


Languages
Pages
Legal


LIMNOFISH-Journal of Limnology and Freshwater Fisheries Research 7(1): 24-39 (2021)
Zooplankton Diversity of a Sub-Tropical Small Urban Wetland of Meghalaya,
Northeast India with Remarks on Spatial Variations
Bhushan Kumar SHARMA1* , Sumita SHARMA2
1 Department of Zoology, North-Eastern Hill University, Shillong - 793 022, Meghalaya, India 2 Lady Veronica Road, Shillong - 793 003, Meghalaya, India
A B S T R A C T A R T I C L E I N F O
Limnological survey of a small urban wetland of Meghalaya state of northeast
India (NEI), undertaken at the littoral and semi-limnetic stations, reveals one of
the biodiverse zooplankton assemblages (148 species belonging to 72 genera and
30 families) known from any lentic environ of the Indian sub-region. The speciose
nature, peak constellation/sample of 83 zooplankton species, and diverse Rotifera
(90 species) are hypothesized to environmental heterogeneity of this urban
wetland in contrast to the general pattern of reduced richness expected in highly
modified urban aquatic environments. The soft and de-mineralized waters are
characterized by low zooplankton abundance. This study records high species
diversity and evenness, and low dominance attributed to low and equitable
abundance depicts ‘generalist’ nature of all species. Rotifera > Cladocera and
Chydoridae > Lecanidae > Lepadellidae > Daphniidae are important at both
stations, and Testudinellidae, Trichocercidae, and Macrothricidae are notable at
the littoral station. Individual abiotic factors exert limited and differential spatial
influence on various taxa, while the CCA registers a high cumulative influence of
10 abiotic factors on the littoral (87.37%) and semi-limnetic (75.81%)
zooplankton assemblages. The spatial variations of composition, richness,
similarities, abundance, diversity indices, and of the influence of individual
abiotic factors are hypothesized to habitat heterogeneity amongst the sampled
stations.
Keywords: Abundance, diversity indices, habitat diversity, salient features,
trophic status
RESEARCH ARTICLE
Received : 17.06.2020
Revised : 22.09.2020
Accepted : 12.10.2020
Published : 29.04.2021
DOI:10.17216/LimnoFish.754060
* CORRESPONDING AUTHOR
[email protected] Phone : +91 943 611 05 99
How to Cite
Sharma BK, Sharma S. 2021. Zooplankton Diversity of a Sub-Tropical Small Urban Wetland of Meghalaya, Northeast India with Remarks on
Spatial Variations. LimnoFish. 7(1): 24-39. doi: 10.17216/LimnoFish.754060
Introduction The smaller water bodies (wetlands and ponds <
10 ha in surface area) form over 90% of the standing
waters of our biosphere and ~ 30% of the global
lentic biotopes by surface area (Downing et al. 2006).
Seekell et al. (2013) and Verpoorter et al. (2014)
suggested even higher conservative estimates as
high-resolution satellite imagery inventories omit
water bodies smaller than 0.2 ha in size, although
even the very smallest of these have important roles
in ecosystem processes (Holgerson and Raymond
2016). The small urban biotopes are recognized as
keystone systems for the conservation of biodiversity
(Céréghino et al. 2008, 2014; Vad et al. 2017; Oertli
2018) despite vulnerability to severe threats of
extinction and habitat degradation (Moss et al. 2011).
Mullins and Doyle (2019) remarked that limnology
will benefit from a renewed focus on these water
bodies as they provide valuable ecological services
and are likely important hot spots of carbon
transformations and carbon sequestration (Downing
et al. 2008; Céréghino et al. 2014). The small
wetlands are important for maintaining regional
biodiversity in urban landscapes that have been
highly modified but may not follow the general
pattern of reduced taxonomic richness expected in
highly modified urban terrestrial or aquatic
environments (Hill et al. 2017).
The small wetlands and ponds form an integral
part of the rural and urban landscape of India. These
environs have attracted relatively more attention
since the inception of the Indian limnology and have

Sharma & Sharma 2021 - LimnoFish 7(1): 24-39
25
resulted in the proliferation of ‘ad-hoc’ and ‘routine’
reports on zooplankton assemblages due to
incomplete species lists, unidentified species, limited
sampling, and inadequate data analysis (Sharma and
Sharma 2019a, 2019b). The selected Indian studies
with variable and limited extant of useful information
are from small wetlands of Bihar (Kumar et al. 2011;
Pandey et al. 2013), Jammu & Kashmir (Jyoti et al.
2009), Haryana (Tyor et al. 2014; Chopra and Jakhar
2016), Karnataka (Majagi 2014), Telangana
(Karuthapandi et al. 2016), Uttarakhand (Kumar et al.
2012) and West Bengal (Datta 2011; Halder Mallick
and Chakraborty 2015; Patra et al. 2015; Adhikari et
al. 2017; Saha et al. 2017; Midya et al. 2018).
Amongst other wetlands, some useful studies are
from the floodplains of Bihar (Sanjer and Sharma
1995), Kashmir (Khan 1987; Ahangar et al. 2012;
Slathia and Dutta 2013) and West Bengal (Khan
2002, 2003; Ganesan and Khan 2008), while the
notable zooplankton diversity works are restricted to
the floodplain wetlands of Assam (Sharma and
Hussain 2001; Sharma and Sharma 2008, 2012;
Sharma 2011a; Sharma and Hatimuria 2017; Sharma
and Noroh 2020) and Manipur (Sharma 2011b;
Sharma and Sharma 2011) states of NEI. On the other
hand, some notable studies from small wetlands of
NEI are yet limited to surveys from Meghalaya
(Sharma and Wanswet 2006), Arunachal Pradesh
(Saikia et al. 2017), and Assam (Deka and Goswami
2015). Also, Sharma et al. (2016), Sharma and
Kensibo (2017), and Sharma and Sharma (2019a,
2019b, 2019c) highlighted small wetlands of NEI to
be one of the Rotifera biodiversity hot-spots of the
Indian sub-region. The literature from India thus
reflects the overall paucity of extensive
investigations till date on various aspects of
zooplankton diversity of small wetlands of India and
NEI in general and urban wetlands in particular.
The present study, a follow-up of our survey of
the rotifer assemblage (Sharma et al. 2016),
endeavors to undertake detailed analyses of
zooplankton diversity of a small urban wetland of
Meghalaya state of NEI; it assumes biodiversity and
limnology interest in light of the stated lacunae. Our
study deals with the spatio-temporal variations of
richness, species composition, community
similarities, abundance, species diversity,
equitability and dominance, and individual and
cumulative influence of abiotic factors on
zooplankton assemblages. The results are discussed
vis-a-vis zooplankton diversity of India and of small
freshwater environs in particular.
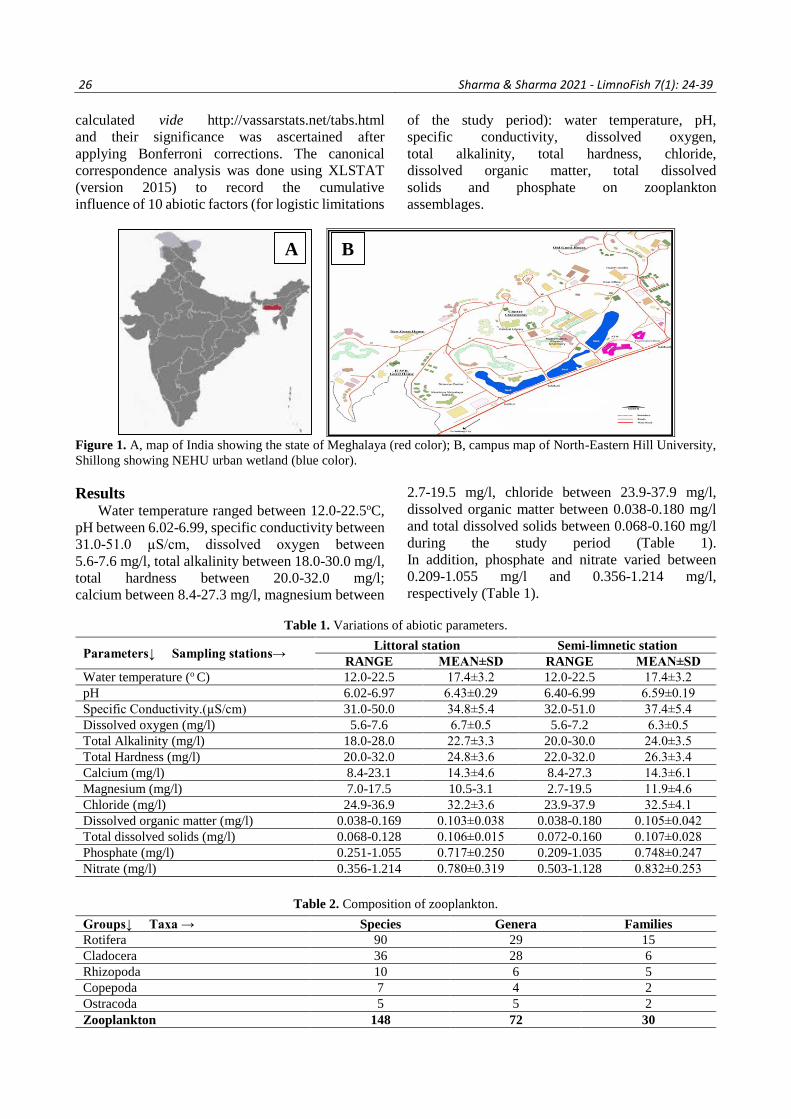
Materials and Methods We undertook a limnological survey of a small
urban perennial wetland (~ 1.5 ha area; maximum
depth: 4 meters) located at the campus of North-
Eastern Hill University (NEHU wetland), Shillong -
the capital of Meghalaya state of NEI (Figure 1,
A-B). Water and qualitative and quantitative
plankton and semi-plankton samples were collected
monthly from the littoral (25°35'33.6''N;
91°53'46.6''E) and the semi-limnetic (25°36'30.3''N;
91°54'01.2''E) stations during August 2014-July 2015
from this wetland which lacked limnetic features.
The littoral station showed growth of Myriophyllum
verticillatum, Nelumbo nucifera, and Hydrilla
verticillata and the semi-limnetic station indicated
Hydrilla verticillata, Ipomoea aquatica, Nymphoides
indica, and Spirogyra sp.
Water samples collected from the two stations
were examined for 13 abiotic parameters each. Water
temperature was recorded using a centigrade
thermometer; pH and specific conductivity were
recorded with the field probes; dissolved oxygen was
estimated by the modified Winkler’s method, and
other abiotic factors namely total alkalinity, total
hardness, calcium, magnesium, chloride, dissolved
organic matter, total dissolved solids, phosphate, and
nitrate were analyzed following APHA (1992). The
qualitative plankton and semi-plankton samples,
collected from each sampling station by towing
nylobolt plankton net (mesh size: 40 µm), were
preserved in 5% formalin. All samples were screened
with a Wild stereoscopic binocular microscope,
zooplankton taxa were isolated and mounted in
polyvinyl alcohol-lactophenol mixture, and were
observed with Leica (DM 1000) stereoscopic
microscope. Zooplankton species were identified
following Michael and Sharma (1988), Sharma
(1998, 2016), Sharma and Sharma (1999a, 1999b,
2000, 2008), and Sharma et al. (2016). The
community similarities were calculated vide
Sørensen’s index and the hierarchical cluster analysis
was done using SPSS (version 20). Monthly
quantitative samples were obtained from the two
stations by filtering 25 L of water each through
nylobolt plankton net and were preserved in 5%
formalin. Quantitative enumeration of zooplankton
and constituent taxa was done by using a Sedgewick-
Rafter counting cell. The abundance of various taxa
was expressed as n/l as well as ranges and mean ±
S.D. Species diversity (Shannon Weiner’s index),
dominance (Berger-Parker’s index) and evenness
(E1 index) were calculated vide Ludwig and
Reynolds (1988) and Magurran (1988). Two-way
analysis of variance (ANOVA) was used to ascertain
significance of spatio-temporal variations of abiotic
and biotic parameters between the sampled stations
and months. Pearson’s correlation coefficients for the
two stations (r1 and r2, respectively) were calculated
between abiotic and biotic factors; p values were
26
Sharma & Sharma 2021 - LimnoFish 7(1): 24-39
calculated vide http://vassarstats.net/tabs.html
and their significance was ascertained after
applying Bonferroni corrections. The canonical
correspondence analysis was done using XLSTAT
(version 2015) to record the cumulative
influence of 10 abiotic factors (for logistic limitations
of the study period): water temperature, pH,
specific conductivity, dissolved oxygen,
total alkalinity, total hardness, chloride,
dissolved organic matter, total dissolved
solids and phosphate on zooplankton
assemblages.
Figure 1. A, map of India showing the state of Meghalaya (red color); B, campus map of North-Eastern Hill University,
Shillong showing NEHU urban wetland (blue color).
Results Water temperature ranged between 12.0-22.5oC,
pH between 6.02-6.99, specific conductivity between
31.0-51.0 µS/cm, dissolved oxygen between
5.6-7.6 mg/l, total alkalinity between 18.0-30.0 mg/l,
total hardness between 20.0-32.0 mg/l;
calcium between 8.4-27.3 mg/l, magnesium between
2.7-19.5 mg/l, chloride between 23.9-37.9 mg/l,
dissolved organic matter between 0.038-0.180 mg/l
and total dissolved solids between 0.068-0.160 mg/l
during the study period (Table 1).
In addition, phosphate and nitrate varied between
0.209-1.055 mg/l and 0.356-1.214 mg/l,
respectively (Table 1).
Table 1. Variations of abiotic parameters.
Parameters↓ Sampling stations→ Littoral station Semi-limnetic station
RANGE MEAN±SD RANGE MEAN±SD
Water temperature (o C) 12.0-22.5 17.4±3.2 12.0-22.5 17.4±3.2
pH 6.02-6.97 6.43±0.29 6.40-6.99 6.59±0.19
Specific Conductivity.(µS/cm) 31.0-50.0 34.8±5.4 32.0-51.0 37.4±5.4
Dissolved oxygen (mg/l) 5.6-7.6 6.7±0.5 5.6-7.2 6.3±0.5
Total Alkalinity (mg/l) 18.0-28.0 22.7±3.3 20.0-30.0 24.0±3.5
Total Hardness (mg/l) 20.0-32.0 24.8±3.6 22.0-32.0 26.3±3.4
Calcium (mg/l) 8.4-23.1 14.3±4.6 8.4-27.3 14.3±6.1
Magnesium (mg/l) 7.0-17.5 10.5-3.1 2.7-19.5 11.9±4.6
Chloride (mg/l) 24.9-36.9 32.2±3.6 23.9-37.9 32.5±4.1
Dissolved organic matter (mg/l) 0.038-0.169 0.103±0.038 0.038-0.180 0.105±0.042
Total dissolved solids (mg/l) 0.068-0.128 0.106±0.015 0.072-0.160 0.107±0.028
Phosphate (mg/l) 0.251-1.055 0.717±0.250 0.209-1.035 0.748±0.247
Nitrate (mg/l) 0.356-1.214 0.780±0.319 0.503-1.128 0.832±0.253
Table 2. Composition of zooplankton.
Groups↓ Taxa → Species Genera Families
Rotifera 90 29 15
Cladocera 36 28 6
Rhizopoda 10 6 5
Copepoda 7 4 2
Ostracoda 5 5 2
Zooplankton 148 72 30
A B

Sharma & Sharma 2021 - LimnoFish 7(1): 24-39
27
Figure 2. Monthly variations of zooplankton richness.
We observed 148 zooplankton species belonging
to 72 genera and 30 families (Table 2-3) with 148 and
122 species from the two sampling stations,
respectively. Rotifera, Cladocera, Rhizopoda,
Copepoda, and Ostracoda indicate 90, 36, 10, 7, and
5 species, respectively. The monthly zooplankton
richness varied between 49-75(61±7) and 53-
83(68±9) species (Figure 2), registered 47.2-74.5 %
and 55.7-84.0 % similarities (Table 3) and record
notable differences in monthly groupings vide the
hierarchical cluster analysis (Figures 3-4). Rotifera
and Cladocera (Table 3) record richness between 16-
35 and 24-46 species; and 19-25 and 18-28 species
and community similarities ranging between 19.0-
60.9 and 37.3-79.5 %, and 58.5-94.7 and 71.4-89.5%
at the littoral and semi-limnetic stations, respectively.
Figure 3. Hierarchical cluster analysis of zooplankton assemblages (Littoral station).
Figure 4. Hierarchical cluster analysis of zooplankton assemblages (Semi-limnetic station).
40
50
60
70
80
90
A S O N D J F M A M J J
Littoral Station Semi-Limnetic station
MONTHS
Nu
mb
er o
f S
pec
ies

28
Sharma & Sharma 2021 - LimnoFish 7(1): 24-39
The monthly variations in zooplankton
abundance and diversity indices are indicated in
Table 3. The abundance ranged between 208 -308 n/l
and 197-245 n/l (Figure 5), species diversity (Figure
6), evenness and dominance of zooplankton ranged
between 3.469-4.195 and 3.934-4.452, 0.858-0.974
and 0.877-0.995, and 0.030-0.093 and 0.027-0.046 at
the littoral and semi-limnetic stations, respectively
(Table 3). Rotifera (64-142 n/l; 71-129 n/l) and
Cladocera (82-107n/l; 70-84 n/I) comprised between
42.9±11.3, 44.2±4.6%, and 40.0±5.2, 38.4±4.3% of
zooplankton abundance (Figures 7-8); Rhizopoda
and Copepoda abundance varied between 20±4 n/l,
19±4 n/l; 21±3, 13±2 n/l (Table 3); and Ostracoda
(8±1, 4±2 n/l) recorded poor abundance at the two
stations, respectively.
Table 3. Zooplankton richness, abundance, and diversity indices.
Groups↓ Stations→ Littoral Station Semi-limnetic Station
Richness
Zooplankton (total richness) 148 species 122 species
Zooplankton (monthly)
Community similarity
49-75 species 61±7 species
47.2-74.5 % 53-83 species 68± 9 species
55.7-84.0 %
Rotifera (monthly)
Community similarity
16-35 species 25±7 species
19.0-60.9 % 24-46 species 35±7 species
37.3-79.5%
Cladocera (monthly)
Community similarity
19-25 species 22±2 species
58.5-94.7% 18-28 species 22±3 species
71.4-89.5% %
Abundance and diversity
Zooplankton (n/l) 208-308 247±26 197-245 213±23
Species diversity 3.469-4.195 3.842±0.192 3.934-4.452 4.135±0.142
Evenness 0.858-0.974 0.943±0.046 0.877-0.995 0.974±0.030
Dominance 0.030-0.093 0.058±0.010 0.027-0.046 0.057±0.017
Different Groups
Rotifera (n/l) 64-142 98±7 71-129 81 ±7
% composition 29.9-73.9 42.9±11.3 38.6-52.9 44.2±4.6
Cladocera (n/l) 82-107 58±18 70-84 66±17
% composition 14.6-37.9 40.0±5.2 19.0-52.2 38.4±4.3
Rhizopoda (n/l) 15-28 20±4 15-28 19±4
% composition 5.1-9.6 8.1±1.1 6.3-11.8 9.0±1.3
Copepoda (n/l) 12-25 21±3 9-18 13±2
% composition 5.0-11.3 8.0±1.9 4.6-8.2 6.3±1.0
Ostracoda (n/l) 6-11 8±1 1-7 4±2
Different Families (n/l)
Chydoridae 49-68 59±6 34-64 52±7
Lecanidae 20-51 39±9 22-53 37±9
Lepadellidae 7-27 16±7 12-28 21±5
Daphniidae 11-18 14±2 7-15 12±2
Testudinellidae 9-24 16±5 0-12 6±3
Trichocercidae 0-17 10±5 3-14 8±3
Macrothricidae 8-14 11±2 4-8 6±1
Figure 5. Monthly variations of zooplankton abundance.
50
100
150
200
250
300
350
A S O N D J F M A M J J
Littoral station Semi-limnetic station
MONTHS
Ab
un
da
nce
(n
/l)

Sharma & Sharma 2021 - LimnoFish 7(1): 24-39
29
The significance of various abiotic and
biotic factors (vide ANOVA) between the littoral and
semi-limnetic stations and months are indicated
in Table 4.
Table 4. ANOVA indicating the significance of abiotic and biotic factors
Parameters Stations Months
Abiotic factors
Water temperature - F11,23 = 7.981, P = 8.32E-05
pH F1,23 = 5.789, P = 0.034 F11,23 = 3.572, P = 0.022
Specific conductivity F1,23 = 14.978, P = 0.003 F11,23 = 19.526, P = 1.12E-05
Dissolved oxygen F1,23 = 3.667, P= 0.081 -
Total Alkalinity F1,23 = 5.49, P = 0.039 F11,23 = 11.125, P = 0.0002
Total Hardness F1,23 = 11.879, P= 0.005 F11,23 = 20.307, P= 9.9E-06
Calcium - F11,23 = 20.047, P = 1.06E-05
Magnesium - F11,23 = 6.920, P = 0.002
Chloride - F11,23 = 35.850, P = 5.26E-07
Dissolved organic matter - F11,23 = 63.170, P = 2.6E-08
Total dissolved solids - F11,23 = 3.622, P = 0.021
Phosphate - F11,23 = 21.024, P = 8.3E-06
Nitrate - F11,23 = 35.140, P = 5.84E-07
Richness
Zooplankton F1,23 = 11.724, P= 0.005 F11,23
= 4.611, P= 0.008
Rotifera F1,23 = 68.075, P = 4.87E-06 F11,23
= 11.095, P= 0.0002
Cladocera - -
Abundance and diversity indices
Zooplankton F1,23 = 31.866, P= 0.0001 F11,23
= 5.010, P= 0.006
Rotifera - F11,23 = 4.642, P= 0.008
Copepoda F1,23 = 40.753, P= 5.2E-05 -
Cladocera F1,23 = 40.745, P= 5.2E-05 -
Zooplankton species diversity F1,23 = 15.380, P= 0.002 -
Zooplankton evenness - -
Zooplankton dominance - -
Important families
Chydoridae F1,23 = 9.580, P= 0.010 -
Lecanidae - F11,23 = 3.664, P= 0.020
Lepadellidae - F11,23 = 3.664, P= 0.020
Daphniidae F1,23 = 13.569, P= 0.004 F11,23
= 3.978, P= 0.015
Testudinellidae F1,23 = 44.929, P= 3.36E-05
Trichocercidae - F11,23 = 5.045, P= 0.006
Macrothricidae F1,23 = 59..055, P= 9.55E-06 -
(-) indicates insignificant variations.
Figure 6. Monthly variations of zooplankton species diversity.
3,000
3,200
3,400
3,600
3,800
4,000
4,200
4,400
A S O N D J F M A M J J
Littoral station Semi-limnetic station
MONTHS
Sp
ecie
s d
iver
sity

30
Sharma & Sharma 2021 - LimnoFish 7(1): 24-39
Figure 7. Monthly variations of the abundance of Rotifera.
Figure 8. Monthly variations of the abundance of Cladocera.
Chydoridae (59±6 and 52±7 n/l), Lecanidae
(39±9 and 37±9 n/l), Lepadellidae (16±7 and
21±5 n/l) and Daphniidae (14±2 and 12±2 n/l)
deserved attention at the two stations, respectively.
Testudinellidae (16±5 n/l), Trichocercidae
(10±5 n/l), and Macrothricidae (11±2 n/l)
recorded importance at Station 1, while Sidiidae
and Brachionidae deserved limited importance.
Zooplankton (r1 = 0.729, p = 0.0168) and Rotifera
(r1 = 0.874, p = 0.0009) richness, and abundance of
zooplankton (r1 = 0.789, p = 0.0067), Rotifera (r1 =
0.813, p = 0.0042), Lecanidae (r1 = 0.622, p = 0.0548)
and Trichocercidae (r1 = 0.762, p = 0.0104) are
positively correlated with water temperature at the
littoral station. In addition, zooplankton (r1 = -0.856,
p = 0.0016) and Rotifera (r1 = -0.757, p = 0.0112)
richness, and abundance of zooplankton (r1 =- 0.786,
p = 0.007), Rotifera (r1 = - 0.668, p = 0.0348) and
Lecanidae (r1 = -0.808, p = 0.0047) are inversely
correlated with total dissolved solids; zooplankton
(r1 = -0.860, p = 0.0014) and Rotifera (r1 = -0.719,
p = 0.0191) richness, and abundance of zooplankton
(r1 = - 0.849, p = 0.0019) and Rotifera (r1 = - 0.664,
p = 0.0363) are inversely influenced by dissolved
organic matter, while Lecanidae abundance
(r1 = - 0.668, p = 0.034) is inversely correlated with
specific conductivity at the littoral station.
Zooplankton (r2 = 0.838, p = 0.0025) and Rotifera
(r2 = 0.755, p = 0.026) richness, and abundance of
zooplankton (r2 = 0.837, p = 0.0032), Rotifera
(r2 = 0.771, p = 0.009), Rhizopoda (r2 = 0.701,
p = 0.024) and Lecanidae (r2= 0.694, p = 0.026) is
positively correlated with water temperature, and
Rotifer density (r2 = -0.743, p = 0.0138) is inversely
correlated with dissolved organic matter at the semi-
limnetic station.
40
60
80
100
120
140
160
A S O N D J F M A M J J
Littoral station Semi-limnetic station
MONTH
Ab
un
da
nce
(n
/l)
40
50
60
70
80
90
100
110
A S O N D J F M A M J J
Littoral station Semi-limnetic station
MONTHS
Ab
un
da
nce
(n
/l)
Sharma & Sharma 2021 - LimnoFish 7(1): 24-39
31
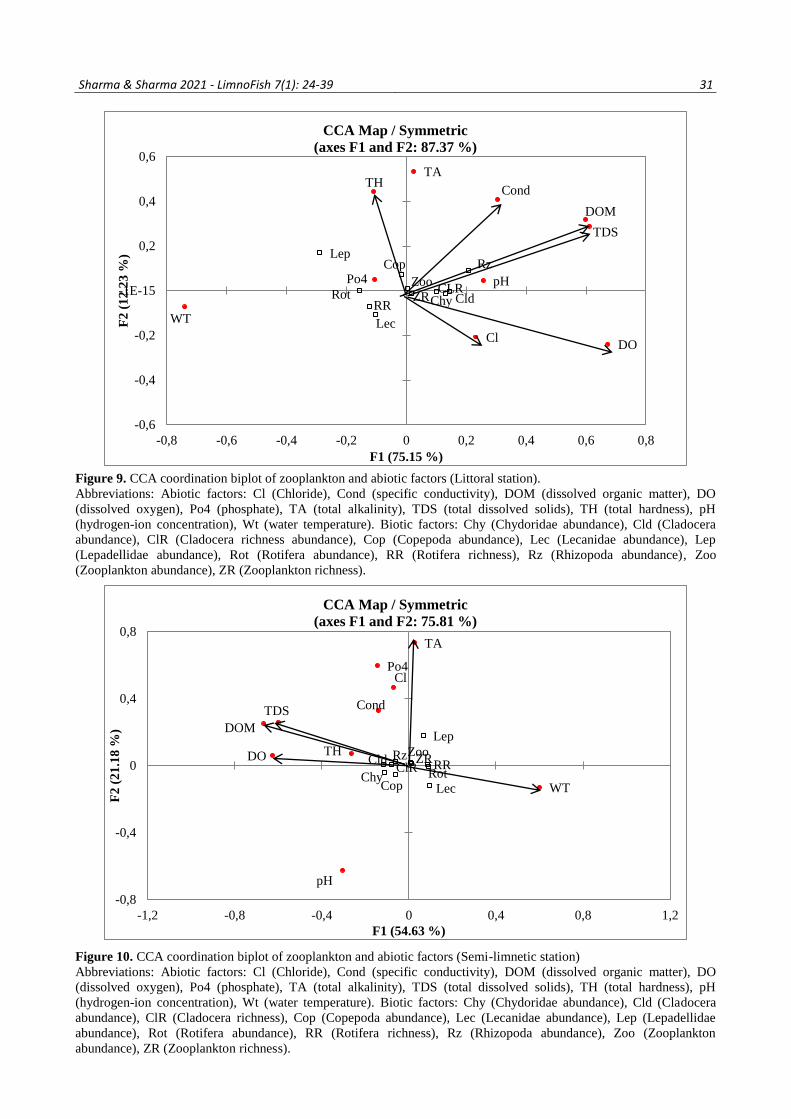
Figure 9. CCA coordination biplot of zooplankton and abiotic factors (Littoral station).
Abbreviations: Abiotic factors: Cl (Chloride), Cond (specific conductivity), DOM (dissolved organic matter), DO
(dissolved oxygen), Po4 (phosphate), TA (total alkalinity), TDS (total dissolved solids), TH (total hardness), pH
(hydrogen-ion concentration), Wt (water temperature). Biotic factors: Chy (Chydoridae abundance), Cld (Cladocera
abundance), ClR (Cladocera richness abundance), Cop (Copepoda abundance), Lec (Lecanidae abundance), Lep
(Lepadellidae abundance), Rot (Rotifera abundance), RR (Rotifera richness), Rz (Rhizopoda abundance), Zoo
(Zooplankton abundance), ZR (Zooplankton richness).
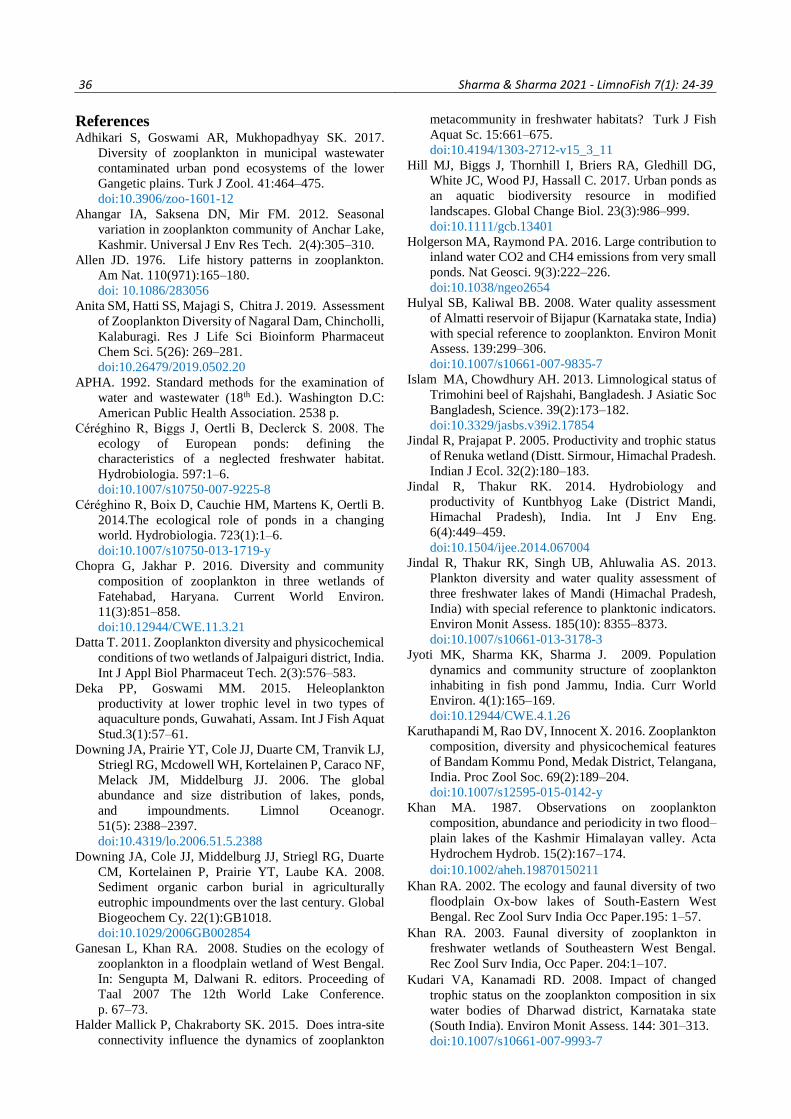
Figure 10. CCA coordination biplot of zooplankton and abiotic factors (Semi-limnetic station)
Abbreviations: Abiotic factors: Cl (Chloride), Cond (specific conductivity), DOM (dissolved organic matter), DO
(dissolved oxygen), Po4 (phosphate), TA (total alkalinity), TDS (total dissolved solids), TH (total hardness), pH
(hydrogen-ion concentration), Wt (water temperature). Biotic factors: Chy (Chydoridae abundance), Cld (Cladocera
abundance), ClR (Cladocera richness), Cop (Copepoda abundance), Lec (Lecanidae abundance), Lep (Lepadellidae
abundance), Rot (Rotifera abundance), RR (Rotifera richness), Rz (Rhizopoda abundance), Zoo (Zooplankton
abundance), ZR (Zooplankton richness).
ZRRR
CLRZoo
Rot Cld
Cop Rz
Lec
Lep
Chy
WT
pH
Cond
DO
TATH
Cl
DOM
TDS
Po4
-0,6
-0,4
-0,2
-1E-15
0,2
0,4
0,6
-0,8 -0,6 -0,4 -0,2 0 0,2 0,4 0,6 0,8
F2
(1
2.2
3 %
)
F1 (75.15 %)
CCA Map / Symmetric
(axes F1 and F2: 87.37 %)
ZRRRClR
Zoo
RotCld
Cop
Rz
Lec
Lep
ChyWT
pH
Cond
DO
TA
TH
Cl
DOM
TDS
Po4
-0,8
-0,4
0
0,4
0,8
-1,2 -0,8 -0,4 0 0,4 0,8 1,2
F2
(2
1.1
8 %
)
F1 (54.63 %)
CCA Map / Symmetric
(axes F1 and F2: 75.81 %)

32
Sharma & Sharma 2021 - LimnoFish 7(1): 24-39
The canonical correspondence analysis (CCA)
with 10 abiotic factors registered cumulative
influence of 87.37% and 75.81% on zooplankton
assemblages at the littoral and semi-limnetic stations,
respectively (Figs. 9-10).
Discussion The sub-tropical NEHU wetland is characterized
by soft, slightly acidic-circum neutral, calcium poor
waters with low nutrients, chloride indicating a
certain influence of human impact, and total
alkalinity attributed to bicarbonate ions. The low
specific conductivity is attributed to the leached
nature of the soil and weathered condition of rocks
due to heavy rainfall in NEI (Sharma 1995; Sharma
and Sharma 2020) and lowered buffering capacity of
de-mineralized waters (Steinitz-Kannan et al. 1983).
ANOVA depicts significant variations of pH,
specific conductivity, dissolved oxygen, total
alkalinity, and total hardness between stations and
months; water temperature and dissolved oxygen
indicated significant variations between stations; and
calcium, magnesium, chloride, dissolved organic
matter, total dissolved solids, phosphate, and nitrate
recorded significant monthly variations between the
sampling stations. The spatial variations of abiotic
factors are hypothesized to the habitat heterogeneity
of the two stations.
Our report of 148 species, belonging to 72 genera
and 30 families, reveals one of the biodiverse
zooplankton assemblages known from any individual
lentic environ of the Indian sub-region. This salient
feature is hypothesized to the overall environmental
heterogeneity of NEHU urban wetland. The
biodiversity significance is in contrast to the general
pattern of reduced taxonomic richness hypothesized
to be expected in highly modified urban aquatic
environs (Hill et al. 2017). We thus categorize this
urban wetland as ‘keystone’ system of Meghalaya
state of NEI for the conservation of aquatic
biodiversity in light of the remarks of Céréghino et
al. (2014), Vad et al. (2017), and Oertli (2018). The
rich and diverse nature of zooplankton is in contrast
to the reports from the floodplain wetlands of Assam
(Sharma and Sharma 2008; Sharma and Hatimuria
2017), Bihar (Sanjer and Sharma 1995), Manipur
(Sharma 2011a), and West Bengal (Khan 2002, 2003;
Ganesan and Khan 2008; Datta 2011; Patra et al.
2011). The richness is distinctly higher than the
reports from small water bodies of Arunachal
Pradesh (Saikia et al. 2017), Bihar (Kumar et al.
2011, 2015; Singh et al. 2012; Pandey et al. 2013),
Chhattisgarh (Mishra et al. 2014), Meghalaya
(Sharma and Wanswett 2006), and West Bengal
(Halder Mallick and Chakraborty 2015; Patra et al.
2015; Saha et al. 2017; Middya 2017; Midya et al.
2018) from India; and elsewhere from Bangladesh
(Islam and Chowdhury 2013), Bhutan (Sharma and
Bhattarai 2005) and Myanmar (Twin and Aung
2019). Zooplankton richness is notably higher than
the reports from the lakes and reservoirs of Himachal
(Jindal and Prajapat 2005; Thakur et al. 2013; Jindal
and Thakur 2014), Karnataka (Hulyal and Kaliwal
2008; Kudari and Kanamadi 2008; Majagi and
Vijaykumar 2009; Majagi 2014; Anita et al. 2019),
Jammu & Kashmir (Khan 1987; Ahangar et al. 2012;
Slathia and Dutta 2013; Sharma and Sharma 2019),
Meghalaya (Sharma 1995; Sharma and Lyngdoh
2004; Sharma and Sharma 2020), Mizoram (Sharma
and Pachuau 2013), Telangana (Karuthapandi et al.
2016) and Uttarakhand (Sharma and Pant 1985;
Mishra et al. 2010; Malik and Panwar, 2016; Sharma
and Kumari 2018; Singh and Sharma 2020) states of
India. The reports of 148 and 122 species with 90.4%
community similarity affirm high zooplankton
homogeneity amongst the stations.
The diverse Rotifera (90 species belonging to 29
genera and 15 families) merit biodiversity interest as
~56.0, ~38.0, and ~23.0% of the species of this taxon
known till date from Meghalaya and NEI (Sharma
and Sharma 2019c) and India (Sharma and Sharma
2017a), respectively. The salient features of poor
Brachionidae richness and lack of Brachionus spp.
noted in our collections are attributed to slightly
acidic - circum neutral waters concurrent with the
reports of Sharma and Pachuau (2013), Sharma et al.
(2016), and Sharma and Sharma (2020), while
Brachionidae paucity concurs with the report from
Arunachal Pradesh (Saikia et al. 2017). Lecanidae >
Lepadellidae collectively comprise ~57.0% of the
rotifer richness and affirm the littoral-periphytic
character of the taxon vides Sharma and Sharma
(2017a, 2019c). Additional details of Rotifera
diversity vis-à-vis new reports (Sharma 2016),
species composition, and elements of biogeographic
interest are dealt with separately by Sharma et al.
(2016). Cladocera, the second speciose group,
indicated 36 species belonging to 28 genera and
6 families; it depicts diverse nature in comparison
with our conservative estimate of the occurrence of
60–65 species from the tropical and subtropical
waters of the Indian subcontinent (Sharma and
Michael 1987; Sharma and Sharma 2017b). High
richness (~ 69%) of the Chydoridae affirms the
littoral periphytic nature of cladoceran assemblages
(Sharma and Sharma 2017b).
Higher monthly zooplankton richness at the
semi-limnetic > the littoral station is hypothesized to
greater habitat diversity of the former region, while
ANOVA indicates significant richness variations
between stations and months. The zooplankton
richness follows oscillating monthly variations at the

Sharma & Sharma 2021 - LimnoFish 7(1): 24-39
33
two stations, while peak consortium/sample of 83
species in monsoon (July 2015) and high assemblage
of 81 (August 2014) species, noted at the semi-
limnetic station, are attributed to the possibility of co-
existence of many species due to high amount of
niche overlap as hypothesized by MacArthur (1965).
We categorize these assemblages as ‘Zooplankton
paradox’ vs. small urban wetland; such consortia are
hypothesized to the intriguing possibility of the co-
existence of a number of species in a relatively
unstructured environment of small wetlands (Sharma
and Sharma 2019a). Peak monsoon richness at the
two stations is affirmed by a positive correlation with
water temperature; the latter concurs with the results
of Thakur et al. (2013). Further, monsoon peaks
concur with the reports from Holmari beel of Assam
(Sharma and Hatimuria 2017), Karnataka (Majagi
2014), Meghalaya (Sharma and Wanswett 2006),
North Bengal (Datta 2011), and Telangana
(Karuthapandi et al. 2016) but deviate from the
reports of the post-monsoon peak by Ganesan and
Khan (2008) and winter peak by Sharma and Sharma
(2020). Zooplankton register 47.2-74.5 % and
55.7-84.0 % community similarities at the littoral and
semi-limnetic stations, respectively; ~ 92% instances
record 51-70% similarities at the former station,
while similarity matrix record 61-80% similarities in
~84% instances at semi-limnetic station. The
hierarchical cluster analysis indicates closer affinities
between September-October, March-April, and
January-February assemblages while August
collection indicates peak species divergence at the
littoral station. High affinity is noted only between
July-August and maximum divergence is noted
during November > February > December
collections at the semi-limnetic station. The
heterogeneity in monthly richness, affirmed both by
community similarities and the differential cluster
groupings, is hypothesized to habitat heterogeneity of
the two stations. The rotifers contribute to
zooplankton richness (r1=0.908, p=0.0003; r2=0.915,
p =0.0002) at the two stations, respectively, and
register significant variations between stations and
months (vide ANOVA). The report of 46 species in
September 2014 (semi-limnetic station) vs. this urban
wetland is categorized as ‘Rotifera paradox’
analogous to the reports of Sharma and Sharma
(2019a, 2019b). The community similarities reflect
greater rotifer heterogeneity at the former station.
Cladocera contributed to zooplankton richness
(r2=0.915, p =0.0002) at the semi-limnetic station and
higher similarities affirm lower heterogeneity of
Cladocera at the two stations.
Our results highlight low zooplankton abundance
with the littoral > semi-limnetic station except in June
2015; ANOVA registers significant variations of
abundance between stations and months. The low
densities are attributed to soft and de-mineralized
waters of NEHU wetland in particular; these remarks
correspond with the reports from identical aquatic
environs of NEI (Sharma 1995, 2011a; Sharma and
Wanswett 2006; Sharma and Sharma 2012, 2020;
Sharma and Pachuau 2013; Sharma and Noroh 2020)
as well as from Bhutan (Sharma and Bhattarai 2005).
The zooplankton follow oscillating monthly
variations with higher abundance during warmer
months and peak densities during monsoon (August
2014) at both the stations, these are affirmed by
positive correlation with water temperature
(r1 = 0.789, p = 0.0067; r2 = 0.837, p = 0.0025). The
latter concurs with the results of Patra et al (2011),
Thakur et al. (2013), and Singh and Sharma (2020)
but differ from the inverse correlation indicated by
Pandey et al. (2013) and Slathia and Dutta (2013).
Further, monsoon peaks concur with the reports from
Arunachal Pradesh (Saikia et al. 2017), Assam (Deka
and Goswami 2015), Uttarakhand (Thakur et al.
2013), and Myanmar (Twin and Aung 2019) but
differ summer peaks listed from wetlands of Bihar
(Pandey et al. 2013), Kashmir (Slathia and Dutta
2013), Karnataka (Majagi 2014; Anita et al. 2019)
and from winter peaks known from Himachal
Pradesh (Sharma and Kumari 2018), Meghalaya
(Sharma and Wanswett 2006), Uttarakhand (Malik
and Panwar 2016; Singh and Sharma 2020) and West
Bengal (Halder Mallick and Chakraborty 2015; Patra
et al. 2015). Low and equitable abundance
categorizes ‘generalist’ nature of zooplankton
species concurrent with the reports from Himachal
Pradesh (Jindal and Prajapat 2005; Jindal and Thakur
2014), NEI (Sharma 1995; Sharma and Lyngskor
2003; Sharma 2011a, 2011b, Sharma and Sharma
2011, 2020; Sharma and Noroh 2020) and
Uttarakhand (Malik and Panwar 2016; Singh and
Sharma 2020). Rotifera (42.9±11.3, 44.2±4.6%) ≥
Cladocera (40.0±5.2, 38.4±4.3%) contribute to
zooplankton abundance at the two stations,
respectively but with different spatio-temporal
patterns.
Rotifera, an important group, contributes to
zooplankton density variations at the littoral
(r1=0.915, p =0.0002) and semi-limnetic (r2=0.825,
p=0.003) stations. The importance of Rotifera
concurs with the reports of Khan (1987, 2003), Sanjer
and Sharma (1995), Jindal and Prajapat (2005), Jyoti
et al (2009), Patra et al. (2011), Sharma (2011a,
2011b), Sharma and Sharma (2011, 2012, 2019c)
Pandey et al. (2013), Deka and Goswami (2015),
Halder Mallick and Chakraborty (2015), Malik and
Panwar (2016), Sharma and Kumari (2018) and
Sharma and Noroh (2020). Higher rotifer abundance
during warmer months is affirmed by a positive

34
Sharma & Sharma 2021 - LimnoFish 7(1): 24-39
correlation with water temperature; the latter concurs
with the results of Thakur et al. (2013), Malik and
Panwar (2016), and Sharma and Sharma (2020). Peak
Rotifera densities during monsoon at the two stations
concur with the report from Maghuri beel of Assam
(Sharma and Noroh 2020) and the reports of Jyoti et
al. (2009), Karuthapandi et al. (2016), Saikia et al.
(2017) but differ from summer (Sanjer and Sharma
1995; Patra et al. 2011; Pandey et al. 2013; Sharma
and Kumari 2018), winter peaks (Sharma and
Hussain 2001; Sharma 2011a; Sharma and Sharma
2011, 2012) from different states of India. Lecanidae
(r1=0.813, p=0.004; r1=0.805, p=0.005) and
Lepadellidae (r1=0.827, p=0.003; r1=0.884,
p=0.0007), respectively contribute to zooplankton
and Rotifera abundance at the littoral station;
Lecanidae contributes to zooplankton (r2=0.705,
p=0.023) and Rotifera (r2=0.814, p=0.004) the semi-
limnetic station; and Trichocercidae (r1=0.811,
p=0.004) and Brachionidae (r1=0.744, p=0.0136)
contribute to Rotifera at the littoral station.
Lecanidae comprise between 40.0±6.8 and
39.3±6.3% of Rotifera, while the five Eurotatoria
families collectively form notable fractions of
zooplankton (35.5±7.1, 37.6±4.1%) and Rotifera
(87.2±6.7, 84.9±3.3%) at the two stations,
respectively. ANOVA registers significant monthly
variations of Rotifera, Lecanidae, Lepadellidae, and
Trichocercidae abundance between the stations.
Lecanidae and Lepadellidae importance concur with
the reports from NEI (Sharma 2011a; Sharma and
Sharma 2001, 2008).
Cladocera, another important group, indicates
significant density variations between stations (vide
ANOVA) and records higher abundance that the
reports from Assam (Sharma and Hussain 2001;
Deka and Goswami 2015; Sharma and Hatimuria
2017), Kashmir (Khan 1987), Meghalaya (Sharma
and Lyngdoh 2004) and Mizoram (Sharma and
Pachuau 2013), while it broadly concurs with the
report of Sharma and Noroh (2020). The cladocerans
follow oscillating monthly variations with peaks
during pre-monsoon (June 2015) at both the stations;
the latter concur with the reports of Sharma (2011a),
Deka and Goswami (2015), Sharma and Noroh
(2020), Malik and Panwar (2016), Saikia et al. (2017)
and Singh and Sharma (2020). Cladocera is notable
for the importance of the Chydoridae (60.3±4.5,
52.7±8.8%) at the two stations, respectively
concurrent with the reports of Sharma (2011a, 2011b)
and Sharma and Sharma (2008, 2011, 2012);
ANOVA indicates significant variations of
Chydoridae between the stations. Daphniidae
deserved attention at the two stations; Macrothricidae
is important at the limnetic station, while Sidiidae
deserved limited importance. The four families
comprise a significant fraction of Cladocera
(95.1±1.9, 78.8±8.7%) and zooplankton (38.0±4.6,
31.3±4.4%) abundance at the two stations,
respectively.
Copepoda and Rhizopoda, two sub-dominant
groups, indicate low abundance and limited spatial
variations at the two stations. Copepoda > Rhizopoda
abundance pattern is noted during September 2014-
January 2015 and again in July 2015 at the littoral
station, while Rhizopoda > Copepoda abundance is
recorded throughout the study at the limnetic station,
except January 2015. Copepoda indicates low
abundance at the two stations with significant
variations between stations (vide ANOVA). The sub-
dominance of copepods concur with the reports from
Assam (Sharma and Sharma 2012; Deka and
Goswami 2015; Sharma and Noroh 2020), Himachal
Pradesh (Jindal and Prajapat 2005), Jammu &
Kashmir (Jyoti et al. 2009; Sharma and Sharma
2020), Manipur (Sharma 2011a) and Uttarakhand
(Malik and Panwar 2016; Singh and Sharma 2020).
Monsoon maxima of this group at the two stations
concur with the findings of Jindal and Thakur (2014)
but deviate from pre-monsoon peaks vides the reports
of Ganesan and Khan (2008) and Sharma and Sharma
(2020). Copepoda abundance, largely influenced by
Cyclopidae, is attributed to the prevalence of stable
environmental conditions for these ‘k-strategists’ as
suggested by Allen (1976). Rhizopoda abundance
broadly concurs with the report of Sharma and Noroh
(2020), it is higher than the results of Sharma and
Pachuau (2013) and Sharma and Hatimuria (2017)
but differs from the poor abundance reported by
Sharma and Sharma (2020). The rhizopods record
maxima during monsoon at the two stations.
Ostracoda forms an insignificant fraction of
zooplankton.
Zooplankton are characterized by high species
diversity at the semi-limnetic station > the littoral
station; the former station recorded higher diversity
throughout the study, except in November 2014;
ANOVA depicts significant diversity variations
between stations. The limnetic station recorded H´
values > 4.0 during 9 months, while the semi-limnetic
station indicated H´ values > 4.0 during 7 months.
High zooplankton species diversity of this urban
wetland, coupled with low densities of individual
species, is hypothesized to fine niche portioning in
combination with micro-and macro- habitat
heterogeneity as hypothesized by (Segers 2008). The
diversity is directly influenced by richness of
zooplankton (r2 = 0.964, p < 0.0001), Rotifera
(r2 = 0.875, p = 0.0009) and Cladocera (r2=0.700,
p=0.024), and abundance of zooplankton (r2 = 0.962,
p < 0.0001), Rotifera (r2 = 0.827, p = 0.003) and
Lecanidae (r2 = 0.722, p = 0.018) at the semi-limnetic

Sharma & Sharma 2021 - LimnoFish 7(1): 24-39
35
station, while so such relationship is noted at the
littoral station. Shannon Weiner diversity index is a
suitable option for assessing the health of aquatic
biotopes (Wilhm and Dorris 1968). Mean annual
diversity values indicate a relatively more clean
water nature of the semi-limnetic region while in
general NEHU wetland is characterized by a very
clean – clean water nature. Low dominance noted at
the two sampling stations, shared by a large number
of ‘generalist’ species (Osborne et al. 1976), is
hypothesized to the fact that the habitat of this urban
wetland has resources for utilization by all species
providing a low amount of niche overlap as
hypothesized by MacArthur (1965). Low densities
and equitable abundance of zooplankton species
affirm higher evenness and reiterate that zooplankton
are ‘generalist’ vis-à-vis the general environment of
this wetland.
This study depicts the differential spatial
influence of individual abiotic parameters on the
richness and abundance of zooplankton. Our results
affirm the importance of water temperature with a
positive influence on zooplankton and Rotifera
richness and abundance of zooplankton, Rotifera, and
Lecanidae at the two stations, respectively; positive
influence on the abundance of Trichocercidae density
at the littoral station and Rhizopoda at the semi-
limnetic station. Besides, dissolved organic matter
indicates importance with inverse correlations on
zooplankton and Rotifera richness, and abundance of
zooplankton, Rotifera and Lecanidae, and
zooplankton richness and abundance is inversely
correlated with total dissolved solids; Lecanidae
abundance is positively correlated with specific
conductivity at the former station. Rotifera density is
inversely correlated with dissolved organic matter at
the semi-limnetic station. The limited and differential
influence of individual abiotic factors affirms the
reports of Sharma and Hussain (2001), Sharma
(2011a), Sharma and Sharma (2011, 2012), Sharma
and Noroh (2020), and Sharma and Sharma (2020).
The canonical correspondence analysis depicts
high but the differential cumulative influence of 10
abiotic factors on zooplankton assemblages at the
littoral (87.37%) and semi-limnetic (75.81%)
stations, respectively; it broadly concurs with the
report of Sharma and Sharma (2020). Also, the
former broadly concurs with 84.8% cumulative
variance reported from a subtropical reservoir of
Mizoram (Sharma and Pachuau 2013), while our
results record higher cumulative influence in contrast
to the reports from the floodplain wetlands of NEI
(Sharma 2011a; Sharma and Sharma 2012; Sharma
and Hatimuria,2017; Sharma and Noroh 2020). CCA
coordination biplot at the littoral station indicates ~
75% and ~12% influence of abiotic factors along axis
1 and 2, respectively with the influence of water
temperature on Rotifera abundance; dissolved
oxygen on richness and abundance of Cladocera, and
abundance of Chydoridae; dissolved oxygen and
chloride on zooplankton richness; conductivity on
zooplankton abundance; dissolved organic matter
and total dissolved solids on Rhizopoda density; and
total hardness on Copeopoda abundance. The semi-
limnetic station indicates ~ 54% and ~21% influence
of abiotic factors along axis 1 and 2, respectively with
the influence of water temperature on Rotifera
richness and abundance; DOM and TDS on
Cladocera and Rhizopoda abundance; dissolved
oxygen on zooplankton and Cladocera richness; total
alkalinity on zooplankton abundance. Our results
thus highlight the importance of cumulative influence
over the individual influence of abiotic factors, while
the impact of biotic factors vs. zooplankton-
macrophytic associations in this urban wetland needs
to be assessed.
To sum up, the biodiversity significance of
zooplankton of NEHU wetland and its importance as
‘keystone’ system of NEI vs. lentic environs of the
Indian sub-region is hypothesized to overall
environmental heterogeneity of this urban wetland.
Peak consortia indicating ‘zooplankton’ and
‘Rotifera paradox’ hypothesized to the possibility of
co-existence of several species due to high amount of
niche overlap in the relatively unstructured
environment of the small wetland; low zooplankton
abundance attributed to ‘soft’ and de-mineralized
waters; and the differential spatial patterns of
richness, abundance and diversity indices
hypothesized to habitat heterogeneity of the sampled
stations are noteworthy. High species diversity, and
low dominance, and high equitability attributed to
‘generalist’ species are notable features; the former
depicts the ‘very clean – clean water nature’ of this
wetland. The importance of high cumulative
influence vis-à-vis limited spatial influence of
individual abiotic factors is noteworthy. This study is
an important contribution to zooplankton diversity of
small water bodies of the Indian sub-region, and
highlights need for the future-focused studies on
zooplankton diversity to avoid the proliferation of
‘ad-hoc’ and ‘routine’ reports.
Acknowledgments The senior author (BKS) is thankful to the
Head, Department of Zoology, North-Eastern
Hill University, Shillong for laboratory facilities
and to K.R. Sounii Pou for help in field
collections. The authors have no conflict with
research interests.
36
Sharma & Sharma 2021 - LimnoFish 7(1): 24-39
References Adhikari S, Goswami AR, Mukhopadhyay SK. 2017.
Diversity of zooplankton in municipal wastewater
contaminated urban pond ecosystems of the lower
Gangetic plains. Turk J Zool. 41:464–475.
doi:10.3906/zoo-1601-12
Ahangar IA, Saksena DN, Mir FM. 2012. Seasonal
variation in zooplankton community of Anchar Lake,
Kashmir. Universal J Env Res Tech. 2(4):305–310.
Allen JD. 1976. Life history patterns in zooplankton.
Am Nat. 110(971):165–180.
doi: 10.1086/283056
Anita SM, Hatti SS, Majagi S, Chitra J. 2019. Assessment
of Zooplankton Diversity of Nagaral Dam, Chincholli,
Kalaburagi. Res J Life Sci Bioinform Pharmaceut
Chem Sci. 5(26): 269–281.
doi:10.26479/2019.0502.20
APHA. 1992. Standard methods for the examination of
water and wastewater (18th Ed.). Washington D.C:
American Public Health Association. 2538 p.
Céréghino R, Biggs J, Oertli B, Declerck S. 2008. The
ecology of European ponds: defining the
characteristics of a neglected freshwater habitat.
Hydrobiologia. 597:1–6.
doi:10.1007/s10750-007-9225-8
Céréghino R, Boix D, Cauchie HM, Martens K, Oertli B.
2014.The ecological role of ponds in a changing
world. Hydrobiologia. 723(1):1–6.
doi:10.1007/s10750-013-1719-y
Chopra G, Jakhar P. 2016. Diversity and community
composition of zooplankton in three wetlands of
Fatehabad, Haryana. Current World Environ.
11(3):851–858.
doi:10.12944/CWE.11.3.21
Datta T. 2011. Zooplankton diversity and physicochemical
conditions of two wetlands of Jalpaiguri district, India.
Int J Appl Biol Pharmaceut Tech. 2(3):576–583.
Deka PP, Goswami MM. 2015. Heleoplankton
productivity at lower trophic level in two types of
aquaculture ponds, Guwahati, Assam. Int J Fish Aquat
Stud.3(1):57–61.
Downing JA, Prairie YT, Cole JJ, Duarte CM, Tranvik LJ,
Striegl RG, Mcdowell WH, Kortelainen P, Caraco NF,
Melack JM, Middelburg JJ. 2006. The global
abundance and size distribution of lakes, ponds,
and impoundments. Limnol Oceanogr.
51(5): 2388–2397.
doi:10.4319/lo.2006.51.5.2388
Downing JA, Cole JJ, Middelburg JJ, Striegl RG, Duarte
CM, Kortelainen P, Prairie YT, Laube KA. 2008.
Sediment organic carbon burial in agriculturally
eutrophic impoundments over the last century. Global
Biogeochem Cy. 22(1):GB1018.
doi:10.1029/2006GB002854
Ganesan L, Khan RA. 2008. Studies on the ecology of
zooplankton in a floodplain wetland of West Bengal.
In: Sengupta M, Dalwani R. editors. Proceeding of
Taal 2007 The 12th World Lake Conference.
p. 67–73.
Halder Mallick P, Chakraborty SK. 2015. Does intra-site
connectivity influence the dynamics of zooplankton
metacommunity in freshwater habitats? Turk J Fish
Aquat Sc. 15:661–675.
doi:10.4194/1303-2712-v15_3_11
Hill MJ, Biggs J, Thornhill I, Briers RA, Gledhill DG,
White JC, Wood PJ, Hassall C. 2017. Urban ponds as
an aquatic biodiversity resource in modified
landscapes. Global Change Biol. 23(3):986–999.
doi:10.1111/gcb.13401
Holgerson MA, Raymond PA. 2016. Large contribution to
inland water CO2 and CH4 emissions from very small
ponds. Nat Geosci. 9(3):222–226.
doi:10.1038/ngeo2654
Hulyal SB, Kaliwal BB. 2008. Water quality assessment
of Almatti reservoir of Bijapur (Karnataka state, India)
with special reference to zooplankton. Environ Monit
Assess. 139:299–306.
doi:10.1007/s10661-007-9835-7
Islam MA, Chowdhury AH. 2013. Limnological status of
Trimohini beel of Rajshahi, Bangladesh. J Asiatic Soc
Bangladesh, Science. 39(2):173–182.
doi:10.3329/jasbs.v39i2.17854
Jindal R, Prajapat P. 2005. Productivity and trophic status
of Renuka wetland (Distt. Sirmour, Himachal Pradesh.
Indian J Ecol. 32(2):180–183.
Jindal R, Thakur RK. 2014. Hydrobiology and
productivity of Kuntbhyog Lake (District Mandi,
Himachal Pradesh), India. Int J Env Eng.
6(4):449–459.
doi:10.1504/ijee.2014.067004
Jindal R, Thakur RK, Singh UB, Ahluwalia AS. 2013.
Plankton diversity and water quality assessment of
three freshwater lakes of Mandi (Himachal Pradesh,
India) with special reference to planktonic indicators.
Environ Monit Assess. 185(10): 8355–8373.
doi:10.1007/s10661-013-3178-3
Jyoti MK, Sharma KK, Sharma J. 2009. Population
dynamics and community structure of zooplankton
inhabiting in fish pond Jammu, India. Curr World
Environ. 4(1):165–169.
doi:10.12944/CWE.4.1.26
Karuthapandi M, Rao DV, Innocent X. 2016. Zooplankton
composition, diversity and physicochemical features
of Bandam Kommu Pond, Medak District, Telangana,
India. Proc Zool Soc. 69(2):189–204.
doi:10.1007/s12595-015-0142-y
Khan MA. 1987. Observations on zooplankton
composition, abundance and periodicity in two flood–
plain lakes of the Kashmir Himalayan valley. Acta
Hydrochem Hydrob. 15(2):167–174.
doi:10.1002/aheh.19870150211
Khan RA. 2002. The ecology and faunal diversity of two
floodplain Ox-bow lakes of South-Eastern West
Bengal. Rec Zool Surv India Occ Paper.195: 1–57.
Khan RA. 2003. Faunal diversity of zooplankton in
freshwater wetlands of Southeastern West Bengal.
Rec Zool Surv India, Occ Paper. 204:1–107.
Kudari VA, Kanamadi RD. 2008. Impact of changed
trophic status on the zooplankton composition in six
water bodies of Dharwad district, Karnataka state
(South India). Environ Monit Assess. 144: 301–313.
doi:10.1007/s10661-007-9993-7

Sharma & Sharma 2021 - LimnoFish 7(1): 24-39
37
Kumar U, Kumar SS, Singh PK. 2015. Analysis of
seasonal biodiversity of zooplankton in Sahni tola
talab (pond) of Sundarpur Bela, Darbhanga district,
Bihar. Int J Sci Res. 4(2):70–72.
Kumar P, Wanganeo A, Sonaullah F, Wanganeo R. 2012.
Limnological study on two high altitude Himalayan
Ponds, Badrinath, Uttarakhand. Int J Ecosys.
2(5):103–111.
doi: 10.5923/j.ije.20120205.04
Kumar P, Wanganeo A, Wanganeo R, Sonaullah F. 2011.
Seasonal variations in zooplankton diversity of
railway pond, Sasaram, Bihar. Int J Env
Sci. 2(2):1007–1016.
Ludwig JA, Reynolds JF. 1988. Statistical Ecology: A
Primer on Methods and Computing. New York: John
Wiley & Sons 337p.
MacArthur RH. 1965. Patterns of species diversity. Biol
Rev. 40(4):510–533.
doi:10.1111/j.1469-185X.1965.tb00815.x
Magurran AE. 1988. Ecological diversity and its
measurement. Croom Helm Limited, London, 179 p.
doi:10.1007/978-94-015-7358-0
Majagi S. 2014. Status of wetlands of Chikkballapur
district, Karnataka. India. Int J Water Res. 2(2):55–62.
Majagi S, Vijaykumar K. 2009. Ecology and abundance
of zooplankton in Karanja reservoir. Environ Monit
Assess. 152:451–458.
doi:10.1007/s10661-008-0329-z
Malik DS, Panwar P. 2016. Zooplankton diversity, species
richness and their distribution pattern in Bhimtal Lake
of Kumaun region, (Uttarakhand). Hydrol Current
Res. 7(1):1–7.
doi:10.4172/2157-7587.1000219
Michael RG, Sharma BK. 1988. Indian Cladocera
(Crustacea: Branchiopoda: Cladocera) Fauna of India
and adjacent countries Series. Zoological Survey of
India, Calcutta 262 pp.
Middya S. 2017. Community structure of zooplankton in
three different types of water bodies of West
Midnapore District, India. J Pharmacy Biol Sci.
12(6-4):21–28.
doi: 10.9790/3008-1206042128
Midya S, Bhattacharya S, Islam SS, Ganguly RK,
Chakraborty SK. 2018. Observation on freshwater
zooplankton and hydrophytes composition in different
wetlands of Paschim Medinipur, West Bengal (India).
Int J Zool Stud. 3(2):5–9.
Mishra A, Chakraborty SK, Jaiswar AK, Sharma AP,
Deshmukhe G, Mohan M. 2010. Plankton diversity in
Dhaura and Baigul reservoirs of Uttarakhand. Indian J
Fish. 57(3):19–27.
Mishra R, Kanumgo VK, Shrivastava S, Agrawal RK.
2014. Seasonal abundance of zooplankton in five
ponds of Raipur city in Chhattisgarh. Int J Fauna Biol
Stud. 1(6):78–82.
Moss B, Kosten S, Meerhof M, Battarbee R, Jeppesen E,
Mazzeo N, Havens K., Lacerot G, Liu Z, De Meester
L, Paerl H, Scheffer M. 2011. Allied attack: climate
change and eutrophication. Inland Waters.
1(2):101–105.
doi:10.5268/IW-1.2.359
Mullins ML, Doyle RD. 2019. Big things come in small
packages: why limnologists should care about small
ponds. Acta Limnol Brasiliensia. 31: e105.
doi:10.1590/s2179-975x4119
Oertli B. 2018. Freshwater biodiversity conservation: The
role of artificial ponds in the 21st century. Aquatic
Conserv. 28(2):264–269.
doi:10.1002/aqc.2902
Osborne A, Wanielista P, Yousuf A. 1976. Benthic
fauna species diversity in six central Florida
lakes in summer. Hydrobiologia. 48(2):125–
129.
doi:10.1007/BF00040164
Pandey BN, Siddhartha R, Tanti KD, Thakur AK. 2013.
Seasonal variation of zooplanktonic community in
swamp of Purnia (Bihar), India. Aquatic Biol
Res.1(1):1–9.
Patra A, Santra KB, Manna CK. 2011. Ecology and
diversity of zooplankton in relation to physico–
chemical characteristics of water of Santragachi Jheel,
West Bengal, India. Journal of Wetlands Ecology.
5:20–39.
doi:10.3126/jowe.v5i0.4595
Patra AK, Das V, Datta T, Datidar SG. 2015. Zooplankton
fauna of Moraghat forest, a territorial forest of
Jalpaiguri district, West Bengal, India. Euro J Exp
Biol. 5(1):39–47.
Saha S, Saha T, Basu P. 2017. Seasonal changes in
zooplankton and macro-fauna populations of the East
Calcutta wetland fish ponds. Proc Zool Soc.
70(2):156–164.
doi:10.1007/s12595-016-0173-z
Saikia R, Das T, Gogoi B, Akash K, Vivekanand S, Das
DN. 2017. Community structure and monthly
dynamics of zooplankton in high altitude rice fish
system in Eastern Himalayan region of India. Int J.
Life Sci. 5(3):362–378.
Sanjer LR, Sharma UP. 1995. Community structure of
plankton in Kawar lake wetland, Begusarai, Bihar: II
Zooplankton. J Freshwat Biol. 7:165–167.
Seekell DA, Pace ML, Tranvik LJ, Verpoorter C. 2013.
A fractal-based approach to lake size-distributions.
Geophys Res Lett. 40(3):517-521.
doi:10.1002/grl.50139
Segers H. 2008. Global diversity of rotifers (Rotifera) in
freshwater. Hydrobiologia. 595:49–59.
doi:10.1007/s10750-007-9003-7
Sharma A, Sharma M. 2019. Zooplankton diversity in
relation to physico-chemical parameters in subtropical
pond of Jammu, Jammu and Kashmir, India. Biosci
Biotech Res Asia. 16(2):425–439.
doi:10.13005/bbra/2758
Sharma BK. 1995. Limnological studies in a small
reservoir in Meghalaya (N. E. India). In: K.H.
Timotius & F. Goltenboth, editors. Tropical
Limnology, II:1–11. Salatiga, Indonesia: Satya
Wacana University Press.
Sharma BK. 1998. Freshwater rotifers (Rotifera:
Eurotatoria). In: State Fauna Series: Fauna of West
Bengal. 3(11):341-461. Zoological Survey of India,
Calcutta

38
Sharma & Sharma 2021 - LimnoFish 7(1): 24-39
Sharma BK. 2011a. Zooplankton diversity of two
floodplain lakes (pats) of Manipur, northeast India.
Opusc Zool Budapest. 42(2):185–197.
Sharma BK. 2011b. Zooplankton communities of Deepor
beel (a Ramsar site), Assam (N.E. India): ecology,
richness and abundance. Trop Ecol. 52(3):291–302.
Sharma BK. 2016. Interesting rotifers (Rotifera:
Eurotatoria) from a sub-tropical wetland of
Meghalaya: new records. Turk J Zool. 40(3):433–437.
doi:10.3906/zoo-1510-20
Sharma BK, Bhattarai S. 2005. Hydrobiological analysis
of a peat bog with emphasis on its planktonic diversity
and population dynamics in Bumdeling Wildlife
Sanctuary, eastern Bhutan. Limnology. 6:183–187.
doi:10.1007/s10201-005-0157-6
Sharma BK, Hatimuria MK. 2017. Zooplankton diversity
of three floodplain lakes (beels) of the Majuli River
Island, Brahmaputra river basin of Assam, northeast
India. J Aquac Mar Biol. 6(1):00144.
doi:10.15406/jamb.2017.06.00144
Sharma BK, Hussain Md. 2001. Abundance and ecology
of zooplankton in a tropical floodplain lake, Assam
(N.E. India). Ecol Env Cons. 7(4):397–403.
Sharma BK, Kensibo. 2017. Rotifer assemblages
(Rotifera: Eurotatoria) of two wetlands of Nagaland,
northeast India: ecosystem diversity and interesting
features. Int J Fish Aquac Stud. 5(2):609–617.
Sharma BK, Lyngdoh RM. 2004. Zooplankton
communities of Umiam reservoir, Meghalaya (N. E.
India): composition, abundance and ecology. Indian J
Anim Sci. 74 (6):681–685.
Sharma BK, Lyngskor C. 2003. Plankton communities of
a subtropical reservoir of Meghalaya (N. E. India).
Indian J Anim Sci. 73(2):88–95.
Sharma BK, Michael RG. 1987. Review of taxonomic
studies on freshwater Cladocera from India with
remarks on biogeography. Hydrobiologia. 145:29–33.
doi:10.1007/BF02530262
Sharma BK, Noroh N. 2020. Zooplankton diversity of
three floodplain lakes of the Dibru-Saikhowa
Biosphere reserve, upper Assam, northeast India. Int J
Aquat Biol. 8(1):189–34.
doi:10.22034/ijab.v8i1.730
Sharma BK, Pachuau L. 2013. Zooplankton diversity of a
sub-tropical reservoir of Mizoram, Northeast India.
Opusc Zool Budapest. 44(1):47–60.
Sharma BK, Pou KRS, Sharma S. 2016. Rich rotifer
assemblage (Rotifera: Eurotatoria) of a sub-tropical
wetland of Meghalaya, Northeast India: ecosystem
diversity and interesting features. Int J Aquat Biol.
4(3):179–188.
Sharma BK, Sharma S. 1999a. Freshwater Rotifers
(Rotifera: Eurotatoria). In: State Fauna Series: Fauna
of Meghalaya. 4(9): 11–161. Zoological Survey of
India. Calcutta.
Sharma BK, Sharma S. 1999b. Freshwater Cladocerans
(Crustacea: Branchiopoda: Cladocera). In: State
Fauna Series: Fauna of Meghelaya. 4(9): 469–550.
Zoological Survey of India, Calcutta.
Sharma BK, Sharma S. 2000. Freshwater Rotifers
(Rotifera: Eurotatoria). In: State Fauna Series: Fauna
of Tripura. 4(7): 163–224. Zoological Survey of
India, Calcutta.
Sharma BK, Sharma S. 2011. Zooplankton diversity of
Loktak Lake, Manipur, India. Journal of Threatened
Taxa. 3(5):1745–1755.
doi:10.11609/JoTT.o2457.1745-55
Sharma BK, Sharma S. 2012. Diversity of zooplankton in
a tropical floodplain lake of the Brahmaputra river
basin, Assam (Northeast India). Opusc Zool Budapest.
43(2):187–195+ appendix
Sharma BK, Sharma S. 2017a. Rotifera: Eurotatoria
(rotifers) Chapter 7. In: K. Chandra, K.C. Gopi, D.V.
Rao, K. Valarmathi, J.R.B Alfred, editors. Current
status of freshwater faunal diversity in India.
Zoological Survey of India, Kolkata. p. 93–113.
Sharma BK, Sharma S. 2017b. Crustacea: Branchiopoda:
Cladocera) Chapter 14. In: K. Chandra, K.C. Gopi,
D.V. Rao, K. Valarmathi, J.R.B Alfred, editors
Current status of freshwater faunal diversity in India.
Zoological Survey of India, Kolkata. p. 199–223.
Sharma BK, Sharma S. 2019a. The biodiverse rotifers
(Rotifera: Eurotatoria) from small wetlands of the
Brahmaputra river floodplains of lower and upper
Assam, Northeast India. Journal of Limnology and
Freshwater Fisheries Research. 5(3):187–196.
doi:10.17216/LimnoFish.515981
Sharma BK, Sharma S. 2019b. The biodiverse rotifers
(Rotifera: Eurotatoria) of the floodplain wetlands of
Barak valley of Assam state, northeast India. Opusc
Zool Budapest. 50(1):3–15.
doi:10.18348/opzool.2019.1.3
Sharma BK, Sharma S. 2019c. The biodiverse rotifers
(Rotifera: Eurotatoria) of Northeast India: faunal
heterogeneity, biogeography, richness in diverse
ecosystems and interesting species assemblages. Bonn
Zool Bull. 68(1):147–162.
doi:10.20363/BZB-2019.68.1.147
Sharma BK, Sharma S. 2020. Zooplankton diversity of a
subtropical reservoir of Meghalaya, northeast India
with remarks on spatial and temporal variations.
Opusc Zool Budapest. 51(1):67–86.
doi:10.18348/opzool.2020.1.67
Sharma BK, Wanswett D. 2006. Zooplankton of a sub-
tropical fish pond of high rainfall region of Meghalaya
(N.E. India): composition and ecology. Rec Zool Surv
India. 106(1):69–80.
Sharma PC, Pant MC. 1985. Species composition of
zooplankton in two Kumaun Himalayan Lakes (U.P.,
India). Arch Hydrobiol. 102:387–403.
Sharma RC, Kumari K. 2018. Seasonal variation in
zooplankton community and environmental variables
of sacred Lake Prashar Himachal Pradesh, India. Int J
Fish Aquac Stud. 6(2):207–213.
Sharma S, Sharma BK. 2008. Zooplankton diversity in
floodplain lakes of Assam. Rec Zool Surv India, Occ
Paper No. 290:1–307.
Singh RK, Pandey MK, Kumari R, Ranjan P. 2012. Study
on the diversity and seasonal variation of zooplankton
in Mahendra Nath Pond, Siwan, Bihar. Int Pharmaceut
Biol Arch. 3(4):867–870.
Singh S, Sharma RC. 2020. Zooplankton diversity and

Sharma & Sharma 2021 - LimnoFish 7(1): 24-39
39
potential indicator species for assessment water
quality of high altitude wetland, Dodi Tal of Garhwal
Himalaya, India. Academia Arena.12(5):1–16.
doi:10.7537/marsaaj120520.01
Slathia S, Dutta SPS. 2013. Hydrobiological study of a
subtropical Shiwalik Lake, Jammu, J & K (India). Int
J Chem Env Biol Sci. 1(1):143–148.
Steinitz-Kannan M, Colinvaux P A, Kannan R. 1983.
Limnological studies in Ecuador: 1. A survey of
chemical and physical properties of Ecuadorian Lakes.
Arch Hydrobiol. Supplement 65: 61–105.
Thakur RK, Jindal R, Singh UB, Ahluwalia AS. 2013.
Plankton diversity and water quality assessment of
three freshwater Lakes of Mandi (Himachal Pradesh,
India) with special reference to planktonic indicators.
Environ Monit Assess. 185: 8355–8373.
doi:10.1007/s10661–013–3178–3
Twin YY, Aung SM. 2019. Seasonal occurrence of
zooplankton at the pond of Botataung Pagoda,
Botataung township, Yangon Region, Myanmar. Int J
Innovative Sci Res Tech. 4(5):991–995.
Tyor AK, Chopra G, Kumari S. 2014. Zooplankton
diversity in shallow lake of Sultanpur National park,
Gurgaon (Haryana). Int J Appl Biol Pharceut Tech.
5(1):35–49.
Vad CF, Péntek A, Cozma NJ, Földi A, Tóth A, Tóth B,
Böde NA, Móra A, Ptacnik R, Ács E, Zsuga K,
Horvátha Z. 2017. Wartime scars or reservoirs of
biodiversity? The value of bomb crater ponds in
aquatic conservation. Biol Conserv. 209:253–262.
doi:10.1016/j.biocon.2017.02.025
Verpoorter C, Kutser T, Seekell DA, Tranvik LJ. 2014. A
global inventory of lakes based on high-resolution
satellite imagery. Geophys Res Lett.
41(18):6396–6402.
doi:10.1002/2014GL060641
Wilhm JL, Dorris TC 1968. Biological parameters
for water quality criteria: BioScience, 18(6):
477–481.
doi:10.2307/1294272
Top Related