


Languages
Pages
Legal


INVESTOR PRESENTATION
Q3FY17 Update
2

3
Key Financial Highlights – Q3FY17
�Basic EPS of 31 cents and Diluted EPS of 30 cents�Book Value of USD 5.7
Satisfactory growth with steady NIM & strong momentum on SA continuesRobust earnings and growth with stable asset quality
NET INTEREST INCOME
30.3%
USD 221.8 Mn.
NET PROFIT
30.6%
USD 129.9 Mn.
DEPOSITS
30.5%
USD 19,480.0 Mn.
TOTAL ASSETS
31.9%
USD 28,670.3 Mn.
NIMs
3.5%
CASA Ratio
ROE
ROA
1.8%
22.3%
0.85%
0.29%
GROSS NPA
NET NPA
12.2%
TIER I*
ADVANCES
38.7%
USD 17,230.2 Mn.
16.9%
TOTAL CAPAD*
* Including Net profit, adjusted for prorated dividends
Retail TDs
33.3%
25.9%
4
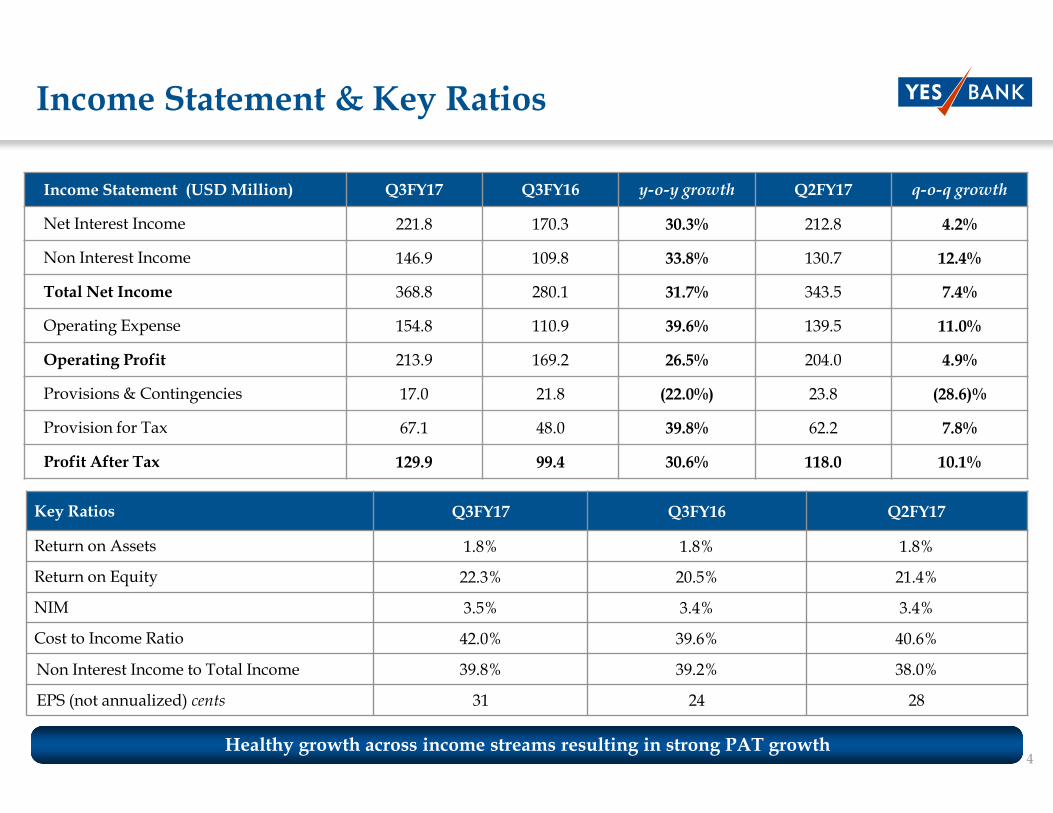
Income Statement & Key Ratios
SteadyHealthy growth across income streams resulting in strong PAT growth
Key Ratios Q3FY17 Q3FY16 Q2FY17
Return on Assets 1.8% 1.8% 1.8%
Return on Equity 22.3% 20.5% 21.4%
NIM 3.5% 3.4% 3.4%
Cost to Income Ratio 42.0% 39.6% 40.6%
Non Interest Income to Total Income 39.8% 39.2% 38.0%
EPS (not annualized) cents 31 24 28
Income Statement (USD Million) Q3FY17 Q3FY16 y-o-y growth Q2FY17 q-o-q growth
Net Interest Income 221.8 170.3 30.3% 212.8 4.2%
Non Interest Income 146.9 109.8 33.8% 130.7 12.4%
Total Net Income 368.8 280.1 31.7% 343.5 7.4%
Operating Expense 154.8 110.9 39.6% 139.5 11.0%
Operating Profit 213.9 169.2 26.5% 204.0 4.9%
Provisions & Contingencies 17.0 21.8 (22.0%) 23.8 (28.6)%
Provision for Tax 67.1 48.0 39.8% 62.2 7.8%
Profit After Tax 129.9 99.4 30.6% 118.0 10.1%

5
Robust Y-o-Y growth of CASA: 63.3%; and healthy Capital position
Balance Sheet (USD Million) Dec 31 2016 Dec 31 2015 y-o-y growth Sep 30 2016 q-o-q growth
Assets 28,670.3 21,743.0 31.9% 27,563.8 4.0%
Advances 17,230.2 12,419.5 38.7% 16,219.1 6.2%
Investments 7,320.8 6,715.6 9.0% 7,295.1 0.4%
Liabilities 28,670.3 21,743.0 31.9% 27,563.8 4.0%
Shareholders’ Funds 2,390.9 1,995.6 19.8% 2,261.8 5.7%
Total Capital Funds* 3,953.3 2,653.3 37.6% 3,401.9 16.2%
Borrowings 5,433.2 3,924.2 38.5% 5,089.9 6.7%
Deposits 19,480.0 14,927.2 30.5% 18,839.6 3.4%
CASA 6,493.5 3,976.1 63.3% 5,707.3 13.8%
Key Ratios Q3FY17 Q3FY16 Q2FY17
Capital Adequacy (Basel III)* 16.9% 16.1% 15.0%
Tier I Ratio (Basel III)* 12.2% 10.9% 10.1%
Book Value (USD) 5.7 4.8 5.4
Gross NPA 0.85% 0.66% 0.83%
Net NPA 0.29% 0.22% 0.29%
Balance Sheet & Key Ratios
* Including Profit , excluding pro rated dividend
6
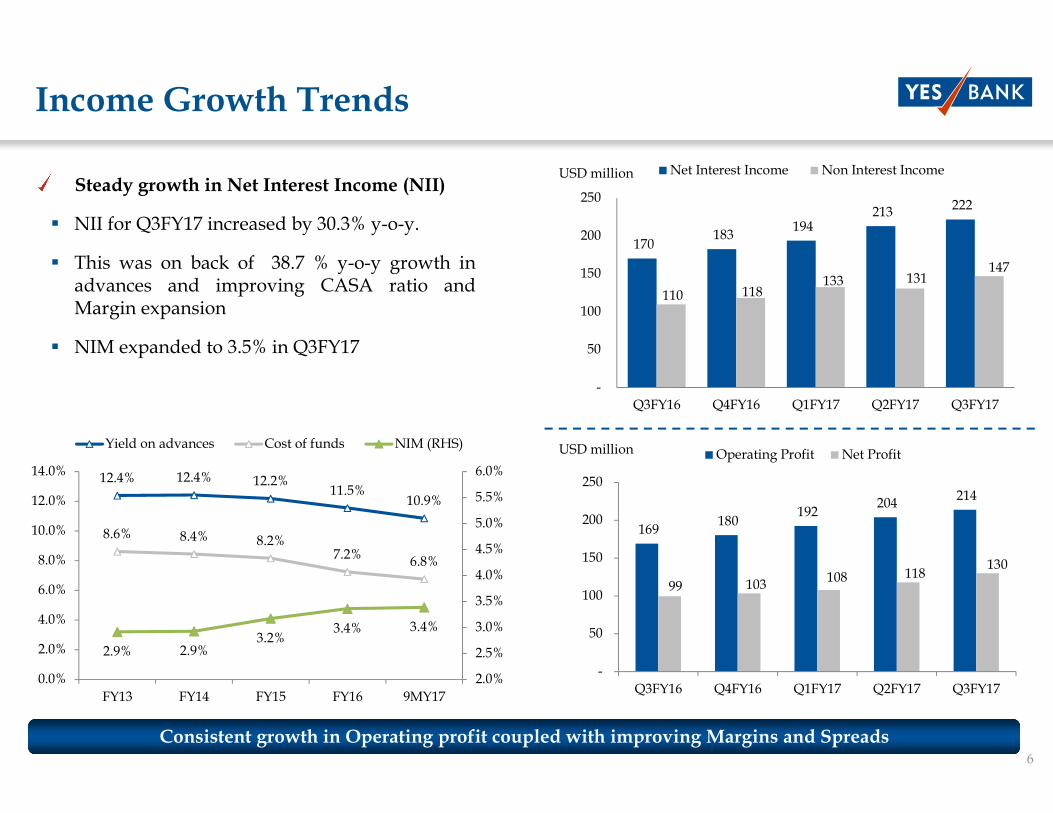
170 183
194 213
222
110 118 133 131
147
-
50
100
150
200
250
Q3FY16 Q4FY16 Q1FY17 Q2FY17 Q3FY17
Net Interest Income Non Interest Income
12.4% 12.4% 12.2%11.5%
10.9%
8.6% 8.4% 8.2%7.2%
6.8%
2.9% 2.9%3.2%
3.4% 3.4%
2.0%
2.5%
3.0%
3.5%
4.0%
4.5%
5.0%
5.5%
6.0%
0.0%
2.0%
4.0%
6.0%
8.0%
10.0%
12.0%
14.0%
FY13 FY14 FY15 FY16 9MY17
Yield on advances Cost of funds NIM (RHS)
169 180
192 204
214
99 103 108 118
130
-
50
100
150
200
250
Q3FY16 Q4FY16 Q1FY17 Q2FY17 Q3FY17
Operating Profit Net Profit
Income Growth Trends
Steady growth in Net Interest Income (NII)
� NII for Q3FY17 increased by 30.3% y-o-y.
� This was on back of 38.7 % y-o-y growth inadvances and improving CASA ratio andMargin expansion
� NIM expanded to 3.5% in Q3FY17
Consistent growth in Operating profit coupled with improving Margins and Spreads
USD million
USD million

7
Non-Interest Income Highlights
Steady
Non Interest Income Break-up
Granular & Healthy Non- Interest Income growth across all segments
USD Million Q3FY17 Q3FY16 y-o-y growth Q2FY17 q-o-q growth
Corporate Trade & Cash Management 14.6 16.5 (11.5)% 15.2 (3.8%)
Forex, Debt Capital Markets & Securities 45.3 15.1 200.2% 44.0 2.9%
Corporate Banking Fees 50.1 55.9 (10.4)% 40.6 23.4%
Retail Banking Fees 31.5 22.3 41.5% 30.8 2.3%
Total * 146.9 109.8 29.0% 130.7 8.37%
USD Million Q3FY17 Q2FY17 Q1FY17 Q4FY16 Q3FY16
Retail Banking Fees: 31.5 30.8 26.1 26.7 22.3
Trade & Remittance 8.7 10.6 10.4 8.5 7.8
Facility / Processing Fee 3.5 3.3 2.4 3.6 2.6
Third Party Sales 4.5 4.1 3.3 4.5 2.7
Interchange Income 7.6 6.7 5.4 5.1 5.3
General Banking Fees 7.3 6.1 4.6 4.9 3.9
Retail Banking Fees Break-up* Above breakup excludes USD 5.33 Million Recovery from Write Off
8
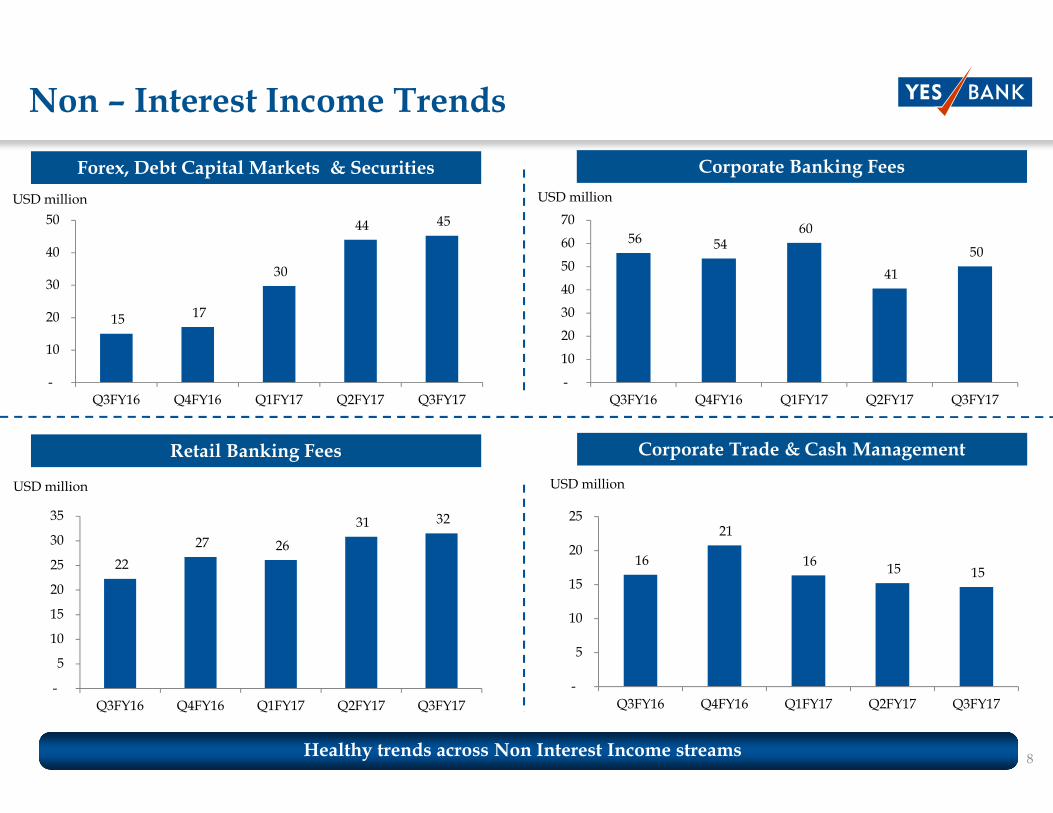
16
21
16 15 15
-
5
10
15
20
25
Q3FY16 Q4FY16 Q1FY17 Q2FY17 Q3FY17
Non – Interest Income Trends
USD million
Forex, Debt Capital Markets & Securities
USD million
Corporate Banking Fees
USD million USD million
Corporate Trade & Cash ManagementRetail Banking Fees
Healthy trends across Non Interest Income streams
22
27 26
31 32
-
5
10
15
20
25
30
35
Q3FY16 Q4FY16 Q1FY17 Q2FY17 Q3FY17
56 54 60
41
50
-
10
20
30
40
50
60
70
Q3FY16 Q4FY16 Q1FY17 Q2FY17 Q3FY17
15 17
30
44 45
-
10
20
30
40
50
Q3FY16 Q4FY16 Q1FY17 Q2FY17 Q3FY17

9

10
8.7%
11.2%13.2%
17.6%
22.2%
0
500
1,000
1,500
2,000
2,500
3,000
3,500
4,000
4,500
5,000
Q3FY13 Q3FY14 Q3FY15 Q3FY16 Q3FY17
SA SA (% of Dep)
9.6% 9.7% 9.4% 9.0%
11.2%
0
500
1,000
1,500
2,000
2,500
Q3FY13 Q3FY14 Q3FY15 Q3FY16 Q3FY17
CA CA (% of Dep)
19.4%21.2%
22.8%
27.2%25.9%
0
1,000
2,000
3,000
4,000
5,000
6,000
Q3FY13 Q3FY14 Q3FY15 Q3FY16 Q3FY17
Retail TD Retail TD (% of Dep)
18.3%20.9%
22.6%
26.6%
33.3%
0
1,000
2,000
3,000
4,000
5,000
6,000
7,000
Q3FY13 Q3FY14 Q3FY15 Q3FY16 Q3FY17
CASA CASA (% of Dep)
Well-diversified Liability Franchise
CASA+Retail FDs as % of Total Deposits stands at 59.2% as at Dec 31, 2016, up from 53.8% a year ago
USD million USD million
USD millionUSD million
Steady improvement in Granular Deposits
11
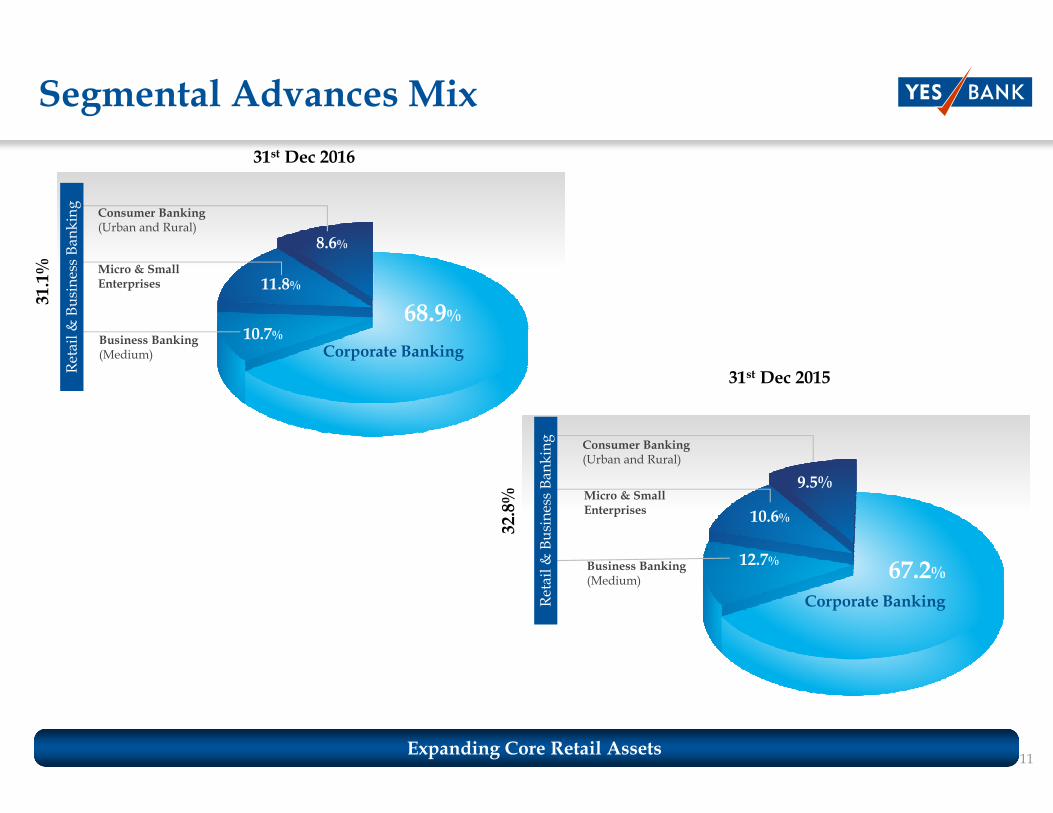
67.2%Corporate Banking
68.9%
Corporate Banking
9.5%
10.6%
12.7%
Consumer Banking (Urban and Rural)
Micro & Small Enterprises
Business Banking (Medium)
8.6%
11.8%
10.7%
Consumer Banking (Urban and Rural)
Micro & Small Enterprises
Business Banking (Medium)
Segmental Advances Mix
Retail & Business Banking
Retail & Business Banking
31st Dec 2016
31st Dec 2015
Expanding Core Retail Assets
31.1%
32.8%
12
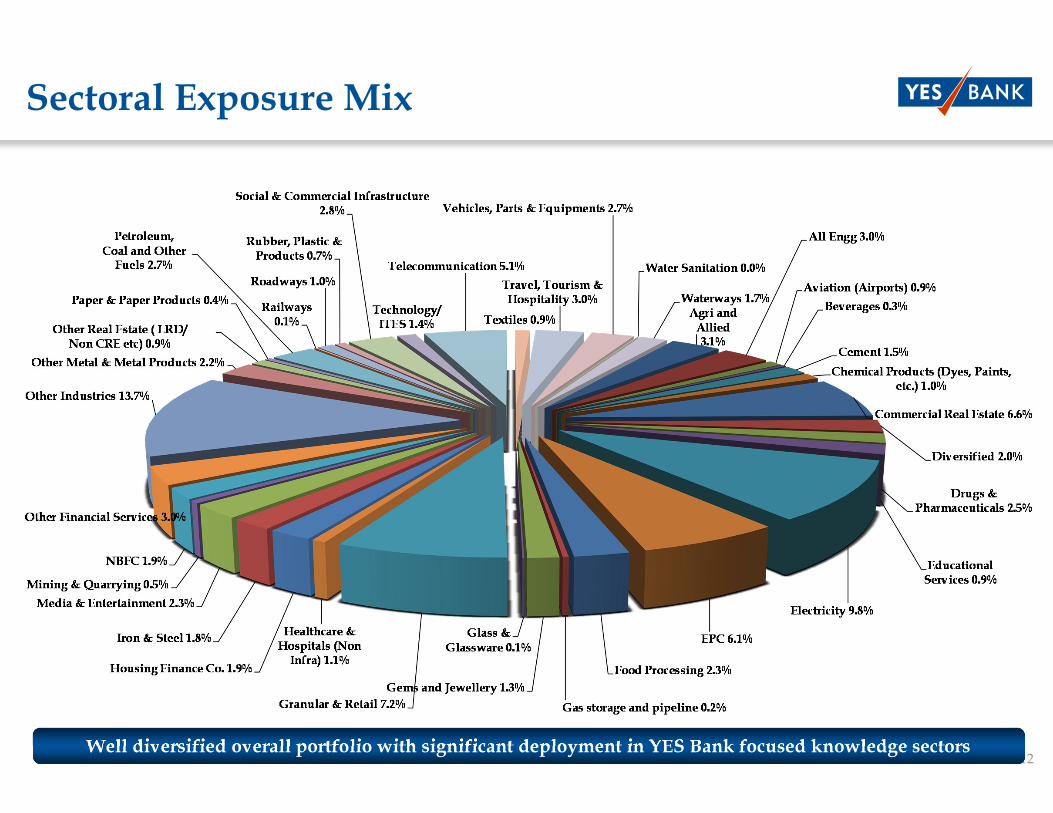
Sectoral Exposure Mix
Well diversified overall portfolio with significant deployment in YES Bank focused knowledge sectors
13
14
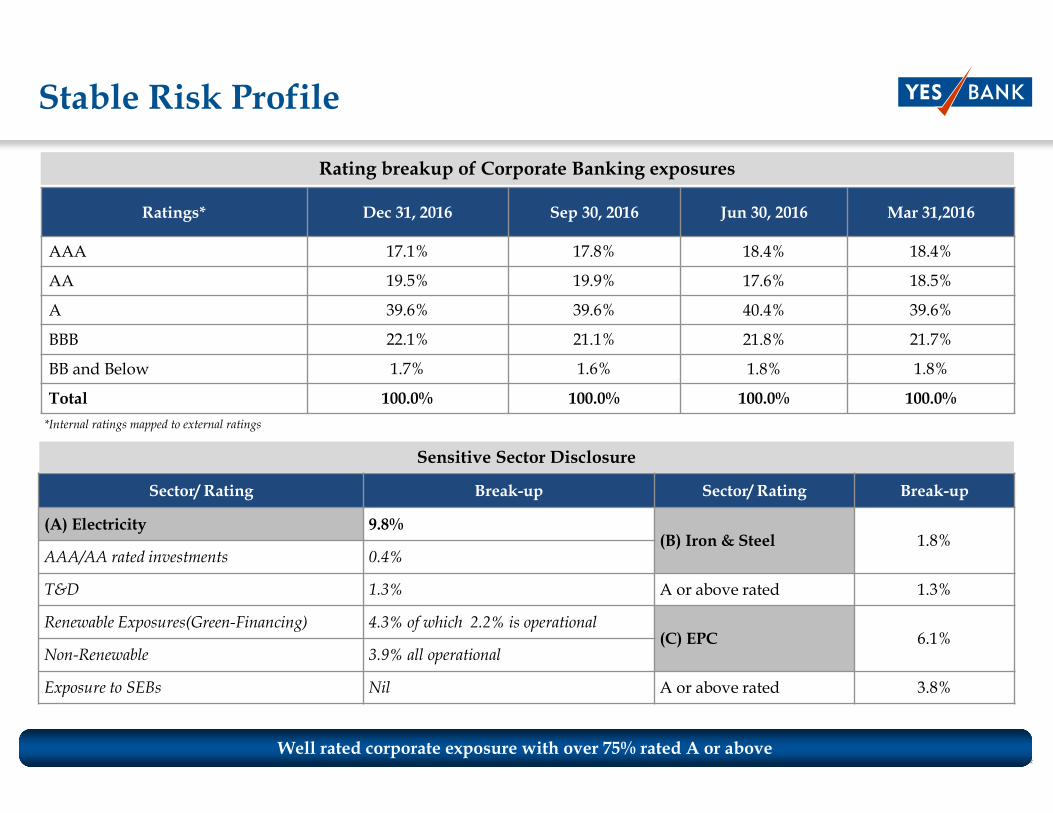
Stable Risk Profile
Rating breakup of Corporate Banking exposures
*Internal ratings mapped to external ratings
Well rated corporate exposure with over 75% rated A or above
Sensitive Sector Disclosure
Sector/ Rating Break-up Sector/ Rating Break-up
(A) Electricity 9.8%(B) Iron & Steel 1.8%
AAA/AA rated investments 0.4%
T&D 1.3% A or above rated 1.3%
Renewable Exposures(Green-Financing) 4.3% of which 2.2% is operational(C) EPC 6.1%
Non-Renewable 3.9% all operational
Exposure to SEBs Nil A or above rated 3.8%
Ratings* Dec 31, 2016 Sep 30, 2016 Jun 30, 2016 Mar 31,2016
AAA 17.1% 17.8% 18.4% 18.4%
AA 19.5% 19.9% 17.6% 18.5%
A 39.6% 39.6% 40.4% 39.6%
BBB 22.1% 21.1% 21.8% 21.7%
BB and Below 1.7% 1.6% 1.8% 1.8%
Total 100.0% 100.0% 100.0% 100.0%

15
55 68 80 87 98
104 103
118 115 119
0.66%
0.76%0.79%
0.83% 0.85%
0.22%0.29% 0.29% 0.29% 0.29%
0.00%
0.20%
0.40%
0.60%
0.80%
1.00%
-
50
100
150
200
250
Q3FY16 Q4FY16 Q1FY17 Q2FY17 Q3FY17
Specific Provision (LHS) General Loan Loss Provision (LHS)
Gross NPA (RHS) Net NPA (RHS)
Healthy Asset Quality
Credit Costs at 8 bps for Q3FY17
During the quarter,
� No additional restructuring
� No sale to ARC
� No instance of restructuring through 5:25 route
� One instance of SDR during the quarter
Bank continues to show resilience on all Asset Quality parameters
Trend of key Asset Quality parameters
USD Million
As a % of Advances Dec 31, 2016 Sep 30, 2016 Jun 30, 2016 Mar 31, 2016 Dec 31, 2015
A 1. Gross NPA % 0.85% (USD 148.0 Mn) 0.83% 0.79% 0.76% 0.66%
2. Net NPA % 0.29% (USD 50.4 Mn) 0.29% 0.29% 0.29% 0.22%
3. Provision Coverage Ratio 66.0% 64.8% 64.2% 62.0% 66.5%
B Restructured Advances % 0.42% (USD 73.6 Mn) 0.46% 0.49% 0.53% 0.67%
C Security Receipts (Net) % 0.22% (USD 38.1 Mn) 0.23% 0.19% 0.20% 0.25%
D Standard SDR 0.17% (USD 30.2 Mn) 0.03% 0.03% - -
E 5:25 Refinancing 0.09% (USD 15.2 Mn) 0.09% - - -
16
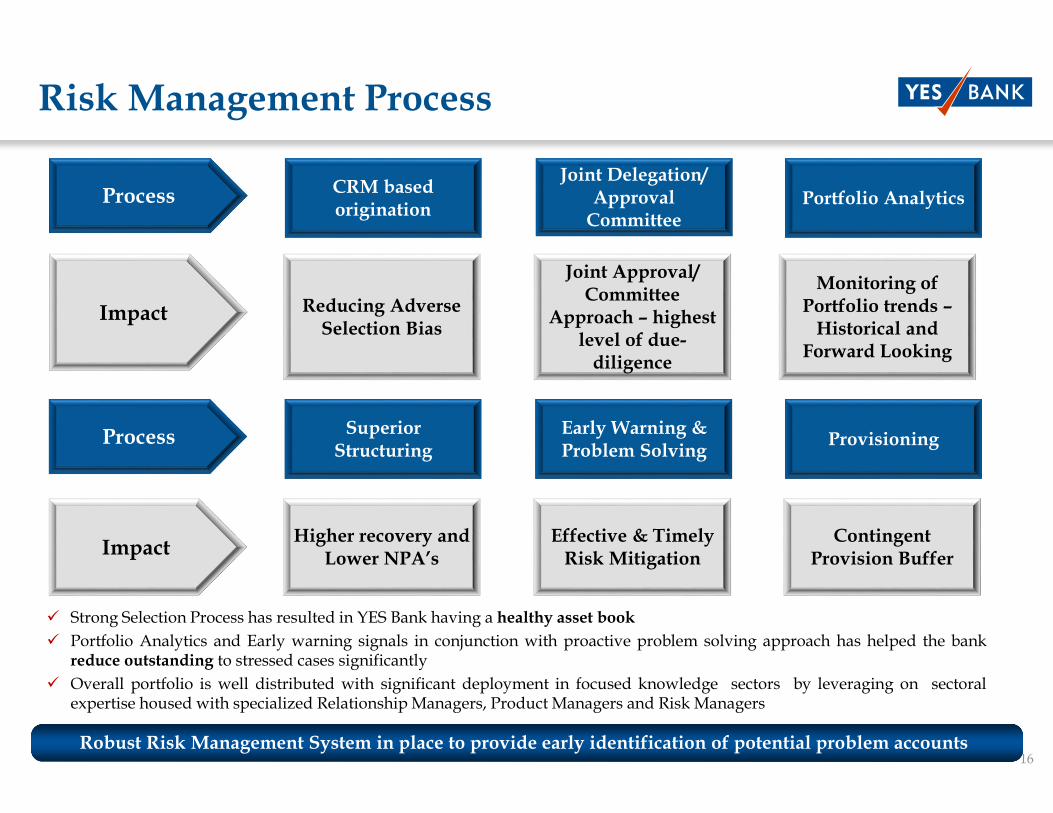
Risk Management Process
CRM based origination
Reducing Adverse Selection Bias
Impact
ProcessJoint Delegation/
Approval Committee
Joint Approval/ Committee
Approach – highest level of due-diligence
Portfolio Analytics
Monitoring of Portfolio trends –Historical and
Forward Looking
Robust Risk Management System in place to provide early identification of potential problem accounts
Superior Structuring
Higher recovery and Lower NPA’s
Impact
Process Early Warning & Problem Solving
Effective & Timely Risk Mitigation
Provisioning
Contingent Provision Buffer
� Strong Selection Process has resulted in YES Bank having a healthy asset book
� Portfolio Analytics and Early warning signals in conjunction with proactive problem solving approach has helped the bankreduce outstanding to stressed cases significantly
� Overall portfolio is well distributed with significant deployment in focused knowledge sectors by leveraging on sectoralexpertise housed with specialized Relationship Managers, Product Managers and Risk Managers
17
18
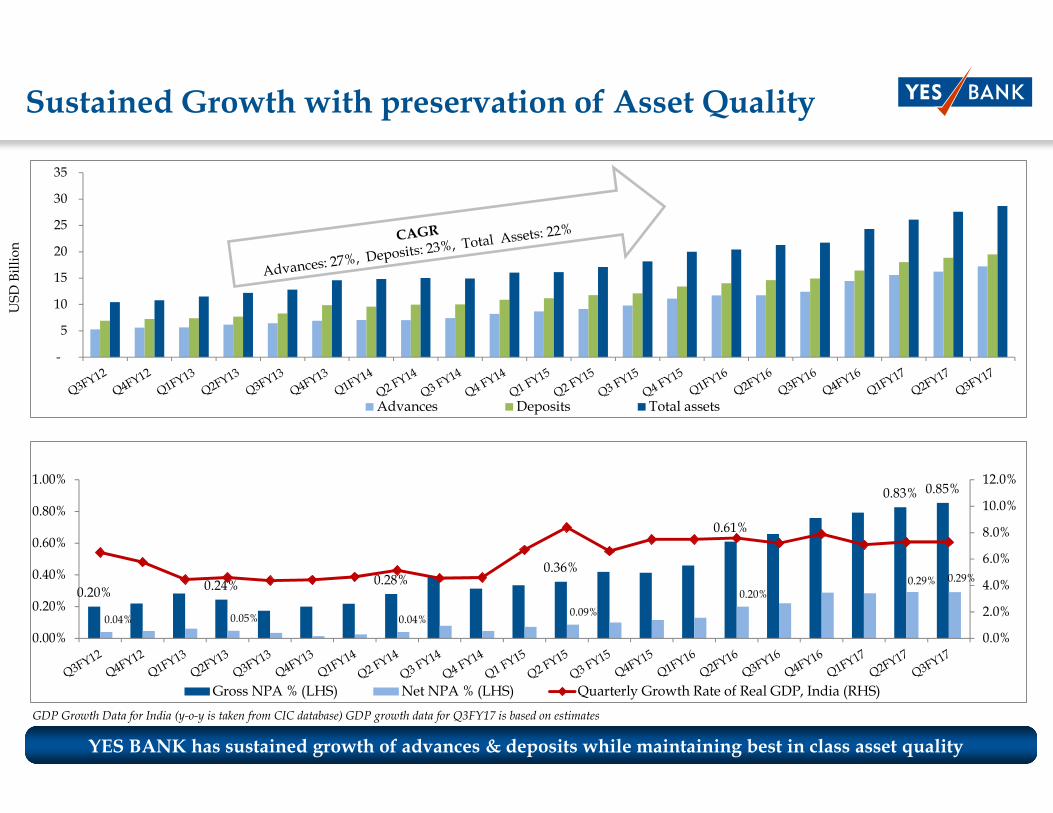
Sustained Growth with preservation of Asset Quality
USD Billion
YES BANK has sustained growth of advances & deposits while maintaining best in class asset quality
GDP Growth Data for India (y-o-y is taken from CIC database) GDP growth data for Q3FY17 is based on estimates
0.20%0.24% 0.28%
0.36%
0.61%
0.83% 0.85%
0.04% 0.05% 0.04%0.09%
0.20%0.29% 0.29%
0.0%
2.0%
4.0%
6.0%
8.0%
10.0%
12.0%
0.00%
0.20%
0.40%
0.60%
0.80%
1.00%
Gross NPA % (LHS) Net NPA % (LHS) Quarterly Growth Rate of Real GDP, India (RHS)
-
5
10
15
20
25
30
35
Advances Deposits Total assets

19
Income Growth With Consistent RoA & RoE Ratios
USD Million
Growth with quality, improving productivity and efficiency
USD Million
RoA RoE
-
20
40
60
80
100
120
140
-
50
100
150
200
250
Net Interest Income (LHS) Non Interest Income (LHS) Net Profit (RHS)
1.8%1.8%
21.5% 22.3%
0.0%
5.0%
10.0%
15.0%
20.0%
25.0%
30.0%
0.0%
0.2%
0.4%
0.6%
0.8%
1.0%
1.2%
1.4%
1.6%
1.8%
Return on Assets (LHS) Return on Equity (RHS)
QIP – US$ 500 Mn.

20
9.2% 9.9% 9.2% 9.5% 9.0% 9.5% 9.5% 9.5% 9.9% 9.8% 12.6% 12.2% 11.8% 11.5% 10.9% 10.9% 10.9% 10.7% 10.3% 10.1% 12.2%
Capital Growth Through Internal Accretion
Strong ROEs allow healthy internally funded growth
USD M
illion
USD M
illion
Tier I Capital Adequacy ratio
� Well capitalized with Total CRAR at 16.9% and Tier I ratio at 12.2%. Total Capital Funds stand at USD 4.0 Bn as onDec 31, 2016
QIP – US$ 500 Mn.
-
20,000
40,000
60,000
80,000
100,000
120,000
140,000
160,000
180,000
200,000
-
200,000
400,000
600,000
800,000
1,000,000
1,200,000
1,400,000
1,600,000
1,800,000
2,000,000
2,200,000
RWA (LHS) Tier I Capital (Including quarterly profits) (RHS)
21
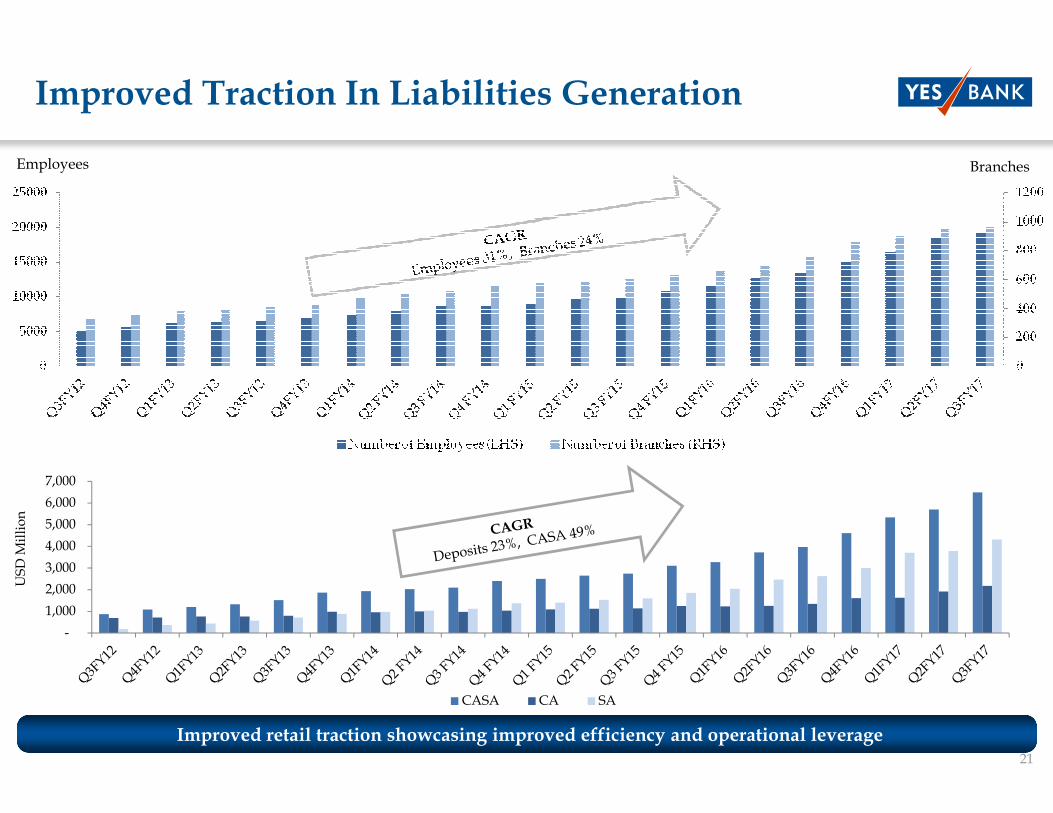
-
1,000
2,000
3,000
4,000
5,000
6,000
7,000
CASA CA SA
Improved Traction In Liabilities Generation
Improved retail traction showcasing improved efficiency and operational leverage
Employees Branches
USD Million

22

23
YES Bank’s Debt Ratings Journey
Ratings reflect a sustainable growth oriented financial model with robust risk management policies
International Rating Long-term Outlook Short-term
Moody's Investors Service Baa3 Stable Prime-3
Domestic Rating Long-term Outlook Short-term
Basel III AT1 Tier II Infra Bonds
ICRA AA+ AA+ Stable A1+
CARE AA AA+ AA+ Stable
India Ratings AA AA+ Stable
Rating Upgrade ICRA & CARELT II:AA- , UT II:A+, CD:A1+ (Highest Grade)
Rating Upgrade ICRA & CARELT II:AA, UT II:AA-
Received maiden International Investment Grade Baa3 long term rating from MOODY’S Investor Services
Rating Upgrade: ICRA & CAREBasel III Tier II: AA+, INFRA BONDS:AA+
2007 2011
2010 2014
Basel III AT1 rating of AA from CARE and India Ratings)
2016
24
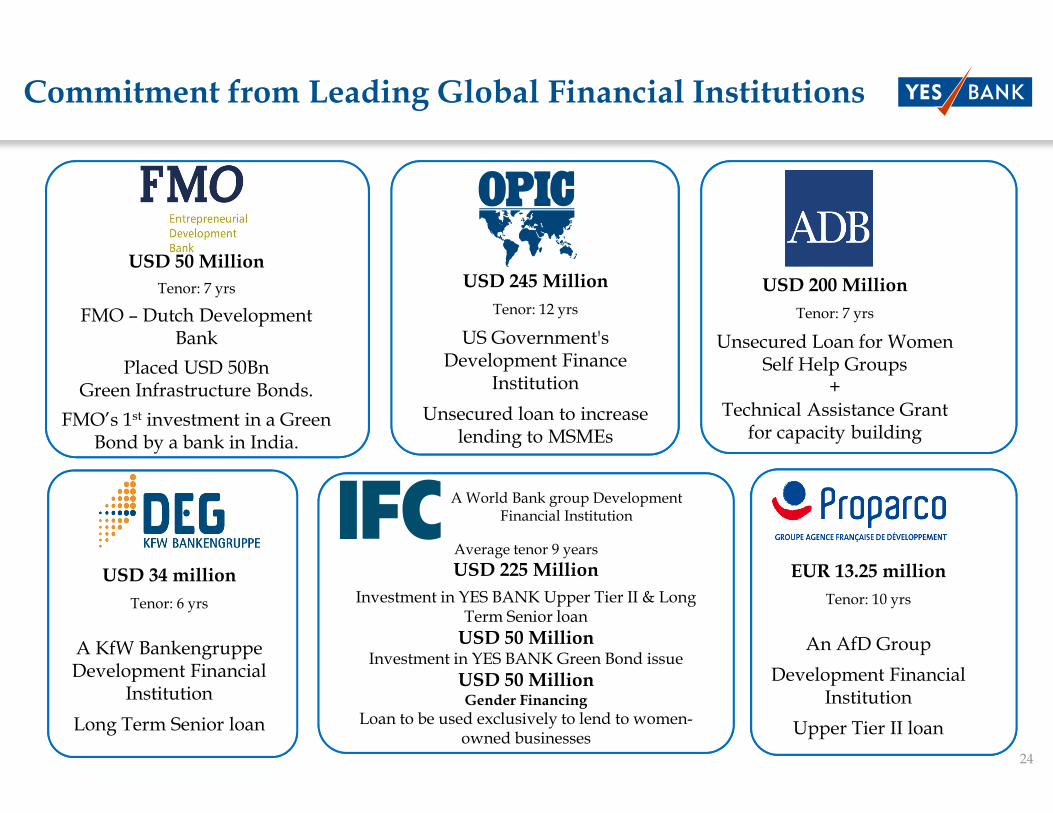
Commitment from Leading Global Financial Institutions
Average tenor 9 years
USD 225 Million
Investment in YES BANK Upper Tier II & Long Term Senior loan
USD 50 MillionInvestment in YES BANK Green Bond issue
USD 50 MillionGender Financing
Loan to be used exclusively to lend to women-owned businesses
USD 245 Million
Tenor: 12 yrs
US Government's Development Finance
Institution
Unsecured loan to increase lending to MSMEs
USD 200 Million
Tenor: 7 yrs
Unsecured Loan for Women Self Help Groups
+Technical Assistance Grant for capacity building
USD 34 million
Tenor: 6 yrs
A KfW BankengruppeDevelopment Financial
Institution
Long Term Senior loan
EUR 13.25 million
Tenor: 10 yrs
An AfD Group
Development Financial Institution
Upper Tier II loan
USD 50 Million
Tenor: 7 yrs
FMO – Dutch Development Bank
Placed USD 50Bn Green Infrastructure Bonds.
FMO’s 1st investment in a Green Bond by a bank in India.
A World Bank group Development Financial Institution

25
Successive Successful Loan Syndications
2013
Dual Currency Syndicated Loan Facility
USD 255 MioParticipation from 11 banks in Americas,
Middle East, Europe & APAC
2012
Dual Currency Syndicated Loan Facility
USD 155 Mio & EUR 50 Mio14 banks representing 9 countries
2014
Dual Currency Syndicated Loan Facility
USD 422 MioParticipation from 21 banks from14 countries
� Progressively broader markets, higher number of participants with longer tenor and improved pricing
� Won the Asia Pacific Loan Market Association (APLMA) award in 2012 and 2013
20165 year loan from Taiwan
USD 130 Mio Participation from 10 Taiwanese Banks
Syndication led by CTBC Bank Co., Ltd andTaiwan Cooperative Bank Ltd
26

27
Three Pronged Customer Acquisition, Engagement and Retention Strategy
�Ramp up Alternate Sales Management
� Implementation of New CBS and Advanced CRM + Analytics systems for highly focusedcustomer targeting and enhancing productivity of acquisition and relationship teams
�Digital Channels: Web/ Mobile/ Contact Centre/ ATMs/ Self Service Kiosks/ DigitalBranches to be at the forefront of Acquisition, Engagement, Servicing and Retention ofCustomers
�Complete Suite of Retail Assets and Liabilities Products
�YES Securities 3 in 1 account
�Credit Cards
�Multiplier effect: Initial period of gestation for Retail Assets to be followed by Scale up and exponential Growth
� Focused Segmented Approach:
� Senior Citizens
� Commercial Segment
� Y-Cops
� TASC
�HNI
� YES First
� YES Prosperity
� GIB
� OPDT
Core is Key –Quality Customer acquisition is the
strategy for developing a credible Retail Franchise
Core is Key
Quality Customer acquisition is the strategy for developing a credible Retail Franchise
Channels
Product Segments

28
Retail Banking: Expanding the National Footprint
� 964 Branches across key liability corridors as on Dec 31, 2016 up from 750 branches as of Dec 31, 2015
� Total ATM network stands at 1,757 as on Dec 31, 2016, including Bunch Note Acceptors (BNA)/ Recyclers
� Covering all 53 Metro locations, 29 States and 7 Union Territories
� Higher density in top deposit centers
� 16 Regions – 250 Hubs
� Hub and Spoke model for faster maturity and greater efficiency of branch network
� Relationship Management & Service Excellence oriented strategy
� Substantial focus on North & West Regions (DMIC/Make in India/GIB corridor) with evolving network in South & East
� Specialized Focus on Rural & Inclusive Banking Strategy
2010150As on Date
964 20202500
A Clearly Articulated 2 Pronged Strategy: Metro + Urban & Semi-Urban +Rural to achieve 2500 Branches by FY20
•IBU Branch in GIFT city•Rep office in Abu Dhabi

29
Strategic Pillars - Building Retail & SME Banking Assets
Building a strong Consumer and SME platform for scalable growth
� Attracting and retaining best talent from the industry � Skilled to scale team of dedicated employees built towards establishing quality franchise�Seasoned experienced leadership now in place with appropriate structure
�Leverage internal channels - Branch, ATM, Net Banking, Mobile Banking, Apps�Creating franchise –Dealers and large External channels�Partnership/Alliances – Key Manufacturers, Builders and New age channels (E-commerce)
�Invest in technology to create holistic customer acquisition platform through which all banking products can beoffered to the customer on real time basis through all touch points
�Create innovative solutions and capabilities�Focus on product innovation, delivery system enhancing customer experience� Exclusive customer offering to both internal and NTB using analytics and behavioral information�Seamless processing through digitization
�Risk management with good control over portfolio and focus on process & compliance with conscience�Robust collection framework in place and build the manpower/vendor structure
Human Capital
Distribution and creating
franchise
Technology
Digitization & Analytics Leadership
Risk Management
Branding & Marketing
�Increasingly capturing customer mindshare through improved brand recall

30
Full suite of product portfolio for Consumer and SME
Consumer RetailCommercial Retail &
MortgageSME and Mid Corporates
�Auto Loans�Two Wheeler Loans �Gold Loan�Personal Loan�Credit Cards
�Commercial Vehicle�Construction Equipment
�LAP/LAS�Healthcare Finance�Home Loans
�Smart Overdraft�Fast track lending Program�Scorecard Lending program�LGD Program (Linking Collateral with Rating for high ticket customers)
Product
� Salaried and Self Employed
�14 Knowledge Sunrise Sectors including Automobile, Pharmaceutical, Textile, Printing & Packaging
�CBB/ EBB/ SBB
Focus segment
�Tapping Liability customers
�Branch Channel�Technology aided processing
�Focused activities�Manufacture Tie-ups
�Cash flow based Credit underwriting
�Adequate Collaterals�Risk based pricing�SME rich lending program
�PSL benefits
�Building Granular MSME book
�CRM Based sourcing�Tapping Corporate linked Supply Chain – Channel Financing
Strategy
�Professionals� Infrastructure & Logistics
�Retail Investors�Self Employed
Ramping up branches across the country to build up Retail Assets
Largely Secured Portfolio

31
VISION : To make banking & payments SIMPLE, SECURE and OMNI PRESENT
YES Bank’s Initiatives
ACQUISITION
DIGITAL ACQUISITIONDIGITAL ENGAGEMENT
PAYMENTS & TRANSACTIONS
GO SOCIALFLEXI PAYMENTS
CUSTOMER SERVICE
BE EFFICIENTSTAY RELEVANT
YES Mobile
YES Tag
YES PAY
UPI
Payment Products
YES SecureSMART BOX
Application Programming Interface
YES SIM Se Pay
YES Money
Digital Banking
YES MONEY
Domestic Remittance
using Award Winning
Remittance Bridge
Platform
32
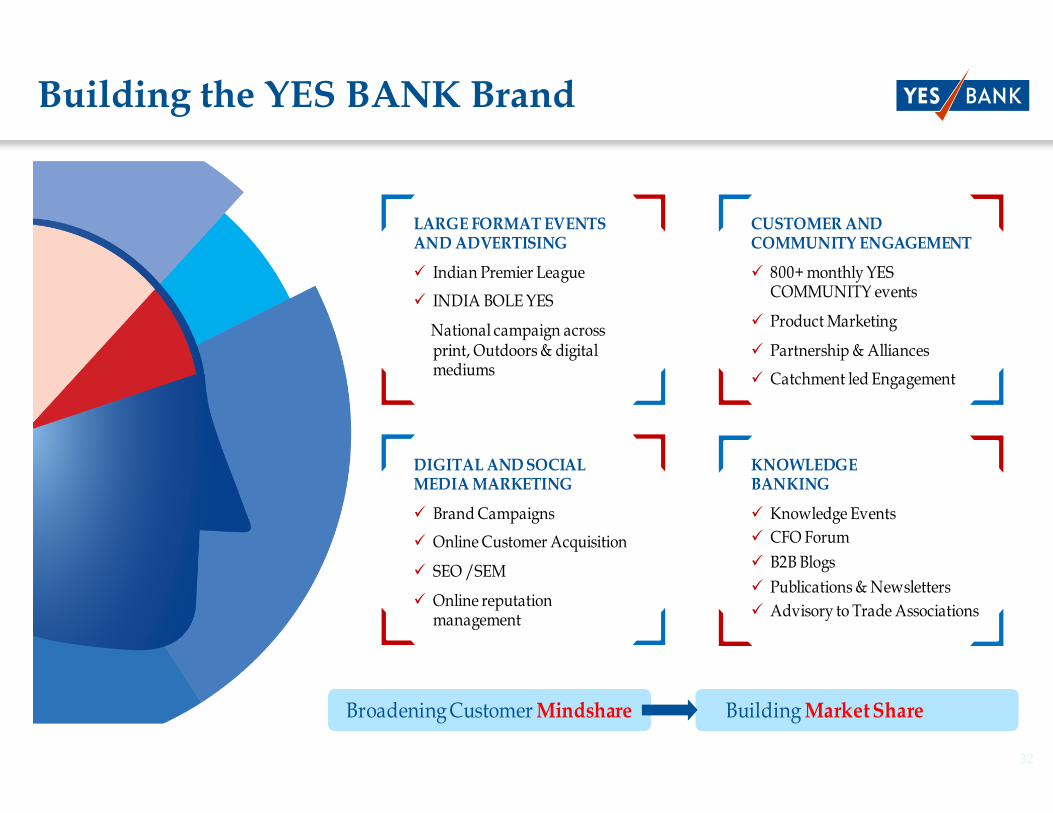
Building the YES BANK Brand
LARGE FORMAT EVENTS AND ADVERTISING
� Indian Premier League
� INDIA BOLE YES
National campaign across print, Outdoors & digital mediums
DIGITAL AND SOCIAL MEDIA MARKETING
� Brand Campaigns
� Online Customer Acquisition
� SEO /SEM
� Online reputation management
CUSTOMER AND COMMUNITY ENGAGEMENT
� 800+ monthly YES COMMUNITY events
� Product Marketing
� Partnership & Alliances
� Catchment led Engagement
KNOWLEDGE BANKING
� Knowledge Events
� CFO Forum
� B2B Blogs
� Publications & Newsletters
� Advisory to Trade Associations
Broadening Customer Mindshare BuildingMarket Share

33
Taking the brand a notch higher
� Highly Positive Campaign instilling a sense of pride and confidence in the India of today
� Matches YES BANK ethos as a forward looking, positive, optimistic and a proud Indian Organization
� Through external and internal visibility & reiteration, YES BANK has adopted the INDIA bole YES! way of life
� Presence across TV, Print, Outdoors, Digital & Social media
� Digital First Campaign launched in partnership with twitter
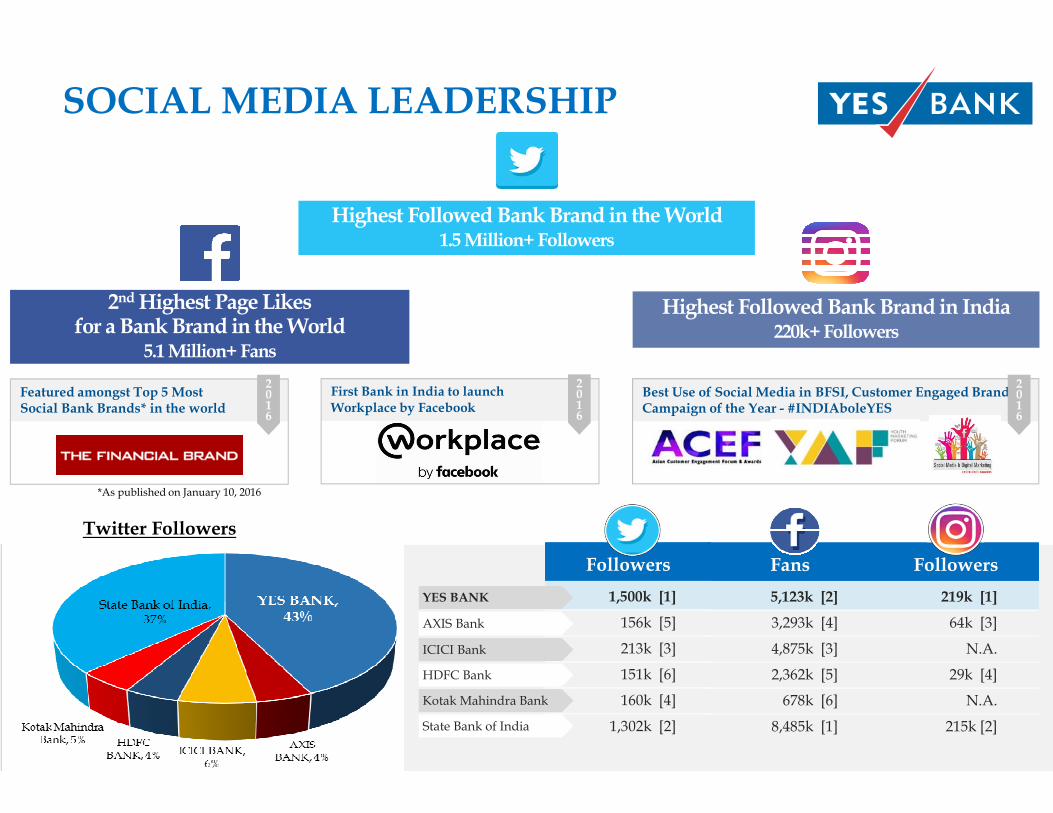
SOCIAL MEDIA LEADERSHIP
Highest Followed Bank Brand in the World1.5 Million+ Followers
Twitter Followers
Featured amongst Top 5 MostSocial Bank Brands* in the world
2016
Best Use of Social Media in BFSI, Customer Engaged Brand & Campaign of the Year - #INDIAboleYES
2016
Highest Followed Bank Brand in India220k+ Followers
2ndHighest Page Likes for a Bank Brand in the World
5.1 Million+ Fans
First Bank in India to launchWorkplace by Facebook
2016
FollowersFollowers
219k [1]
64k [3]
N.A.
29k [4]
N.A.
215k [2]
AXIS Bank
ICICI Bank
HDFC Bank
Kotak Mahindra Bank
State Bank of India
FansFans
5,123k [2]
3,293k [4]
4,875k [3]
2,362k [5]
678k [6]
8,485k [1]
*As published on January 10, 2016
FollowersFollowers
1,500k [1]
156k [5]
213k [3]
151k [6]
160k [4]
1,302k [2]
YES BANK

35
VISION
� On the Carbon Disclosure Leaders Index for five consecutive years
� Listed on the DJSI - Emerging Markets 2015 & 2016
The Bank committed to achieve the following by 2020:
� Mobilize USD 5 billion for climate action, including target funding of 5000MW of clean energy
� Contribute towards creating a carbon sink by planting 2 million trees
� Touch 100 million lives through its safe and clean drinking water program
� Banking Commission member
� Past Global Steering Committee member
� APAC Chair
� Launched India’s First Green Infrastructure Bonds raising INR 1000 crores in February 2015
� Green Masala Bonds - private placement by IFC for INR 315 crores in August 2015
� Issued INR 330 crores of Green Bonds with FMO, on a private placement basis in September 2016
� 447 locations across India ISO 14000: 2015 certified
� Chair of Natural Capital Finance Alliance Steering Committee
2008 | 2011 | 2012 2012 | 2013 | 2014 |
2015 | 2016
2014 | 2016 2016
First Indian Signatory First Indian Signatory First & Only Indian Bank Environmental, Social & Governance Leadership
First Indian Bank to launch Green Bonds
First Indian Bank to beISO 14001:2004 certified
First & Only Indian Signatory
2013 | 2014 | 2015 | 2016
Sustainable & Responsible Banking Leadership
2015 | 2016
Good Corporate Citizen Award
YES BANK Commitment – COP21
� AAA rating on MSCI ESG Ratings 2016
Vision: Be the Benchmark Financial Institution for Inclusivity and Sustainability
36
Best Innovation & Sustainable
Financial Products & Services
Karlsruhe Sustainable Finance Awards, Germany, 2016
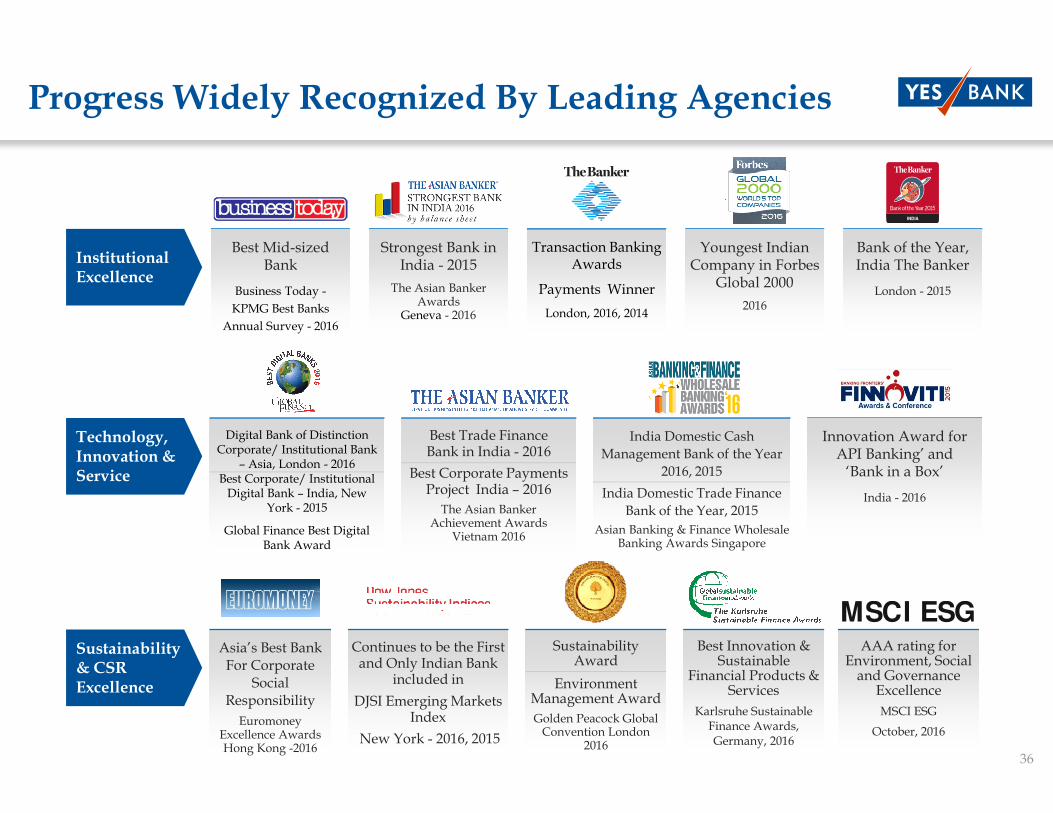
Progress Widely Recognized By Leading Agencies
Sustainability & CSR Excellence
Institutional Excellence
Innovation Award for API Banking’ and ‘Bank in a Box’
India - 2016
Technology, Innovation & Service
Best Trade Finance Bank in India - 2016
Best Corporate Payments Project India – 2016
The Asian Banker Achievement Awards
Vietnam 2016
Asia’s Best Bank For Corporate
Social Responsibility
EuromoneyExcellence Awards Hong Kong -2016
Continues to be the First and Only Indian Bank
included in
DJSI Emerging Markets Index
New York - 2016, 2015
Sustainability Award
Environment Management Award
Golden Peacock Global Convention London
2016
AAA rating for Environment, Social and Governance Excellence
MSCI ESG
October, 2016
Strongest Bank in India - 2015
The Asian Banker Awards
Geneva - 2016
Youngest Indian Company in Forbes Global 2000
2016
Bank of the Year, India The Banker
London - 2015
Transaction Banking Awards
Payments Winner
London, 2016, 2014
Digital Bank of DistinctionCorporate/ Institutional Bank
– Asia, London - 2016Best Corporate/ Institutional Digital Bank – India, New
York - 2015
Global Finance Best Digital Bank Award
India Domestic Cash
Management Bank of the Year
2016, 2015
India Domestic Trade Finance
Bank of the Year, 2015
Asian Banking & Finance Wholesale Banking Awards Singapore
MSCI ESG
Best Mid-sized Bank
Business Today -
KPMG Best Banks
Annual Survey - 2016
37
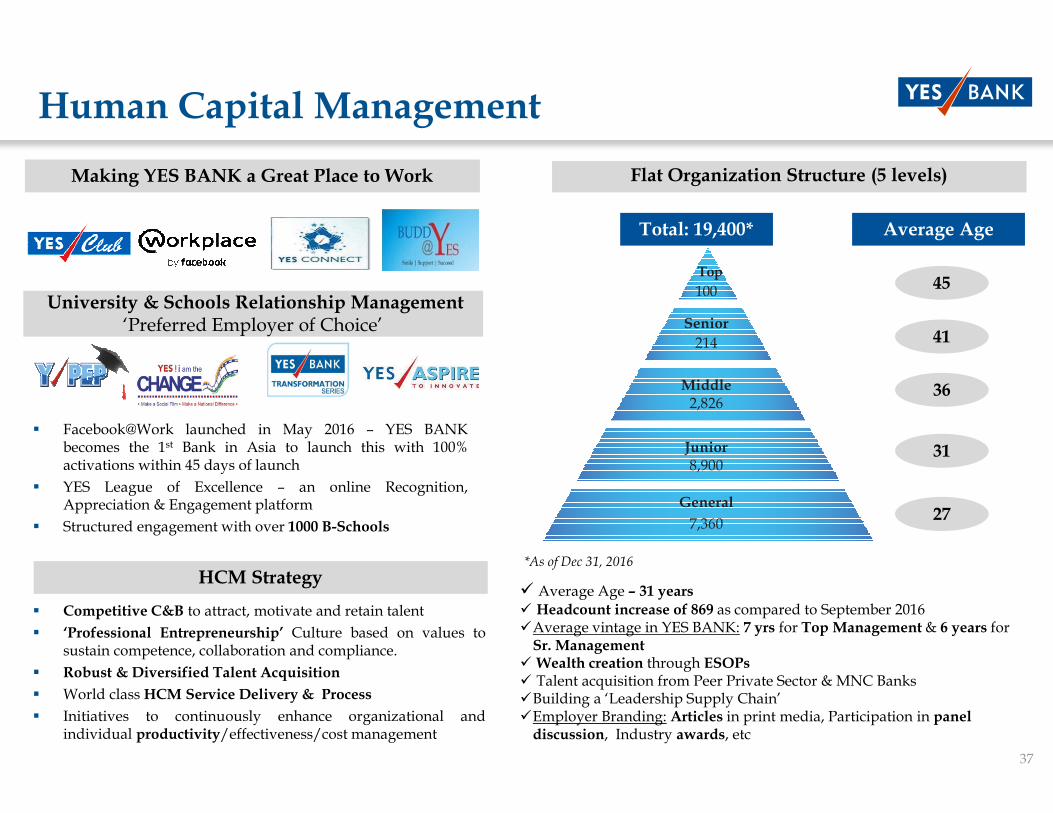
100
Senior
214
2,826
Junior8,900
General
7,360
Middle
Human Capital Management
� Facebook@Work launched in May 2016 – YES BANKbecomes the 1st Bank in Asia to launch this with 100%activations within 45 days of launch
� YES League of Excellence – an online Recognition,Appreciation & Engagement platform
� Structured engagement with over 1000 B-Schools
University & Schools Relationship Management‘Preferred Employer of Choice’
HCM Strategy
� Competitive C&B to attract, motivate and retain talent
� ‘Professional Entrepreneurship’ Culture based on values tosustain competence, collaboration and compliance.
� Robust & Diversified Talent Acquisition
� World classHCM Service Delivery & Process
� Initiatives to continuously enhance organizational andindividual productivity/effectiveness/cost management
Making YES BANK a Great Place to Work Flat Organization Structure (5 levels)
Total: 19,400* Average Age
45
41
36
31
27
*As of Dec 31, 2016
� Average Age – 31 years� Headcount increase of 869 as compared to September 2016�Average vintage in YES BANK: 7 yrs for Top Management & 6 years for Sr. Management
� Wealth creation through ESOPs� Talent acquisition from Peer Private Sector & MNC Banks�Building a ‘Leadership Supply Chain’�Employer Branding: Articles in print media, Participation in panel discussion, Industry awards, etc
Top
38
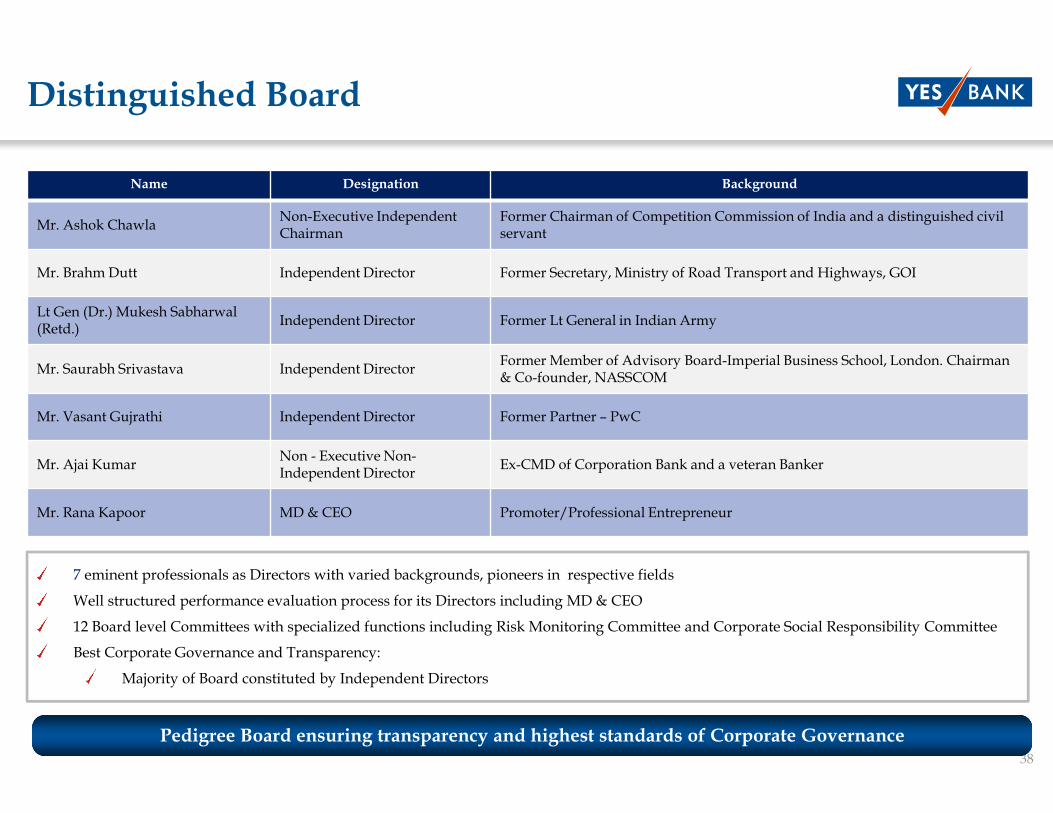
7 eminent professionals as Directors with varied backgrounds, pioneers in respective fields
Well structured performance evaluation process for its Directors including MD & CEO
12 Board level Committees with specialized functions including Risk Monitoring Committee and Corporate Social Responsibility Committee
Best Corporate Governance and Transparency:
Majority of Board constituted by Independent Directors
Name Designation Background
Mr. Ashok ChawlaNon-Executive Independent Chairman
Former Chairman of Competition Commission of India and a distinguished civil servant
Mr. Brahm Dutt Independent Director Former Secretary, Ministry of Road Transport and Highways, GOI
Lt Gen (Dr.) Mukesh Sabharwal (Retd.)
Independent Director Former Lt General in Indian Army
Mr. Saurabh Srivastava Independent DirectorFormer Member of Advisory Board-Imperial Business School, London. Chairman & Co-founder, NASSCOM
Mr. Vasant Gujrathi Independent Director Former Partner – PwC
Mr. Ajai KumarNon - Executive Non-Independent Director
Ex-CMD of Corporation Bank and a veteran Banker
Mr. Rana Kapoor MD & CEO Promoter/Professional Entrepreneur
Distinguished Board
Pedigree Board ensuring transparency and highest standards of Corporate Governance

39
No representation or warranty, express or implied is made as to, and no reliance should be placed on, the fairness, accuracy,
completeness or correctness of such information or opinions contained herein. The information contained in this presentation is only
current as of its date. Certain statements made in this presentation may not be based on historical information or facts and may be
“forward looking statements”, including those relating to the Company’s general business plans and strategy, its future financial
condition and growth prospects, and future developments in its industry and its competitive and regulatory environment. Actual
results may differ materially from these forward-looking statements due to a number of factors, including future changes or
developments in the Company’s business, its competitive environment and political, economic, legal and social conditions in India.
This communication is for general information purpose only, without regard to specific objectives, financial situations and needs of
any particular person. This presentation does not constitute an offer or invitation to purchase or subscribe for any shares in the
Company and neither any part of it shall form the basis of or be relied upon in connection with any contract or commitment
whatsoever. The Company may alter, modify or otherwise change in any manner the content of this presentation, without obligation
to notify any person of such revision or changes. This presentation can not be copied and/or disseminated in any manner.
Important Notice
THANK YOU
Top Related