


Languages
Pages
Legal


9063 2021
May 2021
Years of Life Lost to Revolution and War in Iran Mohammad Reza Farzanegan
Impressum:
CESifo Working Papers ISSN 2364-1428 (electronic version) Publisher and distributor: Munich Society for the Promotion of Economic Research - CESifo GmbH The international platform of Ludwigs-Maximilians University’s Center for Economic Studies and the ifo Institute Poschingerstr. 5, 81679 Munich, Germany Telephone +49 (0)89 2180-2740, Telefax +49 (0)89 2180-17845, email [email protected] Editor: Clemens Fuest https://www.cesifo.org/en/wp An electronic version of the paper may be downloaded · from the SSRN website: www.SSRN.com · from the RePEc website: www.RePEc.org · from the CESifo website: https://www.cesifo.org/en/wp

CESifo Working Paper No. 9063
Years of Life Lost to Revolution and War in Iran
Abstract This study examines the causal joint effect of a new political regime and war against Iraq on life expectancy of Iranians for the period 1978–1988 during the revolution and war. I use a synthetic control approach to construct a synthetic Iran based on a weighted average of other Middle East and North Africa (‘MENA’) and Organization of the Petroleum Exporting (‘OPEC’) countries. The synthetic Iran matches the average level of key pre-revolution life expectancy correlates and the evolution of the factual Iranian life expectancy during the post-revolution period through the end of the war. I find a sizable negative effect of the joint treatment. The results show that in total, an average Iranian has lost an accumulated 62 years of life during the post-revolution period until the end of war with Iraq in 1988. The average annual years of life lost is approximately six years. In other words, in the absence of the revolution and war, an average Iranian’s life expectancy could be approximately six years longer. JEL-Codes: C230, H560, F510, D740, Q340. Keywords: synthetic control method, treatment effect, Iran, Iraq, war, conflict, revolution, life expectancy, health.
Mohammad Reza Farzanegan Philipps-Universität Marburg
Center for Near and Middle Eastern Studies (CNMS) & School of Business and Economics
Deutschhausstr. 12 Germany - 35032 Marburg
This version: 12 April 2021 I thank Jhoana Ocampo for excellent research assistance.

2
Introduction
What was the effect of the Islamic revolution in Iran (1977-79) and the subsequent eight-
year war with Iraq (1980-88) on the life expectancy of Iranians? Open resistance against the
Mohammad Reza Pahlavi monarchy and the political system started in February 1977 and
worsened in 1978. By February 1979, the Shah fled into exile and the monarchy collapsed
(Kurzman 1995, Zunes 2009, and Seeberg 2014). Using the political instability and internal
chaos in Iran as an opportunity, the Iraqi army, under leadership of Saddam Hussein, invaded
Iran in 1980. An armed conflict started with Iraq which lasted eight years. Earlier studies have
attempted to measure the economic costs of the revolution and war for Iran and have estimated
losses from US$ 592 billion to US$ 1.5 trillion (e.g., Amirahmadi 1990, Mofid’s 1990,
Farzanegan 2020). There is no study on the years of life lost due to the revolution and war in
Iran. This study aims to fill this gap as shortened life expectancy resulting from conflict,
violence and war have important implications for economic development.
The purpose of this study is to understand how Iranian life expectancy could have
developed in the absence of the revolution and war. To address this question, I use a quasi-
experiment approach by comparing factual Iran with its counterfactual version, before and after
the revolution, and then estimate the joint effect of the revolution and war on the longevity of
Iranians. Employing a synthetic control methodology (SCM) and using annual data from 1970
to 1988, I quantify the magnitude of years of life lost due to the revolution and war in Iran. This
study contributes to public debate about the health costs of the Islamic revolution and war with
Iraq for the Iranian people.
To set the scene, the next section presents a brief review of literature on the life
expectancy-economic growth nexus. The third section explains the data and method. The fourth
section presents and discusses the main results. Inference procedures and sensitivity analysis
are presented and discussed in the fifth section. Concluding remarks are presented in the sixth
section.
3
Review of literature: life expectancy and economic growth
Health and economic growth are linked to each other through a variety of channels.
Oster, Shoulson, and Dorsey 2013, Soares (2005), and Kalemli-Ozcan et al. (2000) have shown
that lower mortality rates and longer lifespans increase a society’s willingness to invest in
human capital. This is based on the human capital theory which suggests that a longer life
expectancy enhances the incentives to invest in skill acquisition (Becker, 1964; Ben-Porath,
1967). Human capital is shown to have important direct and indirect effects on long-term
economic growth across countries (Hanushek, 2013; Hanushek and Woessmann, 2008, 2015).
Thus, one of the channels through which life expectancy contributes to economic growth is
through the channel of higher incentives for human capital formation.
Soares (2005), Kalemli- Ozcan (2002), Kalemli-Ozcan, Ryder, and Weil (2000), and de
la Croix and Licandro (1999) also provide evidence for a causal effect of life expectancy on
growth via human capital formation mechanism. Among theoretical models which included
human capital, specifically health capital in determining economic growth, we can refer to
Mankiw, Romer, and Weil (1992), Fogel (1994), Barro and Sala-i-Martin (1995) and Barro
(1996). For example, Barro (1996) followed a Ramsey scheme and developed a growth model
including physical capital inputs, level of education, health capital and the quantity of hours
worked. He shows that an increase in health indicators enhanced the incentives for investment
in education.
Other endogenous growth models developed by (Aghion and Howitt, 1998; Howitt,
2000, 2005; Howitt and Mayer-Foulkes 2005) also find six different channels through which
improvements in the health of a population may increase long-term economic growth (i.e.,
productive efficiency, life expectancy, learning capacity, creativity, coping skills and
inequality).
Empirical studies by Strauss and Thomas (1998) and Schultz (1999) show that enhanced
health indicators have made positive impact on the learning abilities of children and also

4
produced better educational outcomes. Fogel (1994) suggests that approximately one-third of
the increase in income in Britain during the 19th and 20th centuries was due to enhancement in
health and nutrition. Similar positive effects of higher life expectancy on growth are estimated
in the cases of Brazil and Mexico by Mayer (2001). Weil (2007) constructed macroeconomic
estimates of the proximate effect of health on GDP per capita. He shows that removing health
gaps across countries would reduce the variance of logarithm of GDP per worker by
approximately 10 percent and reduce the ratio of GDP per worker at the 90th percentile to GDP
per worker at 10th percentile from 20.5 to 17.9. Gyimah-Brempong and Wilson (2004) show
that 22% and 30% of the transition growth rate of per capita income in Sub-Saharan African
and OECD countries respectively, can be attributed to improved health human capital.
The size of the impact of longer life expectancy on economic growth is also substantial.
For example, Bloom, Canning and Sevilla (2004) use a production function model of economic
growth and employ a cross national panel dataset. They show that an increase of life expectancy
by one year increases GDP growth rate by 4%.1
Longer life expectancy also has a positive impact on saving rates (Kinugasa and Mason
2007; Zhang and Zhang, 2005). Lee, Mason, and Miller (2000) show that increases in life
expectancy are critical in the saving behaviour of individuals. Using US household data, Hurd,
McFadden and Gan (1998) show that people with higher subjective survival probabilities save
more. Bloom, Canning and Graham (2003), in their theoretical and empirical study, also find
that increases in life expectancy lead to higher savings rates at every age, even when retirement
is endogenous.
Both higher human capital investment and savings increase labor force productivity
(Cervellati and Sunde 2011). Higher longevity is positively associated with cognitive
1 Other studies find a non-linear association between life expectancy and economic growth (e.g., Azomahou
Boucekkine, and Diene, 2009; and Farauqee and Mühleisen, 2003; Cervellati and Sunde, 2011; and Hansen,
2012; Husain, Dutta and Chowdhary, 2014).

5
development (Jamison et al. 1996) and is shown to be one of the robust determinants of
investment and economic growth (Mason 2007; Alsan, Bloom, Canning 2006; Bloom, Canning,
and Sevilla 2004; Bjorvatn and Farzanegan 2013). Moreover, the level and development of life
expectancy shape fertility behaviour, intergenerational transfers, and incentives for claims on
pension benefits (Zhang, Zhang, and Lee 2001; Coile et al. 2002). Birth and sibling histories
from the Demographic Health Surveys conducted in sub-Saharan Africa, Turan (2020) shows
that increases in life expectancy will have a positive impact on growth through fertility,
education and labor supply. From a public finance perspective, increased life expectancy has a
positive effect on public funding for education (Gradstein and Kaganovich 2004).
In short, there are ample of studies which show a direct and indirect positive association
between life expectancy and economic development across the world.
Data and Methodology
I use the synthetic control method to study the trajectory of longevity in Iran before and
after the Islamic revolution. This method employs a weighted average set of control units,
presenting a synthetic control unit that reflects the treated unit (i.e. Iran) in terms of predictors
of outcome (i.e. life expectancy) before the shock. The SCM minimizes the gap between the
vector of characteristics of Iran and its synthetic before the revolution. Abadie et al. (2010)
present several distinct advantages of SCM over regression-based methods. The method
employs a transparent weighting framework and controls for time-varied unobserved country
characteristics to reduce concerns from simply comparing countries, which may arise in more
descriptive studies. Such descriptive studies usually lack an explicit counterfactual. In their
survey study, Athey and Imbens (2017) present SCM as “arguably the most important
innovation in the policy evaluation literature in the last 15 years.” Abadie and Gardeazabal
(2003), Abadie, Diamond, and Hainmueller (2010) and Abadie (forthcoming) present a review
of the methodology of the synthetic control and its applications.

6
I use annual country-level panel data for the period 1970-1988. The ceasefire between Iran and
Iraq was reached in 1988, ending a war that started in 1980. The treatment year is determined
to be 1977, which is the start of revolutionary movements in Iran.2
Following the same method used by Farzanegan (2020) in analyzing the economic costs
of the Iranian revolution and war, the synthetic Iran is constructed as a weighted average of
potential control countries in the donor pool. The donor pool includes a sample of Middle East
& North Africa (MENA) and Organization of the Petroleum Exporting Countries (OPEC) from
1970 to 1988. Using this sample helps to control for cultural, religious, geographical and
economical similarities. 3 In the SCM approach, an outcome variable (life expectancy) should
be comparable between the treated country (Iran) and its synthetic before the event (revolution
and war with Iraq), conditional on the successful generation of such a synthetic Iran. In the
latter case, a divergence between the factual Iran and its counterfactual after the treatment year
suggests the causal impact of the revolution and war on the longevity of Iranians. For an
unbiased estimation in SCM, it is important that countries in the donor pool do not have a
similar experience of conflict and violence as in the case of Iran. For this reason, countries such
as Iraq, Lebanon and Israel were excluded. After excluding countries with missing data, there
are a total of nine countries (from the initial 20) as possible candidates to generate a
counterfactual Iran4. For the outcome variable, I use an indicator of longevity from the World
Bank (2020), which measures the number of years a newborn infant would live if prevailing
patterns of mortality at the time of birth were to stay constant throughout the child’s life. The
following predictors of life expectancy are used to produce a counterfactual Iran before
applying the joint treatment of Islamic revolution and war. The selection of predictors is based
on earlier literature regarding determinants of longevity, the availability of data from all
2 The results do not change if we select 1978 as the treatment year. 3 The results are robust to an expanded worldwide sample. 4 These are Algeria, Ecuador, Egypt, Gabon, Malta, Morocco, Saudi Arabia, Tunisia, and Venezuela.

7
countries in the donor group from 1970 to 1988 and their contribution in generating a
counterfactual Iran before the treatment year (1970-1976) with high preciseness. The following
are used as predictors and correlates of outcome in SCM: gross domestic product (GDP) per
capita (2010 US$), gross capital formation (% GDP) and final consumption expenditure (% of
GDP) (Pritchett and Summers 1996), population growth rate (Acemoglu and Johnson 2007),
and urbanization (% of total population) (Dye, 2008). Furthermore, there is extensive literature
on the positive association between education and health (e.g., Grossman and Kaestner 1997).
Higher education is associated with higher income and wealth and more cognitive ability to
manage health risk factors. Lleras-Muney (2005) also provides empirical evidence on the causal
effect of education on health outcomes, focusing on adult mortality rates in the United States.5
In a sample of MENA countries, Hamidi et al. (2018) find a significant positive effect of
educational attainment on life expectancy, controlling for other factors. I use a human capital
index from the Penn World Table, which is calculated based on years of schooling and returns
on education (Feenstra, Inklaar and Timmer 2015). Finally, I control for the previous records
of life expectancy in years 1976, 1974, 1972 and 1970 to help increase the goodness of fit of
the counterfactual Iran with the factual Iran during the pre-revolution and war periods. The
source of data for all variables (except for human capital) is the World Bank (2020).
The synthetic control method employs countries included in the donor pool which have
not been exposed to the treatment (the Islamic revolution and war with Iraq), to build the
counterfactual development of life expectancy for Iran in the post-treatment (i.e. revolution and
war) period. This method considers that different countries from the donor pool share a different
degree of similarity with Iran by using country weights 𝜔𝑑 for each country d in donor pool,
assuming that these weights are between 0 and 1, i.e., 0 ≤ 𝜔𝑑 ≤ 1 and ∑ 𝜔𝑑 = 1𝐷𝑑=1 . To
5 Using OLS estimates, she shows that one more year of education in 1960 increased life expectancy at age 35 by
as much as 1.7 years.

8
identify and generate the best possible counterfactual Iran from all possible mixture of countries
in the donor sample, the SCM uses pre-treatment information of the outcome variable (life
expectancy in this study) 𝑌𝑡 and additional predictor variables 𝑍𝑡 which are shown to be relevant
explanatory variables for life expectancy (as explained earlier). Formally, the synthetic Iran is
generated by selecting weights 𝜔𝑑 such that 𝑌𝑡 − ∑ 𝜔𝑑∗𝐷
𝑑=1 𝑌𝑑𝑡 and 𝑍𝑡 − ∑ 𝜔𝑑∗𝐷
𝑑=1 𝑍𝑑𝑡 are
minimized for the years prior to the treatment, i.e., in this case, Iran’s revolutionary period and
the war with Iraq for t < 1977. In simple terms, the optimal synthetic Iran should not only have
the same (or similar) life expectancy as Iran during the pre-revolution and war periods, but it
should also have the same (or similar) values of the covariates. The treatment effect 𝛼𝑡is
calculated as 𝛼𝑡 = 𝑌𝑡 − ∑ 𝜔𝑑∗𝐷
𝑑=1 𝑌𝑑𝑡 for 𝑡 > 1977.
The impact of the revolution and war on life expectancy is equal to the difference
between the factual Iranian life expectancy and the estimated counterfactual life expectancy,
over the period of 1978-1988, had the Iranian revolution and war not happened.
Results
Table 1 shows that the synthetic Iran is best generated by a weighted average of three
countries, with Gabon (54%), Tunisia (30%) and Venezuela, RB (16%) having the highest
weights. Table 2 shows the average values of the covariates for the factual Iran and the
counterfactual Iran before 1977. The synthetic Iran closely reflects the pre-1977 performance
of the life expectancy covariates of the factual Iran. The synthetic Iran is similar to factual Iran
in terms of life expectancy before 1977, as well as in the associated shares of gross capital
formation, final consumption (private and public) in total GDP, population growth rate, urban
share of population, GDP per capita and human capital index.
In addition to data on factual Iran, the synthetic Iran, and their differences, in Table 2, I
present an unweighted average of variables for countries with a weight > 0 (i.e., Gabon, Tunisia
9
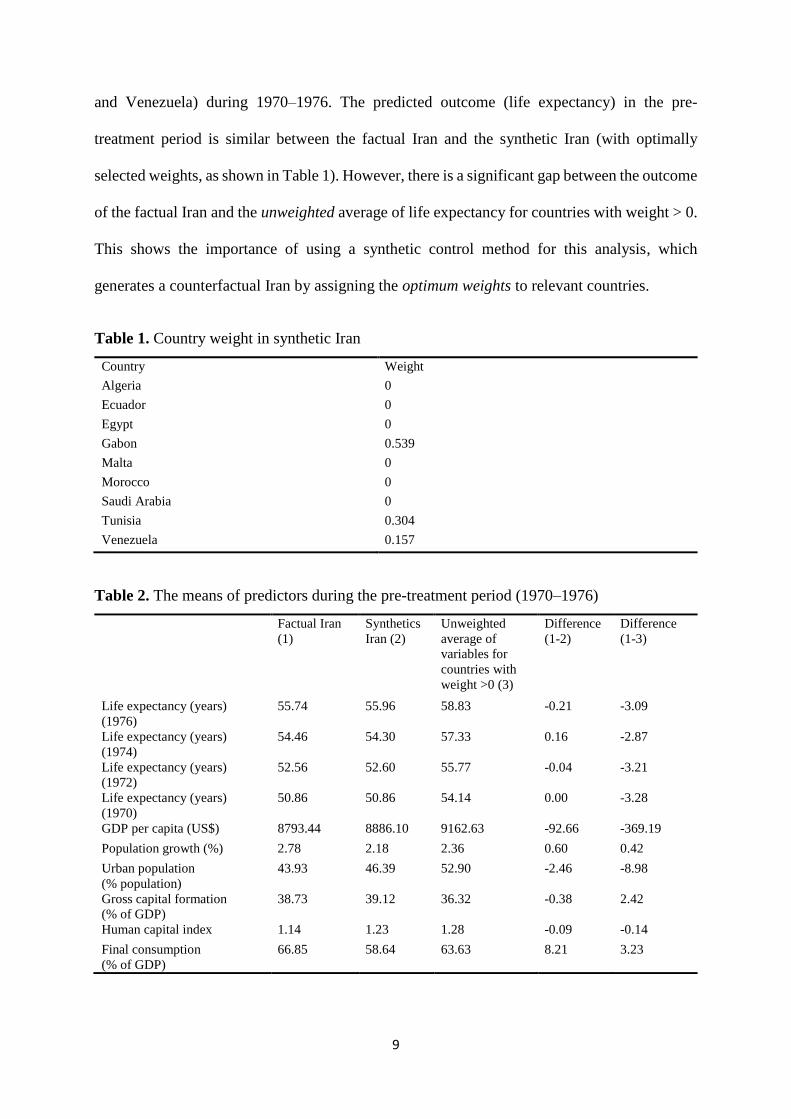
and Venezuela) during 1970–1976. The predicted outcome (life expectancy) in the pre-
treatment period is similar between the factual Iran and the synthetic Iran (with optimally
selected weights, as shown in Table 1). However, there is a significant gap between the outcome
of the factual Iran and the unweighted average of life expectancy for countries with weight > 0.
This shows the importance of using a synthetic control method for this analysis, which
generates a counterfactual Iran by assigning the optimum weights to relevant countries.
Table 1. Country weight in synthetic Iran
Country Weight
Algeria 0
Ecuador 0
Egypt 0
Gabon 0.539
Malta 0
Morocco 0
Saudi Arabia 0
Tunisia 0.304
Venezuela 0.157
Table 2. The means of predictors during the pre-treatment period (1970–1976)
Factual Iran
(1)
Synthetics
Iran (2)
Unweighted
average of
variables for
countries with
weight >0 (3)
Difference
(1-2)
Difference
(1-3)
Life expectancy (years)
(1976)
55.74 55.96 58.83 -0.21 -3.09
Life expectancy (years)
(1974)
54.46 54.30 57.33 0.16 -2.87
Life expectancy (years)
(1972)
52.56 52.60 55.77 -0.04 -3.21
Life expectancy (years)
(1970)
50.86 50.86 54.14 0.00 -3.28
GDP per capita (US$) 8793.44 8886.10 9162.63 -92.66 -369.19
Population growth (%) 2.78 2.18 2.36 0.60 0.42
Urban population
(% population)
43.93 46.39 52.90 -2.46 -8.98
Gross capital formation
(% of GDP)
38.73 39.12 36.32 -0.38 2.42
Human capital index 1.14 1.23 1.28 -0.09 -0.14
Final consumption
(% of GDP)
66.85 58.64 63.63 8.21 3.23
10
Figure 1 shows the life expectancy trajectory of the factual Iran and its synthetic for the
1970–1988 period. The synthetic Iran reproduces the life expectancy of the factual Iran during
the entire pre-revolution period. The estimate of the effect of the revolution and war on the life
expectancy in Iran is shown by the difference between the factual Iran and its synthetic (Figure
2 and Table 3).
The two lines diverge significantly after the collapse of Pahlavi monarchy and during
the war with Iraq. While life expectancy falls in the factual Iran, longevity keeps its earlier path
during the early the 1980s in the case of the synthetic Iran. The difference between the two
series remains significant towards the end of the sample period. Therefore, the results imply a
main negative effect of the revolution and war on life expectancy in Iran, which is a key metric
for assessing the health of the population.
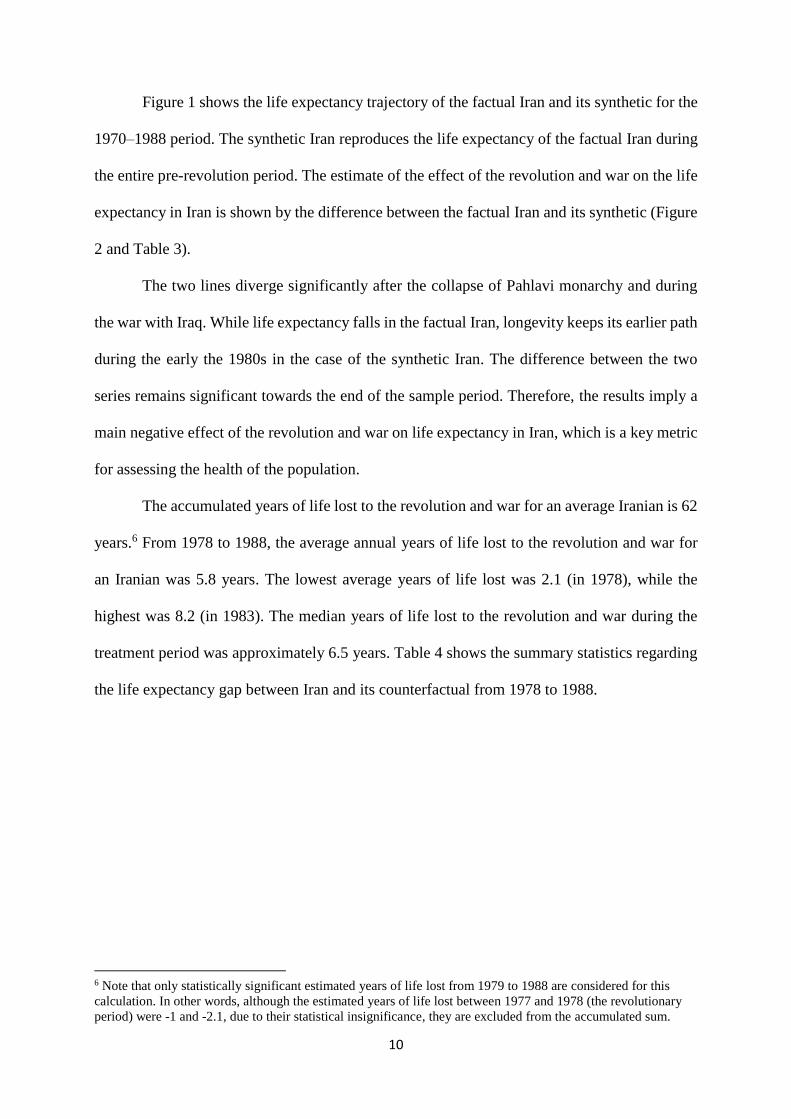
The accumulated years of life lost to the revolution and war for an average Iranian is 62
years.6 From 1978 to 1988, the average annual years of life lost to the revolution and war for
an Iranian was 5.8 years. The lowest average years of life lost was 2.1 (in 1978), while the
highest was 8.2 (in 1983). The median years of life lost to the revolution and war during the
treatment period was approximately 6.5 years. Table 4 shows the summary statistics regarding
the life expectancy gap between Iran and its counterfactual from 1978 to 1988.
6 Note that only statistically significant estimated years of life lost from 1979 to 1988 are considered for this
calculation. In other words, although the estimated years of life lost between 1977 and 1978 (the revolutionary
period) were -1 and -2.1, due to their statistical insignificance, they are excluded from the accumulated sum.

11
Table 3. Years of life lost to revolution and war in Iran
Year Gap in years (Iran life
expectancy-synthetic Iran life
expectancy)
Iran life expectancy Synthetic Iran life expectancy
1970 0.00 50.86 50.86
1971 -0.07 51.66 51.73
1972 -0.04 52.56 52.60
1973 0.06 53.51 53.46
1974 0.16 54.46 54.30
1975 0.13 55.27 55.13
1976 -0.21 55.74 55.96
1977 -0.95 55.83 56.78
1978 -2.08 55.51 57.59
1979 -3.52 54.88 58.40
1980 -5.08 54.11 59.19
1981 -6.52 53.45 59.97
1982 -7.60 53.13 60.73
1983 -8.16 53.29 61.45
1984 -8.14 54.00 62.13
1985 -7.54 55.21 62.76
1986 -6.47 56.85 63.32
1987 -5.12 58.68 63.81
1988 -3.70 60.53 64.23
Table 4. Summary statistics for the life expectancy gap between Iran and Synthetic Iran
(1978-1988)
Mean of loss -5.8 years
Median of loss -6.5 years
Minimum loss - 2.1 years
Maximum loss - 8.2 years
Std. Dev. 2.06 years
Post -treatment period (1978-1988) 11 years

12
Figure 1. Factual and counterfactual Iran. Source: Author’s own calculations.
It is also important to consider the uncertainty around the estimated years of life lost to
the revolution and war in the SCM approach. To do this, I follow a methodology developed by
Firpo and Possebom (2018) and Ferman, Pinto, and Possebom (2020) to gain more insight into
the statistical significance of the estimated results. Ferman et al. (2020) proposed a uniform
confidence set around the estimated effect by SCM, which contains all functions that are
deviations from the estimated treatment effect by an additive and constant factor and are not
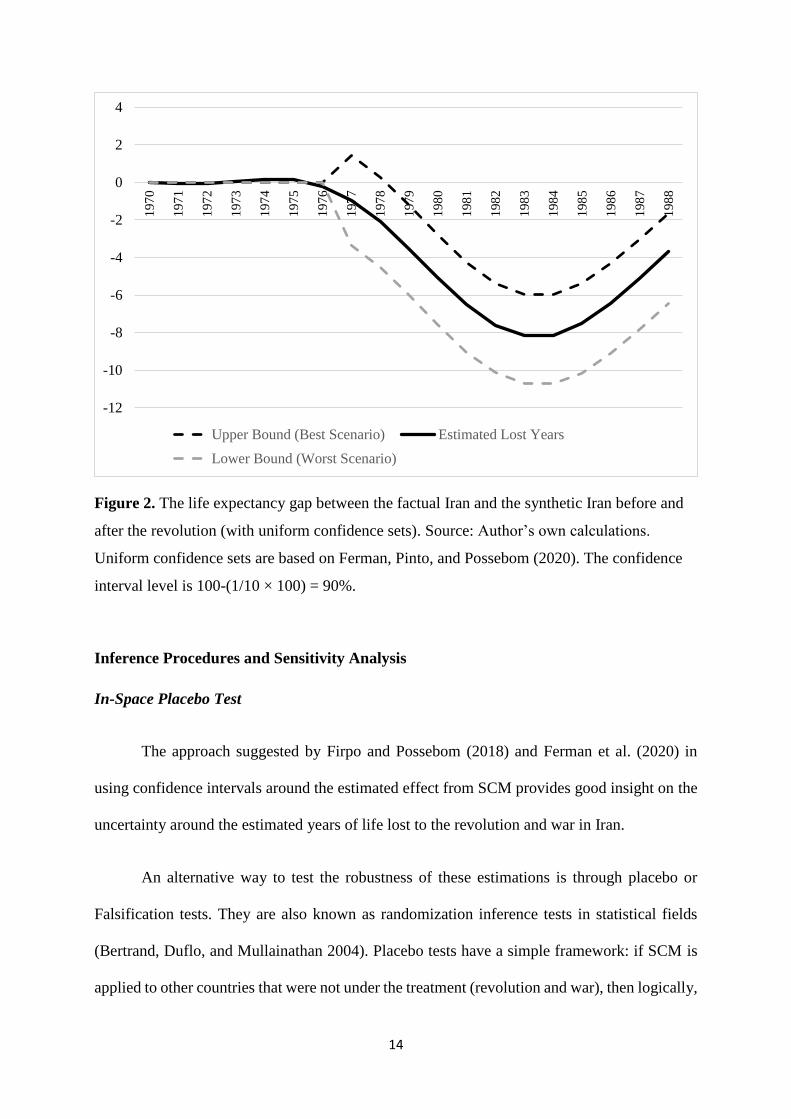
rejected by the placebo test. Figure 2 shows the estimated life expectancy gap between the
factual Iran and the counterfactual Iran with uniform confidence sets at 90% level (which is the
highest level of confidence intervals given the sample size of 10). I observe that the negative
effect of the joint treatment of revolution and war on the longevity of Iranians is statistically
significant in all years between 1979 and 1988. Table 5 and Figure 2 show the estimated gap
in life expectancy of the factual Iran and its counterfactual, in addition to the lower and upper

13
bounds for these estimations. In the years when confidence sets do not include zero, I am 90%
confident on the true negative effect of the revolution and war on the longevity of Iranians.
Table 5. Confidence sets for estimated years of life lost to revolution and war in Iran (1977–
1988)
Year
Upper Bound
(Best Scenario) Estimated Lost Years
Lower Bound
(Worst Scenario)
Confidence sets
(Uniform treatment)
1977 1.4 -1.0 -3.4
1978 0.3 -2.1 -4.5
1979 -1.2 -3.5 -6.0
1980 -2.8 -5.1 -7.6
1981 -4.3 -6.5 -9.0
1982 -5.4 -7.6 -10.1
1983 -6.0 -8.2 -10.7
1984 -6.0 -8.1 -10.7
1985 -5.4 -7.5 -10.2
1986 -4.3 -6.5 -9.1
1987 -3.0 -5.1 -7.8
1988 -1.7 -3.7 -6.4
Estimated Lost Years is the factual Iran’s life expectancy-synthetic Iran life expectancy. Calculations of
confidence sets are based on the work of Firpo and Possebom (2018) and Ferman et al. (2020). The
confidence interval is 90% (which is the highest possible level for the sample of 10 countries). The
bounds not only rejects the null hypothesis of no effect (because the upper bounds of the confidence sets
are –since 1979–below the zero function), but they also show that the joint health impact of the
revolution and war is far from zero, suggesting relevant negative effects on human life.
14
Figure 2. The life expectancy gap between the factual Iran and the synthetic Iran before and
after the revolution (with uniform confidence sets). Source: Author’s own calculations.
Uniform confidence sets are based on Ferman, Pinto, and Possebom (2020). The confidence
interval level is 100-(1/10 × 100) = 90%.
Inference Procedures and Sensitivity Analysis
In-Space Placebo Test
The approach suggested by Firpo and Possebom (2018) and Ferman et al. (2020) in
using confidence intervals around the estimated effect from SCM provides good insight on the
uncertainty around the estimated years of life lost to the revolution and war in Iran.
An alternative way to test the robustness of these estimations is through placebo or
Falsification tests. They are also known as randomization inference tests in statistical fields
(Bertrand, Duflo, and Mullainathan 2004). Placebo tests have a simple framework: if SCM is
applied to other countries that were not under the treatment (revolution and war), then logically,
-12
-10
-8
-6
-4
-2
0
2
4
197
0
197
1
197
2
197
3
197
4
197
5
197
6
197
7
197
8
197
9
198
0
198
1
198
2
198
3
198
4
198
5
198
6
198
7
198
8
Upper Bound (Best Scenario) Estimated Lost Years
Lower Bound (Worst Scenario)

15
a similar significant negative health outcome, should not be observed, as in the case of Iran. If
a similar trajectory for other countries is observed, then the estimated effect for Iran cannot be
associated with the post-revolution shock. The placebo tests are shown in Figure 3.
Figure 3. (in-space) Placebo Tests. Source: Author’s own calculations.
The tests were applied to the other nine donor countries in 1977.7 The thick black line
shows the earlier estimated health effect for Iran. The other lines represent the gap between the
life expectancy (in years) of each of the other countries and their related synthetic counterparts
produced by SCM. From Figure 3, it is clear that Iran shows a significant drop in the post-1977
period. There is no other country in this sample which shows a similar negative health effect
when subjected to this treatment.
7 Two countries (Gabon and Malta) showed a poor pre-treatment goodness of fit and are dropped from Figure 3.

16
In addition to this visual check, I calculate a pseudo p-value based on the rank of the
treatment unit's post/pre-root mean square prediction error (”RMSPE”) ratio compared to the
untreated placebo units’ post/pre-RMSPE ratios (as in Abadie, Diamond, and Hainmueller,
2010). As the results in Table 6 show, the largest ratio of post-treatment RMSPE to pre-
treatment RMSPE belongs to Iran (48.33). The inference procedures show a pseudo p-value of
1/10=0.10, meaning that there are no other placebo runs that outperform or equal the effect of
Iran’s estimate when pre-intervention fit (RMSPE) is accounted for. The evidence for a causal
health effect of the Iranian revolution and war is strong.
Table 6. Ratio between the post- and pre-intervention root mean squared prediction error
(RMSPE)
Country post/pre-RMSPE ratio
Algeria 18.76
Ecuador 2.30
Egypt 11.07
Gabon 1.53
Iran 48.33
Malta 0.92
Morocco 11.61
Saudi Arabia 0.61
Tunisia 4.96
Venezuela 19.05
Source: Author’s own calculations.
Change in Time Dimension (In-Time Placebo)
What will happen to the results produced by the synthetic control method if other years
are selected as treatment shocks? To evaluate the reliability of the results, and in addition to
“in-space placebo” test, I follow Abadie, Diamond, and Hainmueller 2012 and conduct an “in-
time placebo” examination. I re-estimate the SCM model but change the treatment year from
the beginning of the revolution in 1977 to two other periods. One is 1974, which did not have
any specific major political or economic shocks in Iran, and the other is 1980, which was the

17
start of the Iran-Iraq war. Is there a similar divergence between the life expectancy of the factual
Iran and its synthetic even if other periods are used? Figure 4 displays the result of the “in-time
placebo” study.
Figure 4. In-time placebo effect of 1974 life expectancy of the factual Iran vs. synthetic Iran.
Source: Author’s own calculations.
In Figure 4, there is no divergence between the actual life expectancy of the factual Iran
and the synthetic Iran, and there is no effect estimated for 1974. This shows that the random
selection of a year with no major political or economic events does not generate the effect which
was observed from the real shock of the revolution and war.
How about assuming the beginning of war with Iraq as the possible year of shock? Is
there a divergence between the factual Iran and its synthetic beginning in 1980? Re-estimating
the synthetic analysis shows that the divergence between the factual Iran life expectancy and
its synthetic began during the revolution (1977). In other words, the revolution and subsequent
war with Iraq imposed a causal negative effect on the life expectancy of Iranians.

18
Figure 5. In-time placebo effect of 1980 life expectancy of the factual Iran vs. synthetic Iran.
Source: Author’s own calculations.
Leave-One-Out Synthetic Control
To what extent is the main result sensitive to the inclusion of a specific country in the
donor pool? To elaborate this issue, I conduct a leave-one-out analysis where the most
influential countries are iteratively excluded from the synthetic control sample. In each
iteration, the number of countries in the donor pool is reduced by one and the model is re-
estimated based on the adjusted synthetic sample.
In the first iteration, Gabon, which has the highest weight (see Table 1), is excluded,
and the synthetic control method is run following this adjustment to the donor pool. After
running SCM without Gabon, Tunisia received the highest unit weight in the donor sample.
In the next iteration, both Gabon and Tunisia are excluded. I am interested in synthetic
controls with low prediction errors. Thus, I continue this process until the pre-intervention

19
RMSPE is more than twice of the main estimation. This happens after the second iteration
(when excluding both Gabon and Tunisia, resulting in pre-intervention RMSPE of 0.2642,
which is 2.2 times of the pre-intervention RMSPE of the main estimation at 0.1189).
Figure 6 illustrates the findings of Leave-One-Out Synthetic Control analysis. The
synthetic control results are robust to the exclusion of dominant countries from the donor pool,
ensuring the reliability of the initial findings.
Figure 6. Sensitivity analysis
Note: Results from a leave-one-out analysis that iteratively reduces the donor pool by excluding the most important
country from the synthetic control unit until the pre-intervention prediction errors are twice as large as in the main
analysis (n = 2 iterations). Source: Author’s own calculations.
Conclusion
More than four decades ago, Iran experienced a series of momentous political events
with substantial implications for its socio-economic development. The Islamic revolution,
which started during 1977-78 and led to the collapse of monarchy system in Iran in 1979, as
20
well as the subsequent war with Iraq (1980-88) imposed significant economic costs. Farzanegan
(2020) examined the causal joint effect of the revolution and war on the economy of Iran and
showed that the average income per capita lost to the revolution and war was approximately
US$ 3000. While the economic costs of conflict and violence (with more focus on the war with
Iraq) has been studied in the literature, the human and health consequences of these events are
less investigated.
This study provides an answer to the question: what could have happened to the
longevity of Iranians in the absence of the Islamic revolution and war with Iraq? Addressing
this question is important given the significant body of evidence on the long-term positive
development consequences of longer life expectancy. Earlier studies suggest that an increase in
life expectancy leads to more economic growth directly and indirectly through different
channels, such as higher incentives for investment in human capital (education), saving rates,
labor force participation and productivity, and life sensitisation, among others.
I aim to find an answer on the causal effect of conflict and violence on the health of a
nation. To do this, I employ a quasi-experimental approach based on the synthetic control
method, estimating the years of life lost in Iran following the Islamic revolution and war with
Iraq. I show that the trajectories of life expectancy of the factual Iran and its synthetic were
similar before the shock of the revolution. However, it significantly deviated after.
The results show that an average Iranian lost an accumulated 62 years of life during the
post-revolution period until the end of war with Iraq in 1988. The average annual years of life
lost is approximately 6 years. In other words, in the absence of the revolution and war, an
average Iranian’s life expectancy could be approximately 6 years longer.
I also consider the uncertainty around the estimated life expectancy gap between the
factual Iran and its counterfactual after the revolution and calculate the 90% confidence
21
intervals around the estimated gap. I observe that the negative effect of the joint treatment of
the revolution and war on the longevity of Iranians is statistically significant in all years
between 1979 and 1988. The highest negative effect on health is observed in 1983 with an
estimated 8.2 years of life lost.
A change in regime and a destructive eight-year war with Iraq forced the state to allocate
more scarce economic resources to the military, rationing key food and nutrition products and
restricting trade. Post-revolution Iran also experienced a variety of economic sanctions imposed
by the United States. The reduction of the quantity and quality of basic goods and services
degraded the quality of life under the harsh political situation of the post-revolution period.
In addition to considering the uncertainty around the estimations, I also carried out the
more traditional forms of sensitivity analysis for the synthetic control method. These tests
included in-space and in-time placebo examinations as well as leave-one-out synthetic control.
These additional robustness checks support the initial findings of a significant negative causal
effect of revolution and war on the life expectancy of Iranians.
According to existing literature, the lost longevity has long-term negative impact on
willingness to invest in human capital, public funding on education, cognitive development,
saving rates, labor force productivity, fertility behavior of individuals, investment rates and
economic growth. The political shock of the revolution that destabilized the government and
the subsequent war with Iran not only destroyed the nation’s physical infrastructure, but also
came with sizable health costs.

22
References
Abadie, A. forthcoming. Using synthetic controls: feasibility, data requirements, and methodological
aspects. Journal of Economic Literature. https://economics.mit.edu/files/17847
Abadie, A., Diamond, A., Hainmueller, J., 2010. Synthetic Control methods for comparative case
studies: estimating the effect of California’s tobacco control program. Journal of the American
Statistical Association 105, 493–505.
Abadie, A., Diamond, A., Hainmueller, J., 2012. Comparative politics and the synthetic control method.
American Journal of Political Science 59, 495–510.
Abadie, A., Gardeazabal, J., 2003. The economic costs of conflict: a case study of the Basque country.
American Economic Review 93, 112–132.
Acemoglu, D., Johnson, S., 2007. Disease and development: the effect of life expectancy on economic
growth. Journal of Political Economy 115, 925-985.
Aghion, P., Howitt, P., 1998. Endogenous growth theory. Cambridge. MA: MIT Press.
Alsan, M., Bloom, D., Canning, D., 2006. The effect of population health on foreign direct investment
inflows to low- and middle-income countries, World Development 34, 613-630.
Amirahmadi, H., 1990. Economic reconstruction of Iran: costing the war damage. Third World
Quarterly 12, 26-47.
Athey, S., Imbens. G. W. 2017. The state of applied econometrics: causality and policy evaluation.
Journal of Economic Perspectives 31, 3-32.
Azomahou, T.T., Boucekkine, R., Diene, B., 2009. A closer look at the relationship between life
expectancy and economic growth. International Journal of Economic Theory 5, 201-244.
Barro, R. J., 1996. Three models of health and economic growth. Cambridge, MA: Harvard University.
Barro, R. J., Sala-i-Martin, X., 1995. Economic growth. New York: Mc Graw-Hill.
Becker, G., 1964. Human capital. Chicago: University of Chicago Press.
Ben-Porath, Y., 1967. The production of human capital and the life cycle of earnings. Journal Political
Economy 75 (4), 352-365.
Bertrand, M., Duflo, E., Mullainathan, S., 2004. How much should we trust differences in-differences
estimates? Quarterly Journal of Economics 19, 249–75.
Bjorvatn, K., Farzanegan, M.R., 2013. Demographic transition in resource rich countries: a bonus or a
curse? World Development 45, 337–351.
Bloom, D., Canning, D., Graham, B., 2003. Longevity and life-cycle savings. The Scandinavian Journal
of Economics 105, 319-338.
Bloom, D., Canning, D., Sevilla, J, 2003. The demographic dividend: a new perspective on the economic
consequences of population change. RAND Corporation Monograph Reports No. MR-1274-
WFHF/DLPF/RF/UNPF.

23
Bloom, D., Canning, D., Sevilla, J., 2004. The effect of health on economic growth: a production
function approach. World Development 32, 1–13.
Cervellati, M., Sunde, U., 2011. Life expectancy and economic growth: the role of the demographic
transition. Journal of Economic Growth 16, 99–133.
Coile, C., Diamond, P., Gruber, J., Jousten, A., 2002. Delays in claiming social security benefits, Journal
of Public Economics 84, 357-385.
de la Croix, D., Licandro, O., 1999. Life expectancy and endogenous growth. Economics Letters 65 (2),
255-263.
Dye C., 2008. Health and urban living. Science 319, 766-769.
Faruqee, H., Mühleisen, M., 2003. Population aging in Japan: demographic shock and fiscal
sustainability. Japan and the World Economy 15, 185-210.
Farzanegan, M.R., 2020. The economic cost of the Islamic revolution and war for Iran: synthetic
counterfactual evidence. Defence and Peace Economics.
https://doi.org/10.1080/10242694.2020.1825314
Feenstra, R. C., Inklaar, R., Timmer, M.P., 2015. The next generation of the Penn world table. American
Economic Review 105, 3150-3182
Ferman, B., Pinto, C., Possebom, V., 2020. Cherry picking with synthetic controls. Journal of Policy
Analysis and Management 39, 510–532.
Firpo, S., Possebom, V., 2018. Synthetic control method: inference, sensitivity analysis and confidence
sets. Journal of Causal Inference 6, 1-26.
Fogel, R. W., 1994. Economic growth, population health and physiology: The bearing of Long term
processes on the making of economic policy. American Economic Review 84, 369-395.
Gradstein, M., Kaganovich, M., 2004. Aging population and education finance, Journal of Public
Economics 88, 2469-2485.
Grossman, M., Kaestner, R., 1997. Effects of education on health. In: Behrman J. & Stacey N. (Eds.),
The Social Benefits of Education. Ann Arbor: University of Michigan Press, pp. 69-124.
Gyimah-Brempong, K., Wilson, M. (2004). Health human capital and economic growth in sub-Saharan
Africa and OECD countries. The Quarterly Review of Economics and Finance 44, 296-320.
Hamidi, S., Alzouebi, K., Akinci, F., Zengul, F.D., 2018. Examining the association between
educational attainment and life expectancy in MENA region: A panel data analysis. The
International Journal of Health Planning and Management 33, e1124-e1136.
Hansen, C. W., 2012. The relation between wealth and health: Evidence from a world-panel of countries.
Economic Letters 115, 175-176.
Hanushek, E.A., 2013. Economic growth in developing countries: the role of human capital. Economics
of Education Review 37, 204–212.
Hanushek, E.A., Woessmann, L., 2008. The role of cognitive skills in economic development. Journal
of Economic Literature 46, 607–668.

24
Hanushek, E.A., Woessmann, L., 2015. The economic impact of educational quality. In: Dixon P.,
Humble S., Counihan C. (Eds.), Handbook of international development and education. Edward
Elgar Publishing, Cheltenham, pp 6–19.
Howitt, P., 2000. Endogenous growth and cross-country income differences. American Economic
Review 90, 829-846.
Howitt, P., 2005. Health, human capital, and economic growth: A Schumpeterian perspective. In:
Casasnovas, G.L., Rivera, B., Currais, L. (Eds.), Health and economic growth: Findings and
policy implications. MIT Press, Cambridge, MA, pp. 19-40.
Howitt, P., Mayer-Foulkes, D., 2005. R&D, implementation and stagnation: A Schumpeterian theory of
convergence clubs. Journal of Money, Credit and Banking 37, 147-177.
Hurd, M., McFadden D., Gan, L., 1998. Subjective survival curves and life-cycle behavior. In Wise, D.
A. (Ed.), Inquiries in the Economics of Aging, University of Chicago Press, 259-305.
Husain, Z., Dutta, M., Chowdhary, N., 2014. Is health wealth? Results of a panel data analysis. Social
Indicators Research 117, 121-143.
Jamison, D.T., Wang, J., Hill, K., Londono, J. L., 1996. Income, mortality and fertility in Latin America:
country-level performance, 1960–1990. Revista de Análisis Económico – Economic Analysis
Review 11, 219–261.
Kalemli-Ozcan, S., 2002. Does the mortality decline promote economic growth? Journal Economic
Growth 7 (4), 411-439.
Kalemli-Ozcan, S., Ryder, H. E. Weil, D., 2000. Mortality decline, human capital investment, and
economic growth, Journal of Development Economics 62, 1-23.
Kinugasa, T., Mason, A., 2007. Why countries become wealthy: the effects of adult longevity on saving.
World Development 35, 1-23.
Kurzman, C. 1995. Historiography of the Iranian revolutionary movement, 1977-79. Iranian Studies 28,
25-38.
Lee R. D., Mason, A., Miller, T., 2000. Life cycle saving and the demographic transition in East Asia.
Population and Development Review 26(Supplement), 194-222.
Lleras-Muney, A., 2005. The relationship between education and adult mortality in the United States.
The Review of Economic Studies 72, 189-221.
Mankiw, N. G., Romer, D., Weil, D. N., 1992. A contribution to the empirics of economic growth.
Quarterly Journal of Economics 107, 407-437.
Mason, A. 2007. Demographic dividends: the past, the present, and the future. In: Mason, A &
Yamaguchi, M. (Eds.). Population Change, Labor Markets, and Sustainable Growth towards a
New Economic Paradigm. Elsevier B.V., Amsterdam, 75-98.
Mayer, D., 2001. The long-term impact of health on economic growth in Latin America. World
Development 29, 1025-1033.
Mofid, K. 1990. The economic consequences of the Gulf war. New York: Routledge.

25
Oster, E., Shoulson, I., Dorsey, E.R., 2013. Limited life expectancy, human capital and health
investments. American Economic Review 103, 1977-2002.
Pritchett, L., Summers, L., 1996. Wealthier is healthier. Journal of Human Resources 31, 841-868.
Schultz, T. P., 1999. Health and schooling investments in Africa. Journal of Economic Perspectives 13,
67-88.
Seeberg, P., 2014. The Iranian revolution, 1977–79: interaction and transformation. British Journal of
Middle Eastern Studies 41, 483-497.
Soares, R. R., 2005. Mortality reductions, educational attainment, and fertility choice. American
Economic Review 95, 580-601.
Strauss, J., Thomas, D., 1998. Health, nutrition and economic development. Journal of Economic
Literature 36, 766-817.
Turan, B., 2020. Life expectancy and economic development: Evidence from microdata. Review of
Development Economics 24, 949-972.
Weil, D.N., 2007. Accounting for the effect of health on economic growth. The Quarterly Journal of
Economics 122, 1265-1306.
World Bank, 2020. World Development Indicators. Washington D.C.
Zhang, J., Zhang, J., 2005. The effect of life expectancy on fertility, saving, schooling and economic
growth: theory and evidence. Scandinavian Journal of Economics 107, 45-66.
Zhang, J., Zhang, J., Lee, R., 2001. Mortality decline and long-run economic growth, Journal of Public
Economics 80, 485-507.
Zunes, S. 2009. The Iranian revolution (1977-1979). Washington, D.C.: International Center on
Nonviolent Conflict (ICNC).
Top Related