


Languages
Pages
Legal

WTO Expert Symposium on EvaluationWTO Expert Symposium on Evaluation
Monitoring AfT flowsMonitoring AfT flows
OutlineOutline
• Why monitor aid for trade?• How to monitor aid for trade?• Aid for trade flows in 2006
– Global flows
– Sector distribution
– Regional distribution
– Main recipients
– Main donors
– Additionality
• Conclusions2
Why Monitor Aid for Trade? Why Monitor Aid for Trade?
3

How to Monitor?How to Monitor?
4 TPRM: more in-depth assessments
QuantitativeInformation
QualitativeInformation
WTO Global Review of Aid for Trade
In-countryself-assessments
Tracking Aidfor Trade flows
Donorself-assessments
PerformanceIndicators

5
DAC
Global Amounte.g. € 23 bn.
Economic Growth Social Development Other
Donor Amounte.g. € 2 bn.
Recipient Amount e.g. € 0.5 mn.
• Education• Health• Governance
Other Trade-Related Needs
Donors
CRS
Recipient
• Debt• Multi Sector• Emerging Aid• Administrative Costs
• Trade Policy & Regulations• Productive Capacity• Infrastructure• Trade Related
Structural Adjustment
WTO Annual Aid for Trade ReviewWTO Annual Aid for Trade Review
Tracking Global Flows Using theTracking Global Flows Using theCreditor Reporting System (CRS)Creditor Reporting System (CRS)
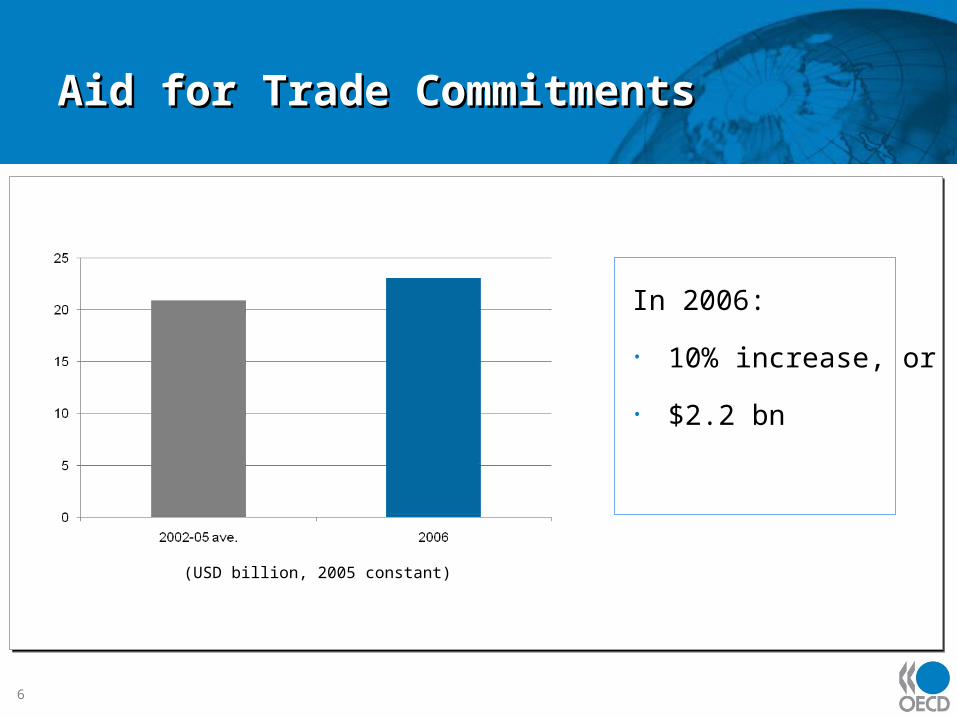
Aid for Trade CommitmentsAid for Trade Commitments
In 2006:
• 10% increase, or
• $2.2 bn
6
(USD billion, 2005 constant)

Sector DistributionSector Distribution
7
Infrastructure Productive Capacity Building Trade Policy & Regulations
52.4%
42.7%
3.1 %
53.4%
42.2%
4.4%
In 2006:
• Infra + $1 bn
• PCB + $0.8 bn
• TPR + $0.4 bn
(USD billion, 2005 constant)
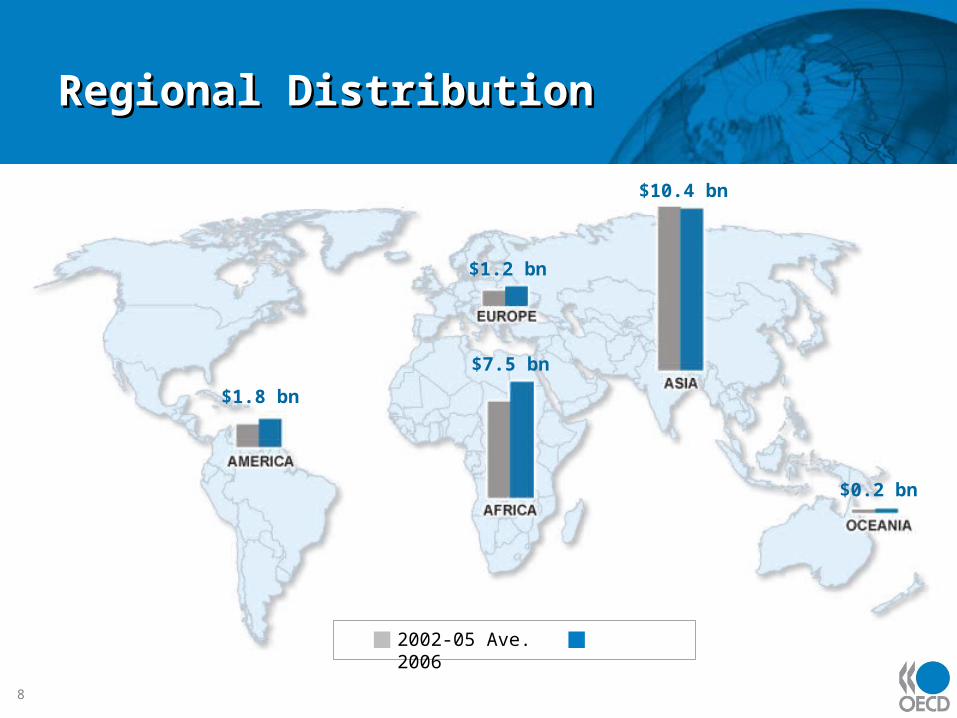
Regional DistributionRegional Distribution
8
2002-05 Ave. 2006
$1.8 bn
$1.2 bn
$10.4 bn
$7.5 bn
$0.2 bn

Regional and Sector DistributionRegional and Sector Distribution
9
Infrastructure Productive Capacity Building Trade Policy & Regulations
AFRICA AMERICA ASIA OCEANIA GLOBALEUROPE

Regional ProgrammesRegional Programmes
10
2002-2005 Average
GLOBAL (6.6%)
REGIONAL (10%)
COUNTRIES (84%)
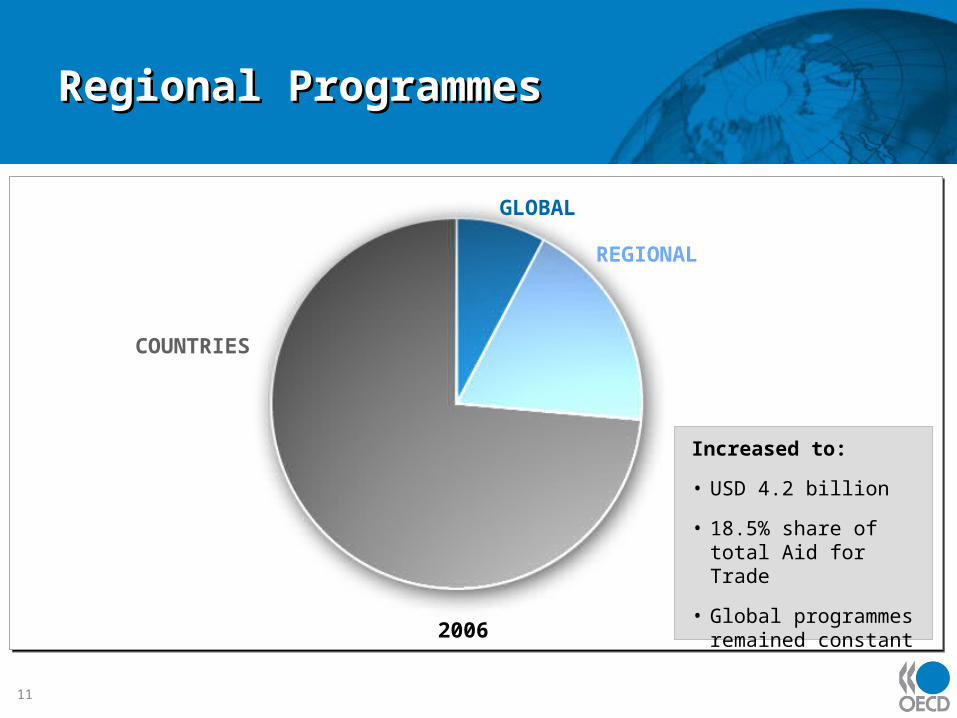
Regional ProgrammesRegional Programmes
11
2006
GLOBAL
REGIONAL
Increased to:
• USD 4.2 billion
• 18.5% share of total Aid for Trade
• Global programmes remained constant
COUNTRIES
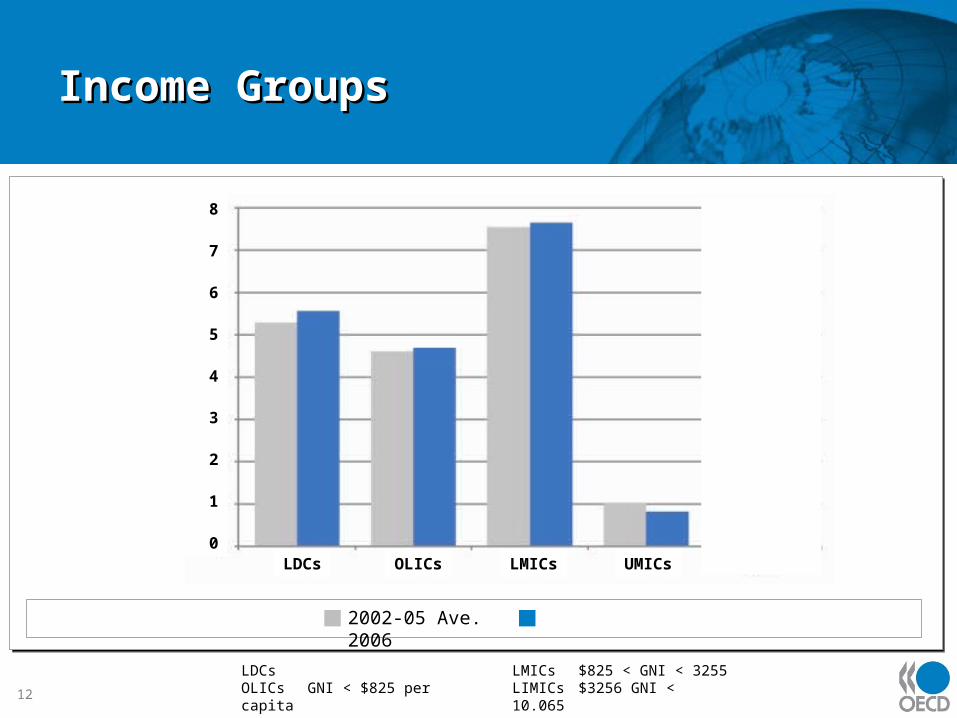
Income GroupsIncome Groups
12
2002-05 Ave. 2006
LDCsOLICs GNI < $825 per capita
LMICs $825 < GNI < 3255LIMICs $3256 GNI < 10.065
LDCs OLICs LMICs UMICs
8
7
6
5
4
3
2
1
0

Country Concentration: VolumeCountry Concentration: Volume
13
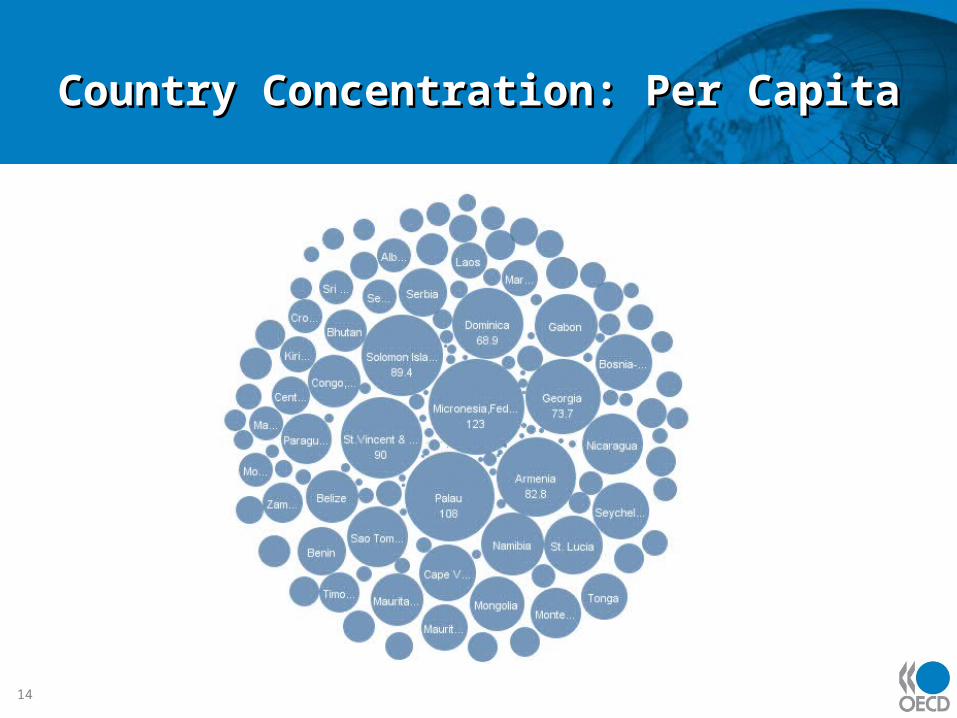
Country Concentration: Per CapitaCountry Concentration: Per Capita
14

DonorsDonors
15
2002-05 Ave. 2006
5.0
4.5
4.0
3.5
3.0
2.5
2.0
1.5
1.0
.5
0

Additionality?Additionality?
16

ConclusionsConclusions
• Increased 10%• Regional programmes doubled• Additionality: positive outlook
17
Aid for Trade in 2006Aid for Trade in 2006
Top Related