


Languages
Pages
Legal


HAL Id: hal-00516245https://hal.archives-ouvertes.fr/hal-00516245
Submitted on 9 Sep 2010
HAL is a multi-disciplinary open accessarchive for the deposit and dissemination of sci-entific research documents, whether they are pub-lished or not. The documents may come fromteaching and research institutions in France orabroad, or from public or private research centers.
L’archive ouverte pluridisciplinaire HAL, estdestinée au dépôt et à la diffusion de documentsscientifiques de niveau recherche, publiés ou non,émanant des établissements d’enseignement et derecherche français ou étrangers, des laboratoirespublics ou privés.
Would YOU want to talk to a scientist at a party? Highschool students’ attitudes to school science and to
scienceJudith Bennett, Sylvia Hogarth
To cite this version:Judith Bennett, Sylvia Hogarth. Would YOU want to talk to a scientist at a party? High schoolstudents’ attitudes to school science and to science. International Journal of Science Education,Taylor
Francis (Routledge), 2009, 31 (14), pp.1975-1998. �10.1080/09500690802425581�. �hal-00516245�

For Peer Review O
nly
Would YOU want to talk to a scientist at a party? High
school students’ attitudes to school science and to science
Journal: International Journal of Science Education
Manuscript ID: TSED-2008-0081.R2
Manuscript Type: Research Paper
Keywords: gender-related, high school, science education, secondary school,
survey
Keywords (user): attitudes to science
URL: http://mc.manuscriptcentral.com/tsed Email: [email protected]
International Journal of Science Education

For Peer Review O
nly
1
Would YOU want to talk to a scientist at a party? High school students’ attitudes to
school science and to science
Abstract
This paper describes a four-year project involving the development of a new instrument, the
Attitudes to School Science and Science instrument, and its use to collect baseline attitudinal
data from 280 students aged 11, 14 and 16. A key feature of the instrument is that it collects
data on both descriptive and explanatory data. Significant differences emerged in responses
by both age and gender, with positive attitudes declining with age (though with evidence of
some upturn in the later years of secondary schooling), and female students displaying less
positive attitudes and less clear-cut views on a variety of aspects of science. The early years
of secondary school emerged as critical, with attitudes to school science in particular
declining most sharply between the ages of 11 and 14 - an ‘age 14 dip’. A sense of science
being important in general terms, though not having much appeal for individual students, also
emerged clearly from the data. The paper suggests that attitudinal instruments have a role to
play in research, but that these need to be complemented by studies of detailed features of
schools that may influence attitudes, some of which may not be apparent form data collected
from students.
Why look at attitudes to science?
What views might a class of sixteen-year-olds have about science? Here is a selection of
comments from students involved in the study reported here:
“We use science for everything. We ARE science.”
“Science is important because modern society is built entirely around the scientific
advances of recent centuries.”
“Science causes problems in the first place, so how can it get rid of them?”
“Would YOU want to talk to a scientist at a party?”
Most people involved in science education would probably be very pleased if any sixteen-
year-old they knew made one of the first two comments. Sadly, it is the case that far too
many young people are likely to have more empathy with the last two comments. Such
Page 1 of 110
URL: http://mc.manuscriptcentral.com/tsed Email: [email protected]
International Journal of Science Education
123456789101112131415161718192021222324252627282930313233343536373839404142434445464748495051525354555657585960
For Peer Review O
nly
2
comments also serve only to reinforce the considerable disquiet felt in the science education
community and beyond over the numbers of students taking science subjects, particularly
chemistry and physics, in post-compulsory education in a number of countries. It would seem
that there is widespread disenchantment amongst young people, who are ‘voting with their
feet’ and turning away from science when they have a choice. In England and Wales, for
example, data from public examination entries show that the percentage of young people
choosing to study physical science subjects at Advanced level (the first point of choice at age
16+) fell by 2.1% in the period 2001-2005 for chemistry, and by 14 % for physics, continuing
a steady downward trend (Hyam, 2006). It is therefore not surprising that concerns about
participation in science feature prominently in current debates over policy and practice in
science teaching, such as in the recent research report for the Department for Education and
Skills (DfES, 2006) on The Supply and Demand for Science, Technology, Engineering and
Mathematics Skills in the UK Economy. The Government has also set ambitious target for
increased participation and performance in science subjects over the decade from 2004-2014
(H.M. Treasury, 2004). Factors affecting participation in science (and mathematics) are also
the focus of a major research initiative launched in the UK by the Economic and Social
Research Council in 2007.
Concern over levels of participation poses a number of questions. What is it about science
that seems to make it so unappealing to so many young people? How do students’ feelings
about school science compare with their feelings about science more generally? What action,
if any, could or should be taken to alter the situation? In looking for answers, students’
attitudes to science are seen as crucial.
The literature on attitudes to science
The literature on attitudes to science is extensive and includes a number of detailed review
articles (e.g. Gardiner, 1975; Ormerod and Duckworth, 1975; Schibeci, 1984; Munby, 1990;
Ramsden, 1998; Osborne et al., 2003). The ‘broad brushstroke’ findings are well known:
science is perceived as difficult and not relevant to the lives of most people, interest in science
declines over the years of secondary schooling, science is more attractive to male students
than female students, with problems being most acute in the physical sciences. Whilst work
on attitudes has remained a consistent feature of research in science education for more than
40 years, there has been a noticeable increase in studies more recently. In England and
Page 2 of 110
URL: http://mc.manuscriptcentral.com/tsed Email: [email protected]
International Journal of Science Education
123456789101112131415161718192021222324252627282930313233343536373839404142434445464748495051525354555657585960
For Peer Review O
nly
3
Wales, this is linked to the increasing body of evidence that the compulsory study of science
up to age 16, introduced for all 11-year-olds in the National Curriculum for Science in 1988,
has had little impact on numbers choosing to continue study beyond the compulsory period.
A notable feature of recent work, and an indicator of the widespread concern, is the range of
groups involved in sponsoring the work, including employers, Government bodies, learned
societies and Examination Boards.
Whilst to a large extent newer studies confirm earlier findings, some new slants have
emerged. The most noticeable of these is neatly encapsulated in the title given by Jenkins and
Nelson (Jenkins and Nelson, 2005): “Important but not for me.” Jenkins and Nelson were
reporting the UK data from a large and ongoing comparative international survey of students
aged 16, the Relevance of Science Education (ROSE) project, which began in 2001 and
involves over 30 countries (Schreiner and Sjøberg, 2004; Sjøberg and Schreiner, 2005). The
ROSE data indicate that a general appreciation of the value of science outside school is not
reflected in responses about enjoyment of science in school, or a desire to have jobs involving
science. This message is echoed in other studies. For example, Osborne and Collins, (2001)
showed sixteen-year-old students to believe science was an important subject in the school
curriculum, but more for career purposes for those interested in science than because of
intrinsic interest. In the Science in my future report (Haste, 2004), young people emerge with
a moderately positive image of science and technology, but are far less interested in jobs in
science or in science in the media.
There is also a growing body of evidence to indicate that attitudes to science decline most
sharply in the early years of secondary education. Galton et al. (2003) conducted a large-scale
survey of attitudes of over 1000 students in the UK, and established that attitudes to science
(compared with Maths and English) decline more appreciably across the first year of
secondary schooling (age 11), a trend that continues through the early years of secondary
education. Set against this is the importance students place on the quality of their science
teaching. Osborne and Collins (2001) found that students see science teachers as being
influential in determining their response to science, particularly in the early years of
secondary education, findings that also emerged very strongly the Planet Science survey
(Cerini, Murray and Reiss, 2004). The decline in positive attitudes to science across the early
years of secondary education is all the more serious as interests and views on future career
Page 3 of 110
URL: http://mc.manuscriptcentral.com/tsed Email: [email protected]
International Journal of Science Education
123456789101112131415161718192021222324252627282930313233343536373839404142434445464748495051525354555657585960
For Peer Review O
nly
4
directions, including science careers, begin to shape in the early years of secondary schooling
(Munro and Elsom, 2000).
The case for developing a new instrument
A number of concerns have been raised and criticisms levelled at work on attitudes in science
education, principally relating to the plethora of existing instruments, failure to draw on ideas
from psychological theory, and poor instrument design and analysis. These have been
extensively documented (e.g. Gardiner, 1975; Ormerod and Duckworth, 1975; Schibeci,
1984; Munby, 1990; Ramsden, 1998; Osborne et al. 1998; Simon, 2000; Osborne et al.,
2003). One message emerging from these reviews is that of caution over the need to develop
yet another instrument, given the number that already exists. A further issue to emerge
concerns the nature of the instruments used. A consistent feature of attitude research is the
use of fixed-response inventories and scaling techniques to gather data. Of these, Likert-type
scales predominate (for example, Haste, 2004; Kelly, 1986; Misiti, et al., 1991; Qualter, 1993;
Simpson and Oliver, 1990; Sjøberg and Schreiner, 2005), though others, such as Thurstone-
type rating scales (for example, Johnson, 1987; Smail and Kelly, 1984) and semantic
differential scales (for example, Crawley and Koballa, 1994) have also been used. Much
more limited use has been made of interviews (for example, Piburn and Baker, 1993) and,
more recently, focus groups (Osborne and Collins, 2001). One outcome of a heavy reliance
on fixed-response inventories is that much attitude data is characterised by an emphasis on
descriptions of ‘the problem’.
Despite the notes of caution sounded in the literature, the study reported here does involve the
development of a new instrument which, though taking the form of a ‘pencil-and-paper’
inventory, does allow attitudinal factors to be probed in a more open format. Whilst the
nature of the data generated by such an instrument does not lend itself to the rigours of
statistical methods for design and analysis often followed in the development of attitudinal
instruments, it offers the potential to go beyond largely descriptive data to probe for
explanations and insights that, in turn, might point to possible areas to target for action.
The aims of the study
The aims of the study were as follows:
Page 4 of 110
URL: http://mc.manuscriptcentral.com/tsed Email: [email protected]
International Journal of Science Education
123456789101112131415161718192021222324252627282930313233343536373839404142434445464748495051525354555657585960

For Peer Review O
nly
5
• to design an instrument to enable both descriptive (Level 1) and explanatory (Level 2)
data to be gathered on students’ affective responses, or attitudes, to science;
• to use the instrument to gather baseline data from school students aged 11, 14 and 16;
• to explore the data for trends in responses, particularly in relation to age, gender and
ability, with particular emphasis on explanatory (Level 2) responses.
The development of the research instrument
The design of the instrument adapted the approach developed in the Views on Science-
Technology-Society (VOSTS) study, undertaken in Canada in the late 1980s to document the
views of upper high school students (aged 16-17) on science-technology-society topics
(Aikenhead and Ryan, 1989; 2002). In essence, the VOSTS approach involved the empirical
development of a fixed response item pool based on views expressed by the students. This
was achieved through presenting students with a series of statements on aspects of science,
technology and society, and inviting free responses. Common themes within these responses
then formed the basis of categories for the fixed-response version of the instrument. The
VOSTS approach had two particular attractions. Firstly, the options in the fixed-response
instrument drew directly on the words of the students, and, secondly, through the use of a
pencil-and-paper instrument, it offered the potential to probe for explanatory data from a large
dataset.
The development of the research instrument is reported in detail in the full project report
Author 1 and Author 2, 2005). The process involved six steps, summarised in Table 1.
Table 1: Stages in the development and validation of the research instrument
Stage Procedure Data sources
1 Identification of areas to be explored Literature search plus interviews with 36
students aged 11, 14 and 16 (12 of each
age)
2 Composition and peer validation of
disposition statements
Initial development by team of three
researchers plus two teachers; validation
by approximately 25 science educators and
teachers
Page 5 of 110
URL: http://mc.manuscriptcentral.com/tsed Email: [email protected]
International Journal of Science Education
123456789101112131415161718192021222324252627282930313233343536373839404142434445464748495051525354555657585960
For Peer Review O
nly
6
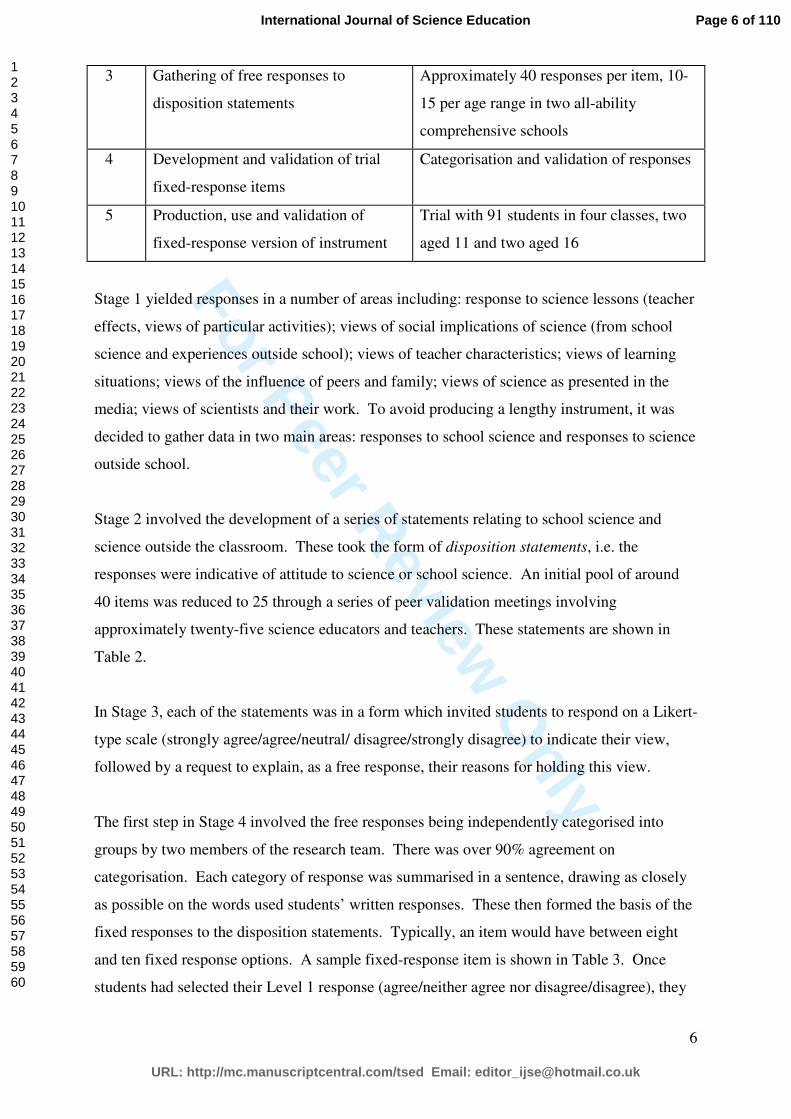
3 Gathering of free responses to
disposition statements
Approximately 40 responses per item, 10-
15 per age range in two all-ability
comprehensive schools
4 Development and validation of trial
fixed-response items
Categorisation and validation of responses
5 Production, use and validation of
fixed-response version of instrument
Trial with 91 students in four classes, two
aged 11 and two aged 16
Stage 1 yielded responses in a number of areas including: response to science lessons (teacher
effects, views of particular activities); views of social implications of science (from school
science and experiences outside school); views of teacher characteristics; views of learning
situations; views of the influence of peers and family; views of science as presented in the
media; views of scientists and their work. To avoid producing a lengthy instrument, it was
decided to gather data in two main areas: responses to school science and responses to science
outside school.
Stage 2 involved the development of a series of statements relating to school science and
science outside the classroom. These took the form of disposition statements, i.e. the
responses were indicative of attitude to science or school science. An initial pool of around
40 items was reduced to 25 through a series of peer validation meetings involving
approximately twenty-five science educators and teachers. These statements are shown in
Table 2.
In Stage 3, each of the statements was in a form which invited students to respond on a Likert-
type scale (strongly agree/agree/neutral/ disagree/strongly disagree) to indicate their view,
followed by a request to explain, as a free response, their reasons for holding this view.
The first step in Stage 4 involved the free responses being independently categorised into
groups by two members of the research team. There was over 90% agreement on
categorisation. Each category of response was summarised in a sentence, drawing as closely
as possible on the words used students’ written responses. These then formed the basis of the
fixed responses to the disposition statements. Typically, an item would have between eight
and ten fixed response options. A sample fixed-response item is shown in Table 3. Once
students had selected their Level 1 response (agree/neither agree nor disagree/disagree), they
Page 6 of 110
URL: http://mc.manuscriptcentral.com/tsed Email: [email protected]
International Journal of Science Education
123456789101112131415161718192021222324252627282930313233343536373839404142434445464748495051525354555657585960

For Peer Review O
nly
7
were invited to select as many of the Level 2 responses as they felt applied to them. The
instrument thus enables responses to be gathered at two levels: Level 1 responses indicate
agreement or otherwise with the disposition statement, and Level 2 responses probe for
explanations.
Validation of the trial fixed-response items took place approximately three months after the
collection of the free responses. The process involved asking the same classes of students
who had originally given free responses to complete eight fixed-response items, with items
being distributed to students in such a way that at least ten responses per item were collected.
The responses selected by the students on the fixed-response item were then compared with
the original free response. The very good agreement (85%) between free responses and the
fixed-response options is a measure of the reliability of the items. Short interviews with
students where differences had emerged established that these students had not originally held
any particularly strong view.
To maximise the validity of the range of Level 2 responses, each item offered the options of
not selecting any of the fixed responses offered, but giving “another reason – please say
what”. The intention was to look for any further patterns emerging in from these options and
add them to the options offered. In practice, though between three and five students per item
selected “another reason”, the reasons were very varied and no consistent patterns emerged. It
was decided to leave the “another reason ...” option in the final version of the instrument to
allow student to express different views if they so wished.
Stage 5 involved the trial of the instrument. Four classes in two schools participated in the
trial, such that data were gathered from 91 students in two classes aged 11 and two aged 16.
This enabled the instrument to be tested with students at the upper and lower ends of the target
age range.
Content validity was assessed by the following procedure. At the point where their students
completed the instrument, the class teacher was asked to indicate their view of each student’s
attitude to science on a five point scale, where a score of five represented a very positive
attitude, and a score of one represented a very negative attitude. A numerical total was then
calculated for each student based on their responses to the instrument. Any ‘agree’ options
selected were given a score of three, ‘neither agree nor disagree’ options were given a score of
Page 7 of 110
URL: http://mc.manuscriptcentral.com/tsed Email: [email protected]
International Journal of Science Education
123456789101112131415161718192021222324252627282930313233343536373839404142434445464748495051525354555657585960

For Peer Review O
nly
8
two, and ‘disagree’ options a score of one. Whilst there are drawbacks to assigning numerical
scores to Likert-type responses, it was felt that these were outweighed by the advantages of
having some indicator of the validity of the instrument in gauging attitudes to school science
and to science. Visual inspection of the scattergrams of the teacher scores for students’
attitude and the students’ score on the instrument showed a good line of fit, and there were no
instances where the instrument had indicated a negative attitude and the teacher had indicated
a positive attitude. In a limited number of instances (10%), the instrument indicated a positive
attitude whilst the teacher had indicated a negative attitude. Conversations with the teachers
showed that these cases tended to be students who were seen as not very hard-working by the
teachers, and that this influenced their view of the students’ attitude.
The full instrument may be accessed at www.york.ac.uk/depts/educ/ResearchPaperSeries/,
under Paper 8.
Table 2: The disposition statements
Dispositions towards school science
A01 Science lessons are among my favourite lessons.
A02 I try extra hard in science lessons.
A03 My science teachers make me more interested in science.
A04 The things we do in science lessons make me more interested in science.
A05 If I had a choice I would study biology.
A06 If I had a choice I would study chemistry.
A07 If I had a choice I would study physics.
A08 I enjoy reading science textbooks.
A09 What we do in science lessons is useful whatever you do after you leave school.
A10 Everybody should study all three science subjects (biology, chemistry and
physics) up to age 16.
A11 When they have a choice, young people should be given particular
encouragement to study science subjects.
Dispositions towards science outside school
B01 I like watching science programmes on the TV.
B02 I like reading about science in newspapers and magazines.
B03 News items about science interest me.
B04 I like reading science books other than school science textbooks.
B05 I would trust something a scientist said.
B06 I would like a job involving science.
B07 It would be good to have a job as a scientist.
B08 Science is blamed for things that are not its fault.
B09 Science has a positive influence on society.
Science can help solve problems (e.g. environmental and social problems).
B11 Science makes an important contribution to the wealth of the nation.
Page 8 of 110
URL: http://mc.manuscriptcentral.com/tsed Email: [email protected]
International Journal of Science Education
123456789101112131415161718192021222324252627282930313233343536373839404142434445464748495051525354555657585960

For Peer Review O
nly
9
B12 The Government should spend more money on scientific research.
B13 It is important for this country to have well-qualified scientists.
B14 It is important to promote this country as a scientific nation.
Page 9 of 110
URL: http://mc.manuscriptcentral.com/tsed Email: [email protected]
International Journal of Science Education
123456789101112131415161718192021222324252627282930313233343536373839404142434445464748495051525354555657585960

For Peer Review Only
10
Table 3: Example of final format for multi-choice items
B06 I would like a job involving science.
I agree because…
I neither agree nor disagree because…
I disagree because…
a …I enjoy science at school
k …it depends on what science you
would be doing
p …I find science boring
b …they are generally well paid
q …science causes too many problems for
the world
c …science makes the world a better
place to live in
r …they don’t get well paid
d …there are good jobs you can do with
science
x
… another reason – please say what
y … another reason – please say what z … another reason – please say what
Page 10 of 110
URL: http://mc.manuscriptcentral.com/tsed Email: [email protected]
International Journal of Science Education
123456789101112131415161718192021222324252627282930313233343536373839404142434445464748495051525354555657585960
For Peer Review O
nly
11
The main study: the sample and methods of analysis
The instrument was used to gather baseline data in a survey of 280 school students in
four 11-18 all-ability (mixed comprehensive) schools in late April 2004. Data were
collected from whole-class sets. All the students completing the attitudes inventory
were following conventional science courses, i.e. none were following courses linked to
any new intervention. The instrument was administered to three cohorts of students
aged 11, 14 and 16. These are the first, third and fifth (final) years of compulsory
secondary schooling in England and Wales, and the study of science is compulsory
throughout this age range.
Data on students’ ability levels were obtained based on actual or estimated results from
external tests and examinations, these being the only external measures of ability
common across all schools. Internal measures would be unreliable as they would be
developed within schools. These were Standard Assessment Tasks (SATs) at Key Stage
2 taken by students taken at age 11 or at Key Stage 3, taken by students at age 14, or
General Certificate of Secondary Education (GCSE) examinations, taken by students at
age 16. These measures were used to designate students as high, middle or low ability.
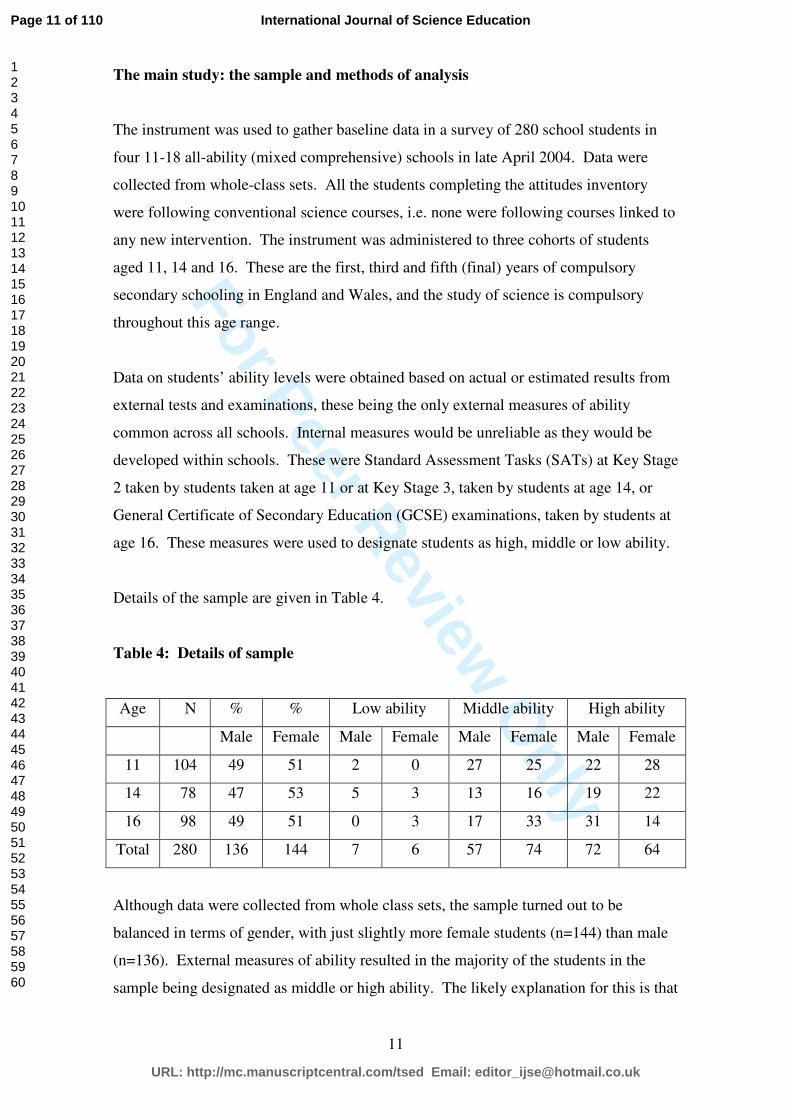
Details of the sample are given in Table 4.
Table 4: Details of sample
Age N % % Low ability Middle ability High ability
Male Female Male Female Male Female Male Female
11 104 49 51 2 0 27 25 22 28
14 78 47 53 5 3 13 16 19 22
16 98 49 51 0 3 17 33 31 14
Total 280 136 144 7 6 57 74 72 64
Although data were collected from whole class sets, the sample turned out to be
balanced in terms of gender, with just slightly more female students (n=144) than male
(n=136). External measures of ability resulted in the majority of the students in the
sample being designated as middle or high ability. The likely explanation for this is that
Page 11 of 110
URL: http://mc.manuscriptcentral.com/tsed Email: [email protected]
International Journal of Science Education
123456789101112131415161718192021222324252627282930313233343536373839404142434445464748495051525354555657585960
For Peer Review O
nly
12
the external measures used for ability are not very discriminating in that the majority of
student will be placed in one of three broad bands at age 11 and 14. Overall, however,
the sample was felt to be representative of the group from which it was drawn, as data
were collected from classes across the whole ability range.
Analysis of the non-parametric data was carried out using the SPSS 11 package, and
applying the Chi-squared test to look for significant differences in responses.
The data were interrogated by age, gender and ability. As there were few lower ability
students in the classes (5% of the total sample), the responses for the lower and middle
ability groups were combined. This decision was felt to be justified as visual inspection
of the responses for the small numbers of lower ability students did not indicate any
appreciable differences in individual responses or patterns of response. A number of
significant differences emerged for age and gender effects. However, no statistically
significant differences emerged in relation to ability. The detailed statistical analysis of
the data may be found in the full report of the study (see details at the end of the paper).
Results
The results are presented in five sections. The first two present an overview of
responses to school science and responses to science outside school, drawing on both
Level 1 and Level 2 responses. The nature of the instrument means that the database
developed for the Level 2 data is extensive, and it is beyond the scope of this paper to
present and discuss all the Level 2 findings in detail. Therefore the remaining three
sections focus on particularly notable features to emerge from the data: the ‘age 14 dip’,
patterns in relation to individual scientific disciplines, and a shift in opinion with
maturity.
Responses to school science
Figure 1 shows the percentage of students in each age group who selected ‘agree’
responses to items. Figure 2 show the percentages of male and female students who
selected ‘agree’ responses to the items about school science. (See Table 2 for details of
items.) There was a noticeable trend for positive attitudes to items relating to both
Page 12 of 110
URL: http://mc.manuscriptcentral.com/tsed Email: [email protected]
International Journal of Science Education
123456789101112131415161718192021222324252627282930313233343536373839404142434445464748495051525354555657585960

For Peer Review O
nly
13
school science to decrease overall from age 11 to age 16, and, within this for female
students to be generally less positive than male students.
Figure 1: Percentage of ‘agree’ responses to items A01-A11 (by age)
Figure 2: Percentage of ‘agree’ responses to items A01-A11 (by gender)
0
10
20
30
40
50
60
A01 A02 A03 A04 A05 A06 A07 A08 A09 A10 A11
Item
%
Male
Female
Five items were statistically significant in terms of decreasingly positive responses by
age. These items were A01, A03, A05, A06, A07. These items are about liking for
science (A01), teacher effects (A03) and responses to the individual disciplines within
science (A05-A07). Significant gender differences were established in responses to
0
10
20
30
40
50
60
70
A01 A02 A03 A04 A05 A06 A07 A08 A09 A10 A11 Item
%
Age 11
Age 14
Age 16
Page 13 of 110
URL: http://mc.manuscriptcentral.com/tsed Email: [email protected]
International Journal of Science Education
123456789101112131415161718192021222324252627282930313233343536373839404142434445464748495051525354555657585960
For Peer Review O
nly
14
biology (A05), chemistry (A06) and, in particular, physics (A07), with students in the
sample conforming to the well-established pattern of female students preferring biology,
and male students preferring the physics and, to a lesser extent, chemistry. These
patterns in response are discussed more fully in the section on ‘scientific disciplines’.
Of particular note is the fall in number of students reporting that science is one of their
favourite subjects (A01), with the proportion of students who responded positively to
this statement dropping sharply between age 11 (39%) and age 14 (26%) (χ2=10.131,
p<0.02). This change was associated with a doubling in the percentage of those who
disagreed from 10% to 21% (χ2=8.370, p<0.05). There was a small further increase to
25% in negative responses from students age 16. Within the groups saying that science
lessons are amongst their favourite lessons, a striking finding is the particularly positive
response to chemistry (85% at age 11, 75% at age 14 and 65% at age 16). Biology
becomes increasingly important in reporting liking of science (45% at age 11, 75% at
age 14 and 77% at age 16), (χ2=8.761, p<0.02) whilst physics held similar levels of
interest across the years with 48% at age 11, 45% age 14 and 46% at age 16. At age 11,
the students who disagreed with the statement all did so because they did not like any of
the three science areas. By age 14, the number of students disagreeing with the
statement had increased, with the physical sciences, and physics in particular, being
cited as ‘hard’ as well as being disliked, a pattern repeated at age 16. The responses to
individual subjects within science (A05-A07) are discussed in more detail later in the
paper.
Two items offer interesting insights into students’ responses to their experiences in
science lessons: A03: My science teachers make me more interested in science, and
A04: The things we do in science lessons make me more interested in science.
Responses to A04 were positive at age 11, with 60% of students agreeing with the
statement. This figure remained comparatively high through to age 16, where, at 44%,
it was the second most highly rated item in relation to school science. In both age
groups, the Level 2 explanation most frequently selected was practical work which also
showed a small significant rise from 87% at age 11 to 100% at 16 (χ2=6.973, p<0.05).
In contrast interest in investigations tailed off significantly from 55% at age 11, to 32%
at age 14 and 26% at age 16 (χ2=10.608, p<0.01). It was notable that positive responses
to group work on presentations and posters decreased significantly across the age range
(65% at age 11, 41% at age 14 and 30% at age 16; χ2=12.917, p<0.01). The Level 2
Page 14 of 110
URL: http://mc.manuscriptcentral.com/tsed Email: [email protected]
International Journal of Science Education
123456789101112131415161718192021222324252627282930313233343536373839404142434445464748495051525354555657585960

For Peer Review O
nly
15
explanations offered by students disagreeing with A04 were fairly equally divided
amongst the following: too much time spent on writing, dislike of maths and theory, not
seeing the point of what they were doing, and too little variety in lessons, with very
little change in the picture between age 11 and age 16. In contrast, A03 elicited a very
positive response at age 11, with 49% of students agreeing with the statement, but
responses dropped significantly by age 14 to 31% and remained at this level at age 16.
Level 2 responses demonstrated a range of ways in which teachers created interest in
science. For the two younger age groups, variety of activities was highly important
(78% at age 11 and 71% at age 14). The next most important aspect at age 11 was
being made to think (57%). (Level 2 data responses total more 100% because more
than one option could be selected if desired.) Explaining things clearly was important
for over half of all ages (58%) and was the most common response at age 14 (71%).
Significantly more female students (74%) than male students (41%) in each age group
cited this as important (χ2=11.660, p<0.001). Similarly female students (48%) were
more likely than male students (37%) to report their interest in science being influenced
by their teachers’ enthusiasm (χ2=3.869, p<0.05). Although there was a drop across the
years on the importance placed on relating science to the outside world, from 45% of 11
year olds to 25% of 14 year olds and 23% of 16 year olds, this was not statistically
significant. These responses point to teachers being particularly influential at age 11,
i.e. in the early stages of secondary science courses, and thus having the potential to
make a crucial difference at this point.
A08: I enjoy reading science textbooks elicited negative responses from the majority of
students in all age ranges, with Level 2 explanations revealing that they were seen as
boring by two thirds or more of the students in each age range and a waste of time over
one third of students. Between 27% and 42% of students said they learned more by
listening to their teacher.
Exceptions to the trend of decreasing overall positive attitudes to school science were
items A10: Everybody should study all three science subjects up to age 16, and A11:
When they have a choice, young people should be given particular encouragement to
study science subjects. Level 2 data showed that over one-third of students in all age
groups agreeing with A10 felt science was an important part of a good general
education. However significantly more of the students agreeing with this item at age 16
(45%) also said that they thought there was too much science on the timetable,
Page 15 of 110
URL: http://mc.manuscriptcentral.com/tsed Email: [email protected]
International Journal of Science Education
123456789101112131415161718192021222324252627282930313233343536373839404142434445464748495051525354555657585960

For Peer Review O
nly
16
compared with just 13% at age 11 (χ2=11.319, p<0.01). Level 2 data for A11 showed
high proportions of students who agreed with the statement supporting that view by
saying science affects so much in everyday life. However there was a significant drop
in the proportion at 16 (94% at 11, 100% at 14 and 63% at 16; χ2=15.065, p<0.001).
All ages felt science leads to good jobs (88% - 100%) and there was little difference in
this view between males (100%) and females (91%). Between a third and a half of
students cited the importance of training the scientists of the future. Around 20% in
each age group disagreed with the statement, saying people should be allowed to study
the subjects they are best at and not pushed into some subjects more than others. The
responses to A10 and A11 do suggest that, whatever, their views, students approaching
the end of their compulsory period of studying science at school place some value on
the experiences they have had, a finding supported to some extent by responses to item
A09: What we do in science lessons is useful whatever you do after you leave school.
At all ages, this item was one of the top three responses for items about school science,
with Level 2 data showing that two thirds or more of students felt it helped people
understand the worth they live in. There was a small significant difference (χ2=7.455,
p<0.05) with age that demonstrated a dip in this view at age 14 (84% at age 11, 67% at
age 14 and 91% at age 16). A high proportion (80%-86%) of this sub-set of students
also thought science affects much in everyday life. Around 15% in each age group
disagreed, with between three quarters of them (aged 11 and 14) and 100% (age 16)
saying you did not need science as you could get by with common sense. These
disagreeing students also showed a small significant difference (χ2=5.995, p<0.05) with
age in acknowledging that knowing something (e.g. the link between lung cancer and
smoking) may not change how people behave: 32% at age 11, 67% at age 14 and 69%
at 16.
Responses to science outside school
Figures 4 and 5 show responses to the items on science outside school by age and by
gender. (See Table 2 for details of items.)
Page 16 of 110
URL: http://mc.manuscriptcentral.com/tsed Email: [email protected]
International Journal of Science Education
123456789101112131415161718192021222324252627282930313233343536373839404142434445464748495051525354555657585960

For Peer Review O
nly
17
Figure 4: Percentage of ‘agree’ responses to items B01-B14 (by age)
The overall pattern shows that attitudes to science outside school are less positive at age
16 than age 11, with four items showed statistically significant decreases in positive
responses: B04: I like reading science books other than school textbooks, B06: I would
like a job involving science, B07: It would be good to have a job as a scientist, and B08:
Science is blamed for things that are not its fault. With the exception of B02: I like
reading about science in newspapers and magazines, male students were more positive
than female students in their responses to science outside school, with four items
showing significant differences: B08: science is blamed for things that are not its fault,
B10: science can help solve problems, B11: science makes an important contribution to
the wealth of the nation and B14: It is important to promote this country as a scientific
nation.
0
10
20
30
40
50
60
70
80
B01 B02 B03 B04 B05 B06 B07 B08 B09 B10 B11 B12 B13 B14 Item
%
Age 11
Age 14
Age 16
Page 17 of 110
URL: http://mc.manuscriptcentral.com/tsed Email: [email protected]
International Journal of Science Education
123456789101112131415161718192021222324252627282930313233343536373839404142434445464748495051525354555657585960

For Peer Review O
nly
18
Figure 5: Percentage of ‘agree’ responses to items B01-B14 (by gender)
Overall responses to science in the media (B01, B02, B03) were not very positive, i.e.
less than one third for all ages. Level 2 explanations for those students who were
positive about watching science programmes on TV show no significant difference with
age. Between 56% and 74% reported that the programmes made them more interested
in science; and similar proportions found that they helped school science understanding
(53% - 75%) and that they liked seeing how science is used in the real world (63% to
81%).
More than half of the students disagreeing with the statement declared they would never
watch a TV programme about science (55% at age 11, 75% at age 14 and 69% at age
16). This lack of interest was also reflected in responses to B02: I like reading about
science in newspapers and magazines, where the overwhelming majority of students -
over 68% in each age group - said that they never read anything to do with science in
newspapers and magazines. Whilst B03: News items about science interest me showed
that over three quarters (78% - 81%) of the agreeing students thought it was important
to learn about things that could affect them, around two thirds (65% -74%) of those who
disagreed in each age group reported never bothering with news items about science.
Within this overall pattern of response, female students were slightly more negatively
disposed than male students to science in the media.
0
10
20
30
40
50
60
70
B01 B02 B03 B04 B05 B06 B07 B08 B09 B10 B11 B12 B13 B14
Item
M ale
Female
Page 18 of 110
URL: http://mc.manuscriptcentral.com/tsed Email: [email protected]
International Journal of Science Education
123456789101112131415161718192021222324252627282930313233343536373839404142434445464748495051525354555657585960
For Peer Review O
nly
19
Item B02 (see above), together with B04: I like reading science books other than
science textbooks, focuses on reading. Both statements did not elicit particularly
positive responses at age 11, and became even less positive with age, B04 significantly
so (χ2=17.906, p<0.001). Around 15% of students aged 11 responded positively to
B02, and this figure halved by age 16. The responses to B04 demonstrate that few
students are interested in reading science books. What interest there was dropped off
sharply between age 11 (26%) and age 14 (9%), declining further by age 16 (6%),
where just short of half the students (49%) explicitly disagreeing with the statement.
Wildlife books were the most interesting for three-quarters (74%) of students at age 11
and just under half (48%) liked science fiction. Close to half of the students at age 11
also related their extra-curricular science reading to their science lessons, both in terms
of helping them understand the science they were studying (48%) and seeing the
relevance of what they did in science lessons (52%). By age 16, these responses had
virtually disappeared, with almost half the students report that they would never choose
to read science books because they are so boring.
Responses to item B05: I would trust something a scientist said, were fairly equally
divided between across age range and gender (around 30%). Level 2 responses showed
that around 78% of students across all age groups agreeing with the statement felt that
scientists were intelligent, and had expert knowledge (70%). 57% of students aged 11
felt scientists were respected members of the community, and it was part of their job to
care about things (77%). Although students’ respect for scientists dropped to around
38% at age 14 and 16, this was not significant. In contrast the perception of scientists as
‘caring about things’ did drop significantly to 44% at aged 16 (χ2=8.001, p<0.02). The
most frequently-selected responses for students disagreeing with the statement were that
scientists confused people with long words and scientists might get things wrong.
Items B06 and B07 focused on careers in science, with B06 asking about liking a job
involving science, and item B07 asking about being a scientist. Both showed significant
differences in results. For item B06, students aged 11 were equally divided amongst
agree/neutral/disagree. By age 14, there was a very low (15%) positive response and a
very high negative response (60%) (χ2=11.863, p<0.02). However this was reversed
to some extend by age 16, where close to one quarter (24%) of students were positive
about the idea and just less than half (47%) opposed. The most frequent reason given in
Page 19 of 110
URL: http://mc.manuscriptcentral.com/tsed Email: [email protected]
International Journal of Science Education
123456789101112131415161718192021222324252627282930313233343536373839404142434445464748495051525354555657585960

For Peer Review O
nly
20
the Level 2 data, irrespective of age, was that there are good jobs available in science
(70% at age 11, 83% at age 14 and 78% at age 16). The next most frequent response
related to enjoyment of science at school at age 11 (61%) and age 14 (58%), but this
was of less relevance at age 16 (39%) than the perception of jobs as well-paid (61%).
Finding science boring appears to be the most common reason at all ages for lack of
interest is taking up a science-based job (76% at age 11, 70% at age 14, 76% at age 16).
Antipathy to science as a source of problems for the world was a consideration for
around one-third of the respondents in each age group.
For item B07: It would be good to have a job as a scientist, there was a highly
significant (χ2=33.180, p<0.001) change of views between age 11 and age 14 with a
drop from 41% to 10% agreeing with the statement. This change of view was sustained
at age 16 (14%). At age 11, students gave a wide range of reasons: the nature of the
work, remuneration and the view that scientists can have a positive influence on the
world, suggesting that they have a generally positive overview of science as a job or
career. Relatively few students at age 14 or 16 agreed with the statements, though, of
those that did, by far the most common explanation (over two-thirds at each age) was
that they felt that scientists were people who could change the world for the better. The
Level 2 data for students disagreeing with B07 showed they had a wide range of
negative opinions of scientists, with the two most prominent views being that scientists
do boring jobs (61% at age 11, 85% at age 14, 63% at age 16) and are a bit weird (63%
at age 11, 53% at age 14 and 53% at age 16). Scientists were also seen as uncaring by
around two-fifths of students in each age group, with a similar proportion also seeing
scientists as causing problems in the world, and as risk takers.
There was a highly significant drop (χ2=14.345, p<0.01) between age 11 (43%) and age
14 (26%) in the proportion of students agreeing with B08: Science is blamed for things
that are not its fault, with little further change at age 16 (27%). The percentage
disagreeing also fell, but less markedly, between age 14 (27%) and age 16 (17%). Level
2 data indicated these changes were associated with a steady increase over the year
groups from one third (33%) at age 11 to well over one half (57%) by age 16 who
neither agreed nor disagreed. A high proportion of students of all years (93% at age 11,
91% at age 14, 73% at age 16) were of the opinion that information was often
misrepresented in the media and by implication that this tendency is a reason that
‘science is blamed for things that are not its fault’. The drop in this view at age 16 was
Page 20 of 110
URL: http://mc.manuscriptcentral.com/tsed Email: [email protected]
International Journal of Science Education
123456789101112131415161718192021222324252627282930313233343536373839404142434445464748495051525354555657585960

For Peer Review O
nly
21
significant (χ2=6.389, p<0.05). Half of the respondents in each age group perceived
that it is scientists who are often blamed for (negative) aspects of science that are
actually a consequence of the actions of others. There was a tendency that increased
with age for students to believe that science is bound to get blamed for some things as it
is so common in everyday life (42% at age 11, 55% at age 14, 65% at age 16), and the
opinion that only bad things about science get reported rose steadily with age (24% at
age 11, 36% at age 14, 46% at age 16). In contrast, close to three-fifths of all ages (56%
at age 11, 55% at age 14, 63% at age 16) who chose to disagree with the main
statements felt that this was because science helps to create problems, but only the good
things about science are reported. Three-quarters or more of students in each age group
were not interested in the way science is reported.
It is apparent from Figures 4 and 5 that more students respond more positively to items
towards the right hand side of the chart than the left. What characterises these latter
items is that there is a shift from the more personal (e.g. B06: I would like a job
involving science) to the less personal (e.g. B14: It is important to promote this country
as a scientific nation). However, five of the fourteen items relating to science outside
schools showed significant differences in favour of positive responses by male students:
B08: science is blamed for things that are not its fault, B10: Science can help solve
problems, B11: Science makes an important contribution to the wealth of the nation and
B14: It is important to promote this country as a scientific nation. Whilst the general
pattern of responses being more positive to less personalised items is repeated, it is clear
that, within this, female students are less positively disposed towards science outside
school than their male counterparts. In part this is because they are more cautious in
their judgements.
For item B10: Science can help solve problems, male students had a significantly more
optimistic view of the beneficial role of science (M=55%, F=44%; χ2=10.052, p<0.01).
Level 2 data showed a very high proportion (over 90%) of students agreeing with the
statement felt that scientists can help to solve problems by inventing things, with close
to three quarters supporting the view that science can give us the knowledge to sort out
problems. Regardless of gender, all students who disagreed with the statement
supported the view that science causes the problems in the first place and so is unlikely
to solve them.
Page 21 of 110
URL: http://mc.manuscriptcentral.com/tsed Email: [email protected]
International Journal of Science Education
123456789101112131415161718192021222324252627282930313233343536373839404142434445464748495051525354555657585960

For Peer Review O
nly
22
A significantly higher proportion of female students (54%) responded in a neutral or
cautious fashion to B11: Science makes an important contribution to the wealth of the
nation compared to male students (37%) who were much more likely to agree (M=46%,
F=32%) (χ2=7.675, p<0.05). Percentages disagreeing with the statement were similar
(M=17%, F=22%). Level 2 data revealed that 80% of students believed that science
helps to create jobs, with close to 40% of both sexes supporting the view that science
lead to inventions which people then buy. The importance of science to industry and
the economy was recognised by similar proportions of male and female students
(M=66% , F=70%). Of the students who disagreed with the statement a high proportion
of both sexes (F=90%, M=73%) felt that science costs money rather than generating
wealth. Appreciably more male students (73%) than female students (55%) thought that
science was not about money but about finding things out.
While two-thirds of students agreed with item B13: It is important for this country to
have well-qualified scientists, there was a significant difference in those who were
neutral or disagreed. The female students (31%) were more uncertain than the male
students (20%) balance by a higher proportion of male students who disagreed (13%)
than female students (6%). Level 2 data showed that a very high proportion of students
(95%) who agreed with the main statement did so because they thought science
important for certain areas such as medicine. Additionally 60% of students supported
the suggestion that scientists in this country can help other countries. Rather more male
students (60%) than of female students (46%) felt that scientists make the country a
better place in which to live.
Significantly more male students than female students (39% and 24% respectively,
χ2=6.672, p<0.05) agreed with B14: It is important to promote this country as a
scientific nation. This was balanced by a higher proportion of female students (31%)
than male students (25%) who disagreed or who neither agreed nor disagreed. Level 2
data showed that high proportions of both sexes (M=85%, F=82%) thought that
promoting the country as a scientific nation would be good for the economy and for
employment. Very similar proportions thought that the UK should not be left behind
other nations given that people in this country have good ideas. The sizable majority of
students disagreeing with the statement thought there were more important things to
promote about the UK (M=83%, F=100%).
Page 22 of 110
URL: http://mc.manuscriptcentral.com/tsed Email: [email protected]
International Journal of Science Education
123456789101112131415161718192021222324252627282930313233343536373839404142434445464748495051525354555657585960

For Peer Review O
nly
23
The ‘age 14 dip’
Within the overall pattern of declining positive attitudes, responses to several questions
showed the decrease is particularly sharp between age 11 and age 14 with, in some
cases, a slight improvement by age 16. This might be termed an ‘age 14 dip’ in
attitudes.
Of the nine items that showed a significant difference in responses with age (A01, A03,
A05, A06, A07, B04, B06, B07 and B08), six of these showed the biggest change in
attitude between ages 11 and 14, where attitudes appeared to dip sharply, sometimes
followed by a rise at ages 16. These items, with percentage responses, are summarised
in Table 5.
Table 5: Items showing the most significant decline between the ages of 11 and 14
Agree at
age 11
(%)
Agree at
age 14
(%)
Agree at
age 16
(%)
A01 Science lessons are among my favourite
lessons
39 26 27
A03 My science teachers make me more interested
in science
49 31 31
B04 I like reading science books other than school
science textbooks
26 10 6
B06 I would like a job involving science 32 15 24
B07 It would be good to have a job as a scientist 41 10 14
B08 Science is blamed for things that are not its
fault
43 26 27
This ‘age 14 dip’ is illustrated in Figure 6.
Figure 6: The distribution of ‘Agree’ percentages for those items related to
attitude to science as a whole that showed significant variations in
‘Agree’, ‘Neither agree nor disagree’ and ‘Disagree’
0%
20%
40%
60%
11 14 16
A01
A03
B04
B06
B07
B08
Page 23 of 110
URL: http://mc.manuscriptcentral.com/tsed Email: [email protected]
International Journal of Science Education
123456789101112131415161718192021222324252627282930313233343536373839404142434445464748495051525354555657585960

For Peer Review O
nly
24
This sharp decline in attitudes from age 11 to age 14 is in keeping with the findings of
the study be Galton et al. (2003).
The explanatory (Level 2) responses to some of the items offer interesting insights into
the ‘age 14 dip’. For example, over 40% of students at age 11 were attracted to careers
in science, giving a wide variety of reasons: the nature of the work, remuneration and
the view that scientists can have a positive influence on the world. This would suggest
that they have a generally positive overview of science as a job or career. By age 14,
the figure has fallen very significantly to 11% (χ2=20.541, p<0.001), with jobs
involving science being seen as unattractive because they are perceived as boring,
because science is perceived as causing too many problems in the world and scientist
having to make too many compromises. However, almost all the students aged 16 who
did want a job involving science gave as their reason the fact that scientists could
change the world for the better. There was a sense in the data that, as students matured,
some at least, came to feel that science offered a way of making a positive difference to
people’s lives.
Scientific disciplines
One particular aspect which generated polarised responses concerned attitudes to the
individual science subjects. These were probed in items A05 (biology), A06
(chemistry) and A07 (physics). There are clear differences in responses as shown in
Table 6.
Table 6: Differences in responses to the statements for individual science subjects
(by age)
Age A05: If I had a choice, I
would study biology
A06: If I had a choice, I
would study chemistry
A07: If I had a choice, I
would study physics
Agree
(%)
Neither
(%)
Disagree
(%)
Agree
(%)
Neither
(%)
Disagree
(%)
Agree
(%)
Neither
(%)
Disagree
(%)
11 26 38 36 42 31 27 23 35 43
14 43 20 37 26 16 58 28 18 54
16 34 12 54 25 16 59 20 12 68
Page 24 of 110
URL: http://mc.manuscriptcentral.com/tsed Email: [email protected]
International Journal of Science Education
123456789101112131415161718192021222324252627282930313233343536373839404142434445464748495051525354555657585960

For Peer Review O
nly
25
Interest in biology increases from age 11 to age 14 before decreasing slightly at age 16.
In contrast, interest in chemistry and physics declines from age 11 to age 14, a pattern
which continues through to age 16. Each of these subjects appears to have a slightly
different problem. Significantly more students are interested in chemistry (42%) than in
physics (23%) at age 11 (χ2=8.739, p<0.01). Indeed, chemistry attracts the highest
level of interest of all three sciences at this age. For physics, the problem is that interest
is low to begin with, and declines with age, whereas for chemistry interest is
comparatively high initially but characterised by a steep and significant decline between
age 11 and age 14 (χ2=7.713, p<0.01).
Level 2 data showed the most prominent reason for wishing to study biology at all ages
was that students found the subject interesting (74% at age 11, 70% at age 14 and 61%
at age 16). The most common reasons given for not wanting to study biology was it not
being necessary for the jobs students had in mind (68% at age 11; 71% at age 14 and
62% at age 16). In addition to interest in the subject, practical work emerged as
significant in students reporting whether or not they wanted to study chemistry (66% at
age 11, 80% at age 14 and 67% at age 16). The two most important reasons for not
wanting to study chemistry were it perceived lack of relevance of chemistry for the job
the student had in mind (79% at age 11, 62% at age 14 and 59% at age 16) and the
strategic aspect of obtaining better grades in other subjects (43% at age 11, 29% at age
14 and 48% at age 16). There was a marked reluctance to study physics, and this
increased steadily with age. While the proportion who wanted to study the subject did
not change greatly (23% at age 11, 28% at age 14 and 20% at age 16), the proportion
who disagreed increased significantly from 42% at age 11, 54% at age 14 to 67% at age
16 (χ2=7.370, p<0.05). Level 2 responses showed physics is increasingly seen as hard,
with significantly more older students feeling they could get better grades in another
subject (34% at age 11, 29% at age 14 and 53% at age 16) (χ2=7.146, p<0.05).
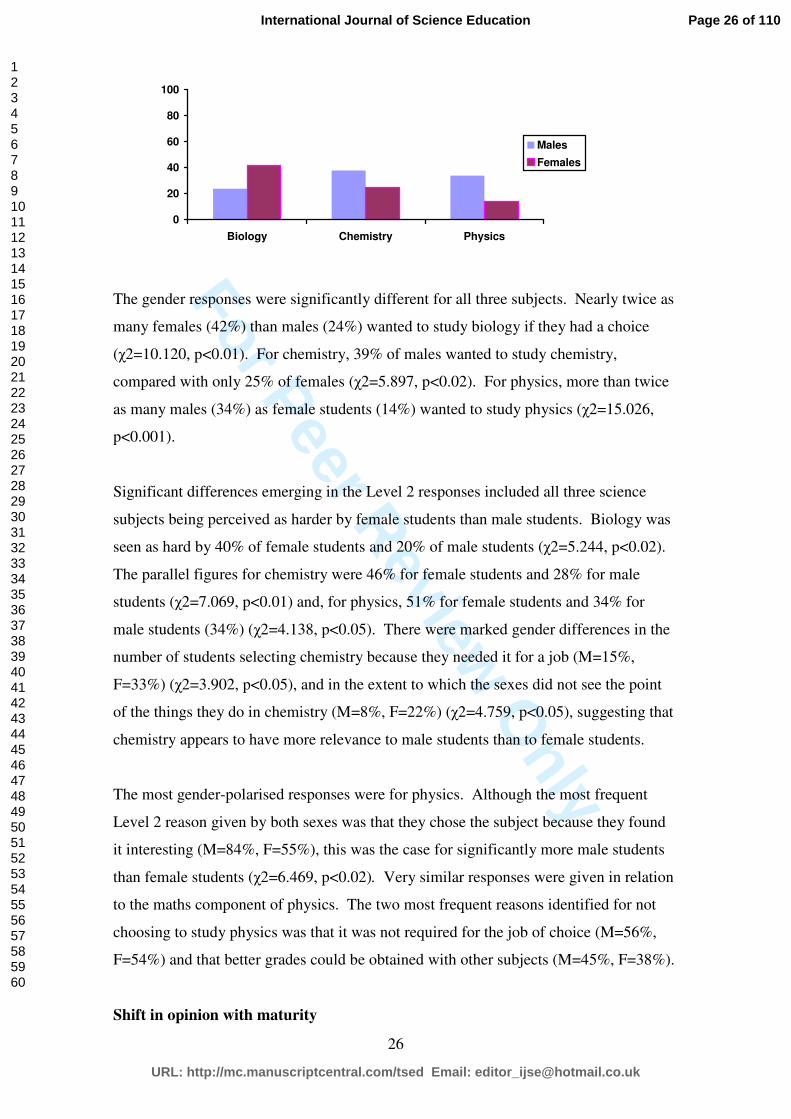
Within these overall patterns, clear gender differences emerged, as shown in Figure 7.
Figure 7: Percentages of male and female students agreeing with the items ‘If I had
a choice I would study …’
Page 25 of 110
URL: http://mc.manuscriptcentral.com/tsed Email: [email protected]
International Journal of Science Education
123456789101112131415161718192021222324252627282930313233343536373839404142434445464748495051525354555657585960
For Peer Review O
nly
26
0
20
40
60
80
100
Biology Chemistry Physics
Males
Females
The gender responses were significantly different for all three subjects. Nearly twice as
many females (42%) than males (24%) wanted to study biology if they had a choice
(χ2=10.120, p<0.01). For chemistry, 39% of males wanted to study chemistry,
compared with only 25% of females (χ2=5.897, p<0.02). For physics, more than twice
as many males (34%) as female students (14%) wanted to study physics (χ2=15.026,
p<0.001).
Significant differences emerging in the Level 2 responses included all three science
subjects being perceived as harder by female students than male students. Biology was
seen as hard by 40% of female students and 20% of male students (χ2=5.244, p<0.02).
The parallel figures for chemistry were 46% for female students and 28% for male
students (χ2=7.069, p<0.01) and, for physics, 51% for female students and 34% for
male students (34%) (χ2=4.138, p<0.05). There were marked gender differences in the
number of students selecting chemistry because they needed it for a job (M=15%,
F=33%) (χ2=3.902, p<0.05), and in the extent to which the sexes did not see the point
of the things they do in chemistry (M=8%, F=22%) (χ2=4.759, p<0.05), suggesting that
chemistry appears to have more relevance to male students than to female students.
The most gender-polarised responses were for physics. Although the most frequent
Level 2 reason given by both sexes was that they chose the subject because they found
it interesting (M=84%, F=55%), this was the case for significantly more male students
than female students (χ2=6.469, p<0.02). Very similar responses were given in relation
to the maths component of physics. The two most frequent reasons identified for not
choosing to study physics was that it was not required for the job of choice (M=56%,
F=54%) and that better grades could be obtained with other subjects (M=45%, F=38%).
Shift in opinion with maturity
Page 26 of 110
URL: http://mc.manuscriptcentral.com/tsed Email: [email protected]
International Journal of Science Education
123456789101112131415161718192021222324252627282930313233343536373839404142434445464748495051525354555657585960
For Peer Review O
nly
27
One feature of particular interest in the data is the shift from ‘agree’ or ‘disagree’ to
‘neither…’ responses as students get older. There are examples of items where there
was no significant difference with age in the number of agree responses, but a very
apparent difference in shift from ‘disagree’ to ‘neither …’ responses. For example, in
item B07, It would be good to have a job as a scientist, numbers disagreeing with this
statement stayed roughly constant at around the 40% level. However, the very
significant fall in numbers agreeing with the statement (from 41% at age 11 to 10% at
age 14 (χ2=20.541, p<0.001) was mirrored by a corresponding rise in number selecting
the ‘neither…’ option (22% to 45%; (χ2=10.384 p<0.01). A similar pattern in
responses may be seen for item B08, Science is blamed for things that are not its fault.
Within this overall shift in opinion with maturity, it is also apparent that a significantly
higher proportion of female students chose the ‘neither …’ option in all cases where
there was a significant gender difference in responses. One possible explanation for this
is that female students may be more cautious than male students in opting for a definite
‘agree’ or ‘disagree’ response which, in turn suggests that male students may have
firmer opinions or a more ‘black and white’ view of the world. A number of aspects of
the data would appear to support this hypothesis. For example, in item B13,
significantly more male students (13%) than female students (6%) disagreed with the
notion that it is important for the country to have well qualified scientists (χ2=3.857,
p<0.05). Furthermore, when looking at the reasons why the ‘neither …’ option is
selected, there is a consistent trend for more female students than male students being
prepared to admit they did not know enough to make an informed response.
Conclusions
Research into attitudes to science often results in feelings of comfort (though very often
cold comfort) from reaffirmation of the findings of other work, demonstrating that
concerns are common and widespread, coupled with frustration at the seemingly
intractable nature of the problem.
A number of the findings of this study, particularly the Level 1 responses, reaffirm the
well-documented findings of other studies: that attitudes to science become less positive
Page 27 of 110
URL: http://mc.manuscriptcentral.com/tsed Email: [email protected]
International Journal of Science Education
123456789101112131415161718192021222324252627282930313233343536373839404142434445464748495051525354555657585960
For Peer Review O
nly
28
over the period of secondary schooling, that interest in science as a school subject and
in jobs involving science is much lower at the end of compulsory secondary education,
that the physical sciences elicit more negative responses than biology, and that female
students are less positively disposed than male students towards science. The Level 1
responses also add to the growing evidence that attitudes to science outside school are
more positive than attitudes to school science.
The principal justification for developing the new instrument was to go beyond
descriptive data to probe for explanations and insights that, in turn, might point to
possible areas to target for action. What, therefore, has emerged from the explanatory
(Level 2) data, and what messages emerge for future research, and for policy and
practice?
The ‘age 14 dip’ suggests areas where more detailed research could prove fruitful.
Clearly the early years of secondary education are crucial, with students seeing their
teachers as very influential, particularly at age 11, citing ‘being made to think’ in
lessons, variety in activity and seeing how science relates to life as the reasons for this.
These responses point to teachers having the potential to make a crucial difference at
this point. Most curriculum materials now do contextualise science, but rather less is
known about the range of activities teachers use in science lessons and their effects.
The notion of what students see as activities that make them ‘think’ in science lessons
would certainly benefit from further exploration. Within this, it would be helpful to
explore these dimensions in relation to the different scientific disciplines, as each
appears to have a different problem. Interest in physics remains consistently low, while
interest in biology increases. The science reported as most interesting at age 11 -
chemistry - shows the sharpest decline.
Other insights to emerge from the explanatory data point to possible changes in the
school science curriculum. Young people, particularly female students, appear less
clear-cut in their views as they mature, and feel they need more information before they
can reach views in relation to, for example, wanting a job involving science. Thus one
area for action would appear to be to look carefully at how information about jobs
involving science might feature in curriculum materials, both in relation to the jobs
themselves and in the context of the view of scientists as ‘uncaring’.
Page 28 of 110
URL: http://mc.manuscriptcentral.com/tsed Email: [email protected]
International Journal of Science Education
123456789101112131415161718192021222324252627282930313233343536373839404142434445464748495051525354555657585960

For Peer Review O
nly
29
Some tensions do emerge from the data: young people see science leading to good jobs,
and a need to training the scientists of the future, yet most do not aspire to jobs
involving science. This reflects the “important but not for me” message from the study
by Jenkins and Nelson (2006). The largely negative image of scientists appears to be a
factor that comes strongly into play here, particularly as the Level 2 data showed that
the majority of those students at age 16 who said they wanted a job as a scientist felt
that scientists could change the world for the better.
One challenging area for policy to emerge from the data is the perception that science
subjects are hard, and there are greater rewards in terms of examination grades for effort
put into other subjects. There appear to be messages here for the subject content of
science curricula, and, possibly, ways in which national tests and examinations are
graded.
Looking more widely at the nature of research on attitudes to science, we believe the
instrument developed for this study has a number of strengths: considerable care has
been taken in its design and validation, its language draws on ‘the student voice’, and it
probes for explanatory insights as well as establishing general patterns.
We also believe that the study points to the future direction of attitude research. Well-
designed instruments certainly have a role to play in surveying attitudes, but their
principal strength lies in providing the ‘board brush stokes’ of the picture, rather than
providing much of the detail that might point to action. There is evidence that some
schools that are much more effective than others at encouraging uptake of particular
subjects. For example, Fitzgibbon (1999) established significant inter-school variations
in numbers of students electing to study mathematics beyond the compulsory period,
and her finding suggested that there might be similarities with the sciences in factors
underlying student choice. A recent report of three small-scale case studies by
Ponchaud (2006) suggests that school-based factors, such as enthusiastic teaching by
specialist teachers, and provision of good information about the value and flexibility of
science qualifications, can exert significant effects on uptake of science. Moreover,
some of the factors that may promote more positive attitudes to science may not be
apparent to students and therefore not easily accessible through attitudinal instruments.
Thus, we contend, the priority for research on attitudes to science is to explore in more
Page 29 of 110
URL: http://mc.manuscriptcentral.com/tsed Email: [email protected]
International Journal of Science Education
123456789101112131415161718192021222324252627282930313233343536373839404142434445464748495051525354555657585960
For Peer Review O
nly
30
detail features of schools that are more - and less - successful at encouraging uptake of
science beyond the compulsory period.
References
Aikenhead, G. & Ryan, A. (1989) The development of a multiple choice instrument for
monitoring views on Science-Technology-Society topics. Final report of SSHRCC
Grant. Saskatoon: University of Saskatchewan, Department of Curriculum Studies.
Aikenhead, G. & Ryan, A. (1992) The development of a new instrument: Views on
Science-Technology-Society. (VOSTS) Science Education, 76 (4), 477-491.
Author 1 (2001) Science with attitude: the perennial problem of pupils’ responses to
science. School Science Review, 82 (300), 59-70.
Author 1 & Author 2. (2005) “Would YOU want to talk to a scientist at a party?”:
Students’ attitudes to school science and science. University of York, Department
of Educational Studies: Research Paper Series No 8.
(www.york.ac.uk/depts/educ/ResearchPaperSeries). York: University of York.
(Project report from study sponsored by the Salters’ Institute of Chemical
education.)
Cerini, B., Murray, I & Reiss, M. (2004) Student review of the science curriculum.
London: Planet Science
Crawley, F.E. & Koballa, T.R. (1994). Attitude research in science education:
contemporary models and methods. Science Education. 78 (1), 35-56.
DfES. (2006) The Supply and Demand for Science, Technology, Engineering and
Mathematics Skills in the UK Economy. Retrieved December 2006 from
http://www.dfes.gov.uk/research/data/uploadfiles/RR775.pdf
Fitzgibbon, C. T. (1999) Long-term consequences of curriculum choices with
particular reference to Mathematics and science. School Effectiveness and School
Improvement, 10 (2), 217-232.
Galton, M., Gray. J. & Ruddock, J. (2003). Transfer and transitions in the middle years
of schools (7-14): continuities and discontinuities in learning. Department for
Education and Skills (DfES) research report No. 443. London: HMSO.
Gardner, P. (1975) Attitudes to science: a review. Studies in Science Education, 2, 1-
41.
H. M. Treasury (2004) Science and Innovation Investment Framework 2004-2014.
Accessed December 2006 at http://www.hm-treasury.gov.uk/documents/
enterprise_and_productivity/enterprise_and_innovation/science_innov/ent_sciinnov
_index.cfm
Haste, H. (2004) Science in my future: a study of values and beliefs in relation to
science and technology amongst 11-21-year-olds. Nestlé Social Research
programme Report No. 1. London: Nestlé Social Research Programme.
Hyam, H. (2006) Increasing uptake of science post-16: report of a Royal Society
conference. London: The Royal Society.
Jenkins, E. & Nelson, N. (2005) Important but not for me: students’ attitudes towards
secondary school science in England. Research in Science and Technological
Education, 23 (1), 41-57.
Johnson, S. (1987) Gender differences in science: parallels in interest, experience and
performance. International Journal of Science Education. 9 (4), 467-481.
Kelly, A. (1986) The development of children’s attitudes to science. European Journal
of Science Education, 8 (4), 399-412.
Page 30 of 110
URL: http://mc.manuscriptcentral.com/tsed Email: [email protected]
International Journal of Science Education
123456789101112131415161718192021222324252627282930313233343536373839404142434445464748495051525354555657585960
For Peer Review O
nly
31
Misiti, F., Shrigley, R. & Hanson, L. (1991) Science attitude scales for middle school
students. Science Education. 75 (5), 525-540.
Munby, H. (1990) Attitude: invited commentary. Science Education, 74 (3), 377-381.
Munro, M. & Elsom, D. (2000) Choosing Science at 16: The influence of science
teachers and careers advisers on students’ decisions about science subjects and
science and technology careers. Cambridge: CRAC.
OCR Examination Board (2005) Science Student Survey Results www.ocr.org.uk
(accessed 23 April 2006).
Ormerod, M. & Duckworth, D. (1975) Pupils’ attitudes to science: a review of
research. London: NFER.
Osborne, J. & Collins, S. (2001) Pupils’ views of the role and value of the science
curriculum. International Journal of Science Education, 23 (5), 441-467.
Osborne, J., Driver, R. & Simon, S. (1998) Attitudes to science: issues and concerns.
School Science Review, 79 (228), 27-33.
Osborne, J., Simon, S. & Collins, S. (2003) Attitudes towards science: a review of the
literature and its implications. International Journal of Science Education, 25 (9),
1049-1079.
Piburn, M. & Baker, D. (1993) If I were the teacher: qualitative study of attitude
towards science. Science Education. 77 (4), 393-406.
Ponchaud, B. (2006) Showcasing success in science education. Education in Science,
218, 8-9.
Qualter, A. (1993) I would like to know more about that: a study of the interest shown
by girls and boys in scientific topics. International Journal of Science Education. 15
(3), 307-317.
Ramsden, J. (1998) Mission impossible: can anything be done about attitudes to
science? International Journal of Science Education, 20 (2), 125 - 137.
Schibeci, R. (1984) Attitudes to science: an update. Studies in Science Education, 11,
26-59.
Schreiner, C. & Sjøberg, S. (2004) Sowing the seeds of ROSE. Background, rationale,
questionnaire development and data collection for ROSE (The Relevance of Science
Education) - a comparative study of students' views of science and science
education. Oslo: Dept. of Teacher Education and School Development, University
of Oslo.
Simon, S. (2000) Students’ attitudes towards science. In M. Monk & J. Osborne (eds)
Good practice in science teaching: what research has to say. Buckingham: Open
University Press.
Simpson, R. & Oliver, J. (1990). A summary of major influences on attitude towards
achievement in science amongst adolescent students. Science Education. 74 (1), 1-
18.
Sjøberg, S. & Schreiner, C. (2005) Update on the ROSE project: students perceptions
of science and technology. IOSTE newsletter, 8 (1), 7-10.
Smail, B. & Kelly, A. (1984) Sex differences in science and technology among 11-
year-old schoolchildren: II-affective. Research in Science and Technological
Education. 2 (2), 87-106.
Storage of the original data
All the original data are stored at [to be added].
The full report
The full report may be accessed at: [to be added].
Page 31 of 110
URL: http://mc.manuscriptcentral.com/tsed Email: [email protected]
International Journal of Science Education
123456789101112131415161718192021222324252627282930313233343536373839404142434445464748495051525354555657585960

For Peer Review O
nly
32
Acknowledgements
[To be added.]
Page 32 of 110
URL: http://mc.manuscriptcentral.com/tsed Email: [email protected]
International Journal of Science Education
123456789101112131415161718192021222324252627282930313233343536373839404142434445464748495051525354555657585960

For Peer Review O
nly
1
Would YOU want to talk to a scientist at a party? High school students’ attitudes to
school science and to science
Abstract
This paper describes a four-year project involving the development of a new instrument, the
Attitudes to School Science and Science instrument, and its use to collect baseline attitudinal
data from 280 students aged 11, 14 and 16. A key feature of the instrument is that it collects
both descriptive and explanatory data in a pencil-and-paper format. The data gathered is
probed in detail for explanatory insights into features that have emerged from more recent
research on attitudes to science, in particular the suggestions that students view science
outside school more positively than their experiences in science lessons, and that the early
years of secondary education (ages approximately 11 to 14) are the most crucial in shaping
attitudes. The study shows that positive attitudes to school science decline significantly
between the ages of 11 and 14, with little appreciable downward change beyond this and, in
some cases, a slight upturn. Female students display less positive attitudes and less clear-cut
views on a variety of aspects of science. A sense of science being important in general terms,
though not having much appeal for individual students, also emerged clearly from the data.
The paper suggests that attitudinal instruments have a role to play in research, but that these
need to be complemented by studies of detailed features of schools that may influence
attitudes, some of which may not be apparent from data collected from students.
Introduction
What views might a class of sixteen-year-olds have about science? Here is a selection of
comments from students involved in the study reported here:
Page 33 of 110
URL: http://mc.manuscriptcentral.com/tsed Email: [email protected]
International Journal of Science Education
123456789101112131415161718192021222324252627282930313233343536373839404142434445464748495051525354555657585960

For Peer Review O
nly
2
“We use science for everything. We ARE science.”
“Science is important because modern society is built entirely around the scientific
advances of recent centuries.”
“Science causes problems in the first place, so how can it get rid of them?”
“Would YOU want to talk to a scientist at a party?”
Most people involved in science education would probably be very pleased if any sixteen-
year-old they knew made one of the first two comments. Sadly, it is the case that far too
many young people are likely to have more empathy with the last two comments. Such
comments also serve only to reinforce the considerable disquiet felt in the science education
community and beyond over the numbers of students taking science subjects, particularly
chemistry and physics, in post-compulsory education in a number of countries. It would seem
that there is widespread disenchantment amongst young people, who are ‘voting with their
feet’ and turning away from science when they have a choice. In England and Wales, for
example, where the study reported here was undertaken, data from public examination entries
show that the percentage of young people choosing to study physical science subjects at
Advanced level (the first point of choice at age 16+) fell by 2.1% in the period 2001-2005 for
chemistry, and by 14% for physics (Hyam, 2006), continuing a steady downward trend that
has yet to be reversed. Such patterns are not unique to the UK, and it is therefore unsurprising
that concerns about participation in science feature prominently in current debates over policy
and practice in science teaching in a number of countries, as reflected in publications such as
Europe needs more scientists (European Commission, 2004), Evolution of student interest in
science and technology (Organisation for Economic Co-operation and Development [OECD],
2006), and The supply and demand for science, technology, engineering and mathematics
skills in the UK economy (Department for Education and Skills, 2006). The recent focus on
Page 34 of 110
URL: http://mc.manuscriptcentral.com/tsed Email: [email protected]
International Journal of Science Education
123456789101112131415161718192021222324252627282930313233343536373839404142434445464748495051525354555657585960

For Peer Review O
nly
3
numbers choosing science in the post-compulsory period of study reflects a longstanding
concern about levels of participation. Underpinning this is the notion that attitudes to science
are crucial, as they are a major determinant of subject choice.
Research on attitudes to science
The research on attitudes to science is extensive, and the ‘broad brushstroke’ findings are
well-known: science is perceived as difficult and not relevant to the lives of most people,
interest in science declines over the years of secondary schooling, science is more attractive to
male students than female students, and problems being most acute in the physical sciences.
These findings have emerged as relatively constant features in a number of countries over the
past four decades, and are well-documented in a literature that including several detailed
review articles (e.g. Gardiner, 1975; Ormerod and Duckworth, 1975; Schibeci, 1984; Munby,
1990; Ramsden, 1998; Osborne et al., 2003).
Whilst to a large extent more recent studies confirm earlier findings, some new slants have
emerged that appear worthy of further probing. The most noticeable of these is neatly
encapsulated in the title given by Jenkins and Nelson (Jenkins and Nelson, 2005): “Important
but not for me.” Jenkins and Nelson were reporting the UK data from a large and ongoing
comparative international survey of students aged 16, the Relevance of Science Education
(ROSE) project, which began in 2001 and involves over 30 countries (Schreiner and Sjøberg,
2004; Sjøberg and Schreiner, 2005). The ROSE data indicate that a general appreciation of
the value of science outside school is not reflected in responses about enjoyment of science in
school, or a desire to have jobs involving science. This message is echoed in other studies.
Osborne and Collins (2001) showed sixteen-year-old students to believe science was an
important subject in the school curriculum, but more for career purposes for those interested
Page 35 of 110
URL: http://mc.manuscriptcentral.com/tsed Email: [email protected]
International Journal of Science Education
123456789101112131415161718192021222324252627282930313233343536373839404142434445464748495051525354555657585960
For Peer Review O
nly
4
in science than because of intrinsic interest. In a similar vein, Haste (2004) found young
people emerged from compulsory schools with a moderately positive image of science and
technology outside school, but with far less interest in jobs in science.
Newer studies are also contributing to a growing body of evidence that points to attitudes to
science declining most sharply in the early years of secondary education (Galton et al., 2003),
a decline that is more appreciable in for science other school subjects. This period has also
emerged as crucial in relation to the impact of science teachers on students’ views of science
and careers involving science (Osborne and Collins, 2001; Cerini, Murray and Reiss, 2004;
Munro and Elsom, 2000).
The literature on attitudes to science has also signalled a number of methodological concerns
about work in the area. Principally, these relate to poor instrument design and analysis,
including failure to address matters of reliability and validity, the plethora of existing
instruments, many of which are limited in use to a single study, and failure to draw on ideas
from psychological theory (e.g. Gardiner, 1975; Ormerod and Duckworth, 1975; Schibeci,
1984; Munby, 1990; Ramsden, 1998; Osborne et al. 1998; Simon, 2000; Osborne et al., 2003;
Blalock et al., 2008). One message emerging from these reviews is that of caution over the
need to develop yet another instrument, given the number that already exists. A further issue
to emerge concerns the nature of the way in which data are gathered. A consistent feature of
attitude research is the use of fixed-response inventories and scaling techniques to gather data.
Of these, Likert-type scales predominate (for example, Haste, 2004; Kelly, 1986; Misiti, et
al., 1991; Qualter, 1993; Simpson and Oliver, 1990; Sjøberg and Schreiner, 2005), though
others, such as Thurstone-type rating scales (for example, Johnson, 1987; Smail and Kelly,
1984) and semantic differential scales (for example, Crawley and Koballa, 1994) have also
been used. Much more limited use has been made of interviews (for example, Piburn and
Page 36 of 110
URL: http://mc.manuscriptcentral.com/tsed Email: [email protected]
International Journal of Science Education
123456789101112131415161718192021222324252627282930313233343536373839404142434445464748495051525354555657585960

For Peer Review O
nly
5
Baker, 1993) and, more recently, focus groups (Osborne and Collins, 2001). One outcome of
a heavy reliance on fixed-response inventories is that much attitude data is characterised by an
emphasis on descriptions of ‘the problem’, with rather less attention paid to possible
explanations.
The purpose of this study
The study reported here involves the development and use of a new instrument to gather data
on attitudes to science, characterised by two particular features in relation to the instrument
design. Firstly, it sought to develop a ‘pencil-and-paper’ instrument that moved beyond the
largely descriptive data generated by most other survey instruments to probe for explanations
of particular responses. Secondly, steps were incorporated into the development of the
instrument to address a number of common problems the literature has identified in attitudinal
instruments. The nature of the data generated by the instrument does not lend itself to the
rigours of statistical methods often followed in the design and development of attitudinal
instruments. However, probing for explanations offers the potential to yield deeper insights
into areas to target for possible action.
The aims of the study were as follows:
• to design an instrument to enable both descriptive (Level 1) and explanatory (Level 2)
data to be gathered on students’ affective responses, or attitudes, to science;
• to use the instrument to gather baseline data from school students aged 11, 14 and 16.
Within the context of these overall aims, the study also sought to explore in more depth some
of the new slants emerging from more recent work on attitudes by looking, firstly, at possible
differences between responses to science in school and science outside school, and, secondly,
Page 37 of 110
URL: http://mc.manuscriptcentral.com/tsed Email: [email protected]
International Journal of Science Education
123456789101112131415161718192021222324252627282930313233343536373839404142434445464748495051525354555657585960

For Peer Review O
nly
6
at changes in attitudes in the early years of secondary schooling. The study did not set out to
look specifically at differences between the responses of male and female students, but the
number of significant gender differences that emerged in the analysis suggested it would be
important to include these in a report of the findings. Equally, though the study did not set
out to look specifically at differences in responses in groups of differing ability, data on
ability were collected. This was because a particular concern about levels of participation is
the number of able and well-qualified students electing not to study science in the post-
compulsory period, and it seemed useful to look for any particular patterns in attitude and
ability. However, as none emerged, these data are not reported here, other than in
characterising the sample.
The development of the research instrument
The design of the instrument adapted the approach developed in the Views on Science-
Technology-Society (VOSTS) study, undertaken in Canada in the late 1980s to document the
views of upper high school students (aged 16-17) on science-technology-society topics
(Aikenhead and Ryan, 1989; 2002). Underpinning the VOSTS approach was the belief that
attitudinal survey instruments most usually reflect the perceptions of the developers, rather
than the respondents, on the likely influences. Thus an instrument that draws n students’
views in its development is likely to generate more valid data. In essence, the VOSTS
approach involved the empirical development of a fixed response item pool based on views
expressed by the students. This was achieved through presenting students with a series of
statements on aspects of science, technology and society, and inviting free responses.
Common themes within these responses then formed the basis of categories for the fixed-
response version of the instrument. The VOSTS approach had two particular attractions.
Firstly, the options in the fixed-response instrument drew directly on the words of the
Page 38 of 110
URL: http://mc.manuscriptcentral.com/tsed Email: [email protected]
International Journal of Science Education
123456789101112131415161718192021222324252627282930313233343536373839404142434445464748495051525354555657585960

For Peer Review O
nly
7
students, and, secondly, through the use of a pencil-and-paper instrument, it offered the
potential to probe for explanatory data from a large dataset.
The development of the research instrument involved six steps, summarised in Table 1.
Table 1: Stages in the development and validation of the research instrument
Stage Procedure Data sources
1 Identification of areas to be explored Literature search plus interviews with 36
students aged 11, 14 and 16 (12 of each
age)
2 Composition and peer validation of
disposition statements
Initial development by team of three
researchers plus two teachers; validation
by approximately 25 science educators and
teachers
3 Gathering of free responses to
disposition statements
Approximately 40 responses per item, 10-
15 per age range in two all-ability
comprehensive schools
4 Development and validation of trial
fixed-response items
Categorisation and validation of responses
5 Production, use and validation of
fixed-response version of instrument
Trial with 91 students in four classes, two
aged 11 and two aged 16
Stage 1 yielded responses in a number of areas including: response to science lessons (teacher
effects, views of particular activities, views of different branches of science); views of social
implications of science (from school science and experiences outside school); views of
teacher characteristics; views of learning situations; views of science as presented in the
media; views of scientists and their work. These areas were divided into the two broad
categories of responses to school science and responses to science outside school.
Stage 2 involved the development of a series of statements relating to school science and
science outside the classroom. These took the form of disposition statements, i.e. responses
were indicative of attitude to science or school science. An initial pool of around 40 items
was reduced to 25 through a series of peer validation meetings involving approximately
twenty-five science educators and teachers. These statements are shown in Table 2.
Page 39 of 110
URL: http://mc.manuscriptcentral.com/tsed Email: [email protected]
International Journal of Science Education
123456789101112131415161718192021222324252627282930313233343536373839404142434445464748495051525354555657585960

For Peer Review O
nly
8
Table 2: The disposition statements
Dispositions towards school science
A01 Science lessons are among my favourite lessons.
A02 I try extra hard in science lessons.
A03 My science teachers make me more interested in science.
A04 The things we do in science lessons make me more interested in science.
A05 If I had a choice I would study biology.
A06 If I had a choice I would study chemistry.
A07 If I had a choice I would study physics.
A08 I enjoy reading science textbooks.
A09 What we do in science lessons is useful whatever you do after you leave school.
A10 Everybody should study all three science subjects (biology, chemistry and
physics) up to age 16.
A11 When they have a choice, young people should be given particular
encouragement to study science subjects.
Dispositions towards science outside school
B01 I like watching science programmes on the TV.
B02 I like reading about science in newspapers and magazines.
B03 News items about science interest me.
B04 I like reading science books other than school science textbooks.
B05 I would trust something a scientist said.
B06 I would like a job involving science.
B07 It would be good to have a job as a scientist.
B08 Science is blamed for things that are not its fault.
B09 Science has a positive influence on society.
B10 Science can help solve problems (e.g. environmental and social problems).
B11 Science makes an important contribution to the wealth of the nation.
B12 The Government should spend more money on scientific research.
B13 It is important for this country to have well-qualified scientists.
B14 It is important to promote this country as a scientific nation.
In Stage 3, each of the statements was in a form which invited students to respond on a Likert-
type scale (strongly agree/agree/neutral/ disagree/strongly disagree) to indicate their view,
followed by a request to explain, as a free response, their reasons for holding this view.
The first step in Stage 4 involved the free responses being independently categorised into
groups by two members of the research team. There was over 90% agreement on
categorisation. Each category of response was summarised in a sentence, drawing as closely
as possible on the words used students’ written responses. These then formed the basis of the
fixed responses to the disposition statements. Typically, an item would have between eight
Page 40 of 110
URL: http://mc.manuscriptcentral.com/tsed Email: [email protected]
International Journal of Science Education
123456789101112131415161718192021222324252627282930313233343536373839404142434445464748495051525354555657585960

For Peer Review O
nly
9
and ten fixed response options. A sample fixed-response item is shown in Table 3. Once
students had selected their Level 1 response (agree/neither agree nor disagree/disagree), they
were invited to select as many of the Level 2 responses as they felt applied to them. The
instrument thus enables responses to be gathered at two levels: Level 1 responses indicate
agreement or otherwise with the disposition statement, and Level 2 responses probe for
explanations.
Validation of the trial fixed-response items took place approximately three months after the
collection of the free responses. The process involved asking the same classes of students
who had originally given free responses to complete eight fixed-response items, with items
being distributed to students in such a way that at least ten responses per item were collected.
The responses selected by the students on the fixed-response item were then compared with
the original free response. The very good agreement (85%) between free responses and the
fixed-response options is a measure of the reliability of the items. Short interviews with
students where differences had emerged established that these students had not originally held
any particularly strong view.
To maximise the validity of the range of Level 2 responses, each item offered the options of
not selecting any of the fixed responses offered, but giving “another reason – please say
what”. The intention was to look for any further patterns emerging in from these options and
add them to the options offered. In practice, though between three and five students per item
selected “another reason”, the reasons were very varied and no consistent patterns emerged. It
was decided to leave the “another reason ...” option in the final version of the instrument to
allow student to express different views if they so wished.
Page 41 of 110
URL: http://mc.manuscriptcentral.com/tsed Email: [email protected]
International Journal of Science Education
123456789101112131415161718192021222324252627282930313233343536373839404142434445464748495051525354555657585960
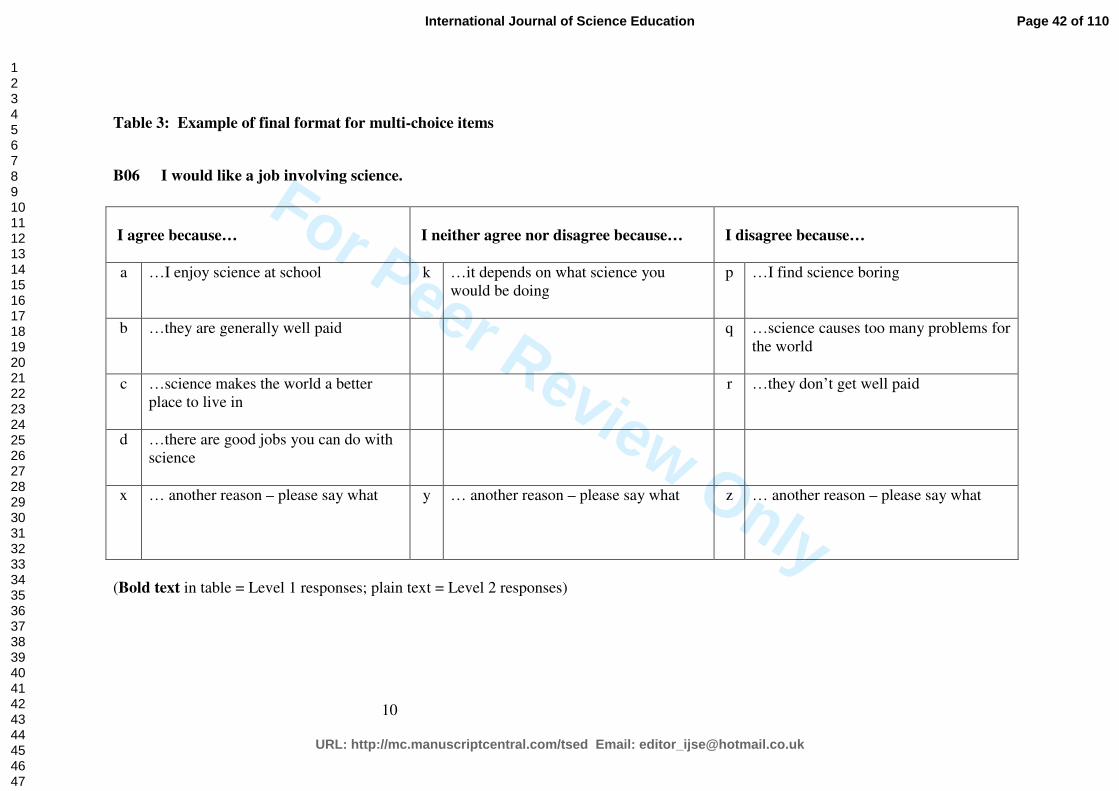
For Peer Review Only
10
Table 3: Example of final format for multi-choice items
B06 I would like a job involving science.
I agree because…
I neither agree nor disagree because…
I disagree because…
a …I enjoy science at school
k …it depends on what science you
would be doing
p …I find science boring
b …they are generally well paid
q …science causes too many problems for
the world
c …science makes the world a better
place to live in
r …they don’t get well paid
d …there are good jobs you can do with
science
x
… another reason – please say what
y … another reason – please say what z … another reason – please say what
(Bold text in table = Level 1 responses; plain text = Level 2 responses)
Page 42 of 110
URL: http://mc.manuscriptcentral.com/tsed Email: [email protected]
International Journal of Science Education
123456789101112131415161718192021222324252627282930313233343536373839404142434445464748495051525354555657585960
For Peer Review O
nly
11
Stage 5 involved the trial of the instrument. Four classes in two schools participated in the
trial, such that data were gathered from 91 students in two classes aged 11 and two aged 16.
This enabled the instrument to be tested with students at the upper and lower ends of the target
age range.
Content validity was assessed by the following procedure. At the point where their students
completed the instrument, the class teacher was asked to indicate their view of each student’s
attitude to science on a five point scale, where a score of five represented a very positive
attitude, and a score of one represented a very negative attitude. A numerical total was then
calculated for each student based on their responses to the instrument. Any ‘agree’ options
selected were given a score of three, ‘neither agree nor disagree’ options were given a score of
two, and ‘disagree’ options a score of one. Whilst there are drawbacks to assigning numerical
scores to Likert-type responses, it was felt that these were outweighed by the advantages of
having some indicator of the validity of the instrument in gauging attitudes to school science
and to science. Visual inspection of the scattergrams of the teacher scores for students’
attitude and the students’ score on the instrument showed a good line of fit, and there were no
instances where the instrument had indicated a negative attitude and the teacher had indicated
a positive attitude. In a limited number of instances (10%), the instrument indicated a positive
attitude whilst the teacher had indicated a negative attitude. Conversations with the teachers
showed that these cases tended to be students who were seen as not very hard-working by the
teachers, and that this influenced their view of the students’ attitude.
Details of the full instrument may be accessed from the web-link at the end of this paper.
Page 43 of 110
URL: http://mc.manuscriptcentral.com/tsed Email: [email protected]
International Journal of Science Education
123456789101112131415161718192021222324252627282930313233343536373839404142434445464748495051525354555657585960
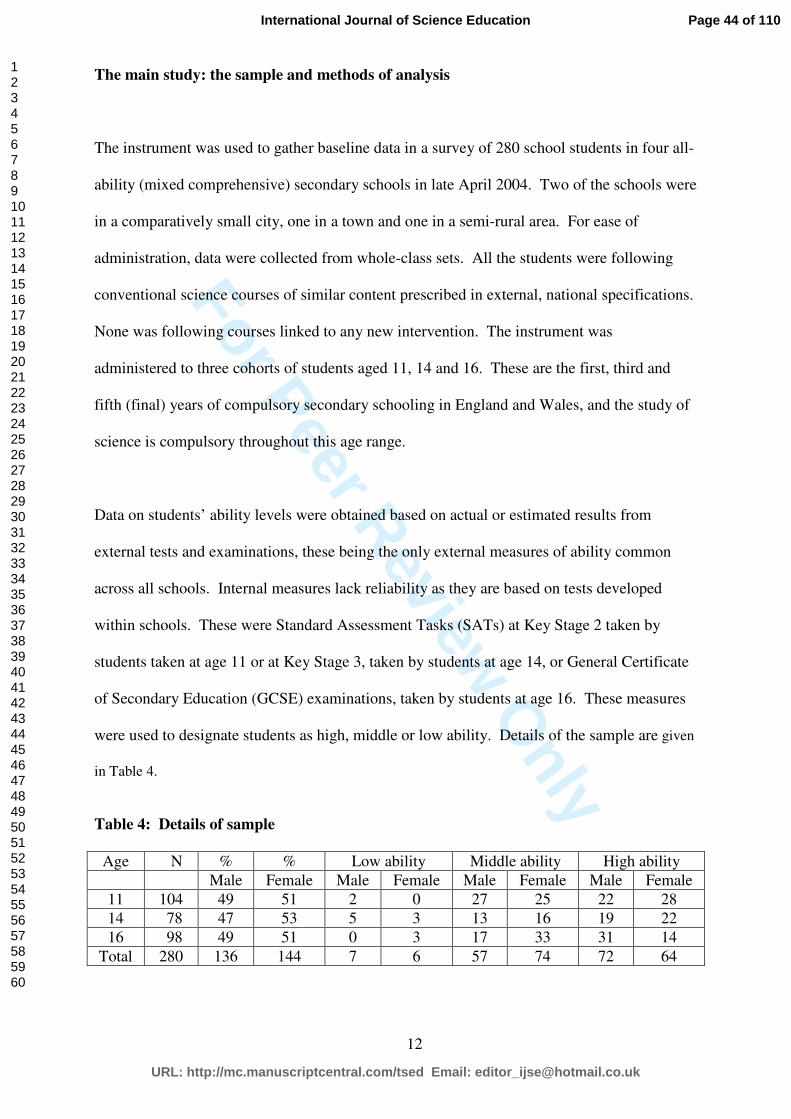
For Peer Review O
nly
12
The main study: the sample and methods of analysis
The instrument was used to gather baseline data in a survey of 280 school students in four all-
ability (mixed comprehensive) secondary schools in late April 2004. Two of the schools were
in a comparatively small city, one in a town and one in a semi-rural area. For ease of
administration, data were collected from whole-class sets. All the students were following
conventional science courses of similar content prescribed in external, national specifications.
None was following courses linked to any new intervention. The instrument was
administered to three cohorts of students aged 11, 14 and 16. These are the first, third and
fifth (final) years of compulsory secondary schooling in England and Wales, and the study of
science is compulsory throughout this age range.
Data on students’ ability levels were obtained based on actual or estimated results from
external tests and examinations, these being the only external measures of ability common
across all schools. Internal measures lack reliability as they are based on tests developed
within schools. These were Standard Assessment Tasks (SATs) at Key Stage 2 taken by
students taken at age 11 or at Key Stage 3, taken by students at age 14, or General Certificate
of Secondary Education (GCSE) examinations, taken by students at age 16. These measures
were used to designate students as high, middle or low ability. Details of the sample are given
in Table 4.
Table 4: Details of sample
Age N % % Low ability Middle ability High ability
Male Female Male Female Male Female Male Female
11 104 49 51 2 0 27 25 22 28
14 78 47 53 5 3 13 16 19 22
16 98 49 51 0 3 17 33 31 14
Total 280 136 144 7 6 57 74 72 64
Page 44 of 110
URL: http://mc.manuscriptcentral.com/tsed Email: [email protected]
International Journal of Science Education
123456789101112131415161718192021222324252627282930313233343536373839404142434445464748495051525354555657585960

For Peer Review O
nly
13
Although data were collected from whole class sets, the sample turned out to be balanced in
terms of gender, with just slightly more female students (n=144) than male (n=136). External
measures of ability resulted in the majority of the students in the sample being designated as
middle or high ability. The likely explanation for this is that the external measures used for
ability are not very discriminating in that the majority of student will be placed in one of three
broad bands at age 11 and 14. Overall, however, the sample was felt to be representative of
the group from which it was drawn, as data were collected from classes across the whole
ability range.
Analysis of the non-parametric data was carried out using the SPSS 11 package, and applying
the Chi-squared test to look for significant differences in responses.
Results
The nature of the instrument means that the database developed is extensive, particularly in
relation to the Level 2 responses, and it is beyond the scope of this paper to present and
discuss all the findings in detail. This paper therefore presents the most notable features of
the data in six main sections. The first presents an overview of responses, with the second
and third highlighting key features of the data in relation to school science and science outside
school. The next two sections focus on particular aspects of the data that offer insights into
two of the particular foci of the study: differences in responses to science in school and
science outside school, and changes in attitudes in the early years of secondary schooling.
The last section reports a noticeable, though unanticipated, outcome of the study, a shift in
opinion with maturity.
Page 45 of 110
URL: http://mc.manuscriptcentral.com/tsed Email: [email protected]
International Journal of Science Education
123456789101112131415161718192021222324252627282930313233343536373839404142434445464748495051525354555657585960
For Peer Review O
nly
14
Overview of responses
Figure 1 provides a visual overview of the positive responses to each of the items by showing
the percentage of students in each age group who selected ‘agree’ as their Level 1 response
for each item. Figure 2 show the percentages of male and female students who selected
‘agree’ as their Level 1 response for each item. The figures show a noticeable trend for
positive attitudes to items relating to both school science and to science outside school to
decrease overall from age 11 to age 16 and, within this, for female students to hold less
positive attitudes than male students.
The items where differences in responses were statistically significant for all Level 1
responses (i.e. ‘agree’, ‘neither agree nor disagree’ and ‘disagree’), are summarised in Table
5.
Page 46 of 110
URL: http://mc.manuscriptcentral.com/tsed Email: [email protected]
International Journal of Science Education
123456789101112131415161718192021222324252627282930313233343536373839404142434445464748495051525354555657585960
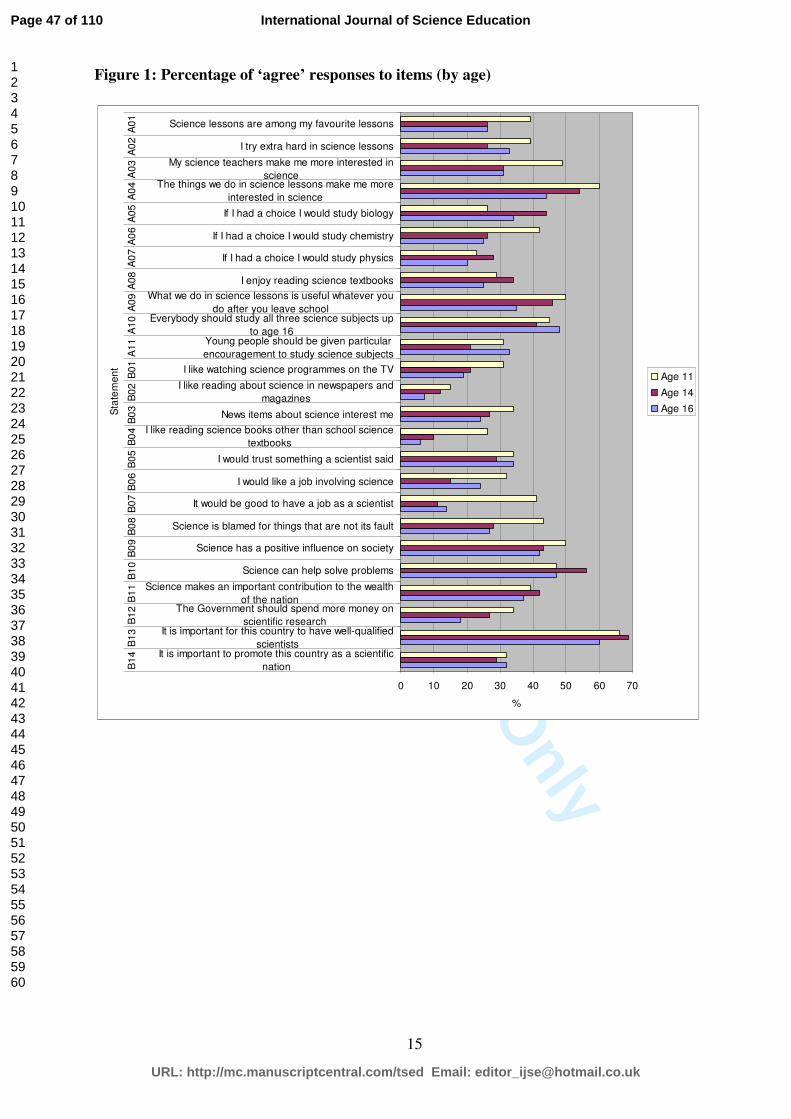
For Peer Review O
nly
15
Figure 1: Percentage of ‘agree’ responses to items (by age)
0 10 20 30 40 50 60 70
It is important to promote this country as a scientific
nation
It is important for this country to have well-qualified
scientists
The Government should spend more money on
scientific research
Science makes an important contribution to the wealth
of the nation
Science can help solve problems
Science has a positive influence on society
Science is blamed for things that are not its fault
It would be good to have a job as a scientist
I would like a job involving science
I would trust something a scientist said
I like reading science books other than school science
textbooks
News items about science interest me
I like reading about science in newspapers and
magazines
I like watching science programmes on the TV
Young people should be given particular
encouragement to study science subjects
Everybody should study all three science subjects up
to age 16
What we do in science lessons is useful whatever you
do after you leave school
I enjoy reading science textbooks
If I had a choice I would study physics
If I had a choice I would study chemistry
If I had a choice I would study biology
The things we do in science lessons make me more
interested in science
My science teachers make me more interested in
science
I try extra hard in science lessons
Science lessons are among my favourite lessonsB
14
B1
3B
12
B1
1B
10
B0
9B
08
B0
7B
06
B0
5B
04
B0
3B
02
B0
1A
11
A1
0A
09
A0
8A
07
A0
6A
05
A0
4A
03
A0
2A
01
Sta
tem
en
t
%
Age 11
Age 14
Age 16
Page 47 of 110
URL: http://mc.manuscriptcentral.com/tsed Email: [email protected]
International Journal of Science Education
123456789101112131415161718192021222324252627282930313233343536373839404142434445464748495051525354555657585960

For Peer Review O
nly
16
Figure 2: Percentage of ‘agree’ responses to items (by gender)
0 10 20 30 40 50 60 70
It is important to promote this country as a scientif ic nation
It is important for this country to have w ell-qualif ied scientists
The Government should spend more money on scientif ic research
Science makes an important contribution to the w ealth of the nation
Science can help solve problems
Science has a positive influence on society
Science is blamed for things that are not its fault
It w ould be good to have a job as a scientist
I w ould like a job involving science
I w ould trust something a scientist said
I like reading science books other than school science textbooks
New s items about science interest me
I like reading about science in new spapers and magazines
I like w atching science programmes on the TV
Young people should be given particular encouragement to study science
subjects
Everybody should study all three science subjects up to age 16
What w e do in science lessons is useful w hatever you do after you
leave school
I enjoy reading science textbooks
If I had a choice I w ould study physics
If I had a choice I w ould study chemistry
If I had a choice I w ould study biology
The things w e do in science lessons make me more interested in science
My science teachers make me more interested in science
I try extra hard in science lessons
Science lessons are among my favourite lessonsB
14
B13
B12
B11
B10
B09
B08
B07
B06
B05
B04
B03
B02
B01
A11
A10
A09
A08
A07
A06
A05
A04
A03
A02
A01
Sta
tem
ent
%
Male
Female
Page 48 of 110
URL: http://mc.manuscriptcentral.com/tsed Email: [email protected]
International Journal of Science Education
123456789101112131415161718192021222324252627282930313233343536373839404142434445464748495051525354555657585960
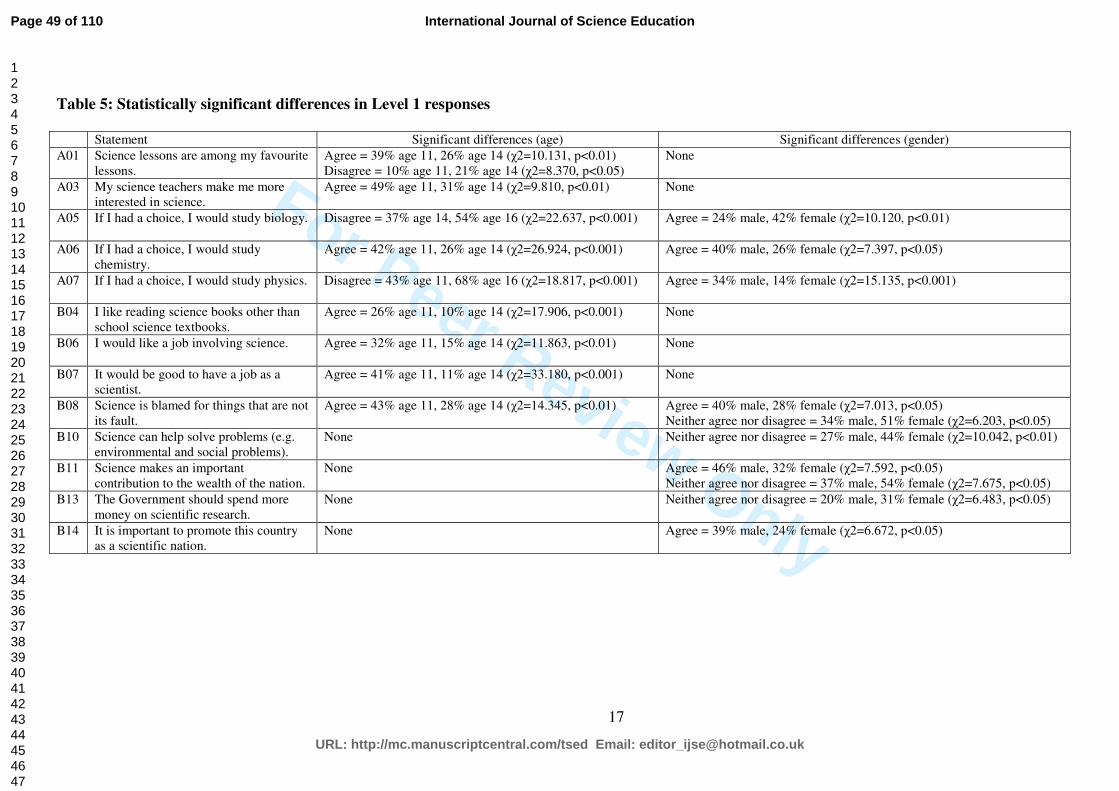
For Peer Review Only
17
Table 5: Statistically significant differences in Level 1 responses
Statement Significant differences (age) Significant differences (gender)
A01 Science lessons are among my favourite
lessons.
Agree = 39% age 11, 26% age 14 (χ2=10.131, p<0.01)
Disagree = 10% age 11, 21% age 14 (χ2=8.370, p<0.05)
None
A03 My science teachers make me more
interested in science.
Agree = 49% age 11, 31% age 14 (χ2=9.810, p<0.01) None
A05 If I had a choice, I would study biology.
Disagree = 37% age 14, 54% age 16 (χ2=22.637, p<0.001) Agree = 24% male, 42% female (χ2=10.120, p<0.01)
A06 If I had a choice, I would study
chemistry.
Agree = 42% age 11, 26% age 14 (χ2=26.924, p<0.001) Agree = 40% male, 26% female (χ2=7.397, p<0.05)
A07 If I had a choice, I would study physics.
Disagree = 43% age 11, 68% age 16 (χ2=18.817, p<0.001) Agree = 34% male, 14% female (χ2=15.135, p<0.001)
B04 I like reading science books other than
school science textbooks.
Agree = 26% age 11, 10% age 14 (χ2=17.906, p<0.001) None
B06 I would like a job involving science.
Agree = 32% age 11, 15% age 14 (χ2=11.863, p<0.01) None
B07 It would be good to have a job as a
scientist.
Agree = 41% age 11, 11% age 14 (χ2=33.180, p<0.001) None
B08 Science is blamed for things that are not
its fault.
Agree = 43% age 11, 28% age 14 (χ2=14.345, p<0.01) Agree = 40% male, 28% female (χ2=7.013, p<0.05)
Neither agree nor disagree = 34% male, 51% female (χ2=6.203, p<0.05)
B10 Science can help solve problems (e.g.
environmental and social problems).
None Neither agree nor disagree = 27% male, 44% female (χ2=10.042, p<0.01)
B11 Science makes an important
contribution to the wealth of the nation.
None Agree = 46% male, 32% female (χ2=7.592, p<0.05)
Neither agree nor disagree = 37% male, 54% female (χ2=7.675, p<0.05)
B13 The Government should spend more
money on scientific research.
None Neither agree nor disagree = 20% male, 31% female (χ2=6.483, p<0.05)
B14 It is important to promote this country
as a scientific nation.
None Agree = 39% male, 24% female (χ2=6.672, p<0.05)
Page 49 of 110
URL: http://mc.manuscriptcentral.com/tsed Email: [email protected]
International Journal of Science Education
123456789101112131415161718192021222324252627282930313233343536373839404142434445464748495051525354555657585960
For Peer Review O
nly
18
Science in school: key features of the data
Responses to science lessons
The number of students reporting that science is amongst their favourite lessons decreases
significantly between the ages of 11 and 14. Within the group saying that science lessons are
amongst their favourite lessons, the Level 2 responses revealed a particularly positive
response to chemistry (85% at age 11, 75% at age 14 and 65% at age 16), linked to a liking of
practical work. Biology became increasingly important in reporting liking of science (45% at
age 11, 75% at age 14 and 77% at age 16), with the difference between ages 11 and 14 being
significant (χ2=8.761, p<0.01). Level 2 responses showed that the significant increase
between ages 11 and 14 in students not reporting science as being amongst their favourite
subjects was associated most strongly with increasing dislike of the physical sciences, and
physics, in particular, being cited as ‘hard’.
Responses to individual subjects within science
One particular aspect which generated polarised responses concerned attitudes to the
individual science subjects, probed in items A05 (biology), A06 (chemistry) and A07
(physics).
Each of the subjects appears to have a slightly different problem associated with it.
Interest in biology increases from age 11 to age 14 before decreasing at age 16, though
remaining higher than interest in the physical sciences. In contrast, interest in chemistry and
physics declines between age 11 and 14, and this continues through to age 16. Significantly
more students are interested in chemistry (42%) than in physics (23%) at age 11 (χ2=8.739,
Page 50 of 110
URL: http://mc.manuscriptcentral.com/tsed Email: [email protected]
International Journal of Science Education
123456789101112131415161718192021222324252627282930313233343536373839404142434445464748495051525354555657585960

For Peer Review O
nly
19
p<0.01). Indeed, chemistry attracts the highest level of interest of all three sciences at this
age. For physics, the problem is that interest is low to begin with, and declines with age,
whereas for chemistry interest is comparatively high initially but characterised by a steep and
statistically significant decline between age 11 and age 14 (χ2=7.713, p<0.01).
Level 2 data showed the most prominent reason for wishing to study biology by two-thirds or
more of students in all age groups at all ages was that students found the subject interesting.
The most common reasons for not wanting to study biology was it not being necessary for the
jobs students had in mind. In common with biology, around two thirds of students in each
age group cited a perceived lack of relevance of chemistry for the jobs they had in mind.
However, around two-fifths of students also cited the strategic aspect of obtaining better
external examination grades in other subjects. There was a marked reluctance to study
physics, and this increased steadily with age. While the proportion who wanted to study the
subject did not change greatly, the proportion who disagreed increased significantly. Level 2
responses showed physics being increasingly seen as hard, with significantly more older
students feeling they could get better grades in another subject (34% at age 11 and 53% at age
16; χ2=7.146, p<0.05). Studies of grades achieved in external examinations at age 16 (e.g.
Coe et al., 2008) have indicated that it is more difficult for student to achieve higher grades in
the physical sciences than in other subjects, so it would seem that students’ perceptions of
levels of difficulty are accurate, and exert a considerable influence on their subject choices.
Gender patterns in responses to science subjects were significant, conforming to the widely
reported differences of girls being more favourably inclined towards biology and boys
towards the physical sciences. Level 2 responses indicated that all three science subjects were
perceived as significantly harder by female students than male students. Though significantly
more female students than male students felt they did not see the point of the things they did
Page 51 of 110
URL: http://mc.manuscriptcentral.com/tsed Email: [email protected]
International Journal of Science Education
123456789101112131415161718192021222324252627282930313233343536373839404142434445464748495051525354555657585960
For Peer Review O
nly
20
in chemistry, significantly more of the female students who viewed the subject positively did
so for carer reasons, suggesting that subject ‘hardness’ is more likely to be tolerated if it has
potential utility for future jobs.
Teacher effects
Two items offered interesting insights into students’ responses to their experiences in science
lessons: A03: My science teachers make me more interested in science, and A04: The things
we do in science lessons make me more interested in science.
A03 elicited a very positive response at age 11, with 49% of students agreeing with the
statement, but responses dropped significantly by age 14 to 31% and remained at this level at
age 16. Level 2 responses demonstrated a range of ways in which teachers created interest in
science. For the two younger age groups, almost three-quarters of students cited a variety of
activities as being very important, with “being made to think” being cited by 60% of student
aged 11. Explaining things clearly was important for over half of all ages, and was the most
common response at age 14, with significantly more female students than male students in
each age group citing this as important (F=74%, M=41%; χ2=11.660, p<0.001). Similarly
female students were more likely than male students to report their interest in science being
influenced by their teachers’ enthusiasm (F=48%, M=37%; χ2=3.869, p<0.05).
Item A04 elicited the most positive responses of all the items about school science, with 60%
of students aged 11 agreeing that the things they did in their lessons made them more
interested in science. This figure remained comparatively high for all age groups. The Level
2 explanation most frequently selected by all age groups was enjoyment of practical work. In
contrast interest in investigations tailed off significantly. One striking feature of the responses
Page 52 of 110
URL: http://mc.manuscriptcentral.com/tsed Email: [email protected]
International Journal of Science Education
123456789101112131415161718192021222324252627282930313233343536373839404142434445464748495051525354555657585960

For Peer Review O
nly
21
was the significant decrease in enjoyment of group work linked to presentations (age
11=65%, age 16=30%; χ2=12.917, p<0.01). This may suggest that the introduction of such
tasks into science courses and lessons needs sensitive handling if students are to feel the
activities are of benefit to them.
Taken together, the responses to these items point to teachers, and the activities they choose
to use in lessons, playing a particularly influential role at age 11, and thus having the potential
to make a crucial difference in the early years of secondary schooling.
The importance of science in the curriculum
Exceptions to the trend of decreasing overall positive attitudes to school science were the two
items relating to the importance of science in the curriculum, A10: Everybody should study all
three science subjects up to age 16, and A11: When they have a choice, young people should
be given particular encouragement to study science subjects. Level 2 data showed that over
one-third of students in all age groups agreeing with A10 felt science was an important part of
a good general education. However significantly more of the students agreeing with this item
at age 16 also said that they thought there was too much science on the timetable (age
11=13%, age 16=45%; χ2=11.319, p<0.01). Level 2 data for A11 showed high proportions of
students who agreed with the statement supporting the view that science affects so much in
everyday life. However there was a significant drop in the proportion of students selecting
this option at age 16 (age 11=94% at 11, age 16=63%; χ2=15.065, p<0.001). Almost all
students felt science leads to good jobs, and around half cited the importance of training the
scientists of the future.
Page 53 of 110
URL: http://mc.manuscriptcentral.com/tsed Email: [email protected]
International Journal of Science Education
123456789101112131415161718192021222324252627282930313233343536373839404142434445464748495051525354555657585960

For Peer Review O
nly
22
One feature these two statements share in common is that they are less personal than the other
statements about science in school. The responses suggest that students approaching the end
of their compulsory period of studying science at school place some general value on the
study of science, whilst not necessarily finding it sufficiently interesting and engaging
themselves to want to pursue their studies of science subjects. This finding is supported by
responses to item A09: What we do in science lessons is useful whatever you do after you
leave school. At all ages, this item was one of the top three items about school science to get
a Level 1 response of ‘agree’. Level 2 data showed that many students felt science helped
people understand the world they live in, though there was a significant difference in
responses that demonstrated a dip in this view from age 11 to age 14 (age 11=84%, age
14=67%; χ2=7.455, p<0.05).
Science outside school: key features of the data
The overall pattern shows that attitudes to science outside school are less positive at age 16
than age 11, with four items (B04, B06, B07 and B08) showing significant decreases in
positive responses. With the exception of B02: I like reading about science in newspapers
and magazines, male students were more positive than female students in their responses to
science outside school, with three items (B08, B11 and B14) showing significant differences.
Four items (B08, B10, B11 and B13) also showed significant differences in neutral responses,
with more female students than male students selecting the ‘neither agree nor disagree’
options.
Science as presented in the media
Page 54 of 110
URL: http://mc.manuscriptcentral.com/tsed Email: [email protected]
International Journal of Science Education
123456789101112131415161718192021222324252627282930313233343536373839404142434445464748495051525354555657585960

For Peer Review O
nly
23
Responses to items about science as presented in the media (B01, B02, B03) were not very
positive, with less than one-third of students in all age groups selecting ‘agree’ as their Level
1 response. Level 2 explanations for those students who were positive about watching
science programmes on TV (B01) indicated between half and three-quarters of students
reported that the programmes made them more interested in science, and similar proportions
found that they helped understanding of school science understanding, and seeing how
science is used in the real world. Half to three-quarters of the students disagreeing with the
statement declared they would never watch a TV programme about science. This lack of
interest was also reflected in responses to B02: I like reading about science in newspapers
and magazines, where the overwhelming majority of students - over 70% in each age group -
said that they never read anything to do with science in newspapers and magazines. Of those
students who selected ‘agree’ as their Level 1 response to B03: News items about science
interest me, the majority thought that it was important to learn about things that could affect
them. However, two-thirds of the much larger numbers who disagreed in each age group
reported never bothering with news items about science. It is clear from these responses that
items in the media about science do little to engage most students.
Reading about science
Item B02 (see above), together with B04: I like reading science books other than science
textbooks, focuses on reading. Both statements did not elicit particularly positive responses at
age 11, and became even less positive with age, B04 significantly so. Around 15% of
students aged 11 responded positively to B02, and this figure halved by age 16. The
responses to B04 demonstrate that few students are interested in reading science books. What
interest there was dropped off sharply between age 11 (26%) and age 14 (9%), declining
further by age 16 (6%), where just short of half the students explicitly disagreeing with the
Page 55 of 110
URL: http://mc.manuscriptcentral.com/tsed Email: [email protected]
International Journal of Science Education
123456789101112131415161718192021222324252627282930313233343536373839404142434445464748495051525354555657585960

For Peer Review O
nly
24
statement. Wildlife books were the most interesting for three-quarters of students at age 11
and just under half liked science fiction. Close to half of the students at age 11 also related
their extra-curricular science reading to their science lessons, both in terms of helping them
understand the science they were studying and seeing the relevance of what they did in
science lessons. By age 16, these responses had virtually disappeared, with almost half the
students report that they would never choose to read science books because they are so
boring. These findings indicate the majority of young people’s leisure reading rarely involves
books on science.
Careers in science
Items B06 and B07 focused on careers in science, with B06 asking about liking a job
involving science, and item B07 asking about being a scientist. Both showed significant
differences in results. For item B06, students aged 11 were equally divided amongst
agree/neutral/disagree. By age 14, there was a very low positive response (15%) and a very
high negative response (60%) (χ2=11.863, p<0.01). However this was reversed to some
extend by age 16, where close to one quarter of students were positive about the idea and just
less than half opposed. The most frequent reason given by three-quarters of students in the
Level 2 data, irrespective of age, was that there are good jobs available in science. Around
60% of students at age 11 and 14 explained their Level 1 agree responses by citing enjoyment
of science at school, but this was of less relevance at age 16 (39%) than the perception of jobs
as well-paid (61%). Finding science ‘boring’ appears, fairly predictably, to be the most
common reason for lack of interest is taking up a science-based job, cited by three-quarters of
students in all age groups.
For item B07: It would be good to have a job as a scientist, there was a highly significant
change of views over the early years of secondary schooling (age 11=41%, age 14=10%;
Page 56 of 110
URL: http://mc.manuscriptcentral.com/tsed Email: [email protected]
International Journal of Science Education
123456789101112131415161718192021222324252627282930313233343536373839404142434445464748495051525354555657585960
For Peer Review O
nly
25
χ2=33.180, p<0.001), a change of view sustained at age 16 (14%). Level 2 data pointed to a
range of factors being of influence, particularly at age 11, where students cited the nature of
the work, remuneration and the view that scientists can have a positive influence on the
world. These responses suggest that younger students have a generally positive overview of
science as a job or career. Relatively few students at age 14 or 16 agreed with the statements,
though, of those that did, by far the most common explanation (over two-thirds at each age)
was that they felt that scientists were people who could change the world for the better. The
most common Level 2 explanation for students at age 16 was that scientists had well-paid
jobs. The Level 2 data for students disagreeing with B07 showed they had a wide range of
negative opinions of scientists, with the two most prominent views in all age groups being
that scientists do boring jobs (two-third or more of students) and are a bit weird (just over half
of students). Scientists were also seen as uncaring by around two-fifths of students in each
age group, with a similar proportion also seeing scientists as causing problems in the world,
and as risk takers. The findings suggest that, for the majority of students, there is little
overlap between their perceptions of themselves and of scientists.
The positive responses to the items about jobs in science point to two rather different factors
being particularly influential for those attracted to jobs in science. For some, the attraction is
linked to altruistic notions of being able to make a difference for the better to the world,
whilst, for others, there is the more pragmatic attraction of seeing jobs involving science as
being well-paid. The perception is of interest in the context of the findings of a survey of
graduate earning potential in a range of disciplines undertaken in the UK for the Royal
Society of Chemistry and the Institute of Physics (PricewaterhouseCooper, 2005). This
showed that graduates with degrees in physics and chemistry, though not necessarily working
in science-related careers, had the fourth and fifth highest earning potential after medicine,
law and engineering. If students’ choice of subjects to study is influenced by their beliefs
Page 57 of 110
URL: http://mc.manuscriptcentral.com/tsed Email: [email protected]
International Journal of Science Education
123456789101112131415161718192021222324252627282930313233343536373839404142434445464748495051525354555657585960
For Peer Review O
nly
26
about potential earnings, as the work reported here suggests, then there would appear to be a
case for ensuring that they are aware of the possible financial benefits of studying science
subjects.
Is science misrepresented?
There was a highly significant drop between age 11 (43%) and age 14 (26%) in the proportion
of students agreeing with B08: Science is blamed for things that are not its fault, with little
further change at age 16. There were also significant gender differences in response, with
male students being much more likely to agree with the statement than female students. The
percentage disagreeing declined with age, with Level 2 data indicated these changes were
associated with a steady increase over the year groups from one-third at age 11 to well over
half by age 16 who neither agreed nor disagreed. Over 90% of students aged 11 and 14 were
of the opinion that information was often misrepresented in the media and, by implication,
this means science is blamed for things that are not its fault. The drop in this view by age 16
was significant (χ2=6.389, p<0.05). Half of the respondents in each age group perceived that
it is scientists who are often blamed for (negative) aspects of science that are actually a
consequence of the actions of others. There was a tendency that increased with age for
students to believe that science is bound to get blamed for some things as it is so common in
everyday life (42% at age 11, 65% at age 16), and the opinion that only bad things about
science get reported also rose with age (24% at age 11, 46% at age 16). In contrast, close to
three-fifths of all students in all age groups who chose ‘disagree’ as their Level 1 response felt
that this was because science helps to create problems, but only the good things about science
are reported. Three-quarters or more of students in each age group were not interested in the
way science is reported, reflecting the lack of interest in science in the media reported earlier.
The somewhat complex data here appear to suggest that, as they mature, students develop a
Page 58 of 110
URL: http://mc.manuscriptcentral.com/tsed Email: [email protected]
International Journal of Science Education
123456789101112131415161718192021222324252627282930313233343536373839404142434445464748495051525354555657585960

For Peer Review O
nly
27
more sophisticated view of the range of effects of science and how these are portrayed, whilst,
at the same time, becoming more critical of the effects of science.
The personal and impersonal response to science
The views on the importance of science in the school curriculum discussed earlier are
forerunners of the very appreciable trend in responses to science outside school for students to
become increasingly positive about science as the items to which they are responding become
less personalised. Items B09 to B14 sought views of the more general importance of science,
and it is clear from Figures 1 and 2 that these elicited a greater proportion of Level 1 ‘agree’
responses than almost all the other items. Within this, male students were generally
significantly more positive than female students who, in turn, were significantly more likely
than male student to be more cautious in their judgements by selecting ‘neither agree no
disagree’ as their Level 1 response.
For item B10: Science can help solve problems, male students had a significantly more
optimistic view of the beneficial role of science. Level 2 data showed a very high proportion
(over 90%) of students who agreed with the statement felt that scientists could help to solve
problems by inventing things, with close to three-quarters supporting the view that science
can give us the knowledge to sort out problems. Regardless of gender, all students who
disagreed with the statement supported the view that science causes the problems in the first
place and so is unlikely to solve them.
A significantly higher proportion of female students responded in a neutral or cautious
fashion to B11: Science makes an important contribution to the wealth of the nation compared
to male students who were much more likely to agree. Level 2 data revealed that 80% of
Page 59 of 110
URL: http://mc.manuscriptcentral.com/tsed Email: [email protected]
International Journal of Science Education
123456789101112131415161718192021222324252627282930313233343536373839404142434445464748495051525354555657585960

For Peer Review O
nly
28
students believed that science helps to create jobs, with close to 40% of both sexes supporting
the view that science lead to inventions which people then buy. The importance of science to
industry and the economy was recognised by around two-thirds of male and female students.
Most of the students who disagreed with the statement felt that science costs money rather
than generating wealth.
Item B13: It is important for this country to have well-qualified scientists, received the most
positive responses of all the items about science outside school from all age groups. Even
though students aged 16 were the least positive, 60% selected ‘agree’ as their Level 1
response, providing a stark contrast to the 14% who responded positively to B07: It would be
good to have a job as a scientist. Level 2 data showed that a very high proportion of students
(95%) who agreed with the main statement did so because they thought science important for
certain areas such as medicine. Additionally around two-thirds of students supported the
suggestion that scientists in this country can help other countries, and similar numbers feeling
that scientists make the country a better place in which to live.
Significantly more male students than female students agreed with B14: It is important to
promote this country as a scientific nation. This was balanced by a higher proportion of
female students who neither agreed nor disagreed. Level 2 data showed over 80% of both
sexes thought that promoting the country as a scientific nation would be good for the
economy and for employment. Very similar proportions thought that the UK should not be
left behind other nations given that people in this country have good ideas. The sizable
majority of students disagreeing with the statement thought there were more important things
to promote about the UK. These responses add to the evidence from other studies (Osborne
and Collins, 2001; Jenkins and Nelson, 2005) that young people’s attitudes to science outside
school are more positive than their attitudes to their personal experience of science in school.
Page 60 of 110
URL: http://mc.manuscriptcentral.com/tsed Email: [email protected]
International Journal of Science Education
123456789101112131415161718192021222324252627282930313233343536373839404142434445464748495051525354555657585960

For Peer Review O
nly
29
The ‘age 14 dip’
The study provides ample evidence of the particularly sharp fall in positive attitudes between
age 11 and age 14, in keeping with the findings of the study by Galton et al. (2003). Within
the overall pattern of declining positive attitudes, seven items showed a statistically
significant decrease in ‘agree’ responses between age 11 and age 14 with, in some cases, a
slight improvement by age 16. No items showed similar significant differences between ages
11 and 14. These items are summarised in Table 6.
Table 6: Items showing statistically significant decline in ‘agree’ responses between the
ages of 11 and 14
Statement Agree at
age 11
(%)
Agree at
age 14
(%)
Agree at
age 16
(%)
A01 Science lessons are among my favourite lessons 39 26 27
A03 My science teachers make me more interested in
science
49 31 31
A06 If I had a choice, I would study chemistry 42 26 25
B04 I like reading science books other than school
science textbooks
26 10 6
B06 I would like a job involving science 32 15 24
B07 It would be good to have a job as a scientist 41 11 14
B08 Science is blamed for things that are not its fault 43 28 27
The explanatory (Level 2) responses to the items offer interesting insights into the ‘age 14
dip’, some of which have been discussed earlier. The most pertinent of these relate to
students views of their science lessons, their responses to what their teachers do, and their
perceived value of jobs and careers involving science. In science lessons, an increasing
feeling that the subject matter is difficult – science is ‘hard’ – exerts a very significant
influence between ages 11 and 14. Enthusiastic teachers who challenged students to think
and provided variety in activity were seen as very influential at age 11. At this age, students
were also attracted to careers in science, giving a wide variety of reasons: the nature of the
Page 61 of 110
URL: http://mc.manuscriptcentral.com/tsed Email: [email protected]
International Journal of Science Education
123456789101112131415161718192021222324252627282930313233343536373839404142434445464748495051525354555657585960
For Peer Review O
nly
30
work, remuneration and the view that scientists can have a positive influence on the world.
This view has altered dramatically by age 14, with jobs involving science being seen as
unattractive because they are perceived as boring, science being perceived as causing too
many problems in the world and scientists having to make too many compromises. However,
students aged 16 who did want a job involving science gave as their reasons the fact that
scientists could change the world for the better, or that jobs involving science were well-paid.
It appears that some students at least, as they mature, come to feel that science offers a way of
making a positive difference to people’s lives.
Shift in opinion with maturity
One unanticipated feature of particular interest in the data is the shift in Level 1 responses
from ‘agree’ or ‘disagree’ to ‘neither agree nor disagree’ as students get older. There are
examples of items where there was no significant difference with age in the number of agree
responses, but a very apparent difference in shift from ‘disagree’ to ‘neither …’ responses.
For example, in item B07, It would be good to have a job as a scientist, numbers disagreeing
with this statement stayed roughly constant at around the 40% level. However, the very
significant fall in numbers agreeing with the statement (age 11=41%, age 14=11%;
χ2=33.180, p<0.001) was mirrored by a corresponding rise in number selecting the
‘neither…’ option (age 11=22%, age 14=45%; χ2=10.384 p<0.01). A similar pattern in
responses may be seen for item B08, Science is blamed for things that are not its fault. The
majority of neutral Level 1 responses were linked to Level 2 responses in which students said
they did not feel they knew enough to have a view. These findings suggest that, as students
mature, they feel they need more information to make an informed judgement.
Page 62 of 110
URL: http://mc.manuscriptcentral.com/tsed Email: [email protected]
International Journal of Science Education
123456789101112131415161718192021222324252627282930313233343536373839404142434445464748495051525354555657585960

For Peer Review O
nly
31
Within this overall shift in opinion with maturity, it is also apparent that a significantly higher
proportion of female students chose the ‘neither …’ option in all cases where there was a
significant gender difference in responses. Furthermore, when looking at the reasons why the
‘neither …’ option was selected, there was a consistent trend for more female students than
male students being prepared to admit they did not know enough to make an informed
response. One possible explanation for this is that female students may be more cautious than
male students in opting for a definite ‘agree’ or ‘disagree’ response which, in turn suggests
that male students may have firmer opinions or a more ‘black and white’ view of the world.
Conclusions
Research into attitudes to science often results in feelings of comfort (though very often cold
comfort) from reaffirmation of the findings of other work, coupled with frustration at the
seemingly intractable nature of the problem. Certainly some of the responses in the study
reported here support well-documented findings on the decline of positive attitudes to science
and jobs involving science over the period of secondary schooling, with physical sciences
eliciting particularly negative responses and female students less positively disposed than
male students towards science.
The study adds to the growing evidence that attitudes to science outside school are more
positive than attitudes to school science, and that experiences of school science between ages
11-14 are crucial in shaping students’ attitudes and subsequent behaviours in relation to
subject choice. Whilst the decline in positive attitudes between 11 and 14 is of considerable
concern, a more positive feature of the findings is the identification of school science as
exerting the greater influence, as what students experience in their science lessons is easier to
control than what they experience of science outside school.
Page 63 of 110
URL: http://mc.manuscriptcentral.com/tsed Email: [email protected]
International Journal of Science Education
123456789101112131415161718192021222324252627282930313233343536373839404142434445464748495051525354555657585960
For Peer Review O
nly
32
The principal justification for developing the new instrument was to go beyond descriptive
data to probe for explanations and insights that, in turn, might point to possible areas to target
for action. What, therefore, has emerged from the explanatory (Level 2) data, and what
messages emerge for future research, and for policy and practice?
The Level 2 data points to particular features of lessons being important, with younger
students citing ‘being made to think’, variety in activity and seeing how science relates to life
as the reasons for this. Many curriculum materials now do contextualise science, but rather
less is known about the range of activities teachers use in science lessons and their effects.
The notion of what students see as activities that make them ‘think’ in science lessons would
certainly benefit from further exploration, given that older students cite the ‘hard’ nature of
science subjects as a reason for not wanting to study them. It would be useful to have more
information on where the boundaries lie between ‘being made to think’ and ‘hard’. As most
students study ‘science’ in the early years of secondary schooling, it is important to explore
these dimensions in relation to the different scientific disciplines, as each has a different
problem. Interest in physics remains consistently low, interest in biology increases, and the
science reported as most interesting at age 11 - chemistry - shows the sharpest decline. The
perception of ‘hardness’ also poses a challenge to policy: if students believe that there are
greater rewards in terms of external examination grades for effort put into subjects other than
the physical sciences, and reviews of examination grades have confirmed that it is more
difficult to achieve higher grades in these subjects, then there is a need to examine carefully
the subject content of science curricula, and ways in which national tests and examinations
are graded.
Page 64 of 110
URL: http://mc.manuscriptcentral.com/tsed Email: [email protected]
International Journal of Science Education
123456789101112131415161718192021222324252627282930313233343536373839404142434445464748495051525354555657585960
For Peer Review O
nly
33
Other insights to emerge from the explanatory data point to features of the curriculum which
might usefully benefit from strengthening or from a different emphasis. Young people,
particularly female students, appear to become less clear-cut in their views as they mature,
and feel they need more information before they can reach views in relation to, for example,
wanting a job involving science, or knowing whether science can help solve environmental
and social problems. One area to target for action would be to look carefully at how
information about jobs involving science might feature in curriculum materials, both in
relation to the jobs themselves and in the context of the view of scientists being seen as
‘uncaring’. It may well be that the links between contextualising science, on which students
report favourably, and jobs involving science need to be made more overtly, as they are not as
apparent to students as they are to those developing materials for use in lessons. Moreover, a
factor strongly influencing those students aged 16 who wanted a job as a scientist was a belief
that scientists could change the world for the better. Thus it would be useful to provide more
information on the contribution scientists make to society.
Looking more widely at the nature of research on attitudes to science, we believe the
instrument developed for this study has a number of strengths: considerable care has been
taken in its design and validation, it combines the ability of a survey to gather large datasets
on general patterns with the explanatory insights normally drawn from interviews into an
easy-to-administer pencil-and-paper instrument, its language draws on ‘the student voice’,
and it probes for explanatory insights as well as establishing general patterns. However, the
gathering both descriptive and explanatory data in this way does generate extensive data
which, in turn, leads to challenges in analysis and reporting.
We also believe that the study points to the future direction of attitude research. Well-
designed instruments certainly have a role to play in surveying attitudes, but their principal
Page 65 of 110
URL: http://mc.manuscriptcentral.com/tsed Email: [email protected]
International Journal of Science Education
123456789101112131415161718192021222324252627282930313233343536373839404142434445464748495051525354555657585960

For Peer Review O
nly
34
strength lies in providing the ‘board brush stokes’ of the picture, rather than providing much
of the detail that might point to action. There is much in the study reported here that suggests
there is little overlap between students’ perceptions of science and their perceptions of
themselves and their own identity. This area would be worth probing in more detail. There is
also evidence that some schools that are much more effective than others at encouraging
uptake of particular subjects. For example, Fitzgibbon (1999) established significant inter-
school variations in the UK in numbers of students electing to study mathematics beyond the
compulsory period, and her finding suggested that there might be similarities with the
sciences in factors underlying student choice. Recent reports of studies of schools (Ponchaud,
2006; National Strategies, 2008) suggests that school-based factors, such as enthusiastic
teaching by specialist teachers, and provision of good information about the value and
flexibility of science qualifications, can exert significant effects on uptake of science.
Moreover, some of the factors that may promote more positive attitudes to science may not be
apparent to students and therefore not easily accessible through attitudinal instruments. Thus,
we contend that the priority for research on attitudes to science is to explore in more detail
features of schools that are more - and less - successful at encouraging uptake of science
beyond the compulsory period.
References
Aikenhead, G. & Ryan, A. (1989) The development of a multiple choice instrument for
monitoring views on Science-Technology-Society topics. Final report of SSHRCC Grant.
Saskatoon: University of Saskatchewan, Department of Curriculum Studies.
Aikenhead, G. & Ryan, A. (1992) The development of a new instrument: Views on Science-
Technology-Society. (VOSTS) Science Education, 76 (4), 477-491.
Page 66 of 110
URL: http://mc.manuscriptcentral.com/tsed Email: [email protected]
International Journal of Science Education
123456789101112131415161718192021222324252627282930313233343536373839404142434445464748495051525354555657585960

For Peer Review O
nly
35
Author 1 (2001) Science with attitude: the perennial problem of pupils’ responses to science.
School Science Review, 82 (300), 59-70.
Author 1 & Author 2. (2005) “Would YOU want to talk to a scientist at a party?”: Students’
attitudes to school science and science. University of York, Department of Educational
Studies: Research Paper Series No 8. (www.york.ac.uk/depts/educ/ResearchPaperSeries).
York: University of York. (Project report from study sponsored by the Salters’ Institute
of Chemical education.)
Blalock, C., Lichtenstein, M., Owen, S., Pruski, L., Marshall, C. and Toepperwein, M. (2008)
In pursuit of validity: a comprehensive review of science attitude instruments 1035-2005.
International Journal of Science Education, 30 (7), 961-977.
Cerini, B., Murray, I & Reiss, M. (2004) Student review of the science curriculum. London:
Planet Science.
Coe, R., Searle, J., Barmby, P., Jones, K, and Higgins, S. (2008) Relative difficulty of
examinations in different subjects. Durham: Centre for Educational Management.
Crawley, F.E. & Koballa, T.R. (1994). Attitude research in science education: contemporary
models and methods. Science Education. 78 (1), 35-56.
DfES. (2006) The Supply and Demand for Science, Technology, Engineering and
Mathematics Skills in the UK Economy. Retrieved December 2006 from
http://www.dfes.gov.uk/research/data/uploadfiles/RR775.pdf
European Commission (2004) Europe needs more scientists: increasing human resources for
science and technology in Europe. Luxembourg: Office for Official Publications of the
European Communities.
Fitzgibbon, C. T. (1999) Long-term consequences of curriculum choices with particular
reference to Mathematics and science. School Effectiveness and School Improvement, 10
(2), 217-232.
Page 67 of 110
URL: http://mc.manuscriptcentral.com/tsed Email: [email protected]
International Journal of Science Education
123456789101112131415161718192021222324252627282930313233343536373839404142434445464748495051525354555657585960

For Peer Review O
nly
36
Galton, M., Gray. J. & Ruddock, J. (2003). Transfer and transitions in the middle years of
schools (7-14): continuities and discontinuities in learning. Department for Education and
Skills (DfES) research report No. 443. London: HMSO.
Gardner, P. (1975) Attitudes to science: a review. Studies in Science Education, 2, 1-41.
Haste, H. (2004) Science in my future: a study of values and beliefs in relation to science
and technology amongst 11-21-year-olds. Nestlé Social Research programme Report No.
1. London: Nestlé Social Research Programme.
Hyam, H. (2006) Increasing uptake of science post-16: report of a Royal Society conference.
London: The Royal Society.
Jenkins, E. & Nelson, N. (2005) Important but not for me: students’ attitudes towards
secondary school science in England. Research in Science and Technological Education,
23 (1), 41-57.
Johnson, S. (1987) Gender differences in science: parallels in interest, experience and
performance. International Journal of Science Education. 9 (4), 467-481.
Kelly, A. (1986) The development of children’s attitudes to science. European Journal of
Science Education, 8 (4), 399-412.
Misiti, F., Shrigley, R. & Hanson, L. (1991) Science attitude scales for middle school
students. Science Education. 75 (5), 525-540.
Munby, H. (1990) Attitude: invited commentary. Science Education, 74 (3), 377-381.
Munro, M. & Elsom, D. (2000) Choosing Science at 16: The influence of science teachers
and careers advisers on students’ decisions about science subjects and science and
technology careers. Cambridge: CRAC.
National Strategies (2008) Progression to post-16 science: an enquiry into the factors which
are influential in achieving high levels of take-up of science subjects post-16. London:
Department for Children, Schools and Families.
Page 68 of 110
URL: http://mc.manuscriptcentral.com/tsed Email: [email protected]
International Journal of Science Education
123456789101112131415161718192021222324252627282930313233343536373839404142434445464748495051525354555657585960

For Peer Review O
nly
37
OCR Examination Board (2005) Science Student Survey Results www.ocr.org.uk (accessed
23 April 2006).
Organisation for Economic Co-operation and Development [OECD] (2006) Evolution of
student interest in science and technology studies policy report. Paris: OECD.
Ormerod, M. & Duckworth, D. (1975) Pupils’ attitudes to science: a review of research.
London: NFER.
Osborne, J. & Collins, S. (2001) Pupils’ views of the role and value of the science
curriculum. International Journal of Science Education, 23 (5), 441-467.
Osborne, J., Driver, R. & Simon, S. (1998) Attitudes to science: issues and concerns. School
Science Review, 79 (228), 27-33.
Osborne, J., Simon, S. & Collins, S. (2003) Attitudes towards science: a review of the
literature and its implications. International Journal of Science Education, 25 (9), 1049-
1079.
Piburn, M. & Baker, D. (1993) If I were the teacher: qualitative study of attitude towards
science. Science Education. 77 (4), 393-406.
PricewaterhouseCoopers LLP (2005) The economic benefits of higher education
qualifications: a report produced for the Royal Society of Chemistry and the Institute of
Physics. London: RSC/IoP.
Ponchaud, B. (2006) Showcasing success in science education. Education in Science, 218,
8-9.
Qualter, A. (1993) I would like to know more about that: a study of the interest shown by
girls and boys in scientific topics. International Journal of Science Education. 15 (3),
307-317.
Ramsden, J. (1998) Mission impossible: can anything be done about attitudes to science?
International Journal of Science Education, 20 (2), 125 - 137.
Schibeci, R. (1984) Attitudes to science: an update. Studies in Science Education, 11, 26-59.
Page 69 of 110
URL: http://mc.manuscriptcentral.com/tsed Email: [email protected]
International Journal of Science Education
123456789101112131415161718192021222324252627282930313233343536373839404142434445464748495051525354555657585960

For Peer Review O
nly
38
Schreiner, C. & Sjøberg, S. (2004) Sowing the seeds of ROSE. Background, rationale,
questionnaire development and data collection for ROSE (The Relevance of Science
Education) - a comparative study of students' views of science and science education.
Oslo: Dept. of Teacher Education and School Development, University of Oslo.
Simon, S. (2000) Students’ attitudes towards science. In M. Monk & J. Osborne (eds) Good
practice in science teaching: what research has to say. Buckingham: Open University
Press.
Simpson, R. & Oliver, J. (1990). A summary of major influences on attitude towards
achievement in science amongst adolescent students. Science Education. 74 (1), 1-18.
Sjøberg, S. & Schreiner, C. (2005) Update on the ROSE project: students perceptions of
science and technology. IOSTE newsletter, 8 (1), 7-10.
Smail, B. & Kelly, A. (1984) Sex differences in science and technology among 11-year-old
schoolchildren: II-affective. Research in Science and Technological Education. 2 (2), 87-
106.
Storage of the original data
All the original data are stored at [to be added].
The full report and instrument
The full report and instrument may be accessed at: [to be added].
Acknowledgements
[To be added.]
Page 70 of 110
URL: http://mc.manuscriptcentral.com/tsed Email: [email protected]
International Journal of Science Education
123456789101112131415161718192021222324252627282930313233343536373839404142434445464748495051525354555657585960
For Peer Review O
nly
1
Would YOU want to talk to a scientist at a party? High school students’ attitudes to
school science and to science
Abstract
This paper describes a four-year project involving the development of a new instrument, the
Attitudes to School Science and Science instrument, and its use to collect baseline attitudinal
data from 280 students aged 11, 14 and 16. A key feature of the instrument is that it collects
both descriptive and explanatory data in a pencil-and-paper format. The data gathered is
probed in detail for explanatory insights into features that have emerged from more recent
research on attitudes to science, in particular the suggestions that students view science
outside school more positively than their experiences in science lessons, and that the early
years of secondary education (ages approximately 11 to 14) are the most crucial in shaping
attitudes. The study shows that positive attitudes to school science decline significantly
between the ages of 11 and 14, with little appreciable downward change beyond this and, in
some cases, a slight upturn. Female students display less positive attitudes and less clear-cut
views on a variety of aspects of science. A sense of science being important in general terms,
though not having much appeal for individual students, also emerged clearly from the data.
The paper suggests that attitudinal instruments have a role to play in research, but that these
need to be complemented by studies of detailed features of schools that may influence
attitudes, some of which may not be apparent from data collected from students.
Introduction
What views might a class of sixteen-year-olds have about science? Here is a selection of
comments from students involved in the study reported here:
Page 71 of 110
URL: http://mc.manuscriptcentral.com/tsed Email: [email protected]
International Journal of Science Education
123456789101112131415161718192021222324252627282930313233343536373839404142434445464748495051525354555657585960

For Peer Review O
nly
2
“We use science for everything. We ARE science.”
“Science is important because modern society is built entirely around the scientific
advances of recent centuries.”
“Science causes problems in the first place, so how can it get rid of them?”
“Would YOU want to talk to a scientist at a party?”
Most people involved in science education would probably be very pleased if any sixteen-
year-old they knew made one of the first two comments. Sadly, it is the case that far too
many young people are likely to have more empathy with the last two comments. Such
comments also serve only to reinforce the considerable disquiet felt in the science education
community and beyond over the numbers of students taking science subjects, particularly
chemistry and physics, in post-compulsory education in a number of countries. It would seem
that there is widespread disenchantment amongst young people, who are ‘voting with their
feet’ and turning away from science when they have a choice. In England and Wales, for
example, where the study reported here was undertaken, data from public examination entries
show that the percentage of young people choosing to study physical science subjects at
Advanced level (the first point of choice at age 16+) fell by 2.1% in the period 2001-2005 for
chemistry, and by 14% for physics (Hyam, 2006), continuing a steady downward trend that
has yet to be reversed. Such patterns are not unique to the UK, and it is therefore unsurprising
that concerns about participation in science feature prominently in current debates over policy
and practice in science teaching in a number of countries, as reflected in publications such as
Europe needs more scientists (European Commission, 2004), Evolution of student interest in
science and technology (Organisation for Economic Co-operation and Development [OECD],
2006), and The supply and demand for science, technology, engineering and mathematics
skills in the UK economy (Department for Education and Skills, 2006). The recent focus on
Page 72 of 110
URL: http://mc.manuscriptcentral.com/tsed Email: [email protected]
International Journal of Science Education
123456789101112131415161718192021222324252627282930313233343536373839404142434445464748495051525354555657585960
For Peer Review O
nly
3
numbers choosing science in the post-compulsory period of study reflects a longstanding
concern about levels of participation. Underpinning this is the notion that attitudes to science
are crucial, as they are a major determinant of subject choice.
Research on attitudes to science
The research on attitudes to science is extensive, and the ‘broad brushstroke’ findings are
well-known: science is perceived as difficult and not relevant to the lives of most people,
interest in science declines over the years of secondary schooling, science is more attractive to
male students than female students, and problems being most acute in the physical sciences.
These findings have emerged as relatively constant features in a number of countries over the
past four decades, and are well-documented in a literature that including several detailed
review articles (e.g. Gardiner, 1975; Ormerod and Duckworth, 1975; Schibeci, 1984; Munby,
1990; Ramsden, 1998; Osborne et al., 2003).
Whilst to a large extent more recent studies confirm earlier findings, some new slants have
emerged that appear worthy of further probing. The most noticeable of these is neatly
encapsulated in the title given by Jenkins and Nelson (Jenkins and Nelson, 2005): “Important
but not for me.” Jenkins and Nelson were reporting the UK data from a large and ongoing
comparative international survey of students aged 16, the Relevance of Science Education
(ROSE) project, which began in 2001 and involves over 30 countries (Schreiner and Sjøberg,
2004; Sjøberg and Schreiner, 2005). The ROSE data indicate that a general appreciation of
the value of science outside school is not reflected in responses about enjoyment of science in
school, or a desire to have jobs involving science. This message is echoed in other studies.
Osborne and Collins (2001) showed sixteen-year-old students to believe science was an
important subject in the school curriculum, but more for career purposes for those interested
Page 73 of 110
URL: http://mc.manuscriptcentral.com/tsed Email: [email protected]
International Journal of Science Education
123456789101112131415161718192021222324252627282930313233343536373839404142434445464748495051525354555657585960

For Peer Review O
nly
4
in science than because of intrinsic interest. In a similar vein, Haste (2004) found young
people emerged from compulsory schools with a moderately positive image of science and
technology outside school, but with far less interest in jobs in science.
Newer studies are also contributing to a growing body of evidence that points to attitudes to
science declining most sharply in the early years of secondary education (Galton et al., 2003),
a decline that is more appreciable in for science other school subjects. This period has also
emerged as crucial in relation to the impact of science teachers on students’ views of science
and careers involving science (Osborne and Collins, 2001; Cerini, Murray and Reiss, 2004;
Munro and Elsom, 2000).
The literature on attitudes to science has also signalled a number of methodological concerns
about work in the area. Principally, these relate to poor instrument design and analysis,
including failure to address matters of reliability and validity, the plethora of existing
instruments, many of which are limited in use to a single study, and failure to draw on ideas
from psychological theory (e.g. Gardiner, 1975; Ormerod and Duckworth, 1975; Schibeci,
1984; Munby, 1990; Ramsden, 1998; Osborne et al. 1998; Simon, 2000; Osborne et al., 2003;
Blalock et al., 2008). One message emerging from these reviews is that of caution over the
need to develop yet another instrument, given the number that already exists. A further issue
to emerge concerns the nature of the way in which data are gathered. A consistent feature of
attitude research is the use of fixed-response inventories and scaling techniques to gather data.
Of these, Likert-type scales predominate (for example, Haste, 2004; Kelly, 1986; Misiti, et
al., 1991; Qualter, 1993; Simpson and Oliver, 1990; Sjøberg and Schreiner, 2005), though
others, such as Thurstone-type rating scales (for example, Johnson, 1987; Smail and Kelly,
1984) and semantic differential scales (for example, Crawley and Koballa, 1994) have also
been used. Much more limited use has been made of interviews (for example, Piburn and
Page 74 of 110
URL: http://mc.manuscriptcentral.com/tsed Email: [email protected]
International Journal of Science Education
123456789101112131415161718192021222324252627282930313233343536373839404142434445464748495051525354555657585960

For Peer Review O
nly
5
Baker, 1993) and, more recently, focus groups (Osborne and Collins, 2001). One outcome of
a heavy reliance on fixed-response inventories is that much attitude data is characterised by an
emphasis on descriptions of ‘the problem’, with rather less attention paid to possible
explanations.
The purpose of this study
The study reported here involves the development and use of a new instrument to gather data
on attitudes to science, characterised by two particular features in relation to the instrument
design. Firstly, it sought to develop a ‘pencil-and-paper’ instrument that moved beyond the
largely descriptive data generated by most other survey instruments to probe for explanations
of particular responses. Secondly, steps were incorporated into the development of the
instrument to address a number of common problems the literature has identified in attitudinal
instruments. The nature of the data generated by the instrument does not lend itself to the
rigours of statistical methods often followed in the design and development of attitudinal
instruments. However, probing for explanations offers the potential to yield deeper insights
into areas to target for possible action.
The aims of the study were as follows:
• to design an instrument to enable both descriptive (Level 1) and explanatory (Level 2)
data to be gathered on students’ affective responses, or attitudes, to science;
• to use the instrument to gather baseline data from school students aged 11, 14 and 16.
Within the context of these overall aims, the study also sought to explore in more depth some
of the new slants emerging from more recent work on attitudes by looking, firstly, at possible
differences between responses to science in school and science outside school, and, secondly,
Page 75 of 110
URL: http://mc.manuscriptcentral.com/tsed Email: [email protected]
International Journal of Science Education
123456789101112131415161718192021222324252627282930313233343536373839404142434445464748495051525354555657585960

For Peer Review O
nly
6
at changes in attitudes in the early years of secondary schooling. The study did not set out to
look specifically at differences between the responses of male and female students, but the
number of significant gender differences that emerged in the analysis suggested it would be
important to include these in a report of the findings. Equally, though the study did not set
out to look specifically at differences in responses in groups of differing ability, data on
ability were collected. This was because a particular concern about levels of participation is
the number of able and well-qualified students electing not to study science in the post-
compulsory period, and it seemed useful to look for any particular patterns in attitude and
ability. However, as none emerged, these data are not reported here, other than in
characterising the sample.
The development of the research instrument
The design of the instrument adapted the approach developed in the Views on Science-
Technology-Society (VOSTS) study, undertaken in Canada in the late 1980s to document the
views of upper high school students (aged 16-17) on science-technology-society topics
(Aikenhead and Ryan, 1989; 2002). Underpinning the VOSTS approach was the belief that
attitudinal survey instruments most usually reflect the perceptions of the developers, rather
than the respondents, on the likely influences. Thus an instrument that draws n students’
views in its development is likely to generate more valid data. In essence, the VOSTS
approach involved the empirical development of a fixed response item pool based on views
expressed by the students. This was achieved through presenting students with a series of
statements on aspects of science, technology and society, and inviting free responses.
Common themes within these responses then formed the basis of categories for the fixed-
response version of the instrument. The VOSTS approach had two particular attractions.
Firstly, the options in the fixed-response instrument drew directly on the words of the
Page 76 of 110
URL: http://mc.manuscriptcentral.com/tsed Email: [email protected]
International Journal of Science Education
123456789101112131415161718192021222324252627282930313233343536373839404142434445464748495051525354555657585960

For Peer Review O
nly
7
students, and, secondly, through the use of a pencil-and-paper instrument, it offered the
potential to probe for explanatory data from a large dataset.
The development of the research instrument involved six steps, summarised in Table 1.
Table 1 about here
Stage 1 yielded responses in a number of areas including: response to science lessons (teacher
effects, views of particular activities, views of different branches of science); views of social
implications of science (from school science and experiences outside school); views of
teacher characteristics; views of learning situations; views of science as presented in the
media; views of scientists and their work. These areas were divided into the two broad
categories of responses to school science and responses to science outside school.
Stage 2 involved the development of a series of statements relating to school science and
science outside the classroom. These took the form of disposition statements, i.e. responses
were indicative of attitude to science or school science. An initial pool of around 40 items
was reduced to 25 through a series of peer validation meetings involving approximately
twenty-five science educators and teachers. These statements are shown in Table 2.
Table 2 about here
In Stage 3, each of the statements was in a form which invited students to respond on a Likert-
type scale (strongly agree/agree/neutral/ disagree/strongly disagree) to indicate their view,
followed by a request to explain, as a free response, their reasons for holding this view.
Page 77 of 110
URL: http://mc.manuscriptcentral.com/tsed Email: [email protected]
International Journal of Science Education
123456789101112131415161718192021222324252627282930313233343536373839404142434445464748495051525354555657585960

For Peer Review O
nly
8
The first step in Stage 4 involved the free responses being independently categorised into
groups by two members of the research team. There was over 90% agreement on
categorisation. Each category of response was summarised in a sentence, drawing as closely
as possible on the words used students’ written responses. These then formed the basis of the
fixed responses to the disposition statements. Typically, an item would have between eight
and ten fixed response options. A sample fixed-response item is shown in Figure 1.
Figure 1 about here
Once students had selected their Level 1 response (agree/neither agree nor disagree/disagree),
they were invited to select as many of the Level 2 responses as they felt applied to them. The
instrument thus enables responses to be gathered at two levels: Level 1 responses indicate
agreement or otherwise with the disposition statement, and Level 2 responses probe for
explanations.
Validation of the trial fixed-response items took place approximately three months after the
collection of the free responses. The process involved asking the same classes of students
who had originally given free responses to complete eight fixed-response items, with items
being distributed to students in such a way that at least ten responses per item were collected.
The responses selected by the students on the fixed-response item were then compared with
the original free response. The very good agreement (85%) between free responses and the
fixed-response options is a measure of the reliability of the items. Short interviews with
students where differences had emerged established that these students had not originally held
any particularly strong view.
Page 78 of 110
URL: http://mc.manuscriptcentral.com/tsed Email: [email protected]
International Journal of Science Education
123456789101112131415161718192021222324252627282930313233343536373839404142434445464748495051525354555657585960
For Peer Review O
nly
9
To maximise the validity of the range of Level 2 responses, each item offered the options of
not selecting any of the fixed responses offered, but giving “another reason – please say
what”. The intention was to look for any further patterns emerging in from these options and
add them to the options offered. In practice, though between three and five students per item
selected “another reason”, the reasons were very varied and no consistent patterns emerged. It
was decided to leave the “another reason ...” option in the final version of the instrument to
allow student to express different views if they so wished.
Stage 5 involved the trial of the instrument. Four classes in two schools participated in the
trial, such that data were gathered from 91 students in two classes aged 11 and two aged 16.
This enabled the instrument to be tested with students at the upper and lower ends of the target
age range.
Content validity was assessed by the following procedure. At the point where their students
completed the instrument, the class teacher was asked to indicate their view of each student’s
attitude to science on a five point scale, where a score of five represented a very positive
attitude, and a score of one represented a very negative attitude. A numerical total was then
calculated for each student based on their responses to the instrument. Any ‘agree’ options
selected were given a score of three, ‘neither agree nor disagree’ options were given a score of
two, and ‘disagree’ options a score of one. Whilst there are drawbacks to assigning numerical
scores to Likert-type responses, it was felt that these were outweighed by the advantages of
having some indicator of the validity of the instrument in gauging attitudes to school science
and to science. Visual inspection of the scattergrams of the teacher scores for students’
attitude and the students’ score on the instrument showed a good line of fit, and there were no
instances where the instrument had indicated a negative attitude and the teacher had indicated
a positive attitude. In a limited number of instances (10%), the instrument indicated a positive
Page 79 of 110
URL: http://mc.manuscriptcentral.com/tsed Email: [email protected]
International Journal of Science Education
123456789101112131415161718192021222324252627282930313233343536373839404142434445464748495051525354555657585960

For Peer Review O
nly
10
attitude whilst the teacher had indicated a negative attitude. Conversations with the teachers
showed that these cases tended to be students who were seen as not very hard-working by the
teachers, and that this influenced their view of the students’ attitude.
Details of the full instrument may be accessed from the web-link at the end of this paper.
The main study: the sample and methods of analysis
The instrument was used to gather baseline data in a survey of 280 school students in four all-
ability (mixed comprehensive) secondary schools in late April 2004. Two of the schools were
in a comparatively small city, one in a town and one in a semi-rural area. For ease of
administration, data were collected from whole-class sets. All the students were following
conventional science courses of similar content prescribed in external, national specifications.
None was following courses linked to any new intervention. The instrument was
administered to three cohorts of students aged 11, 14 and 16. These are the first, third and
fifth (final) years of compulsory secondary schooling in England and Wales, and the study of
science is compulsory throughout this age range.
Data on students’ ability levels were obtained based on actual or estimated results from
external tests and examinations, these being the only external measures of ability common
across all schools. Internal measures lack reliability as they are based on tests developed
within schools. These were Standard Assessment Tasks (SATs) at Key Stage 2 taken by
students taken at age 11 or at Key Stage 3, taken by students at age 14, or General Certificate
of Secondary Education (GCSE) examinations, taken by students at age 16. These measures
were used to designate students as high, middle or low ability. Details of the sample are given
in Table 3.
Page 80 of 110
URL: http://mc.manuscriptcentral.com/tsed Email: [email protected]
International Journal of Science Education
123456789101112131415161718192021222324252627282930313233343536373839404142434445464748495051525354555657585960
For Peer Review O
nly
11
Table 3 about here
Although data were collected from whole class sets, the sample turned out to be balanced in
terms of gender, with just slightly more female students (n=144) than male (n=136). External
measures of ability resulted in the majority of the students in the sample being designated as
middle or high ability. The likely explanation for this is that the external measures used for
ability are not very discriminating in that the majority of student will be placed in one of three
broad bands at age 11 and 14. Overall, however, the sample was felt to be representative of
the group from which it was drawn, as data were collected from classes across the whole
ability range.
Analysis of the non-parametric data was carried out using the SPSS 11 package, and applying
the Chi-squared test to look for significant differences in responses.
Results
The nature of the instrument means that the database developed is extensive, particularly in relation to
the Level 2 responses, and it is beyond the scope of this paper to present and discuss all the findings in
detail. This paper therefore presents the most notable features of the data in six main sections. The
first presents an overview of responses, with the second and third highlighting key features of the data
in relation to school science and science outside school. The next two sections focus on particular
aspects of the data that offer insights into two of the particular foci of the study: differences in
responses to science in school and science outside school, and changes in attitudes in the early years of
secondary schooling. The last section reports a noticeable, though unanticipated, outcome of the
study, a shift in opinion with maturity.
Page 81 of 110
URL: http://mc.manuscriptcentral.com/tsed Email: [email protected]
International Journal of Science Education
123456789101112131415161718192021222324252627282930313233343536373839404142434445464748495051525354555657585960
For Peer Review O
nly
12
Overview of responses
Figure 2 provides a visual overview of the positive responses to each of the items by showing
the percentage of students in each age group who selected ‘agree’ as their Level 1 response
for each item. Figure 3 show the percentages of male and female students who selected
‘agree’ as their Level 1 response for each item. The figures show a noticeable trend for
positive attitudes to items relating to both school science and to science outside school to
decrease overall from age 11 to age 16 and, within this, for female students to hold less
positive attitudes than male students.
Figures 2 and 3 about here
The items where differences in responses were statistically significant at Level 1 (i.e. ‘agree’,
‘neither agree nor disagree’ and ‘disagree’), are summarised in Table 4.
Table 4 about here
Science in school: key features of the data
Responses to science lessons
The number of students reporting that science is amongst their favourite lessons decreases
significantly between the ages of 11 and 14. Within the group saying that science lessons are
amongst their favourite lessons, the Level 2 responses revealed a particularly positive
response to chemistry (85% at age 11, 75% at age 14 and 65% at age 16), linked to a liking of
practical work. Biology became increasingly important in reporting liking of science (45% at
age 11, 75% at age 14 and 77% at age 16), with the difference between ages 11 and 14 being
Page 82 of 110
URL: http://mc.manuscriptcentral.com/tsed Email: [email protected]
International Journal of Science Education
123456789101112131415161718192021222324252627282930313233343536373839404142434445464748495051525354555657585960

For Peer Review O
nly
13
significant (χ2=8.761, p<0.01). Level 2 responses showed that the significant increase
between ages 11 and 14 in students not reporting science as being amongst their favourite
subjects was associated most strongly with increasing dislike of the physical sciences, and
physics, in particular, being cited as ‘hard’.
Responses to individual subjects within science
One particular aspect which generated polarised responses concerned attitudes to the
individual science subjects, probed in items A05 (biology), A06 (chemistry) and A07
(physics).
Each of the subjects appears to have a slightly different problem associated with it.
Interest in biology increases from age 11 to age 14 before decreasing at age 16, though
remaining higher than interest in the physical sciences. In contrast, interest in chemistry and
physics declines between age 11 and 14, and this continues through to age 16. Significantly
more students are interested in chemistry (42%) than in physics (23%) at age 11 (χ2=8.739,
p<0.01). Indeed, chemistry attracts the highest level of interest of all three sciences at this
age. For physics, the problem is that interest is low to begin with, and declines with age,
whereas for chemistry interest is comparatively high initially but characterised by a steep and
statistically significant decline between age 11 and age 14 (χ2=7.713, p<0.01).
Level 2 data showed the most prominent reason for wishing to study biology by two-thirds or
more of students in all age groups at all ages was that students found the subject interesting.
The most common reasons for not wanting to study biology was it not being necessary for the
jobs students had in mind. In common with biology, around two thirds of students in each
age group cited a perceived lack of relevance of chemistry for the jobs they had in mind.
Page 83 of 110
URL: http://mc.manuscriptcentral.com/tsed Email: [email protected]
International Journal of Science Education
123456789101112131415161718192021222324252627282930313233343536373839404142434445464748495051525354555657585960

For Peer Review O
nly
14
However, around two-fifths of students also cited the strategic aspect of obtaining better
external examination grades in other subjects. There was a marked reluctance to study
physics, and this increased steadily with age. While the proportion who wanted to study the
subject did not change greatly, the proportion who disagreed increased significantly. Level 2
responses showed physics being increasingly seen as hard, with significantly more older
students feeling they could get better grades in another subject (34% at age 11 and 53% at age
16; χ2=7.146, p<0.05). Studies of grades achieved in external examinations at age 16 (e.g.
Coe et al., 2008) have indicated that it is more difficult for student to achieve higher grades in
the physical sciences than in other subjects, so it would seem that students’ perceptions of
levels of difficulty are accurate, and exert a considerable influence on their subject choices.
Gender patterns in responses to science subjects were significant, conforming to the widely
reported differences of girls being more favourably inclined towards biology and boys
towards the physical sciences. Level 2 responses indicated that all three science subjects were
perceived as significantly harder by female students than male students. Though significantly
more female students than male students felt they did not see the point of the things they did
in chemistry, significantly more of the female students who viewed the subject positively did
so for carer reasons, suggesting that subject ‘hardness’ is more likely to be tolerated if it has
potential utility for future jobs.
Teacher effects
Two items offered interesting insights into students’ responses to their experiences in science
lessons: A03: My science teachers make me more interested in science, and A04: The things
we do in science lessons make me more interested in science.
Page 84 of 110
URL: http://mc.manuscriptcentral.com/tsed Email: [email protected]
International Journal of Science Education
123456789101112131415161718192021222324252627282930313233343536373839404142434445464748495051525354555657585960

For Peer Review O
nly
15
A03 elicited a very positive response at age 11, with 49% of students agreeing with the
statement, but responses dropped significantly by age 14 to 31% and remained at this level at
age 16. Level 2 responses demonstrated a range of ways in which teachers created interest in
science. For the two younger age groups, almost three-quarters of students cited a variety of
activities as being very important, with “being made to think” being cited by 60% of student
aged 11. Explaining things clearly was important for over half of all ages, and was the most
common response at age 14, with significantly more female students than male students in
each age group citing this as important (F=74%, M=41%; χ2=11.660, p<0.001). Similarly
female students were more likely than male students to report their interest in science being
influenced by their teachers’ enthusiasm (F=48%, M=37%; χ2=3.869, p<0.05).
Item A04 elicited the most positive responses of all the items about school science, with 60%
of students aged 11 agreeing that the things they did in their lessons made them more
interested in science. This figure remained comparatively high for all age groups. The Level
2 explanation most frequently selected by all age groups was enjoyment of practical work. In
contrast interest in investigations tailed off significantly. One striking feature of the responses
was the significant decrease in enjoyment of group work linked to presentations (age
11=65%, age 16=30%; χ2=12.917, p<0.01). This may suggest that the introduction of such
tasks into science courses and lessons needs sensitive handling if students are to feel the
activities are of benefit to them.
Taken together, the responses to these items point to teachers, and the activities they choose to
use in lessons, playing a particularly influential role at age 11, and thus having the potential to
make a crucial difference in the early years of secondary schooling.
Page 85 of 110
URL: http://mc.manuscriptcentral.com/tsed Email: [email protected]
International Journal of Science Education
123456789101112131415161718192021222324252627282930313233343536373839404142434445464748495051525354555657585960
For Peer Review O
nly
16
The importance of science in the curriculum
Exceptions to the trend of decreasing overall positive attitudes to school science were the two
items relating to the importance of science in the curriculum, A10: Everybody should study all
three science subjects up to age 16, and A11: When they have a choice, young people should
be given particular encouragement to study science subjects. Level 2 data showed that over
one-third of students in all age groups agreeing with A10 felt science was an important part of
a good general education. However significantly more of the students agreeing with this item
at age 16 also said that they thought there was too much science on the timetable (age
11=13%, age 16=45%; χ2=11.319, p<0.01). Level 2 data for A11 showed high proportions of
students who agreed with the statement supporting the view that science affects so much in
everyday life. However there was a significant drop in the proportion of students selecting
this option at age 16 (age 11=94% at 11, age 16=63%; χ2=15.065, p<0.001). Almost all
students felt science leads to good jobs, and around half cited the importance of training the
scientists of the future.
One feature these two statements share in common is that they are less personal than the other
statements about science in school. The responses suggest that students approaching the end
of their compulsory period of studying science at school place some general value on the
study of science, whilst not necessarily finding it sufficiently interesting and engaging
themselves to want to pursue their studies of science subjects. This finding is supported by
responses to item A09: What we do in science lessons is useful whatever you do after you
leave school. At all ages, this item was one of the top three items about school science to get
a Level 1 response of ‘agree’. Level 2 data showed that many students felt science helped
people understand the world they live in, though there was a significant difference in
Page 86 of 110
URL: http://mc.manuscriptcentral.com/tsed Email: [email protected]
International Journal of Science Education
123456789101112131415161718192021222324252627282930313233343536373839404142434445464748495051525354555657585960
For Peer Review O
nly
17
responses that demonstrated a dip in this view from age 11 to age 14 (age 11=84%, age
14=67%; χ2=7.455, p<0.05).
Science outside school: key features of the data
The overall pattern shows that attitudes to science outside school are less positive at age 16
than age 11, with four items (B04, B06, B07 and B08) showing significant decreases in
positive responses. With the exception of B02: I like reading about science in newspapers
and magazines, male students were more positive than female students in their responses to
science outside school, with three items (B08, B11 and B14) showing significant differences.
Four items (B08, B10, B11 and B13) also showed significant differences in neutral responses,
with more female students than male students selecting the ‘neither agree nor disagree’
options.
Science as presented in the media
Responses to items about science as presented in the media (B01, B02, B03) were not very
positive, with less than one-third of students in all age groups selecting ‘agree’ as their Level
1 response. Level 2 explanations for those students who were positive about watching science
programmes on TV (B01) indicated between half and three-quarters of students reported that
the programmes made them more interested in science, and similar proportions found that
they helped understanding of school science understanding, and seeing how science is used in
the real world. Half to three-quarters of the students disagreeing with the statement declared
they would never watch a TV programme about science. This lack of interest was also
reflected in responses to B02: I like reading about science in newspapers and magazines,
where the overwhelming majority of students - over 70% in each age group - said that they
Page 87 of 110
URL: http://mc.manuscriptcentral.com/tsed Email: [email protected]
International Journal of Science Education
123456789101112131415161718192021222324252627282930313233343536373839404142434445464748495051525354555657585960

For Peer Review O
nly
18
never read anything to do with science in newspapers and magazines. Of those students who
selected ‘agree’ as their Level 1 response to B03: News items about science interest me, the
majority thought that it was important to learn about things that could affect them. However,
two-thirds of the much larger numbers who disagreed in each age group reported never
bothering with news items about science. It is clear from these responses that items in the
media about science do little to engage most students.
Reading about science
Item B02 (see above), together with B04: I like reading science books other than science
textbooks, focuses on reading. Both statements did not elicit particularly positive responses at
age 11, and became even less positive with age, B04 significantly so. Around 15% of
students aged 11 responded positively to B02, and this figure halved by age 16. The
responses to B04 demonstrate that few students are interested in reading science books. What
interest there was dropped off sharply between age 11 (26%) and age 14 (9%), declining
further by age 16 (6%), where just short of half the students explicitly disagreeing with the
statement. Wildlife books were the most interesting for three-quarters of students at age 11
and just under half liked science fiction. Close to half of the students at age 11 also related
their extra-curricular science reading to their science lessons, both in terms of helping them
understand the science they were studying and seeing the relevance of what they did in
science lessons. By age 16, these responses had virtually disappeared, with almost half the
students report that they would never choose to read science books because they are so
boring. These findings indicate the majority of young people’s leisure reading rarely involves
books on science.
Page 88 of 110
URL: http://mc.manuscriptcentral.com/tsed Email: [email protected]
International Journal of Science Education
123456789101112131415161718192021222324252627282930313233343536373839404142434445464748495051525354555657585960

For Peer Review O
nly
19
Careers in science
Items B06 and B07 focused on careers in science, with B06 asking about liking a job
involving science, and item B07 asking about being a scientist. Both showed significant
differences in results. For item B06, students aged 11 were equally divided amongst
agree/neutral/disagree. By age 14, there was a very low positive response (15%) and a very
high negative response (60%) (χ2=11.863, p<0.01). However this was reversed to some
extend by age 16, where close to one quarter of students were positive about the idea and just
less than half opposed. The most frequent reason given by three-quarters of students in the
Level 2 data, irrespective of age, was that there are good jobs available in science. Around
60% of students at age 11 and 14 explained their Level 1 agree responses by citing enjoyment
of science at school, but this was of less relevance at age 16 (39%) than the perception of jobs
as well-paid (61%). Finding science ‘boring’ appears, fairly predictably, to be the most
common reason for lack of interest is taking up a science-based job, cited by three-quarters of
students in all age groups.
For item B07: It would be good to have a job as a scientist, there was a highly significant
change of views over the early years of secondary schooling (age 11=41%, age 14=10%;
χ2=33.180, p<0.001), a change of view sustained at age 16 (14%). Level 2 data pointed to a
range of factors being of influence, particularly at age 11, where students cited the nature of
the work, remuneration and the view that scientists can have a positive influence on the world.
These responses suggest that younger students have a generally positive overview of science
as a job or career. Relatively few students at age 14 or 16 agreed with the statements, though,
of those that did, by far the most common explanation (over two-thirds at each age) was that
they felt that scientists were people who could change the world for the better. The most
common Level 2 explanation for students at age 16 was that scientists had well-paid jobs.
The Level 2 data for students disagreeing with B07 showed they had a wide range of negative
Page 89 of 110
URL: http://mc.manuscriptcentral.com/tsed Email: [email protected]
International Journal of Science Education
123456789101112131415161718192021222324252627282930313233343536373839404142434445464748495051525354555657585960

For Peer Review O
nly
20
opinions of scientists, with the two most prominent views in all age groups being that
scientists do boring jobs (two-third or more of students) and are a bit weird (just over half of
students). Scientists were also seen as uncaring by around two-fifths of students in each age
group, with a similar proportion also seeing scientists as causing problems in the world, and
as risk takers. The findings suggest that, for the majority of students, there is little overlap
between their perceptions of themselves and of scientists.
The positive responses to the items about jobs in science point to two rather different factors
being particularly influential for those attracted to jobs in science. For some, the attraction is
linked to altruistic notions of being able to make a difference for the better to the world,
whilst, for others, there is the more pragmatic attraction of seeing jobs involving science as
being well-paid. The perception is of interest in the context of the findings of a survey of
graduate earning potential in a range of disciplines undertaken in the UK for the Royal
Society of Chemistry and the Institute of Physics (PricewaterhouseCooper, 2005). This
showed that graduates with degrees in physics and chemistry, though not necessarily working
in science-related careers, had the fourth and fifth highest earning potential after medicine,
law and engineering. If students’ choice of subjects to study is influenced by their beliefs
about potential earnings, as the work reported here suggests, then there would appear to be a
case for ensuring that they are aware of the possible financial benefits of studying science
subjects.
Is science misrepresented?
There was a highly significant drop between age 11 (43%) and age 14 (26%) in the proportion
of students agreeing with B08: Science is blamed for things that are not its fault, with little
further change at age 16. There were also significant gender differences in response, with
Page 90 of 110
URL: http://mc.manuscriptcentral.com/tsed Email: [email protected]
International Journal of Science Education
123456789101112131415161718192021222324252627282930313233343536373839404142434445464748495051525354555657585960

For Peer Review O
nly
21
male students being much more likely to agree with the statement than female students. The
percentage disagreeing declined with age, with Level 2 data indicated these changes were
associated with a steady increase over the year groups from one-third at age 11 to well over
half by age 16 who neither agreed nor disagreed. Over 90% of students aged 11 and 14 were
of the opinion that information was often misrepresented in the media and, by implication,
this means science is blamed for things that are not its fault. The drop in this view by age 16
was significant (χ2=6.389, p<0.05). Half of the respondents in each age group perceived that
it is scientists who are often blamed for (negative) aspects of science that are actually a
consequence of the actions of others. There was a tendency that increased with age for
students to believe that science is bound to get blamed for some things as it is so common in
everyday life (42% at age 11, 65% at age 16), and the opinion that only bad things about
science get reported also rose with age (24% at age 11, 46% at age 16). In contrast, close to
three-fifths of all students in all age groups who chose ‘disagree’ as their Level 1 response felt
that this was because science helps to create problems, but only the good things about science
are reported. Three-quarters or more of students in each age group were not interested in the
way science is reported, reflecting the lack of interest in science in the media reported earlier.
The somewhat complex data here appear to suggest that, as they mature, students develop a
more sophisticated view of the range of effects of science and how these are portrayed, whilst,
at the same time, becoming more critical of the effects of science.
The personal and impersonal response to science
The views on the importance of science in the school curriculum discussed earlier are
forerunners of the very appreciable trend in responses to science outside school for students to
become increasingly positive about science as the items to which they are responding become
less personalised. Items B09 to B14 sought views of the more general importance of science,
Page 91 of 110
URL: http://mc.manuscriptcentral.com/tsed Email: [email protected]
International Journal of Science Education
123456789101112131415161718192021222324252627282930313233343536373839404142434445464748495051525354555657585960
For Peer Review O
nly
22
and it is clear from Figures 1 and 2 that these elicited a greater proportion of Level 1 ‘agree’
responses than almost all the other items. Within this, male students were generally
significantly more positive than female students who, in turn, were significantly more likely
than male student to be more cautious in their judgements by selecting ‘neither agree no
disagree’ as their Level 1 response.
For item B10: Science can help solve problems, male students had a significantly more
optimistic view of the beneficial role of science. Level 2 data showed a very high proportion
(over 90%) of students who agreed with the statement felt that scientists could help to solve
problems by inventing things, with close to three-quarters supporting the view that science
can give us the knowledge to sort out problems. Regardless of gender, all students who
disagreed with the statement supported the view that science causes the problems in the first
place and so is unlikely to solve them.
A significantly higher proportion of female students responded in a neutral or cautious
fashion to B11: Science makes an important contribution to the wealth of the nation compared
to male students who were much more likely to agree. Level 2 data revealed that 80% of
students believed that science helps to create jobs, with close to 40% of both sexes supporting
the view that science lead to inventions which people then buy. The importance of science to
industry and the economy was recognised by around two-thirds of male and female students.
Most of the students who disagreed with the statement felt that science costs money rather
than generating wealth.
Item B13: It is important for this country to have well-qualified scientists, received the most
positive responses of all the items about science outside school from all age groups. Even
though students aged 16 were the least positive, 60% selected ‘agree’ as their Level 1
Page 92 of 110
URL: http://mc.manuscriptcentral.com/tsed Email: [email protected]
International Journal of Science Education
123456789101112131415161718192021222324252627282930313233343536373839404142434445464748495051525354555657585960

For Peer Review O
nly
23
response, providing a stark contrast to the 14% who responded positively to B07: It would be
good to have a job as a scientist. Level 2 data showed that a very high proportion of students
(95%) who agreed with the main statement did so because they thought science important for
certain areas such as medicine. Additionally around two-thirds of students supported the
suggestion that scientists in this country can help other countries, and similar numbers feeling
that scientists make the country a better place in which to live.
Significantly more male students than female students agreed with B14: It is important to
promote this country as a scientific nation. This was balanced by a higher proportion of
female students who neither agreed nor disagreed. Level 2 data showed over 80% of both
sexes thought that promoting the country as a scientific nation would be good for the
economy and for employment. Very similar proportions thought that the UK should not be
left behind other nations given that people in this country have good ideas. The sizable
majority of students disagreeing with the statement thought there were more important things
to promote about the UK. These responses add to the evidence from other studies (Osborne
and Collins, 2001; Jenkins and Nelson, 2005) that young people’s attitudes to science outside
school are more positive than their attitudes to their personal experience of science in school.
The ‘age 14 dip’
The study provides ample evidence of the particularly sharp fall in positive attitudes between
age 11 and age 14, in keeping with the findings of the study by Galton et al. (2003). Within
the overall pattern of declining positive attitudes, seven items showed a statistically
significant decrease in ‘agree’ responses between age 11 and age 14 with, in some cases, a
slight improvement by age 16. No items showed similar significant differences between ages
11 and 14. These items are summarised in Table 5.
Page 93 of 110
URL: http://mc.manuscriptcentral.com/tsed Email: [email protected]
International Journal of Science Education
123456789101112131415161718192021222324252627282930313233343536373839404142434445464748495051525354555657585960

For Peer Review O
nly
24
Table 5 about here
The explanatory (Level 2) responses to the items offer interesting insights into the ‘age 14
dip’, some of which have been discussed earlier. The most pertinent of these relate to
students views of their science lessons, their responses to what their teachers do, and their
perceived value of jobs and careers involving science. In science lessons, an increasing
feeling that the subject matter is difficult – science is ‘hard’ – exerts a very significant
influence between ages 11 and 14. Enthusiastic teachers who challenged students to think and
provided variety in activity were seen as very influential at age 11. At this age, students were
also attracted to careers in science, giving a wide variety of reasons: the nature of the work,
remuneration and the view that scientists can have a positive influence on the world. This
view has altered dramatically by age 14, with jobs involving science being seen as
unattractive because they are perceived as boring, science being perceived as causing too
many problems in the world and scientists having to make too many compromises. However,
students aged 16 who did want a job involving science gave as their reasons the fact that
scientists could change the world for the better, or that jobs involving science were well-paid.
It appears that some students at least, as they mature, come to feel that science offers a way of
making a positive difference to people’s lives.
Shift in opinion with maturity
One unanticipated feature of particular interest in the data is the shift in Level 1 responses
from ‘agree’ or ‘disagree’ to ‘neither agree nor disagree’ as students get older. There are
examples of items where there was no significant difference with age in the number of agree
responses, but a very apparent difference in shift from ‘disagree’ to ‘neither …’ responses.
Page 94 of 110
URL: http://mc.manuscriptcentral.com/tsed Email: [email protected]
International Journal of Science Education
123456789101112131415161718192021222324252627282930313233343536373839404142434445464748495051525354555657585960
For Peer Review O
nly
25
For example, in item B07, It would be good to have a job as a scientist, numbers disagreeing
with this statement stayed roughly constant at around the 40% level. However, the very
significant fall in numbers agreeing with the statement (age 11=41%, age 14=11%;
χ2=33.180, p<0.001) was mirrored by a corresponding rise in number selecting the
‘neither…’ option (age 11=22%, age 14=45%; χ2=10.384 p<0.01). A similar pattern in
responses may be seen for item B08, Science is blamed for things that are not its fault. The
majority of neutral Level 1 responses were linked to Level 2 responses in which students said
they did not feel they knew enough to have a view. These findings suggest that, as students
mature, they feel they need more information to make an informed judgement.
Within this overall shift in opinion with maturity, it is also apparent that a significantly higher
proportion of female students chose the ‘neither …’ option in all cases where there was a
significant gender difference in responses. Furthermore, when looking at the reasons why the
‘neither …’ option was selected, there was a consistent trend for more female students than
male students being prepared to admit they did not know enough to make an informed
response. One possible explanation for this is that female students may be more cautious than
male students in opting for a definite ‘agree’ or ‘disagree’ response which, in turn suggests
that male students may have firmer opinions or a more ‘black and white’ view of the world.
Conclusions
Research into attitudes to science often results in feelings of comfort (though very often cold
comfort) from reaffirmation of the findings of other work, coupled with frustration at the
seemingly intractable nature of the problem. Certainly some of the responses in the study
reported here support well-documented findings on the decline of positive attitudes to science
and jobs involving science over the period of secondary schooling, with physical sciences
Page 95 of 110
URL: http://mc.manuscriptcentral.com/tsed Email: [email protected]
International Journal of Science Education
123456789101112131415161718192021222324252627282930313233343536373839404142434445464748495051525354555657585960

For Peer Review O
nly
26
eliciting particularly negative responses and female students less positively disposed than
male students towards science.
The study adds to the growing evidence that attitudes to science outside school are more
positive than attitudes to school science, and that experiences of school science between ages
11-14 are crucial in shaping students’ attitudes and subsequent behaviours in relation to
subject choice. Whilst the decline in positive attitudes between 11 and 14 is of considerable
concern, a more positive feature of the findings is the identification of school science as
exerting the greater influence, as what students experience in their science lessons is easier to
control than what they experience of science outside school.
The principal justification for developing the new instrument was to go beyond descriptive
data to probe for explanations and insights that, in turn, might point to possible areas to target
for action. What, therefore, has emerged from the explanatory (Level 2) data, and what
messages emerge for future research, and for policy and practice?
The Level 2 data points to particular features of lessons being important, with younger
students citing ‘being made to think’, variety in activity and seeing how science relates to life
as the reasons for this. Many curriculum materials now do contextualise science, but rather
less is known about the range of activities teachers use in science lessons and their effects.
The notion of what students see as activities that make them ‘think’ in science lessons would
certainly benefit from further exploration, given that older students cite the ‘hard’ nature of
science subjects as a reason for not wanting to study them. It would be useful to have more
information on where the boundaries lie between ‘being made to think’ and ‘hard’. As most
students study ‘science’ in the early years of secondary schooling, it is important to explore
these dimensions in relation to the different scientific disciplines, as each has a different
Page 96 of 110
URL: http://mc.manuscriptcentral.com/tsed Email: [email protected]
International Journal of Science Education
123456789101112131415161718192021222324252627282930313233343536373839404142434445464748495051525354555657585960

For Peer Review O
nly
27
problem. Interest in physics remains consistently low, interest in biology increases, and the
science reported as most interesting at age 11 - chemistry - shows the sharpest decline. The
perception of ‘hardness’ also poses a challenge to policy: if students believe that there are
greater rewards in terms of external examination grades for effort put into subjects other than
the physical sciences, and reviews of examination grades have confirmed that it is more
difficult to achieve higher grades in these subjects, then there is a need to examine carefully
the subject content of science curricula, and ways in which national tests and examinations are
graded.
Other insights to emerge from the explanatory data point to features of the curriculum which
might usefully benefit from strengthening or from a different emphasis. Young people,
particularly female students, appear to become less clear-cut in their views as they mature,
and feel they need more information before they can reach views in relation to, for example,
wanting a job involving science, or knowing whether science can help solve environmental
and social problems. One area to target for action would be to look carefully at how
information about jobs involving science might feature in curriculum materials, both in
relation to the jobs themselves and in the context of the view of scientists being seen as
‘uncaring’. It may well be that the links between contextualising science, on which students
report favourably, and jobs involving science need to be made more overtly, as they are not as
apparent to students as they are to those developing materials for use in lessons. Moreover, a
factor strongly influencing those students aged 16 who wanted a job as a scientist was a belief
that scientists could change the world for the better. Thus it would be useful to provide more
information on the contribution scientists make to society.
Looking more widely at the nature of research on attitudes to science, we believe the
instrument developed for this study has a number of strengths: considerable care has been
Page 97 of 110
URL: http://mc.manuscriptcentral.com/tsed Email: [email protected]
International Journal of Science Education
123456789101112131415161718192021222324252627282930313233343536373839404142434445464748495051525354555657585960

For Peer Review O
nly
28
taken in its design and validation, it combines the ability of a survey to gather large datasets
on general patterns with the explanatory insights normally drawn from interviews into an
easy-to-administer pencil-and-paper instrument, its language draws on ‘the student voice’,
and it probes for explanatory insights as well as establishing general patterns. However, the
gathering both descriptive and explanatory data in this way does generate extensive data
which, in turn, leads to challenges in analysis and reporting.
We also believe that the study points to the future direction of attitude research. Well-
designed instruments certainly have a role to play in surveying attitudes, but their principal
strength lies in providing the ‘board brush stokes’ of the picture, rather than providing much
of the detail that might point to action. There is much in the study reported here that suggests
there is little overlap between students’ perceptions of science and their perceptions of
themselves and their own identity. This area would be worth probing in more detail. There is
also evidence that some schools that are much more effective than others at encouraging
uptake of particular subjects. For example, Fitzgibbon (1999) established significant inter-
school variations in the UK in numbers of students electing to study mathematics beyond the
compulsory period, and her finding suggested that there might be similarities with the
sciences in factors underlying student choice. Recent reports of studies of schools (Ponchaud,
2006; National Strategies, 2008) suggests that school-based factors, such as enthusiastic
teaching by specialist teachers, and provision of good information about the value and
flexibility of science qualifications, can exert significant effects on uptake of science.
Moreover, some of the factors that may promote more positive attitudes to science may not be
apparent to students and therefore not easily accessible through attitudinal instruments. Thus,
we contend that the priority for research on attitudes to science is to explore in more detail
features of schools that are more - and less - successful at encouraging uptake of science
beyond the compulsory period.
Page 98 of 110
URL: http://mc.manuscriptcentral.com/tsed Email: [email protected]
International Journal of Science Education
123456789101112131415161718192021222324252627282930313233343536373839404142434445464748495051525354555657585960
For Peer Review O
nly
29
References
Aikenhead, G. & Ryan, A. (1989) The development of a multiple choice instrument for
monitoring views on Science-Technology-Society topics. Final report of SSHRCC Grant.
Saskatoon: University of Saskatchewan, Department of Curriculum Studies.
Aikenhead, G. & Ryan, A. (1992) The development of a new instrument: Views on Science-
Technology-Society. (VOSTS) Science Education, 76 (4), 477-491.
Blalock, C., Lichtenstein, M., Owen, S., Pruski, L., Marshall, C. and Toepperwein, M. (2008)
In pursuit of validity: a comprehensive review of science attitude instruments 1035-2005.
International Journal of Science Education, 30 (7), 961-977.
Cerini, B., Murray, I & Reiss, M. (2004) Student review of the science curriculum. London:
Planet Science.
Coe, R., Searle, J., Barmby, P., Jones, K, and Higgins, S. (2008) Relative difficulty of
examinations in different subjects. Durham: Centre for Educational Management.
Crawley, F.E. & Koballa, T.R. (1994). Attitude research in science education: contemporary
models and methods. Science Education. 78 (1), 35-56.
DfES. (2006) The Supply and Demand for Science, Technology, Engineering and
Mathematics Skills in the UK Economy. Retrieved December 2006 from
http://www.dfes.gov.uk/research/data/uploadfiles/RR775.pdf
European Commission (2004) Europe needs more scientists: increasing human resources for
science and technology in Europe. Luxembourg: Office for Official Publications of the
European Communities.
Fitzgibbon, C. T. (1999) Long-term consequences of curriculum choices with particular
reference to Mathematics and science. School Effectiveness and School Improvement, 10
(2), 217-232.
Page 99 of 110
URL: http://mc.manuscriptcentral.com/tsed Email: [email protected]
International Journal of Science Education
123456789101112131415161718192021222324252627282930313233343536373839404142434445464748495051525354555657585960

For Peer Review O
nly
30
Galton, M., Gray. J. & Ruddock, J. (2003). Transfer and transitions in the middle years of
schools (7-14): continuities and discontinuities in learning. Department for Education and
Skills (DfES) research report No. 443. London: HMSO.
Gardiner, P. (1975) Attitudes to science: a review. Studies in Science Education, 2, 1-41.
Haste, H. (2004) Science in my future: a study of values and beliefs in relation to science
and technology amongst 11-21-year-olds. Nestlé Social Research programme Report No.
1. London: Nestlé Social Research Programme.
Hyam, H. (2006) Increasing uptake of science post-16: report of a Royal Society conference.
London: The Royal Society.
Jenkins, E. & Nelson, N. (2005) Important but not for me: students’ attitudes towards
secondary school science in England. Research in Science and Technological Education,
23 (1), 41-57.
Johnson, S. (1987) Gender differences in science: parallels in interest, experience and
performance. International Journal of Science Education. 9 (4), 467-481.
Kelly, A. (1986) The development of children’s attitudes to science. European Journal of
Science Education, 8 (4), 399-412.
Misiti, F., Shrigley, R. & Hanson, L. (1991) Science attitude scales for middle school
students. Science Education. 75 (5), 525-540.
Munby, H. (1990) Attitude: invited commentary. Science Education, 74 (3), 377-381.
Munro, M. & Elsom, D. (2000) Choosing Science at 16: The influence of science teachers
and careers advisers on students’ decisions about science subjects and science and
technology careers. Cambridge: CRAC.
National Strategies (2008) Progression to post-16 science: an enquiry into the factors which
are influential in achieving high levels of take-up of science subjects post-16. London:
Department for Children, Schools and Families.
Page 100 of 110
URL: http://mc.manuscriptcentral.com/tsed Email: [email protected]
International Journal of Science Education
123456789101112131415161718192021222324252627282930313233343536373839404142434445464748495051525354555657585960
For Peer Review O
nly
31
Organisation for Economic Co-operation and Development [OECD] (2006) Evolution of
student interest in science and technology studies policy report. Paris: OECD.
Ormerod, M. & Duckworth, D. (1975) Pupils’ attitudes to science: a review of research.
London: NFER.
Osborne, J. & Collins, S. (2001) Pupils’ views of the role and value of the science
curriculum. International Journal of Science Education, 23 (5), 441-467.
Osborne, J., Driver, R. & Simon, S. (1998) Attitudes to science: issues and concerns. School
Science Review, 79 (228), 27-33.
Osborne, J., Simon, S. & Collins, S. (2003) Attitudes towards science: a review of the
literature and its implications. International Journal of Science Education, 25 (9), 1049-
1079.
Piburn, M. & Baker, D. (1993) If I were the teacher: qualitative study of attitude towards
science. Science Education. 77 (4), 393-406.
PricewaterhouseCoopers LLP (2005) The economic benefits of higher education
qualifications: a report produced for the Royal Society of Chemistry and the Institute of
Physics. London: RSC/IoP.
Ponchaud, B. (2006) Showcasing success in science education. Education in Science, 218,
8-9.
Qualter, A. (1993) I would like to know more about that: a study of the interest shown by
girls and boys in scientific topics. International Journal of Science Education. 15 (3),
307-317.
Ramsden, J. (1998) Mission impossible: can anything be done about attitudes to science?
International Journal of Science Education, 20 (2), 125 - 137.
Schibeci, R. (1984) Attitudes to science: an update. Studies in Science Education, 11, 26-59.
Schreiner, C. & Sjøberg, S. (2004) Sowing the seeds of ROSE. Background, rationale,
questionnaire development and data collection for ROSE (The Relevance of Science
Page 101 of 110
URL: http://mc.manuscriptcentral.com/tsed Email: [email protected]
International Journal of Science Education
123456789101112131415161718192021222324252627282930313233343536373839404142434445464748495051525354555657585960

For Peer Review O
nly
32
Education) - a comparative study of students' views of science and science education.
Oslo: Dept. of Teacher Education and School Development, University of Oslo.
Simon, S. (2000) Students’ attitudes towards science. In M. Monk & J. Osborne (eds) Good
practice in science teaching: what research has to say. Buckingham: Open University
Press.
Simpson, R. & Oliver, J. (1990). A summary of major influences on attitude towards
achievement in science amongst adolescent students. Science Education. 74 (1), 1-18.
Sjøberg, S. & Schreiner, C. (2005) Update on the ROSE project: students perceptions of
science and technology. IOSTE newsletter, 8 (1), 7-10.
Smail, B. & Kelly, A. (1984) Sex differences in science and technology among 11-year-old
schoolchildren: II-affective. Research in Science and Technological Education. 2 (2), 87-
106.
Storage of the original data
All the original data are stored in the Department of Educational Studies at the University of
York.
The full report and the instrument
The full report and the instrument may be found as Paper 8 in the Department of Educational
Studies Research Paper series: www.york.ac.uk/depts/educ/ResearchPaperSeries/
Acknowledgements
The authors would like to thank the Salters’ Institute of Industrial Chemistry for the grant that
supported the work reported in this paper, and the colleagues, teachers and students who
assisted with the development of the instrument and the data collection.
Page 102 of 110
URL: http://mc.manuscriptcentral.com/tsed Email: [email protected]
International Journal of Science Education
123456789101112131415161718192021222324252627282930313233343536373839404142434445464748495051525354555657585960
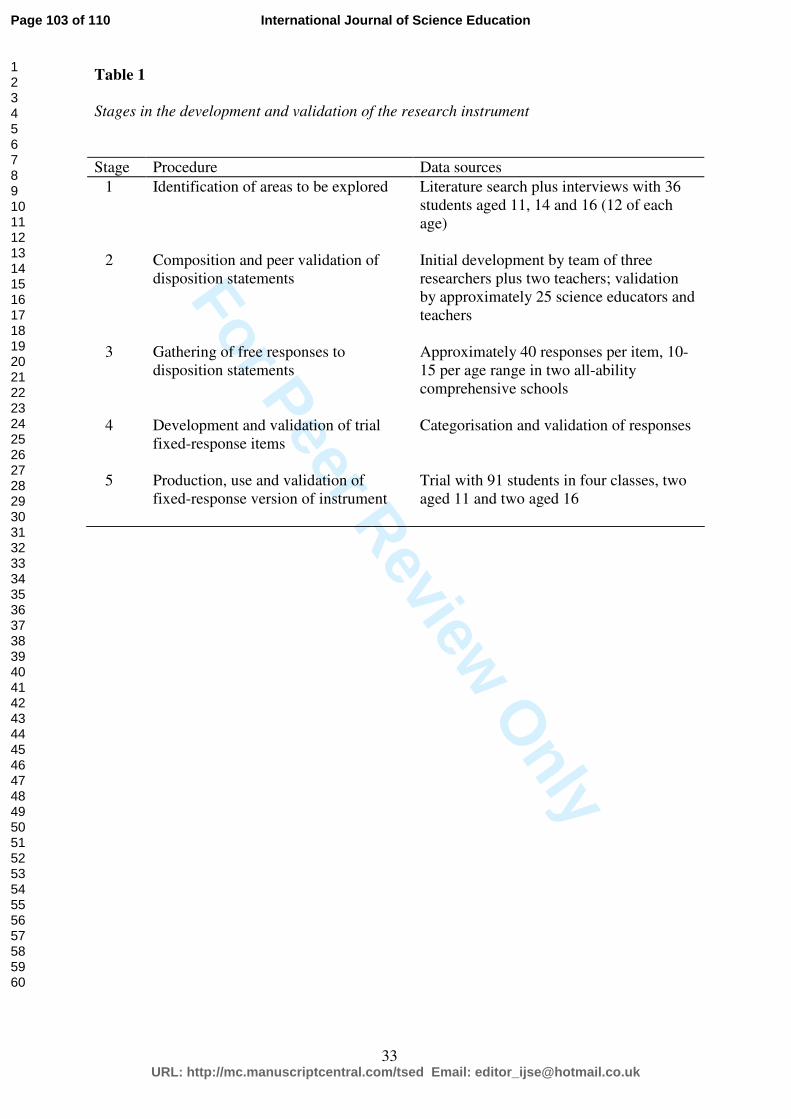
For Peer Review O
nly
33
Table 1
Stages in the development and validation of the research instrument
Stage Procedure Data sources
1 Identification of areas to be explored Literature search plus interviews with 36
students aged 11, 14 and 16 (12 of each
age)
2 Composition and peer validation of
disposition statements
Initial development by team of three
researchers plus two teachers; validation
by approximately 25 science educators and
teachers
3 Gathering of free responses to
disposition statements
Approximately 40 responses per item, 10-
15 per age range in two all-ability
comprehensive schools
4 Development and validation of trial
fixed-response items
Categorisation and validation of responses
5 Production, use and validation of
fixed-response version of instrument
Trial with 91 students in four classes, two
aged 11 and two aged 16
Page 103 of 110
URL: http://mc.manuscriptcentral.com/tsed Email: [email protected]
International Journal of Science Education
123456789101112131415161718192021222324252627282930313233343536373839404142434445464748495051525354555657585960
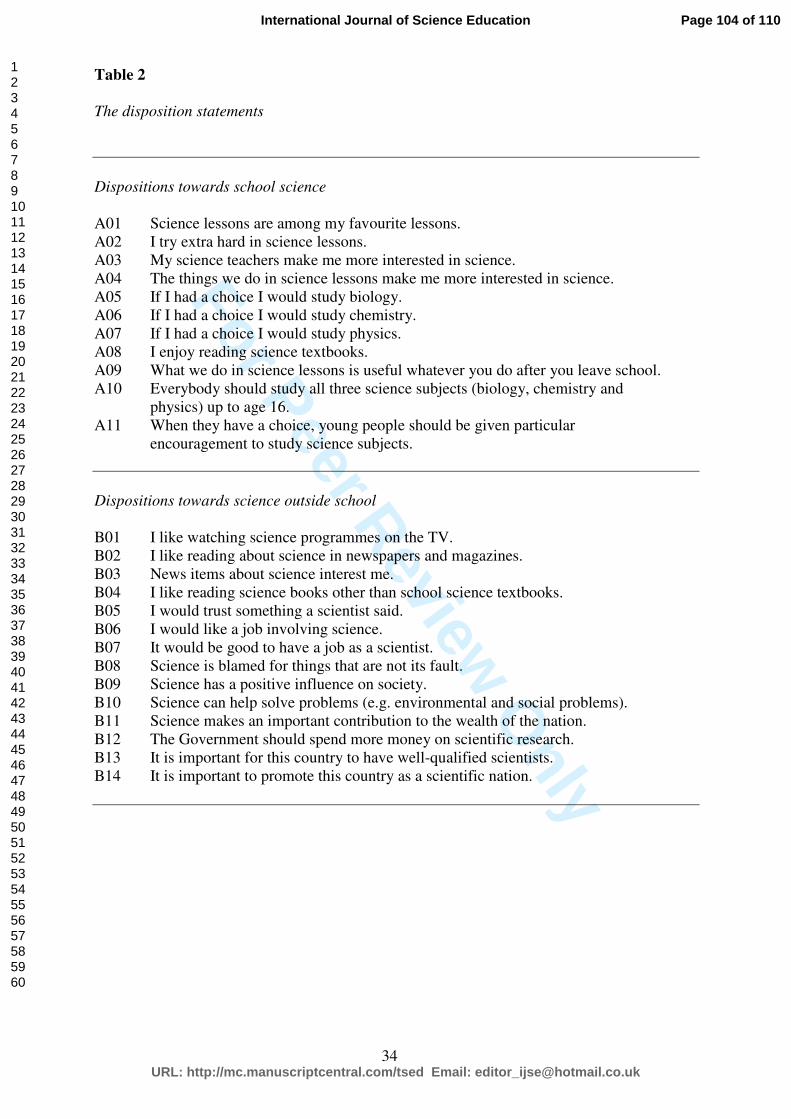
For Peer Review O
nly
34
Table 2
The disposition statements
Dispositions towards school science
A01 Science lessons are among my favourite lessons.
A02 I try extra hard in science lessons.
A03 My science teachers make me more interested in science.
A04 The things we do in science lessons make me more interested in science.
A05 If I had a choice I would study biology.
A06 If I had a choice I would study chemistry.
A07 If I had a choice I would study physics.
A08 I enjoy reading science textbooks.
A09 What we do in science lessons is useful whatever you do after you leave school.
A10 Everybody should study all three science subjects (biology, chemistry and
physics) up to age 16.
A11 When they have a choice, young people should be given particular
encouragement to study science subjects.
Dispositions towards science outside school
B01 I like watching science programmes on the TV.
B02 I like reading about science in newspapers and magazines.
B03 News items about science interest me.
B04 I like reading science books other than school science textbooks.
B05 I would trust something a scientist said.
B06 I would like a job involving science.
B07 It would be good to have a job as a scientist.
B08 Science is blamed for things that are not its fault.
B09 Science has a positive influence on society.
B10 Science can help solve problems (e.g. environmental and social problems).
B11 Science makes an important contribution to the wealth of the nation.
B12 The Government should spend more money on scientific research.
B13 It is important for this country to have well-qualified scientists.
B14 It is important to promote this country as a scientific nation.
Page 104 of 110
URL: http://mc.manuscriptcentral.com/tsed Email: [email protected]
International Journal of Science Education
123456789101112131415161718192021222324252627282930313233343536373839404142434445464748495051525354555657585960

For Peer Review Only
35
Figure 1
Example of final format for multi-choice items
B06 I would like a job involving science.
I agree because…
I neither agree nor disagree because…
I disagree because…
a …I enjoy science at school
k …it depends on what science you
would be doing
p …I find science boring
b …they are generally well paid
q …science causes too many problems for
the world
c …science makes the world a better
place to live in
r …they don’t get well paid
d …there are good jobs you can do with
science
x
… another reason – please say what
y … another reason – please say what z … another reason – please say what
(Bold text in table = Level 1 responses; plain text = Level 2 responses)
Page 105 of 110
URL: http://mc.manuscriptcentral.com/tsed Email: [email protected]
International Journal of Science Education
123456789101112131415161718192021222324252627282930313233343536373839404142434445464748495051525354555657585960

For Peer Review O
nly
36
Table 3
Details of sample
Age N % % Low ability Middle ability High ability
Male Female Male Female Male Female Male Female
11 104 49 51 2 0 27 25 22 28
14 78 47 53 5 3 13 16 19 22
16 98 49 51 0 3 17 33 31 14
Total 280 136 144 7 6 57 74 72 64
Page 106 of 110
URL: http://mc.manuscriptcentral.com/tsed Email: [email protected]
International Journal of Science Education
123456789101112131415161718192021222324252627282930313233343536373839404142434445464748495051525354555657585960
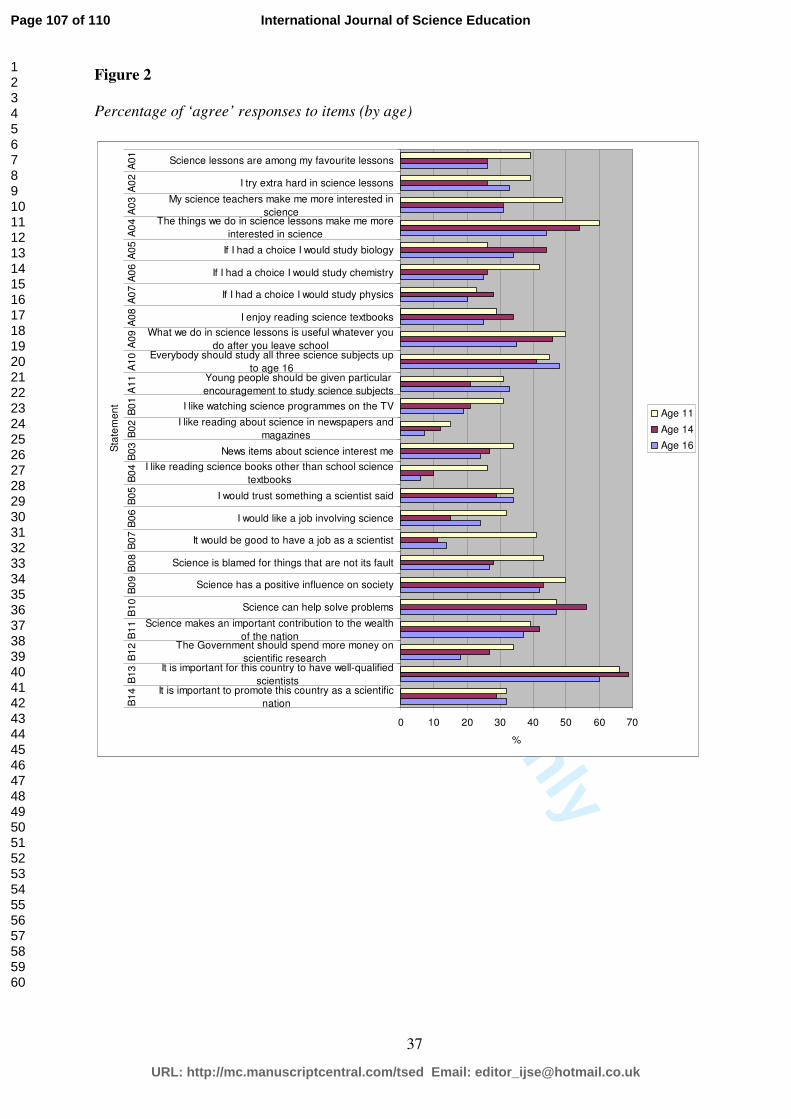
For Peer Review O
nly
37
Figure 2
Percentage of ‘agree’ responses to items (by age)
0 10 20 30 40 50 60 70
It is important to promote this country as a scientific
nation
It is important for this country to have well-qualified
scientists
The Government should spend more money on
scientific research
Science makes an important contribution to the wealth
of the nation
Science can help solve problems
Science has a positive influence on society
Science is blamed for things that are not its fault
It would be good to have a job as a scientist
I would like a job involving science
I would trust something a scientist said
I like reading science books other than school science
textbooks
News items about science interest me
I like reading about science in newspapers and
magazines
I like watching science programmes on the TV
Young people should be given particular
encouragement to study science subjects
Everybody should study all three science subjects up
to age 16
What we do in science lessons is useful whatever you
do after you leave school
I enjoy reading science textbooks
If I had a choice I would study physics
If I had a choice I would study chemistry
If I had a choice I would study biology
The things we do in science lessons make me more
interested in science
My science teachers make me more interested in
science
I try extra hard in science lessons
Science lessons are among my favourite lessons
B1
4B
13
B1
2B
11
B1
0B
09
B0
8B
07
B0
6B
05
B0
4B
03
B0
2B
01
A1
1A
10
A0
9A
08
A0
7A
06
A0
5A
04
A0
3A
02
A0
1
Sta
tem
en
t
%
Age 11
Age 14
Age 16
Page 107 of 110
URL: http://mc.manuscriptcentral.com/tsed Email: [email protected]
International Journal of Science Education
123456789101112131415161718192021222324252627282930313233343536373839404142434445464748495051525354555657585960

For Peer Review O
nly
38
Figure 3
Percentage of ‘agree’ responses to items (by gender)
0 10 20 30 40 50 60 70
It is important to promote this country as a scientif ic nation
It is important for this country to have w ell-qualif ied scientists
The Government should spend more money on scientif ic research
Science makes an important contribution to the w ealth of the nation
Science can help solve problems
Science has a positive influence on society
Science is blamed for things that are not its fault
It w ould be good to have a job as a scientist
I w ould like a job involving science
I w ould trust something a scientist said
I like reading science books other than school science textbooks
New s items about science interest me
I like reading about science in new spapers and magazines
I like w atching science programmes on the TV
Young people should be given particular encouragement to study science
subjects
Everybody should study all three science subjects up to age 16
What w e do in science lessons is useful w hatever you do after you
leave school
I enjoy reading science textbooks
If I had a choice I w ould study physics
If I had a choice I w ould study chemistry
If I had a choice I w ould study biology
The things w e do in science lessons make me more interested in science
My science teachers make me more interested in science
I try extra hard in science lessons
Science lessons are among my favourite lessons
B14
B13
B12
B11
B10
B09
B08
B07
B06
B05
B04
B03
B02
B01
A11
A10
A09
A08
A07
A06
A05
A04
A03
A02
A01
Sta
tem
ent
%
Male
Female
Page 108 of 110
URL: http://mc.manuscriptcentral.com/tsed Email: [email protected]
International Journal of Science Education
123456789101112131415161718192021222324252627282930313233343536373839404142434445464748495051525354555657585960
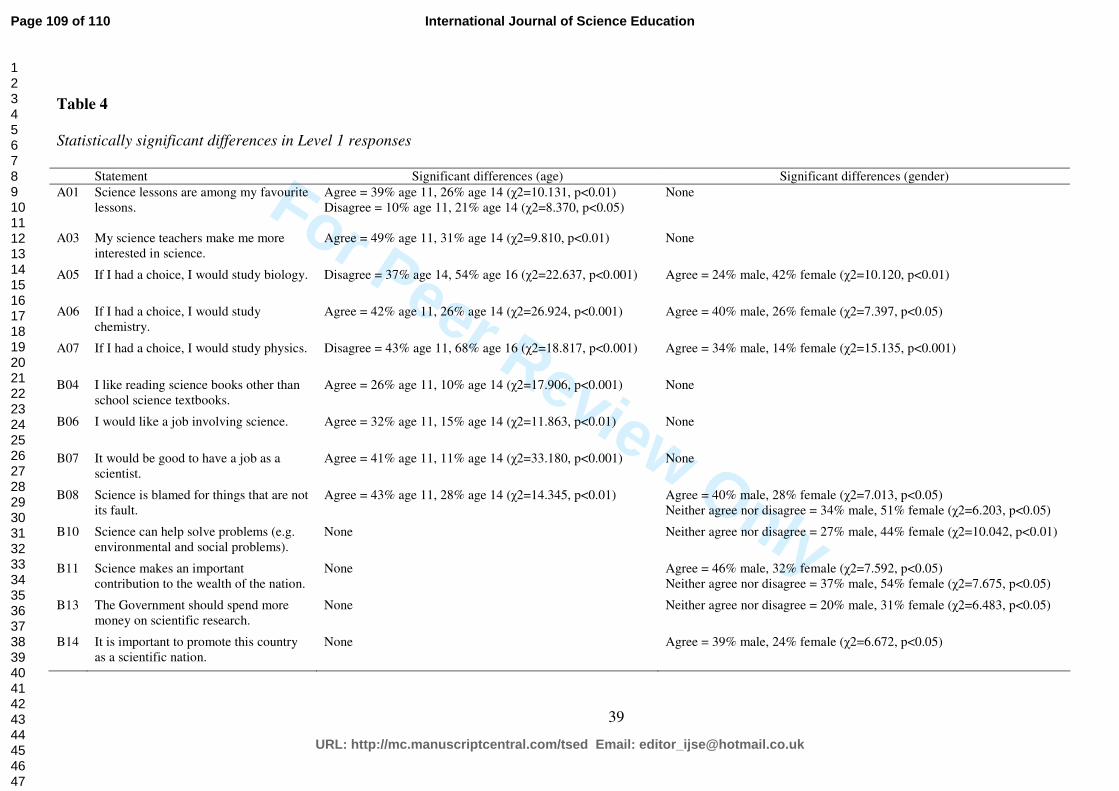
For Peer Review Only
39
Table 4
Statistically significant differences in Level 1 responses
Statement Significant differences (age) Significant differences (gender)
A01 Science lessons are among my favourite
lessons.
Agree = 39% age 11, 26% age 14 (χ2=10.131, p<0.01)
Disagree = 10% age 11, 21% age 14 (χ2=8.370, p<0.05)
None
A03 My science teachers make me more
interested in science.
Agree = 49% age 11, 31% age 14 (χ2=9.810, p<0.01)
None
A05 If I had a choice, I would study biology.
Disagree = 37% age 14, 54% age 16 (χ2=22.637, p<0.001)
Agree = 24% male, 42% female (χ2=10.120, p<0.01)
A06 If I had a choice, I would study
chemistry.
Agree = 42% age 11, 26% age 14 (χ2=26.924, p<0.001)
Agree = 40% male, 26% female (χ2=7.397, p<0.05)
A07 If I had a choice, I would study physics.
Disagree = 43% age 11, 68% age 16 (χ2=18.817, p<0.001)
Agree = 34% male, 14% female (χ2=15.135, p<0.001)
B04 I like reading science books other than
school science textbooks.
Agree = 26% age 11, 10% age 14 (χ2=17.906, p<0.001)
None
B06 I would like a job involving science.
Agree = 32% age 11, 15% age 14 (χ2=11.863, p<0.01)
None
B07 It would be good to have a job as a
scientist.
Agree = 41% age 11, 11% age 14 (χ2=33.180, p<0.001)
None
B08 Science is blamed for things that are not
its fault.
Agree = 43% age 11, 28% age 14 (χ2=14.345, p<0.01)
Agree = 40% male, 28% female (χ2=7.013, p<0.05)
Neither agree nor disagree = 34% male, 51% female (χ2=6.203, p<0.05)
B10 Science can help solve problems (e.g.
environmental and social problems).
None
Neither agree nor disagree = 27% male, 44% female (χ2=10.042, p<0.01)
B11 Science makes an important
contribution to the wealth of the nation.
None
Agree = 46% male, 32% female (χ2=7.592, p<0.05)
Neither agree nor disagree = 37% male, 54% female (χ2=7.675, p<0.05)
B13 The Government should spend more
money on scientific research.
None
Neither agree nor disagree = 20% male, 31% female (χ2=6.483, p<0.05)
B14 It is important to promote this country
as a scientific nation.
None
Agree = 39% male, 24% female (χ2=6.672, p<0.05)
Page 109 of 110
URL: http://mc.manuscriptcentral.com/tsed Email: [email protected]
International Journal of Science Education
123456789101112131415161718192021222324252627282930313233343536373839404142434445464748495051525354555657585960

For Peer Review O
nly
40
Table 5
Items showing statistically significant decline in ‘agree’ responses between the ages of 11 and
14
Statement Agree at
age 11
(%)
Agree at
age 14
(%)
Agree at
age 16
(%)
A01 Science lessons are among my favourite lessons 39 26 27
A03 My science teachers make me more interested in
science
49 31 31
A06 If I had a choice, I would study chemistry 42 26 25
B04 I like reading science books other than school
science textbooks
26 10 6
B06 I would like a job involving science 32 15 24
B07 It would be good to have a job as a scientist 41 11 14
B08 Science is blamed for things that are not its fault 43 28 27
Page 110 of 110
URL: http://mc.manuscriptcentral.com/tsed Email: [email protected]
International Journal of Science Education
123456789101112131415161718192021222324252627282930313233343536373839404142434445464748495051525354555657585960
Top Related