


Languages
Pages
Legal

June 30, 2017
World Acceptance CorporationNASDAQ: WRLD

Certain statements in this presentation constitute “forward looking-statements” under the Private Securities LitigationReform Act of 1995. Statements other than those of historical fact, as well as those identified by the words “anticipate,”“estimate,” ”intend,” “plan,” “expect,” “believe,” “may,” “will,” and “should” or any variation of the foregoing and similarexpressions are forward-looking statements. Such forward-looking statements are about matters that are inherently subjectto risks and uncertainties. Factors that could cause actual results or performance to differ from the expectations expressed orimplied in such forward-looking statements include the following: recently enacted, proposed or future legislation and themanner in which it is implemented; the nature and scope of regulatory authority, particularly discretionary authority, that maybe exercised by regulators having jurisdiction over the Company’s business or consumer financial transactions generically,including, but not limited to, the Consumer Financial Protection Bureau (the “CFPB”), having jurisdiction over the Company’sbusiness or consumer financial transactions generically; the unpredictable nature of regulatory proceedings and litigation; andany determinations, findings, claims or actions made or taken by the CFPB, other regulators or third parties in connection withor resulting from the previously disclosed civil investigative demand from the CFPB that assert or establish that the Company’slending practices or other aspects of its business violate applicable laws or regulations; the impact of changes in accountingrules and regulations, or their interpretation or application, which could materially and adversely affect the Company’sreported financial statements or necessitate material delays or changes in the issuance of the Company’s audited financialstatements; the Company's assessment of its internal control over financial reporting, and the timing and effectiveness of theCompany's efforts to remediate any reported material weakness in its internal control over financial reporting; changes ininterest rates; risks related to expansion and foreign operations; risks inherent in making loans, including repayment risks andvalue of collateral; the timing and amount of revenues that may be recognized by the Company; changes in current revenueand expense trends (including trends affecting delinquencies and charge-offs); and changes in the Company’s markets andgeneral changes in the economy (particularly in the markets served by the Company). These and other factors are discussed ingreater detail in Part I, Item 1A, “Risk Factors” in the Company’s most recent annual report on Form 10-K for the fiscal yearended March 31, 2017 filed with the Securities and Exchange Commission (“SEC”) and the Company’s other reports filed with,or furnished to, the SEC from time to time. World Acceptance Corporation does not undertake any obligation to update anyforward-looking statements it makes.
2
Cautionary Note About Forward-Looking Statements

Table of Contents
3
Section 1 Company Overview and Key Investment Highlights.... 4
Section 2 Business Overview..................................................... 11
Section 3 Financial Summary.................................................... 23

Company Overview and Key Investment Highlights
4

5
World Acceptance Overview
Largest Domestic Branch Network…
…With a Presence in Mexico
50+ year old small-loan consumer finance company
Provides loans to individuals with limited access to credit
Well positioned to capitalize on favorable supply/demand imbalance within the non-prime lending space
Originated over $27 billion dollars worth of loans since 1994
Focused on relationship-lending business model Total: 1,169
Total: 162
Branch Count
FY2018 Data is through 6/30/2017
217 360 441
620
990
1,271 1,350 1,327 1,331
0200400600800
1,0001,2001,4001,600
'94 '98 '02 '06 '10 '14 '16 '17 '18
30
80 2975
39
292
73
4721 65
10476
93124
21
Jalisco 3
Sinaloa 7
Sonora12 Chihuahua
29 Coahuila 12
Chiapas 9
Yucatan 4
Quintana Roo 5
Nuevo Leon 23Tamaulipas 11
Guerrero 4
SLP 4Aguas Calientes 4
Guanajuato 5
Edo De Mexico 4Morelos 3
Queretaro 3
Hildalgo 3
Puebla 5
Veracruz 2
Campeche 1
Baja California Sur 2
Oaxaca 3
Baja Calif North 1
Zacatecas 1
Ciudad Mexico 2

6
Key Investment Highlights
Consistently Profitable through
Multiple Cycles
Experienced Management Team
Stable Business Model with Low
Volatility of Earnings and Losses
Attractive Market Supported by Strong
Supply/Demand Dynamics
High-Touch Business Model Enhances Risk
Monitoring Strong Balance Sheet with
Compelling Cash Flow Characteristics
Long Operating History

Consistently Profitable through Multiple Cycles
World Acceptance has remained profitable while operating with strong and stable margins in various economic environments
Net Charge-Offs
7
($ in millions)
_________________Note: Fiscal year-end is 3/31. FY 2018 numbers represent last twelve months. (1) Return on Average Assets is calculated as net income over the Average Total Assets for the respective period. Average Total Assets are defined as a 5-quarter average, ending at the respective period end(2) 20+ Year Average represents average from 3/31/1997 to 3/31/2017
20+ Year Average NCOs2: 13.7%
Net Income & Return on Average Assets1
$6 $9 $11 $8 $8 $7 $14 $16 $19 $23 $29 $34 $39 $48 $50 $56 $74 $91 $101 $104 $107 $111
$87 $74 $70
8.2%10.8% 11.9%
8.2% 7.2%8.4%
9.7% 8.8% 9.9% 10.4%11.7% 11.8% 11.9% 12.2%
11.0% 10.9%12.7%
13.9% 13.9% 13.0% 12.3% 12.5%10.0%
8.8% 8.3%
0.0%
4.0%
8.0%
12.0%
16.0%
$0
$40
$80
$120
$160
$200
'94 '95 '96 '97 '98 '99 '00 '01 '02 '03 '04 '05 '06 '07 '08 '09 '10 '11 '12 '13 '14 '15 '16 '17 '18
7.6%
11.2%10.6% 9.4% 9.7%
12.0% 12.0%14.8% 14.6% 14.7% 14.6% 14.8%
13.3%14.5%
16.7%15.5%
14.3% 14.1% 13.9% 14.7%12.9%
14.8% 15.7% 15.4%
0.0%
5.0%
10.0%
15.0%
20.0%
'95 '96 '97 '98 '99 '00 '01 '02 '03 '04 '05 '06 '07 '08 '09 '10 '11 '12 '13 '14 '15 '16 '17 '18
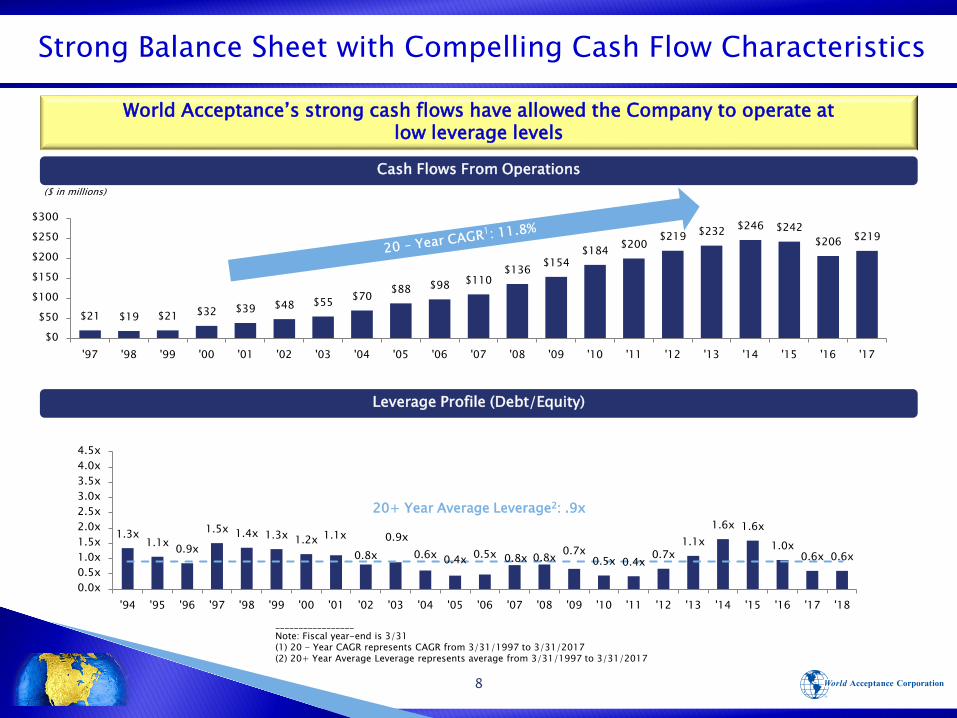
Strong Balance Sheet with Compelling Cash Flow Characteristics
World Acceptance’s strong cash flows have allowed the Company to operate at low leverage levels
Leverage Profile (Debt/Equity)
Cash Flows From Operations
8
_________________Note: Fiscal year-end is 3/31(1) 20 - Year CAGR represents CAGR from 3/31/1997 to 3/31/2017(2) 20+ Year Average Leverage represents average from 3/31/1997 to 3/31/2017
($ in millions)
20+ Year Average Leverage2: .9x
1.3x1.1x 0.9x
1.5x 1.4x 1.3x 1.2x 1.1x
0.8x0.9x
0.6x 0.4x 0.5x 0.8x 0.8x 0.7x0.5x 0.4x 0.7x
1.1x1.6x 1.6x
1.0x0.6x 0.6x
0.0x0.5x1.0x1.5x2.0x2.5x3.0x3.5x4.0x4.5x
'94 '95 '96 '97 '98 '99 '00 '01 '02 '03 '04 '05 '06 '07 '08 '09 '10 '11 '12 '13 '14 '15 '16 '17 '18
$21 $19 $21 $32 $39 $48 $55 $70 $88 $98 $110 $136 $154
$184 $200 $219 $232 $246 $242
$206 $219
$0
$50
$100
$150
$200
$250
$300
'97 '98 '99 '00 '01 '02 '03 '04 '05 '06 '07 '08 '09 '10 '11 '12 '13 '14 '15 '16 '17

Traditional Loan Product Provider to Underserved Clients
9
PaydayPawnTraditional InstallmentCredit Card
_________________Source: Company filings, CFPB, Center for Responsible Lending Report (Feb 2013), Wall Street Research(1) Center for Responsible Lending, “The State of Lending in America & its Impact on U.S. Households." Data represents 30-Day Balloon Payment Car-Title Loans(2) CFPB, “Payday Loans and Deposit Advance Products”
Auto Title Loans
Past Due Resolution
Auto debit bank account
Sale of loan collateralBranch calling
Centralized callingSale to a 3rd party
Repo automobile
Loan Amortization BalloonBalloon
Fully amortizingFixed, equal
monthly payments
RevolvingLow minimum
paymentBalloon
Credit Reporting No reportingNo reportingReport to bureausReport to bureaus No reporting
Renewals Borrower’s optionAverage 0 – 3 renewals/yearRevolving
Underwriting Approach
Bank account and employment
Solely collateral valueAbility to payAbility to pay and
credit historySolely collateral
value
8 renewals/year1 9 renewals/year2
World Acceptance provides an attractive product to an underserved customer base, focusing on the customer's stability, ability and willingness to pay
Average Term 2 - 3 weeks22 – 4 months
Large: 3-5 yearsSmall: 12-24 months
Revolving 30 days1

10
Experienced Management Team
Employee Hierarchy and Avg. Tenure With WRLD
Senior Management
Senior Vice Presidents
Vice President of Operations
Supervisors
Branch Employees
23 years
18 years
14 years
5 years
6years
7years
3 years
2 years
U.S. Mexico1
_________________(1) Mexico locations opened in 2005

Business Overview

World Acceptance Branch Overview
12
Managers have full P&L responsibility for their branch and are tasked with fostering an ownership attitude
United States
Representative Branch
Mexico
Typical Branch Portfolio Branch EmployeesCharacteristics
1,500 square feet
$1,470 per month lease
Rural America –typically downtown or small strip center
1,725 square feet
$1,800 per month lease
Medium to large cities –typically in small strip centers
$840,000 gross loans receivables
654 accounts
$418,000 avg. revenue during fiscal 2017
$794,000 gross loans receivables
1,012 accounts
$267,000 avg. revenue during fiscal 2017
2.8 employees per branch
Manager, Branch Service Representatives
8.0 employees per branch
Manager, Assistant Manager, Customer Service Representative and Security Guards
_________________Note: Data as of 6/30/2017

Historical Branch Growth
13
Branch Count Over Time
Conservative and disciplined manner of entering states and opening branches
1962 1974 1980 1991 1993 1996
July 1962: South Carolina
2000 2003 2005 2010 2013
December 1974: Texas and Georgia
October 1980: Oklahoma
May 1991: Louisiana
April 1993: Tennessee
1996: Illinois, Missouri and New
Mexico
March 2000: Kentucky
January 2003: Alabama
September 2005: Mexico
December 2010: Wisconsin
September 2012: Indiana
2012 2014
October 2014: Idaho
September 2013: Mississippi
_________________Note: Total branch count over time is as of 6/30/2017
State Date of Entry 1995 2000 2005 2010 2015 Total
South Carolina July '62 59 63 65 95 99 93Georgia December '74 38 48 76 101 113 124Texas December '74 93 135 164 229 300 292 Oklahoma October '80 33 43 51 82 83 73Louisiana May '91 15 21 20 38 49 47 Tennessee April '93 6 35 55 95 107 104 Illinois September '96 30 33 64 82 80 Missouri August '96 18 36 62 78 75New Mexico December '96 13 20 39 44 39 Kentucky March '00 4 36 61 79 76 Alabama January '03 21 44 68 65 Mexico September '05 80 148 162 Wisconsin December '10 28 30 Indiana September '12 22 29Mississippi September '13 12 21 Idaho October '14 8 21Total 244 410 577 990 1,320 1,331

All loans are fully amortized with a fixed rate and term Installment loans standardized by amount, rate and maturity Loans underwritten to allow customers to make affordable payments from their disposable income Mexican operations began in 2005; currently Mexico operations represent ~10% of the total portfolio
Payroll deduct loans are originated through state unions
14
Loan Characteristics
World Acceptance operates predominately in the small-loan installment space
Small Installment
Large Installment
Installment Lending -Payroll Deduct
Installment Lending –Branch-Based
Size Average Term
Average: $3,600 Range: $1,500 to $13,500 23 months
Average: $923 Range: $200 to $3,600 10 months
_________________Note: Data as of 6/30/2017(1) Mexican portfolio data displayed in USD; exchange rate is as of 6/30/2017, 1 USD = MXN 18.0540
Mex
ico1
U.S.
Average: $413 Range: $203 to $1,362 12 months
Average: $1,838 Range: $339 to $8,143 31 months

15
Portfolio By Geography1 U.S. Portfolio by Loan Size Amount2
Portfolio Overview
Diversified portfolio by size and geography
No state has greater than a 20% loan concentration Larger loans (>$1,500) have been growing as a percentage of the portfolio
Currently comprise approximately one-third of World Acceptance’s loan portfolio
_________________(1) Based on gross loans receivable as of 6/30/2017(2) Data as of 6/30/2017(3) Other states include Louisiana, New Mexico, Wisconsin, Indiana, Mississippi and Idaho
9%
19%
13%
12%
17%
11%
17%
2%
0-250
251-500
501-750
751-1000
1001-1500
1501-2000
2001-5000
5001+
17.1%
12.7%
11.4%
8.5%11.6%
8.5%
6.1%
6.2%
5.8%
4.3%7.8% Texas
Missouri
Oklahoma
Illinois
Kentucky
MexicoTennessee
Georgia
Alabama
South Carolina
Other

16
Portfolio By Beacon Score1 Portfolio By APR2
Portfolio Overview (cont’d)
World Acceptance’s deep knowledge of its borrower base has enabled the Company to lend effectively throughout the non-prime segment
Approximately 26% of the loans in the U.S. portfolio have APRs of 36% or less Approximately 90% of U.S. loans have an APR of less than 100% Portfolio spreads across a broad spectrum of borrowers
_________________(1) Represents U.S. portfolio, data as of 6/30/2017 (2) Data as of 3/31/2017
0.00%
5.00%
10.00%
15.00%
20.00%
25.00%
30.00%
26.2%24.1%
12.6%
5.5% 4.6%3.4%
13.5%
9.8%
0.2%0.0%
8.0%
27.2%
18.7%
4.4% 2.5% 3.4%
35.8%
0.0%0.0%
10.0%
20.0%
30.0%
40.0%
50.0%
60.0%
0%-36%
37%-50%
51%-60%
61%-70%
71%-80%
81%-90%
91%-99%
100%-149%
150%-200%
U.S. Mexico

Rigorous Loan Underwriting Process
Time-tested underwriting principles produce consistently strong performance
Mitigate net charge-off volatility through various economic cycles
Stability, ability and willingness to pay
Underwriting policies with objective credit evaluation criteria
Relationship-based branch lending enhances servicing effectiveness
Establishes initial contact with the borrower, building an ongoing customer relationship
Individual loan approval authority based on experience and position
Large loans approved at Large Loan Center
Generally decentralized loan approval and collections
Rigorous senior management oversight
17
World Acceptance’s time-tested underwriting process coupled with an understanding of the local demographic profile has yielded strong performance
Take Application
Budget Review
Verify Job, Residence and Credit References
Approve / Decline
Sign Documents
Disburse Funds
Review Credit Bureau
1
2
3
4
5
6
7

Robust Collections Process
Internal data system generates customizable notices on delinquent accounts
Friendly text message payment reminders sent once per week on Fridays; these go to every customer who has a payment due the following week from Monday to Sunday and has completed an opt-in form to receive texts.
Accounts 30+ days past due considered an advanced collection situation
Accounts charged off after 180 days Extensions allowed in special situations All charge-offs reviewed and approved by
supervisors
Branch managers earn up to 10% of Monthly Rating Sheet Profit if certain delinquency, profitability and growth goals are met
Other branch staff also earn a percentage of Monthly Rating Sheet Profit based on the performance of the branch
18
Collection Process
Branch Incentive Program
1 - 6+ Days 14 Days 90 - 180+ Days
Automatic reminder letters are mailed weekly
Phone calls from branch employees to home or cell phones
Phone place of employment
Phone customer references if customer not reachable
Account is charged off
Internal Recovery Unit (IRU) Calls 90+ Days
World Acceptance utilizes a rigid collection process and makes numerous attempts to work with the borrower prior to charging-off a loan
19
Net Charge-Offs
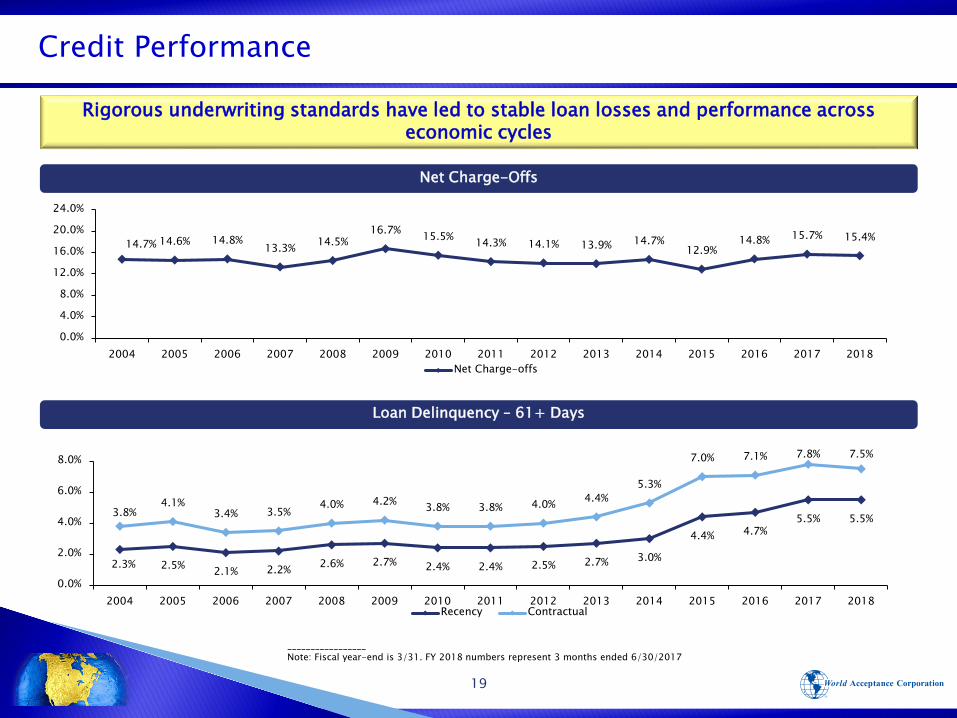
Credit Performance
Loan Delinquency – 61+ Days
Rigorous underwriting standards have led to stable loan losses and performance across economic cycles
_________________Note: Fiscal year-end is 3/31. FY 2018 numbers represent 3 months ended 6/30/2017
14.7% 14.6% 14.8%13.3% 14.5%
16.7% 15.5% 14.3% 14.1% 13.9% 14.7%12.9%
14.8% 15.7% 15.4%
0.0%
4.0%
8.0%
12.0%
16.0%
20.0%
24.0%
2004 2005 2006 2007 2008 2009 2010 2011 2012 2013 2014 2015 2016 2017 2018Net Charge-offs
2.3% 2.5% 2.1% 2.2% 2.6% 2.7% 2.4% 2.4% 2.5% 2.7% 3.0%
4.4% 4.7%5.5% 5.5%3.8%
4.1%3.4% 3.5%
4.0% 4.2% 3.8% 3.8% 4.0% 4.4%5.3%
7.0% 7.1% 7.8% 7.5%
0.0%
2.0%
4.0%
6.0%
8.0%
2004 2005 2006 2007 2008 2009 2010 2011 2012 2013 2014 2015 2016 2017 2018Recency Contractual

Ancillary Products
20
FY 2017 Revenue
Contribution
Insurance Products
Description
~3%
~ 8%
World Acceptance acts as an independent agent for an unaffiliated company in offering optional insurance products connected with loan origination Credit Life – provides for the payment in full of the borrower's credit obligation to
the lender in the event of death Credit Accident and Health – provides for repayment of installments to the lender
in an event the insured is injured during the coverage period Credit Property - provides the borrower’s credit obligation if pledged collateral is
damaged during coverage period Unemployment – provides for repayment of installments to the lender that come
due during the insured’s period of involuntary unemployment All products are voluntary and customers must opt-in to purchase
World Acceptance’s ancillary products complement installment loans and provide additional growth opportunities
Other Products
World Acceptance offers income tax return preparation and electronic filing Prepared 72,000 returns in FY 2017 Employees receive annual tax prep training ~50% are loan customers
Acts as a third-party agent in selling automobile club membership Reimburses members with expenses related to automobile breakdown and towing
_________________Note: Fiscal year-end is 3/31
21
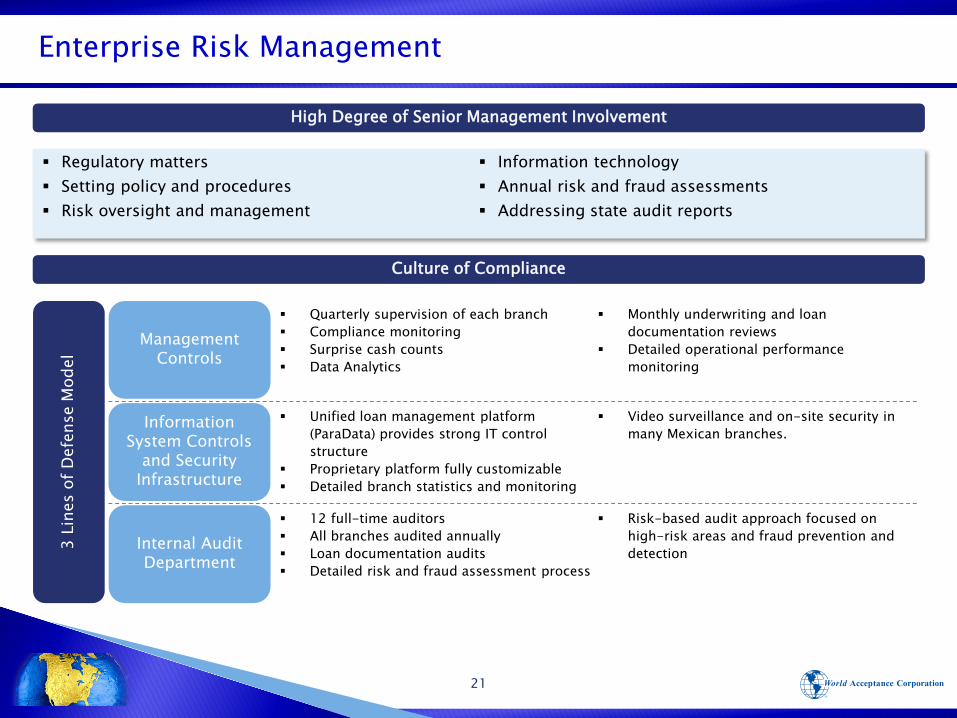
Enterprise Risk Management
High Degree of Senior Management Involvement
Culture of Compliance
Management Controls
Regulatory matters Setting policy and procedures Risk oversight and management
Information technology Annual risk and fraud assessments Addressing state audit reports
Information System Controls
and Security Infrastructure
Internal Audit Department
Quarterly supervision of each branch Compliance monitoring Surprise cash counts Data Analytics
Monthly underwriting and loan documentation reviews
Detailed operational performance monitoring
3 Li
nes
of D
efen
se M
odel
Unified loan management platform (ParaData) provides strong IT control structure
Proprietary platform fully customizable Detailed branch statistics and monitoring
Video surveillance and on-site security in many Mexican branches.
12 full-time auditors All branches audited annually Loan documentation audits Detailed risk and fraud assessment process
Risk-based audit approach focused on high-risk areas and fraud prevention and detection

22
Risk and Compliance
World Acceptance has built a culture of compliance that understands and seeks to anticipate a changing regulatory environment
Implement controls to address weaknesses noted during risk assessments, branch audits, external compliance audits, state regulatory audits and customer complaints
Aligning the compliance program with changing business and regulatory conditionsControl
Continuously monitor branch audits, state regulatory audits and customer complaints for quick identification of systemic issues
Participate and consult on key business initiativesMonitor
Maintain a compliance program to identify deficiencies within our business processes Perform compliance and fair lending risk assessments Review all regulatory environment changes and translating those to changes in policies and procedures
Identify
Monthly detailed reporting throughout the business Quarterly summary reporting to the Board of Directors and senior management Escalate high-risk systemic issuesReport
Develop branch-level compliance training on key risk areas and systemic issues Ensure all employees and directors receive annual compliance trainingTrain

Financial Summary

24
Financial Highlights
_________________(1) Trailing Twelve Months(2) Compared to the three months ended June 30, 2016
1
Fiscal Year 2005 2006 2007 2008 2009 2010 2011 2012 2013 2014 2015 2016 2017
Three months ended
June 30, 2017(2)
Revenue Increase/
(Decrease)17.6% 15.4% 20.2% 18.4% 13.8% 12.4% 11.5% 9.9% 8.1% 5.8% 1.9% (8.6%) (4.6%) 1.4%
Net IncomeIncrease/
(Decrease)18.2% 13.3% 19.9% 8.8% 12.4% 30.4% 23.9% 10.4% 3.4% 2.4% 6.8% (21.1%) (15.8%) (21.4%)
EPSIncrease/
(Decrease)16.8% 16.1% 24.3% 15.1% 18.7% 29.7% 26.5% 18.3% 20.1% 20.0% 27.3% (15.5%) (16.6%) (21.9%)
Avg. Net Loan Growth
18.1% 14.2% 20.2% 20.0% 14.1% 13.7% 14.5% 11.6% 10.6% 7.0% 2.4% (2.5%) (4.6%) 0.4%
Return on Avg. Assets
11.8% 11.9% 12.2% 11.0% 10.9% 12.7% 13.9% 13.9% 13.0% 12.3% 12.9% 10.0% 8.8% 8.3% (1)
Return on Avg. Equity
20.1% 19.9% 20.9% 21.2% 21.2% 22.1% 22.8% 23.6% 27.0% 31.2% 37.6% 24.0% 17.8% 16.3% (1)
Same StoreRevenue
8.6% 10.1% 12.5% 8.9% 7.7% 8.1% 9.0% 6.8% 5.5% 3.7% .83% (6.9%) (3.4%) 1.2%

25
Gross Loans Receivables Loan Origination Volume
Revenue Earnings Per Share
Historical Financial Performance
($ in millions)
($ in millions)($ in millions)
_________________Note: Fiscal year-end is 3/31. Data is through 3/31/2017.
$2,261 $2,572
$2,820 $2,985 $2,954 $2,724 $2,621 $2,508
$0
$500
$1,000
$1,500
$2,000
$2,500
$3,000
$3,500
2010 2011 2012 2013 2014 2015 2016 2017
$770 $875
$973 $1,067 $1,112 $1,110 $1,067 $1,060
$0
$200
$400
$600
$800
$1,000
$1,200
2010 2011 2012 2013 2014 2015 2016 2017
$441 $491
$540 $584
$618 $610 $558 $532
$-
$100
$200
$300
$400
$500
$600
$700
2010 2011 2012 2013 2014 2015 2016 2017
$4.45 $5.63
$6.63 $8.00
$9.60
$11.90
$10.05
$8.38
$-
$2.00
$4.00
$6.00
$8.00
$10.00
$12.00
$14.00
2010 2011 2012 2013 2014 2015 2016 2017

26
Stock repurchase program
$858,799,533*No shares were repurchased in Fiscal 2016
FISCAL YEAR SHARES PURCHASED AVERAGE PURCHASE PRICE PER SHARE
• Fiscal 1996 176,000 shares $10.00
• Fiscal 1997 1,810,000 shares $ 7.88
• Fiscal 2000 144,000 shares $ 5.03
• Fiscal 2001 275,000 shares $ 5.21
• Fiscal 2002 251,891 shares $ 8.65
• Fiscal 2003 1,623,549 shares $ 7.39
• Fiscal 2005 486,000 shares $18.01
• Fiscal 2006 800,400 shares $25.98
• Fiscal 2007 1,209,395 shares $44.73
• Fiscal 2008 1,375,100 shares $30.44
• Fiscal 2009 288,700 shares $27.19
• Fiscal 2010 38,500 shares $37.26
• Fiscal 2011 1,298,057 shares $41.09
• Fiscal 2012 2,181,045 shares $64.10
• Fiscal 2013 2,569,597 shares $71.24
• Fiscal 2014 2,091,699 shares $91.09
• Fiscal 2015 1,432,058 shares $80.53
• Fiscal 2017 95,703 shares $52.20
• Fiscal 2018 58,728 shares $78.57
• Total 18,205,422 shares $47.17

World’s return on assets and equity
12.7%13.9% 13.9% 13.0% 12.3% 12.5%
10.0%8.8%
22.1% 22.8% 23.6%
27.0%
31.2%
36.6%
24.0%
17.8%
0.0%
5.0%
10.0%
15.0%
20.0%
25.0%
30.0%
35.0%
40.0%
2010 2011 2012 2013 2014 2015 2016 2017
Return on Average Assets Return on Average Equity
27
Top Related