


Languages
Pages
Legal

HCEO WORKING PAPER SERIES
Working Paper
The University of Chicago1126 E. 59th Street Box 107
Chicago IL 60637
www.hceconomics.org
Teacher Licensing, Teacher Supply, and StudentAchievement:
Nationwide Implementation of edTPA ∗
Bobby W. Chung†
Jian Zou‡
July, 2021
Abstract
The educative Teacher Performance Assessment (edTPA) - a performance-based exam-ination for prospective PreK-12 teachers to guarantee teaching readiness - has gainedpopularity in recent years. This research offers the first causal evidence about the effectsof this nationwide initiative on teacher supply and student outcomes of new teachers.We leverage the quasi-experimental setting of different adoption timing by states andanalyze multiple data sources containing a national sample of prospective teachers andstudents of new teachers in the US. We find that the new license requirement reducedthe number of graduates from teacher preparation programs by 14%. The negative effectis stronger for non-white prospective teachers at less-selective universities. Contraryto the policy intention, we find evidence that edTPA has adverse effects on studentlearning.
Keywords: teacher licensing, edTPA, occupational licensing, education policyJEL Classification: I28, J2, J44, K31, L51
∗We are thankful for the comments from Dan Bernhardt, Peter Blair, Robert Bruno, Brad Larsen,Benjamin Marx, and Elizabeth Powers, as well as seminar participants at BE-Lab, UIUC, CSOR Conferences,and the Carolina Region Empirical Economics Day. All errors are ours.†School of Labor and Employment Relations, University of Illinois at Urbana-Champaign, 123 LER
building, 504 E.Armory Ave., Champaign, IL 61820. [email protected].‡Department of Economics, University of Illinois at Urbana-Champaign, 1407 West Gregory Drive, Urbana,
IL, 61801. [email protected].
1
1 Introduction
The earliest call for teacher entry requirements in the US dates back to the 1960s following
widespread concerns over declining student test scores (Rudner and Adelman, 1987). After
decades of development, teacher licensure became the primary guaranteer of teacher quality in
U.S. public schools. Although teacher licensing is universal in the U.S., the requirements have
been determined by the state legislature and they have varied substantially across jurisdictions.
The complex historical development and a lack of concurrent national data create challenges
to evaluating the impacts of teacher licensure on teachers and their students on a nationwide
scale. Moreover, the net effect of teacher licensure is unclear: license requirements increase
entry costs that reduce teacher availability and may distort investments; but a minimum
standard of teachers may improve student learning by eliminating incompetent teachers or
training teacher skills.
In recent years, the educative Teacher Performance Assessment (edTPA) – a performance-
based examination to evaluate the teaching readiness of prospective teachers – has gained
popularity across the nation. By 2018, edTPA had become a mandatory testing component for
initial teacher licensure and program completion in eight states, providing a contemporaneous
quasi-experimental setting to evaluate the effectiveness of teacher licensure.1
Unlike the traditional one-time written examinations, edTPA is a semester-long project
involving lesson plans, classroom videos, and follow-up reports. The required money and
time investment create an additional barrier to entry, potentially exacerbating the existing
teacher shortages (Bergstrand Othman et al., 2017; Goldhaber et al., 2017; Petchauer et
al., 2018; Gilbert and Kuo, 2019). It is also an open question as to whether the assessment
benefits students. A higher requirement filters pre-service teachers at the lower tail of
quality distribution, but may lead to negative sorting where higher ability candidates opt for
better outside options (Angrist and Guryan, 2004; Goldhaber, 2007; Larsen et al., 2020).2
1In total, 18 states recognized edTPA as a test option for initial teacher licensure in 2018. We definetreatment states as those with edTPA being the only option. See Section 2 about the policy timing.
2Kugler and Sauer (2005) also documented that licensing induced negative selection in the physician
1
Complementarities between the test content and quality of teaching are also key for the new
standard to benefit student learning. The overall impacts of edTPA then connect broadly to
traditional debates in economics about whether occupational licensing is welfare-improving
(Friedman, 1962; Leland, 1979; Shapiro, 1986; Kleiner and Soltas, 2019).
This paper provides the first causal evidence about the effects of edTPA on teacher
supply and student outcomes. We build on extant qualitative or case-specific analyses in
education literature, providing a quantitative evaluation of edTPA using a national sample
of new teachers and their students. Our identification strategy leverages different policy
timing, comparing outcomes of interest in treatment states with other states before and after
the adoption of edTPA. The analysis applies to the ongoing debate about the implementa-
tion/revocation of edTPA in different states, and it speaks to the efficacy of teacher licensure
and occupational licensing in general.
We first examine the number of graduates from teacher preparation programs documented
in the Integrated Postsecondary Education Data (IPEDS) that captures the majority of
potential teacher supply. Analyzing graduation years from 2011 to 2019, we find that edTPA
reduced the number of teacher graduates by about 14%. This negative effect is stronger
in less selective universities and for minority candidates, suggesting issues associated with
equity concerns and entry barriers created by edTPA. We are one of the first to document
the employment/labor supply effect of teacher licensing (Larsen et al., 2020).
Besides its adverse impacts on teacher supply, we find evidence that edTPA harms the
student learning of new teachers. We analyze the restricted student data from 2009 to 2017
in the National Assessment of Educational Progress (NAEP) that contains the test scores of
a national sample of students in the US. The NAEP is the largest nationally representative
assessment in core subjects that provide a common yardstick to compare student progress
in different states. Importantly for our analysis, the dataset also links students to the years
of experience of their corresponding subject teachers. This unique feature allows us to
profession.
2
accurately measure the potential benefit of edTPA by focusing on new teachers. Contrary to
the policy intention, we find that edTPA decreases student test scores. This negative effect is
concentrated on students at higher ability percentiles. The adverse impact is consistent with
findings from qualitative studies that onerous workloads hinder prospective teachers from
learning how to teach (Greenblatt, 2016; Shin, 2019). Although we also find some positive
impacts on reading scores, the estimates are sensitive to the specification. As far as the
outcomes (teacher supply and student outcome) we study, the overall impacts of this recent
nationwide reform are negative.
In addition to providing a thorough evaluation of one particular policy, this paper con-
tributes to the broader interests of teacher licensure. Economists have endeavored to quantify
the benefits of teacher licensure (Angrist and Guryan, 2008; Clotfelter et al., 2007, 2010;
Goldhaber and Brewer, 2000; Kane et al., 2008; Sass, 2015). Previous results are mixed,
reflecting the differences in research design and policy context. We offer complementary evi-
dence that can be generalized to the whole US by looking at the most controversial licensure
initiative in recent years. Apart from updating the evidence on students, we also document
the extent to which licensure policy is related to teacher shortages, complementing analyses
of commonly-discussed factors, including monetary incentives (Goldhaber et al., 2015; Feng
and Sass, 2018), work environment (Carter and Carter, 2000; Carroll et al., 2000), support
from teacher programs (Liu et al., 2004), and other education reforms (Guarino et al., 2006;
Kraft et al., 2020).
Our results also speak to the efficacy of occupational licensing. Researchers found that
licensing reduces employment (Blair and Chung, 2019; Chung, 2020), increases price/wage
(Kleiner, 2000; Kleiner and Krueger, 2013; Thornton and Timmons, 2013), and has minimal
improvement on quality (Carpenter and Dick, 2012; Kleiner et al., 2016; Anderson et al.,
2020; Farronato et al., 2020).3 Several studies have pointed to the signaling value of licensing
(Law and Marks, 2009; Blair and Chung, 2018, 2020; Xia, 2021). Most empirical work on
3Anderson et al. (2020) are among the few to find a positive quality effect.
3

licensing uses cross-sectional variation or historical data. In contrast, we exploit a unique
contemporary policy change in an important profession to provide sharper identification. To
the extent that public school teachers comprise a large and socially influential workforce, our
paper offers three important results about the welfare consequences of occupational licensing:
the policy reduces labor supply and creates shortages; exacerbates diversity concerns; and,
does not benefit consumers (students in our setting).
Lastly, our results speak to the unintended consequences of high-stake teacher assessments.
The goal of performance-based evaluations in public schools is to improve teacher performance
by providing incentives. Unfortunately, studies have found ample evidence that high-stakes
on-the-job evaluations exerted pressure on teachers, hampering teacher recruitment and
retention (Reback et al., 2014; Dee and Wyckoff, 2015; Sartain and Steinberg, 2016; Kraft
et al., 2020; Cullen et al., 2021). We evaluate a new performance-based assessment for
pre-service teachers and offer complementary findings that high-stake assessments dampen
new teacher supply.
2 Background of edTPA
Modern licensure tests for prospective teachers mostly cover three areas: basic skills (such
as reading, writing, grammar, mathematics), subject matter, and pedagogical knowledge
(Larsen et al., 2020). For pedagogical knowledge, the education community in the 1990s
started to recognize the need for performance evaluation rather than written examinations
to guarantee the teaching readiness of prospective teachers (Sato, 2014).
The earliest attempt to incorporate a performance evaluation process into the teacher
licensure system was in 1998 in California.4 Borrowing from the experience and models in
California, the American Association of Colleges of Teacher Education (AACTE), which is
the leading organization representing educator preparation programs in the US, cooperated
4The legislation is ‘CA Senate Bill 2042’. Among a variety of models, popular options include theCalifornia Teaching Performance Assessment (CalTPA) and the Performance Assessment for CaliforniaTeachers (PACT)
4

with the Stanford Center for Assessment to develop a standardised assessment called the
educative Teacher Performance Assessment (edTPA) for nation-wide adoptions.5
Unlike the usual form of written examinations, edTPA requires candidates to show
competency in preparing classes by submitting detailed lesson plans, delivering instruction
effectively by recording the lesson during the internship, and properly assessing student
performance to guide future instruction via a thorough analysis of student learning outcomes.
The experts at Pearson then score a candidate’s materials in three areas: ‘Planning for
Instruction and Assessment’, ‘Instructing and Engaging Students in Learning’, and ‘Assessing
Student Learning’.6 Preparation for edTPA takes place alongside the teaching internship.
The entire whole process can take semesters.
Some education scholars contend that this performance-based format better reflects the
complexity of teaching better than written examinations and prepare teachers to focus on
student learning (Darling-Hammond and Hyler, 2013). However, ample qualitative evidence
suggests that edTPA discourages new teachers from entering the teaching profession. Gilbert
and Kuo (2019) find that the test fee together with miscellaneous expenses add a significant
burden to students who have already struggled financially. Bergstrand Othman et al. (2017)
find that time commitment and the uncertainty about passing the exam created mental stress
to the teacher candidates. Besides, Greenblatt (2016) and Shin (2019) suggest that teacher
candidates often found themselves focusing too much on catching up the scoring rubrics
and deadline at the expense of teaching opportunities. Worse still, the negative impacts fall
disproportionately on minority and lower-income candidates (Greenblatt and O’Hara, 2015;
Goldhaber et al., 2017; Petchauer et al., 2018).7
By 2018, eight states had implemented edTPA to evaluate teaching effectiveness for
5EdTPA is now administered by Pearson Education, Inc.6Interested readers can refer to the official edTPA document (http://www.edtpa.com/Content/Docs/
edTPAMGC.pdf) for a more detailed description on the assessment scheme.7From the latest official statistics of edTPA (https://secure.aacte.org/apps/rl/res_get.php?fid=
3621&ref=rl), the average pass rate is between 75% and 92%. The pass rate for ethnic minorities issignificantly lower than for their white counterparts.
5

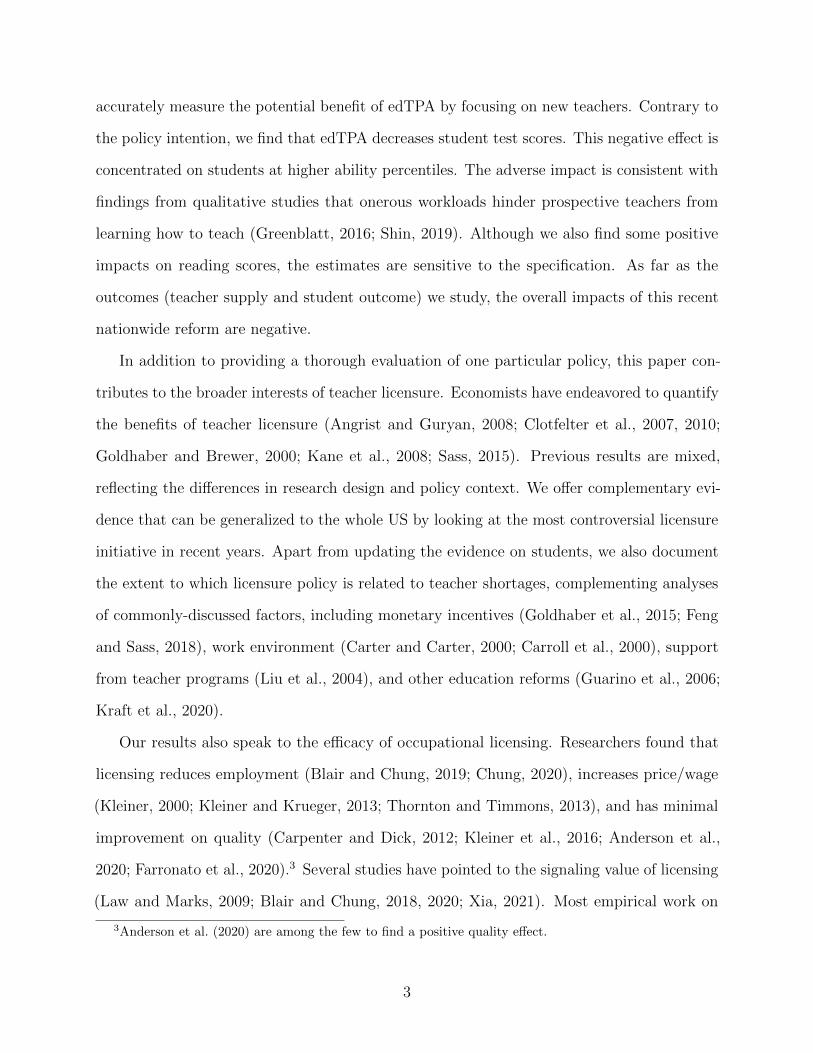
prospective public school teachers (see Figure 1).8 Washington and New York were among
the earliest states mandated edTPA as a necessary component for program completion and
initial teacher licensure in January and May 2014, respectively. Prospective teachers have
to satisfy a cutoff score to graduate from the teacher preparation program and qualify for a
teacher license.9 Later, the mandatory nature of edTPA expanded to Georgia (September
2015), Illinois (September 2015), Wisconsin (September 2016), New Jersey (September 2017),
Alabama (September 2018) and Oregon (September 2018).10
Not all states consider edTPA as the sole assessment choice. By 2018, ten other states
had recognized edTPA as an assessment option. Since teacher candidates in these states
may opt for existing options other than edTPA, we do not include the optional states in the
baseline analysis.11 To check sensitivity of this sample criteria, we add them as control states
in a robustness analysis.
8Official document can be found here: https://secure.aacte.org/apps/rl/res_get.php?fid=1014&
ref=edtpa. We cross-check the mandatory nature in the official websites of state education departments.9The cutoff scores vary by states and subjects. For a typical 15-Rubric criteria with a full score of 75,
passing scores range from 35 to 42.10In 2019, Connecticut and Tennessee also mandated edTPA. Since our sample ends in 2019, we treat
these two states as the control states in the empirical analysis.11The optional states include Arkansas, California, Delaware, Hawaii, Iowa, Maryland, Minnesota, North
Carolina, South Carolina, and West Virginia. Ohio, Texas and Utah also regarded edTPA as an assessmentoption after 2018.
6
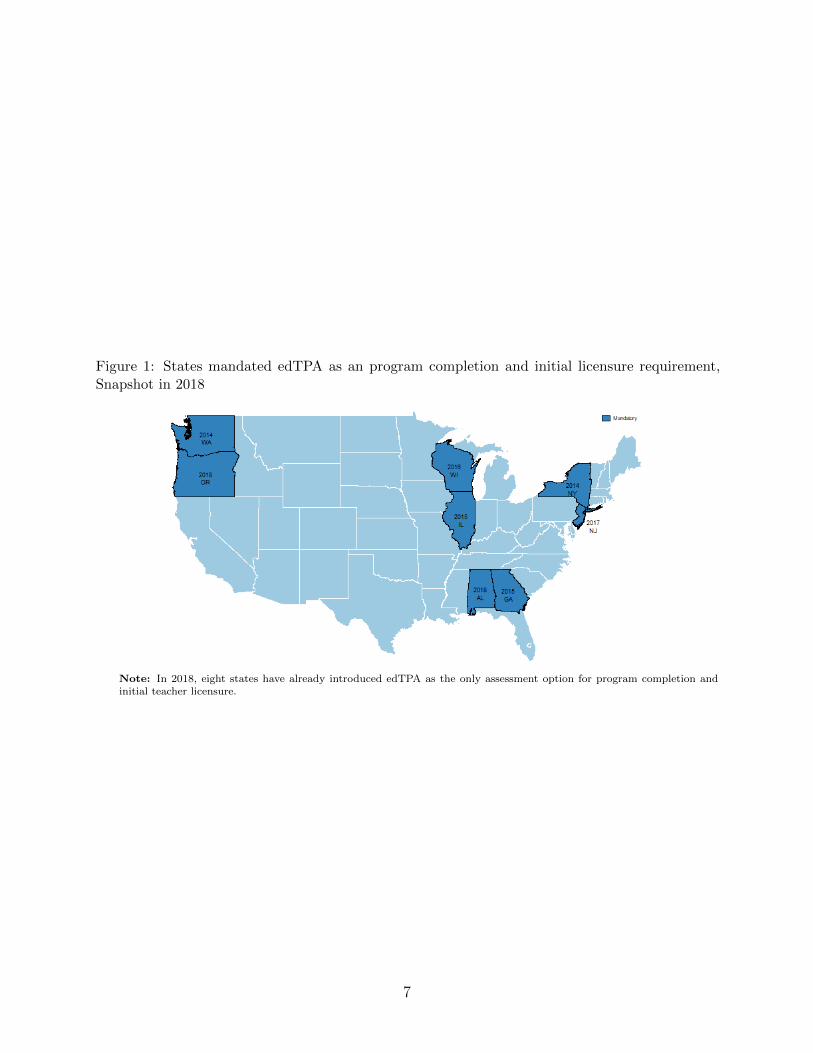
Figure 1: States mandated edTPA as an program completion and initial licensure requirement,Snapshot in 2018
Note: In 2018, eight states have already introduced edTPA as the only assessment option for program completion andinitial teacher licensure.
7
3 Data
3.1 IPEDS
We measure the teacher supply response to the implementation of edTPA by the number
of graduates from teacher preparation programs in post-secondary institutions. The data
is obtained from the Integrated Postsecondary Education Data (IPEDS), which contains
rich information about the characteristics of post-secondary institutions in the entire US.
We exploit the detailed statistics of program completion by majors and identify graduates
in teacher preparation programs (both bachelor’s and master’s degrees) from school year
2010/2011 to 2018/2019.12 The majors include ‘Education, General’, ‘Bilingual, Multilingual,
and Multicultural Education’,‘Curriculum and Instruction’, ‘Special Education and Teaching’,
‘Teacher Education & Professional Development, Specific Levels and Methods’, ‘Teaching
English or French as a Second or Foreign Language”, and ‘Education, Other’.13 We then
aggregate the number of teacher graduates at the institution level. In the sample, we have a
panel of 1,243 post-secondary institutions that offer teacher preparation programs.
In Panel A of Table 1, in addition to the outcomes of interest — the number of teacher
graduates and the breakdown by white and non-white candidates — we report time-varying
institution characteristics to account for concurrent changes in student demographics and
the quality of institutions.14 The variables include the number and percent of minority of
graduates in non-education majors, the submission rates and percentile scores of SAT/ACT,
first-year full-time enrollment, par-time to full-time faculty ratio, and the amount of and the
percent of students receiving federal grants/loans.
12To become a licensed public school teacher in the US, a prospective teacher from the traditional route goesthrough training in a teacher preparation program. Alternatively, a person with a degree from non-educationmajor can opt for the alternative route to complete an approved postgraduate program. EdTPA applies tothe candidates in both the traditional and alternative route to teacher certification, and the IPEDS captureboth sources.
13IPEDS defines the major of a program using CIP codes. We follow the definition of teacher preparationprograms recommended by Kraft et al. (2020) in their Appendix C.
14In Table A1 of appendix, we present the summary statistics for all states.
8

Table 1: Summary statistics (IPEDS) - Estimation Sample
Mean SD Min Max
A. Outcomes:education graduates 142.31 188.28 0.00 3041.00education graduates (white) 107.42 139.71 0.00 1763.00education graduates (non-white) 34.89 66.76 0.00 1968.00
B. Time-varying controls:graduates (non-education majors) 1594.51 2160.49 1.00 16364.00minority graduates (% of non-education majors) 16.57 17.68 0.00 100.00SAT submission rate 51.22 34.20 0.00 100.00ACT submission rate 52.81 32.12 0.00 100.00SAT 25 percentile score 476.10 65.18 215.00 740.00SAT 75 percentile score 583.41 63.97 349.00 800.00ACT 25 percentile score (cumulative) 20.38 3.31 3.00 33.00ACT 75 percentile score (cumulative) 25.58 3.18 8.00 35.00first-year FT enrollment 1056.10 1315.98 9.00 9082.00part-time/full-time faculty ratio 0.03 0.11 0.00 2.32grant (% student) 76.19 16.74 16.00 100.00grant (dollar amount, thousands) 44407.21 48785.28 326.33 397711.80loan (% student) 58.80 16.66 0.00 99.00loan (dollar amount, thousands) 21099.54 24175.53 0.00 256364.16
Data: IPEDS 2011-2019.Note: This table shows summary statistics of estimation sample for teacher supply using IPEDS. Optional statesare excluded. Summary statistics for all states are presented in the appendix.
3.2 NAEP
To assess the effect of edTPA on student achievement, we analyze the biennial restricted
data of the National Assessment of Educational Progress (NAEP) administered by the U.S
Department of Education and the Institute of Education Sciences from 2009 to 201715. The
assessment is a nationwide test in the US that measures the knowledge of a representative
sample of students in various core subjects16. The standardized nature of the test enables
us to compare student achievement across the country using a common measurement. We
standardize the assessment scores by first averaging the composite values of five (or twenty)
assessment items within each year-grade-subject and then standardize the averaged assess-
ment scores over the estimation sample to have a zero mean and one standard deviation
15NAEP 2017 provides the latest restricted-use data that is available for application.16The subjects include reading, mathematics, science, writing, arts, civics, geography, economics, U.S.
history, and technology & engineering literacy.
9
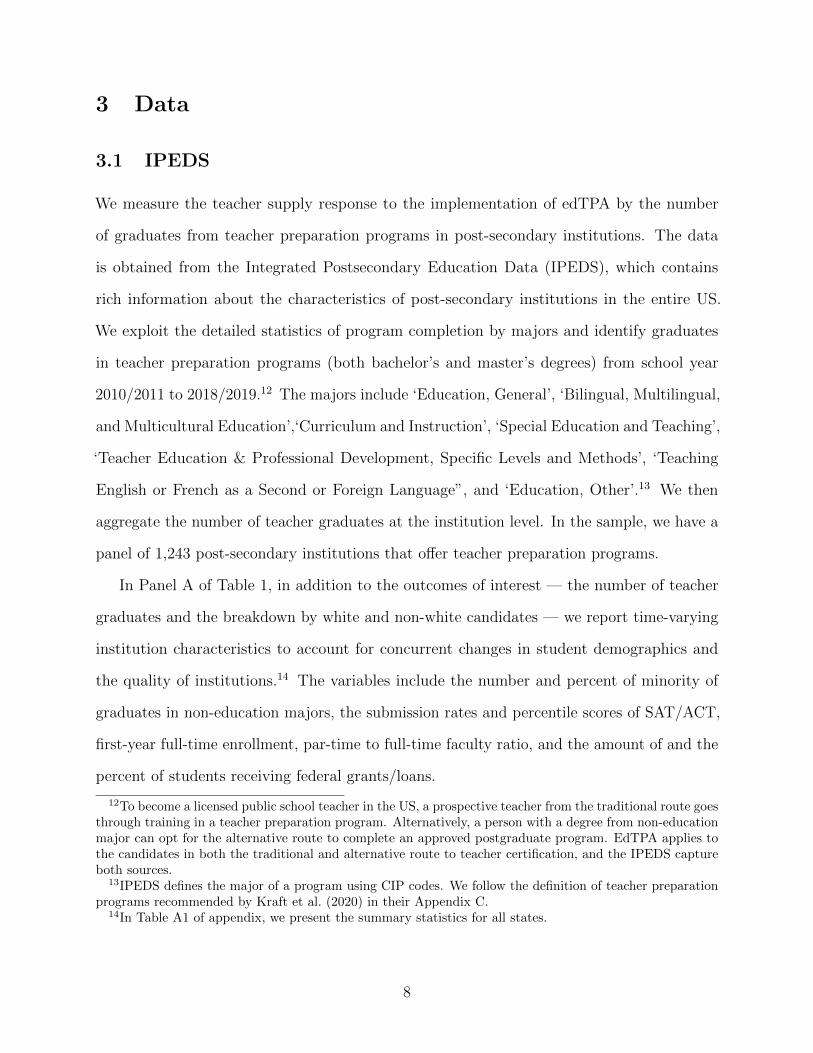
Table 2: Summary statistics (NAEP)
Grade 4 Math Grade 4 Reading Grade 8 ReadingA. Outcomes:
Assessment score 234.67 (27.93) 215.25 (34.46) 250.37 (37.41)
B. Student controls:White 0.41 (0.49) 0.42 (0.49) 0.45 (0.50)Black 0.17 (0.38) 0.17 (0.37) 0.17 (0.38)Hispanic 0.30 (0.46) 0.30 (0.46) 0.26 (0.44)Female 0.49 (0.50) 0.50 (0.50) 0.50 (0.50)Individualized Education Program (IEP) 0.13 (0.33) 0.12 (0.32) 0.11 (0.31)English learner 0.11 (0.31) 0.10 (0.30) 0.06 (0.24)
C. School controls:Charter school 0.05 (0.22) 0.05 (0.22) 0.05 (0.22)Urban area 0.78 (0.41) 0.78 (0.42) 0.75 (0.43)Share of black student 21.49 (28.92) 20.81 (28.19) 20.24 (28.67)Lunch program 0.60 (0.49) 0.59 (0.49) 0.55 (0.50)Student enrollment (≥ 500) 0.49 (0.50) 0.49 (0.50) 0.50 (0.50)
Number of Student 63,610 64,710 52,470
Data: NAEP 2009-2017.Note: This table shows summary statistics of estimation sample (students with new teachers) for student achievement usingNAEP. The mean is shown in the cell while the standard deviation is shown in the parentheses. Each column presents one ofthe three student assessment samples: Math at Grade 4 , Reading at Grade 4, and Reading at Grade 8. Raw assessment scoresare reported in the summary statistics. The number of observations is rounded to the nearest 10 per IES disclosure guidelines.
within the same year-grade-subject level.17
NAEP also provides important characteristics of students and schools, which enable more
precise estimations by including them as controls. They allow us to conduct balance tests
by regressing these predetermined variables on edTPA policy variances in our later analyses.
The student controls include student’s race and gender, if the student needs an Individualized
Education Program (IEP), and if the student is an English-language learner. The school
controls include share of black students, indicators for charter school, urban area, eligibility
of lunch programs, and whether school enrollment is larger than 500 students18.
In addition to rich student and school characteristics, the NAEP data links students to
17In survey year 2009 and 2011, NAEP uses a five-item scale to measure the composite values of students’math and reading assessment at grade 4 and 8. In survey year 2013, 2015, and 2017, NAEP uses a twenty-itemscale for math and reading assessment at grade 4 and 8.
18While most control variables employed in this study share consistent measures across the two subjectsand grades, one exception is the school enrollment. For students at grade 4, we use enrollment larger than500 to indicate magnitude of schools. However, for students at grade 8, we use enrollment larger than 600 inyear 2009, 2011, 2013, and 2017, as data in these years use a different category for enrollment measure.
10
characteristics of the corresponding subject teacher. This enables us to narrow down the
sample to students whose teachers have less than two years. This criterion is importance
since edTPA only applies to new teachers.19 As far as the data provides, we assess student
performances in the mathematics score at grade 4, and the reading scores at grades 4 and
8.20 To ensure that the teachers have gone through the standard license procedure, we drop
students whose subject teachers do not have a teacher license.
Combining the NAEP from different cohorts yields a repeated cross-sectional sample of
students. To address the concern that changes in student and school characteristics may
affect teacher assignments and contaminate the causal estimates, we control for student and
school characteristics presented in Table 2.
19The question on years of experience contains continuous measures in survey year 2009 and 2011 andcategorical responses in year 2013, 2015, and 2017. The categorical responses are listed as the following: Lessthan 1 year, 1-2 years, 3-5 years, 6-10 years, 11-20 years, 21 or more years, omitted, and multiple responses.
20The restricted data also tracks the mathematics scores at grade 8. However, it does not contain teacherexperience in 2017 survey year and cannot identify new teachers.
11

4 Identification Strategy
4.1 Teacher Supply
We estimate the effects of the mandatory edTPA requirement on teacher and student outcomes
using a difference-in-differences framework with the leads and lags of treatment. Formally,
for teacher supply analysis, we employ the following specification:
Yu,s,t =∑k 6=−1
βkedTPAs,t1(t = t∗ + k) + Xu,s,tΓ + Zs,tθ + αu + αt + εu,s,t (1)
where Yu,s,t refers to the log of the number of teacher graduates from institution u in state
s in year t. To differentiate the edTPA effects on teacher supply by race, we run separate
regressions on the number of white and non-white candidates. edTPA is a dummy indicator
equals 1 after a state mandated edTPA as the initial licensure requirement in the graduation
year t∗. In the above non-parametric model, the omitted period is the graduation year right
before the policy took effect. For example, the effective date in Illinois is September 2015.
Its omitted year is the 2014/2015 school year. Then, β(k>−1) measures the edTPA effect on
teacher supply in a given post-policy year, whereas β(k<−1) detects any deviation in trends
in the pre-policy period between the edTPA and non-edTPA states. Xu,s,t refers to a vector
of time-varying controls at the institution level presented in Table 1. Zs,t refers to a series of
education policy indicators suggested by Kraft et al. (2020) to control for potential confounds
on the teacher supply response. The policies include the elimination of teacher tenure, the
increase in probationary period, the elimination of mandatory union dues, the adoption of
Common Core Standards, and changes in the licensure content.21 αu and αt are institution
and year fixed effects, respectively. To account for serial correlation within a state, we cluster
the standard errors at the state level.
21We code the policy year based on Table A1 of Kraft et al. (2020).
12

4.2 Student Outcomes
To estimate the impacts of edTPA on student achievement, we exploit the same policy
variation in which edTPA becomes consequential in the educator licensing process shown in
Figure 1 using the NAEP data. Since the latest available year in NAEP is 2017, we adjust
the treatment groups to students in the five earlier edTPA states, namely Washington, New
York, Illinois, Georgia, and Wisconsin. Because the mathematics and reading test in NAEP
are administered bi-annually, the maximum number of of post-treatment periods is two (2015
and 2017 for Washington and New York; 2017 for Illinois, Georgia, and Wisconsin). We
employ the same differences-in-differences framework with a repeated cross-sectional sample
of students. Formally, we estimate the following model:
Yi,j,s,t =k=1∑
k=−4,k 6=−1
βkedTPAs,t1 (t = t∗ + k) + Xi,j,s,tΓ + Zs,tθ + αs + αt + εi,j,s,t (2)
where Yist is the student i’s outcome in school j in state s sampled in period t. We again
included the leads and lags of treatment indicators (edTPA) to check the parallel-trend
assumption and also capture the dynamic effects. t∗s is the policy implementation year, which
varies by states. Xi,j,s,t is a vector of student and school control variables. αs and αt are
the state fixed effects and year fixed effects, respectively. Stand errors are clustered at state
level, which is the level edTPA policies were implemented. While this specification is almost
identical to the one for teacher supply above, there is a difference on the time period because
of the data structure. NAEP is a biennial assessment and the NAEP data we obtained is
from 2009 to 2017, the time period of this specification ranges is from -4 to 1 and each period
t represents two years.
13
5 Teacher Supply
5.1 Main Results
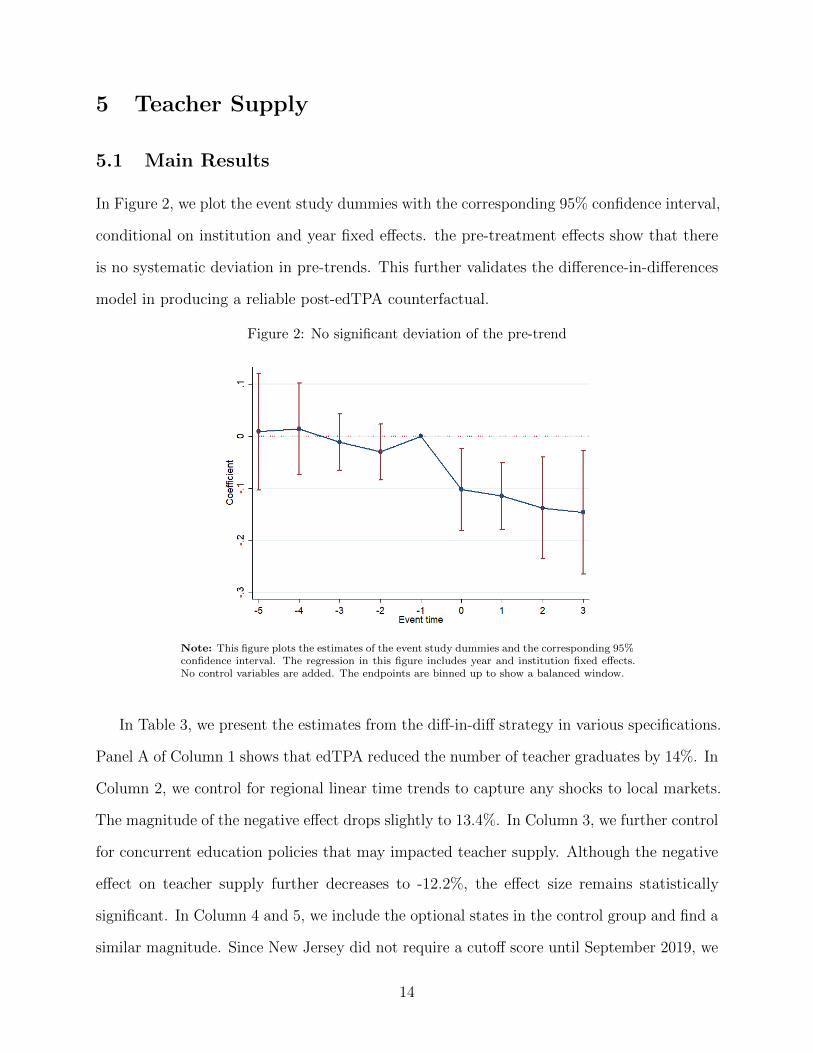
In Figure 2, we plot the event study dummies with the corresponding 95% confidence interval,
conditional on institution and year fixed effects. the pre-treatment effects show that there
is no systematic deviation in pre-trends. This further validates the difference-in-differences
model in producing a reliable post-edTPA counterfactual.
Figure 2: No significant deviation of the pre-trend
Note: This figure plots the estimates of the event study dummies and the corresponding 95%confidence interval. The regression in this figure includes year and institution fixed effects.No control variables are added. The endpoints are binned up to show a balanced window.
In Table 3, we present the estimates from the diff-in-diff strategy in various specifications.
Panel A of Column 1 shows that edTPA reduced the number of teacher graduates by 14%. In
Column 2, we control for regional linear time trends to capture any shocks to local markets.
The magnitude of the negative effect drops slightly to 13.4%. In Column 3, we further control
for concurrent education policies that may impacted teacher supply. Although the negative
effect on teacher supply further decreases to -12.2%, the effect size remains statistically
significant. In Column 4 and 5, we include the optional states in the control group and find a
similar magnitude. Since New Jersey did not require a cutoff score until September 2019, we
14

exclude it in Column 6 and still find a similar result. In Panel B and C of Table 3, we also
find a similar pattern when we breakdown teacher graduate statistics by white and non-white
candidates.
Table 3: Diff-in-diff estimates with various specifications
(1) (2) (3) (4) (5) (6)All states Include optional states Drop NJ
Panel A: All groups
edTPA -0.140*** -0.134*** -0.122*** -0.161*** -0.136*** -0.130***(0.0487) (0.0374) (0.0353) (0.0518) (0.0332) (0.0367)
Constant 2.117*** 2.210*** 2.199*** 1.997*** 2.133*** 2.222***(0.376) (0.417) (0.420) (0.305) (0.328) (0.424)
R-squared 0.190 0.195 0.199 0.171 0.185 0.197
Panel B: White
edTPA -0.130*** -0.122*** -0.112*** -0.148*** -0.119*** -0.114***(0.0431) (0.0339) (0.0324) (0.0441) (0.0280) (0.0346)
Constant 2.072*** 2.192*** 2.181*** 2.033*** 2.166*** 2.189***(0.337) (0.363) (0.369) (0.271) (0.287) (0.375)
R-squared 0.200 0.204 0.207 0.176 0.185 0.205
Panel C: Non-white
edTPA -0.134** -0.137*** -0.111*** -0.156** -0.123*** -0.123***(0.0569) (0.0374) (0.0348) (0.0611) (0.0362) (0.0355)
Constant 0.488 0.447 0.422 0.543 0.531 0.513(0.497) (0.535) (0.529) (0.422) (0.433) (0.524)
R-squared 0.065 0.071 0.075 0.060 0.071 0.075
Observations 7,281 7,281 7,281 10,598 10,598 7,091Number of unitid 858 858 858 1,243 1,243 836Regional trend X X X XPolicy controls # X X X
Data: IPEDS, 2011-2019
Note: Each column in each panel represents one regression. Dependent variable in each regression is the log of thenumber of teacher graduates (by race). All regressions include time-varying controls in Panel A of Table 1, year andinstitution fixed effects. #The policy controls are based on Table A1 of Kraft et al. (2020). Standard errors in theparenthesis are clustered at the state level. ***, **, and * represent 1%, 5%, and 10% significant level, respectively.
In Table 4, we differentiate the effects by program types. We run the analyses using
the full specification with all institution controls, regional time trend, and policy controls.
Column 1 to 3 show that edTPA reduced the number of teacher graduates in the traditional
15
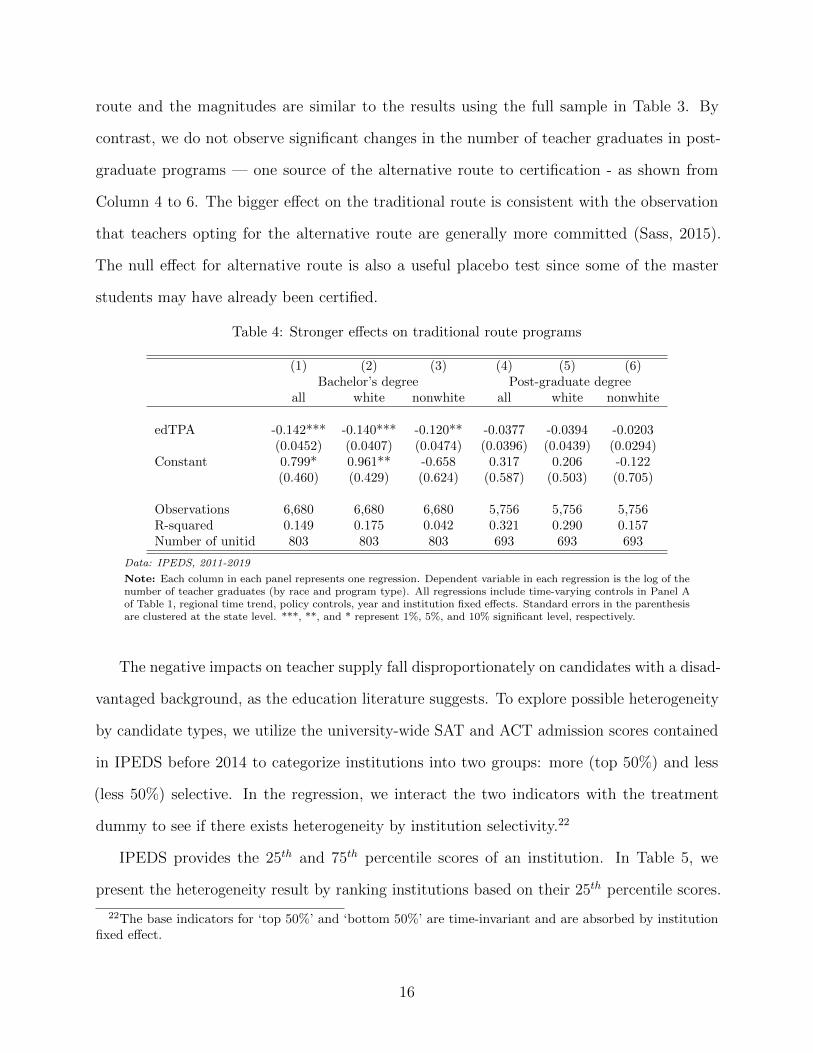
route and the magnitudes are similar to the results using the full sample in Table 3. By
contrast, we do not observe significant changes in the number of teacher graduates in post-
graduate programs — one source of the alternative route to certification - as shown from
Column 4 to 6. The bigger effect on the traditional route is consistent with the observation
that teachers opting for the alternative route are generally more committed (Sass, 2015).
The null effect for alternative route is also a useful placebo test since some of the master
students may have already been certified.
Table 4: Stronger effects on traditional route programs
(1) (2) (3) (4) (5) (6)Bachelor’s degree Post-graduate degree
all white nonwhite all white nonwhite
edTPA -0.142*** -0.140*** -0.120** -0.0377 -0.0394 -0.0203(0.0452) (0.0407) (0.0474) (0.0396) (0.0439) (0.0294)
Constant 0.799* 0.961** -0.658 0.317 0.206 -0.122(0.460) (0.429) (0.624) (0.587) (0.503) (0.705)
Observations 6,680 6,680 6,680 5,756 5,756 5,756R-squared 0.149 0.175 0.042 0.321 0.290 0.157Number of unitid 803 803 803 693 693 693
Data: IPEDS, 2011-2019
Note: Each column in each panel represents one regression. Dependent variable in each regression is the log of thenumber of teacher graduates (by race and program type). All regressions include time-varying controls in Panel Aof Table 1, regional time trend, policy controls, year and institution fixed effects. Standard errors in the parenthesisare clustered at the state level. ***, **, and * represent 1%, 5%, and 10% significant level, respectively.
The negative impacts on teacher supply fall disproportionately on candidates with a disad-
vantaged background, as the education literature suggests. To explore possible heterogeneity
by candidate types, we utilize the university-wide SAT and ACT admission scores contained
in IPEDS before 2014 to categorize institutions into two groups: more (top 50%) and less
(less 50%) selective. In the regression, we interact the two indicators with the treatment
dummy to see if there exists heterogeneity by institution selectivity.22
IPEDS provides the 25th and 75th percentile scores of an institution. In Table 5, we
present the heterogeneity result by ranking institutions based on their 25th percentile scores.
22The base indicators for ‘top 50%’ and ‘bottom 50%’ are time-invariant and are absorbed by institutionfixed effect.
16

In Column 1 and 4, both the results using SAT and ACT ranking show that the difference in
effect size between the two institution types is not significant, though the coefficient for less
selective institutions is slightly bigger. When we differentiate the effects by race, we observe
a significantly larger impact on minority candidates in less selective universities as shown
in Column 3 and 6. The p-values of the difference between coefficients are 0.022 and 0.027,
respectively. To check sensitivity, we also find similar patterns in Table A2 of Appendix with
the 75th percentile scores.
Table 5: Heterogeneity by the selectivity of university
(1) (2) (3) (4) (5) (6)Selectivity by SAT Selectivity by ACT
all white nonwhite all white nonwhite
edTPA*(bottom 50%) -0.129*** -0.0997*** -0.148** -0.152*** -0.121** -0.164**(0.0387) (0.0355) (0.0629) (0.0451) (0.0484) (0.0624)
edTPA*(top 50%) -0.0865* -0.108** -0.0215 -0.0613 -0.0858 -8.89e-05(0.0454) (0.0468) (0.0430) (0.0548) (0.0570) (0.0536)
Constant 2.121*** 2.077*** 0.451 2.138*** 2.083*** 0.481(0.397) (0.361) (0.507) (0.397) (0.360) (0.505)
Observations 7,204 7,204 7,204 7,204 7,204 7,204R-squared 0.199 0.207 0.072 0.199 0.207 0.073Number of unitid 832 832 832 832 832 832
Data: IPEDS, 2011-2019
Note: Dependent variable in each regression is the log of the number of teacher graduates (by race). All regressionsinclude time-varying controls in Panel A of Table 1, policy controls, year and institution fixed effects. We categoriseinstitutions into more (top 50%) and less (bottom 50%) according to their pre-2014 25th percentile SAT/ACTscores. Standard errors in the parenthesis are clustered at the state level. ***, **, and * represent 1%, 5%, and10% significant level, respectively.
17
5.2 Robustness
Because we are leveraging different policy timing across states, one concern is that the propen-
sity to adopt edTPA is correlated with the regional teacher market conditions. Although
previous licensing studies have pointed out that state variation in licensing policy is largely
determined randomly by political forces, we perform balance tests to show there are no
systematic differences in observed characteristics between edTPA and non-edTPA states.23
In all columns of Table 6, we regress an indicator equals 1 if a state adopted edTPA during
the sample period on its pre-2014 attributes, including the level/growth of the number of
teacher graduates, and average institution characteristics. Across columns, we use different
measures of institution quality available in IPEDS to probe the sensitivity of the estimates.
In all specifications, we do not find a strong evidence that edTPA adoption was correlated
with pre-policy characteristics of post-secondary institution or teacher graduates. This gives
us credence about the quasi-random nature of edTPA implementations.
We then perform a couple of placebo tests to show that our identified effect on teacher
supply does not capture confounding factors, such as unmeasured shocks of teacher supply
and demand. First, in Table 7, we find that the placebo treatment has essentially zero effects
on the number of non-education graduates. This alleviates the concern that the drop of
teacher graduates simply reflects state-specific shocks in tertiary education.
In Table 8, we run a series of auxiliary fixed-effect models excluding the time-varying
controls. As shown in Column 1 to 6, the edTPA treatment does not change institution
characteristics, including first-year enrollment (all majors), faculty resource, and the financial
background of students. In Column 7 of Table 8, we also find that there is no significant
changes in teacher demand measured by public school enrollments.24
23Relevant studies include Kleiner and Soltas (2019) and Larsen et al. (2020).24We pool the state level statistics (2011-2019) from the National Center for Education Statistics (NCES).
18
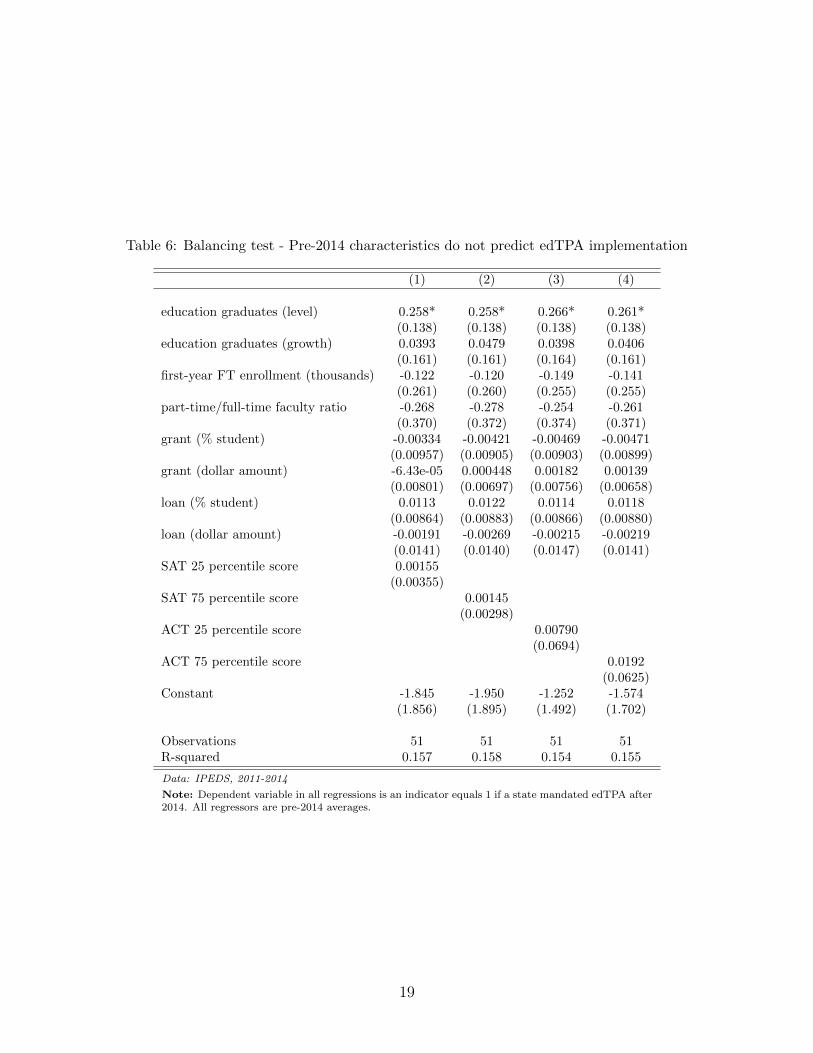
Table 6: Balancing test - Pre-2014 characteristics do not predict edTPA implementation
(1) (2) (3) (4)
education graduates (level) 0.258* 0.258* 0.266* 0.261*(0.138) (0.138) (0.138) (0.138)
education graduates (growth) 0.0393 0.0479 0.0398 0.0406(0.161) (0.161) (0.164) (0.161)
first-year FT enrollment (thousands) -0.122 -0.120 -0.149 -0.141(0.261) (0.260) (0.255) (0.255)
part-time/full-time faculty ratio -0.268 -0.278 -0.254 -0.261(0.370) (0.372) (0.374) (0.371)
grant (% student) -0.00334 -0.00421 -0.00469 -0.00471(0.00957) (0.00905) (0.00903) (0.00899)
grant (dollar amount) -6.43e-05 0.000448 0.00182 0.00139(0.00801) (0.00697) (0.00756) (0.00658)
loan (% student) 0.0113 0.0122 0.0114 0.0118(0.00864) (0.00883) (0.00866) (0.00880)
loan (dollar amount) -0.00191 -0.00269 -0.00215 -0.00219(0.0141) (0.0140) (0.0147) (0.0141)
SAT 25 percentile score 0.00155(0.00355)
SAT 75 percentile score 0.00145(0.00298)
ACT 25 percentile score 0.00790(0.0694)
ACT 75 percentile score 0.0192(0.0625)
Constant -1.845 -1.950 -1.252 -1.574(1.856) (1.895) (1.492) (1.702)
Observations 51 51 51 51R-squared 0.157 0.158 0.154 0.155
Data: IPEDS, 2011-2014
Note: Dependent variable in all regressions is an indicator equals 1 if a state mandated edTPA after2014. All regressors are pre-2014 averages.
19
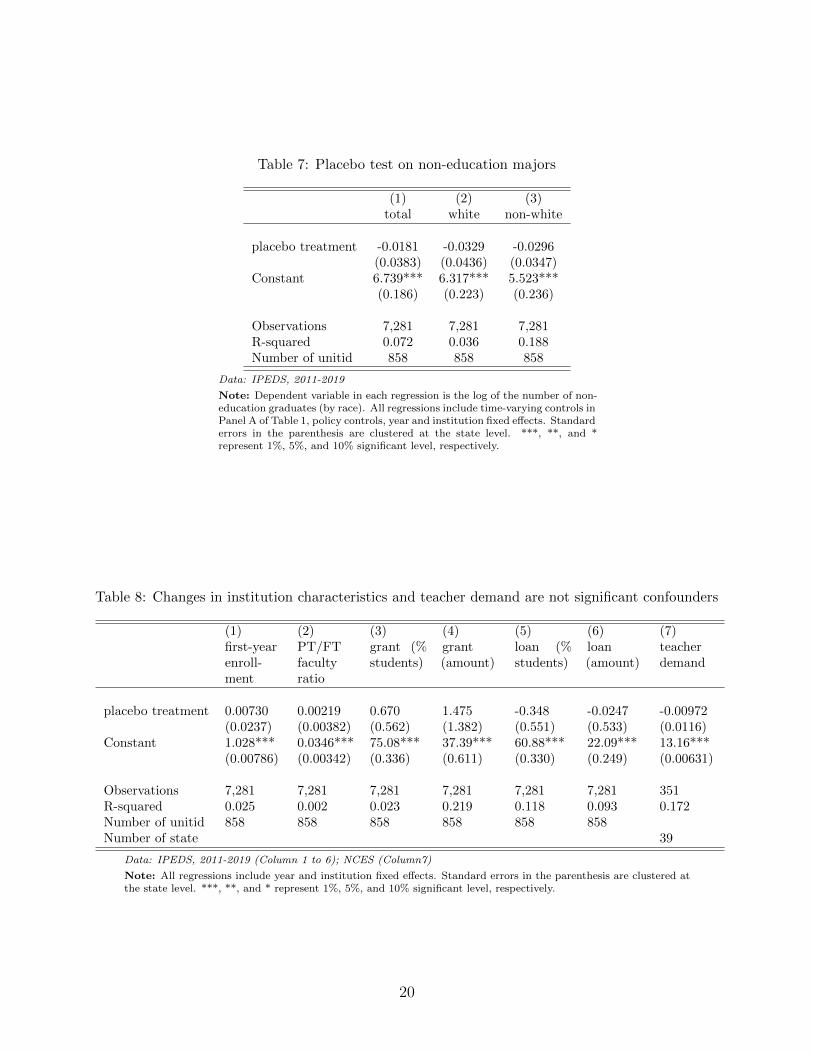
Table 7: Placebo test on non-education majors
(1) (2) (3)total white non-white
placebo treatment -0.0181 -0.0329 -0.0296(0.0383) (0.0436) (0.0347)
Constant 6.739*** 6.317*** 5.523***(0.186) (0.223) (0.236)
Observations 7,281 7,281 7,281R-squared 0.072 0.036 0.188Number of unitid 858 858 858
Data: IPEDS, 2011-2019
Note: Dependent variable in each regression is the log of the number of non-education graduates (by race). All regressions include time-varying controls inPanel A of Table 1, policy controls, year and institution fixed effects. Standarderrors in the parenthesis are clustered at the state level. ***, **, and *represent 1%, 5%, and 10% significant level, respectively.
Table 8: Changes in institution characteristics and teacher demand are not significant confounders
(1) (2) (3) (4) (5) (6) (7)first-yearenroll-ment
PT/FTfacultyratio
grant (%students)
grant(amount)
loan (%students)
loan(amount)
teacherdemand
placebo treatment 0.00730 0.00219 0.670 1.475 -0.348 -0.0247 -0.00972(0.0237) (0.00382) (0.562) (1.382) (0.551) (0.533) (0.0116)
Constant 1.028*** 0.0346*** 75.08*** 37.39*** 60.88*** 22.09*** 13.16***(0.00786) (0.00342) (0.336) (0.611) (0.330) (0.249) (0.00631)
Observations 7,281 7,281 7,281 7,281 7,281 7,281 351R-squared 0.025 0.002 0.023 0.219 0.118 0.093 0.172Number of unitid 858 858 858 858 858 858Number of state 39
Data: IPEDS, 2011-2019 (Column 1 to 6); NCES (Column7)
Note: All regressions include year and institution fixed effects. Standard errors in the parenthesis are clustered atthe state level. ***, **, and * represent 1%, 5%, and 10% significant level, respectively.
20

6 Student Achievement
6.1 Main Results
In this section, we test if edTPA benefits student learning. Figure 3 plot the estimates of
event study dummies for standardized test scores. We first combine the three subjects -
namely mathematics in grade 4, reading in grades 4 and 8 - to show an aggregate picture. In
the regression, we do not add time-varying controls to demonstrate the pattern in the raw
data, conditional on subject, year, and state fixed effects. There is no significant deviation
in pre-treatment trends as shown by the lead indicators, that validates the assumption of
the difference-in-differences approach.
Figure 3: Event study figures for standardized test scores
-.4-.3
-.2-.1
0.1
.2.3
Std.
test
sco
re
-4 -3 -2 -1 0 1Time to edTPA reform
Data Source: NAEP 2009, 2011, 2013, 2015, and 2017.Note: The dependent variable is the three standardized test scores. Event period -1 is normalized to 0. The underlying
regression contains no controls to show raw data patterns, conditional on subject, state, and year fixed effects. The figuresshow the 95% confidence interval with robust standard errors clustered at the state level.
We present the difference-in-differences estimates by sub-sample in Table 9. In Column 1,
4, and 7 of Panel A, edTPA has both economically and statistically insignificant effects on
the three test scores, which is consistent with the flat pattern in Figure 3.
When we add student and school controls, Column 2 and 5 of Panel A show that edTPA
decreases mathematics and reading scores of grade 4 students by 8.4% and 8.9% of a standard
deviation. Adding the controls for concurrent education policies reduces the magnitude for
mathematics score to a decrease of 5.7% in Column 3, while that for reading score remains
21
similar in Column 6. On the contrary, As shown in Column 8 and 9, edTPA has a statistically
insignificant effect on reading scores of grade 8 students in all specifications. The stronger
impacts on grade 4 students relative to grade 8 students are consistent with the finding by
Jackson (2014) that teachers are more influential for younger children.
In Panel B and C of Table 9, we split the analysis by whether the teachers went through
traditional route. We utilize one question in the teacher survey of NAEP that asks the subject
teacher if he/she went through the alternative route to certification. For the mathematics
and reading scores of grade 4 students, Panel B consistently shows that the negative effect
of edTPA on grade 4 students primarily occurs on new teachers who went through the
traditional route. This coincides the pattern in teacher supply response that edTPA only
reduced the number of traditional route graduates. For new teachers who went through the
alternative route, there are some signs that edTPA improves the reading scores of grade 8
students in Panel C. However, a caveat is that the magnitude is sensitive to including control
variables.
22
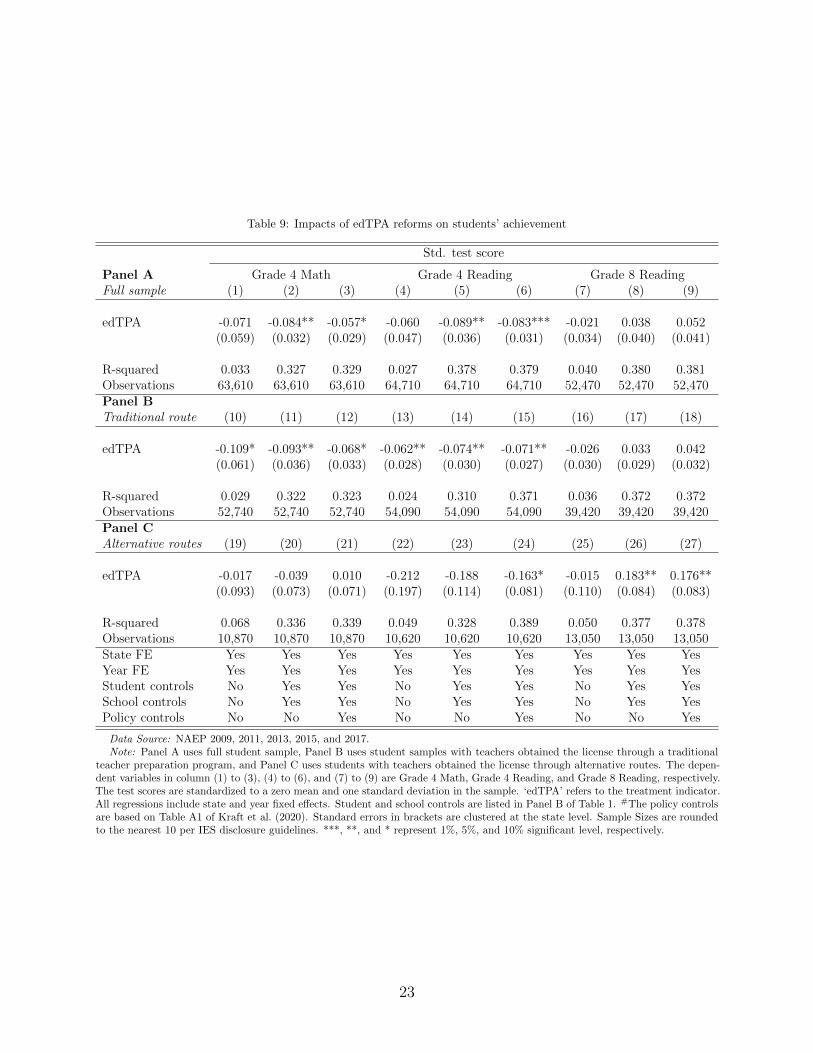
Table 9: Impacts of edTPA reforms on students’ achievement
Std. test score
Panel A Grade 4 Math Grade 4 Reading Grade 8 ReadingFull sample (1) (2) (3) (4) (5) (6) (7) (8) (9)
edTPA -0.071 -0.084** -0.057* -0.060 -0.089** -0.083*** -0.021 0.038 0.052(0.059) (0.032) (0.029) (0.047) (0.036) (0.031) (0.034) (0.040) (0.041)
R-squared 0.033 0.327 0.329 0.027 0.378 0.379 0.040 0.380 0.381Observations 63,610 63,610 63,610 64,710 64,710 64,710 52,470 52,470 52,470Panel BTraditional route (10) (11) (12) (13) (14) (15) (16) (17) (18)
edTPA -0.109* -0.093** -0.068* -0.062** -0.074** -0.071** -0.026 0.033 0.042(0.061) (0.036) (0.033) (0.028) (0.030) (0.027) (0.030) (0.029) (0.032)
R-squared 0.029 0.322 0.323 0.024 0.310 0.371 0.036 0.372 0.372Observations 52,740 52,740 52,740 54,090 54,090 54,090 39,420 39,420 39,420Panel CAlternative routes (19) (20) (21) (22) (23) (24) (25) (26) (27)
edTPA -0.017 -0.039 0.010 -0.212 -0.188 -0.163* -0.015 0.183** 0.176**(0.093) (0.073) (0.071) (0.197) (0.114) (0.081) (0.110) (0.084) (0.083)
R-squared 0.068 0.336 0.339 0.049 0.328 0.389 0.050 0.377 0.378Observations 10,870 10,870 10,870 10,620 10,620 10,620 13,050 13,050 13,050State FE Yes Yes Yes Yes Yes Yes Yes Yes YesYear FE Yes Yes Yes Yes Yes Yes Yes Yes YesStudent controls No Yes Yes No Yes Yes No Yes YesSchool controls No Yes Yes No Yes Yes No Yes YesPolicy controls No No Yes No No Yes No No Yes
Data Source: NAEP 2009, 2011, 2013, 2015, and 2017.Note: Panel A uses full student sample, Panel B uses student samples with teachers obtained the license through a traditional
teacher preparation program, and Panel C uses students with teachers obtained the license through alternative routes. The depen-dent variables in column (1) to (3), (4) to (6), and (7) to (9) are Grade 4 Math, Grade 4 Reading, and Grade 8 Reading, respectively.The test scores are standardized to a zero mean and one standard deviation in the sample. ‘edTPA’ refers to the treatment indicator.All regressions include state and year fixed effects. Student and school controls are listed in Panel B of Table 1. #The policy controlsare based on Table A1 of Kraft et al. (2020). Standard errors in brackets are clustered at the state level. Sample Sizes are roundedto the nearest 10 per IES disclosure guidelines. ***, **, and * represent 1%, 5%, and 10% significant level, respectively.
23
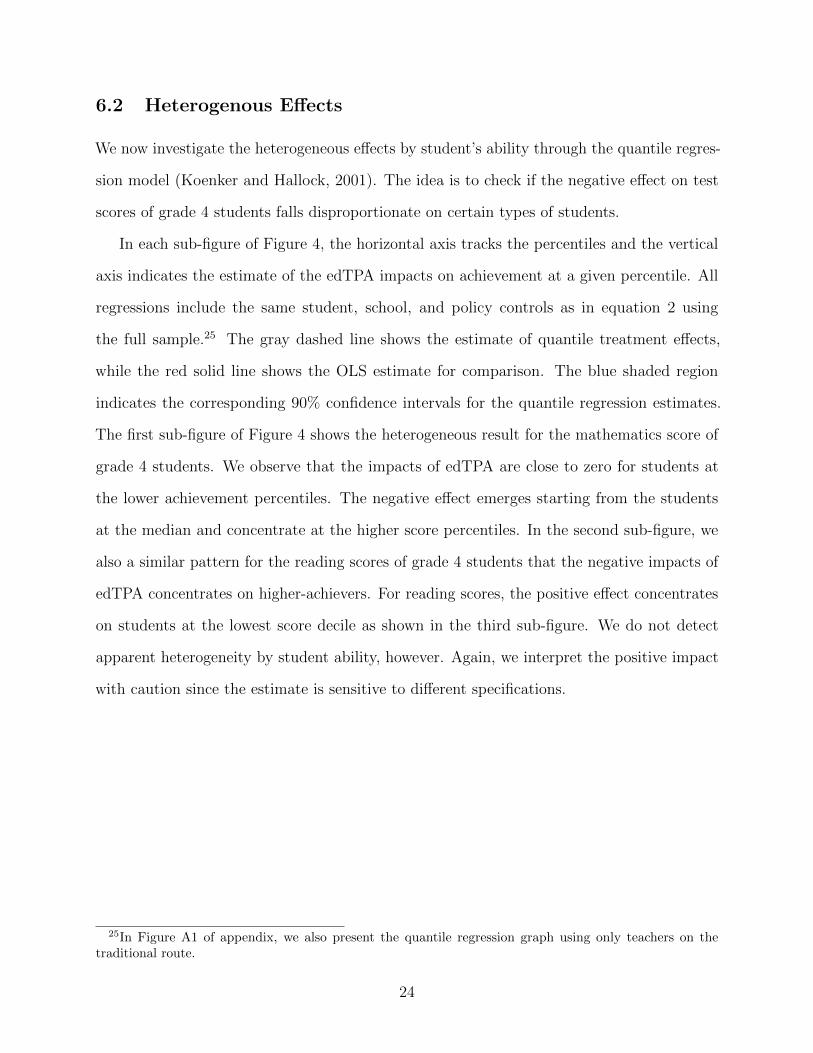
6.2 Heterogenous Effects
We now investigate the heterogeneous effects by student’s ability through the quantile regres-
sion model (Koenker and Hallock, 2001). The idea is to check if the negative effect on test
scores of grade 4 students falls disproportionate on certain types of students.
In each sub-figure of Figure 4, the horizontal axis tracks the percentiles and the vertical
axis indicates the estimate of the edTPA impacts on achievement at a given percentile. All
regressions include the same student, school, and policy controls as in equation 2 using
the full sample.25 The gray dashed line shows the estimate of quantile treatment effects,
while the red solid line shows the OLS estimate for comparison. The blue shaded region
indicates the corresponding 90% confidence intervals for the quantile regression estimates.
The first sub-figure of Figure 4 shows the heterogeneous result for the mathematics score of
grade 4 students. We observe that the impacts of edTPA are close to zero for students at
the lower achievement percentiles. The negative effect emerges starting from the students
at the median and concentrate at the higher score percentiles. In the second sub-figure, we
also a similar pattern for the reading scores of grade 4 students that the negative impacts of
edTPA concentrates on higher-achievers. For reading scores, the positive effect concentrates
on students at the lowest score decile as shown in the third sub-figure. We do not detect
apparent heterogeneity by student ability, however. Again, we interpret the positive impact
with caution since the estimate is sensitive to different specifications.
25In Figure A1 of appendix, we also present the quantile regression graph using only teachers on thetraditional route.
24
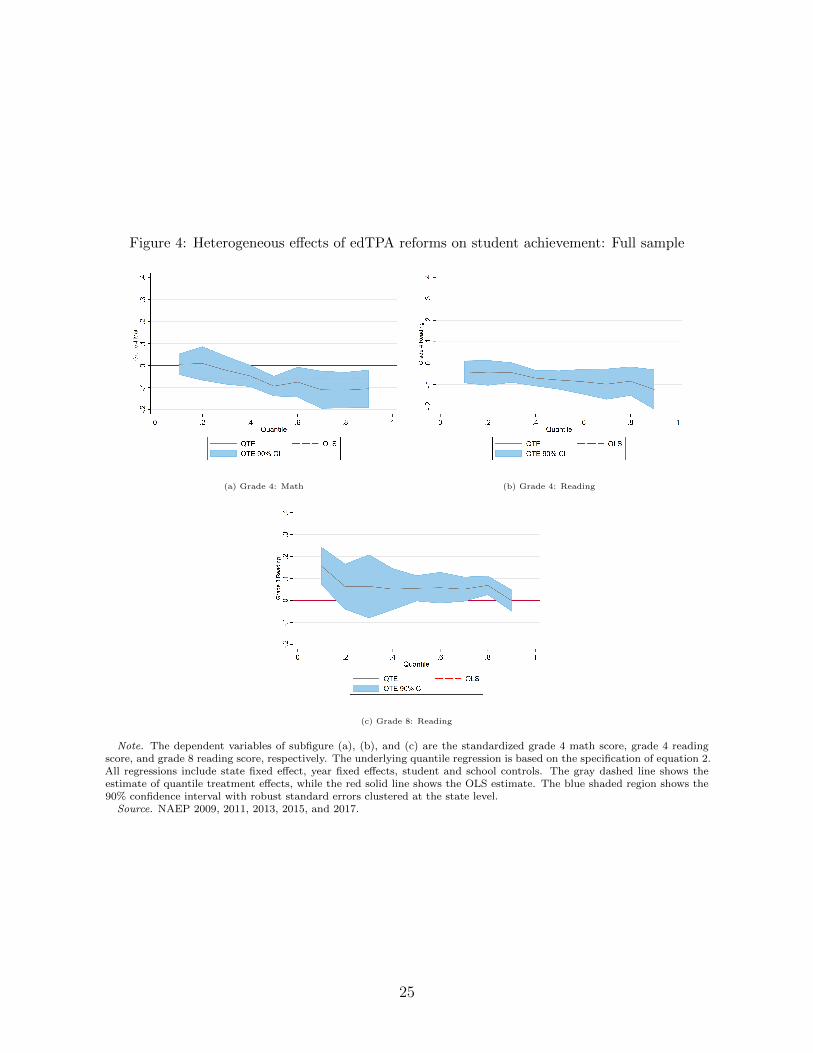
Figure 4: Heterogeneous effects of edTPA reforms on student achievement: Full sample
(a) Grade 4: Math (b) Grade 4: Reading
(c) Grade 8: Reading
Note. The dependent variables of subfigure (a), (b), and (c) are the standardized grade 4 math score, grade 4 readingscore, and grade 8 reading score, respectively. The underlying quantile regression is based on the specification of equation 2.All regressions include state fixed effect, year fixed effects, student and school controls. The gray dashed line shows theestimate of quantile treatment effects, while the red solid line shows the OLS estimate. The blue shaded region shows the90% confidence interval with robust standard errors clustered at the state level.
Source. NAEP 2009, 2011, 2013, 2015, and 2017.
25
6.3 Mechanism: Teacher Behaviors
Based on the unintended adversity on students, this section explores possible explanations.
We exploit detailed survey questions in NAEP about teacher pedagogy. In all the following
regressions, we present the results using the full specification with student, school, and policy
controls.
From Column 1 to Column 9 of Panel A and B in Table 10, we investigate potential
behavioral changes of grade 4 mathematics teachers. From Column 1 to 4, we first examine
whether teachers meet students daily in four aspects, including discussing current performance
level, setting goals, discussing progress toward goals, and adjusting teaching strategies that
meet needs.26 Among the four measures, edTPA significantly reduced the likelihood that
traditional route teachers meet with students to set goals as shown in Panel A. In the other
three measures of teacher-student interaction, we do not observe statistically insignificant
changes for both traditional and alternative route teachers. The second set of questions is
about pedagogy. Teachers rate with a scale from 1 (not at all) to 4 (large extent) about the
likelihood of using a specific teaching method, including setting different standards for some
students, using other materials some students, engaging some students in different activity,
using different methods for some students, and changing pace for some student.27 In the
ordered choice models from Column 5 to 9, we find weak evidence that edTPA changed
teacher pedagogy. Among the five measures, only ‘change pace’ has a marginally significant
coefficient.
The teacher survey for reading class covers a different set of pedagogy questions. In
the first subset of questions, teachers in reading subject rate, with a scale from 1 (never)
to 4 (always), the regularity of several teaching methods. The methods include students
summarizing the passage, interpreting meaning of passage, questioning motives of characters,
26The teachers rate the frequency with a scale from 1 to 5: (1) never or hardly ever; (2) a few times a year;(3) once or twice a month; (4) once or twice a week; (5) every day or almost. We define an outcome variableequals 1 if the response is ‘every day or almost’.
27The scale is: (1) not at all; (2) small extent; (3) moderate extent; (4) large extent.
26
identifying main theme of passage.28 In the second subset of questions, teachers in reading
subject rate, with a scale from 1 (not at all) to 4 (large extent), the focus of a particular type
of literacy work. The type of work includes fiction, literary nonfiction, poetry, exposition,
argumentation and persuasion, and procedural texts.29 From Column 1 to Column 10 of
Panel C and D in Table 10, we present the results of the aforementioned pedagogy measures
using ordered choice models. Among the ten measures, traditional route teachers in edTPA
states are more likely to ‘question motives’ and focus on ‘procedural text’.
The above results regarding changes in pedagogy are not conclusive. One caveat is
that statistically significance may not survive the adjustment of multiple hypothesis testing.
Another caution is the uncertainty about the relationship between a particular pedagogy and
student learning.
Meanwhile, we explore the potential change in class size. It is one possible consequence
that could affect the quality of instruction caused by reduced new teacher supply. The five
categories in the survey in terms of the number of student in a class: 15 or fewer, 16 to
18, 19 to 20, 21 to 25, and 26 or more. Since the median occurs in the fourth group, we
create a dummy variable to indicate the class size is large if there are 26 or more students.
In Column 10 of Panel A and Column 11 of Panel C, we observe that both mathematics and
reading teachers who went through traditional programs are more likely to teach large classes
after the adoption of edTPA. At the same time, there is no class size effect for alternative
route teachers. This again is consistent with the teacher supply results that edTPA only
reduced tradition route graduates. Relative to the results of pedagogy, we believe the change
in class size is more compelling to explain the negative effect on students.
28The scale is: (1) never or hardly ever; (2) sometimes; (3) often; (4) always or almost. For 2017, the scalechanges to 1 to 5: (1) never or hardly ever; (2) once in a while; (3) sometimes; (4) often; (5) always or almostalways. We combine (1) “never or hardly ever” and (2) “once in a while” in 2017 into (1) “never or hardlyever” in pre-2017 surveys to generate consistent measures on the teaching pedagogy.
29Specifically, the scale is from 1 to 4: (1) not at all; (2) small extent; (3) moderate extent; (4) large extent.
27

Table 10: Mechanism: Impacts of edTPA reforms on teacher behaviors
Meeting with students (daily) Teaching practices
Discuss Set Discuss Adjust Set diff Use other Engage stud Use diff Change Largeperformance goals progress teaching standards materials activity methods pace class
Grade4 Math (1) (2) (3) (4) (5) (6) (7) (8) (9) (10)Panel A. Traditional routeedTPA -0.004 -0.036*** -0.005 -0.006 0.140 0.153 0.008 -0.151 -0.212* 0.067*
(0.009) (0.008) (0.019) (0.044) (0.162) (0.163) (0.080) (0.153) (0.125) (0.033)
R-squared 0.017 0.017 0.015 0.030 0.013 0.017 0.024 0.024 0.019 0.158Observations 50,580 50,580 50,580 50,580 50,580 50,580 50,580 50,580 50,580 50,580
Panel B. Alternative routesedTPA -0.010 -0.031 -0.047 0.077 0.105 -0.120 -0.161 0.254 -0.374 -0.006
(0.067) (0.059) (0.054) (0.115) (0.266) (0.447) (0.350) (0.259) (0.258) (0.123)
R-squared 0.060 0.060 0.056 0.070 0.032 0.035 0.045 0.042 0.039 0.252Observations 10,140 10,140 10,140 10,140 10,140 10,140 10,140 10,140 10,140 10,140
Pedagogy on reading Taught about
Summarize Interpret Question Identify Fiction Literary Poetry Exposition Argumentation Procedural Largepassage meaning motives theme nonfiction activity & persuasion texts class
Grade4 Reading (1) (2) (3) (4) (5) (6) (7) (8) (9) (10) (11)Panel C. Traditional routeedTPA 0.018 0.161 0.341** 0.021 0.041 0.035 0.033 -0.232 0.063 0.450*** 0.069**
(0.138) (0.194) (0.144) (0.107) (0.248) (0.182) (0.155) (0.185) (0.284) (0.128) (0.028)
R-squared 0.012 0.021 0.021 0.024 0.022 0.024 0.028 0.025 0.027 0.022 0.165Observations 52,240 52,240 52,240 52,240 52,240 52,240 52,240 52,240 52,240 52,240 52,240
Panel D. Alternative routesedTPA 1.092** -0.255 -0.128 0.284 -0.583 0.019 0.669 0.137 0.527 0.405 0.151
(0.502) (0.413) (0.555) (0.462) (0.398) (0.321) (1.226) (0.313) (0.659) (0.527) (0.174)
R-squared 0.060 0.058 0.070 0.062 0.045 0.037 0.060 0.096 0.045 0.040 0.274Observations 10,110 10,110 10,110 10,110 10,110 10,110 10,110 10,110 10,110 10,110 10,110
Data Source: NAEP 2009, 2011, 2013, 2015, and 2017.Note: Panel A uses full student sample, Panel B uses student samples with teachers obtained the license through a traditional teacher preparation program, and Panel C uses students with teachers obtained
the license through alternative routes. The dependent variables in column (1) to (3), (4) to (6), and (7) to (9) are Grade 4 Math, Grade 4 Reading, and Grade 8 Reading, respectively. The test scores arestandardized to a zero mean and one standard deviation in the sample. ‘edTPA’ refers to the treatment indicator. All regressions include policy controls based on Table A1 of Kraft et al. (2020), state and yearfixed effects. Student and school controls are listed in Panel B of Table 1. Standard errors in brackets are clustered at the state level. Pseudo R-squareds are reported for the ordered logistic regression. SampleSizes are rounded to the nearest 10 per IES disclosure guidelines. ***, **, and * represent 1%, 5%, and 10% significant level, respectively.
28
6.4 Robustness
Balancing tests - Our student sample is based on the years of experience of teachers. One
concern of this sample selection criteria is that the estimation sample changes systematically
with the edTPA timing. For example, if new teachers are more/less likely to be assigned to
disadvantaged students after edTPA, our negative estimates would falsely be attributed to
the causal impact of edTPA.
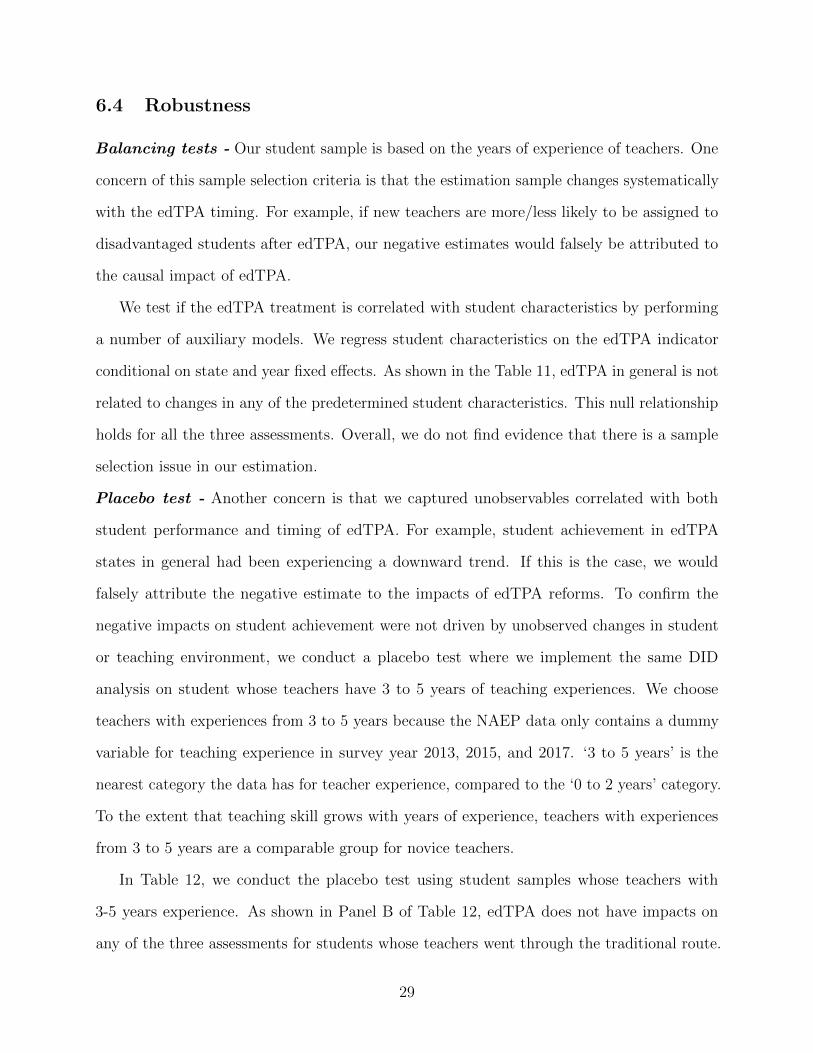
We test if the edTPA treatment is correlated with student characteristics by performing
a number of auxiliary models. We regress student characteristics on the edTPA indicator
conditional on state and year fixed effects. As shown in the Table 11, edTPA in general is not
related to changes in any of the predetermined student characteristics. This null relationship
holds for all the three assessments. Overall, we do not find evidence that there is a sample
selection issue in our estimation.
Placebo test - Another concern is that we captured unobservables correlated with both
student performance and timing of edTPA. For example, student achievement in edTPA
states in general had been experiencing a downward trend. If this is the case, we would
falsely attribute the negative estimate to the impacts of edTPA reforms. To confirm the
negative impacts on student achievement were not driven by unobserved changes in student
or teaching environment, we conduct a placebo test where we implement the same DID
analysis on student whose teachers have 3 to 5 years of teaching experiences. We choose
teachers with experiences from 3 to 5 years because the NAEP data only contains a dummy
variable for teaching experience in survey year 2013, 2015, and 2017. ‘3 to 5 years’ is the
nearest category the data has for teacher experience, compared to the ‘0 to 2 years’ category.
To the extent that teaching skill grows with years of experience, teachers with experiences
from 3 to 5 years are a comparable group for novice teachers.
In Table 12, we conduct the placebo test using student samples whose teachers with
3-5 years experience. As shown in Panel B of Table 12, edTPA does not have impacts on
any of the three assessments for students whose teachers went through the traditional route.
29
Table 11: edTPA is not correlated with changes in student characteristics
Indep Var: edTPA White Black Hispanic Female IEP Eng learnerPanel A (1) (2) (3) (4) (5) (6)
G4 Math 0.024 -0.027 0.012 -0.000 0.004 0.018(0.021) (0.019) (0.021) (0.006) (0.007) (0.019)
R-squared 0.106 0.128 0.094 0.001 0.008 0.092Observations 63,610 63,610 63,610 63,610 63,610 63,610Panel B (7) (8) (9) (10) (11) (12)
G4 Reading 0.023 -0.030 0.011 0.004 -0.002 0.001(0.022) (0.023) (0.016) (0.012) (0.017) (0.024)
R-squared 0.102 0.123 0.093 0.001 0.011 0.088Observations 64,710 64,710 64,710 64,710 64,710 64,710Panel C (13) (14) (15) (16) (17) (18)
G8 Reading -0.039 0.007 0.026 0.013 0.041 0.018(0.038) (0.028) (0.018) (0.019) (0.016) (0.020)
R-squared 0.142 0.155 0.153 0.001 0.010 0.060Observations 52,470 52,470 52,470 52,470 52,470 52,470State FE Yes Yes Yes Yes Yes YesYear FE Yes Yes Yes Yes Yes Yes
Note. The samples in panel A, B, and C are from three NAEP assessments: Grade4 Math, Grade 4 Reading, and Grade 8 Reading, respectively. The dependent variablesare students’ predetermined characteristics, while the independent variable ‘edTPA’ isan indicator where its value equals 1 if state s passes compulsory edTPA policy and0 otherwise. All regressions include state fixed effects and year fixed effects. Robuststandard errors clustered at state level are in brackets. Sample Sizes are rounded tothe nearest 10 per IES disclosure guidelines. ∗ ∗ ∗p < 0.01, ∗ ∗ p < 0.05, ∗p < 0.1.
Source. NAEP 2009, 2011, 2013, 2015, and 2017.
The null effects are consistent across specifications, with or without student, school, and
policy controls. In Figure A1 of Appendix, we also show that there is no heterogeneity by
performance percentiles. The null effects using alternative student samples give us credence
about the adverse impacts caused by edTPA on students of new teachers.
30

Table 12: Placebo test: Impacts of edTPA on students’ achievement using alternative samples
Std. test score
Panel A Grade 4 Math Grade 4 Reading Grade 8 ReadingFull sample (1) (2) (3) (4) (5) (6) (7) (8) (9)
edTPA 0.009 -0.008 0.026 0.051 0.005 0.012 0.053 0.012 0.039(0.055) (0.046) (0.042) (0.059) (0.042) (0.039) (0.069) (0.056) (0.058)
R-squared 0.023 0.337 0.337 0.026 0.385 0.385 0.032 0369 0.370Observations 101,070 101,070 101,070 103,240 103,240 103,240 80,530 80,530 80,530Panel BTraditional route (10) (11) (12) (13) (14) (15) (16) (17) (18)
edTPA -0.020 -0.018 0.017 -0.000 -0.020 -0.012 0.040 0.016 0.043(0.064) (0.050) (0.047) (0.070) (0.043) (0.045) (0.081) (0.062) (0.067)
R-squared 0.022 0.336 0.336 0.021 0.379 0.380 0.032 0362 0.362Observations 85,420 85,420 85,420 87,880 87,880 87,880 61,710 61,710 61,710Panel CAlternative routes (19) (20) (21) (22) (23) (24) (25) (26) (27)
edTPA 0.147 0.065 0.080 0.359*** 0.250** 0.239** 0.101 -0.024 -0.014(0.116) (0.044) (0.062) (0.105) (0.101) (0.101) (0.141) (0.065) (0.068)
R-squared 0.044 0.333 0.333 0.053 0.395 0.396 0.041 0377 0.378Observations 15,650 15,650 15,650 15,360 15,360 15,360 18,820 18,820 18,820State FE Yes Yes Yes Yes Yes Yes Yes Yes YesYear FE Yes Yes Yes Yes Yes Yes Yes Yes YesStudent controls No Yes Yes No Yes Yes No Yes YesSchool controls No Yes Yes No Yes Yes No Yes YesPolicy controls No No Yes No No Yes No No Yes
Note. The estimation sample is student sample whose teachers have 3 to 5 years of teaching experience. Panel A uses full stu-dent sample, Panel B uses student samples with teachers obtained the license through a traditional teacher preparation program,and Panel C uses students with teachers obtained the license through alternative routes. The samples in column (1) to (3), (4) to(6), and (7) to (9) are from three NAEP assessments: Grade 4 Math, Grade 4 Reading, and Grade 8 Reading, respectively. Thedependent variables are test scores for Grade 4 Math, Grade 4 Reading, and Grade 8 Reading, standardized to a zero mean andone standard deviation over each estimation sample. ‘edTPA’ is an indicator where its value equals 1 if state s passes compulsoryedTPA policy and 0 otherwise. All regressions include state fixed effects and year fixed effects. Student and school controls arelisted in Table 1 Panel B. Policy controls include the teacher accountability reforms discussed by Kraft et al. (2020). Robuststandard errors clustered at state level are in brackets. Sample Sizes are rounded to the nearest 10 per IES disclosure guidelines.∗ ∗ ∗p < 0.01, ∗ ∗ p < 0.05, ∗p < 0.1.
Source. NAEP 2009, 2011, 2013, 2015, and 2017.
31

7 Conclusion
This paper makes the first attempt to provide causal evidence about the effect of edTPA on
teacher supply and student performance, leveraging the quasi-random setting where states
integrated edTPA into their licensure systems in different years.
In terms of teacher supply, we analyze university-level graduation data from IPEDS
which captures the major source of new teachers in the US. We find that edTPA reduced the
number of teacher graduates and disproportionately hurt minority candidates in less selective
programs. Our results are alarming to the existing shortage and diversity issue in the US
public schools. The loss of minority teachers is also worrying given many researchers have
found that teachers of the same race bring about a role-modeling effect for minority students.
For student performance, NAEP is a unique dataset that allows us to identify students
with new teachers among a nationally representative sample of students in the US. We do not
find strong evidence that edTPA improved student learning. We instead find some evidence
that there was a negative impact on the academic performance of higher-achieving students.
A potential link we find is a larger class size that results in a heavier teaching load. We do not
speculate further on the underlying mechanisms, but our result on students is consistent with
other education research finding that the assessment may not improve teaching effectiveness.
There are two routes to combat teacher shortage and diversity concerns brought by
the edTPA. An intermediate solution is to provide more supports (financial and mental)
and guidelines to help prospective teachers get through the hurdle, which is found to have
improved the experience of teacher candidates (Lachuk and Koellner, 2015; Muth et al.,
2018). In the recent development, Georgia is among the first state to abolish the edTPA
requirement for prospective teachers. Therefore, eliminating the entire assessment is another
feasible option.
One final note is that our results do not cast a veto against the entire teacher licensure
system. Rather, we focus on a particular component of the licensure system that is hotly
debated in the current education community. Our discussion is widely applicable to the
32

educational policymakers nationwide, especially in the states which had integrated or are
planning to integrate edTPA as a necessary component for initial teacher licensure.
33

References
Anderson, D Mark, Ryan Brown, Kerwin Kofi Charles, and Daniel I Rees, “Oc-cupational licensing and maternal health: Evidence from early midwifery laws,” Journalof Political Economy, 2020, 128 (11), 4337–4383.
Angrist, Joshua D and Jonathan Guryan, “Teacher testing, teacher education, andteacher characteristics,” American Economic Review, 2004, 94 (2), 241–246.
and , “Does teacher testing raise teacher quality? Evidence from state certificationrequirements,” Economics of Education Review, 2008, 27 (5), 483–503.
Blair, Peter Q and Bobby W Chung, “Job market signaling through occupationallicensing,” Technical Report, National Bureau of Economic Research 2018.
and , “How much of barrier to entry is occupational licensing?,” British Journal ofIndustrial Relations, 2019, 57 (4), 919–943.
and , “A Model of Occupational Licensing and Statistical Discrimination,” TechnicalReport, National Bureau of Economic Research 2020.
Carpenter, II and M Dick, “Testing the utility of licensing: Evidence from a fieldexperiment on occupational regulation,” Journal of Applied Business and Economics,2012, 13 (2), 28–41.
Carroll, Stephen, Robert Reichardt, Cassandra Guarino, and Andrea Mejia, “Thedistribution of teachers among California’s school districts and schools,” Technical Report,RAND CORP SANTA MONICA CA 2000.
Carter, MS and CM Carter, “How principals can attract teachers to the middle grades,”Schools in the Middle, 2000, 9 (8), 22–25.
Chung, Bobby W, “Trade-Offs of Occupational Licensing: Understanding the Costs andPotential Benefits,” Available at SSRN 3707990, 2020.
Clotfelter, Charles T, Helen F Ladd, and Jacob L Vigdor, “Teacher credentialsand student achievement: Longitudinal analysis with student fixed effects,” Economics ofEducation Review, 2007, 26 (6), 673–682.
, , and , “Teacher credentials and student achievement in high school a cross-subjectanalysis with student fixed effects,” Journal of Human Resources, 2010, 45 (3), 655–681.
Cullen, Julie Berry, Cory Koedel, and Eric Parsons, “The compositional effect ofrigorous teacher evaluation on workforce quality,” Education Finance and Policy, 2021, 16(1), 7–41.
Darling-Hammond, Linda and Maria E Hyler, “The role of performance assessmentin developing teaching as a profession.,” Rethinking schools, 2013, 27 (4), 10–15.
34
Dee, Thomas S and James Wyckoff, “Incentives, selection, and teacher performance:Evidence from IMPACT,” Journal of Policy Analysis and Management, 2015, 34 (2),267–297.
Farronato, Chiara, Andrey Fradkin, Bradley Larsen, and Erik Brynjolfsson, “Con-sumer protection in an online world: An analysis of occupational licensing,” TechnicalReport, National Bureau of Economic Research 2020.
Feng, Li and Tim R Sass, “The impact of incentives to recruit and retain teachersin “hard-to-staff” subjects,” Journal of Policy Analysis and Management, 2018, 37 (1),112–135.
Friedman, Milton, Capitalism and freedom, University of Chicago press, 1962.
Gilbert, Kristen A and Nai-Cheng Kuo, “Ethical, legal, and pedagogical issues inedTPA,” Critical Education, 2019, 10 (8), 1–17.
Goldhaber, Dan, “Everyone’s doing it, but what does teacher testing tell us about teachereffectiveness?,” Journal of human Resources, 2007, 42 (4), 765–794.
Goldhaber, Dan D and Dominic J Brewer, “Does teacher certification matter? Highschool teacher certification status and student achievement,” Educational evaluation andpolicy analysis, 2000, 22 (2), 129–145.
Goldhaber, Dan, James Cowan, and Roddy Theobald, “Evaluating prospective teach-ers: Testing the predictive validity of the edTPA,” Journal of Teacher Education, 2017,68 (4), 377–393.
, John Krieg, Roddy Theobald, and Nate Brown, “Refueling the STEM and specialeducation teacher pipelines,” Phi Delta Kappan, 2015, 97 (4), 56–62.
Greenblatt, Deborah, “The consequences of edTPA,” Educational Leadership, 2016, 73(8), 51–54.
and Kate E O’Hara, “Buyer Beware: Lessons Learned from EdTPA Implementationin New York State.,” Teacher Education Quarterly, 2015, 42 (2), 57–67.
Guarino, Cassandra M, Lucrecia Santibanez, and Glenn A Daley, “Teacher recruit-ment and retention: A review of the recent empirical literature,” Review of educationalresearch, 2006, 76 (2), 173–208.
Jackson, C Kirabo, “Teacher quality at the high school level: The importance of accountingfor tracks,” Journal of Labor Economics, 2014, 32 (4), 645–684.
Kane, Thomas J, Jonah E Rockoff, and Douglas O Staiger, “What does certificationtell us about teacher effectiveness? Evidence from New York City,” Economics of Educationreview, 2008, 27 (6), 615–631.
Kleiner, Morris M, “Occupational licensing,” Journal of Economic Perspectives, 2000, 14(4), 189–202.
35
, Allison Marier, Kyoung Won Park, and Coady Wing, “Relaxing occupationallicensing requirements: Analyzing wages and prices for a medical service,” The Journal ofLaw and Economics, 2016, 59 (2), 261–291.
and Alan B Krueger, “Analyzing the extent and influence of occupational licensing onthe labor market,” Journal of Labor Economics, 2013, 31 (S1), S173–S202.
and Evan J Soltas, “A Welfare Analysis of Occupational Licensing in US States,” 2019.
Koenker, Roger and Kevin F Hallock, “Quantile regression,” Journal of economicperspectives, 2001, 15 (4), 143–156.
Kraft, Matthew A, Eric J Brunner, Shaun M Dougherty, and David J Schweg-man, “Teacher accountability reforms and the supply and quality of new teachers,” Journalof Public Economics, 2020, 188, 104212.
Kugler, Adriana D and Robert M Sauer, “Doctors without borders? Relicensingrequirements and negative selection in the market for physicians,” Journal of Labor Eco-nomics, 2005, 23 (3), 437–465.
Lachuk, Amy Johnson and Karen Koellner, “Performance-based assessment for certi-fication: Insights from edTPA implementation,” Language Arts, 2015, 93 (2), 84–95.
Larsen, Bradley, Ziao Ju, Adam Kapor, and Chuan Yu, “The Effect of OccupationalLicensing Stringency on the Teacher Quality Distribution,” NBER Working Paper, 2020,(w28158).
Law, Marc T and Mindy S Marks, “Effects of occupational licensing laws on minorities:Evidence from the progressive era,” The Journal of Law and Economics, 2009, 52 (2),351–366.
Leland, Hayne E, “Quacks, lemons, and licensing: A theory of minimum quality standards,”Journal of political economy, 1979, 87 (6), 1328–1346.
Liu, Edward, Susan Moore Johnson, and Heather G Peske, “New teachers and theMassachusetts signing bonus: The limits of inducements,” Educational Evaluation andPolicy Analysis, 2004, 26 (3), 217–236.
Muth, Nicole, Kathleen Kremer, Val Keiper, Richard Schnake, and Renae Mac-Cudden, “Implementation of edTPA Completion Prior to Student Teaching.,” Mid-Western Educational Researcher, 2018, 30 (3), 71–92.
Othman, Lama Bergstrand, Rowand Robinson, and Nancy F Molfenter, “Emerg-ing issues with consequential use of the edTPA: Overall and through a special educationlens,” Teacher Education and Special Education, 2017, 40 (4), 269–277.
Petchauer, Emery, Anica G Bowe, and Julene Wilson, “Winter is coming: Forecastingthe impact of edTPA on Black teachers and teachers of color,” The Urban Review, 2018,50 (2), 323–343.
36

Reback, Randall, Jonah Rockoff, and Heather L Schwartz, “Under pressure: Jobsecurity, resource allocation, and productivity in schools under No Child Left Behind,”American Economic Journal: Economic Policy, 2014, 6 (3), 207–41.
Rudner, Lawrence M and Nancy Elizabeth Adelman, What’s happening in teachertesting: An analysis of state teacher testing practices, Office of Educational Research andImprovement, US Department of Education, 1987.
Sartain, Lauren and Matthew P Steinberg, “Teachers’ labor market responses to per-formance evaluation reform: Experimental evidence from Chicago public schools,” Journalof Human Resources, 2016, 51 (3), 615–655.
Sass, Tim R, “Licensure and worker quality: A comparison of alternative routes to teaching,”The Journal of Law and Economics, 2015, 58 (1), 1–35.
Sato, Mistilina, “What is the underlying conception of teaching of the edTPA?,” Journalof Teacher Education, 2014, 65 (5), 421–434.
Shapiro, Carl, “Investment, moral hazard, and occupational licensing,” The Review ofEconomic Studies, 1986, 53 (5), 843–862.
Shin, Minsun, ““The edTPA took away from my student teaching experience”: The impactof the edTPA on student teaching experiences,” Contemporary Issues in Early Childhood,2019, 20 (3), 309–312.
Thornton, Robert J and Edward J Timmons, “Licensing one of the world’s oldestprofessions: Massage,” The Journal of Law and Economics, 2013, 56 (2), 371–388.
Xia, Xing, “Barrier to Entry or Signal of Quality? The Effects of Occupational Licensingon Minority Dental Assistants,” Labour Economics, 2021, p. 102027.
37

Appendix to:
“Teacher Licensing, Teacher Supply, and StudentAchievement: Nationwide Implementation of edTPA”
Bobby W. Chung & Jian Zou
May, 2021
38
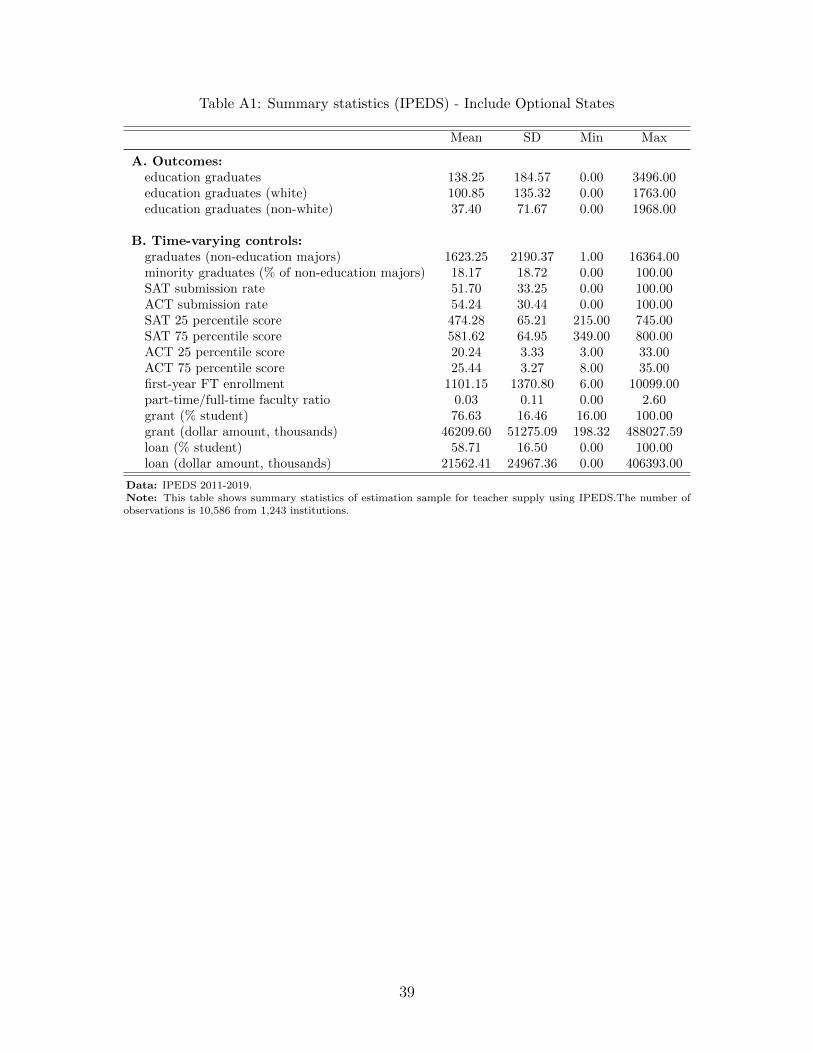
Table A1: Summary statistics (IPEDS) - Include Optional States
Mean SD Min Max
A. Outcomes:education graduates 138.25 184.57 0.00 3496.00education graduates (white) 100.85 135.32 0.00 1763.00education graduates (non-white) 37.40 71.67 0.00 1968.00
B. Time-varying controls:graduates (non-education majors) 1623.25 2190.37 1.00 16364.00minority graduates (% of non-education majors) 18.17 18.72 0.00 100.00SAT submission rate 51.70 33.25 0.00 100.00ACT submission rate 54.24 30.44 0.00 100.00SAT 25 percentile score 474.28 65.21 215.00 745.00SAT 75 percentile score 581.62 64.95 349.00 800.00ACT 25 percentile score 20.24 3.33 3.00 33.00ACT 75 percentile score 25.44 3.27 8.00 35.00first-year FT enrollment 1101.15 1370.80 6.00 10099.00part-time/full-time faculty ratio 0.03 0.11 0.00 2.60grant (% student) 76.63 16.46 16.00 100.00grant (dollar amount, thousands) 46209.60 51275.09 198.32 488027.59loan (% student) 58.71 16.50 0.00 100.00loan (dollar amount, thousands) 21562.41 24967.36 0.00 406393.00
Data: IPEDS 2011-2019.Note: This table shows summary statistics of estimation sample for teacher supply using IPEDS.The number ofobservations is 10,586 from 1,243 institutions.
39
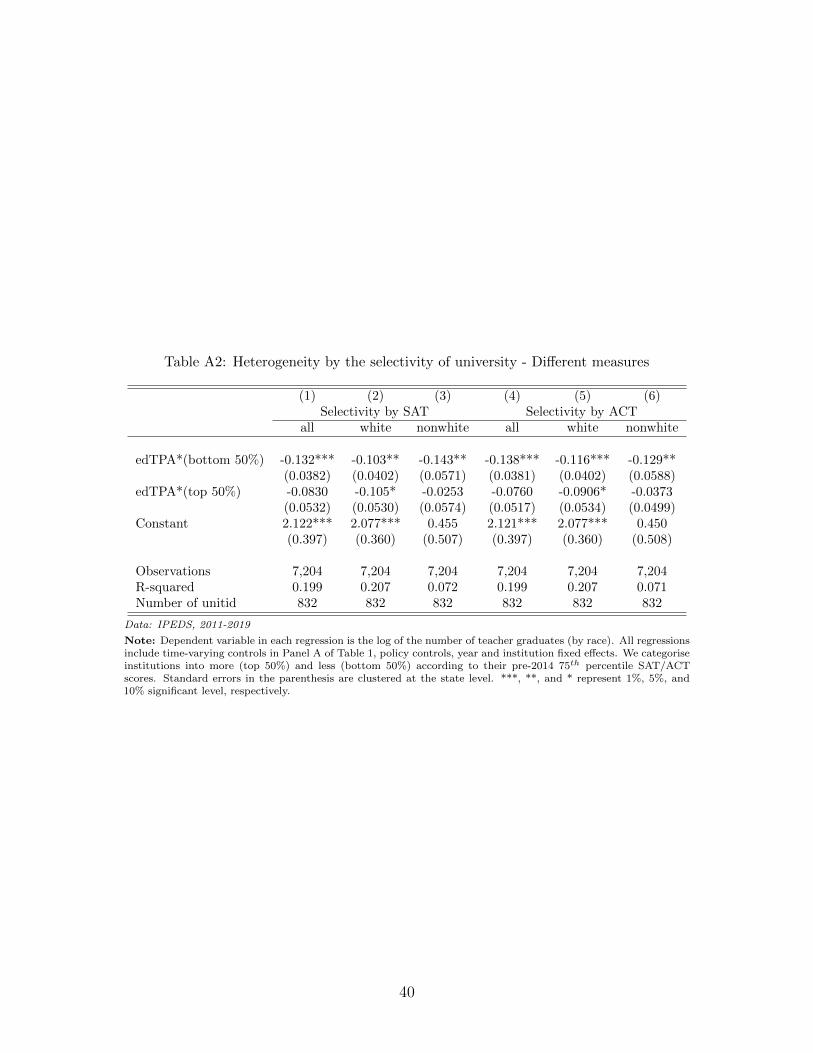
Table A2: Heterogeneity by the selectivity of university - Different measures
(1) (2) (3) (4) (5) (6)Selectivity by SAT Selectivity by ACT
all white nonwhite all white nonwhite
edTPA*(bottom 50%) -0.132*** -0.103** -0.143** -0.138*** -0.116*** -0.129**(0.0382) (0.0402) (0.0571) (0.0381) (0.0402) (0.0588)
edTPA*(top 50%) -0.0830 -0.105* -0.0253 -0.0760 -0.0906* -0.0373(0.0532) (0.0530) (0.0574) (0.0517) (0.0534) (0.0499)
Constant 2.122*** 2.077*** 0.455 2.121*** 2.077*** 0.450(0.397) (0.360) (0.507) (0.397) (0.360) (0.508)
Observations 7,204 7,204 7,204 7,204 7,204 7,204R-squared 0.199 0.207 0.072 0.199 0.207 0.071Number of unitid 832 832 832 832 832 832
Data: IPEDS, 2011-2019
Note: Dependent variable in each regression is the log of the number of teacher graduates (by race). All regressionsinclude time-varying controls in Panel A of Table 1, policy controls, year and institution fixed effects. We categoriseinstitutions into more (top 50%) and less (bottom 50%) according to their pre-2014 75th percentile SAT/ACTscores. Standard errors in the parenthesis are clustered at the state level. ***, **, and * represent 1%, 5%, and10% significant level, respectively.
40
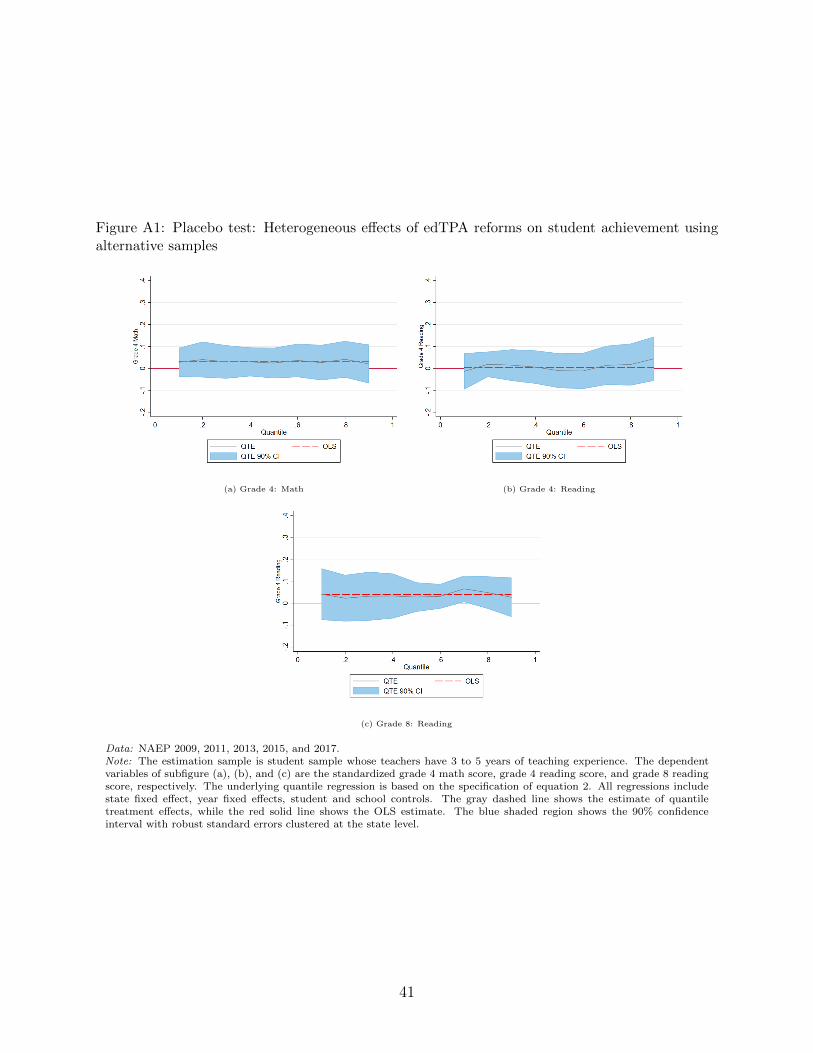
Figure A1: Placebo test: Heterogeneous effects of edTPA reforms on student achievement usingalternative samples
(a) Grade 4: Math (b) Grade 4: Reading
(c) Grade 8: Reading
Data: NAEP 2009, 2011, 2013, 2015, and 2017.Note: The estimation sample is student sample whose teachers have 3 to 5 years of teaching experience. The dependentvariables of subfigure (a), (b), and (c) are the standardized grade 4 math score, grade 4 reading score, and grade 8 readingscore, respectively. The underlying quantile regression is based on the specification of equation 2. All regressions includestate fixed effect, year fixed effects, student and school controls. The gray dashed line shows the estimate of quantiletreatment effects, while the red solid line shows the OLS estimate. The blue shaded region shows the 90% confidenceinterval with robust standard errors clustered at the state level.
41
Top Related