


Languages
Pages
Legal


WORKING DOCUMENT FOR THE RURAL DEVELOPMENT COMMITTEE
August 2015
RURAL DEVELOPMENT
MONITORING (2014-2020) – IMPLEMENTATION REPORT TABLES
1. INTRODUCTION
The general approach proposed is that the monitoring data (output indicators and target
indicators) are compiled from data items recorded at operation (project) level by the
Managing Authority (MA)/ Paying Agency (PA) in the operations database.
The annual monitoring tables will be part of the Annual Implementation Report (AIR) in
year N for N-1.
They would include committed expenditure (recorded at approval or application stage)
and realised expenditure/outputs (reported at final/annual payment stage for completed
operations):
For the committed data, only expenditure by measure and by focus area (FA)
(table A).
More details (breakdown) for the realised output indicators (tables B and C)
would be requested in AIR compared to the indicator plan (breakdown per type
of operation, per type of beneficiaries…) in a way to provide more insight on
what has been implemented. However, significant effort is made to keep it to the
minimum indispensable information.
The value of the target indicators would be provided as at N-1 based on realised
outputs/expenditure. In principle, nearly half of the targets can be calculated directly
from outputs from table B. The other values would need to be encoded in table D. In
table D some outputs are also reported when the applications are approved to provide an
early information on the target achievement.
In table E, the total public expenditure is monitored for the transitional measures to show
the share of the transitional measures out of the total expenditure (see section on
transitional measures).
In table F, mostly generated from tables B, we can monitor the progress made towards
the performance framework indicators. An adjustment is necessary if top ups have been
taken into account in the target setting (see section on Additional National Financing and
State Aid).

2
In Table B4 (cumulative), the aggregated total public expenditure of all the operations
which have been flagged in the operations database for having additional contributions to
other FA (other than the FA under which they are programmed and monitored) is
indicated. The purpose of this table is to illustrate the multi purpose dimension of
operations and, therefore, double counting is possible (see page 7 for further explanations
and example).
The annual monitoring tables are cumulative, in a way to best compare to the indicator
plan, measuring progress in implementation against the plan (except for area-based
measures, when it concerns multi-annual commitments, where cumulative data are more
difficult to interpret and for table E). So the monitoring will allow to (cumulatively)
compare realised outputs and realised expenditure against the planned outputs and
planned expenditure by FA and degree of achievement of the target on an annual basis.
2. STRUCTURE OF THE MONITORING TABLES
Table A: Committed total public expenditure for AIR Year N+1, fed from 2
intermediate tables submitted by 31 October of Year N and 31 January of year
N+1
– Tables B:
– B1: Realized output indicators for AIR (cumulative)
– B2: Realized LEADER and TA/Networking output indicators for AIR
(cumulative)
– B3: Realized output indicators for multi-annual commitments (annual)
– B4: Total public expenditure of the operations having additional
contributions to other FAs (cumulative)
– Table C: Breakdown by NCA area types, type and size of farm holdings
supported, gender and age for AIR (cumulative)
– Table D: Progress towards targets for AIR
– Table E: Monitoring of transitional measures (annual)
– Tables F: Progress towards performance framework indicators
3
3. GENERAL DEFINITIONS
3.1. Data period and frequency
Table A
According to Article 66 §1 (b) of Regulation (EU) No 1305/2013, the MA provides the
Commission 'by 31 January and 31 October in each year of the programme, with relevant
indicator data on operations selected for funding, including information on output and
financial indicators'. This provision applies to table A.
The following process is envisaged:
Submission date Period concerned Who
By 31 October Year N Data from 1 January Year
N to 31 August Year N
MA to Commission
By 31 January Year N+1 Data from 1 September
Year N to 31 December
Year N
MA to Commission
Before the submission of
the AIR Year N
_ Commission compiles data
at annual level, uploads it
in SFC and provides it to
MA
By 30 June Year N+1 Year N Table A covering Year N is
available for the AIR Year
N. At this stage, in case of
administrative errors,
corrections could be made.
Tables B, C, D, E and F
The monitoring data submitted in the AIR must concern the previous calendar year.1
These monitoring tables use the calendar year as their framework so all operations
realized2 in YEAR N-1 should be reported (expenditure and output indicators). For
example, for AIR submitted by 30 June 2018, the reporting year is 2017.
3.2. Financial data
Financial data concerning the implementation of measures is either expressed as
'committed expenditure' for table A or 'realised expenditure' for other tables.
In the majority of tables financial terms have the following meanings:
1 First AIR 2016 covers 2 calendar years: 2014 and 2015.
2 In tables D, some outputs are also reported when the operations are approved.

4
Committed – Total public expenditure (Table A) = Total amount committed
(EAFRD + other public)3 when the application is approved. For multi-annual
commitments (e.g. M10 Agri-environment-climate), the commitment is defined
annually when the annual claimed expenditure is submitted.
Realized – Total public expenditure (Tables B1, B2, C and D - Cumulative) =
Total amount of expenditure (EAFRD + other public) made by the MS (it should
not necessarily have been declared to the Commission) for completed operations in
the reporting year and previous years of the programming period.
Completed operation. Article 2 (14) of Regulation (EU) No 1303/2015 states that
a completed operation 'means an operation that has been physically completed or
fully implemented and in respect of which all related payments have been made by
beneficiaries and the corresponding public contribution has been paid to the
beneficiaries. No payments are reported until the operation is completed.
Completion is determined by the last payment made (but not necessarily declared
to the Commission).
In case of subsidised loans, completion should be determined when the
purchase/construction has been physically done. At that moment, all the remaining
expenditure of the loan is reported (interest rate subsidy) (in principle this
information should be known at that stage).
For multi-annual commitments implemented through annual payments (e.g. M10
Agri-environment-climate), intermediate completion is considered on an annual
basis when the claim is paid.
Realized – Total public expenditure (Table B3 - Annual) = Total amount of
expenditure (EAFRD + other public) made by the MS (e.g. area payments not yet
necessarily declared to the Commission) for commitments/operations in the
reporting year.
Total investment = sum of all public and private expenditure (eligible expenditure
only) of all the tangible and/or intangible investments made for completed
operations supported under a particular investment measure/sub-measure. This
indicator should only be compiled for investment type of operations.
Recoveries = in principle recoveries should not be monitored. To be tackled by the
financial execution.
3 According to Article 2 (15) of Regulation (EU) No 1303/2015: "public expenditure means any public
contribution to the financing of operations the source of which is the budget of national, regional or
local public authorities, the budget of the Union related to the ESI Funds, the budget of public law
bodies or the budget of associations of public authorities or of public law bodies (…)".

5
3.3 Definitions of committed/completed by measures
Measures Committed Table A Realized Tables B1, B2, C
1 Application approved When operation completed (set
of trainings), final payment
made
2 Application approved Set up farm services: last
payment
Advices: when operation
completed (set of advices),
final payment made
4 Application approved When operation completed, last
payment
5 Application approved When operation completed, last
payment
6 Application approved (6.1 to 6.4): when operation
completed, last payment
Transfer payment (6.5):
one-off: payment completed
annual:expenditure are reported
on an annual basis when annual
payments are made in table B1
(expenditure cumulated)
Number of beneficiaries are
recorded and reported when the
first annual payments are made
in table B1 (same beneficiaries
should not be double counted
over the years)
7 Application approved When operation completed, last
payment
8.1 and 8.2
Establishment only
Application approved When operation completed, last
payment
8.4 Application approved When operation completed, last
payment
8.5 Application approved When operation completed, last
payment
8.6 Application approved When operation completed, last

6
payment
16 Cooperation operations
approved
When operation completed, last
payment
17.1 Application approved Premium paid to beneficiaries
17.2 Setting up: Mutual fund
scheme approved
Financial compensation+ costs
incurred: /
Setting up of the fund: last
payment
Financial compensation+ costs
incurred: payment made
17.3 Setting up: Income
stabilisation scheme appproved
Financial compensation + costs
incurred:/
Setting up of the fund: last
payment
Financial compensation + costs
incurred: payment made
19 Preparatory works: payment
request
Running costs, LDS and
cooperation projects: when
LAG is selected. Unless
cooperation projects are
selected separately (when
selection is approved)
Preparatory works: when
payments are made
Running cost: payment made
When LDS/cooperation
operation completed: last
payment
Measures Committed - table A Realized - table B3
3 Application approved Annual payment made
8.1 for maintenance Commitment signed Annual payment made
8.2 for maintenance Commitment signed Annual payment made
8.3 Application approved or
commitment signed
Annual payment made
9 Application approved Annual payment made
10 Annual payment claimed Annual payment made during
the reporting year
Area after on-the-spot checks
having received payments
11 Annual payment claimed Area after on-the-spot checks
having received payments

7
12 Annual Payment claimed Annual payment made
13 Annual Payment claimed Annual payment made
14 Annual Payment claimed Annual payment made
15 Annual Payment claimed Annual payment made
3.4. Other general points
Focus Areas
All the operations should be reported under the FA they belong to. The purpose is to
monitor what has been programmed. One operation should not be broken down, the
expenditure and output indicators linked to that operation are entirely attributed to the
relevant FA.
In general, the FA is known before the implementation of the policy. In the RDP, type of
operations or sub-measures have been designed to address specific FA to respond to a
need identified and in accordance with the strategy. All the operations supported under
these specific sub-measures/type of operations are therefore automatically attributed to
the relevant FA in the operations database.
Table B4
In the other tables, the operations are reported under the 'main' FA (or priority for P.4)
under which they have been programmed.
On top of that, for each operation approved, the MA should identify in their operations
database the FAs to which the operation has additional contributions (if any). The
purpose of the Table B4 is to report on that (100% of the total public expenditure of the
operation is reported under the FAs to which it has an additional contribution (double
counting)). This table is important, notably to monitor the multi-purpose dimension of
the rural development operations. Please see example below.
In the first column of Table B4, we have the total public expenditure taken automatically
from the other reporting tables (based on the main programmed FA (no double
counting)). In the second column, a breakdown for P.4 between FAs 4A, 4B and 4C has
to be filled-in. As a consequence of its multi-purpose dimension, P.4 is programmed and
monitored at priority level in the other tables and Table B4 is the opportunity to monitor
the breakdown between FAs 4A, 4B and 4C (all the operations programmed under P.4
which have contributions to these FAs are reported at 100% under these FAs (double
counting).

8
In the third column, all the operations programmed outside the FA but which have also
additional contributions to that FA are 100% (total public expenditure) reported under
that FA. If one operation has additional contributions to several FAs, its total public
expenditure will be reported several times (double counting).
On-going commitments from the previous period
In the AIR, ongoing commitments made during the 2007-2013 programming period and
supported through 2014-2020 EAFRD and commitments made in 2014 (before the
approval of the new RDP) based on the 2007-2013 rules and paid through 2014-2020
EAFRD are monitored in the Tables A, B, C and D. No specific distinction is foreseen.
The additional Table E allows the monitoring of realized EAFRD and total public
expenditure by measure. This table is based on the model of the indicative carry-over
table (section 19 of the RDP).
Additional national financing
As Article 82 (Additional National Financing) and Article 81 (State Aid) of Regulation
(EU) No 1305/2013 are included in the Indicator Plan for the measures with top ups
(taken into account for targets setting, planned expenditure and outputs), the
commitments and realisations supported by these articles are also taken into account in
the tables. No distinction is foreseen in the Tables A, B, C and D.
Transfer from 1st pillar

9
First pillar transfers reinforcing certain measures are monitored and included in the
monitoring tables (target implementation, realized outputs and expenditure). No
distinction is foreseen.
Sub-programme
Targets/outputs and expenditure are monitored in the overall tables aggregated for
programme and sub-programme.
In addition, in accordance with Article 75 §3 and §4 of Regulation (EU) No 1305/2013,
in the AIR submitted in 2017 and 2019 outputs and targets should be provided for the
sub-programme separately, using templates of Tables B and D.
Additional Focus Areas
If an additional FA is programmed, the RDP specific target should be monitored as the
other targets. The realized output and expenditure using the common indicators should
also be monitored as for any other FA.
Financial Instruments (FI)
In the monitoring tables expenditure and outputs for FI are recorded under the relevant
measure (e.g. investment measures 4, 6.4, 7, 8.6 and 16). If both grants and FI are
implemented in the same measure and FA, a distinction is requested.
For Table A, the committed expenditure corresponds to the total amount of public
contribution (EAFRD and national counterpart) committed in the signed funding
agreement (loan, guarantee, equity/quasi-equity or other funds) (codes IV. 16.1.4 +
16.2.1)4.
For Table B, the realized expenditure corresponds to the total amount of public
contribution (EAFRD and national counterpart) actually paid to the FI fund (loan,
guarantee, equity/quasi-equity or other funds) on an annual basis (IV. 16.1.4 + 16.2.1).
For the output indicators, as the FI will be implemented through investment measures,
the relevant output indicators are:
Number of operations supported (measures 4, 7 and 8.6: it will correspond to:
number of loan contracts signed with final recipient (V. 17.5) + number of final
recipients supported by guarantees (V. 18.7) + number of equity or quasi-equity
4 See Fiche 4B Monitoring of Financial Instruments and provision of monitoring information to the
Commission

10
investments made (V. 19.5) + number of other financial product instruments
made to final recipient (V. 20.5);
Number of beneficiaries supported (measures 6.4 and 4.1: it will correspond to:
number of final recipients supported by loans (V. 17.6) + number of final
recipients supported by guarantees (V. 18.6) + number of final recipients
supported by equity or quasi-equity investments (V. 19.6) + number of final
recipients supported by other financial product (V. 20.6).
Total investment should not be collected for operations supported through FI.
Only the output for operations supported by EAFRD should be considered.
Currency
All financial amounts must be expressed in Euro (EUR). All figures should be rounded
up/down to the nearest whole Euro. If Member States outside the Euro-zone have
converted their financial monitoring data from national currencies to Euro, they are
requested to indicate the exchange rate they used in the AIR.
4. Output indicators definitions:
O.1 Total public expenditure
Title and definition Measures concerned Source of data, timing of
reporting
Total amount of expenditure
(EAFRD + other public)
All measures Application form (for
commitments), payment
claims, PA database of
payments
Reported when completed
For Technical Assistance outside Networking, a breakdown administrative /
non-administrative cost is requested. Administrative corresponds to staff costs, office
overhead and running costs (see European Court of Auditors Special Report 04/2015).
For M04 (4.1, 4.2 and 4.4) and M06 (6.1 to 6.4) operations, a breakdown by type of farm
holdings receiving the support (based on FADN TF8 type of agricultural branch + non-
agricultural holdings) and size of the farm holdings receiving the support (by hectares) is
collected.
O.2 Total investment
Title and definition Measures concerned Source of data, timing of
reporting

11
Sum of all public and private
expenditure (eligible
expenditure only) of all the
tangible and/or intangible
investments made for
operations supported under a
particular investment
measure/sub-measure.
4, 5, 6.4, 7.2 to 7.8, 8.5
and 8.6
Application form
Reported when completed
This indicator should only be compiled for investment type of operations. If no
investments are supported, value is NP (not programmed).
If no private part is invested such as for 4.4 'non-productive investment' operations, the
total investment = total public expenditure.
4, 5, 8.5, 8.6: whole measures.
6: only 6.4 investment in non-agricultural activities in rural areas.
7: whole measure (7.2 to 7.8) except for 7.1 'drawing up and updating plans' .
O.3 Number of actions/operations supported
Title and definition Measures concerned Source of data, timing of
reporting
Number of operations
supported
1, 2, 4, 6, 7, 8.5 and
8.6, 9, 17.2 and 17.3
Application form
Reported when completed
1: number of actions organized by the service provider broken down by vocational
training/skill acquisition; demonstration/information and farm exchange (e.g. One
service provider organizing two distinct trainings (one on water management and the
other on manure management) = 2 operations, no matter how many times these trainings
are provided).
2: number of actions organized by the service provider (2.1 and 2.3) or the body in
charge of setting up the service (2.2) broken down by providing advisory services;
advisory services set-up and training of advisors (e.g. one service provider organizing
two distinct advisory services (one on young farmers business plan and the other on
specific agri-environment schemes) = 2 operations, no matter how many times these
services are provided).
4: number of investment operations supported (normally it corresponds to the number of
applications approved which have been completed) broken down by investments in
agricultural holdings (4.1); investments in processing/marketing of agricultural products
(4.2); investments in agricultural and forestry infrastructure (4.3) and non-productive
investments (4.4); out of which number of operations supported through FI.

12
6: under FA 5C, this information is notably needed for the common performance
framework output indicator.
For M04 (4.1, 4.2 and 4.4) and M06 (6.1 to 6.4) operations, a breakdown by type of farm
holdings receiving the support (based on FADN TF8 type of agricultural branch + non-
agricultural holdings) and size of the farm holdings receiving the support (by hectares) is
collected.
7: number of operations (investments, studies or drawing up of plans) supported broken
down by operations for drawing up plans of village development (7.1); for drawing up
NATURA 2000/HNV area management plans (7.1); for investments of small scale
infrastructure, including investments in renewable energy and energy saving (7.2); for
investments in broadband infrastructure and access to broadband, including e-
government services (7.3); for investments in local basic services for the rural population
(7.4); for investments in recreational/tourist infrastructure (7.5); for studies/investments
in rural cultural and natural heritage, including HNV sites (7.6); for investments in
relocation of activities for environmental/quality of life reasons (7.7); out of which
number of operations supported through FI; others (7.8).
Particular breakdown for 7.3 (ICT): ICT infrastructure: High-Speed broadband network
(access/local loop; >/= 30 Mbps); ICT infrastructure: Very high-speed broadband
network (access/local loop; >/= 100 Mbps); ICT: Other types of ICT infrastructure
(passive, IT center…); e-Government services.
8.5: number of operations supported.
8.6: number of operations supported, out of which number of operations supported
through FI.
9: number of producer groups set up receiving support, reported on an annual basis.
17.2: number of mutual funds supported.
17.3: number of stabilisation tools supported.
O.4 Number of holdings/beneficiaries supported
Title and definition Measures concerned Source of data, timing of
reporting
Number of
holdings/beneficiaries
supported
3.1, 4.1, 5, 6, 8.1 to 8.4,
11, 12, 13, 14, 17.1
Application form
Reported when completed

13
Beneficiaries are individuals or entities other than farm holdings which received support.
3 (only 3.1): number of holdings supported for new participation in quality schemes
(broken down by EU schemes, national schemes, voluntary agricultural product
certification schemes). For that sub-measure, completion is determined by the annual
payment made, reported annually in Table B3 (Article 5 (3) of Regulation (EU) No
215/2014).
4 (only for 4.1): number of holdings supported for investments in agricultural holdings.
5: number of beneficiaries supported for investment in prevention or restoration (broken
down by type of beneficiaries: farm holders or others).
6: number of holdings or beneficiaries receiving support (broken down by business start-
up aid for young farmers, business start-up aid for non-agricultural activities in rural
areas, business start-up aid for development of small farms, support for investments in
creation and development of non-agricultural activities, payments for farmers eligible for
the small farmers scheme who permanently transfer their holding to another farmer); out
of which, number of operations supported through FI.
If holdings and beneficiaries are supported under the same sub-measures, they are added
up with no distinction.
For 6.5, 'small farmers scheme who permanently transfer their holding to another
farmer': the number of beneficiaries should not be double counted. In case of annual
payment, the beneficiary is reported in the monitoring table when the first annual
payment is made.
8.1: number of beneficiaries supported to afforestation/creation of woodland (breakdown
maintenance/establishment). For maintenance support, completion is determined by the
annual payment made, reported annually in Table B3 (Article 5 (3) of Regulation (EU)
No 215/2014).
8.2: number of beneficiaries supported for establishment or maintenance of agro-forestry
systems (breakdown maintenance/establishment). For maintenance support, completion
is determined by the annual payment made, reported annually in Table B3 (Article 5 (3)
of Regulation (EU) No 215/2014).
8.3: number of beneficiaries supported for prevention operations. For that sub-measure,
completion is determined by the annual payment made, reported annually in Table B3
(Article 5 (3) of Regulation (EU) No 215/2014).
8.4: number of beneficiaries supported for restoration operations.
11: number of holdings supported through organic farming measure. For that measure,
completion is determined by the annual payment made, reported annually in Table B3
(Article 5 (3) of Regulation (EU) No 215/2014).
12: number of holdings supported through NATURA 2000 or Water Framework
Directive. For that measure, completion is determined by the annual payment made,

14
reported annually in Table B3 (Article 5 (3) of Regulation (EU) No 215/2014).
13: number of holdings supported through ANC measure. For that measure, completion
is determined by the annual payment made, reported annually in Table B3 (Article 5 (3)
of Regulation (EU) No 215/2014).
14: number of beneficiaries supported by animal welfare measure. For that measure,
completion is determined by the annual payment made, reported annually in Table B3
(Article 5 (3) of Regulation (EU) No 215/2014).
17.1: number of holdings supported for insurance premiums.
O.5 Total area (ha)
Title and definition Measures concerned Source of data, timing of
reporting
Area (ha)5 : area supported 4, 8.1 to 8.5, 10.1, 11,
12, 13, 15.1
IACS/application
form/payment claim
Reported on an annual basis
when annual payments are
made except for 8.1 and 8.2 in
the case of establishment
(operations completed)
4: only area concerned by investments in irrigation under FA 5A – reported when
operation is completed.
8.1: area supported broken down by establishment (reported cumulatively) and
maintenance (reported on an annual basis).
8.2: area supported broken down by establishment (reported cumulatively) and
maintenance (reported on an annual basis).
8.3 and 8.4: area concerned by prevention (reported on an annual basis) and restoration
(reported cumulatively).
8.5: area concerned by improving resilience and environmental value of forest
ecosystems – reported when operation is completed.
10.1: area under agri-environmental schemes broken down by type of land management
(management of inputs including integrated production (reduction of mineral fertilizers,
reduction of pesticides); soil cover, ploughing techniques, low tillage, conservation
agriculture; reduction of irrigated areas and/or irrigation rate, irrigation techniques;
5 “Area” relates to the total area under each type of contract, i.e. a hectare subject to two separate agri-
environment contracts is counted twice.

15
reduction of drainage, management of wetlands; creation, upkeep of ecological features
(e.g. field margins, buffer areas, flower strips, hedgerows, trees); maintenance of HNV
arable and grassland systems (e.g. mowing techniques, hand labour, leaving of winter
stubbles in arable areas), introduction of extensive grazing practices, conversion of
arable land to grassland; crop diversification, crop rotation; animal feed regimes, manure
management).
In case of different schemes of a same measure implemented on the same area, that area
is counted several times (no physical area).
11: area supported broken down by conversion and maintenance.
12: area supported broken down by NATURA 2000 agricultural land; NATURA 2000
forestry and Water Framework Directive.
13: area supported broken down by mountain areas; other areas facing natural
constraints and others areas affected by specific constraints.
15.1: area supported under forest-environment commitments.
In case of different schemes for a same measure implemented on the same area, that area
is counted several times (no physical area).
O.6 Physical area supported (ha)
Title and definition Measures concerned Source of data, timing of
reporting
Physical area supported (ha)6
10.1 IACS/application form
Reported on an annual basis
10 (only for 10.1): physical area not broken down neither by type of management nor by
FAs (this indicator should not be attributed to FA). The indicator is for the whole RDP,
hectares under agri-environment schemes. Schemes implemented under the same area
should not be double counted.
O.7 Number of contracts supported (ha)
Title and definition Measures concerned Source of data, timing of
reporting
Number of contracts
supported
10, 15 Application form
Reported on an annual basis
6 "Physical area supported" is the actual area covered by contracts, i.e. each hectare is only counted once,
regardless of how many separate contracts it may be subject to.
16
10: number of contract schemes supported. A farm holder could commit for several
contract/schemes broken down by 10.1 and 10.2.
15: number of contract schemes supported. A forestry holder could commit for several
contract/schemes.
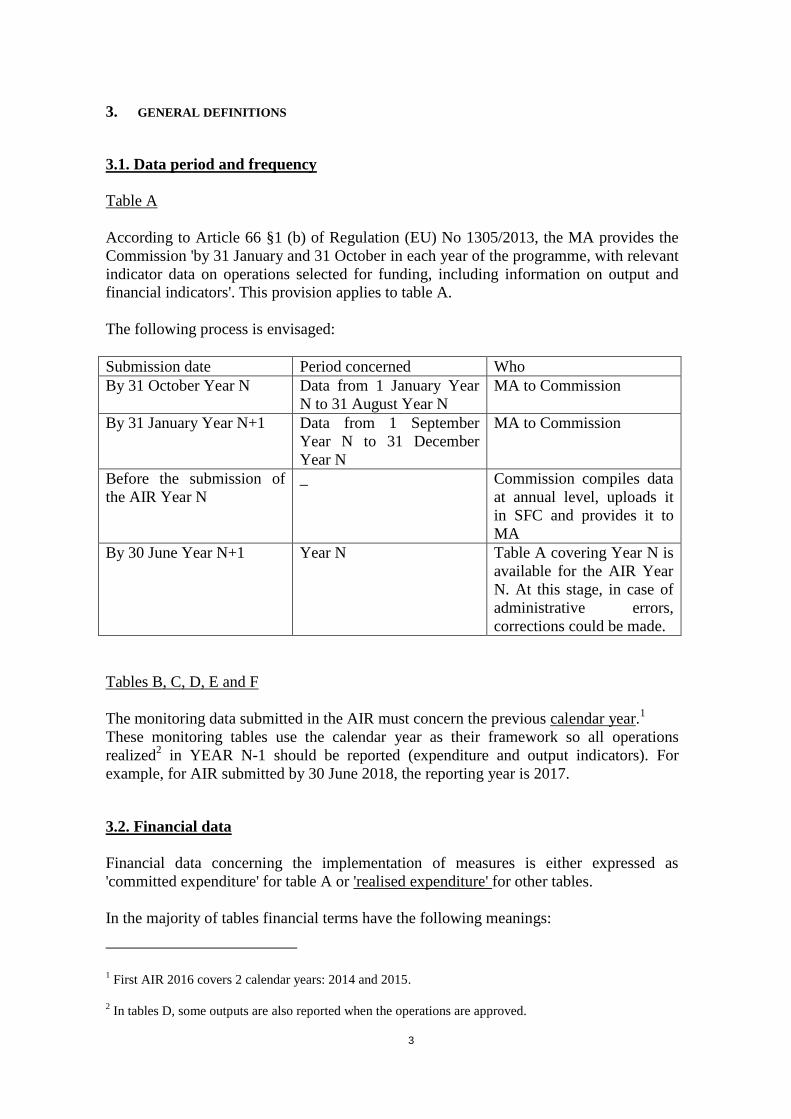
O.8 Number of Livestock Units supported (LU)
Title and definition Measures concerned Source of data, timing of
reporting
Number of LU supported
14, 4 Application form
4: reported when operation
completed
14: reported on an annual basis
after annual payment
14: number of LU concerned by the animal welfare commitment supported.
4: only if investments in manure storage/treatment under FA 5D.
O.9 Number of holdings participating in supported schemes
Title and definition Measures concerned Source of data, timing of
reporting
Number of holdings
participating in supported
schemes
9, 16.4, 17.2 and 17.3 Application form, plus
confirmation/amendment on
completion of the operation
Reported when completed
9 : number of holdings/organisations participating to the producer group supported. For
that measure, completion is determined by the annual payment made, reported annually
in Table B3 (Article 5 (3) of Regulation (EU) No 215/2014).
16 (only for 16.4): cooperation/local promotion among supply chain actors for
establishment and development of short supply chains and local markets.
17.2: number of farm holdings participating in mutual fund supported - reported when
completed.
17.3: number of farm holdings participating in stabilisation tool supported – reported
when completed.
17
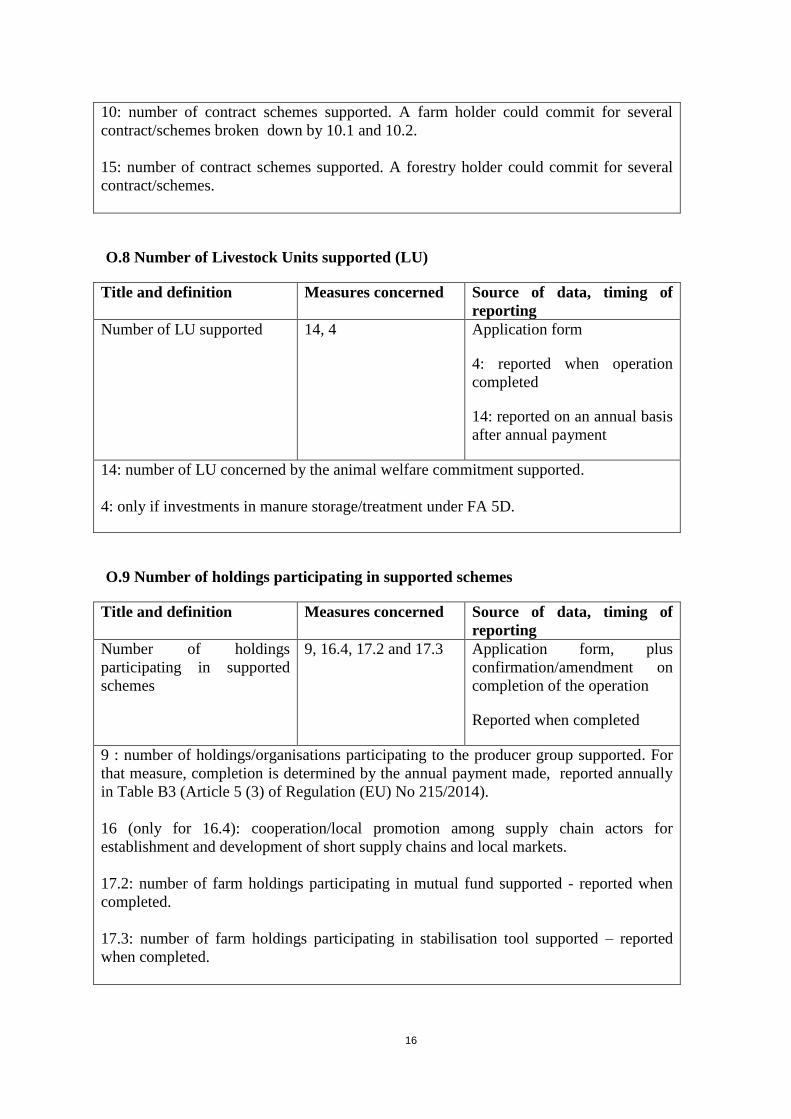
O.10 Number of farmers benefiting from pay-outs
Title and definition Measures concerned Source of data, timing of
reporting
Number of farmers
benefiting from
pay-outs/compensation
17.2 and 17.3 Annual reporting to MA from
risk management tool manager
Reported when completed
17.2: number of farmers receiving pay-outs from the mutual funds.
17.3: number of farmers receiving pay-outs from the stabilisation tool.
O.11 Number of training days given
Title and definition Measures concerned Source of data, timing of
reporting
Number of training days
given
1.1 Application form, plus
confirmation/amendment on
completion of the operation
Reported when completed
1 (only 1.1): number of training days given
One day equals to 8 hours of training. The indicator is calculated as the sum of the
number of hours received by all the participants, divided by 8.
O.12 Number of participants in trainings
Title and definition Measures concerned Source of data, timing of
reporting
Number of participants in
trainings
1.1 Application form, plus
confirmation/amendment on
completion of the operation
Reported when completed
1 (only 1.1): number of participants in trainings
It is not necessary to register the identity of participants; the same participant could be
counted as many times he/she participates in different trainings.

18
O.13 Number of beneficiaries advised
Title and definition Measures concerned Source of data, timing of
reporting
Number of beneficiaries
advised
2.1 Application form, plus
confirmation/amendment on
completion of the operation
Reported when completed
2 (only 2.1): only for providing advisory services.
It is not necessary to register the identity of beneficiaries advised; the same beneficiary
could be counted as many times he/she is advised.
O.14 Number of advisors trained
Title and definition Measures concerned Source of data, timing of
reporting
Number of advisors trained 2.3 Application form, plus
confirmation/amendment on
completion of the operation
Reported when completed
2 (only 2.3): number of advisors trained.
It is not necessary to register the identity of advisors trained; the same advisor could be
counted as many times he/she is trained.
O.15 Population benefiting from improved services/infrastructures (IT or others)
Title and definition Measures concerned Source of data, timing of
reporting
Total population benefiting
from improved
services/infrastructures
(broadband, other ICT or
others)
7 Application form plus, if
needed,
confirmation/amendment on
completion of operation
Reported when completed
This output indicator will count the potential population benefiting from improved
services/infrastructures via EAFRD operations (breakdown between non-ICT operations
(7.1, 7.2 and 7.4 to 7.8), broadband and other ICT). It will count population several times
if several operations are supported in the same municipality.
However, the target indicators (Table D – see target fiches FA 6B and FA 6A) should
count municipalities and related population only once.
19
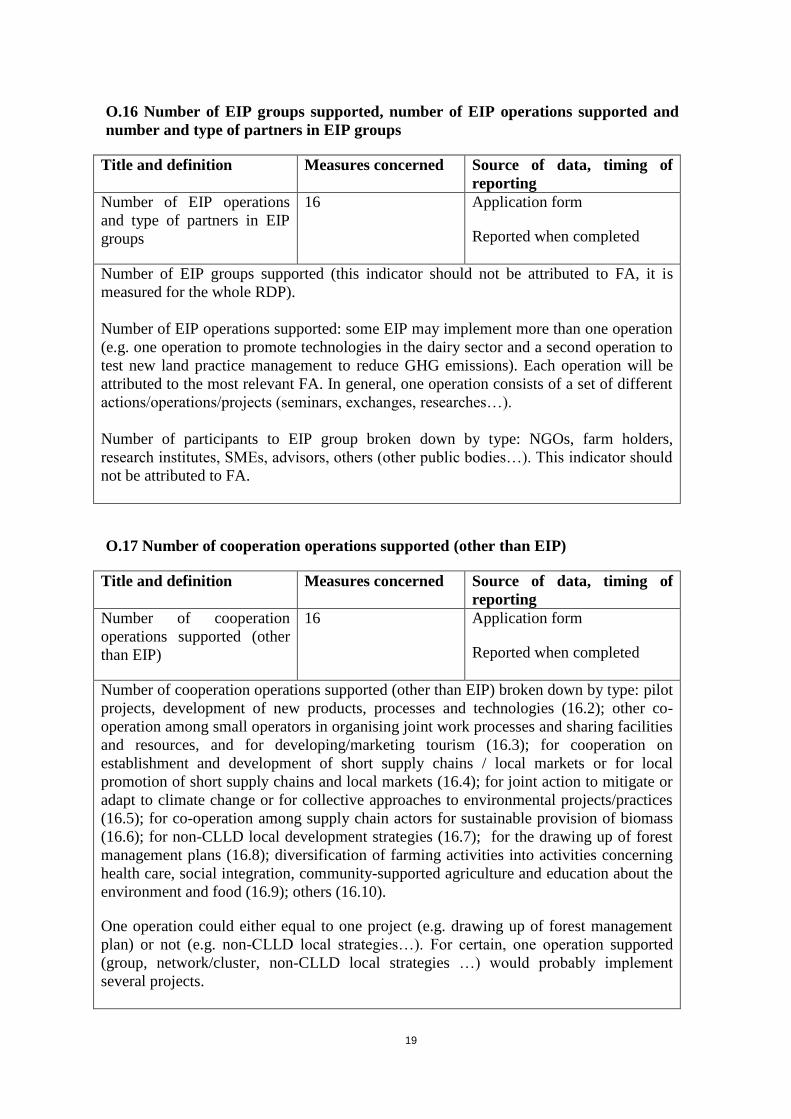
O.16 Number of EIP groups supported, number of EIP operations supported and
number and type of partners in EIP groups
Title and definition Measures concerned Source of data, timing of
reporting
Number of EIP operations
and type of partners in EIP
groups
16
Application form
Reported when completed
Number of EIP groups supported (this indicator should not be attributed to FA, it is
measured for the whole RDP).
Number of EIP operations supported: some EIP may implement more than one operation
(e.g. one operation to promote technologies in the dairy sector and a second operation to
test new land practice management to reduce GHG emissions). Each operation will be
attributed to the most relevant FA. In general, one operation consists of a set of different
actions/operations/projects (seminars, exchanges, researches…).
Number of participants to EIP group broken down by type: NGOs, farm holders,
research institutes, SMEs, advisors, others (other public bodies…). This indicator should
not be attributed to FA.
O.17 Number of cooperation operations supported (other than EIP)
Title and definition Measures concerned Source of data, timing of
reporting
Number of cooperation
operations supported (other
than EIP)
16
Application form
Reported when completed
Number of cooperation operations supported (other than EIP) broken down by type: pilot
projects, development of new products, processes and technologies (16.2); other co-
operation among small operators in organising joint work processes and sharing facilities
and resources, and for developing/marketing tourism (16.3); for cooperation on
establishment and development of short supply chains / local markets or for local
promotion of short supply chains and local markets (16.4); for joint action to mitigate or
adapt to climate change or for collective approaches to environmental projects/practices
(16.5); for co-operation among supply chain actors for sustainable provision of biomass
(16.6); for non-CLLD local development strategies (16.7); for the drawing up of forest
management plans (16.8); diversification of farming activities into activities concerning
health care, social integration, community-supported agriculture and education about the
environment and food (16.9); others (16.10).
One operation could either equal to one project (e.g. drawing up of forest management
plan) or not (e.g. non-CLLD local strategies…). For certain, one operation supported
(group, network/cluster, non-CLLD local strategies …) would probably implement
several projects.

20
O.18 Population covered by LAG
Title and definition Measures concerned Source of data, timing of
reporting
Population covered by LAG 19 MA/LAG
Reported when LAG selected
See target fiche for FA 6B
(this indicator should not be attributed to FA)
O.19 Identification number of LAG
Title and definition Measures concerned Source of data, timing of
reporting
Identification number of
LAG
19 MA
Reported when LAG selected
Total number of LAGs selected and number of LAGs multi-funds (this indicator should
not be attributed to FA).
O.20 Number of LEADER projects suported
Title and definition Measures concerned Source of data, timing of
reporting
Number of LEADER
projects supported
19 Application, reporting from
LAG manager
Reported when completed
For each project, the LAG managers identify what is the main objective of the project
(by using the list of FA, the project is flagged with the most relevant FA). To monitor the
contributions of the LEADER projects to the FAs, one indicator per project is collected.
The indicator to be collected depends on the main FA the project contributes to.
List of indicators to be collected depending on the most relevant objective of the
LEADER project:
1A -
1B Number of cooperation operations (non-Article
35 §1c) of Regulation (EU) No 1303/2013
operations)
1C Number of participants trained
2A, 2B Number of holdings/beneficiaries supported
3A, 3B Number of holdings supported or participating
in supported schemes
4A, 4B, 4C Total area (agriculture)

21
4A, 4B, 4C Total area (forestry)
5A Total area
5B, 5C Total investment
5D Total area or number of LU
5E Total area
6A -
6B Population benefiting from improved
services/infrastructures
6C Population benefiting from improved ICT
services/infrastructures
O.21 Number of cooperation projects supported
Title and definition Measures concerned Source of data, timing of
reporting
Number of cooperation
projects supported
19 Application, reporting from
LAG
Reported when completed
Number of cooperation projects supported broken down by inter-territorial cooperation
and transnational cooperation (this indicator should not be attributed to FA).
O.22 Number and type of project promoters
Title and definition Measures concerned Source of data, timing of
reporting
Number and type of project
promoters
19 Application, reporting from
LAG
Reported when completed
Number and type of project promoters broken down by NGOs, LAGs, public bodies,
SMEs, others (this indicator should not be attributed to FA).
O.23 Unique identification number of LAG involved in cooperation projects
Title and definition Measures concerned Source of data, timing of
reporting
Unique number of LAG
involved in cooperation
projects
19 MA, reporting from LAG
Reported when completed
Unique number of LAG involved in cooperation projects supported, broken down by
inter-territorial cooperation and transnational cooperation (this indicator should not be
attributed to FA).

22
O.24 Number of thematic and analytical exchanges set up with the support of NRN
Title and definition Measures concerned
Source of data, timing of
reporting
Number of thematic and
analytical exchanges set up
with the support of NRN, by
type
Networking
NRN reporting to MA
annually
Reported when completed
This indicator counts the total number of thematic and analytical exchanges set up
broken down by:
Number of thematic working groups set up;
Number of consultations (e.g. between MA and NRN stakeholders on programme
modifications…);
Others (trainings, web forum…).
Out of these total number of thematic and analytical exchanges set up, it is counted how
many:
Are focused on sharing and disseminating monitoring and evaluation
findings;
Are devoted to advisors and/or innovation support services;
Are devoted to LAG including support to cooperation.
O.25 Number of NRN communication tools
Title and definition Measures concerned
Source of data, timing of
reporting
Number of NRN
communication tools, by
type
Networking NRN reporting to MA
annually
Reported when completed
This indicator is broken down as follows:
Total events organized (seminars, conference, field trips….);
Number of publications: leaflets, newsletters, magazines… issued by the NRN
including e-publications;
Number of other NRN communication tools used to communicate RDP to
broader public (e.g. website, social media....);
Number of project examples collected and dissiminated by NRN;
From project databases, number of projects identified, collected, documented and
disssimated.
Out of these total number of events organized, publications and other communication
tools, it is counted how many:
Are focused on sharing and disseminating monitoring and evaluation

23
findings;
Are devoted to advisors and/or innovation support services;
Are devoted to LAG including support to cooperation.
O.26 Number of ENRD activities in which the NRN has participated
Title and definition Measure concerned
Source of data, timing of
reporting
Number of ENRD activities
in which the NRN has
participated
Networking NRN reporting to MA
annually
Reported when completed
This indicator counts all ENRD activities in which the NRN has participated and out of
those to which the NRN actively contributed (e.g. through presentations, facilitation of
working groups, poster sessions, etc.).

24
List and definitions of pre-defined output indicators used for the performance
framework
These indicators are pre-calculated by SFC 2014 based on the Indicator Plan. The output
indicators can be adapted/changed by the MA to better represent the RDP specificities.
Indicators Definitions of the pre-defined
performance framework indicators
Priority
2
Total Public Expenditure P2 (€) ∑ of total public expenditure of all
measures under P2
Number of agriculture holdings with RDP support for
investment in restructuring or modernisation (2A) +
Number of agricultural holdings with RDP supported
business development plan/investment for young
farmers (2B)
Number of holdings supported under
4.1 (2A) + number of holdings
supported under 6.1 (2B) {or number of
holdings supported under 4.1 (2B) if
6.1 = 0 }
Priority
3
Total Public Expenditure P3 (€) ∑ of total public expenditure of all
measures under P3
Nr of agricultural holdings supported under quality
schemes, local markets/short supply circuits, and
producer groups (3A)
Number of holdings supported under
3.1 (3A) + Number of holdings
supported under 9 (3A) + Number of
holdings supported under 16.4 (3A)
Number of agricultural holdings participating in risk
management schemes (3B)
Number of holdings supported under
17.1 (3B) + Number of holdings
participating in 17.2 (3B) + Number of
holdings participating in 17.3 (3B) +
number of holdings supported for
preventive actions 5.1 (3B)
Priority
4
Total Public Expenditure P4 (€) ∑ of total public expenditure of all
measures under P4
Agricultural land under management contracts
contributing to biodiversity (ha) (4A) + Agricultural
land under management contracts improving water
management (ha) (4B) + Agricultural land under
management contracts improving soil management
and/preventing soil erosion (ha) (4C)
Total area supported under 8.1 (P4 Ag)
+ Total area supported under 8.2 (P4
Ag) + Total area supported under 10.1
(P4 Ag) + Total area supported under
11.1 (P4 Ag) + Total area supported
under 11.2 (P4 Ag) + Total area
supported under 12.1 (P4 Ag) + Total
area supported under 12.3 (P4 Ag)
Priority
5
Total Public Expenditure P5 (€) ∑ of total public expenditure of all
measures under P5
Nr of investment operations in energy savings and
efficiency (€) (5B) + Nr of investment operations in
renewable energy production (€) (5C)
Number of operations supported under
4.1 to 4.3 (5B) + Number of operations
supported under 7.2 (5B) + Number of
operations supported under 4.1 to 4.3

25
(5C) + Number of operations supported
under 7.2 (5C) +Number of operations
supported under 6 (5C) + Number of
operations supported under 8.6 (5C) +
Agricultural and forest land under management to foster
carbon sequestration/conservation (ha) (5E) +
Agricultural land under management contracts targeting
reduction of GHG and/or ammonia emissions (ha) (5D)
+ Irrigated land switching to more efficient irrigation
system (ha) (5A)
Total area supported under 10.1 (5A) +
Total area supported under 4 (5A) +
Total area supported under 10.1 (5D) +
Total area supported under 10.1 (5E) +
Total area supported under 8.1 (5E) +
Total area supported under 8.2 (5E)
Priority
6
Total Public Expenditure P6 (€) ∑ of total public expenditure of all
measures under P6
Nr of operations supported to improve basic services
and infrastructures in rural areas (6B and 6C)
Number of operations supported under
7 (6B) + Number of operations
supported under 7.3 (6C)
Population covered by LAG Population covered by LAG
26
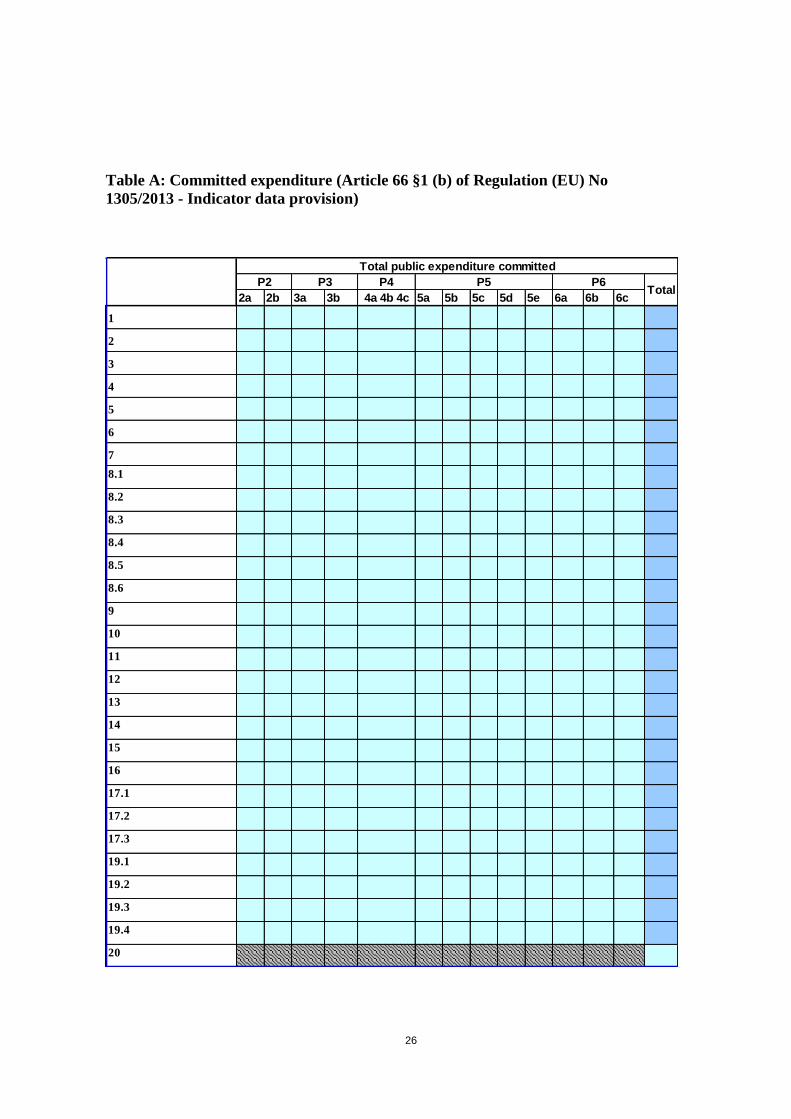
Table A: Committed expenditure (Article 66 §1 (b) of Regulation (EU) No
1305/2013 - Indicator data provision)
2a 2b 3a 3b 5a 5b 5c 5d 5e 6a 6b 6c
1
2
3
4
5
6
7
8.1
8.2
8.3
8.4
8.5
8.6
9
10
11
12
13
14
15
16
17.1
17.2
17.3
19.1
19.2
19.3
19.4
20
4a 4b 4c
Total public expenditure committed
P2 P3 P4 P5 P6Total

Table B1 - Table with realised outputs (AIR) - CUMULATIVE
2a 2b 3a 3b 5a 5b 5c 5d 5e 6a 6b 6c
farm holders
others (public entities…)
farm holders
others (public entities…)
Total public expenditures
(€) (4.1 to 4.4)
of which total public expenditure (€) (4.1) of which total public expenditure (€) (4.2) of which total public expenditure (€) (4.3) of which total public expenditure (€) (4.4)
Total
Total investment (public+private)
support for investments in non-agric activities in rural areas (6.4)
out of which Nr of holdings/beneficiaries supported through FI
Total public expenditures
(€) (6.1 to 6.5)
Total
of which total public expenditure (€) (6.1)
of which total public expenditure (€) (6.2)
of which total public expenditure (€) (6.3)
of which total public expenditure (€) (6.4)
of which total public expenditure (€) (6.5)
Nr of operations supported (advisory services)
start up aid young farmers (6.1)
start up aid non-agric activities in rural areas (6.2)
start up aid development small farms (6.3)
support for investments in restoration of agricultural
land and production potential (5.2)
Area (ha) concerned by investments for saving water (e.g. more efficient irrigation systems…)
out of which public expenditure realized through FI
transfer payment (6.5)
6
1
Training/skills acquisition
(1.1)
2 Providing advisory
services (2.1)
Nr of operations supported (advisory services set-up) (2.2)
Total public expenditure € (2.1 to 2.3)
Nr of farm exchanges operations supported (1.3)
Nr of training operations supported
Training of advisors (2.3)
Nr of beneficiaries advised
Nr of participants in trainings
Total public expenditure € for training/skills
output realised (2014-Year N cumul)
P2 P3 P4
support for investments in preventive actions to limit
natural disaster/catastrophic event damage (5.1)
Nr of
holdings/beneficiaries
receiving
Total investment € (public + private) (4.1 to 4.4)
Nr. of holdings supported for investments in agricultural holdings (4.1)
investments in processing/marketing of agricultural products (4.2)Nr. of operations
supported for
out of which Nr of operations supported through FI
investments in agricultural and forestry infrastructure (4.3)
non productive investment (4.4)
Nbr of operations supported (trainings for advisors)
Nbr of advisor trained
Nr of demonstration/information action operations supported (1.2)
Total public expenditure € (trainings, farm exchanges, demonstration) (1.1 to 1.3)
Nr of training days given
5
Total investment (public + private) (5.1 and 5.2)
Total public expenditures (€) (5.1 and 5.2)
Nr of beneficiaries for
LU concerned by investment in livestock management in view of reducing GHG and ammonia emissions (4.1, 4,4 and 4.3)
out of which public expenditure realized through FI
Totala b c
investments in agricultural holdings (4.1)
out of which Nr of holdings supported through FI
P5 P6
4
Number of operations
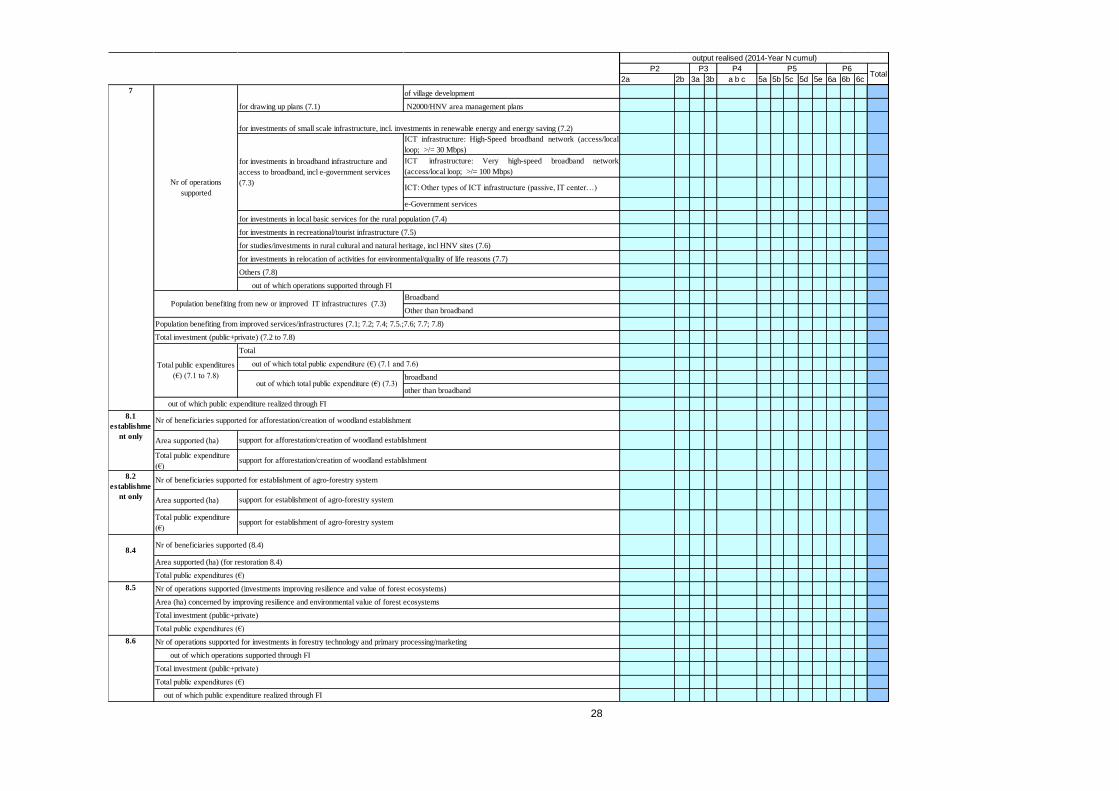
28
2a 2b 3a 3b 5a 5b 5c 5d 5e 6a 6b 6c
of village development
N2000/HNV area management plans
ICT infrastructure: High-Speed broadband network (access/local
loop; >/= 30 Mbps)
ICT infrastructure: Very high-speed broadband network
(access/local loop; >/= 100 Mbps)
ICT: Other types of ICT infrastructure (passive, IT center…)
e-Government services
Broadband
Other than broadband
broadband
other than broadband
Area supported (ha)
Total public expenditure
(€)
Area supported (ha)
Total public expenditure
(€)
Nr of beneficiaries supported (8.4)
Total investment (public+private)
P6P3
for investments in broadband infrastructure and
access to broadband, incl e-government services
(7.3)
out of which public expenditure realized through FI
8.1
establishme
nt only
Nr of beneficiaries supported for afforestation/creation of woodland establishment
support for afforestation/creation of woodland establishment
support for afforestation/creation of woodland establishment
8.2
establishme
nt only
Nr of beneficiaries supported for establishment of agro-forestry system
out of which operations supported through FI
for investments in relocation of activities for environmental/quality of life reasons (7.7)
Total investment (public+private) (7.2 to 7.8)
P2
out of which total public expenditure (€) (7.1 and 7.6)
for drawing up plans (7.1)
Total
support for establishment of agro-forestry system
support for establishment of agro-forestry system
Population benefiting from new or improved IT infrastructures (7.3)
Total public expenditures
(€) (7.1 to 7.8) out of which total public expenditure (€) (7.3)
for studies/investments in rural cultural and natural heritage, incl HNV sites (7.6)
for investments of small scale infrastructure, incl. investments in renewable energy and energy saving (7.2)
for investments in local basic services for the rural population (7.4)
for investments in recreational/tourist infrastructure (7.5)
Population benefiting from improved services/infrastructures (7.1; 7.2; 7.4; 7.5.;7.6; 7.7; 7.8)
8.4
8.5
Total public expenditures (€)
Total investment (public+private)
8.6
Total public expenditures (€)
7
output realised (2014-Year N cumul)
Totala b c
P5P4
Area (ha) concerned by improving resilience and environmental value of forest ecosystems
out of which public expenditure realized through FI
Others (7.8)
Nr of operations supported (investments improving resilience and value of forest ecosystems)
Total public expenditures (€)
Nr of operations supported for investments in forestry technology and primary processing/marketing
Area supported (ha) (for restoration 8.4)
Nr of operations
supported
out of which operations supported through FI

29
2a 2b 3a 3b 5a 5b 5c 5d 5e 6a 6b 6c
NGOs
Research institutes
Farm holders
SMEs
Advisors
others (other public bodies…)
pilot projects, development of new products, processes and
technologies (16.2)
for cooperation on establishment and development of short supply
chains / local markets or for local promotion of short supply chains
and local markets (16.4)
for joint action to mitigate or adapt to climate change or for
collective approaches to environmental projects/practices (16.5)
for cooperation among supply chain actors for sustainable provision
of biomass (16.6)
for non-CLLD local development strategies (16.7)
for the drawing up of forest management plans (16.8)
(other) co-operation among small operators in organising joint work
processes and sharing facilities and resources, and for developing /
marketing tourism (16.3)
diversification of farming activities into activities concerning health
care, social integration, community-supported agriculture and
education about the environment and food (16.9)
other
Total
out of which total public expenditure (€) (16.5)
17.3
Nr of EIP groups supported
17.2
Nr of farm holdings participating in mutual funds (17.2)
Nr of agricultural holdings involved in co-operation on short supply chains / local markets (16.4)
16
Total public expenditure (€) (non EIP)
Nr of EIP cooperation operations supported (e.g.pilot projects, product development...)
a b c
Non EIP
P2
out of which public expenditure realized through FI
Nr partners in EIP groups
output realised (2014-Year N cumul)
17.1
Nr of operations supported (mutual funds) (17.2)
Nr of farmers benefiting from payouts (17.2)
out of which public expenditure realized through FI
Total public expenditure (€) (17.1)
Total public expenditures (€) (17.2)
Nr of farm holdings participating in income stabilisation tool (17.3)
Nr farmers benefiting from payouts (17.3)
Nr of cooperation operations supported (EIP
excluded)
Total public expenditures (€) (17.3)
TotalP6P3 P5P4
EIP
Nr of operations (income stabilisation tool) supported (17.3)
Total public expenditure for EIP (€)
Nr of holdings supported for premium for insurance (17.1)
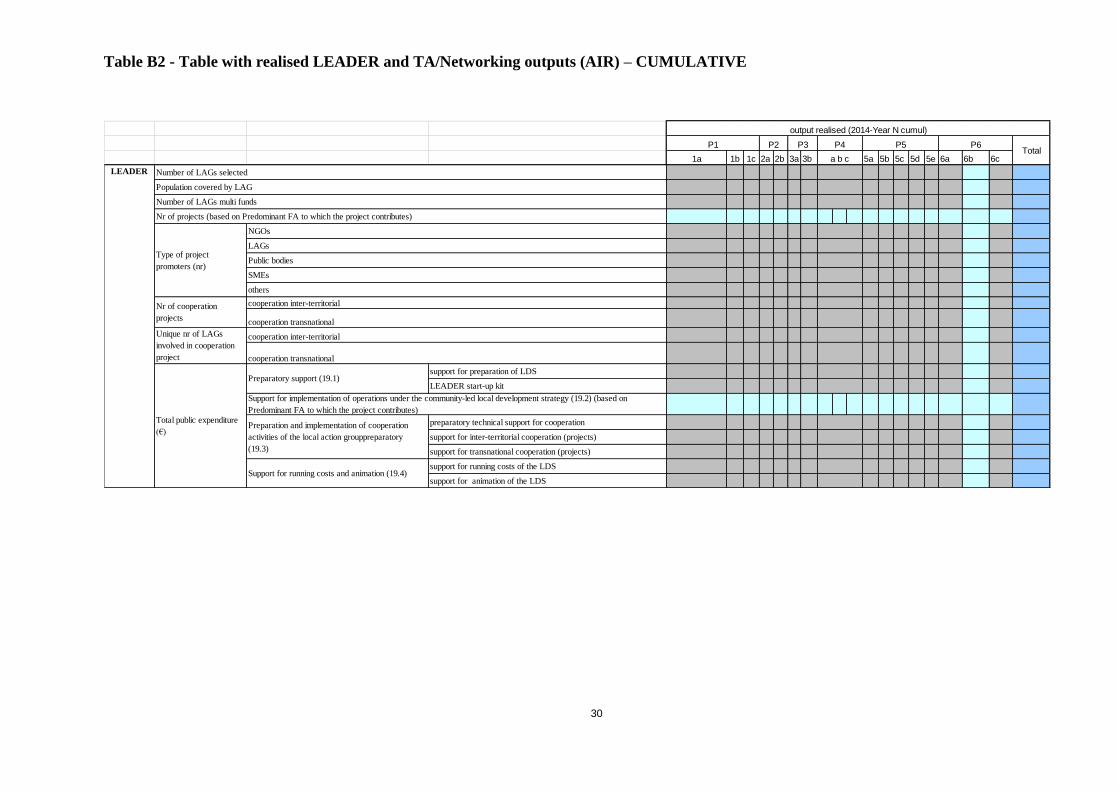
30
Table B2 - Table with realised LEADER and TA/Networking outputs (AIR) – CUMULATIVE
1a 1b 1c 2a 2b 3a 3b 5a 5b 5c 5d 5e 6a 6b 6c
support for preparation of LDS
LEADER start-up kit
preparatory technical support for cooperation
support for inter-territorial cooperation (projects)
support for transnational cooperation (projects)
support for running costs of the LDS
support for animation of the LDS
LEADER
P6Total
a b c
P5
Total public expenditure
(€)
Number of LAGs selected
P3
Support for implementation of operations under the community-led local development strategy (19.2) (based on
Predominant FA to which the project contributes)
others
Support for running costs and animation (19.4)
Preparation and implementation of cooperation
activities of the local action grouppreparatory
(19.3)
Preparatory support (19.1)
P4
Population covered by LAG
cooperation inter-territorial
NGOs
Unique nr of LAGs
involved in cooperation
project
Public bodies
SMEs
Number of LAGs multi funds
cooperation transnational
LAGs
Nr of projects (based on Predominant FA to which the project contributes)
output realised (2014-Year N cumul)
P2P1
Nr of cooperation
projects
Type of project
promoters (nr)
cooperation transnational
cooperation inter-territorial

31
FA recorded Data item Value (2014 - YEAR N CUMUL)
1A *
1BNumber of cooperation operations (non-Article
35(1c) of Reg. (EU) N° 1303/2013 operations)
1C Number of participants trained
2A Number of holdings/beneficiaries supported
2B Number of holdings/beneficiaries supported
3A
3B
Total area (agriculture) (ha)
Total area (forestry) (ha)
Total area (agriculture) (ha)
Total area (forestry) (ha)
Total area (agriculture) (ha)
Total area (forestry) (ha)
5A Total area (ha)
5B Total investment
5C Total investment
Total area
Number of LU
5E Total area
6A *
6BPopulation benefiting from improved
services/infrastructures
6CPopulation benefiting from improved ICT
services/infrastructures
4B
LEADER Data items to monitor contributions to the main FA
Depending on the Predominant FA to which the LEADER project contributes, the following item is recorded (1 value per project)
* Information collected by default for all LEADER projects (total public expenditure paid (LEADER data item 8) and jobs created (LEADER data item 13)).
Number of holdings supported or participating in
supported schemes
4A
4C
LEADER
5D

32
Nr of events organized by NRN
Nr of Publications: leaflets, newsletters, magazines... including e-
publications
Nr of other tools (website, social media…)
Nr of projects examples collected and disseminated by NRN
Thematic working groups
Consultations with stakeholders
others (trainings, web forum…)
TA
Networking
out of which
devoted to LAG
including support
to cooperation
out of which support for set up and running of the NRN
out of which focused
on sharing and
disseminating M&E
findings
out of which
devoted to
advisors
and/or
innovation
support
servicestotal
TA Other
than
Networking
Total public expenditure
(€)
Nr of thematic and analytical exchanges set up with the support of NRN
other costs (studies, trainings…)
administrative costs (staff, materials…)
Nr of NRN communication tools (by type)
total support for technical assistance
out of which NRN had an active contribution
Total public expenditure
(€)
Nr of ENRD activities in which the NRN has participated

33
Table B3 - Table with realised output indicators for area-based, LU and multi-annual measures (AIR) - ANNUAL
2a 2b 3a 3b 5a 5b 5c 5d 5e 6a 6b 6c
Plant genetic resources
Animal genetic resources
Cultivation practices Soil cover, ploughing techniques, low tillage, Conservation
agriculture
Reduction of irrigated areas and/or irrigation rate, irrigation
techniques
Reduction of drainage, management of wetlands
Creation, upkeep of ecological features (e.g. field margins, buffer
areas, flower strips, hedgerows, trees)
Maintenance of HNV arable and grassland systems (e.g. mowing
techniques, hand labour, leaving of winter stubbles in arable areas),
introduction of extensive grazing practices, conversion of arable land
to grassland.
Crop diversification, crop rotation
Animal feed regimes, manure management
others
Cultivation practices Soil cover, ploughing techniques, low tillage, Conservation
agriculture
Reduction of irrigated areas and/or irrigation rate, irrigation
techniques
Reduction of drainage, management of wetlands
Creation, upkeep of ecological features (e.g. field margins, buffer
areas, flower strips, hedgerows, trees)
Maintenance of HNV arable and grassland systems (e.g. mowing
techniques, hand labour, leaving of winter stubbles in arable areas),
introduction of extensive grazing practices, conversion of arable land
to grassland.
Crop diversification, crop rotation
Animal feed regimes, manure management
Irrigation/drainage
Farm management, integrated approaches
Total Public expenditure for genetic resources conservation (10.2)
Management of inputs incl. integrated production (reduction of mineral fertilizers, reduction of pesticides)
Nr of contracts supported (10.1)
Farm management, integrated approaches
Management of landscape, habitats, grassland,
HNV farming
10
Total public expenditure €
(10.1)
Area supported (ha)
(10.1)
others
Nr of contracts for genetic resources conservation supported (10.2)
Irrigation/drainage
Management of landscape, habitats, grassland,
HNV farming
P6P3 P5P4
Total
a b c
output realised (Year N ANNUAL)
P2
Management of inputs incl. integrated production (reduction of mineral fertilizers, reduction of pesticides)
Physical area (ha) (10.1)

34
2a 2b 3a 3b 5a 5b 5c 5d 5e 6a 6b 6c
Area supported (ha)
Total public expenditure
(€)
Area supported (ha)
Total public expenditure
(€)
8.1
maintenanc
e only
Nr of contracts supported (15.1)
15
8.2
maintenanc
e only
support for afforestation/creation of woodland maintenance premium
support for new participation in EU quality schemes
support for new participation in national quality schemes
Area supported (ha)
Nr of holdings supported (12.1 to 12.3)
Area supported (ha)
mountain areas (13.1)
NATURA 2000 agricultural land (12.1)
conversion to organic farming (11.1)
9
P4
a b c
output realised (Year N ANNUAL)
P5Total
P2 P3 P6
Area (ha) under forest environment commitment (15.1)
NATURA 2000 agricultural land (12.1)
others areas affected by specific constraints (13.3)
Nr of LU supported
NATURA 2001 forest land (12.2)
12
13
14
Nr of holdings supported (13.1 to 13.3)
Nr of holdings supported (11.1 and 11.2)
others areas facing natural constraints (13.2)
WFD (12.3)
support for afforestation/creation of woodland maintenance premium
Area (ha)
Total public expenditure
(€)
mountain areas (13.1)
others areas facing natural constraints (13.2)
others areas affected by specific constraints (13.3)
NATURA 2000 forest land (12.2)
maintenance of organic farming (11.2)
Total public expenditure (€) (11.1 and 11.2)
Total public expenditure
(€)
WFD (12.3)
Area supported (ha) (for prevention 8.3)
Total public expenditures (8.3) (€)
Nr of beneficiaries supported (8.3)
Total public expenditures (€) (3.1, 3.2)
support for new participation in voluntary agricultural product certification schemes
Nr of beneficiaries supported for maintenance of agro-forestry system premium
11
Total public expenditure (€) (15.1 to 15.2)
Public expenditures for genetic resources conservation (15.2)
Total public expenditure (€)
Nr of beneficiaries supported
Total public expenditures (€)
Nr of holdings participating in producer groups supported
Nr of operations supported (producer groups set up)
3
support for maintenance of agro-forestry system premium
support for maintenance of agro-forestry system premium
Nr of beneficiaries supported for afforestation/creation of woodland maintenance premium
Nr of holding supported
(3.1)
Total public expenditures (€) (3.2)
8.3

Table B4 - Total public expenditure of the operations which have additional contributions to other Focus Areas (AIR) - CUMULATIVE
Total public - YEAR N Cumulative (total
programmed FA)
P4 breakdown: Total public - YEAR N Cumulative (Total
public of all P4 operations having contributions to each
individual P4 Fas - double counting)
Total public - YEAR
N Cumulative (Total
public of all the
operations having
additional
contributions to
other Fas - double
counting)
FA 2A
FA 2B
FA 3A
FA 3B
FA 4A
FA 4B
FA 4C
FA 5A
FA 5B
FA 5C
FA 5D
FA 5E
FA 6A
FA 6B
FA 6C
cell calculated from other sections
P4
P5
P6
Priority/ Focus Area
P1
P2
P3

36
Table C: Breakdown by gender, type of agricultural branch and size, age and area type - Cumulative
Mountain other
specific
constraints
4
6
Totalof which Natura
2000
10.1
15.1
Totalof which organic
holdings
4.1, 6.1, 6.3,10, 12,
13, 14,
Total
2A 2B
male
female
male
female
male
female
male
female
P6P5
Total public expenditure (6.1 to 6.5)
Cumul 2014-Year N
Total public expenditure
P 2
Monitoring of outputs broken down by age and gender
P4
Cumul 2014-Year N
P3
Total
ANC
Monitoring of outputs broken down by area type Cumul 2014-Year N
Total public expenditure
Total public expenditure (4.1 to 4.4)
non-ANC
Age (> 40)
Other non individuals
Nbr. of holdings supported
(investment in agricultural holdings
4.1)
Age (≤ 40)
Total
6
4
Cumul 2014-Year N
Total public expenditure
Total
Nbr. of holdings/beneficiaries
receiving (6.1 to 6.5)
Other non individuals
Age (> 40)
Age (≤ 40)

37
Total Field crops Horticulture Wine Other
permanent
crops
Milk Other grazing
livestock
Granivores Mixed
(crops +
livestock)
Non agroicultural
sector (Food
industry…)
Total< 5 Ha
>= 5 HA to < 10
Ha
>= 10 HA to <
20 Ha
>= 20 HA to
< 50 Ha >= 50 Ha
Number of operations
Monitoring of outputs broken down by type of agricultural branch
Monitoring of outputs broken down by size
Number of operations
M04 (4.1, 4.2, 4.4)
M06 (6.1, 6.2, 6.3,
6.4)
Total public expenditure
Total public expenditure
Total public expenditure
Number of operations
Number of operations
Total public expenditure
M04 (4.1, 4.2, 4.4)
M06 (6.1, 6.2, 6.3,
6.4)
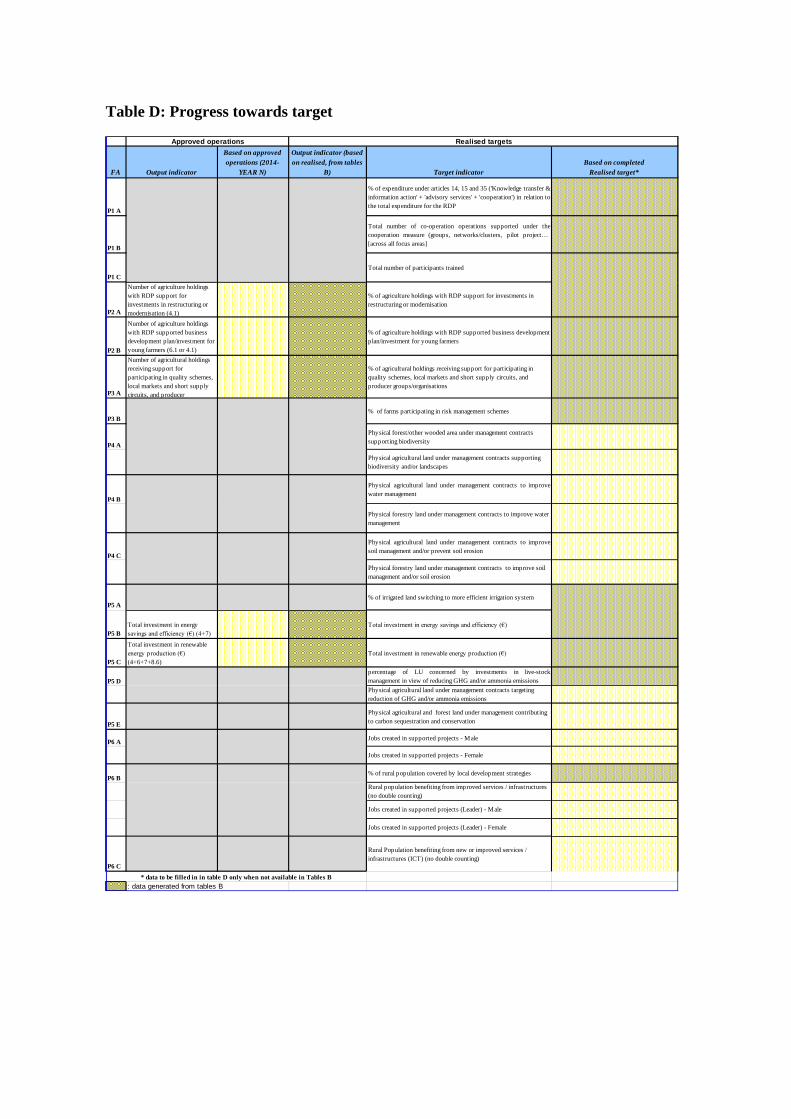
Table D: Progress towards target
FA Output indicator
Based on approved
operations (2014-
YEAR N)
Output indicator (based
on realised, from tables
B) Target indicator
Based on completed
Realised target*
P1 A
% of expenditure under articles 14, 15 and 35 ('Knowledge transfer &
information action' + 'advisory services' + 'cooperation') in relation to
the total expenditure for the RDP
P1 B
Total number of co-operation operations supported under the
cooperation measure (groups, networks/clusters, pilot project… )
[across all focus areas]
P1 C
Total number of participants trained
P2 A
Number of agriculture holdings
with RDP support for
investments in restructuring or
modernisation (4.1)
% of agriculture holdings with RDP support for investments in
restructuring or modernisation
P2 B
Number of agriculture holdings
with RDP supported business
development plan/investment for
young farmers (6.1 or 4.1)
% of agriculture holdings with RDP supported business development
plan/investment for young farmers
P3 A
Number of agricultural holdings
receiving support for
participating in quality schemes,
local markets and short supply
circuits, and producer
% of agricultural holdings receiving support for participating in
quality schemes, local markets and short supply circuits, and
producer groups/organisations
P3 B
% of farms participating in risk management schemes
P4 A
Physical forest/other wooded area under management contracts
supporting biodiversity
Physical agricultural land under management contracts supporting
biodiversity and/or landscapes
P4 B
Physical agricultural land under management contracts to improve
water management
Physical forestry land under management contracts to improve water
management
P4 C
Physical agricultural land under management contracts to improve
soil management and/or prevent soil erosion
Physical forestry land under management contracts to improve soil
management and/or soil erosion
P5 A
% of irrigated land switching to more efficient irrigation system
P5 B
Total investment in energy
savings and efficiency (€) (4+7)
Total investment in energy savings and efficiency (€)
P5 C
Total investment in renewable
energy production (€)
(4+6+7+8.6)
Total investment in renewable energy production (€)
P5 D
percentage of LU concerned by investments in live-stock
management in view of reducing GHG and/or ammonia emissions
Physical agricultural land under management contracts targeting
reduction of GHG and/or ammonia emissions
P5 E
Physical agricultural and forest land under management contributing
to carbon sequestration and conservation
P6 A Jobs created in supported projects - Male
Jobs created in supported projects - Female
P6 B% of rural population covered by local development strategies
Rural population benefiting from improved services / infrastructures
(no double counting)
Jobs created in supported projects (Leader) - Male
Jobs created in supported projects (Leader) - Female
P6 C
Rural Population benefiting from new or improved services /
infrastructures (ICT) (no double counting)
: data generated from tables B
Approved operations
* data to be filled in in table D only when not available in Tables B
Realised targets

39
Table E: Monitoring of total public expenditure for transitional measures -
ANNUAL
Measures under Regulation
(EU) No […][RD]
Codes under Regulation (EU) No
[…][RD]
Codes under Regulation (EC) No
1698/2005Total public expenditure
Article 14 1 331, 111
Article 15 2 114, 115
Article 16 3 132, 133
Article 17 4 216, 121, 125, 123
Article 18 5 126
Article 19 6 112, 141, 311,312,313
Article 20 7 321, 322, 323
Article 21 8 221, 222, 223, 226, 227, 122, 123
Article 27 9 142
Article 28 10 214
Article 29 11 214
Article 30 12 213, 224
Article 31 13 211, 212
Article 33 14 215
Article 34 15 225
Article 35 16 124
Article 32 of Regulation (EU) No
[…][CPR]/Art. 42 RD19 411, 412, 413, 421, 431
113
131
341
Discontinued measures

40
Table F (AIR): Progress towards performance framework indicators (using pre-defined output indicators, to be adapted depending on the RDP)
Indicators
Realised
performance
framework
indicators (Year
N)*
Adjustment top
ups
Calculated
achievement
rate (YEAR
N)**
Milestones Targets 2023
Priority 2 Total Public Expenditure P2 (€)
Number of agriculture holdings with RDP support for investment in
restructuring or modernisation (2A) + Number of agricultural holdings with
RDP supported business development plan/investment for young farmers
(2B)
Priority 3 Total Public Expenditure P3 (€)
Nr of agricultural holdings supported under quality schemes, local
markets/short supply circuits, and producer groups (3A)
Number of agricultural holdings participating in risk management schemes
(3B)
Priority 4 Total Public Expenditure P4 (€)
Agricultural land under management contracts contributing to biodiversity
(ha) (4A) + Agricultural land under management contracts improving water
management (ha) (4B) + Agricultural land under management contracts
improving soil management and/preventing soil erosion (ha) (4C)
Priority 5 Total Public Expenditure P5 (€)
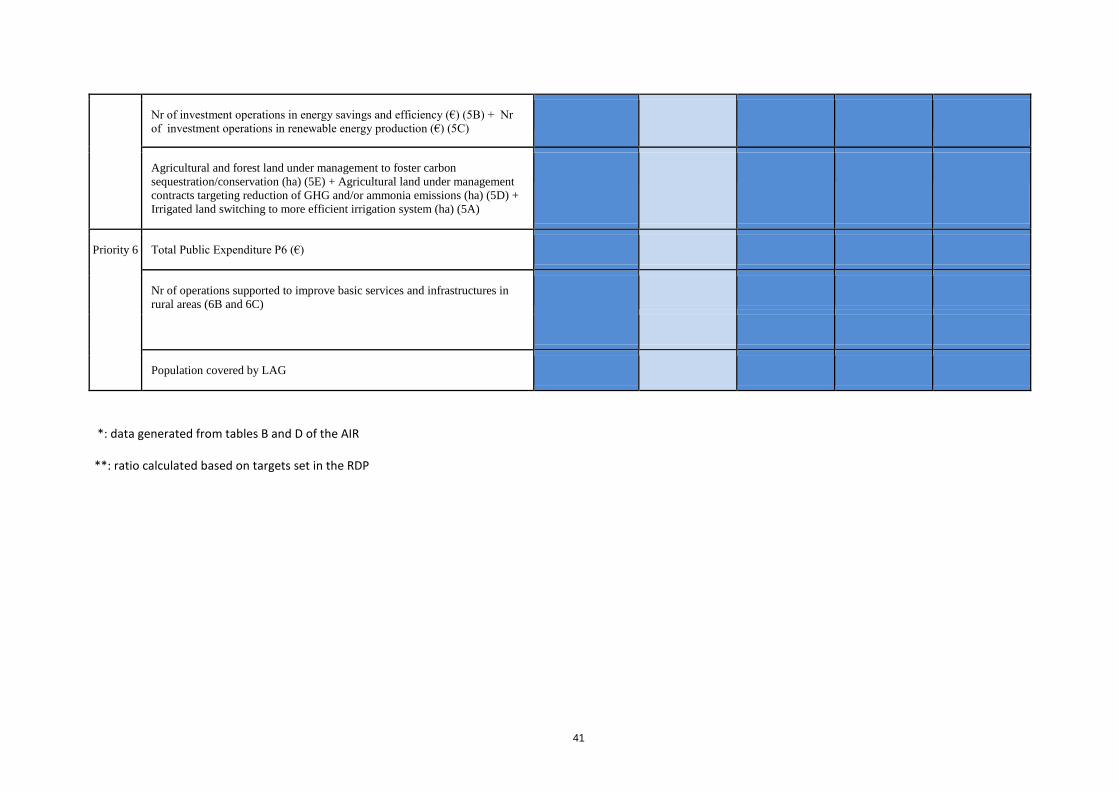
41
Nr of investment operations in energy savings and efficiency (€) (5B) + Nr
of investment operations in renewable energy production (€) (5C)
Agricultural and forest land under management to foster carbon
sequestration/conservation (ha) (5E) + Agricultural land under management
contracts targeting reduction of GHG and/or ammonia emissions (ha) (5D) +
Irrigated land switching to more efficient irrigation system (ha) (5A)
Priority 6 Total Public Expenditure P6 (€)
Nr of operations supported to improve basic services and infrastructures in
rural areas (6B and 6C)
Population covered by LAG
*: data generated from tables B and D of the AIR
**: ratio calculated based on targets set in the RDP
Top Related