


Languages
Pages
Legal


Document #98139100
WinPEP User GuideFor the Kart/ATV DynamometerSoftware under Windows 95/98
Dynojet® Research Inc.
Revision B 2/9/00

Document #98139100
© 1993, 1994, 1995, 1996, 1997, 1998 Dynojet Research Inc. AllRights Reserved.
Dynojet WinPEP for use with Microsoft® Windows® 95.
This manual, as well as the software described in it, is furnishedunder license and may only be used or copied in accordance with theterms of such license. The information in this manual is furnished forinformational use only, is subject to change without notice, andshould not be construed as a commitment by Dynojet Research Inc.Dynojet Research Inc. assumes no responsibility or liability for anyerrors or inaccuracies that may appear in this book.
The Dynojet Logo is a trademark of Dynojet Research Inc.
Printed in the USA.

Document #98139100 iRevision B 2/9/00
Contents
Chapter 1 ..............................................1 - 1Introduction
About the Guide......................................................................1 - 1System Requirements............................................................1 - 2WinPEP Package Contents...................................................1 - 2Technical Support .................................................................1 - 3
Chapter 2 ..............................................2 - 1Installing WinPEP
Important Points of Interest ..................................................2 - 1Install WinPEP ........................................................................2 - 2
Chapter 3 ..............................................3 - 1Basic Concepts
Windows Environment ..........................................................3 - 1WinPEP Interface ....................................................................3 - 1Workspace Menu ....................................................................3 - 3Workspace Toolbar ................................................................3 - 5Work Group Toolbar................................................................3 - 6Graph View Toolbar ................................................................3 - 7

ii Document #98139100
Chapter 4 ..............................................4 - 1Making a Run with a Kart or ATV
Loading the Vehicle ................................................................4 - 1RPM Pickup ............................................................................4 - 4RPM Pickup Guide..................................................................4 - 5Connecting the Inductive Pickup..........................................4 - 6Primary Wire Inductive Pickup..............................................4 - 7Running WinPEP ....................................................................4 - 7Editing the Notes and Parameters......................................4 - 10Run Preparation....................................................................4 - 14Make a Test Run....................................................................4 - 15Making a Run ........................................................................4 - 17
Chapter 5 ..............................................5 - 1Viewing Graphs
Viewing a Fourth Gear Roll-on..............................................5 - 1Graph Features ......................................................................5 - 3
Smoothing ......................................................................................5 - 4Correction Factor............................................................................5 - 4Zooming In ......................................................................................5 - 5Unzooming ......................................................................................5 - 5Copy graph to clipboard................................................................5 - 5Graph Options ................................................................................5 - 6Axis Selection ................................................................................5 - 7Multiple Graph Selection ..............................................................5 - 9Full Screen Zoom ........................................................................5 - 13
Right Mouse Button Menu ..................................................5 - 14Graph Options ..............................................................................5 - 14Cursor ............................................................................................5 - 15Cursor Line....................................................................................5 - 15Scaling ..........................................................................................5 - 17Font Size ........................................................................................5 - 17Grid Lines ......................................................................................5 - 18Grid in Front ..................................................................................5 - 18Graph Lines ..................................................................................5 - 18Export Dialog ................................................................................5 - 19
Printing a Graph....................................................................5 - 20Print Preview ................................................................................5 - 21Changing Graphic Header ..........................................................5 - 23Print Options ................................................................................5 - 27

Document #98139100 iii
Chapter 6 ..............................................6 - 1Racing Vehicles
Chapter 7 ..............................................7 - 1Notes / Search Features
Viewing /Editing Notes ..........................................................7 - 1Search ......................................................................................7 - 3
Chapter 8 ..............................................8 - 1Tools
WinPEP Tools ..........................................................................8 - 1Group Tools ............................................................................8 - 4System Information ................................................................8 - 5Other Tools ..............................................................................8 - 6Options ....................................................................................8 - 8
Chapter 9 ..............................................9 - 1Theory of Operation
WinPEP Tools ..........................................................................9 - 1Power........................................................................................9 - 1Torque ......................................................................................9 - 2Correction Factors..................................................................9 - 3Hardware and Software..........................................................9 - 5Conclusion ..............................................................................9 - 6

iv Document #98139100
Notes:

Document #98198100 1 - 1
Chapter 1
Introduction
Welcome to WinPEP-- Dynojet’s Windows® 95/98
based performance evaluation program. Dynojet’s
software and dynamometers will give you the power to
get the maximum performance out of vehicles you
evaluate. Whether you are new to the benefits of a
chassis dynamometer or an experienced performance
leader, the repeatability and diagnostic tools of
WinPEP software and a Dynojet Dynamometer will
give you the professional results for which you are
looking.
About the Guide
Before you begin using WinPEP, be sure to read
this guide for software installation instructions,
program features, and other important
information. The Dynojet WinPEP User’s Guide
provides detailed information about WinPEP
features and commands, dynamometer use, a
theoretical background, and a hands-on tutorial.
This guide is designed to be a reference tool in
your everyday work.
Revision C 2/9/00

1 - 2 Document #98198100
System Requirements
To use WinPEP, your system must meet the
following minimum requirements:
• Pentium P5-100 processor• Microsoft® Windows® 9x• 800 Megabyte Hard Drive• 16 MB of Ram• 800x600 (SVGA) 16k Color Video• 8x CD-ROM Drive
Dynojet Research, Inc., however, recommends
the following hardware and software:
• Pentium P5-133 or greater processor• 1.2 Gigabyte Hard Drive or better• 16 MB of Ram (32 MB for Windows 98)• 1024x768 (SVGA) 16k Color Video or better• 8x CD-ROM Drive• 28.8 K Modem or better
Disk space requirements:
8 MB of free hard disk space is required to install
WinPEP.
WinPEP Package Contents
The WinPEP software package includes the
following items:
• WinPEP Software CD• WinPEP User Guide (on the above CD)

Document #98198100 1 - 3
Note: Your WinPEP software is dyno/drumspecific. That means that the precisedrum mass for your individual dyno hasbeen calibrated and tied directly to theWinPEP software that came with yourdyno. The software will not give accurateresults if it is used with some otherdynamometer.
Technical Support
If you have any questions or need technical
support, we can be reached at:
Dynojet Research, Inc.2191 Mendenhall DriveNorth Las Vegas, NV 89031Phone: (800) 992-4993
(702)399-1423Fax: (702) 339-1431Web: www.dynojet.com
Our presence on the World Wide Web offers you
the Performance Industry advantage. We provide
state of the art technical support, on-line
shopping, 3D visualizations, and press releases
about our latest product line.
Also, as a Dyno Owner or Dealer, you have
access to jet kit fact sheets, newsletters, and
dealer pricing in @PREFFERED.Dynojet.com
with just a click of a mouse.

1 - 4 Document #98198100
Notes.
98198100 2-1
Chapter 2
Installing WinPEPFrom CD
Getting Started
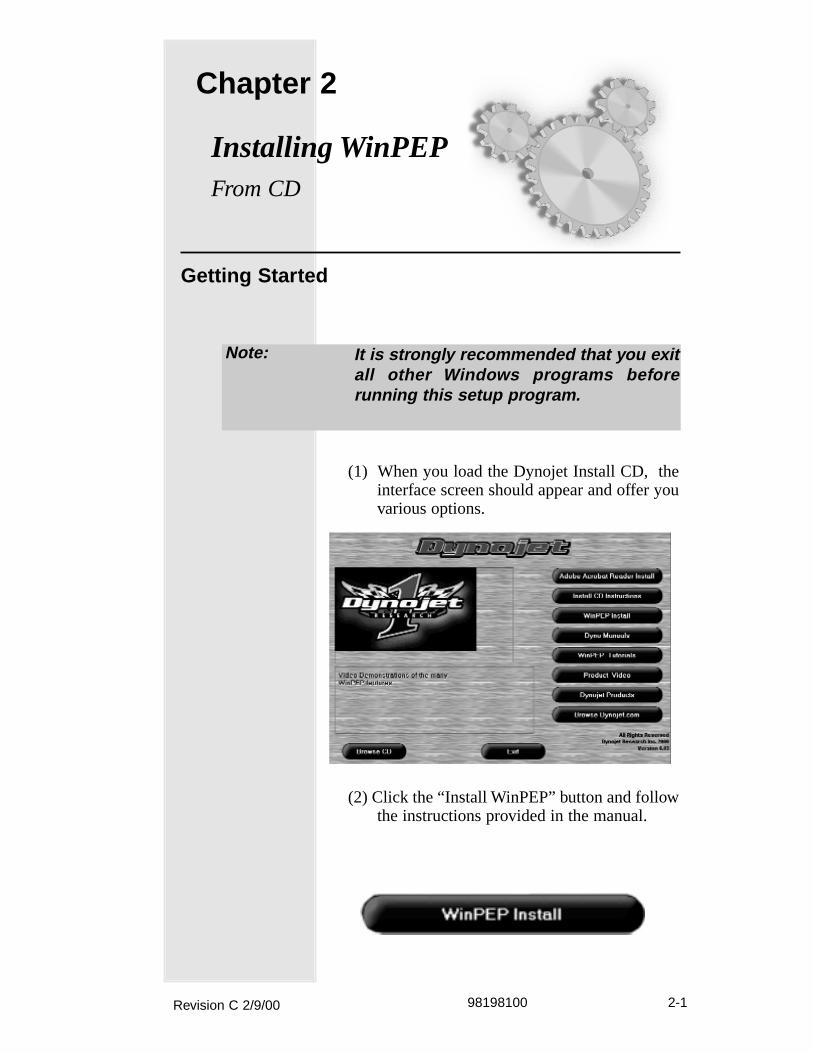
(1) When you load the Dynojet Install CD, theinterface screen should appear and offer youvarious options.
(2) Click the “Install WinPEP” button and followthe instructions provided in the manual.
Revision C 2/9/00
Note: It is strongly recommended that you exitall other Windows programs beforerunning this setup program.

2-2 98198100
Install WinPEP
Use the following steps as a guide to install WinPEP
for Windows® 95 / 98.
(1) Read the WinPEP Copyright notice and click“NEXT”.
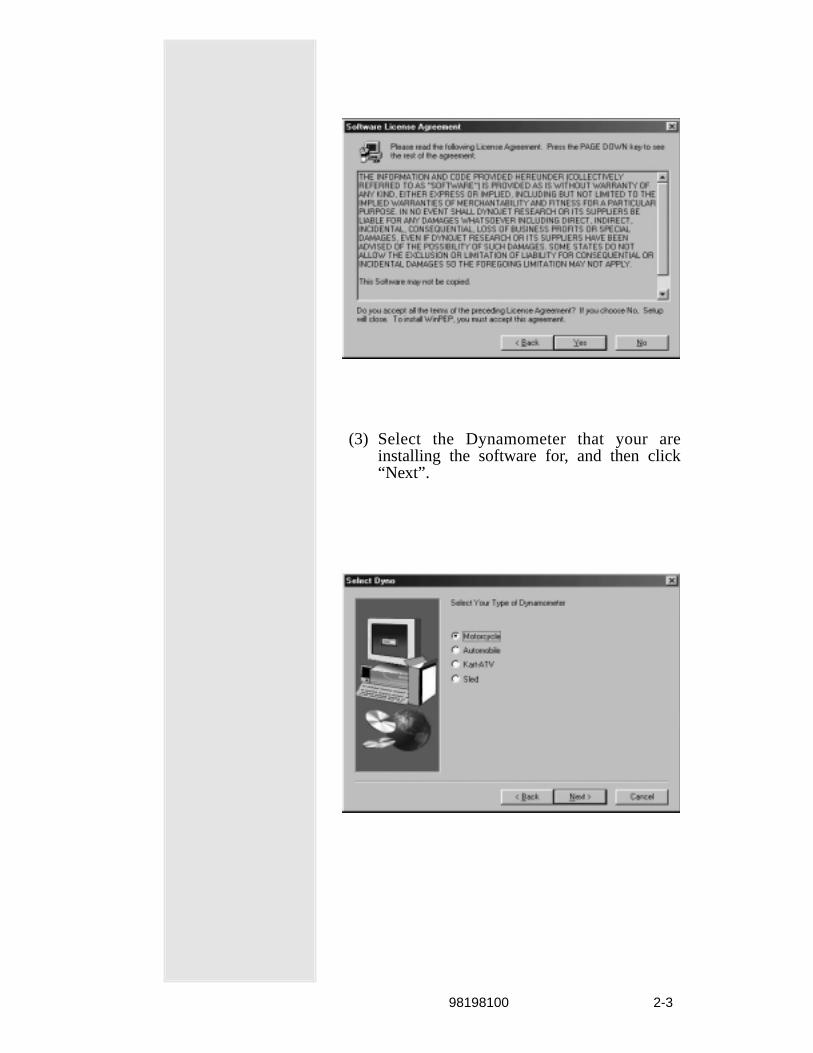
(2) Carefully read the WinPEP license agreementand click “Yes” if you agree to the terms.
98198100 2-3
(3) Select the Dynamometer that your areinstalling the software for, and then click“Next”.

2-4 98198100
(4) You will need to select the type of hardwarethat you have. Refer to the picture below,make your selection, and then click “Next”.
Dynoware EX+
If you have a “HardwareStack” as shown to the left,select the “DynowareEX+” option.
If you do not have a“Hardware Stack”, choosethe “Internal PC Card”option.

98198100 2-5
(5) Select a drive and directory where youwould like WinPEP to be installed.
Click the “Next” button after you have madeyour selection.
(6) On a typical installation, the boxes in thepicture on the next page will be checked.
Note: If you are reading this manual on yourcomputer screen, you already have AdobeAcrobat Reader installed. If you are reading ahard copy, you may want to check the “InstallAcrobat Reader” box.

2-6 98198100
! Leaving the “Copy Manuals”box checked will install theselected manuals on yourhard drive. If you choose touncheck the box, you’ll stillbe able to access the manuals.from the CD.
! Clicking on the “CopyManuals” text will allow youto pick and choose themanuals you would like toinstall.
Click the “Next” button after you have madeyour selections.
(7) Choose the language you prefer the units tobe displayed in, and then click the “Next”button.

98198100 2-7
(8) Review the selections in the “CurrentSettings” window. If the selections lookOK, click the “Next” button.
(9) You should notice the screen below whileinstallation occurs, no action is necessary.
2-8 98198100
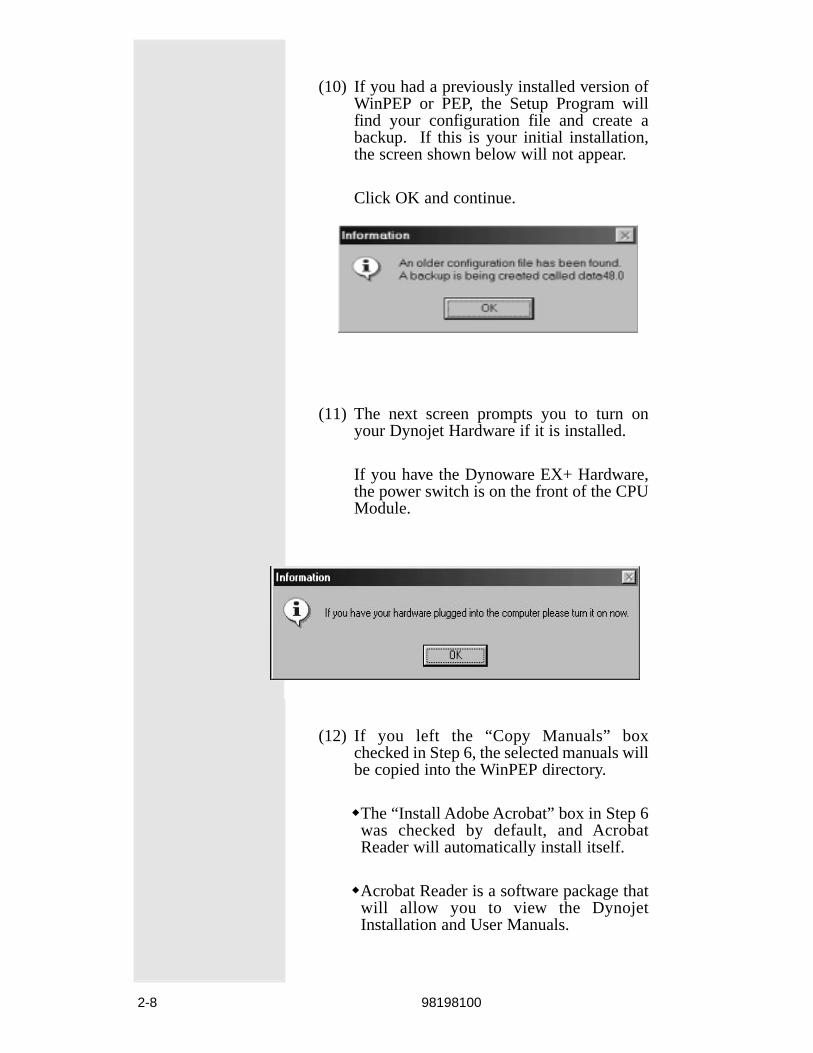
(10) If you had a previously installed version ofWinPEP or PEP, the Setup Program willfind your configuration file and create abackup. If this is your initial installation,the screen shown below will not appear.
Click OK and continue.
(11) The next screen prompts you to turn onyour Dynojet Hardware if it is installed.
If you have the Dynoware EX+ Hardware,the power switch is on the front of the CPUModule.
(12) If you left the “Copy Manuals” boxchecked in Step 6, the selected manuals willbe copied into the WinPEP directory.
!The “Install Adobe Acrobat” box in Step 6was checked by default, and AcrobatReader will automatically install itself.
!Acrobat Reader is a software package thatwill allow you to view the DynojetInstallation and User Manuals.

98198100 2-9
(13) Setup will add program icons to the“Program Folder” shown in the picturebelow. You may type a new folder name, orselect one from the “Existing Folders” list.
Click “Next” to continue.
(14) Click “Yes” if you would like a “WinPEP”icon placed on the Start Menu.

2-10 98198100
(15) Setup is now complete, leave the “Yes Iwant to view the help file now” boxchecked. This will allow a screen to pop upwith useful information that may help youfind answers to common questions.
Click the “Finish” button.

98198100 2-11
Notes:

Document #98198100 3 - 1
Chapter 3
Basic Concepts
The following chapter will introduce you to effective
and efficient use of WinPEP.
Windows Environment
For a complete understanding of Windows® 95
interface and environment, please refer to the
“Introducing Microsoft® Windows® 95” booklet
that came with Windows® 95 Software.
WinPEP Interface
WinPEP is designed to be user-friendly and
intuitive. Once you understand the basic layout,
it will be easy to obtain information efficiently.
Revision C 2/9/00
Run Browser Tree
Workspace
Work Group
Run Browser Tabs
Selection List
Graph View

3 - 2 Document #98198100
Workspace
The Workspace is WinPEP’s working desktop.
Work Group
The Work Group is the dialog that contains the
current runs being made or viewed. A work
group can contain from 1 to 12 runs.
The work group is broken into 4 quadrants (Tree,
Tabs, Selection List and Data View).
Run Browser Tree
Using the tree structure for viewing dyno runs
allows you to access your runs from a standard
Windows® tree format.
Run Browser Tabs
The Run Browser Tabs mirror the way the Run
Browser Tree moves, but resembles the same
functionality of the DOS Pep. This feature may
be easier to use than the Run Browser Tree for
former DOS users.
Selection List
The Selection List displays the currently selected
runs. The list will store up to 12 runs.
Data View
The Data View portion of the screen displays the
run data in graph format. While in the
“Preview Graphs” mode, the graph will only
preview the currently selected run that is active in
the Tree or the Tab. However, when you click the
“Graph View” icon, the graph will display all the
data from the graphs in the Selection List. {Refer
to Work Group Toolbar}

Document #98198100 3 - 3
Workspace Menu
File Menu
• New (Ctrl - N): Start a new Work Group formaking dyno runs.
• Open (Ctrl - O): Open a Work Group.• Save (Ctrl - S): Save current Work Group with
1 to 12 dyno runs.• Save As (Ctrl - S): Save current Work Group
to a different name.• Close (Ctrl - W): Close current Work Group.• Close All: Close all open Work Groups.• Print: Print current dyno Graph or Notes.• Print Setup: Edit properties of the printer.• Exit (Ctrl - Q): Exit WinPEP.
Dyno Menu• Dyno Parameters: Edit the parameters of
your dynamometer and the environment.• Graph / Race Colors: Edit the images in
WinPEP for the different functions using 12distinct colors.
• Make Run Option: Configure the options formaking a dyno run and viewing the samplingscreen.
• Make Run Graph Options: This options pageallows the user to configure the graphparameters for the graph that is generated aftermaking a run.
• Make Run: Prior to making a dyno run, entera name for the new run, a title for the run, andother applicable parameters.
Tools Menu• Group Tools: Group tools to copy or delete
the currently selected Work Group.

3 - 4 Document #98198100
• System Information: View the current systemresources. Shown Below.
• Other ToolsNew Root Directory: Set the drive and
directory as the root when looking for runs.Printer Parameters: Control the output of the
dyno graphs.Clear Clipboard: Clear any data that may be
on the clipboard in order to gain memory.Sort Runs: The user can change the order in
which the runs are displayed in the Browsersections tree and tab.
• Window MenuCascade (Shift - F5): Cascade a number of
Work Groups so that you can easily see thedifferent Groups on the Workspace.
Tile (Vertical): Tile Vertical aligns your WorkGroups vertically on the Workspace.
Tile (Horizontal): Tile Horizontal alignsWork Groups horizontally on the Workspace.
Arrange Icons: Arrange the Work Groups intoan organized manner at the base of theWorkspace when minimized.
Minimize All: Shrinks the Work Groups tomake more space when beginning anotherWork Group.
Work Space 1: View the current Work Groupsavailable on the Workspace. The currentWork Group will be check marked.
Document #98198100 3 - 5
Note: You may flip between Work Space 1,2,3,etc. by hitting the (Ctrl + Tab) keys.
Help Menu• Contents: Electronic help file for WinPEP• About WinPEP: Displays credits, version and
release date.
Workspace Toolbar
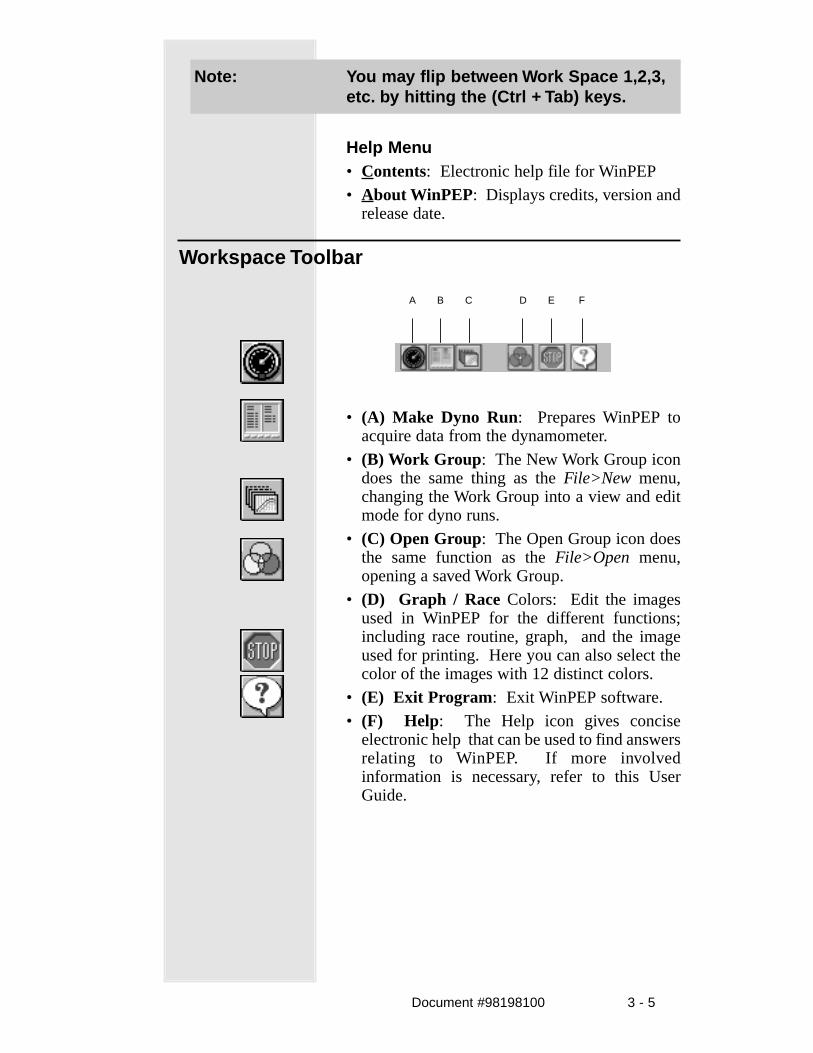
• (A) Make Dyno Run: Prepares WinPEP toacquire data from the dynamometer.
• (B) Work Group: The New Work Group icondoes the same thing as the File>New menu,changing the Work Group into a view and editmode for dyno runs.
• (C) Open Group: The Open Group icon doesthe same function as the File>Open menu,opening a saved Work Group.
• (D) Graph / Race Colors: Edit the imagesused in WinPEP for the different functions;including race routine, graph, and the imageused for printing. Here you can also select thecolor of the images with 12 distinct colors.
• (E) Exit Program: Exit WinPEP software.• (F) Help: The Help icon gives concise
electronic help that can be used to find answersrelating to WinPEP. If more involvedinformation is necessary, refer to this UserGuide.
A B C D E F
3 - 6 Document #98198100
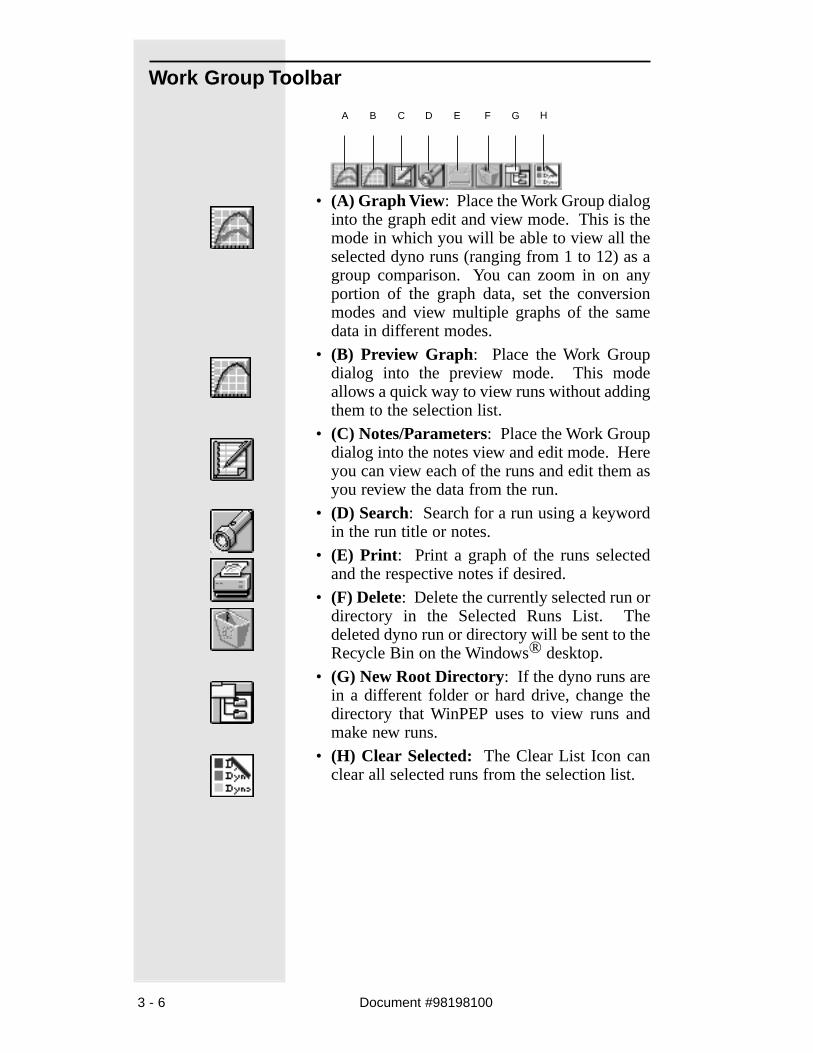
Work Group Toolbar
• (A) Graph View: Place the Work Group dialoginto the graph edit and view mode. This is themode in which you will be able to view all theselected dyno runs (ranging from 1 to 12) as agroup comparison. You can zoom in on anyportion of the graph data, set the conversionmodes and view multiple graphs of the samedata in different modes.
• (B) Preview Graph: Place the Work Groupdialog into the preview mode. This modeallows a quick way to view runs without addingthem to the selection list.
• (C) Notes/Parameters: Place the Work Groupdialog into the notes view and edit mode. Hereyou can view each of the runs and edit them asyou review the data from the run.
• (D) Search: Search for a run using a keywordin the run title or notes.
• (E) Print: Print a graph of the runs selectedand the respective notes if desired.
• (F) Delete: Delete the currently selected run ordirectory in the Selected Runs List. Thedeleted dyno run or directory will be sent to theRecycle Bin on the Windows® desktop.
• (G) New Root Directory: If the dyno runs arein a different folder or hard drive, change thedirectory that WinPEP uses to view runs andmake new runs.
• (H) Clear Selected: The Clear List Icon canclear all selected runs from the selection list.
A B C D E F G H

Document #98198100 3 - 7
Graph View Toolbar
• (A) Graph Options (Shown below):(1) Change what values are to be displayed on
the left and right Y axis, and what is to bedisplayed on the bottom X axis.
(2) Change from single to multiple graphs.(3) Select options : Display Negative Value,
Mazimize Graph Automatically and ForceScaling.
(4) Choose to: Display Maximum Values,Display Conditions, Display Titles or None.
• (B) Copy Graph to Clipboard: Copy thecurrently displayed graph to the clipboard inorder to move the data between applications.
• (C) Maximize Graph: The Maximize Graphicon will display the current graph in fullscreen mode.
• (D) Correction Factor: The Correction Factormenu changes the view of the graph usingeither SAE, DIN, EEC or STD (Standard)correction factors.
• (E) Smoothing: The Smoothing menu showsfive different levels of detail in a graph.Smoothing level one shows the most detailwhere smoothing level five shows the leastdetail (Note. Level three is the default setting).
A B C D E

3 - 8 Document #98198100
Notes:
Document #98139100 4 - 1
Chapter 4
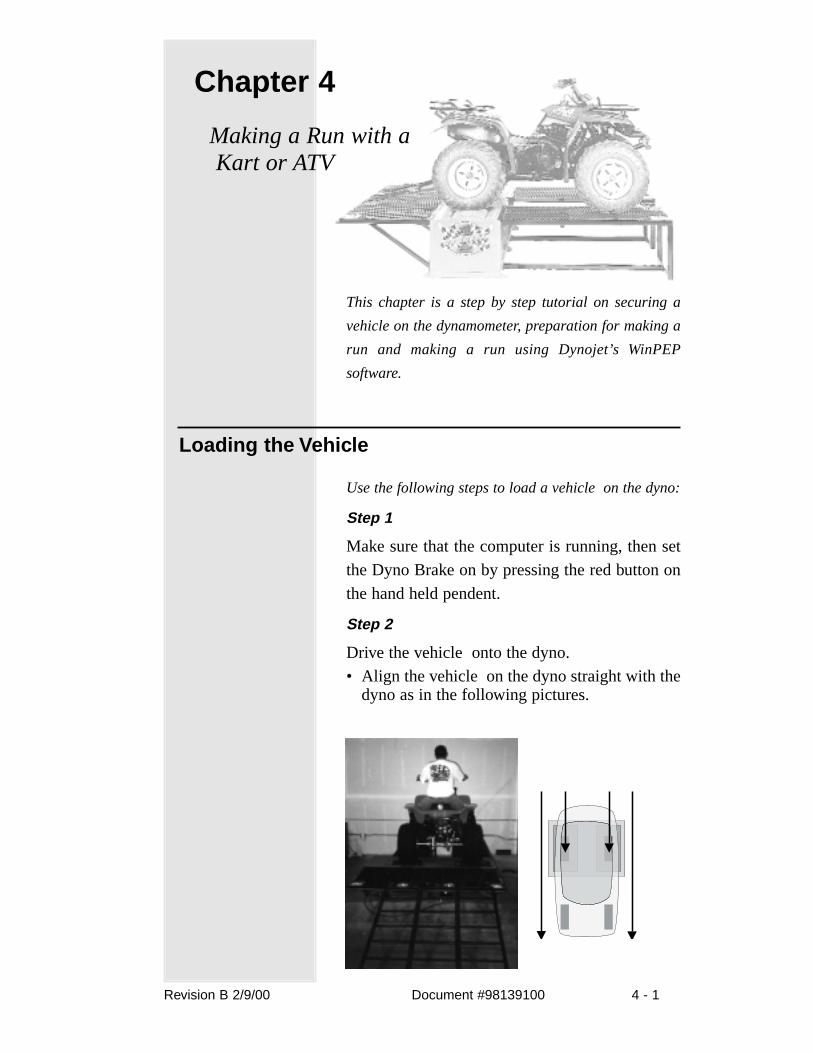
Making a Run with aKart or ATV
This chapter is a step by step tutorial on securing a
vehicle on the dynamometer, preparation for making a
run and making a run using Dynojet’s WinPEP
software.
Loading the Vehicle
Use the following steps to load a vehicle on the dyno:
Step 1
Make sure that the computer is running, then set
the Dyno Brake on by pressing the red button on
the hand held pendent.
Step 2
Drive the vehicle onto the dyno.• Align the vehicle on the dyno straight with the
dyno as in the following pictures.
Revision B 2/9/00

4 - 2 Document #98139100
• Stop the vehicle when the center of the driveaxle is centered on the drums.
Step 3
When the vehicle is positioned properly on the
dyno, shut the engine off. If the vehicle has an
automatic transmission, set the park brake. If the
vehicle is manual transmission, place it in gear.
Step 4
Attach the tie-down straps.• Attach two tie-down straps from secure anchor
points to the rear of the vehicle . The tie-downstraps connect directly behind the vehicle.
Document #98139100 4 - 3
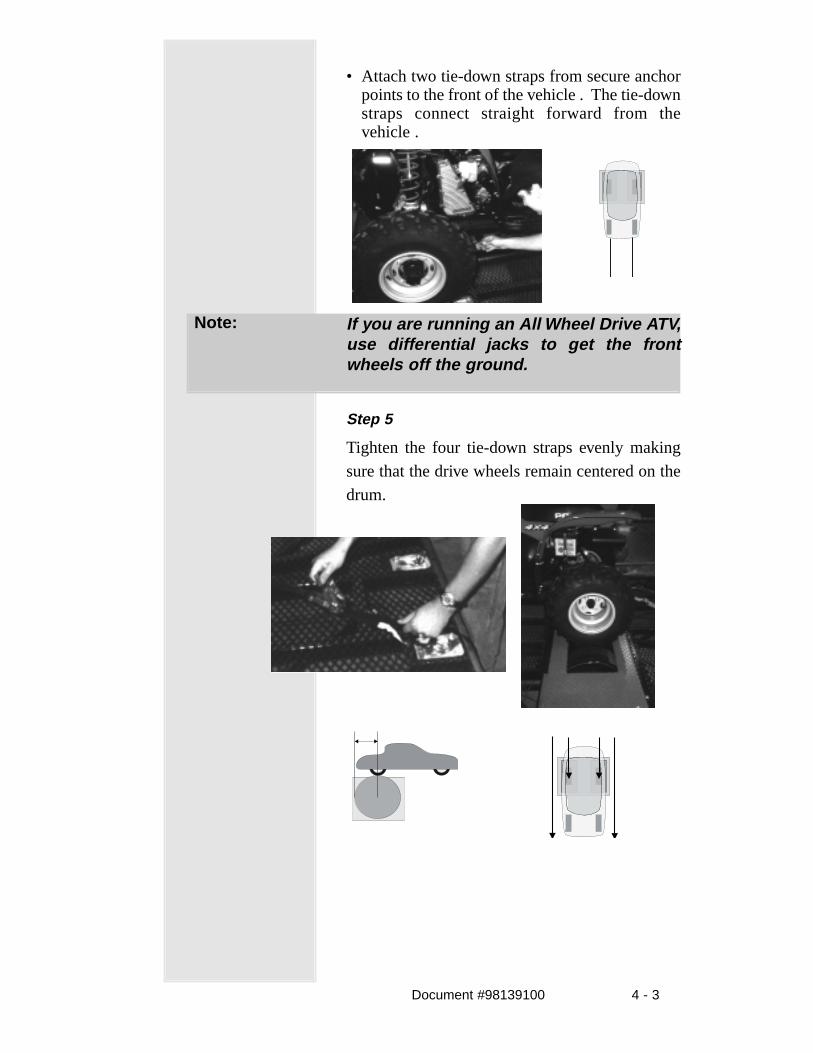
• Attach two tie-down straps from secure anchorpoints to the front of the vehicle . The tie-downstraps connect straight forward from thevehicle .
Note: If you are running an All Wheel Drive ATV,use differential jacks to get the frontwheels off the ground.
Step 5
Tighten the four tie-down straps evenly making
sure that the drive wheels remain centered on the
drum.

4 - 4 Document #98139100
RPM Pickup
Your Dynojet Dynamometer includes a primary
wire inductive pickup and two secondary wire
inductive pickups. These small “clothespin like”
inductive pickups are used to sense RPM. An
RPM pickup is required if you want to view
Torque graphs. Generally you will use one
secondary wire inductive pickup on a spark plug
wire. Vehicles with wasted spark ignition
systems may require two secondary inductive
pickups. The primary wire inductive pickup
senses RPM pulses from the coil. Although this
pickup location generally works better, it is
harder to find the correct location to connect the
RPM pickup.
Caution!! Inductive pickups are very fragile. Theferrite core can easily be damaged and isnot covered under warranty. Dropping,snapping, vibration and heat can alldamage the ferrite core.
The DynoWare EX+ RPM module contains the
electronics that sense the RPM pulses. An auto-
gain circuit looks at only the peak voltage of the
vehicle’s spark, ignoring the lower voltages to
help reduce electronic noise problems. Wasted
spark ignition systems will produce a lower
voltage level on the exhaust stroke than the
compression stroke. By definition of the auto-
gain circuit, lower voltage spark levels will be
ignored, missing every other spark the vehicle
would produce.

Document #98139100 4 - 5
Dynojet provides two secondary inductive pick-
ups with your dyno. Both pickups may be needed
on wasted spark ignition system vehicles. Each
pickup plugs into the RPM module. If using a
single fire ignition system (the most common)
only one pickup is used and plugged into the
RPM module.
RPM Pickup Guide
Descriptions of RPM pickups.• Secondaries (Non-wasted spark system)
Use one secondary pickup. Unplug the otherpickup from the RPM module and set thedegrees between plug fires to 720° in WinPEP.
• Secondaries (Wasted spark ignition system)Use two secondary pickups. Attach one pickupon each sparkplug wire on the same coil and setthe degrees between plug fires to 360° inWinPEP.
• Primary pickupAttach the primary wire pickup to the primaryside of the coil. Set the degrees between plugfires by taking 720 (4 cycle engines) or 360 (2cycle engines) divided by the number ofcylinders multiplied by the number of coils.
For example:The number of degrees between plug fires on afour cylinder four cycle engine with dual coils(where each coil fires two cylinders) is:
720 / 4 x 2 = 360°
4 - 6 Document #98139100
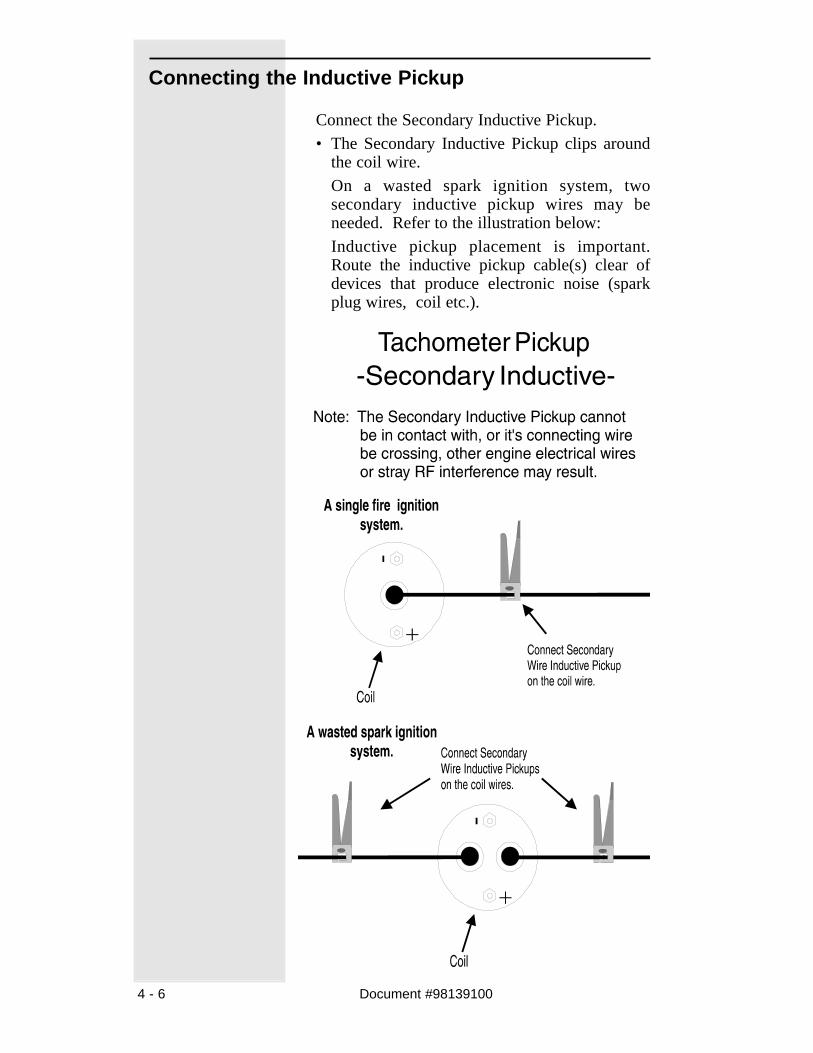
Connecting the Inductive Pickup
Connect the Secondary Inductive Pickup.• The Secondary Inductive Pickup clips around
the coil wire.On a wasted spark ignition system, twosecondary inductive pickup wires may beneeded. Refer to the illustration below:Inductive pickup placement is important.Route the inductive pickup cable(s) clear ofdevices that produce electronic noise (sparkplug wires, coil etc.).
Document #98139100 4 - 7
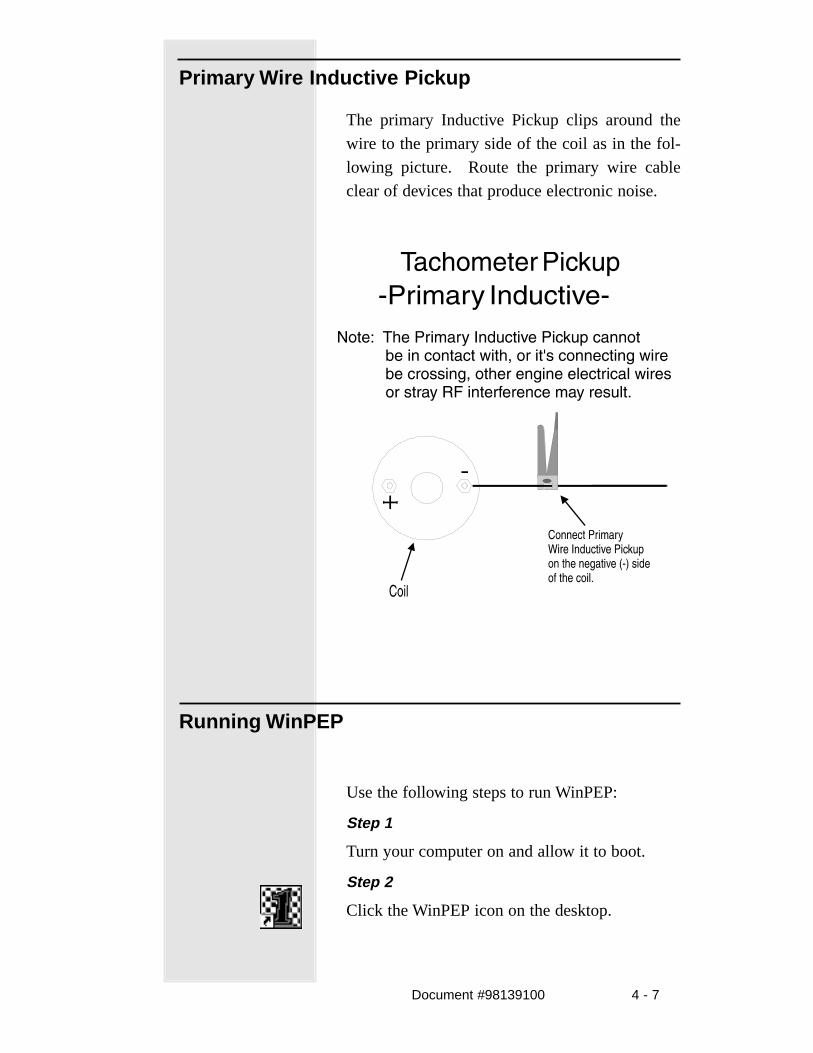
Primary Wire Inductive Pickup
The primary Inductive Pickup clips around the
wire to the primary side of the coil as in the fol-
lowing picture. Route the primary wire cable
clear of devices that produce electronic noise.
Running WinPEP
Use the following steps to run WinPEP:
Step 1
Turn your computer on and allow it to boot.
Step 2
Click the WinPEP icon on the desktop.

4 - 8 Document #98139100
Step 3
Click on the “Make Run” icon in the work space
toolbar.
If the following Error Message is displayed the
user will need to select a different Com port
(DynoWare EX+) or a different Address (PC
Card).
The Dyno Parameters page will automatically
load to facilitate this.
After correcting the problem click on the make
run Icon again to enter the make run screen.

Document #98139100 4 - 9
Selecting a Name
Use the following steps to make a run. This
example will use a Honda 400 EX owned by
Dynojet.
Step 1
Select the Make.• Using the mouse click on Honda in the tree
structure to the left.
Step 2
Select the Model.• Press the <INSERT> key on the keyboard or
click on the “New Model” button to insert anew model.
• Type the name of your vehicle in from thekeyboard. You can use small or capital letters.

4 - 10 Document #98139100
Example: 400 EX• Click <OK>
The screen should look like the following:
• Type in the name of the owner. You can usesmall or capital letters.
Example: Dynojet• Click <OK>
The screen should look like the picture below.

Document #98139100 4 - 11
Editing the Notes and Parameters
Now you need to fill in the data necessary for
making a dyno run.
Next Run Name
Enter the name of the run. It must be 1 to 8
characters without spaces. This name will appear
on the graph when it prints.
Example: Dynojet
Run Title
Enter the description of the run in the Run Title.
Example: 98 Honda 400 EX,
All Stock
Plug Fires
Enter the number of degrees (one engine
revolution = 360 degrees) the crankshaft turns
between plug firings (for secondary inductive
hookups).

4 - 12 Document #98139100
Note: When using the Secondary Inductivehookup method, enter 720 for the numberof Plug Fires. The Secondary Inductivemethod receives one electrical pulse forevery 2 engine revolutions.
When using the Primary Inductive hookupmethod, divide 720 (two enginerevolutions) by the number of enginecylinders times the number of coils.
• Enter 720 for the plug fires.
Redline
Enter the Tachometer Redline from your vehicle’s
tachometer or it’s owner manual.
Example: 7,500 RPM = 7.5
This places a redline on the tachometer on the
computer screen during a run. If you exceed this
redline during your run, the tachometer needle on
the computer screen will change colors.
Document #98139100 4 - 13
Tire Speed
Enter the Speed Rating of the drive tires of the
vehicle in m.p.h..
Tire Speed
Enter the Speed Rating of the rear tire for the
KART or ATV in m.p.h., referring to the list
below:
Non-Rated 93 m.p.h.
S 112 m.p.h.
H 130 m.p.h.
V 150 m.p.h.
Z 150 m.p.h. and higher
Note: If you exceed this speed, the computerwill stop the run.
Absolute Pressure, Room Air Temperature and
Relative Humidity are automatically determined
by DynoWare’s Atmospheric module and cannot
be changed.
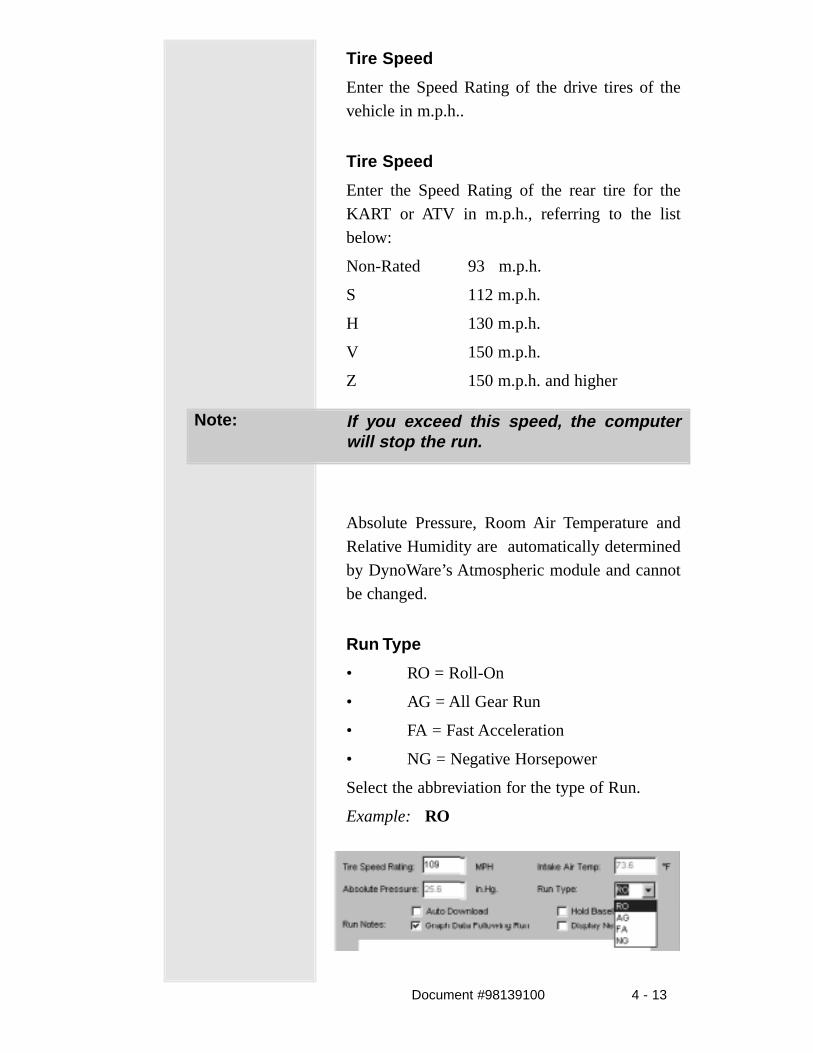
Run Type
• RO = Roll-On
• AG = All Gear Run
• FA = Fast Acceleration
• NG = Negative Horsepower
Select the abbreviation for the type of Run.
Example: RO
4 - 14 Document #98139100
Notes:
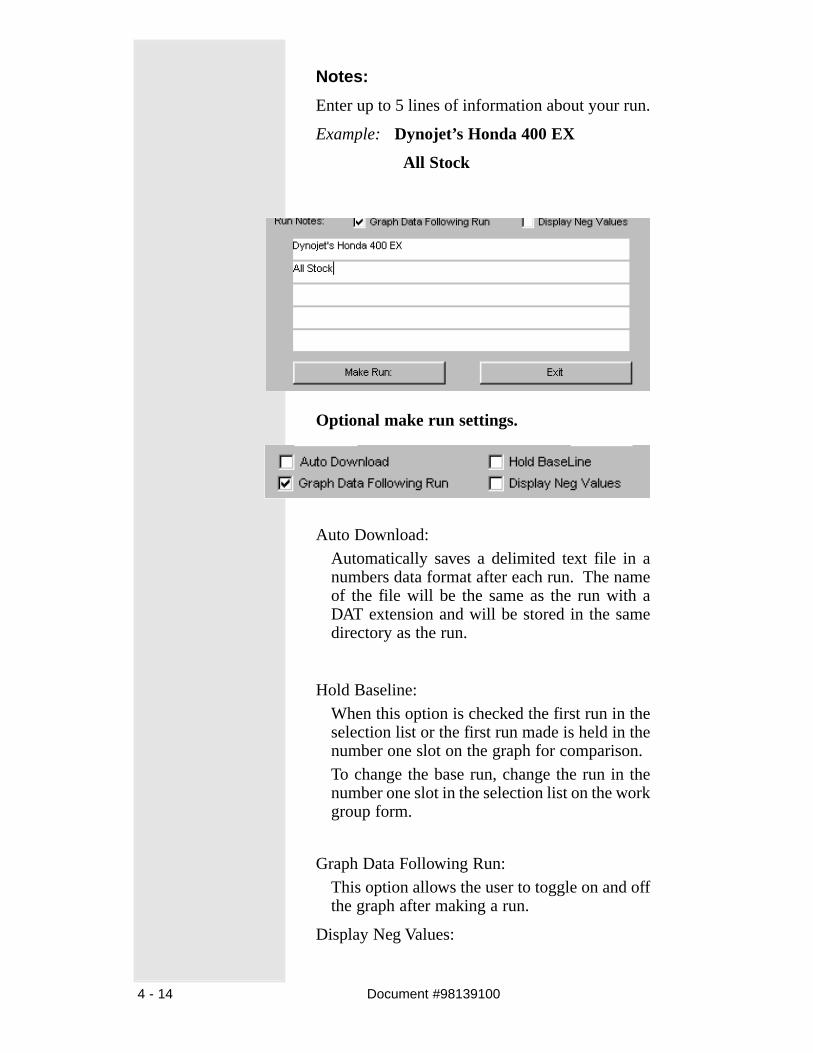
Enter up to 5 lines of information about your run.
Example: Dynojet’s Honda 400 EX
All Stock
Optional make run settings.
Auto Download:Automatically saves a delimited text file in anumbers data format after each run. The nameof the file will be the same as the run with aDAT extension and will be stored in the samedirectory as the run.
Hold Baseline:When this option is checked the first run in theselection list or the first run made is held in thenumber one slot on the graph for comparison.To change the base run, change the run in thenumber one slot in the selection list on the workgroup form.
Graph Data Following Run:This option allows the user to toggle on and offthe graph after making a run.
Display Neg Values:

Document #98139100 4 - 15
The user can elect to view negative values onthe graph after making a run.
Press the “Make Run” button to start the run.
4 - 16 Document #98139100
Make a Pre-run Inspection
Perform a vehicle inspection before making a run.
Check the following:
Before Starting the Engine• Connect an exhaust hose or hoses (if dual
exhaust) on the vehicle, make sure the hose fitsover the tail pipe, is not plugged or kinked andthe hose is vented correctly out of the DynoRoom.
Perform the following safety checks:• Check the radiator coolant (if applicable) and
oil levels.• Check the tire pressure and tire speed rating.
Improperly inflated tires or exceeding themaximum speed rating can result in prematurewear or severe tire damage.
• Check the tie-down straps to make sure thatthey are tight and secured.
• Visually inspect the vehicle. Make sure it is insafe running order.
• Make sure safety glasses and ear protection isused when the dyno is being operated.
• Keep all rotating components clear at all times.• Only the operator should be near the dyno or
the vehicle during the test.• Never allow any person(s) to stand behind the
dyno or vehicle when it is being operated.• Check the drive tires to be sure that they are
aligned correctly on the Dynamometer’sdrums.
• Perform any other safety inspectionsappropriate to running the vehicle on the Dyno.
Engine Warm Up
Warm the vehicle’s engine and drivetrain before
beginning testing. Consistent engine tempera-
tures will assure your runs are repeatable.

Document #98139100 4 - 17
After Warming Engine
Always leave the vehicle in neutral (automatic
transmission) or in first gear (manual transmis-
sion), with the engine off, the park brake and the
Dyno brake on when you get off the vehicle on
the dyno.• Fix any fuel, oil or coolant leaks that may have
shown up after engine warm up and check thecarburetor for leaks.
• Any loud or unusual engine noises or excessiveexhaust smoke should be resolved beforecontinuing.
Make a Test Run
Step 1
Accelerate the vehicle.• Make sure that the vehicle is secured properly.• Place the vehicle in a low gear and release the
Dyno Brake using the Hand Held Pendent(shown below). Slowly accelerate the vehicleto about 20 m.p.h..
Step 2
Test the tachometer.• If the tachometer is moving but not registering
the correct RPM values, the number entered for“Plug Fires” may be incorrect. Stop thevehicle, return to the “Make Run” dialog byhitting the <ESCAPE> key and enter thecorrect value for the plug fires.
4 - 18 Document #98139100
Step 3
Stop the vehicle.• Take the vehicle out of gear (manual
transmission only).• Press brake button to stop the dyno drums.• Shut the engine off. Put the vehicle in gear
(manual transmission) or neutral (automatictransmission). Set the vehicle’s parking brake.Leave the dyno brake on.
Warning!! DO NOT use the vehicle’s own brakes toslow the dyno drums! Using only thevehicle’s brake to stop the drums willseverely over stress the vehicle’s brakeparts. The use of the vehicles brakesshould be for “Emergency Stop Situa-tions“ only.
Step 4
Perform a final inspection.• Make any adjustments to the straps that may be
needed. Verify the drive tires’ alignment on thedyno drums.
• Perform any other safety checks that you deemappropriate to your particular situation.
• You should now be ready to perform a highspeed run on the dyno.

Document #98139100 4 - 19
Making a Run
Using the following steps to make a run.
Step 1
Release the dyno brake.• For a vehicle with a standard transmission, put
the vehicle in 1st gear and start the drumrolling. Shift up to 4th gear and accelerate tothe desired starting RPM. A good startingRPM is when your engine is running at thelowest RPM where there is no hesitation whenyou floor the accelerator.
• For a vehicle with automatic transmission, startthe drums rolling and accelerate to around 10MPH.
Step 2
Push the sample button on the Hand Held Pendent
(shown below) or the <Enter> key on the
computer keyboard to begin sampling.
Step 3
Floor the throttle all the way and accelerate to
redline.
Step 4
Finish the run:• Let off the throttle and press the sample button.

4 - 20 Document #98139100
• Take the vehicle out of gear and press the dynobrake button.
Step 5
Press the <Enter> key on the computer keyboard
or the sample button to continue.
Step 6
Press the <N> key to return to the “Make Run”
dialog.
Congratulations! You have just made your first run.
Document #98198100 5 - 1
Chapter 5
Viewing Graphs
WinPEP corrects for altitude and atmospheric
conditions and automatically adjusts power curves for
different weather conditions producing consistent
power graphs. This unique feature is just another
example of our common sense approach to precision
and diagnostics.
Viewing a Fourth Gear Roll-on
The run used in this chapter may not be in the demo
runs that came with your dyno, so just select a make,
model and run that interests you)
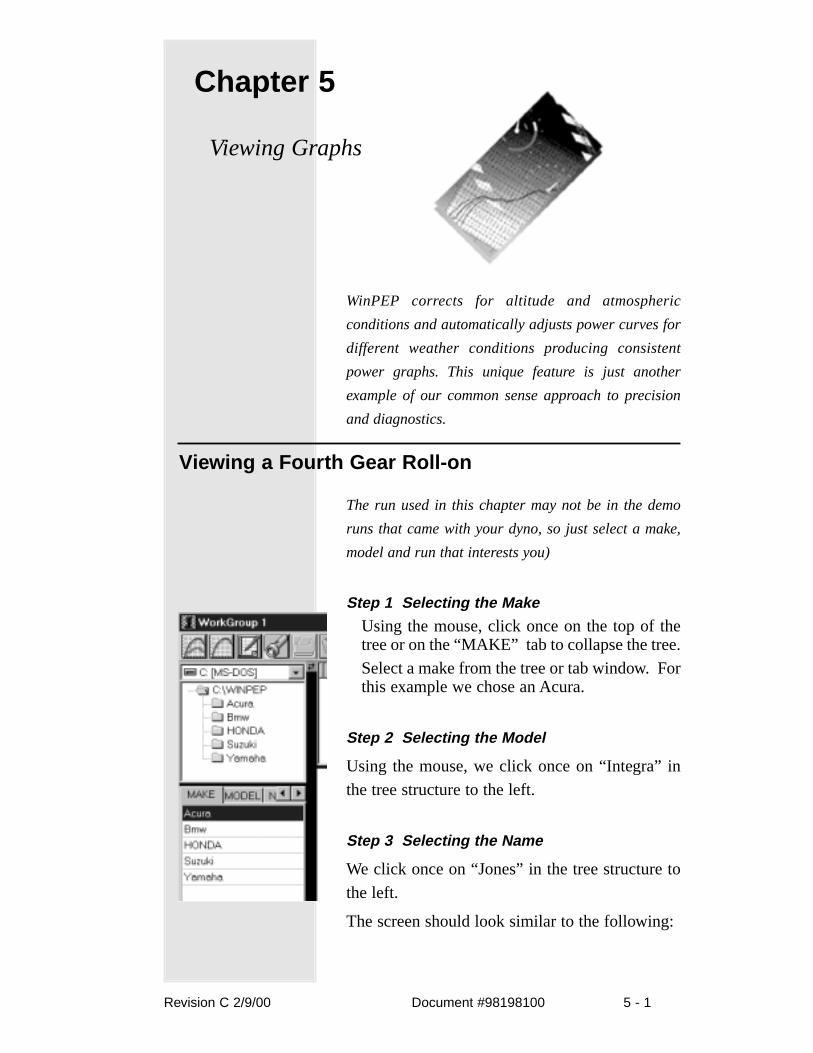
Step 1 Selecting the Make
Using the mouse, click once on the top of thetree or on the “MAKE” tab to collapse the tree.Select a make from the tree or tab window. Forthis example we chose an Acura.
Step 2 Selecting the Model
Using the mouse, we click once on “Integra” in
the tree structure to the left.
Step 3 Selecting the Name
We click once on “Jones” in the tree structure to
the left.
The screen should look similar to the following:
Revision C 2/9/00

5 - 2 Document #98198100
Step 4
We click on Jones.001 and it is graphed in the
preview runs Graph to the right of the tab
window.
Step 5 Adding Run to the Selection List
By double clicking on JONES.001 in the tree
structure to the left the run is added to the
selection list. Refer to the image on the next
page.

Document #98198100 5 - 3
Step 6 Graphing the Selected Run
Click on the “Graph View” icon in the workspace
toolbar or click the mouse over the graph to graph
the selected run(s).
Graph Features
Smoothing
The “Smoothing” slider controls the level of
detail of the graph. Smoothing level one shows
the most detail where smoothing level five shows
the least detail (Level three is default).

5 - 4 Document #98198100
Correction Factor
Graphs can be viewed using either SAE, DIN,
EEC or STD (Standard) correction factors. To
change the correction factor click on the “Correc-
tion Factor” pulldown and select the desired
option.
Zooming In
Step 1
Left mouse click on the graph area, hold the
mouse button down, and move the mouse down
and to the right.
The screen should look similar to the image
shown below.

Document #98198100 5 - 5
Step 2
Release the mouse button and the graph will
magnify the selected area.
Unzooming
With the mouse cursor over the graph, click the
right mouse button.
Select Undo Zoom.
Copy graph to clipboard
With the mouse, click once on the “Copy Graph
to Clipboard” icon. Once copied to the clipboard,
the graph can be imported (pasted) into other
applications.
To clear the graph from the Clipboard, go to the
Tools / Other Tools menu and click once on the
“Clear Clipboard” menu option.
5 - 6 Document #98198100
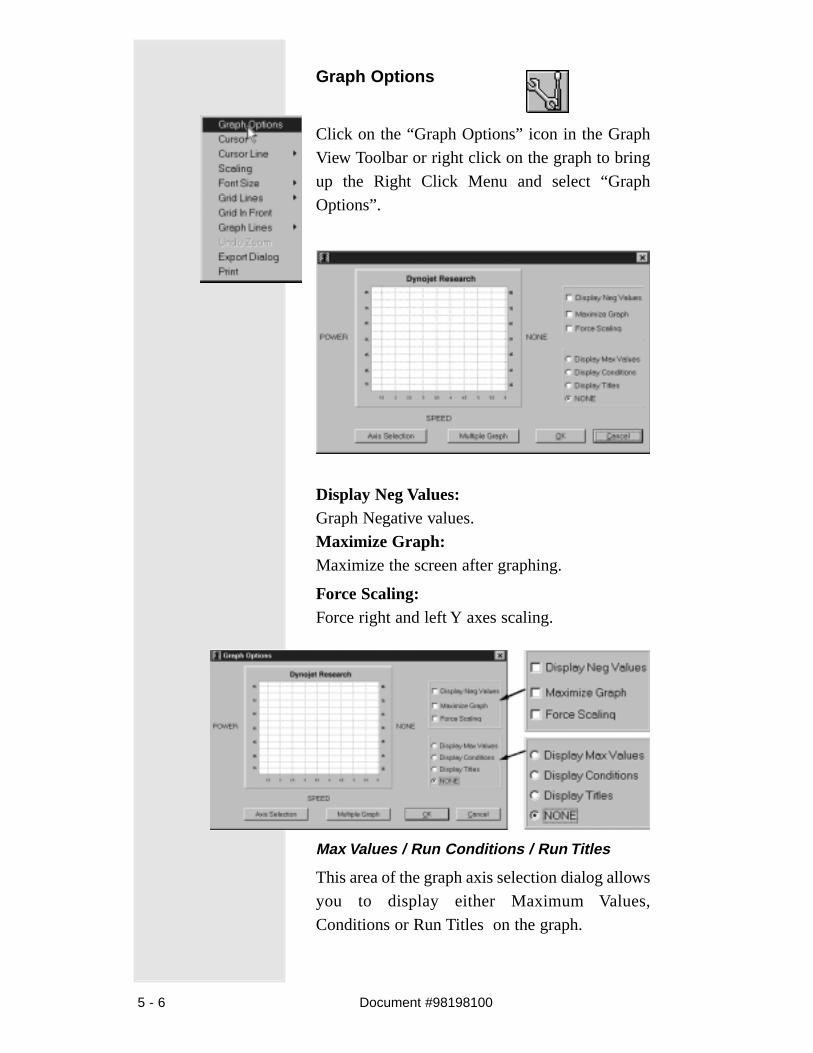
Graph Options
Click on the “Graph Options” icon in the Graph
View Toolbar or right click on the graph to bring
up the Right Click Menu and select “Graph
Options”.
Display Neg Values:Graph Negative values.Maximize Graph:Maximize the screen after graphing.
Force Scaling:Force right and left Y axes scaling.
Max Values / Run Conditions / Run Titles
This area of the graph axis selection dialog allows
you to display either Maximum Values,
Conditions or Run Titles on the graph.

Document #98198100 5 - 7
Axis Selection
Step 1
Using the mouse click once on “Axis Selection.”
Step 2
Click on Power in the displayed option box.
Note: Available selection may differ dependingon dyno model and configuration.
5 - 8 Document #98198100
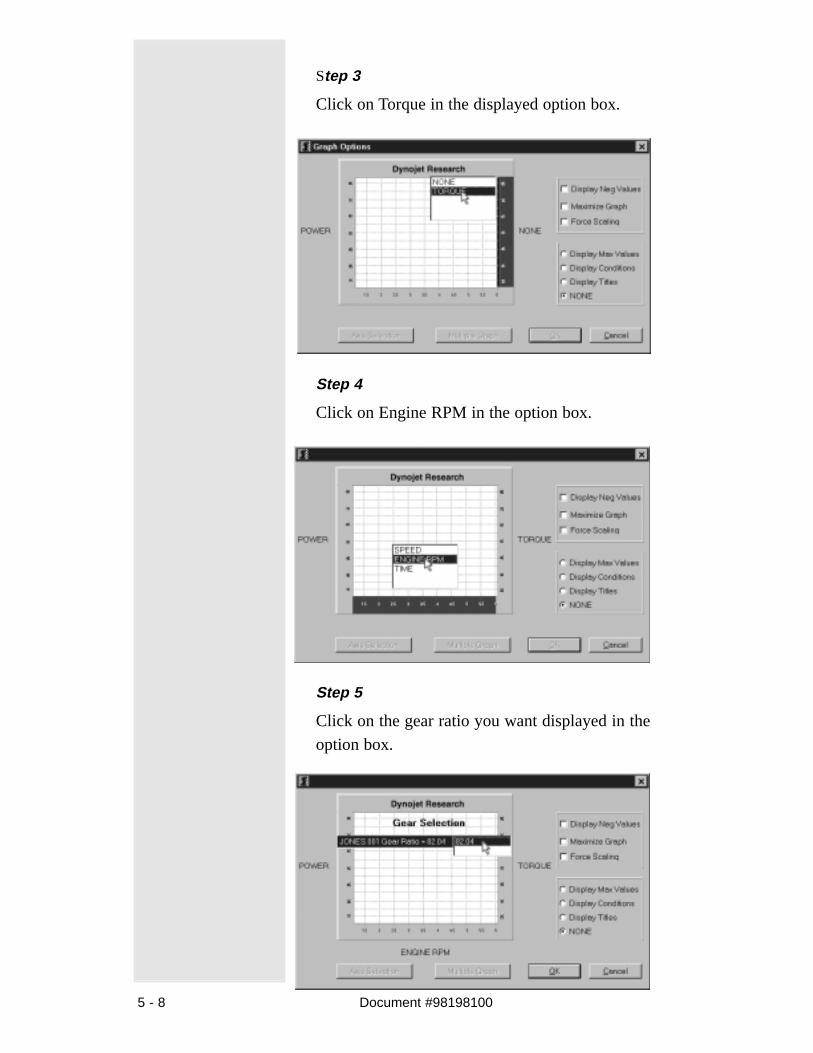
Step 3
Click on Torque in the displayed option box.
Step 4
Click on Engine RPM in the option box.
Step 5
Click on the gear ratio you want displayed in the
option box.
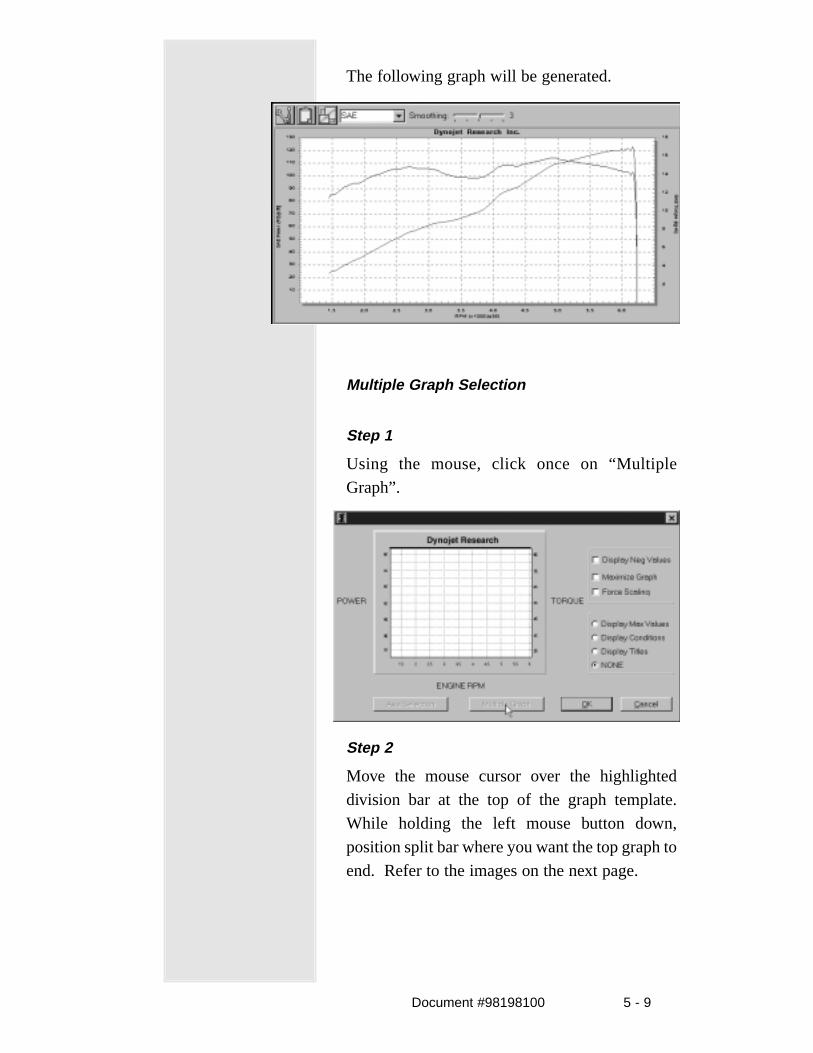
Document #98198100 5 - 9
The following graph will be generated.
Multiple Graph Selection
Step 1
Using the mouse, click once on “Multiple
Graph”.
Step 2
Move the mouse cursor over the highlighted
division bar at the top of the graph template.
While holding the left mouse button down,
position split bar where you want the top graph to
end. Refer to the images on the next page.

5 - 10 Document #98198100
Step 4
Click <OK>.
Step 5
Click on POWER in the displayed option box.
Step 6
Click on TORQUE in the displayed option box.
Document #98198100 5 - 11
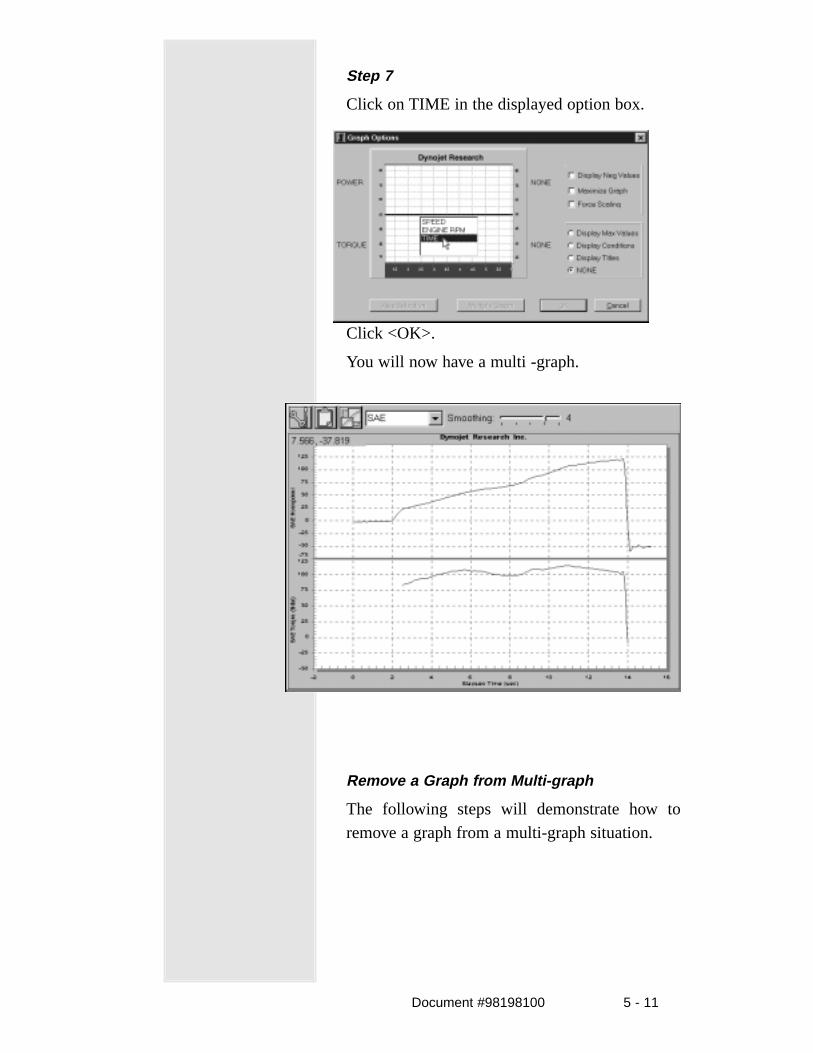
Step 7
Click on TIME in the displayed option box.
Click <OK>.
You will now have a multi -graph.
Remove a Graph from Multi-graph
The following steps will demonstrate how to
remove a graph from a multi-graph situation.

5 - 12 Document #98198100
Step 1
Go back to the Graph Options Dialogue.
Step 2
Click on “Multiple Graph” and position the
cursor over the line that you want removed.
Step 3
Double click the right mouse button to remove
the line.
Document #98198100 5 - 13
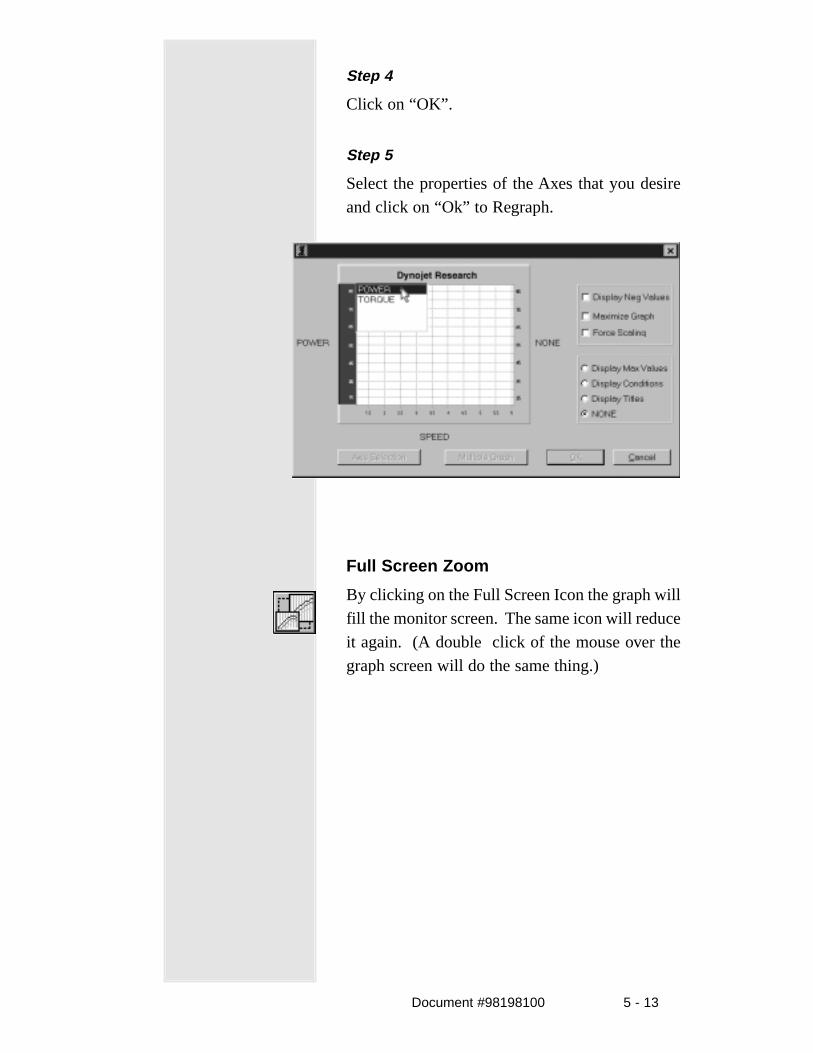
Step 4
Click on “OK”.
Step 5
Select the properties of the Axes that you desire
and click on “Ok” to Regraph.
Full Screen Zoom
By clicking on the Full Screen Icon the graph will
fill the monitor screen. The same icon will reduce
it again. (A double click of the mouse over the
graph screen will do the same thing.)

5 - 14 Document #98198100
Right Mouse Button Menu
By placing the mouse cursor over the graph and
clicking the right mouse button, the menu shown
below will be generated.
Graph Options
The Graph Options dialogue box (shown below)
can be accessed through this option.

Document #98198100 5 - 15
Right Mouse Button Menu continued...
Cursor
This option toggles the graph cursor on and off.
(Refer to the next page for more information on
the graph cursor.)
Cursor Line
This option allows the user to change the
thickness of the cursor to improve visibility.

5 - 16 Document #98198100
Right Mouse Button Menu continued...
If the user clicks on the graph when the cursor is
toggled on then a vertical line will be drawn on
the graph at that spot and values will be displayed
on the graph where the line intersects the graphed
run(s).
The up and down arrow keys move the cursor in
large even steps. The left and right arrow keys
move the cursor in small even steps. Hold down
the CTRL key for even smaller stems while using
the arrow keys.
HP = 481.3
X axis cursor value
Document #98198100 5 - 17
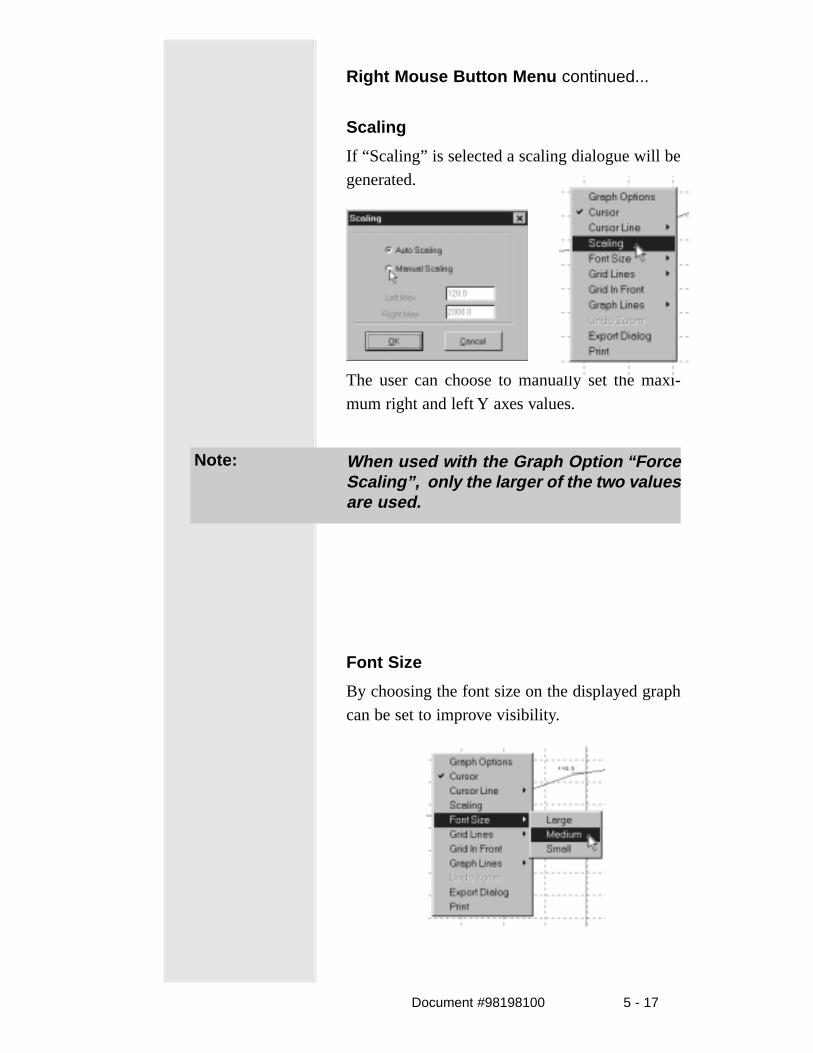
Right Mouse Button Menu continued...
Scaling
If “Scaling” is selected a scaling dialogue will be
generated.
The user can choose to manually set the maxi-
mum right and left Y axes values.
Note: When used with the Graph Option “ForceScaling”, only the larger of the two valuesare used.
Font Size
By choosing the font size on the displayed graph
can be set to improve visibility.
5 - 18 Document #98198100
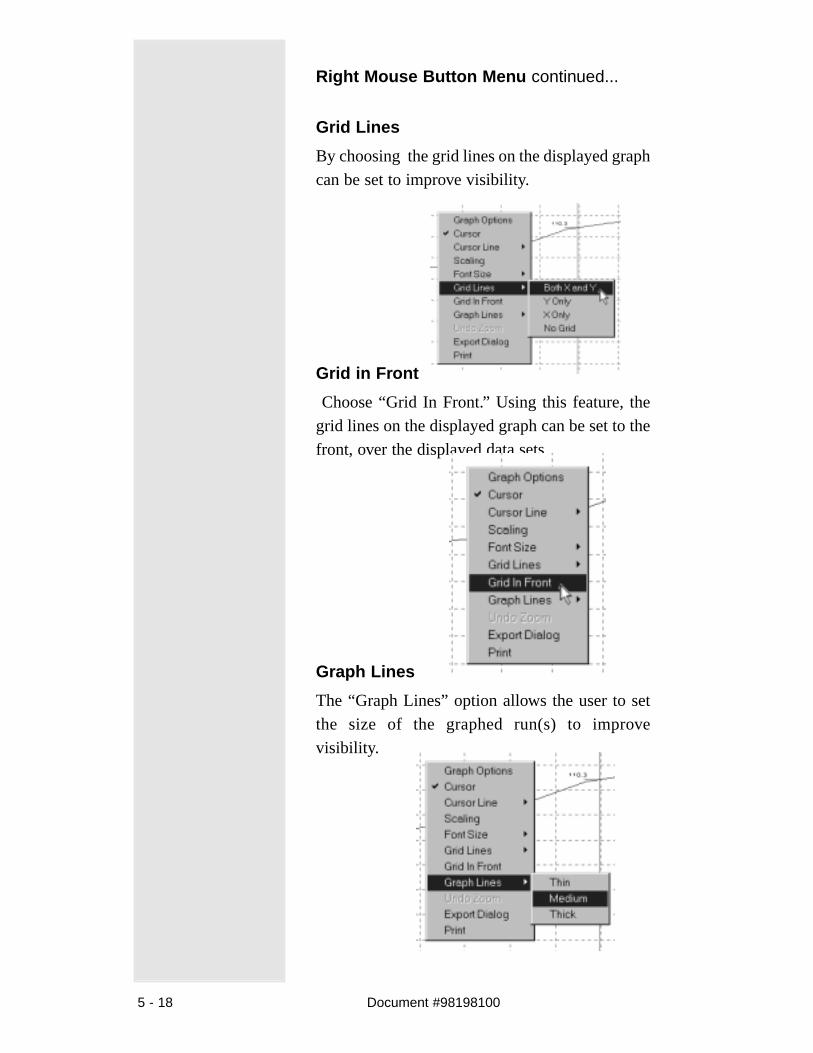
Right Mouse Button Menu continued...
Grid Lines
By choosing the grid lines on the displayed graph
can be set to improve visibility.
Grid in Front
Choose “Grid In Front.” Using this feature, the
grid lines on the displayed graph can be set to the
front, over the displayed data sets.
Graph Lines
The “Graph Lines” option allows the user to set
the size of the graphed run(s) to improve
visibility.

Document #98198100 5 - 19
Right Mouse Button Menu continued...
Export Dialog
With the right mouse button, click on the
displayed graph. By choosing the export dialog
feature, the data points can be exported.
The export dialog allows the user to export to a
Windows Metafile or a Windows Bitmap
After selecting either Metafile or Bitmap and
clicking on the “OK” button the appropriate
dialogue will load with the proper extension and
allow you to select a name for the file and the
directory where you want the file to be saved.

5 - 20 Document #98198100
Printing a Graph
Step 1
Click on the “Print” icon in the workspace toolbar
or use the Right Click Graph Menu and Select
“Print”
Step 2
Using the mouse click once on “Print.”
Step 3
Using the mouse, click once on “Ok” .
This will send the current graph to the default
printer. To cancel the print, click once with the
mouse on “Cancel.” Either operation will return
you to the WinPEP program.
Note: For quick black and white prints, click onthe graph and press the “S” key. Thegraph should change from color to blackand white. Press the “P” key to send it toyour printer.

Document #98198100 5 - 21
Print Preview
Step 1
Click on the “Print” icon in the workspace toolbar
or use the Right Click Graph Menu and Select
“Print”
Notes: The Print Dialogue has several uniqueoptions.(1) The user can print/preview the graphalone. (Default)(2) The user can print/preview the graphand notes on the same page. (Limited to 3runs)(3) The user can force the notes to sepa-rate pages.(4) The user can toggle on and off thegraphic placed at the top of the graphpage.
5 - 22 Document #98198100
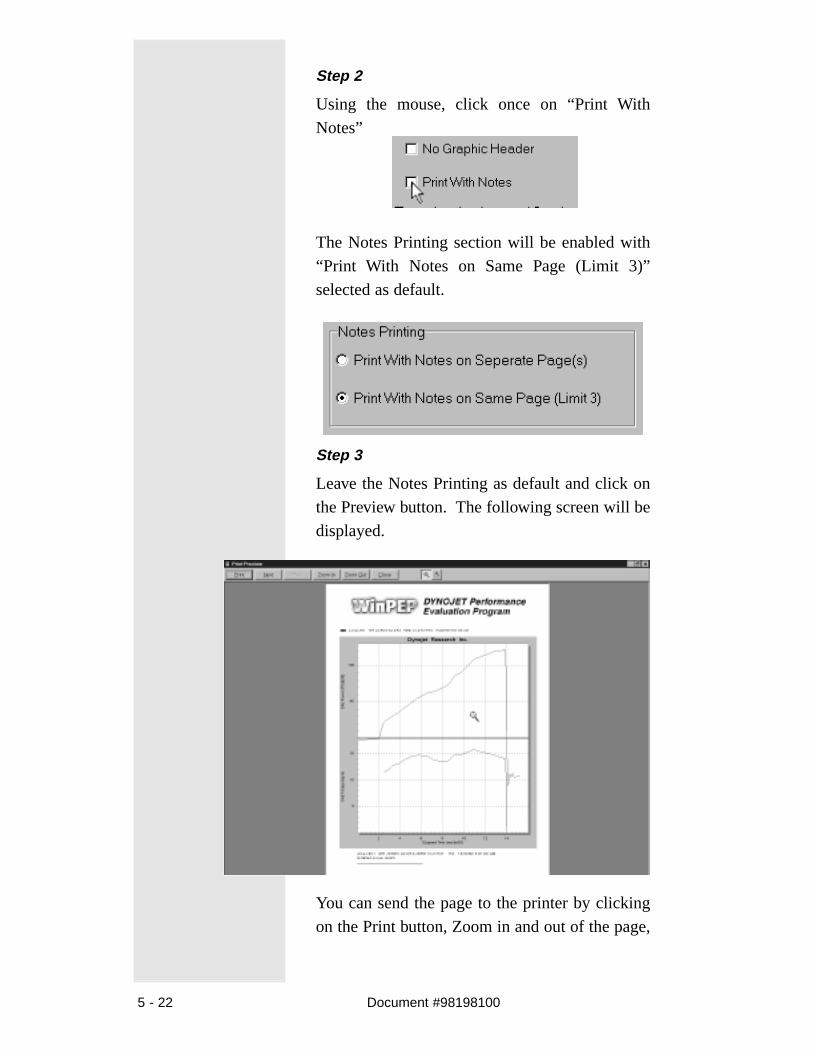
Step 2
Using the mouse, click once on “Print With
Notes”
The Notes Printing section will be enabled with
“Print With Notes on Same Page (Limit 3)”
selected as default.
Step 3
Leave the Notes Printing as default and click on
the Preview button. The following screen will be
displayed.
You can send the page to the printer by clicking
on the Print button, Zoom in and out of the page,

Document #98198100 5 - 23
pan the image when zoomed or cancel the
preview by clicking on Close button or the X
button in the top right corner. When the user
finishes with the preview screen they will be
returned to the print options dialogue.
Changing Graphic Header
Step 1
Using the mouse, click once on “Page Graphic.”
Step 2
Using the mouse, click once on “Load Bitmap.”

5 - 24 Document #98198100
Step 3
After selection of bitmap file, click once on the
Open button.
Step 4
Adjust the printed image size.
Step 5
After sizing the bitmap file, click on the Update
Bitmap button.

Document #98198100 5 - 25
Step 6
After updating the bitmap, click once on “Place
Graphic.”
Step 7
With the left mouse button held down, position
the graphic on the page where it will appear on
printed page.
Note: This may take a few tries to get the map toappear right in the preview screen. It maybe necessary to place the graphic a bit offto the left of the page to get it to center inthe preview screen.

5 - 26 Document #98198100
Step 8
With the mouse, click once on “Print Graph” and
then the Preview button to check it’s placement.
All previews and graphs sent to the printer will
now have the new graphic.

Document #98198100 5 - 27
Print Options
Font Selection
With the mouse, click once on “Font.”
The following selection dialog will be displayed.
This dialog allows you to change the default font
properties of the run titles above the graph. Font
sizes over 16 are not recommended.

5 - 28 Document #98198100
Setting Margins for graph output
This area of the print dialog allows you to change
the default margin of the entire graph.
Page Orientation
This area of the print dialog allows you to change
the page orientation for the entire graph.
The illustration below demonstrates Portrait and
Landscape graph output.
No Graphic on Output
This area of the print dialog enables/disables
graphic above the graph.

Document #98198100 5 - 29
Text printed at top of graph
This area of the print dialog allows you to change
the text that is displayed at the top of the printed
graph.

5 - 30 Document #98198100
Notes:

Document #98198100 6 - 1
Chapter 6
Racing Vehicles
The Race Routine is a unique feature in WinPEP that
places the Work Group area into race mode. The
mode races the currently selected runs against each
other for performance comparisons.
This chapter will be sent out with the softwareupdate that enables the Race Routine in WinPEP.
Revision C 2/9/00

6 - 2 Document #98198100
Notes.

Document #98198100 7 - 1
Chapter 7
Notes / Search Features
This chapter will introduce you to the different features
of the Notes capabilities and search function.
Viewing / Editing Notes
Step 1
Click on the “Notes/Parameters” icon in the Work
Group toolbar.
Step 2
Click once on the dyno run file that contains the
notes you wish to view.
Revision C 2/9/00

7 - 2 Document #98198100
Step 3
Using the mouse, click once on the title field.
This will allow the current run title to be edited.
Once the cursor is blinking on the title field, you
may type in any corrections, additions, or
changes.
Step 4
Use the mouse to bring down the run type field.
This will allow you to choose a different run type.

Document #98198100 7 - 3
Step 5
Using the mouse, click once on the notes field to
alter any note corrections and additions.
Step 6
Finally, click once on “Save Changes.” This
writes your changes to the run file.
Search
Step 1
Click on the “Search” icon in the Work Group
toolbar.
Step 2
Select the desired drive and directory to search.

7 - 4 Document #98198100
Step 3
Using the mouse, click once on the box labeled
“Search For” and enter the keyword for the
search.
Step 4
Finally, click once on “Search.” This will initiate
the search procedure.

Document #98198100 7 - 5
Step 5
Simply double click on the runs of interest to au-
tomatically add the run to the selection list.

7 - 6 Document #98198100
Notes:

Document #98198100 8 - 1
Chapter 8
Tools
WinPEP’s tools enable the dynamometer to produce
fast, repeatable, and reliable results for increasing
performance and providing diagnostic changes.
WinPEP Tools
A work group is the heart of WinPEP. The work group
is where selected runs can be compared , notes read
and edited and runs can be renamed and reorganized.
When WinPEP loads it automatically creates a blank
(New) work group. The user can use this blank one or
close it and open a previously saved one. Work groups
are meant to be saved in the root directory where
WinPEP is located.
There are some distinct advantages to working with
saved work groups.
(1) A saved work group maintains the directorystructure that the user was last using before savingthe group.
(2) The selected runs (after a save) will remainselected when the group is opened at a later date.
(3) The user can use a saved group to copy the selectedruns and their primary directory structure to anotherdirectory or drive (Even a floppy disk). This makescopying runs for dyno customers easy. There is avery distinct difference between saving a work groupand copying one.
Revision C 2/9/00

8 - 2 Document #98198100
Several of WinPEP’s Tools involve saved work groups
so we will begin this chapter by reviewing saving and
opening work groups.
Save Group
Step 1
With the mouse, click on the “File” menu then
position the cursor over “Save”, click once.
The following dialog will then prompt for a
descriptive file name to save the group as and
where you want to save it. Dynojet recommends
that you save your work groups in the same
directory where your version of WinPEP is
currently running. This directory will come up
automatically when you save a group.
Document #98198100 8 - 3
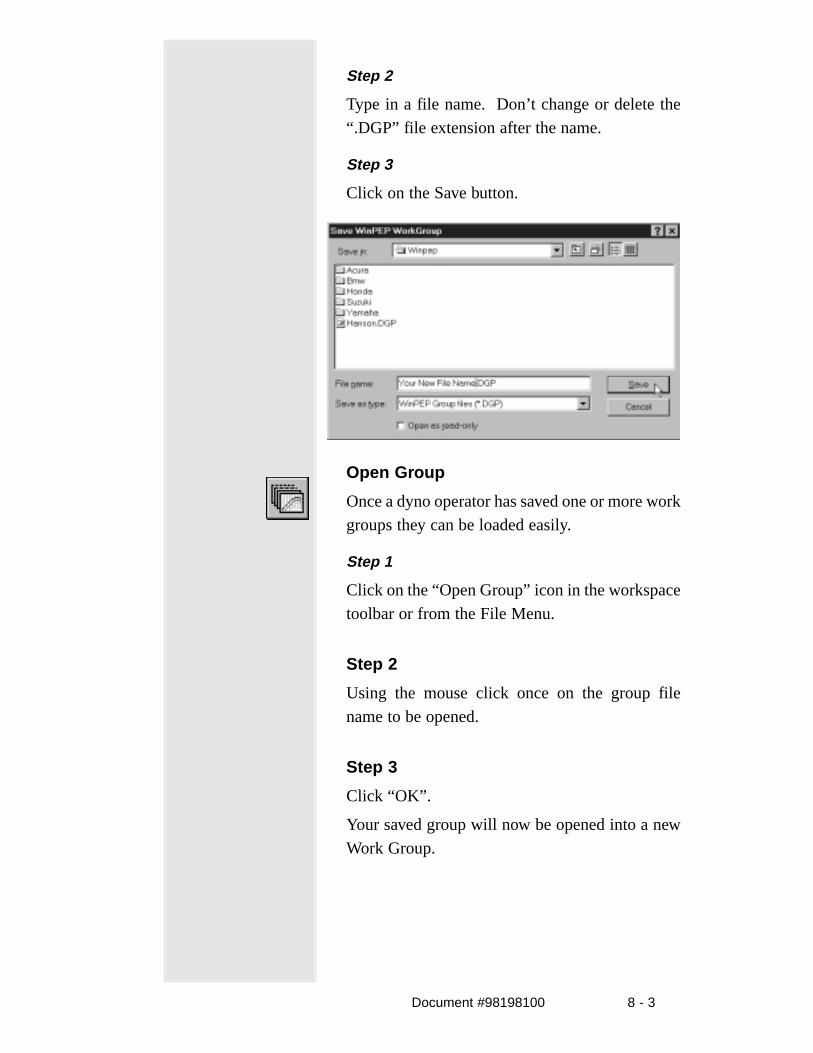
Step 2
Type in a file name. Don’t change or delete the
“.DGP” file extension after the name.
Step 3
Click on the Save button.
Open Group
Once a dyno operator has saved one or more work
groups they can be loaded easily.
Step 1
Click on the “Open Group” icon in the workspace
toolbar or from the File Menu.
Step 2
Using the mouse click once on the group file
name to be opened.
Step 3
Click “OK”.
Your saved group will now be opened into a new
Work Group.

8 - 4 Document #98198100
Group Tools
Copy Group
Step 1
Click “Copy Group” from the “Group Tools”
menu.
Step 2
The following dialog will allow selection of the
destination for the current selection list and files.
Delete Group
Step 1
Click “Delete Group” from the “Group Tools”
menu.
Document #98198100 8 - 5
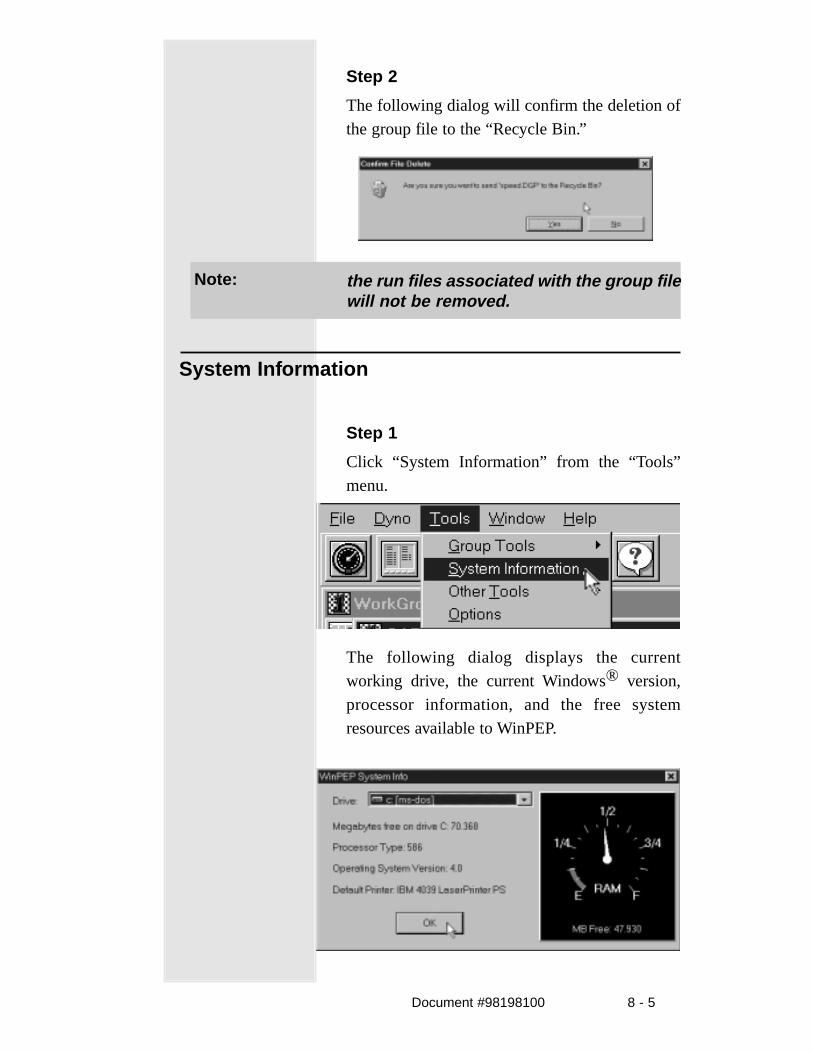
Step 2
The following dialog will confirm the deletion of
the group file to the “Recycle Bin.”
Note: the run files associated with the group filewill not be removed.
System Information
Step 1
Click “System Information” from the “Tools”
menu.
The following dialog displays the current
working drive, the current Windows® version,
processor information, and the free system
resources available to WinPEP.

8 - 6 Document #98198100
Other Tools
New Root Directory
WinPEP uses a fixed directory structure to store
runs. To change the root directory of the WinPEP
software do the following.
Step 1
Click on the “Select New Root” icon in the Work
Group toolbar.
The following pull down menu example demon-
strates an alternate method of executing the
command.
Step 2
The following dialog will allow changing the
default root directory for run viewing.

Document #98198100 8 - 7
Printer Parameters
Step 1
With the mouse, click on the “Other Tools” menu
then position the cursor over “Printer Parame-
ters.” Click once.
Note: This option is disabled until the user hasselected and graphed a minimum of onerun.
The following dialog will then appear. For
detailed information on printing, see the chapter
on Viewing Graphs.
8 - 8 Document #98198100
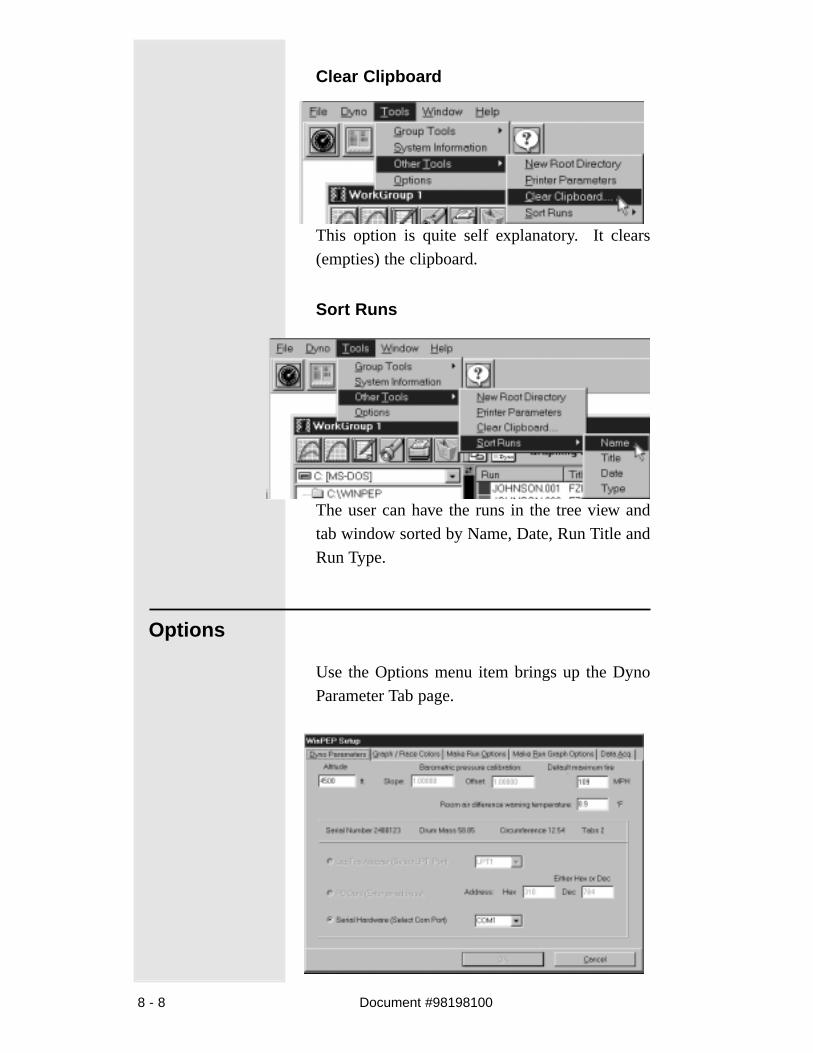
Clear Clipboard
This option is quite self explanatory. It clears
(empties) the clipboard.
Sort Runs
The user can have the runs in the tree view and
tab window sorted by Name, Date, Run Title and
Run Type.
Options
Use the Options menu item brings up the Dyno
Parameter Tab page.

Document #98198100 8 - 9
Dyno Parameters
The altitude number placed in this box will be
saved in the run file for display and dyno operator
knowledge.
The Barometric Pressure Calibration settings are
used to adjust the absolute pressure sensor on the
Motorcycle Model 150 Dynamometer (for all
other Dynojet Dynamometers, set both options to
1.0000).
WinPEP will halt the sampling of data once
maximum tire speed has been reached.
When comparing dyno runs from different
sessions, the room air temperature must be fairly
consistent. If the temperature difference is
greater than the predicted preset degree, a
warning notice will appear on the screen.

8 - 10 Document #98198100
This area of the Dyno Parameters dialog allows
you to change the default Laptop Adapter port,
PC Card Address or Hardware Serial port to your
current hardware configuration.
This information is display only and can not be
edited.
Graph / Race Colors
The left area of the Graph / Race Colors dialog
allows you to change the default color order for
displayed graphs.
The right area of the Graph / Race Colors dialog
allows you to change the default background /
foreground colors for displayed graphs.

Document #98198100 8 - 11
Make Run Options
This area of the Make Run Options dialog allows
you to change the Gauge Screen (or Sample
Screen) colors as well as the run abbreviation for
various run types. For example, the default ab-
breviations are RO for a Roll On, AG for All
Gear, FA for Fast Acceleration, and NG Negative
Horsepower. The user can edit them as well as
add two new ones.
Make Run Graph Options
The graph after making a run can be customized.

8 - 12 Document #98198100
The Display section allows the user to choose
from a variety of options to display on the graph
after making a run.
The Axes Selection allows for a custom multi
axes graph.
Checking this box will allow you to make axis
selections from the main graph. If the selections
that you made are not available in any of the
selected runs, then the “Make Run” graph will be
set to the default axis selection (HP vs. Speed).
The axis selection will be restored when you
remove the runs that lack the information to
execute your selections.
Fonts and Lines on the graph can be individually
changed

Document #98198100 8 - 13
The correction factor, smoothing and the
maximum number of runs to graph at a time after
making a run can be preset.
If the user checks the check box marked “Control
these settings from the Main Graph”, the maxi-
mum number of runs that will be graphed at a
time after making a run will be 12 and the
smoothing and correction factor will be taken
from the settings on the Main Graph.

Document #98198100 9 - 1
Chapter 9
Theory of Operation
Dynojet’s inertia dynamometer is a measuring device
for recording and displaying power and torque of an
engine. Its method of measurement is a direct
implementation of the definitions of power and torque.
Correction factors assist in the comparison of these
measurements under various test conditions, making
computer hardware and software necessary to obtain,
interpret, and display the data.
Power
Power in mechanical terms is the ability to
accomplish a specified amount of work in a given
amount of time. By definition, one horsepower is
equal to applying a 550 pound force through a
distance of 1 foot in one second. In real terms, it
would take 1 HP to raise a 550 pound weight up
1 foot in 1 second. So to measure horsepower, we
need to know force (in pounds) and velocity (in
feet per second).
Dynojet’s inertia dynamometer measures power
according to the terms just described. It measures
velocity by measuring the time it takes to rotate a
heavy steel drum one turn. The dyno measures
force at the surface of the drum by indirectly
measuring its acceleration. Acceleration is
simply the difference in velocity at the surface of
Revision C 2/9/00

9 - 2
the drum from one revolution to the next. The
force applied to the drum is calculated from
acceleration using Newton’s 2nd law, (F)orce =
(M)ass x (A)cceleration.
Power is coupled to the drum by friction
developed between the driving tire of the vehicle
and the knurled steel surface on the drum of the
dynamometer.
Torque
When an object rotates around a point, its speed
of rotation depends on both an applied force and
the moment arm. The moment arm is the distance
from the point of rotation to where the force is
being applied. Torque is the product of the force
and the moment arm. For example, if a rope,
wrapped around a drum of 1 foot radius, is pulled
with 550 pounds of force, the resulting force is
550 foot-pounds.
The Torque on the dyno’s drum can be calculated
by multiplying the force applied by the drum’s
radius. However, engine torque is not equal to
drum torque because the gearing through the
drive train changes the moment arm. The change
in the moment arm is proportional to the ratio of
engine speed to drum speed. Therefore,
tachometer readings are necessary to calculate
and display engine torque.

9 - 3
Correction Factors
The calculation of horsepower or the accuracy of
our dynamometer is not dependent on the
location or conditions during the measurement.
The performance of the internal combustion
engine is, however, sensitive to atmospheric
conditions, especially air density and air
temperature. To compare power measurements
taken at different times or places, it is necessary
to compensate for differing atmospheric
conditions.
Correction Factors are used to compensate engine
horsepower measurements for differences in
operating conditions during engine testing. The
typical correction factor (CF) is calculated based
on the absolute barometric pressure, air
temperature and water content of the air used for
combustion by the engine under test. It attempts
to predict the horsepower that would be
developed if the engine were tested at sea level
under standard pressure and temperature
conditions.
Absolute barometric pressure is a measure of how
hard the air molecules are being pushed closer to
one another. The unit of measurement is typically
inches of mercury (inches Hg). The more
pressure, the more molecules there are in a liter of
air and the more air the engine gobbles up during
the intake stroke. Absolute barometric pressure is
equal to Relative barometric pressure only at sea
level. Relative barometric pressure is reported at
airports and by weather barometers. A good

9 - 4
approximation for converting relative barometric
pressure to absolute barometric pressure is:
AbsHg = RelHg - (Elev/1000)Where:
AbsHg = Absolute barometricpressure
RelHg = Relative barometricpressure
Elev = test location elevation infeet above sea level
Water content is calculated from the ambient wet
and dry bulb temperatures. Dry bulb temperature
is normal room temperature. Wet bulb
temperature is always less than or equal to dry
bulb temperature. As air is blown over the wet
bulb thermometer the water evaporates and cools
the thermometer. The dryer the air, the cooler the
wet thermometer indicates. If the ambient air is
saturated (humidity = 100%), very little water
evaporates and the wet bulb temperature is equal
to the dry bulb temperature. These measurements
are then converted to partial pressure in inches of
mercury and used in the correction formula.
Water vapor displaces oxygen and reduces the
amount of combustion air ingested during the
intake stroke.
Air temperature is the temperature of the air
entering the intake system of the engine under
test. In some cases this is ambient air
temperature, but in other cases the intake air is
significantly heated by the engine and is different
than ambient air. Heat tends to spread air

9 - 5
molecules apart. So as temperature increases,
there are less molecules in a liter of air and less
air is swallowed during the intake stroke.
Dynojet’s WinPEP (Performance Evaluation
Program for Windows 95) software uses the
SAE’s latest correction formula (June 1990).
This formula assumes a mechanical efficiency of
85% and is much more accurate than earlier
formulas at extreme conditions. The formula
used is:
CF= 1.18 x (29.22/Bdo) x To+460 / 537) - 0.18
Where:To = Intake air temperature in
degrees F
Bdo = Dry ambient absolute
barometric pressure
Hardware and Software
The dynamometer electronics acquire data
necessary for power, torque, and correction factor
calculations. This includes air temperature,
absolute barometric pressure, drum timing, and
engine rpm.
During a run, the data is stored in the dyno
electronics memory.
After a dyno run is finished, data from the dyno
electronics, calibration data and user notes are
saved to a file on the computer’s hard disk. Each
run file is saved in a directory structure composed
of “Make”, “Model” and “Name” which
organizes the data for quick and easy retrieval.

9 - 6
When the user selects a run, the data is loaded
from the hard disk into computer memory. Data
from up to twelve runs can be placed in memory
at once. This information can be used for either
viewing horsepower graphs or racing vehicles.
The drum data is used to calculate and display
power while viewing graphs. Data can either be
viewed as measured (“uncorrected”) or as
corrected according to standard atmospheric
conditions.
The drum data can also be used for determining
speed and distance traveled in a simulated race.
When not correcting to standard atmospheric
conditions, the vehicle speed is equal to the drum
speed and distance traveled equivalent to the
number of drum revolutions times drum
circumference. The relations are no longer equal
when correcting to standard conditions. Both
speed and distance are then predicted from the
corrected acceleration of the drum.
Conclusion
By accelerating a massive drum, measurement of
power and torque is straight forward and
accurate. The use of correction factors allows
comparison of those measurements under various
test conditions. The use of modern computers
provides an economical yet logical method of
obtaining and viewing the information. Dynojet’s
inertia dynamometer is fast becoming the
industry standard because of its accuracy,
repeatability and design simplicity.

9 - 7
Notes:

9 - 8
Notes.
Top Related