


Languages
Pages
Legal

Wildland Fire Occurrence and Emissions in the Eastern United States From 2001 Through 2050
By Todd Hawbaker and Zhiliang Zhu
Professional Paper 1804
U.S. Department of the InteriorU.S. Geological Survey
Chapter 4 ofBaseline and Projected Future Carbon Storage and Greenhouse-Gas Fluxes in Ecosystems of the Eastern United StatesEdited by Zhiliang Zhu and Bradley C. Reed

U.S. Department of the InteriorSALLY JEWELL, Secretary
U.S. Geological SurveySuzette M. Kimball, Acting Director
U.S. Geological Survey, Reston, Virginia: 2014
For more information on the USGS—the Federal source for science about the Earth, its natural and living resources, natural hazards, and the environment, visit http://www.usgs.gov or call 1–888–ASK–USGS.
For an overview of USGS information products, including maps, imagery, and publications, visit http://www.usgs.gov/pubprod/.
To order this and other USGS information products, visit http://store.usgs.gov/.
Any use of trade, firm, or product names is for descriptive purposes only and does not imply endorsement by the U.S. Government.
Although this information product, for the most part, is in the public domain, it also may contain copyrighted materials as noted in the text. Permission to reproduce copyrighted items must be secured from the copyright owner.
Suggested citation:Hawbaker, Todd, and Zhu, Zhiliang, 2014, Wildland fire occurrence and emissions in the eastern United States from 2001 through 2050, chap. 4 of Zhu, Zhiliang, and Reed, B.C., eds., Baseline and projected future carbon storage and greenhouse gas fluxes in ecosystems of the eastern United States: U.S. Geological Survey Professional Paper 1804, p. 55–79, http://dx.doi.org/10.3133/pp1804.
ISSN 1044-9612 (print) ISSN 2330-7102 (online) ISBN 978-1-4113-3794-7
iii
Contents
4.1. Highlights ..............................................................................................................................................554.2. Introduction ..........................................................................................................................................554.3. Methods and Data ...............................................................................................................................57
4.3.1. MTBS Wildland Fire Data .......................................................................................................574.3.2. Fuels and Topography.............................................................................................................574.3.3. Weather and Climate Data .....................................................................................................574.3.4. Baseline Wildland Fire Occurrence and Emissions ..........................................................594.3.5. Projected Future Wildland Fire Occurrence and Emissions ............................................59
4.3.5.1. Ignitions .........................................................................................................................594.3.5.2. Spread ...........................................................................................................................604.3.5.3. Emissions ......................................................................................................................604.3.5.4. Calibration .....................................................................................................................604.3.5.5. Simulations of Future Fires ........................................................................................60
4.3.6. Limitations and Uncertainties ................................................................................................604.4. Results ...................................................................................................................................................62
4.4.1. Baseline Wildland Fires and Emissions ...............................................................................624.4.2. Climate-Change Trends in the Eastern United States .......................................................634.4.3. Projected Future Wildland Fires and Emissions .................................................................664.4.4. Summary of Wildland Fire Occurrence and Emissions of Carbon Fluxes ......................68
Figures 4 – 1. Graphs showing summaries of projected wildland fire ignitions, burned area,
and emissions for the Eastern United States by decade from 2001 through 2050 ...........58 4 –2. Graphs showing the annual number of wildland fires, area burned, and emissions
for the baseline (2001–2008) period of the carbon flux and storage assessment of the Eastern United States .....................................................................................................62
4 –3. Graphs showing the annual number of wildland fires, area burned, and emissions for the baseline (2001–2008) period for the A, Mixed Wood Shield and Mixed Wood Plains, B, Southeastern USA Plains, C, Ozark, Ouachita-Appalachian Forests, and D, Mississippi Alluvial and Southeast USA Coastal Plains ecoregions in the Eastern United States ...............................................................................................................................64
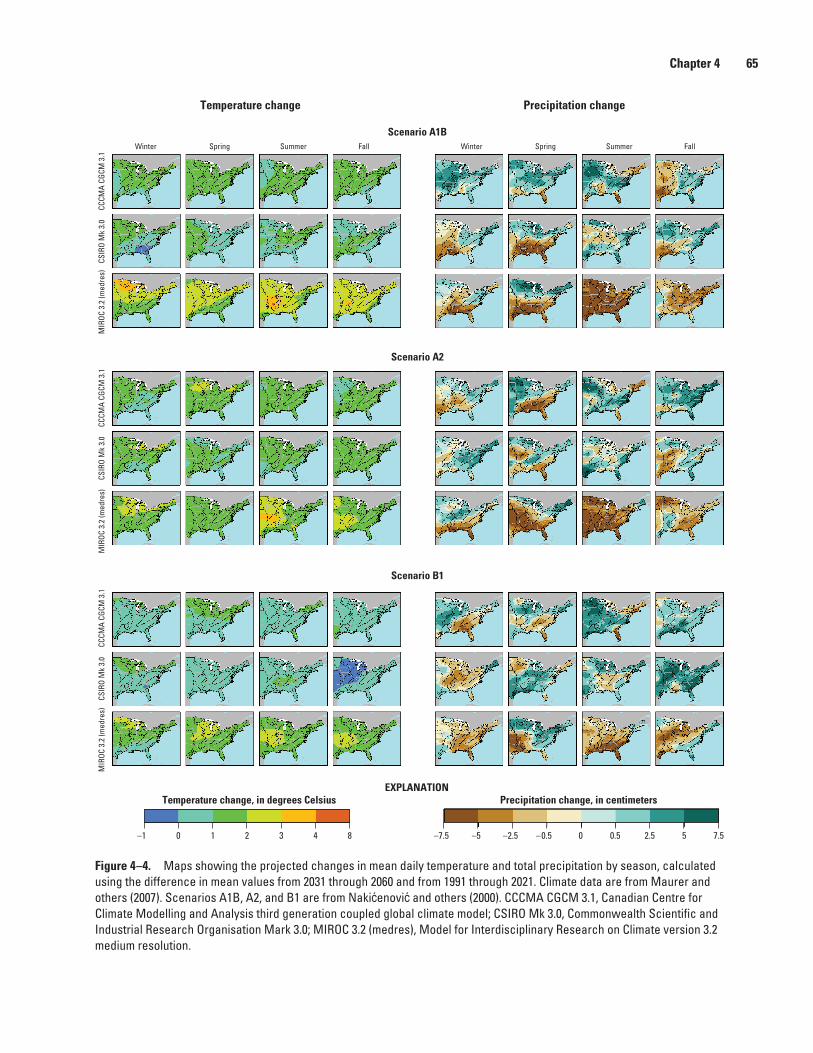
4 –4. Maps showing the projected changes in mean daily temperature and total precipitation by season, calculated using the difference in mean values from 2031 through 2060 and from 1991 through 2021 ............................................................65
4 – 5. Graphs showing summaries of projected wildland fire ignitions, burned area, and emissions for the A, Mixed Wood Shield and Mixed Wood Plains, B, Southeastern USA Plains, C, Ozark, Ouachita-Appalachian Forests, and D, Mississippi Alluvial and Southeast USA Coastal Plains ecoregions by decade from 2001 through 2050 ..............67

iv
Tables 4–1. Summary statistics for the number of wildland fires, area burned, and emissions ........63 4–2. Relative projected changes in the 50th and 95th percentiles for wildfire ignitions,
area burned, and emissions between 2001–2010 and 2041–2050 .......................................68

Chapter 4. Wildland Fire Occurrence and Emissions in the Eastern United States From 2001 Through 2050
By Todd Hawbaker and Zhiliang Zhu
4.1. Highlights
• Duringthebaselineperiodofthewildlandfirepartoftheassessment(2001through2008),themedianofareaburnedbywildlandfireswas1,355squarekilometersperyear(km2/yr),andthe95thpercentilewas4,092km2/yr.
• Duringthebaselineperiodofthewildlandfirepartoftheassessment,themedianofemissionsfromwildlandfireswas5.2teragramsofcarbondioxideequivalentperyear(TgCO2-eq/yr;1.4TgC/yr),andthe95thpercentilewas17.3TgCO2-eq/yr(4.7TgC/yr).
• Duringthebaselineperiodofthewildlandfirepartoftheassessment,themedianofwildfireemissionsintheEasternUnitedStateswasequivalentto0.51percentoftheaverageNEP(279TgC/yr;chap.7),andthe95thpercentilewas1.59percentoftheaverageNEP.
• Duringthebaselineperiodofthewildlandfireassessment,themedianofwildfireemissionsintheEasternUnitedStateswasequivalentto0.09percentoffossilfuelemissionsfortheUnitedStates,andthe95thpercentilewas0.31percentoffossilfuelemissionsfortheUnitedStates.
• Fortheprojectedperiod(2009through2050),wildlandfireoccurrenceandgreenhouse-gasemissionsincreasedintheEasternUnitedStatesunderalloftheclimate-changescenariosconsideredinthisassessment.
• Fortheprojectedperiod,therewassubstantialvariabilityinthedirectionandmagnitudeofchangeamongecoregions,andnotallecoregionsexpe-riencedincreasesinwildlandfireoccurrenceandemissionsunderallclimate-changescenarios.
• Theprojectedmedianamountofareaburnedannuallyfrom2041through2050wasasmuchas51percentgreaterthanthemedianamountofareaburnedannuallyduringthebaselineyears.Themedianannualemissionswereprojectedtoincreasebyasmuchas41percentfromthebaselinemedianannualemissions.
• Extremefireyears(yearsinwhichtheamountofareaburnedarerankedthe95thpercentile)areprojectedtobecomemoreextreme.Theannualareaburnedinextremefireyearswasprojectedtoincreaseby43to122percentfromtheearlyconditions,andthe95thpercentileofannualwildlandfireemissionswasprojectedtoincreaseby41to111percentfromthebaseline95thpercentileestimate.
• PrescribedfireisanimportantlandmanagementtoolintheEasternUnitedStates;however,thelackofaccurateandconsistentdataaboutprescribedfireslimitsunderstandingoftheircontributionstoGHGemissions.
4.2. IntroductionThemethodologyforthisassessment(Zhuandothers,
2010)explicitlyaddressedecosystemdisturbances,includinghuman-andnatural-causedwildlandfires,asrequiredbytheEISA(U.S.Congress,2007).Estimatesforthebaselineandprojectedbiomasscombustionemissionsfromwildlandfiresandeffectsinlong-termcarbonbalancewerecomponentsoftheassessment(fig.1–2).Biomasscombustionemissionresultsarepresentedinthischapter.Thebaselineburnedareasandtheprojectedfuturepotentialburnedareasforwildlandfiresandtheirseverity,describedinthischapter,wereusedasinputintotheassessmentofthelong-termeffectsofecosystemcarbonbalances(chap.5).
WildlandfiresareacriticalcomponentoftheglobalcarboncyclebecausetheyproduceanimmediatereleaseofGHGs—CO,CO2,andCH4—whenbiomassisconsumedthroughcombustion(SeilerandCrutzen,1980).However,previousestimatesofemissionsfromwildlandfiresintheUnitedStateswerehighlyvariable,andafterconvertingthereportedemissionstocarbon-dioxideequivalents,theywereasfollows:
• from15TgCO2-eq/yrin2001to73TgCO2-eq/yrin2008(Giglioandothers,2010;vanderWerfandothers,2010;OakRidgeNationalLaboratory,2012),
• from29TgCO2-eq/yrin2001to199TgCO2-eq/yrin2008(Frenchandothers,2011;MichiganTechResearchInstitute,2012),and

56 Baseline and Projected Future Carbon Storage and Greenhouse-Gas Fluxes in Ecosystems of the Eastern United States
• from157TgCO2-eq/yrin2002to283TgCO2-eq/yrin2006(WiedinmeyerandNeff,2007).
Whencomparedwiththe2010estimateof1,075TgCO2-eq/yrofnetcarbonfluxfromecosystemsinthecontinentalUnitedStatesreportedbytheEPA(U.S.EnvironmentalProtectionAgency,2012),theannualemis-sionsfromwildlandfireswereequivalentto1to26percentoftheecosystem’stotalannualnetcarbonflux.Incontrast,thecombustionoffossilfuelsproduced5,642TgCO2/yrfrom2001to2008(U.S.EnvironmentalProtectionAgency,2012),andemissionsincreasedatarateof1percentperyear(Pacalaandothers,2007).Basedontheserates,theannualemissionsfromwildlandfireswereequivalentto0.3to5.1percentoftheemissionsfromfossil-fuelconsumption.
Thedifferencesamongthevariabilityandqualityoftheseresults,thespatialandtemporalresolutionofthedata,andassumptionsaboutvariationsincombustionefficiencyweretheprimarysourcesofuncertaintiesinwildlandfireemissionsestimates(Larkinandothers,2009;Frenchandothers,2011).Theassumptionsabouttheproportionofabovegroundbiomassconsumedbywildlandfire,especiallyabovegroundwoodybiomassinforests,canhaveasubstantialinfluenceonemissionestimates(Campbellandothers,2007;Meigsandothers,2009).Themethodsusedtocalculateemissionsreliedonestimatesoftheareathatwasburned,fuelloads(volumeofliveanddeadbiomassavailableforburning),combustionefficiency,andemissionfactors(SeilerandCrutzen,1980;Albiniandothers,1995;WiedinmeyerandNeff,2007;Ottmarandothers,2008).Forexample,theGlobalFireEmissionsDatabase(GFED;Giglioandothers,2010;vanderWerfandothers,2010)estimatesbiomassconsumptionandemissionatfirelocations(includingagriculturalfires)detectedbytheNationalAerospaceandSpaceAdministration’s(NASA)moderateresolutionimagingspectroradiometer(MODIS;Royandothers,2002;Giglioandothers,2003)basedonland-covertypes,combustioncompleteness,soilmoisture,andland-cover-specificemissionfactors.TheGFEDalsoincorporateschangesinfuelloadsusingtheCarnegieAmesStanfordapproachtocharacterizebiomassproduction(Potterandothers,1993,2012).WiedinmyerandNeff(2007)alsousedactivewildlandfireobservationsfromMODISsatellitesensors(Giglioandothers,2003),butcalculatedtheemissionsbasedonstaticland-covertypes,percentageoflandcover,andbiomassat1-kilometer(km)resolution.Frenchandothers(2011)usedtheForestServiceConsumemodel(Ottmarandothers,2008),whichcalculatedfuelconsump-tionandemissionusingfuelloadsderivedfromtheForestServiceFuelCharacteristicClassificationSystem(FCCS;Ottmarandothers,2007)andfuelmoisturesderivedfromweather-stationdata.
Wildlandfiresalsohavelong-termeffectsonecosystemcarbonbalancebyinfluencingtherateofcarbonseques-trationaftercombustion,throughthedecompositionofdeadvegetation(whichcanprovidenutrientstohelpestablishnewvegetation),andbyreducingtherateofphotosynthesis
perunitarea.Becauseofthoseeffects,yearstodecadescanpassbeforecarbonstocksreturntoconditionsbeforethefire(Turnerandothers,1998;Clearyandothers,2010;HurteauandBrooks,2011;Kashianandothers,2012).Iffireregimesarestableandassumingnootherlandmanagement,thelong-termeffectsofwildlandfiresonecosystemcarbonbalancearetypicallynegligiblebecausecarbonsequestrationthroughgrowthofnewvegetationandcarbonlossthroughwildlandfireemissionscancelouteachotheroverlongperiods(Balshiandothers,2009a,b;Flanniganandothers,2009).However,ifafireregimechanges,thenthevulnerabilityforcarbonstorageishighbecausetheamountofcarbonstoredintheecosystemcanbealteredorlostthroughemissions.
Substantialevidenceisavailabletodocumentthatfireregimeshavenotbeenstaticinmoderntimes.Forexample,thefrequencyofwildlandfireshasbeengreatlyreducedsincesettlementoftheUnitedStatesbeganmainlyduetoland-usechangesandthesuccessoffiresuppressioninthepastcentury(Clelandandothers,2004).IntheWesternUnitedStates,thefrequencyofwildlandfireshasbeenincreasingsincethe1990sbecauseofclimatechangesleadingtoanincreasinglyearliersnowmelt(Westerlingandothers,2006).WildlandfiresandemissionstocarboncyclingarelikelytobelessimportantintheEasternUnitedStatesthanintheWesternUnitedStates,butlimitedresearchhasbeenconductedquantifyingrelationshipsbetweenwildfireoccurrenceandclimatechangeintheEasternUnitedStates.Iftheclimateshiftstowarmeranddriercondi-tions,thenincreasesinfirefrequencyandemissionsarelikely.Therefore,anycomprehensiveassessmentofcarbonstorageandfluxesinecosystemsthroughtimemustaccountforthepotentialchangesinwildlandfireoccurrenceandemissions.
Wildlandfireregimesareafunctionoftheinteractionsbetweenvegetation,landuse,andultimately,theclimate(SwetnamandBetancourt,1990;Gedalofandothers,2005;Westerlingandothers,2006;Falkandothers,2007).Achangingclimatemayresultinchangesinwildlandfireregimes,includingtheiroccurrenceandseverity.Hessl(2011)outlinedtheprimarypathwaysthroughwhichclimatechangemayalterwildlandfireregimes,including(1)alteredfuelconditions,suchasachangeinfuelmoisture;(2)alteredfuelloads;and(3)changesinignitionpatterns.TheeffectsofclimatechangeonwildlandfiresintheEasternUnitedStatesareexpectedtobesignificantandresultinchangesinweatherpatternsthatwouldalter(1)ignitionpatterns,(2)wildlandfirebehavior,and(3)toalesserextent,thedistributionofvegetation.Nosinglestudy,however,hasaddressedallthreetypesofchangessimultaneouslyatthescalerequiredbythisassessment(Flanniganandothers,2009).
Previousstudiesprovidedanestimateoftheeffectsofwildlandfiresoncarbonbalanceatanationalscalebutlackedtheregionaldetailrequiredbythisassessment.Furthermore,therewerefewprojectionsoffuturepotentialwildlandfireemissionsthatwereconsistentwiththeexistingbaselineemissionestimates.Therefore,asetofbaselineemissionsandprojectedfuturepotentialemissionswasdevelopedtoensureconsistencythroughoutthisandotherregionalassessments.

Chapter 4 57
Theprimaryquestionsaddressedinthischapterinclude:(1)whatwerethepatternsofwildlandfireoccurrenceandemissionsintheEasternUnitedStates?(2)whatmaybethepotentialchangesinwildlandfireoccurrenceandemis-sionsfortheEasternUnitedStatesunderclimatechange?(3)howdidrecentwildlandfireoccurrenceandemissionsvarytemporallyandspatiallyamongtheecoregionsoftheEasternUnitedStates?and(4)whichecoregionsoftheEasternUnitedStateshavethegreatestpotentialforchangesinfire-occurrenceandemissions?
4.3. Methods and DataThewildfiremodelingandestimationstudyforthe
carbonsequestrationassessmentofecosystemsoftheEasternUnitedStateshadtwotasks:(1)calculatingthebaselinequantitiesforwildlandfireoccurrenceandemissionsand(2)simulatingfuture(2009 –2050)projectionsofwildlandfireoccurrenceandemissionsunderclimate-changescenarios.Themethodsusedforthisstudyarethesamemethods(HawbakerandZhu,2012)usedintheUSGSwesternecosystemcarbonsequestrationassessment(ZhuandReed,2012).Somespecifictechnicalprocessesarecommontobothpartsofthestudy;othermethodsarespecificforasingletask.Thebaselineestimatesforthenumberofwildlandfires,theareaburned,andemissionswerederivedfromtheWildlandFireLeadershipCouncil’sMonitoringTrendsinBurnSeverity(MTBS)database(Eidenshinkandothers,2007)andtheForestService’sFirstOrderFireEffectsModel(FOFEM;Reinhardtandothers,1997)forthemajorGHGsCO2,CO,andCH4.ThismethodwasappliedtoeachwildlandfireintheregionthatwasintheMTBSdatabasetoproduceestimatesofCO2,CO,andCH4emissions(convertedtoCO2equivalents).
Thewildlandfiremodelingapproachusedforthefutureprojectionsinthisassessmentincorporatedthreeprimarycomponents:wildfireignitions,spread,andeffects.Theparametersfortheignitionandspreadcomponentswereselectedthroughacalibrationprocessusingthebaselineobserveddata,whichwereusedtosimulatefuturepotentialwildfiresandburnedareasandthenFOFEMwasusedtoestimateemissionsforthesimulatedburnedareas.ResultsofthebaselineandfutureprojectionsofwildlandfireswereaggregatedtoproduceestimatesofemissionsfortheEasternUnitedStatesasawholeandforeachlevelIIecoregionwithinit(fig.1–1;asdescribedindetailinchapter2ofthisreport).ThedatasetsandmethodsusedbythevariouswildlandfiremodelingcomponentsaredescribedbrieflyinHawbakerandZhu(2012)andinmoredetailinthefollowingsections.
4.3.1. MTBS Wildland Fire DataThelocationsofwildlandfiresweretakenfromMTBS
data(Eidenshinkandothers,2007)andwereusedforbaselineobservationsandtocalibratetheignitionandspreadcompo-nentsofthewildlandfiremodelingsystem.TheMTBSdata
describedfiresthatoccurredfrom1984to2008andcoveredareasthatwerelargerthan404hectares(ha;1,000acres)intheWesternUnitedStatesand202ha(500acres)intheEasternUnitedStates.TheMTBSdatadidnotincludesmallfiresbutcapturedthemajorityoftheareaburnedbecausetheyincludedthelargestfires,whichcontributedmosttototalareaburned(Straussandothers,1989;Stocksandothers,2002).SomeprescribedfiresareincludedintheMTBSdatabase;however,theywereexcludedfromthisassessmentbecausethecompletenessofprescribedfirecoverageintheMTBSdatabasewasuncertainandlikelyunderestimatedactualprescribedfireuseintheEasternUnitedStates.EachwildlandfiredetailedintheMTBSdatabasewasidentifiedinStateorFederalfirerecords,anditsburnscarandseverityweremanuallymappedusingLandsatimageryfrombeforeandafterthefire.BecauseoftheMTBSmethodology,therewasahighdegreeofconfidenceinthespatialandtemporalaccuracyofthewildlandfiredata,whereasotherwildlandfiredatabaseshadknownproblems,includingduplicaterecordsanderroneouslocations(Brownandothers,2002),whichwouldrequirelaboriouserrorcheckingbeforeuse.
4.3.2. Fuels and Topography
Themethodologyforthebaselineandprojectedwildfiresreliedonvegetation,fuels,andtopographydatafromtheLandscapeFireandResourceManagementPlanningTools(LANDFIRE)Program(Rollins,2009)oftheU.S.DepartmentoftheInterior(DOI)andtheU.S.DepartmentofAgriculture(USDA).Thesedataincludedinformationaboutexistingvegetation,fire-behaviorfuelmodels,andtreecanopyfuels(cover,height,baseheight,andbulkdensity),aswellastheelevation,slope,andaspectoftheterrain.Tocalculateemissionsfromwildlandfires,theFuel-LoadingModel(FLM;Lutesandothers,2009)datalayeroftheLANDFIREprogramwasused.Vegetationandfuelswereheldstaticthroughoutthesimulationsforfuturewildfiresandwerenotalteredbysimu-lateddisturbancesandothertypesofLULCchange.Allrasterdatawereaggregatedto250-meter(m)resolutioninordertoimprovetheprocessingefficiencyusinganearest-neighborrule(Lillesandandothers,2007).Thenearest-neighboraggregationwasdesirablebecauseitpreservedtheproportionofvegetative-covertypeswithinthestudyarea,whereasotheraggregationmethodsweremorelikelytoresultincommonvegetative-covertypesbeingoverrepresentedanduncommonvegetative-covertypesbeingunderrepresented.
4.3.3. Weather and Climate Data
Theassessmentmethodologyrequireddailyweatherdata,includingtemperature,precipitation,relativehumidity,andwindspeeds,forthebaselineandfutureperiods.Forthebaselineperiod,griddeddailyweatherdataforthecontermi-nousUnitedStateswith0.125-degree(°)spatialresolution(approximately12km)wereused(Maurerandothers,2002).
58 Baseline and Projected Future Carbon Storage and Greenhouse-Gas Fluxes in Ecosystems of the Eastern United States
Thesedatawereinterpolatedfromweatherstationsandincludedtheminimumandmaximumdailytemperatureanddailyprecipitationfrom1950to2010.Thedataonafternoonwindspeedanddirectionfromthe0.333°(approximately32km)NorthAmericanregionalreanalysis(Mesingerandothers,2006)werejoinedtothe0.125°dailytemperatureandprecipitationdata.
Inordertosimulatetheeffectsoftheclimate-changescenariosonwildlandfireoccurrenceandemissions,downscaledmonthlyclimatedataprovidedbytheWorldClimateResearchProgramme(WCRP)CoupledModelIntercomparisonProjectphase3(CMIP3)multimodeldatasetwereused.TheCMIP3datawerecorrectedforbiasandspatiallydownscaledtomatchthe0.125°-resolutionbaselineweatherdata(Maurerandothers,2007).Forthisanalysis,thedownscaleddatafromtheClimateResearchBranchofEnvironmentCanada’sCanadianCentreforClimateModellingandAnalysis(CCCma)thirdgenerationcoupledglobalclimatemodel(CGCM3.1;FlatoandBoer,2001),theAustralianBureauofMeteorology’sCommonwealthScientificandIndustrialResearchOrganisationMark3.0(CSIROMk3.0;Gordonandothers,2000)climatemodel,andtheModelforInterdisciplinaryResearchonClimateversion3.2mediumresolution(MIROC3.2-medres;HasumiandEmori,2004)foreachofclimate-changescenariosA1B,A2,andB1(chap.2)weredownloadedfromthebiascorrectedanddownscaledWCRPCMIP3climateprojectionsarchive(Maurerandothers,2007;Meehlandothers,2007).TheGCMsandscenarioswereselectedonthebasisoftheirabilitytocapturepastclimatepatterns(Balshiandothers,2009a,b).Additionally,therangeofvariabilityamongtheprojectionsgenerallybracketedtheextremesoftemperatureandprecipitationprojectionsfortheconterminousUnitedStates(Gonzalezandothers,2010).Seasonalsummariesoftheclimateprojectionsweregeneratedforthe1991through2020and2031through2060periods.These30-yearperiods
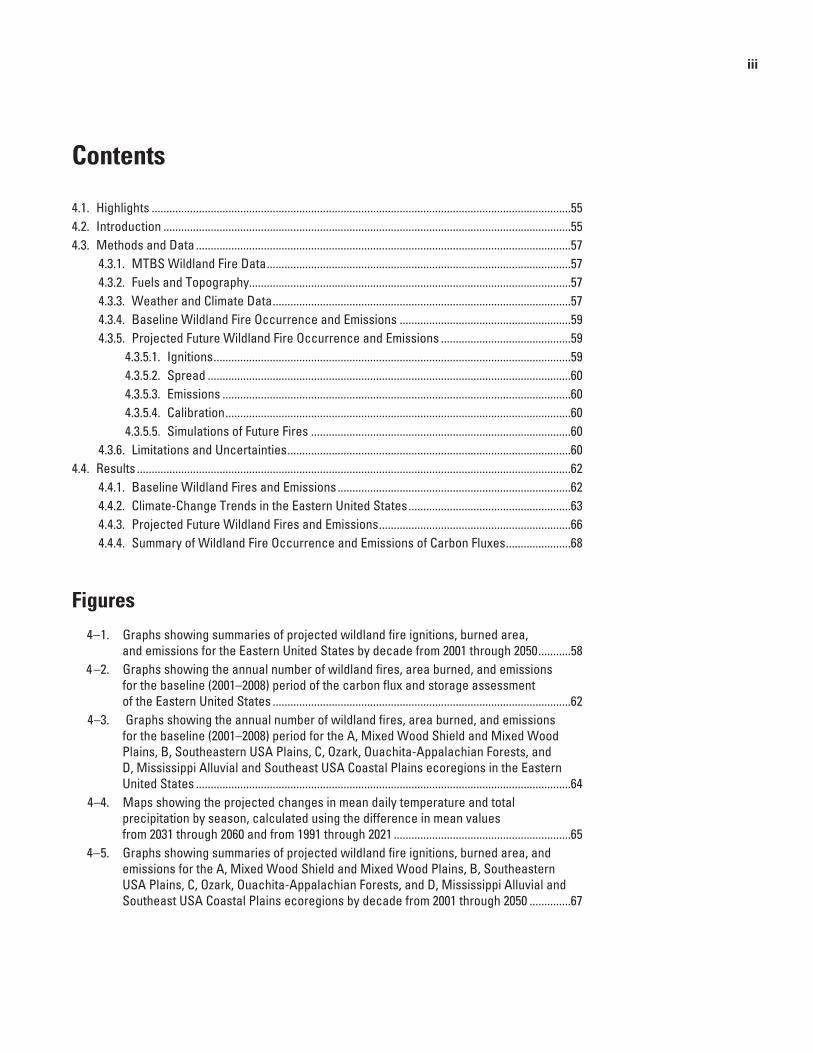
areafterthebaselineperiod(2001–2008)andthelastdecadeoftheprojections(2041–2050)usedinthisassessment.Differencesintemperatureandprecipitationamongthe1991through2020and2031through2060periodsforthedifferentclimate-changescenarioandGCMsusedinthisassessmentareshowninfigure4–1.
Thedownscaledclimatedataonlyprovidedmonthlytemperatureandprecipitationvalues,soatemporaldisaggregationalgorithm(Woodandothers,2002)wasimplementedtoproducethedailyvaluesnecessaryforwildlandfiresimulations.Thisalgorithmrandomlyrearrangedyear-longsequencesofthebaselineweatherdataforeachfutureyearandthenadjustedthedisaggregateddailyvaluesoftemperatureandprecipitationsothatthemonthlymeansmatchedthevaluesprovidedbythemonthlyclimateforecasts.Usingthismethodology,threereplicateweathersequencesweregeneratedforeachGCMandclimate-changescenariocombinationforatotalof27simulationruns.ThenumberofGCMsusedandreplicaterunswasultimatelylimitedbycomputingpowerandprocessingtimes.
Forthebaselineandfutureclimatechangescenarios,additionalprocessingstepsweretakentoproducetheliveanddeadfuelmoisturevariablesrequiredforsimulatingwildlandfirespreadandbehavior.First,theUniversityofMontanamountainclimatesimulator(MT–CLIM)algorithms(GlassyandRunning,1994)wereusedtocalculaterelativehumiditybasedonminimumandafternoondailytemperatures(Kimballandothers,1997).Oncehumiditywasestimated,theNationalFireDangerRatingSystem(NFDRS)algorithmswereusedtoestimatedailyvaluesforliveanddeadfuelmoistures,aswellaswildlandfirebehaviorindices,suchasanenergyreleasecomponent(ERC;Deemingandothers,1977;Bradshawandothers,1983;Burgan,1988).TheNFDRSalgorithmsrequiredinformationaboutthebeginningofspring(green,up)andfall(brown,down)toestimatelivefuelmoistures.Toaccountforpotentialshiftsinphenology,atechniquewasimplementedthatdeterminedthedatesofseasonal
0
400
600
800
200
1,000
1,200
0
10,000
15,000
5,000
0
20
10
40
30
50
2010
2020
2030
2040
2050
2010
2020
2030
2040
2050
2010
2020
2030
2040
2050
2010
2020
2030
2040
2050
2010
2020
2030
2040
2050
2010
2020
2030
2040
2050
2010
2020
2030
2040
2050
2010
2020
2030
2040
2050
2010
2020
2030
2040
2050
Scenario A1B Scenario A2 Scenario B1 Scenario A1B Scenario A2 Scenario B1 Scenario A1B Scenario A2 Scenario B1
Figure 4–4.
Number of wildland fires per year Area burned, insquare kilometers per year
Emissions, in carbon dioxideequivalent per year
5th percentile
Minimum
95th percentile
50th percentile (median)
Maximum
EXPLANATION
Figure 4 – 1. Graphs showing summaries of projected wildland fire ignitions, burned area, and emissions for the Eastern United States by decade from 2001 through 2050. The x-axis labels indicate the last year in the decade; for example, 2010 on the graph corresponds to the decade from 2001 through 2010. Scenarios A1B, A2, and B1 are from Nakićenović and others (2000).

Chapter 4 59
changesbasedongreen-upandbrown-downdatesusinganindexthatincorporatedthedailyphotoperiod,minimumtemperature,andthevapor-pressuredeficit(Jollyandothers,2005).
4.3.4. Baseline Wildland Fire Occurrence and Emissions
BaselinewildlandfireemissionswerecalculatedforeachburnedpixelintheMTBSdatabaseusingFOFEM,whichusedfuelloadsalongwithfuelmoisturestoestimatetheamountofforestlitteranddowneddeadwoodthatwasconsumed(AlbiniandReinhardt,1995,1997;Albiniandothers,1995).Theconsumptionofduff(decayingforestlitter),trees,plants,andshrubswasestimatedasafunctionoftheregion,season,fuelmoistures,andfuelloads.CanopyfuelconsumptionwasestimatedasafunctionoftheburnseverityprovidedbytheMTBSdata.TheemissionsofCO,CO2,andCH4werethencalculatedbasedontheamountoffuelconsumed,theorganic-mattercontentofthefuel,andhowefficientlyitburned.TherequiredinputdataforFOFEMincludedfuelloads,burnseverity,anddeadandlivefuelmoistures.Tosimplifythereportingofresults,theemissionestimatesweresummarizedforallcarbon-containingconstituentstoCO2equivalentsusingthefollowingequation:
CO2-eq=CO2+(2.33×CO)+(21×CH4). (4 –1)
Fuel-loaddataprovidedanestimateoftheamountofbiomassthatwasavailableforconsumptionandwerederivedfromtheLANDFIREProject’sFLMdatalayer(Lutesandothers,2009).Thesefuel-loaddatawerecategorizedby1-,10-,100-,and1,000-hourfuelclassesfordead,decaying(duffandforestlitter),andlive(grass,shrubs,andtreecanopy)biomass.IntheFOFEM,theamountoftreecanopythatwasconsumedwasadirectfunctionofburn-severityvaluesfromtheMTBSdata.Theamountsofcanopyfoliageconsumedinthehigh,moderate,andlowburn-severitycategorieswereassumedtobe100percent,60percent,and20percent,respectively.Similarly,theconsumptionofthecanopy’sbranchwoodinthehigh,moderate,andlowburn-severitycategorieswassetat50percent,30percent,and10percent,respectively.Thesevalueswerebasedonpreviouslypublishedestimates(Spracklenandothers,2009;Zhuandothers,2010)andonacomparisonofFOFEMemissionswithpreviouslypublishedresultsforselectedwildlandfires.Theemissionswerecalculatedforwildlandfiresbetween2001and2008.Wildlandfiresbefore2001wereexcludedbecausetheLANDFIREfuelsdatawerederivedfromLandsatimageryfromabout2001.
Aftercalculatingemissions,summariesofthewildlandfiredataforeachlevelIIecoregionandfortheentiretyoftheEasternUnitedStatesweregeneratedforthebaselineperiod.Thesesummariesincludetheminimum,mean,median,95thpercentile,andmaximumvaluesfornumberoffiresperyear,areaburnedperyear,andemissionsperyear.Themedianand
95thpercentilesummarystatisticswereassumedtorepresenttypicalandextremefireyears,respectively.
4.3.5. Projected Future Wildland Fire Occurrence and Emissions
Paststudiesgenerallysuggestthattheareaaffectedbylargewildlandfiresandemissionsfromthefireswasafunc-tionofignitionpatternsandfirebehavior,primarilyspread;ignitionpatternsandfirebehaviorwerelargelyinfluencedbyweatherconditions,fuels,andtopography(Caryandothers,2009)andinsomeregions,ignitionswereinfluencedbyhumanactivity(Cardilleandothers,2001;Syphardandothers,2007).Projectingthepotentialchangesinwildfirepatterns,therefore,requiredanunderstandingandaccuratecharacterizationofthedriversthatcreatedtheobservedpatternsofignitions,spread,andemissions(Keaneandothers,2003;Flanniganandothers,2009;Hessl,2011).Accordingly,thewildlandfiremodelingapproachusedforthisassessmentincorporatedthreeprimarycomponents:wildfireignitions,spread,andeffects.Theparametersfortheignitionandspreadcomponentswereselectedthroughacalibrationprocessusingthebaselineobserveddata,whichwereusedtosimulatefuturepotentialwildfires.
4.3.5.1. IgnitionsGenerallinearmodels(GLMs)withabinaryresponse
wereconstructedtopredictdailyignitionprobabilitieswithineach0.125°weathergridcell.Fromthedatadescribedabove,asuiteofpotentialpredictorvariableswascompiledthatincludeddailyweatherstatistics(minimumandmaximumtemperatureandERC),monthlyweathersummaries(temperatureandprecipitation),seasonalweathersummaries(temperatureandprecipitation),andmonthlyandseasonalregionalsummariesoftemperatureandprecipitation.Alsoincludedwithinthe0.125°weathergridcellsaspotentialpredictorsintheGLMmodelingweretheproportionsoflandareaclassifiedaspublicorurbanandexistingvegetationtypegroupsfromtheLANDFIREdatabase.
Mostobservations(gridcellswithdailyweatherdata)hadnodataonignitions;therefore,asubsamplewasselectedusingacase-controlsamplingdesign.Anyobservationwithprecipitationgreaterthan0.25centimeters(cm)wasremoved;thiswasdonetoensurethatignitionprobabilitieswerezeroondayswithsubstantialprecipitationthatwouldlimitfirespread.Allobservationswithignitiondatawereretainedalongwitharandomlyselectedsetofobservationswithoutignitiondata.Thenumberofobservationswithoutignitiondatawas10timesthenumberofobservationswithignitiondata.Thechoiceofdesignwassomewhatarbitrary,butjustifiedbecausethepredictiveperformanceofmodelsusingcase-controlsamplingdesignshasbeenshowntoincreasewiththeratioofcasestocontrols(Hastieandothers,2009).TheinterceptoftheGLMwasadjustedusingequation4–2toaccountforunequalproportionsofcases(ignitions)andcontrols

60 Baseline and Projected Future Carbon Storage and Greenhouse-Gas Fluxes in Ecosystems of the Eastern United States
(non-ignitions)inthesamplecomparedwiththepopulation(Preislerandothers,2004;Hastieandothers,2009).
golgol elpmaselpmas
noitalupopnoitalupop
non ignitions ignitionsnon ignitions ignitions
− −−
(4–2)
TobuildtheGLMs,aninitialsetofpredictorvariableswasselectedusingforwardstepwiseregression,includingonlyvariableswithp-valueslessthanorequalto0.05andlimitingthenumberofpredictorstoone-tenththenumberofwildlandfireobservations.EachGLMwasthenevaluatedandmodi-fiedasneededtoensurethattheselectedpredictorvariablesaccuratelydescribedweatherandclimateconditionsknowntoaffectwildlandfireoccurrenceinagivenecoregion.TheoverallperformanceofthefinalGLMwasjudgedusingtheareaunderthecurve(AUC)ofareceiver-operatorcharacter-isticplot(HanleyandMcNeil,1982).TheAUCmeasuredtheprobabilityofcorrectlyclassifyingarandompairoffireandnonfireobservations;anAUCvalueof0.5indicatedthatthemodelpredictionswereequivalenttoarandomguess,andanAUCvalueof1.0indicatedperfectpredictions.AUCvaluesgreaterthan0.8weregenerallyconsideredtobegood.
4.3.5.2. SpreadDuringthesimulations,theminimumtraveltime(MTT)
algorithm(Finney,2002)wasusedtosimulatethespreadofwildlandfiresafterignition.TheMTTalgorithmhasbeenusedextensivelyforlocal-andnational-scalesimulationsofburnprobability(Calkinandothers,2011;Finneyandothers,2011).Inadditiontoanignitionlocation,theMTTalgorithmreliedonfuels(surfaceandcanopy),topography(elevation,slope,andaspect),weather(windspeedanddirection),andliveanddeadfuelmoisturedata.TheMTTalgorithmalsorequiredaspecifiednumberofdaysandminutesperdaythatawildlandfirecanspread.TheoutputsproducedbytheMTTalgorithmincludedthearrivaltime(durationofthewildlandfiresinceignition)ofeverypixelrepresentingburnedarea,aswellaswildlandfire-behaviormetrics,suchasfirelineintensityandcrown-fireactivity.
4.3.5.3. EmissionsTocalculateemissions,theFOFEM(Reinhardtand
others,1997;ReinhardtandKeane,2009)wasappliedtoeachpixelburnedbythesimulatedwildlandfiresusingthesameprocessingstepsthatwereusedforthebaselineemissions.
4.3.5.4. CalibrationAnumberofcalibrationsimulationswererequired
todeterminetheappropriatenumberofdaysandminutesperdaytoallowwildlandfirestospreadusingtheMTTalgorithm.Theinitialvaluesfortheminimumandmaximumnumberofdaystoallowthespreadandminutesofspread
perdaywereselectedbasedonvaluesderivedfromFederalfirerecords.Ninereplicatesimulationswererunusingtheavailableweatherdata(1984–2008).Afterthesimulationswerecomplete,atwo-sidedt-testwasusedtodetermineiftheannualaverageareaburnedduringthesimulationsdifferedsignificantlyfromtheannualaverageareaburnedbasedonobservationsfromtheMTBSdatabase.Ifthedifferencesweresignificant,thenumberofdaysoffirespreadandtheminutesofspreadperdaywerealteredandthecalibrationprocesswasrepeateduntilthep-valueofthet-testwaslessthan0.05,indicatingthatthecalibrationsimulationsreproducedthebaselinefirepatterns.
4.3.5.5. Simulations of Future FiresAftercalibration,futurepotentialwildlandfireignitions,
spread,andemissionsweregeneratedforthreereplicatesimulationsforeachoftheclimate-changescenariosandGCMs,startingin2001andendingin2050.Thereplicatesimulationswereruntohelpquantifyuncertaintybecauseofthestochasticnatureofthemodels;morereplicatesimula-tionswouldhavebeenideal,butprocessingtimeslimitedthenumberofreplicatestothree.Thesimulatedannualnumberofwildlandfires,areaburned,andemissionsweresummarizedacrosstheGCMsandreplicatesandwereshownasthemedianand95thpercentileforeachclimate-changescenarioforeachdecade,whichrepresentedtypicalandextremefireyears,respectively.Therelativechangebetween2001–2010and2041–2050werereported.Significanceofeachchangewasassessedata0.05-alpha(α)levelusingMonteCarlopermutationtestwith1,000permutations(Hesterbergandothers,2012).
4.3.6. Limitations and UncertaintiesTheresultsgeneratedforthisassessmentforbaseline
wildfireemissionsdifferedandweregenerallylowerthanestimatesofemissionsfromthepeer-reviewedliteraturefortheEasternUnitedStates.Thehighestestimatesofemis-sionsfrompeer-reviewedliteraturewerefromWiedinmyerandNeff(2007),whousedtheactivefireproductfromtheMODISsensorsfrom2002to2006andestimatedthemeanofannualemissionstobe71TgCO2-eqforAlabama,Connecticut,Delaware,Florida,Georgia,Illinois,Indiana,Kentucky,Louisiana,Maine,Maryland,Massachusetts,Michigan,Mississippi,NewHampshire,NewJersey,NewYork,NorthCarolina,Ohio,Pennsylvania,RhodeIsland,SouthCarolina,Tennessee,Vermont,Virginia,WestVirginia,andWisconsin.TheareausedinWiedinmyerandNeff(2007)isnotthesameastheareausedforthisanalysisoftheEasternUnitedStates.
Frenchandothers(2011)calculatedemissionsusingtheMTBSdataandConsumemodel(Ottmarandothers,2008)forwildlandfiresoccurringfrom2001to2008;theresultsareavailableasecoregion-levelsummaries(MichiganTechResearchInstitute,2012).WhentheresultsfromFrenchand
Chapter 4 61
others(2011)weresummarizedacrosstheEasternUnitedStates,theaverageandstandarddeviationofannualemissionswere20.5TgCO2-eqand12TgCO2-eq,respectively.Theemis-sionestimatesfromtheseanalysesweresubstantiallygreaterthantheestimatesproducedforthisassessment.Thedifferencesamongresultsarelikelyduetodifferencesinmethods,data,andtheresolutionofthedataused.WiedinmyerandNeff(2007)reliedon1-km-resolutionactivewildlandfiredatafromMODISandfueldatafromtheFCCS(U.S.DepartmentofAgriculture,ForestService,2012a),whichtypicallyhavehigherfuelloadsthentheFLMdatausedforthisassessment.Theyalsoassumedthatalltheavailablebiomasscouldpotentiallyburn,andthatisoftennotthecase,especiallyforwoodyfuels(Campbellandothers,2007;Meigsandothers,2009).Frenchandothers(2011)alsousedthe1-km-resolutionFCCSfuelsdataandaggregated1-km-resolutionMTBSdata.Thefueldataintheirreportdifferedfromthedatalayerusedinthisassessmentintermsofinformationandresolution.Themethodsusedinthisassessmentmadeuseoffuelmoistures,whicharebasedongriddeddailyweatherdata.ThemethodsusedbyFrenchandothers(2011)alsomadeuseoffuelmoistures,butrecommended10percentlevelsfor1,000-houravailabilityandduffmoistures,whichareveryfavorableconditionsforcombustion.Thefulleffectsofthedifferencesinfuelmapsandmoisturelevelsontheaccuracyoffiremodelingweredifficulttoassess,butthesecomparisonssuggestthattheresultsinthisassessmentaremoreconservativethanpreviouslypublishedestimatesofwildlandfireemissions.
TheMTBSdatausedinthisassessmentdidnotincludesmallwildlandfires,buttheystillcapturedthemajorityoftheareaburnedbecausetheyincludedthelargestwildlandfiresthatcontributedmosttotheamountofareaburned(Straussandothers,1989;Stocksandothers,2002).AcomparisonoftheMTBSdatawiththeFederalwildlandfire-occurrencedatabase(U.S.DepartmentofInterior,2012)showedthattheMTBSlistedonly3percentofallwildlandfiresbutaccountedfor88percentoftheareaburnedintheEasternUnitedStates.Therefore,theresultsofthisassessmentcapturedthegeneralpatternsandtrendsofwildlandfiresintheEasternUnitedStates,butinalllikelihood,underestimatedwildlandfireemissions.
Inthisassessment,thebaselineandprojectedestimatesofareaburnedandemissionsalsodidnotincludetheinfluenceofprescribedandagriculturalfires(forexample,burningcropresidues);however,theemissionsproducedbythosetypesoffiresweresuspectedtobelowrelativetothewildlandfireemissions(Liu,2004;vanderWerfandothers,2010).Theinfluenceofprescribedfiresonemissionswasdifficulttoassessbecausethedatacharacterizingprescribedfiresweregenerallypoorbasedoninconsistentreportingaboutthemacrossthecountry.Theexistingestimatesofemissionsfromprescribedfiressuggestedthattheyproducedonly10percentoftheemissionsfromwildlandfires(Liu,2004),inpartbecauseprescribedfiresusuallyburnunderlessextrememeteorologicalconditionsthanwildlandfires.Theinfluenceofagriculturalfireswasalsoestimatedtobeabout10percentofthewildlandfireemissionsintheGFEDdatabase.
IntheEasternUnitedStates,therelativeamountofemissionsproducedbyprescribedandagriculturalfiresislikelytobemoresubstantialthaninotherpartsoftheUnitedStates,becauseagriculturalfiresarecommonintheregion(Korontziandothers,2006;Tulbureandothers,2011).PrescribedfiresintheEasternUnitedStates,especiallythoseintheSoutheast,accountedfor70percentoftheareaburnedbyprescribedfiresnationwide,andareaburnedbyprescribedfiresinthestudyareawasmorethan2.5timestheareaburnedbywildfires(basedon2002to2008datafromtheNationalInteragencyFireCenter,2012).Unfortunately,recordsformanyprescribedfiresarenotenteredintonational-leveldatabases,soaccuratedatacharacter-izingtheindividuallocationsofeachprescribedfirearenotavailable.IntheMTBSdatabase,theareaburnedbyprescribedfireswasonly18percentofthetotalareaburnedintheEasternUnitedStates.Becauseprescribedfiresburnunderlessextrememeteorologicalconditions,severityandemissionsareexpectedtobelowerthanwildfires(Liu,2004;OutcaltandWade,2004;vanderWerfandothers,2010).However,speculatingaboutthelocationsofprescribedfires,thefuelstheyburnthough,andtheconditionsunderwhichtheyburnwouldlikelyintroduceagreateramountofuncertaintyintotheemissionestimatesprovidedinthisassessment.Theseuncertaintieswillremaindifficulttoresolveuntilbetterinformationisavailableonthetimingandlocationofprescribedfires.
InspiteoftheuncertaintiesaboutthetimingandlocationofprescribedfiresintheEasternUnitedStates,emissionestimateshavebeenincludedintheEPA’sNationalGreenhouseGasEmissionsInventory(U.S.EnvironmentalProtectionAgency,2012)andcanprovidesomeindicationoftheimpactofprescribedfiresonemissions.TheEPAmethodsforwildlandandprescribedfireemissionsfocusonforestsandapplyemissionfactorstocarbonstock-changes.TheEPAestimatesfor2005,2007,and2008forwildfireemissionsaveraged144.3TgCO2-eq/yrandforprescribedemissionsaveraged20.3TgCO2-eq/yrfortheconterminousUnitedStates.Assumingthat70percentofprescribedfiresoccurintheEasternUnitedStates(NationalInteragencyFireCenter,2012),thenaverageannualemissionsfromprescribedfireswouldbe14.2TgCO2-eq/yr,avaluesubstantiallylargerthanthemedianwildfireemissionsfromthebaselineperiodofthisassessment(5.2TgCO2-eq/yr).However,theEPA’swildfireestimatesforthecontinentalUnitedStates(144.3TgCO2-eq/yr)arealsosubstantiallylargerthanthoseproducedforthisassessment,theGreatPlainsassessment(Zhuandothers,2011),andtheWesternassessment(HawbakerandZhu,2012),whichcollectivelyhadamedianvalueof56.0TgCO2-eq/yrandamaximumvalueof101.4TgCO2-eq/yr.
Throughoutthewildlandfiresimulations,vegetationandfuelsremainedstatic,whichintroducedsomelimitationsintotheassessment.Becauseofsuccessionanddisturbances(espe-ciallyanthropogenic,suchasLULCchange),thecompositionandstructureofvegetationmaychangesubstantiallyduringthe50-yearspanusedinthisassessment(Fosterandothers,1998;Gallantandothers,2004;Rhemtullaandothers,2009).

62 Baseline and Projected Future Carbon Storage and Greenhouse-Gas Fluxes in Ecosystems of the Eastern United States
Thesechangescouldresultinalteredsurfaceandcanopyfuelsthatinfluencewildlandfirebehaviorandemissions.Byholdinglanduse,vegetation,andfuelsstatic,theinteractionsamongwildlandfireandLULCchangewereoversimplified,whicharelimitationsthataresharedbymanybroad-scalestudiesofprojectedclimatechangeandwildlandfires.
Vegetationdynamicshaveoftenbeenignoredinclimate-changeprojectionsinpartbecauseofthedifficultyofparameterizingthesuccessionaltrajectoriesofeachindividualecosystemtypeandthelackofinformationabouthowecosystemsmayshiftacrossthelandscapeunderclimatechange.Theinfluencethatvegetationdynamicsmighthavehadontheresultsofthisassessmentisuncertain.Inspiteoftheprojectedincreasesinwildlandfireignitionsandareaburnedsimulatedforthisassessment,theextentoftheareaburnedeachyearwasprojectedtobequitesmallrelativetotheextentofareathatcouldpotentiallyburninanecoregion.Thus,intheecoregionsincludedinthisportionoftheassessment,itisunlikelythattheamountandarrangementofburnablevegetationonthelandscapewilllimitwildlandfires.Shiftsinvegetation,however,mightaffectthetypeofvegetationandtheamountoffuelavailabletoburn;thus,pastwildlandfiresandLULCchangemightalterthefuels,behavior,andemissionsoffuturewildlandfires(Bacheletandothers,2001,2003).
Specifically,intheEasternUnitedStatestheseprocessescouldincludethemesophicationofforestsinthemid-AtlanticthroughoutsouthernAppalachiathatisreducingunderstoryvegetationdensityandtheflammabilityoflitterfuels(NowackiandAbrams,2008).IntheSoutheasternUSAPlainsandtheMississippiAlluvialandSoutheastUSACoastalPlainsecore-gions,crownfireoccurrenceandwildlandfireemissionscouldpotentiallyincreasewithshiftsintheacreageofshort-rotationpineforests,withlittlefiremanagement.DefoliationandmortalityfollowinginsectoutbreakscanaffectsubstantialareasintheEasternUnitedStates.TheeffectsofinsectoutbreaksoncarboncyclingintheEasternUnitedStatescouldincludeshort-termdecreasesinprimaryproductivityandincreasesinrespirationthroughaltereddecompositionrates(Hickeandothers,2012).However,theeffectsofinsectdisturbancesoncarboncyclingatecoregionalscalesarenotwellunderstood,andmodelstopredictwherefutureoutbreaksarelikelyarenotcurrentlyavailable,thustheeffectsofinsectdisturbanceswerenotincorporatedintothisassessment.Theseprocessesandvegetationdynamicsintotheecosystem-disturbancemodelcomponentshouldbeconsideredforincorporationintofuturecarbonassessments(Running,2008;Goetzandothers,2012).
4.4. ResultsResultsforthebaselineandfuturepotentialprojections
ofwildlandfireoccurrenceandemissionsarepresentedusingsummarystatisticsofthemedianand95thpercentilevalues.Thesewereassumedtorepresenttypicalandextremefireyearsrespectively.
4.4.1. Baseline Wildland Fires and Emissions
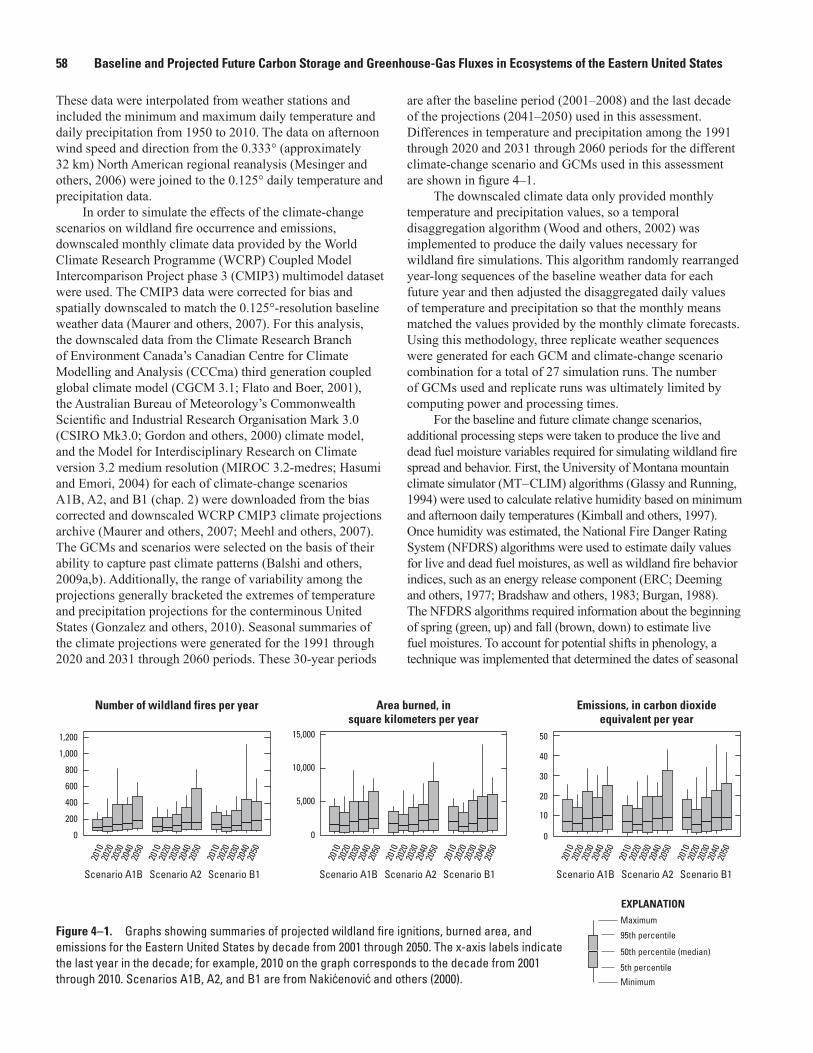
Duringthebaselineperiod(2001–2008)intheEasternUnitedStates,thenumberofwildlandfiresperyearinatypicalfireyearwas112,butyear-to-yearvariabilitywashigh,andasmanyas186wildfiresoccurredduringextremefireyears(fig.4–2;table4–1).Theareaburnedbywildfiresinatypicalfireyearwas1,355km2,butwasmorethantwicethatinextremefireyears(4,092km2).Annualemissionsfromwildfireswere5.2teragramsofcarbondioxideequivalent(TgCO2-eq)duringtypicalfireyears,butmorethanfourtimesthatamountinextremefireyears(17.3TgCO2-eq).
Combined,theMixedWoodShieldandMixedWoodPlainsecoregionshadtheleastamountoffireactivityamong
2001 2002 2003Year
2004 2005 2006 2007 2008
0
50
150
200
100
0
2,000
1,000
4,000
3,000
5,000
0
5
10
15
20
25
Figure 4–1.
Num
ber o
f wild
fires
Area
bur
ned,
in s
quar
e ki
lom
eter
sEm
issi
ons,
in te
ragr
ams
ofca
rbon
dio
xide
equ
ival
ent
Figure 4 –2. Graphs showing the annual number of wildland fires, area burned, and emissions for the baseline (2001–2008) period of the carbon flux and storage assessment of the Eastern United States.
Chapter 4 63
Table 4–1. Summary statistics for the number of wildland fires, area burned, and emissions.
MetricMixed Wood Shield
and Mixed Wood Plains
Southeastern USA Plains
Ozark, Ouachita- Appalachian Forests
Mississippi Alluvial and Southeast USA
Coastal Plains1
Eastern United States
Number of wildfires per yearMean 9 17 37 58 121Minimum 1 2 13 24 60Median 9 10 41 49 11295thpercentile 17 49 54 97 186Maximum 18 57 59 110 200
Area burned, in square kilometers per yearMean 173 137 311 1,225 1,851Minimum 3 21 60 499 974Median 81 52 382 746 1,35595thpercentile 497 417 462 3,164 4,092Maximum 523 526 470 4,035 5,048
Emissions, in teragrams of carbon dioxide equivalent per yearMean 2.0 0.3 0.8 4.2 7.3Minimum 0.0 0.0 0.2 0.6 2.9Median 1.2 0.1 0.9 2.8 5.295thpercentile 5.8 1.0 1.3 11.9 17.3Maximum 6.0 1.3 1.3 15.6 22.3
1IncludestheEvergladesandTexas-LouisianaCoastalPlainlevelIIecoregionsfortheanalysisofthisassessment.
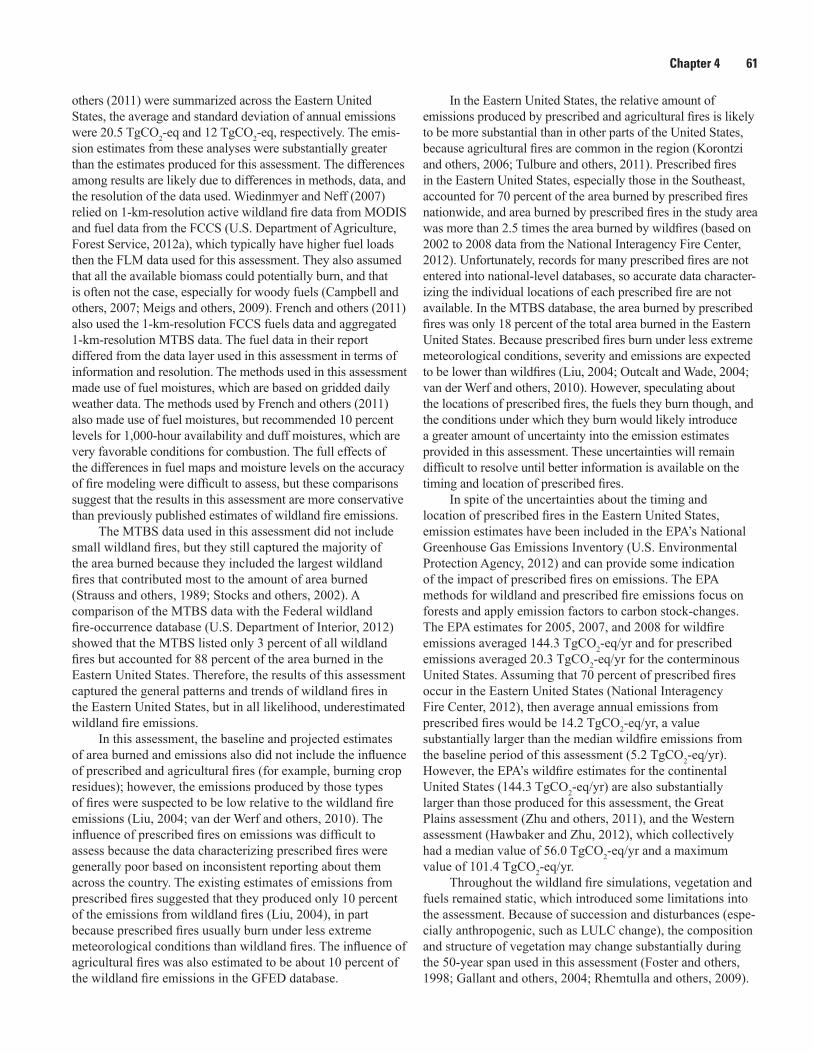
thefourecoregionsanalyzedintheEasternUnitedStates(fig.4–3A;table4–1).Themediannumberofwildfiresperyearwas9,andthe95thpercentileofwildfiresperyearwas17.Areaburnedduringtypicalfireyearswas81km2andwasashighas497km2inextremefireyears.Emissionswereverylowat1.2TgCO2-eq/yrinatypicalfireyear.However,inspiteofhavingtheleastamountofwildfiresandareaburned,emissionsduringextremefireyearswererelativelyhighinthisecoregionat5.8TgCO2-eq/yr.
IntheSoutheasternUSAPlainsecoregion,themedianvaluesforwildfireoccurrence,areaburned,andemissionswere10wildfiresperyear,52km2/yr,and0.1TgCO2-eq/yr,respectively(fig.4–3B;table4–1).Thenumberofwildfires,areaburned,andemissionsweremuchgreaterduringextremefireyearsat49wildfiresperyear,417km2/yr,and1TgCO2-eq/yr,respectively.
FireoccurrenceintheOzark,Ouachita-AppalachianForestsecoregionduringtypicalfireyearswasgreaterthanintheSoutheasternUSAPlains,MixedWoodShield,andMixedWoodPlainsecoregions(fig.4–3C;table4–1).Thenumberofwildfires,areaburned,andemissionswere41peryear,382km2/yr,and0.9TgCO2-eq/yr,respectively.Ratesofwild-fireoccurrenceandemissionswerenotsubstantiallydifferentduringextremefireyearswhenthenumberofwildfires,areaburned,andemissionswere54peryear,462km2/yr,and1.3TgCO2-eq/yr,respectively.
AmongthefourecoregionsoftheEasternUnitedStates,theMississippiAlluvialandSoutheastUSACoastalPlainsecoregionhadthegreatestnumberofwildfires,areaburned,andemissions(fig.4–3D;table4–1).Duringtypicalfireyears,thenumberofwildfires,areaburned,andemissionswere49peryear,746km2/yr,and2.8TgCO2-eq/yr,respectively.Duringextremefireyears,therewerenearlytwiceasmany
wildfires(97peryear),withmorethanfourtimesasmuchareaburned(3,164km2/yr)andemissions(11.9TgCO2-eq/yr).
4.4.2. Climate-Change Trends in the Eastern United States
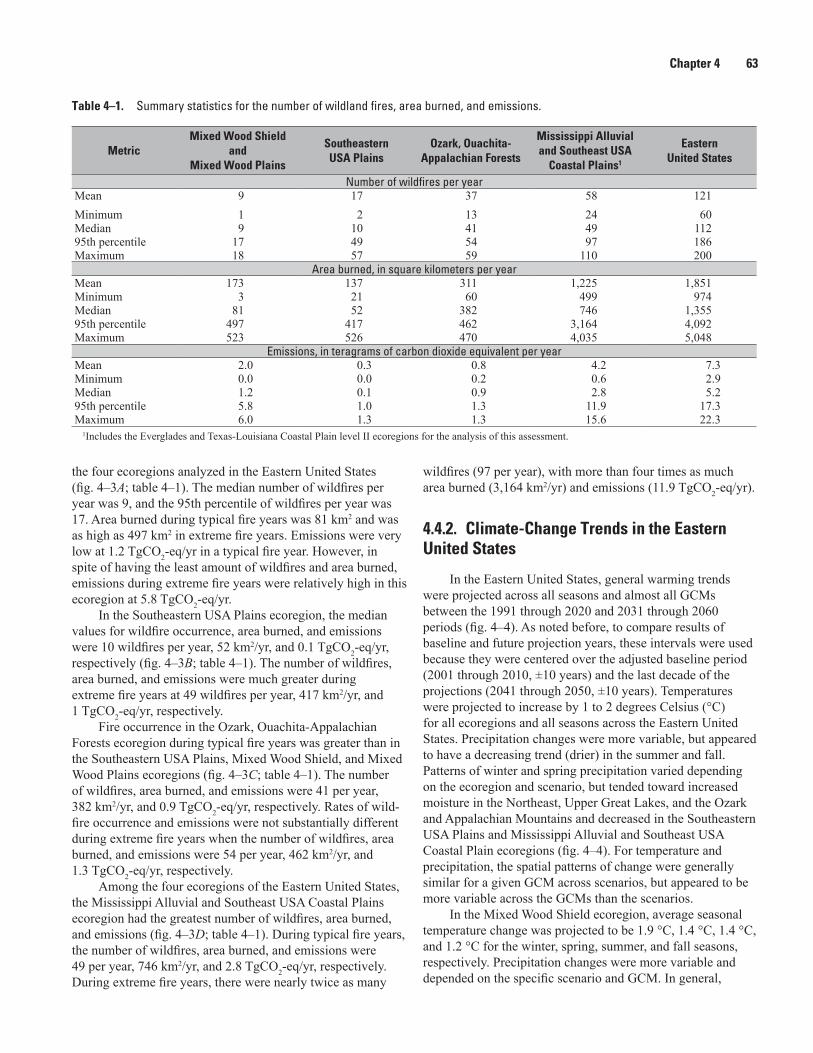
IntheEasternUnitedStates,generalwarmingtrendswereprojectedacrossallseasonsandalmostallGCMsbetweenthe1991through2020and2031through2060periods(fig.4–4).Asnotedbefore,tocompareresultsofbaselineandfutureprojectionyears,theseintervalswereusedbecausetheywerecenteredovertheadjustedbaselineperiod(2001through2010,±10years)andthelastdecadeoftheprojections(2041through2050,±10years).Temperatureswereprojectedtoincreaseby1to2degreesCelsius(°C)forallecoregionsandallseasonsacrosstheEasternUnitedStates.Precipitationchangesweremorevariable,butappearedtohaveadecreasingtrend(drier)inthesummerandfall.Patternsofwinterandspringprecipitationvarieddependingontheecoregionandscenario,buttendedtowardincreasedmoistureintheNortheast,UpperGreatLakes,andtheOzarkandAppalachianMountainsanddecreasedintheSoutheasternUSAPlainsandMississippiAlluvialandSoutheastUSACoastalPlainecoregions(fig.4–4).Fortemperatureandprecipitation,thespatialpatternsofchangeweregenerallysimilarforagivenGCMacrossscenarios,butappearedtobemorevariableacrosstheGCMsthanthescenarios.
IntheMixedWoodShieldecoregion,averageseasonaltemperaturechangewasprojectedtobe1.9°C,1.4°C,1.4°C,and1.2°Cforthewinter,spring,summer,andfallseasons,respectively.PrecipitationchangesweremorevariableanddependedonthespecificscenarioandGCM.Ingeneral,

64 Baseline and Projected Future Carbon Storage and Greenhouse-Gas Fluxes in Ecosystems of the Eastern United States
20
15
10
5
0
60
50
40
30
20
10
0
60
50
40
30
20
10
0
600
500
400
300
200
100
0
600
500
400
300
200
100
0
1.4
1.2
1.0
0.8
0.6
0.4
0.2
0
0
40
20
80
60
120
100
0
2,000
5,000
4,000
3,000
1,000
20
15
10
5
0
1.4
1.2
1.0
0.8
0.6
0.4
0.2
0
B. Southeastern USA Plains
C. Ozark, Ouachita−Appalachian Forests
D. Mississippi Alluvial and Southeast USA Coastal Plains
2001 2002 2003Year
2004 2005 2006 2007 2008 2001 2002 2003Year
2004 2005 2006 2007 2008 2001 2002 2003Year
2004 2005 2006 2007 2008
Figure 4–2.
A. Mixed Wood Shield and Mixed Wood Plains
Number of wildfires Area burned,in square kilometers
Emissions, in teragrams ofcarbon dioxide equivalent
600
500
400
300
200
100
0
7
6
5
4
3
2
1
0
Figure 4 –3. Graphs showing the annual number of wildland fires, area burned, and emissions for the baseline (2001–2008) period for the A, Mixed Wood Shield and Mixed Wood Plains, B, Southeastern USA Plains, C, Ozark, Ouachita-Appalachian Forests, and D, Mississippi Alluvial and Southeast USA Coastal Plains ecoregions (U.S. Environmental Protection Agency, 2013a) in the Eastern United States.
Chapter 4 65
Temperature change
Scenario A1B
Precipitation change
Scenario A2
Scenario B1
Winter Spring Summer Fall
CCCM
A CG
CM 3
.1CS
IRO
Mk
3.0
MIR
OC 3
.2 (m
edre
s)CC
CMA
CGCM
3.1
CSIR
O M
k 3.
0M
IROC
3.2
(med
res)
CCCM
A CG
CM 3
.1CS
IRO
Mk
3.0
MIR
OC 3
.2 (m
edre
s)
Winter Spring Summer Fall
Temperature change, in degrees Celsius Precipitation change, in centimeters
–1 0 1 2 3 4 8 –5–7.5 –2.5 –0.5 0 0.5 2.5 5 7.5
EXPLANATION
Figure 4.3.Figure 4 –4. Maps showing the projected changes in mean daily temperature and total precipitation by season, calculated using the difference in mean values from 2031 through 2060 and from 1991 through 2021. Climate data are from Maurer and others (2007). Scenarios A1B, A2, and B1 are from Nakićenović and others (2000). CCCMA CGCM 3.1, Canadian Centre for Climate Modelling and Analysis third generation coupled global climate model; CSIRO Mk 3.0, Commonwealth Scientific and Industrial Research Organisation Mark 3.0; MIROC 3.2 (medres), Model for Interdisciplinary Research on Climate version 3.2 medium resolution.
66 Baseline and Projected Future Carbon Storage and Greenhouse-Gas Fluxes in Ecosystems of the Eastern United States
winterandspringseasonswereprojectedtohaveincreasesinprecipitationof0.5cmand2.4cm,respectively.Precipitationdecreasedinthesummerseasonby0.5cm,andfallprecipita-tionchangedlittle.
WarmingtrendswerealsoprojectedbymostscenariosandGCMsintheSoutheasternUSAPlainsecoregion.Averagewinter,spring,summer,andfalltemperatureswere1°C,1.3°C,1.4°C,and1.3°C,respectively,greaterinthe2031through2050periodthantheywereinthe1991through2020period.Winterandspringprecipitationdecreasedby1.1cmand1.9cm,respectively.SummerandfallprojectionsweremoremixeddependingontheGCMandscenario.Averagesummerprecipitationdecreasedby0.9cm,butaveragefallprecipitationincreasedslightlyby0.3cm.
SimilartotheSoutheasternUSAPlainsecoregion,temperaturechangesintheOzark,Ouachita-AppalachianForestsecoregionincreasedtheleastinwinter(1.2°C)andthemostinspring(1.4°C),summer(1.5°C),andfall(1.3°C).Inallseasons,theGCMsandscenarioswereevenlysplitwithabouthowprecipitationwouldchange:abouthalfofthesimulationsprojecteddrierconditions,andhalfprojectedwetterconditions.WhentheprecipitationchangeprojectionswereaveragedacrossGCMsandscenarios,winterprecipita-tiondecreasedminimallyby0.04cm,springprecipitationdecreasedby0.5cm,summerprecipitationdecreasedby0.9cm,andfallprecipitationincreasedslightlyby0.3cm.
ProjectedchangesintemperaturefortheMississippiAlluvialandSoutheastUSACoastalPlainsecoregionwerethesmallestamongallecoregionsintheEasternUnitedStates.Winter,spring,summer,andfalltemperatureswereprojectedtoincreaseby0.9°C,1.2°C,1.3°C,and1.2°C,respectively,betweenthe1991through2020and2031through2050periods.Precipitationchangeswereconsistentlydrierinthewinterandspringseasons(decreasesof1.4cmand2.5cm,respectively)andtosomeextentinthesummerseason(decreaseof1.6cm),butprecipitationincreasedslightlyinthefallseason(0.6cm).
high-andlow-densityurbanareas,golfcourses,urbanparks,andhighways),publiclands,and(or)areaofwildlandvegeta-tionandagriculturewereoftenincludedaspredictorstoo.Whenincluded,developedlandandagriculturehadnegativerelationshipswithwildfireignitionprobability,andpubliclandsandwildlandvegetationareahadpositiverelationshipswithignitionprobability.
CalibrationsimulationswererunforeachlevelIIIecoregiontoensurethatthepatternsofwildlandfireoccur-rencefrom1984through2008couldbereproduced.Foralltheecoregions,therewasnosignificantdifferenceintheaverageannualburnedareabetweenthecalibrationsimulationandtheobservedvaluesfromtheMTBSdatabase,assumingthatdifferenceswerenotsignificantwhenap-valueof0.05orgreaterwascalculatedusingatwo-sidedt-testthatassumedunequalvariance.Afterthecalibrationprocess,thesimulatedwildlandfireswereallowedtospreadbetween4to24hoursperday,andtheburndurationsrangedfrom1to6days,dependingontheecoregion.
FortheentireEasternUnitedStatesandacrossalltheclimate-changescenarios,theprojectionsimulationsresultedinanincreaseinwildlandfireignitions,areaburned,andemissionsbetweenthefirst(2001–2010)andlast(2041–2050)decades(fig.4–1;table4–2).Intypicalfireyears,themediannumberofignitionswasprojectedtoincrease,rangingfrom36percentunderscenarioB1to42percentunderscenarioA2and75percentunderscenarioA1B.Theareaburnedwasprojectedtoincrease,rangingfroma17percentincreaseinscenarioB1toa51percentincreaseinscenarioA1B.Wildlandfireemissionsfollowedsimilarpatterns,withprojectedincreasesof41percentunderscenarioA1B,25percentunderscenarioA2,and1percentunderscenarioB1.However,thechangesinmedianareaburnedandemissionswerenotstatisticallysignificantata0.05αlevelunderscenarioB1.CharacteristicsofscenariosA1B,A2,andB1areprovidedinchapter2.
Thesimulatedchangesinignitions,areaburned,andemissionsweresignificantlygreaterinextremefireyears(95thpercentile);acrosstheEasternUnitedStates,ignitionswereprojectedtoincreaseby45to153percent,theareaburnedwasprojectedtoincreaseby43to122percent,andemissionswereprojectedtoincreaseby41to111percent(fig.4–1;table4–2).Therateofchangewasgenerallynonlinear,andthegreatestincreasesinignitions,areaburned,andemissionswereprojectedin2021to2030forscenarioA1B,2041to2050inscenarioA2,and2031to2040inscenarioB1.
Therewasalargeamountofvariabilityintheprojectionsoffuturepotentialwildfires,areaburned,andemissionsintheMixedWoodShieldandMixedWoodPlainsecoregions(fig.4–5A;table4–2)andnotallthechangeswerestatisticallysignificantlydifferentfromzero.Ignitionsincreasedbyasmuchas71percentduringtypicalfireyearsandasmuchas43percentduringextremefireyears.Areaburnedandemissionsdidnotnecessarilyincreaseeventhoughignitionsdidunderallscenarios.Duringtypicalfireyears,thechange
4.4.3. Projected Future Wildland Fires and Emissions
GLMswerefittoeachlevelIIIecoregionandusedtogeneratedailyignitionprobabilitiesinthesimulations.Ingeneral,themodelfitsweregoodwiththeAUCvaluesaveraging0.87andrangingfrom0.72to0.93.ThebestmodelfitswereinthelevelIIIecoregionswithintheOzark,Ouachita-AppalachianForestsandtheworstmodelfitwasfortheSouthernFloridaCoastalPlainlevelIIIecoregion(reportedwiththeMississippiAlluvialandSoutheastUSACoastalPlainsecoregioninthisreport).Mostmodelsincludedtheenergyreleasecomponent(ERC)or10-or100-hourdeadfuelmoisturesasapredictoraswellasmonthlyandseasonalweathersummaries(whichcapturedseasonalandyear-to-yearvariability).Mostecoregionsalsoincludedatleastonevegetationpredictor.Developedland(whichincluded

Chapter 4 67
0
20
40
30
10
A. Mixed Wood Shield and Mixed Wood Plains
0
200
100
300
400
500
0
4
8
2
6
0
40
80
20
60
B. Southeastern USA Plains
0
400
800
200
6001.0
1.5
0.5
0
0
400
200
1,000
800
600
C. Ozark, Ouachita−Appalachian Forests
0
6,000
4,000
2,000
12,000
10,000
8,000
0
20
40
10
30
0
100
200
50
150
D. Mississippi Alluvial and Southeast USA Coastal Plains
0
3,000
2,000
1,000
7,000
6,000
5,000
4,000
0
20
10
30
2010
2020
2030
2040
2050
2010
2020
2030
2040
2050
2010
2020
2030
2040
2050
2010
2020
2030
2040
2050
2010
2020
2030
2040
2050
2010
2020
2030
2040
2050
2010
2020
2030
2040
2050
2010
2020
2030
2040
2050
2010
2020
2030
2040
2050
Scenario A1B Scenario A2 Scenario B1 Scenario A1B Scenario A2 Scenario B1 Scenario A1B Scenario A2 Scenario B1
Figure 4–5.
Number of wildland fires per year Area burned, insquare kilometers per year
Emissions, in carbon dioxideequivalent per year
5th percentile
Minimum
95th percentile
50th percentile (median)
Maximum
EXPLANATIONFigure 4 – 5. Graphs showing summaries of projected wildland fire ignitions, burned area, and emissions for the A, Mixed Wood Shield and Mixed Wood Plains, B, Southeastern USA Plains, C, Ozark, Ouachita-Appalachian Forests, and D, Mississippi Alluvial and Southeast USA Coastal Plains ecoregions (U.S. Environmental Protection Agency, 2013a) by decade from 2001 through 2050. The x-axis labels indicate the last year in the decade; for example, 2010 on the graph corresponds to 2001 through 2010. Scenarios A1B, A2, and B1 are from Nakićenović and others (2000).

68 Baseline and Projected Future Carbon Storage and Greenhouse-Gas Fluxes in Ecosystems of the Eastern United States
intheamountofareaburnedrangedasmuchas234percentinscenarioA2,andinemissions,asmuchas246percentinscenarioA2.Thelargeamountofchangeislikelyanartifactofthesmallamountofareaburnedandemissionsduringthebaselineperiod(5km2and0.04TgCO2-eq,respectively),sothatevensmallincreasesresultedinlargerelativechange.Theprojectedchangesforignitions,areaburned,andemissionswerelessinextremefireyearsthanintypicalfireyearsandweremostlynotstatisticallysignificant.Ignitionsincreasedbyasmuchas43percent,areaburnedchangedbyasmuchas65percent,andemissionschangedbyasmuchas26percent,butonlychangesinignitionsunderscenarioA2werestatisti-callysignificant.
IntheSoutheasternUSAPlainsecoregion,projectedchangeswereonlystatisticallysignificantfortypicalfireyearsunderscenarioA1B(fig.4–5B;table4–2),duringwhichignitionsincreasedbyasmuchas40percent,burnedareaincreasedbyasmuchas36percent,andemissionsincreasedbyasmuchas72percent.Projectedchangesforthenumberofwildfires,areaburned,andemissionswerenotstatisticallysignificantforscenarioA1BforextremefireyearsandforscenariosA2andB1fortypicalandextremefireyears.
TheOzark,Ouachita-AppalachianForestsecoregionexperiencedthegreatestamountofchangeintheEasternUnitedStatesinfireoccurrenceandemissionsintypicalandextremefireyears,andthealltheprojectedchangesweresubstantial(fig.4–5C;table4–2).Thenumberofignitionswasprojectedtochangeby56to123percentintypicalfire
yearsand55to207percentinextremefireyears.Projectedchangesinburnedareaweresimilarandincreasedby66to133percentintypicalfireyearsand49to197percentinextremefireyears.Changesinemissionslargelyfollowedchangesinburnedareaandincreasedby64to132percentintypicalfireyearsand48to209percentinextremefireyears.
ProjectedchangesinfireoccurrenceandemissionsintheMississippiAlluvialandSoutheastUSACoastalPlainsecore-giongenerallyincreased(fig.4–5D;table4–2).Decreaseswereprojectedundersomeclimate-changescenarios,butwerenotstatisticallysignificant.Intypicalfireyears,theamountsofchangerangedbyasmuchas30percentforignitions,47percentforareaburned,and36percentforemissions.ThedecreasesoccurredunderscenarioB1,andincreaseswereprojectedforscenariosA1BandA2.Inextremefireyears,fireoccurrenceandemissionsincreasedunderallscenarios.Changesrangedbyasmuchas51percentforignitions,55percentforareaburned,and67percentforemissions.
4.4.4. Summary of Wildland Fire Occurrence and Emissions of Carbon Fluxes
From2001through2008,wildlandfireactivityintheEasternUnitedStateswaslesssubstantialthanotherregionsoftheUnitedStates.Largewildlandfiresnumberedbetween60and200peryearandburned974to5,048km2eachyear.ThesewildlandfiresintheEasternUnitedStates
Table 4–2. Relative projected changes in the 50th and 95th percentiles for wildfire ignitions, area burned, and emissions between 2001–2010 and 2041–2050.
Scenario MetricMixed Wood Shield
and Mixed Wood Plains
Southeastern USA Plains
Ozark, Ouachita- Appalachian Forests
Mississippi Alluvial and Southeast USA
Coastal Plains1
Eastern United States
Percentage of number of wildfires per yearA1B Median 50* 40* 123* 26* 75*A2 Median 71* 18 64* 30* 42*B1 Median 20 8 56* 12 36*A1B 95thpercentile 5 15 198* 41* 141*A2 95thpercentile 43* 28 207* 51* 153*B1 95thpercentile 16 42 55* 25* 45*
Percentage of area burned per yearA1B Median –10 36* 133* 47* 51*A2 Median 234* 27 66* 12 34*B1 Median 79 –4 70* –2 17A1B 95thpercentile –2 –16 162* 19 52*A2 95thpercentile 65* –9 197* 55* 122*B1 95thpercentile 1 –5 49* 22 43*
Percentage of emissions per yearA1B Median 9 72* 132* 36* 41*A2 Median 246* 20 64* 9 25*B1 Median 127 2 70* –17 1A1B 95thpercentile –16 –8 209* 10 41*A2 95thpercentile 26 5 164* 67* 111*B1 95thpercentile 20 –12 48* 12 45*
1IncludestheEvergladesandTexas-LouisianaCoastalPlainlevelIIecoregionsfortheanalysisofthisassessment.
*Changewassignificantat0.05alphalevelsinpermutationtests.

Chapter 4 69
represented23percentofallwildlandfiresthatoccurredintheconterminousUnitedStatesfrom2001through2008andaremappedintheMTBSdatabaseandaccountedfor10percentofalltheareaburned.Themedianofannualemissionswas5.2TgCO2-eq/yr,whichwasequivalentto0.48percentofNEP(chap.5).Theinterannualvariabilityinemissionswashighandrangedfrom2.9to22.3TgCO2-eqintheEasternUnitedStates,whichwasequivalentto0.27to2.05percentofNEP.In2010,themedianofannualwildfireemissionswas5,594TgCO2-eq/yr,equivalentto0.09percentofnationwidefossil-fuelemissions(U.S.EnvironmentalProtectionAgency,2012);minimumwildfireemissionswere0.13percentandmaximumwildfireemissionswere0.40percentofthenationwidefossil-fuelemissions.TherelativecontributionofwildlandfiresoftheEasternUnitedStatestonationwidegreenhouse-gasemissionswassmallwhencomparedthatofotherregionsoftheUnitedStates(Zhuandothers,2010;HawbakerandZhu,2012)andtothecontributionoffossil-fuelemissions.
Wildlandfireignitionsandareaburnedwereprojectedtoincreaseacrossalltheclimate-changescenariosfortheEasternUnitedStatesasawhole,andthechangeswerelargerforextremefireyearsthanfortypicalfireyears.TheannualamountofareaburnedbywildfiresintheEasternUnitedStateswasprojectedtoincreasebyasmuchas51percentfrom1,355km2intypicalfireyearsandasmuchas122percentfrom4,092km2inextremefireyears.Theprojectedchangesinburnedarearesultedinsimilarchangesinemissions,whichincreasedbyasmuchas41percentfrom5.2TgCO2-eqintypicalfireyearsandbetween41and111percentfrom17.3TgCO2-eqinextremefireyears.Thesechangesweredrivenbytheinfluenceofclimatechangeonliveanddeadfuelmoisturelevels,whichinturnhadalargeinfluenceonignitionprobabilities,firespread,fuelconsumption,andemissions.
Themagnitudeanddirectionofchangeofthewildfireprojectionsvariedamongecoregionsandclimate-changescenarios.Theonlyecoregionthathadconsistentincreasesinthenumberofwildfires,areaburned,andemissionsacross
allclimate-changescenarioswastheOzark,Ouachita-AppalachianForestsecoregion.TheMixedWoodShieldandMixedWoodPlainsecoregionsprojectedincreasesinignitionsunderallscenariosandincreasesinareaburnedandemissionsunderscenariosA2andB1,butnotforscenarioA1Bwhereprecipitationprojectionssuggestedawetterclimate.TheSoutheasternUSAPlainsecoregionhadmixedresults,withtypicalfireyearsexperiencingmostlyincreasesinignitions,areaburned,andemissions,butwithextremefireyearsexperiencingdecreasesinareaburnedandemissions.TheMississippiAlluvialandSoutheastUSACoastalPlainsecore-gionexperiencedincreasesinfireoccurrenceandemissionsunderscenariosA1BandA2,butnotunderscenarioB1.
Inthisstudyarea,wildfireemissionswererelativelylowcomparedwithcarbonsequesteredinterrestrialecosystems(chap.5),butthisdoesnotnecessarilymeanthatwildfiresdonothaveimportanteffectsoncarbonbalanceintheEasternUnitedStates.Instead,thelargesteffectsofwildfiresoncarbonbalanceintheEasternUnitedStatesmightbelocal-izedtospecificecosystemsthatcurrentlyhavehighcarbonstorage,butareatriskoflosingcarbonbecauseofincreasedfireactivitiesoralteredfirebehavior.TheseecosystemsmayincludepocosinwetlandswithdeeppeatdepositsalongtheAtlanticcoast(MessinaandConner,1998),southernborealforestsalsowithdeeppeatdepositsandhighfuelloadsintheUpperGreatLakes(Heinselman,1973),pinebarrensintheUpperGreatLakesandNewJersey(Forman,1998;Radeloffandothers,2000),andpineforestsintheSoutheasternUSACoastalPlains(Christensen,1999).Managementeffortsdesignedtomaintainorincreasecarbonstorageintheseecosystemsmaybechallengedbythepotentialcarbonlossesduetotheprojectedclimate-drivenincreasesinwildlandfireactivities.InotherecosystemsintheEasternUnitedStates,wildfireplaysasmallerroleincarboncycling,andothernaturaldisturbancesmaybemoreimportant,forexample,windthrow(CanhamandLoucks,1984;FrelichandLorimer,1991)andanthropogenicLULCchange(chap.3).

Top Related