


Languages
Pages
Legal

1
Widely used commercial ELISA does not detect preHP-2, but recognizes 1
properdin as a potential second member of the zonulin family 2
Running Title: Commercial ELISA for human zonulin detects also properdin 3
4
Lucas Scheffler1, Alyce Crane1, Henrike Heyne1, Anke Tönjes2, Dorit Schleinitz1, Christian 5
H. Ihling3, Michael Stumvoll2, Rachel Freire4, Maria Fiorentino4, 6
Alessio Fasano4, Peter Kovacs1*, John T. Heiker5* 7
8 1Leipzig University Medical Center, IFB Adiposity Diseases, Leipzig, Germany; 2Divisions 9 of Endocrinology and Nephrology, University of Leipzig, Leipzig, Germany; 3Department of 10 Pharmaceutical Chemistry and Bioanalytics, Institute of Pharmacy, Martin-Luther-University 11 Halle-Wittenberg, Halle, Germany; 4Mucosal Immunology And Biology Research Center, 12 Massachusetts General Hospital – Harvard Medical School, Boston, MA U.S.A.; 5Institute of 13 Biochemistry, Faculty of Biosciences, Pharmacy and Psychology, University of Leipzig, 14 Leipzig, Germany 15 16
*Corresponding authors: 17 18 E-mail: [email protected] 19 20 E-mail: [email protected] 21 22 23 24 Keywords: diabetes - lipid metabolism - pre-Haptoglobin 2 - ELISA - intestinal permeability 25 - properdin – obesity – metabolic diseases 26 27 Nonstandard abbreviations: HP, haptoglobin; T2D, type 2 diabetes; WHR, waist-to-hip 28 ratio. 29
.CC-BY-ND 4.0 International licenseIt is made available under a (which was not peer-reviewed) is the author/funder, who has granted bioRxiv a license to display the preprint in perpetuity.
The copyright holder for this preprint. http://dx.doi.org/10.1101/157578doi: bioRxiv preprint first posted online Jun. 30, 2017;

2
Abstract 30
BACKGROUND. There is increasing evidence for the role of impaired intestinal 31
permeability in obesity and associated metabolic diseases. Zonulin is an established serum 32
marker for intestinal permeability and identical to pre-haptoglobin2. Here, we aimed to 33
investigate the relationship between circulating zonulin and metabolic traits related to obesity. 34
METHODS. Serum zonulin was measured by using a widely used commercial ELISA kit in 35
376 subjects from the metabolically well-characterized cohort of Sorbs from Germany. In 36
addition, haptoglobin genotype was determined in DNA samples from all study subjects. 37
RESULTS. As zonulin concentrations did not correlate to the haptoglobin genotypes, we 38
investigated the specificity of the zonulin ELISA assay using antibody capture experiments, 39
mass spectrometry and Western blot analysis. Using serum samples that gave the highest or 40
lowest ELISA signals, we detected several proteins that are likely to be captured by the 41
antibody in the present kit. However, none of these proteins corresponds to pre-haptoglobin2. 42
We used increasing concentrations of recombinant pre-haptoglobin 2 and complement C3 as 43
one of the representative captured proteins and the ELISA kit did not detect either. Western 44
blot analysis using both the polyclonal antibodies used in this kit and monoclonal antibodies 45
rose against zonulin showed a similar protein recognition pattern but with different intensity 46
of detection. The protein(s) measured using the ELISA kit was (were) significantly increased 47
in patients with diabetes and obesity and correlated strongly with markers of the lipid and 48
glucose metabolism. Combining mass spectrometry and Western blot analysis using the 49
polyclonal antibodies used in the ELISA kit, we identified properdin as another member of 50
the zonulin family. 51
CONCLUSIONS. Our study suggests that the zonulin ELISA does not recognize pre-52
haptoglobin 2, rather structural (and possibly functional) analogue proteins belonging to the 53
mannose-associated serine protease family, with properdin being the most likely possible 54
candidate. 55
.CC-BY-ND 4.0 International licenseIt is made available under a (which was not peer-reviewed) is the author/funder, who has granted bioRxiv a license to display the preprint in perpetuity.
The copyright holder for this preprint. http://dx.doi.org/10.1101/157578doi: bioRxiv preprint first posted online Jun. 30, 2017;
3
Introduction 56
The “intestinal barrier” is an established term, defined as a functional entity separating the gut 57
lumen from the inner host, and consisting of mechanical, humoral, immunological, muscular 58
and neurological elements. Intestinal barrier dysfunction is a characteristic feature of 59
pathological states such as inflammatory bowel disease, celiac disease, nonalcoholic 60
steatohepatitis and ulcerative colitis (1, 2). There is also emerging evidence for the role of 61
impaired intestinal permeability in metabolic diseases including obesity and type 2 diabetes 62
(T2D) (3–5). It has been hypothesized that gut bacteria and bacterial endotoxins may disrupt 63
the intestinal barrier resulting in the so called “leaky gut” (4, 6). The leakage of toxins, 64
bacterial components or even live bacteria and their transfer to target organs such as adipose 65
tissue might contribute to the development of obesity and T2D (6, 7). Indeed, numerous 66
studies in mouse models have demonstrated that changes in the gut microbiota can alter the 67
gut permeability and lead to an endotoxemia-induced inflammation in adipose tissue, and 68
ultimately to obesity (3, 8, 9). Results from experimental mouse models are supported by 69
studies in humans by showing an increase in circulating endotoxin levels and circulating 70
bacterial DNA in obese/diabetic patients, likely due to an increased intestinal permeability in 71
affected subjects (10, 11). 72
Intestinal barrier transport is mainly regulated by structures of the paracellular pathway called 73
tight junctions which form barriers between epithelial cells and regulate the transport of ions 74
and small molecules across the intestinal lumen. Intestinal permeability is a functional feature 75
of the intestinal barrier. It can be measured by analyzing flux rates of inert molecules across 76
the intestinal wall as a whole or across wall components (1). The gold standard for assessment 77
of intestinal permeability in vivo is an assay combining indigestible large and small 78
oligosaccharides, such as lactulose and mannitol; the larger oligosaccharide, lactulose, is only 79
transported via the paracellular pathway, whereas the smaller oligosaccharide, mannitol, is 80
taken up freely over the intestinal barrier via the transcellular route. However, these 81
.CC-BY-ND 4.0 International licenseIt is made available under a (which was not peer-reviewed) is the author/funder, who has granted bioRxiv a license to display the preprint in perpetuity.
The copyright holder for this preprint. http://dx.doi.org/10.1101/157578doi: bioRxiv preprint first posted online Jun. 30, 2017;
4
oligosaccharide assays are expensive, laborious, poorly reproducible, and time consuming. 82
Therefore, identifying appropriate biomarkers for intestinal permeability is highly desirable. 83
Zonulin has been identified as a tight junction regulating protein which is, functionally, the 84
human counterpart of the Vibrio cholera endotoxin zonula occludens toxin (12, 13). Precisely, 85
subsequent studies recognized zonulin as the precursor of haptoglobin 2 (pre-HP2) (14). 86
Haptoglobin is a well-known protein involved in scavenging hemoglobin, whereas the 87
function of its precursor is largely unknown. Haptoglobin is first synthesized into a single 88
chain precursor protein, which is cleaved into a light N-terminal α-chain and heavy C-89
terminal β-chain. An exon duplication of exons 3 and 4 of the haptoglobin gene differentiates 90
the HP1 from the HP2 allele. Due to this exon duplication the HP2 α-chain is 1.7kb longer 91
than in the HP1 allele. Haptoglobin is active as tetramer consisting of 2 α- and 2 β-chains 92
linked by disulfide bonds, resulting in three possible genotypes: homozygous HP1/1 and 93
HP2/2 as well as heterozygous HP1/2 (15, 16). About 15 % of the Caucasian population is 94
homozygous for HP (16, 17). Zonulin as pre-HP2 reversibly opens tight junctions and is 95
upregulated in diseases such as celiac disease and type 1 diabetes (T1D) (14, 18). Serum 96
zonulin concentrations are also increased in T2D and obesity (19–21) and strong correlations 97
were observed with various metabolic markers, including fasting plasma glucose, IL-6, HDL, 98
and triglyceride (TG) levels (19–21). 99
Here, we aimed at characterizing the relationship between circulating serum zonulin and traits 100
related to obesity in a metabolically well-characterized cohort of Sorbs from Germany. To 101
measure zonulin, we used the commercially available ELISA kit (Immundiagnostik, 102
Bensheim, Germany). In addition, we determined the haptoglobin genotypes in the entire 103
cohort. Due to a lack of correspondence between the observed circulating zonulin 104
concentrations and the haptoglobin genotypes in our study cohort, we further investigated the 105
possible identity of the product captured by the commercial ELISA assay. We found that the 106
ELISA kit used in the present study does not detect purified pre-HP2 but rather targets one or 107
.CC-BY-ND 4.0 International licenseIt is made available under a (which was not peer-reviewed) is the author/funder, who has granted bioRxiv a license to display the preprint in perpetuity.
The copyright holder for this preprint. http://dx.doi.org/10.1101/157578doi: bioRxiv preprint first posted online Jun. 30, 2017;
5
more proteins from a range of candidate molecules possibly structurally and functionally 108
related to zonulin. Our data also showed that protein concentrations measured by this ELISA 109
correlated with parameters of obesity and related metabolic traits. 110
111
Materials and Methods 112
Study subjects 113
All subjects are part of a sample from an extensively clinically characterized population from 114
Eastern Germany, the Sorbs (22–24). Extensive phenotyping included standardized 115
questionnaires to assess past medical history and family history, collection of anthropometric 116
data (weight, height, waist-to-hip ratio (WHR)), and an oral glucose tolerance test. Glucose 117
was assessed by the Hexokinase method (Automated Analyzer Modular, Roche Diagnostics, 118
Mannheim, Germany) and serum insulin was measured using the AutoDELFIA Insulin assay 119
(PerkinElmer Life and Analytical Sciences, Turku, Finland). Total serum cholesterol and TG 120
concentrations were measured by standard enzymatic methods (CHOD-PAP and GPO-PAP; 121
Roche Diagnostics). Serum LDL-C and HDL-C concentrations were determined using 122
commercial homogeneous direct measurement methods (Roche Diagnostics). All assays were 123
performed in an automated clinical chemistry analyzer (Hitachi/ Roche Diagnostics) at the 124
Institute of Laboratory Medicine, University Hospital Leipzig. 125
All blood samples were taken in the morning after an overnight fast and stored at -80°C until 126
analyses. From the 1040 Sorbs enrolled in the cohort, a subgroup of 376 subjects was 127
genotyped for haptoglobin and provided blood samples for zonulin measurements (Table 1). 128
Main metabolic characteristics of the study subjects are summarized in Table 2. 129
The study was approved by the ethics committee of the University of Leipzig and all subjects 130
gave written informed consent before taking part in the study. 131
132
133
.CC-BY-ND 4.0 International licenseIt is made available under a (which was not peer-reviewed) is the author/funder, who has granted bioRxiv a license to display the preprint in perpetuity.
The copyright holder for this preprint. http://dx.doi.org/10.1101/157578doi: bioRxiv preprint first posted online Jun. 30, 2017;
6
ELISA measurements 134
Circulating zonulin was measured by a competitive ELISA (Immundiagnostik AG, Bensheim, 135
Germany) in serum samples of 376 individuals according to the manufacturer’s protocol. 136
Inter-assay coefficient of variation was 6.5%. When purified proteins zonulin and properdin 137
and the synthetic peptide AT1001 were tested by the ELISA, they were re-suspended in PBS 138
and diluted in Diluent buffer (IDK kit) to reach a final concentration of 5 μg/ml. 139
140
Genotyping 141
Haptoglobin genotypes were determined by PCR using a method adapted from Koch et al. 142
(17). Briefly, the following two primer pairs were used: A (5’-143
GAGGGGAGCTTGCCTTTCCATTG-3’) and B (5’-GAGATTTTTGAGCCCTGGCTGGT-144
3’), as well as C (5’-CCTGCCTCGTATTAACTGCACC AT-3’) and D (5’-145
CCGAGTGCTCCACATAGCCATGT-3’). The primer pair A/B generates two bands: a 146
1,757-bp allele 1 specific band and a 3,481-bp allele 2 specific band. The primer pair C/D 147
produces one allele 2 specific band of 349 bp. The combination of the bands allows a 148
reproducible typing of the two common haptoglobin genotypes HP1 and HP2. In contrast, no 149
band is detectable for the rare HP deletion genotype, present in ~0.1% Caucasians (16). 150
151
Antibody capturing experiment 152
We aimed to isolate the target protein of the ELISA antibody from serum samples utilizing 153
the immobilized anti-zonulin antibodies on the ELISA plates to perform antibody capturing 154
experiments. Based to the manufacturing information, these polyclonal antibodies were raised 155
against an octapeptide sequenced from the zonulin molecule (25). Equal amounts of undiluted 156
serum samples with highest and lowest concentrations of zonulin, as measured using the same 157
ELISA kit, were transferred to separate wells, incubated and washed according to the 158
manufacturer’s protocol. Afterwards we eluted the captured protein(s) by incubation with 50 159
.CC-BY-ND 4.0 International licenseIt is made available under a (which was not peer-reviewed) is the author/funder, who has granted bioRxiv a license to display the preprint in perpetuity.
The copyright holder for this preprint. http://dx.doi.org/10.1101/157578doi: bioRxiv preprint first posted online Jun. 30, 2017;
7
µl of hot (95°C) SDS sample buffer with β-mercaptoethanol for 5 minutes. The captured 160
protein of high or low zonulin serum samples were pooled (N=8 for high (2 pooled groups) 161
and low (1 pooled group); measured protein concentrations using the zonulin ELISA of the 162
serum samples is given in Supplementary Table 1). Twenty µl of these elution samples (high 163
or low zonulin) were separated by SDS-PAGE using precast Bolt 4-12% Bis-Tris Plus gels 164
(ThermoFisher, Waltham, MA, USA). Proteins were stained using the Pierce silver stain for 165
mass spectrometry (ThermoFisher) or detected by Western Blot. 166
167
Mass spectrometry 168
To identify proteins isolated from serum samples as described above, bands were excised 169
from silver-stained gels and in-gel digested with trypsin following a standard protocol (26). 170
After enzymatic digestion, the peptide mixtures were immediately analyzed by LC/MS/MS on 171
an U3000 RSLC nano-HPLC system (Thermo Fisher Scientific) coupled to an Orbitrap 172
Fusion Tribrid mass spectrometer (Thermo Fisher Scientific). Samples were loaded onto a 173
pre-column (RP-C8, 300 μm * 5 mm, 5 μm, 100 Å, Thermo Fisher Scientific) and washed 174
with water containing 0.1% (v/v) TFA for 15 min, before the peptides were separated on the 175
separation column (RP-C18, 75 μm * 250 mm, 2 μm, 100 Å, Thermo Fisher Scientific) using 176
gradients from 1% to 40% (v/v) B (45 min), 40% to 85% (v/v) B (5 min) followed by 85% B 177
(5 min), with solvent A: 0.1% (v/v) formic acid (FA) in water and solvent B: 0.08% (v/v) FA 178
in acetonitrile. Data were acquired using data-dependent MS/MS mode where each high-179
resolution full-scan in the orbitrap (m/z 198 to 1,500; R = 120,000) was followed by high-180
resolution product ion scans in the orbitrap (higher energy collision-induced dissociation 181
(HCD), 27% normalized collision energy, R = 15,000, isolation window 2 Th) within 5 s, 182
starting with the most intense signal in the full-scan mass spectrum. 183
Data analysis was performed using the Proteome Discoverer 2.1 (Thermo Fisher Scientific). 184
MS/MS data of precursor ions (m/z range 350-5,000) were searched against the Swissprot 185
.CC-BY-ND 4.0 International licenseIt is made available under a (which was not peer-reviewed) is the author/funder, who has granted bioRxiv a license to display the preprint in perpetuity.
The copyright holder for this preprint. http://dx.doi.org/10.1101/157578doi: bioRxiv preprint first posted online Jun. 30, 2017;

8
Database (version 11/2016, taxonomy human, 20,082 entries) and a contaminant database 186
using Sequest HT. Mass accuracy was set to 5 ppm and 20 mmu for precursor and fragment 187
ions, respectively. Carbamidomethylation of cysteines was set as fixed modification; 188
oxidation of methionines and N-terminal acetylation were set as variable modifications, two 189
missed cleavages of trypsin were allowed. Results were filtered for non-contaminant proteins 190
identified by at least three unique highly confident peptides (peptide FDR ≤ 1%). 191
192
Western blot analysis 193
Western blot experiments were performed to validate the results of mass spectrometric data 194
analysis and to compare the serum target proteins identified by the polyclonal antibodies used 195
by this ELISA kit compared to monoclonal anti-zonulin antibodies. Gels were blotted on a 196
PVDF membrane and Western blots were probed with anti-C3 β-chain (1:2000) (Biozol, 197
Eching, Germany), anti-haptoglobin (1:1000) (Abcam, Cambridge, UK), polyclonal anti-198
zonulin (1:500) (kindly provided by Immundiagnostik), monoclonal anti-zonulin (1:5000) 199
(BioRad, Hercules, CA USA) antibodies. Purified C3c from plasma (Athens Research, 200
Athens, Georgia, USA) and recombinant zonulin were used as positive controls. Properdin 201
(R&D Systems Minneapolis, MN, U.S.A.) was also used to validate the potential protein 202
candidate identified by the ELISA. Incubation with primary and secondary antibodies (HRP-203
conjugated) was done for 90 minutes at room temperature. Blots were visualized by enhanced 204
chemiluminescence using Pierce ECL Western Blotting Substrate (ThermoFisher). 205
206
Statistical analysis 207
Statistical analysis was performed using with SPSS 24 (IBM). All non-normally distributed 208
metric parameters were log transformed to generate a Gaussian normal distribution. 209
Spearman’s rank correlation method was used to assess the relationship between metabolic 210
traits. To test for significant differences in distribution for ordinal values, the Kruskal-Wallis-211
.CC-BY-ND 4.0 International licenseIt is made available under a (which was not peer-reviewed) is the author/funder, who has granted bioRxiv a license to display the preprint in perpetuity.
The copyright holder for this preprint. http://dx.doi.org/10.1101/157578doi: bioRxiv preprint first posted online Jun. 30, 2017;
9
test was used. Exact differences between two groups were tested by both the Mann-Whitney-212
U test and unpaired student’s t-test. In addition, multiple linear regression analyses were done 213
to assess the linear relationship between continuous variables and genotypes. For all tests, a p-214
value <0.05 was considered to be statistically significant. 215
216
Results 217
Haptoglobin genotype 218
Haptoglobin genotype HP1/1 was present in 15.8% of the subjects, HP1/2 in 47.6% and 219
HP2/2 in 36.6%. These frequencies are comparable to the distribution of HP genotypes in 220
cohorts of European ancestry reported by others (16, 17). We tested the association of the HP 221
genotypes with various anthropometric and metabolic traits in all study subjects. The analysis 222
revealed that blood hemoglobin levels significantly increase with the presence of at least one 223
HP2 allele (p=0.004 over all three groups, p=4.2x10⁻⁴ between HP1 homozygote and HP2 224
carriers). Furthermore, we observed that the total protein concentration in the urine 225
significantly differed between the three groups, with an increase in the HP2 carriers 226
(p=0.027). Interestingly, mean triiodothyronine (fT3) levels were lower in the HP1/1 group 227
than in the HP2/2 group (p=0.012) and in accordance, an increase in administered thyroid 228
gland hormones (p=0.023) was observed. 229
230
Zonulin ELISA data do not match HP genotype distribution 231
Strikingly, there were no significant differences in levels of the zonulin ELISA signal 232
between the three haptoglobin genotype groups (Figure 1; p=0.153 using ANOVA, p=0.07 for 233
the t-test comparing log transformed zonulin signals between HP1/1 vs. HP1/2 + HP2/2). 234
Assuming that the protein measured by the kit is zonulin (i.e. pre-HP2), subjects with the 235
HP1/1 genotype were expected to have no detectable zonulin levels. As the zonulin 236
concentrations measured in patient sera using the zonulin ELISA kit clearly did not reflect the 237
.CC-BY-ND 4.0 International licenseIt is made available under a (which was not peer-reviewed) is the author/funder, who has granted bioRxiv a license to display the preprint in perpetuity.
The copyright holder for this preprint. http://dx.doi.org/10.1101/157578doi: bioRxiv preprint first posted online Jun. 30, 2017;
10
HP genotype distribution we therefore concluded that the protein measured by the kit is not 238
identical to zonulin as pre-HP2 or that, beside pre-HP2, the kit detects other unrelated 239
proteins. Consequently, we aimed at identifying the protein(s) detected by the alleged zonulin 240
ELISA kit. 241
242
The zonulin ELISA does not detect recombinant pre-HP2, but targets multiple proteins 243
To attempt identifying proteins bound and quantified by the capturing antibody deployed in 244
the zonulin ELISA kit, we performed an immune-capturing experiment using patient sera and 245
the immobilized antibody of the ELISA kit as supplied. After incubation of the immobilized 246
ELISA kit antibodies with selected patient sera representing the highest and lowest measured 247
ELISA signals in the cohort, the captured proteins were separated by SDS-PAGE. Notably, 248
we could not measure the protein content of the eluted samples, but given that equal amounts 249
of serum were used, that the same washing and elution procedure was performed for all 250
samples and that 20µl of the pooled elution samples were used for SDS-PAGE and Western 251
blot, the detected amount of “captured” protein should resemble the amount of protein that 252
was present in the initial serum sample. 253
Silver staining revealed multiple bands, with the most intense band at ~70 kDa and further 254
prominent bands at ~55 kDa, ~180 kDa and >180kDA (Figure 2A). This band pattern was 255
incompatible with a band pattern that would be expected for pre-HP2 or haptoglobin-derived 256
proteins and further supported the results demonstrating the lack of correspondence of the 257
captured protein with HP genotypes. To further characterize major proteins captured by the 258
ELISA kit, protein bands were cut (Figure 2A) and subjected to MS analysis after tryptic 259
digestion (Supplementary Table 2). Mass spectrometry demonstrated that bands 1 (>180kDa), 260
2 (~150 kDa), 3 (~70 kDa) were all very likely representing the C3 protein or cleavage 261
products derived from the C3 protein, such as the C3 precursor (187 kDa), C3c (144 kDa) and 262
the C3 β-chain (71 kDa). Furthermore, the 55 kDa band was identified as properdin or factor 263
.CC-BY-ND 4.0 International licenseIt is made available under a (which was not peer-reviewed) is the author/funder, who has granted bioRxiv a license to display the preprint in perpetuity.
The copyright holder for this preprint. http://dx.doi.org/10.1101/157578doi: bioRxiv preprint first posted online Jun. 30, 2017;
11
P (MW 53 kDa). To validate results from mass spectrometry, we performed Western blot 264
analyses. The major band at 70 kDa was clearly detected by an anti-C3 β-chain antibody 265
(Figure 2B). 266
Consequently, we tested several C3c proteins from different suppliers (Abcam, Cambridge, 267
UK; Athens Research, Athens, Georgia, USA; mybiosource, San Diego, California, USA), in 268
a range from 0.1 mg/ml to 0.1 ng/ml under native and denatured conditions, as well as diluted 269
in serum, with the respective ELISA kit. All results were negative (data not shown), 270
indicating that C3 might represent a contaminant only. Additionally, we tested C3, 271
recombinant zonulin, HP1, and HP2 at increasing concentrations (range 1-50 μg/ml), along 272
with sera from celiac patients (both HP1-1 and HP2-2), healthy controls (both HP1-1 and 273
HP2-2), and our standard control (AF, HP2-2). The results showed in Figure 3 demonstrated 274
that while this kit does not recognize C3, zonulin, or mature haptoglobin (both HP1 and HP2), 275
it does recognize protein(s) both in HP1-1 and HP2-2 genotype subjects, irrespective of their 276
disease status. 277
278
Anti-zonulin monoclonal antibodies and Immundiagnostik polyclonal antibodies 279
recognize same target proteins in Western blot. 280
Our ELISA results clearly showed that this kit does not detect zonulin (alias, pre-HP2 as 281
originally claimed by the manufacturer) or complement C3, the protein captured by our 282
experiments described above. In order to further characterize the target protein(s) of this kit, 283
we performed Western blotting analysis of sera from a HP2-2 subject either under baseline 284
condition or after deglycosylation as we have previously described (14), using recombinant 285
zonulin as control. As anticipated, the zonulin monoclonal antibodies recognized recombinant 286
zonulin as well as a variety of bands in the serum sample, including bands with a MW of ~70, 287
52, 37, 27, and 16 kDa (Figure 4A). Based on similar patterns we detected when zonulin was 288
originally cloned (14), we predicted that the ~72 kDa corresponded to the glycosylated HP β-289
.CC-BY-ND 4.0 International licenseIt is made available under a (which was not peer-reviewed) is the author/funder, who has granted bioRxiv a license to display the preprint in perpetuity.
The copyright holder for this preprint. http://dx.doi.org/10.1101/157578doi: bioRxiv preprint first posted online Jun. 30, 2017;

12
chain, the 52 kDa zonulin, and the 16 kDa the HP2 α-chain. To confirm this interpretation, we 290
performed deglycosylation experiments showing the shift of the 72 kDa β-chain to a lower 291
MW, while, as anticipated, the zonulin band and the HP2 α-chain remained unchanged 292
(Figure 4A). Interestingly enough, the Immundiagnostik polyclonal antibodies raised against 293
the zonulin synthetic peptide inhibitor GGVLVQPG (AT1001) (25) recognized the same main 294
bands detected by the monoclonal antibodies but with different intensity, being the 295
recombinant zonulin and serum α-chain bands fainter compared to the monoclonal antibody 296
signal, while the serum β-chain and serum zonulin-like signals stronger (Figure 4A). When 297
combined to our ELISA results, these data suggest that, while the zonulin monoclonal 298
antibodies specifically detect in serum samples only zonulin at its predicted molecular weight, 299
most likely the polyclonal antibodies used in this kit are possibly detecting “zonulin-like” 300
protein(s) (as suggested by the much more intense signal of the ~52 kDa band compared to 301
the monoclonal antibodies) with similar molecular weight, structure, and possibly function. 302
303
Immundiagnostik polyclonal antibodies recognize both zonulin as well as properdin as 304
an additional target in Western blot 305
Among all the proteins we identified with our mass spec analysis, properdin fulfills the 306
structural-functional characteristics mentioned above and, therefore, may represent the most 307
likely candidate target detected by this ELISA kit. To explore this hypothesis, we performed 308
both Western blotting analysis using the Immunodiagnostik polyclonal antibodies and ELISA 309
test using commercially available properdin. The Western blot showed that beside 310
recombinant zonulin, the Immunodiagnostik polyclonal antibodies also detect properdin (Fig 311
4B) that migrated at the same molecular weight of zonulin and serum bands recognized by the 312
antibodies in both HP2-2 and HP 1-1 subjects (Fig 4B). Similar results were obtained with 313
polyclonal antibodies raised against recombinant zonulin (data not shown). The same samples 314
used for Western blotting analysis, including zonulin, properdin and AT1001 at a 315
.CC-BY-ND 4.0 International licenseIt is made available under a (which was not peer-reviewed) is the author/funder, who has granted bioRxiv a license to display the preprint in perpetuity.
The copyright holder for this preprint. http://dx.doi.org/10.1101/157578doi: bioRxiv preprint first posted online Jun. 30, 2017;

13
concentration of 5 μg/ml were tested using the ELISA kit. The results showed that properdin 316
and AT1001 were both detected by the ELISA test, however, their amounts were substantially 317
underestimated by 914 (5.47 ng/ml) and 40 folds (126.04 ng/ml), respectively. However, 318
despite zonulin being detected in Western blot, it was not detected with the ELISA kit (Figure 319
3). In comparison, serum from subjects with HP 1-1 and HP 2-2 genotype were measured at a 320
concentration of 67.54 and 56.41 ng/ml, respectively (Table 3). 321
322
Correlations of measured protein concentrations using the ELISA with metabolic traits 323
In a sample of 376 subjects tested using the purchased zonulin ELISA, the product was 324
measured in a mean concentration of 72.2 ± 27.2 ng/ml (mean ± standard deviation), ranging 325
from 17.8 to 207.1 ng/ml. The ELISA signal was significantly increased in subjects with T2D 326
(81.78 ± 25.31 ng/ml) compared to subjects with normal glucose tolerance (67.25 ± 25.45 327
ng/ml, Mann-Whitney-U test; p=2.1x10⁻⁸) or impaired glucose tolerance (71.88 ± 29.36 328
ng/ml, p=0.0017) (Figure 5A). Additionally, lean subjects had significantly lower values 329
(65.64 ± 25.23 ng/ml) than subjects with overweight (74.20 ± 30.68 ng/ml, p=0.0082) or 330
obesity (76.24 ± 24.17 ng/ml, p=7.0x10⁻⁵) (Figure 5B). We observed no gender differences or 331
any correlations with age (data not shown). The ELISA signal correlated with traits related to 332
glucose and lipid metabolism (Spearman’s rank correlation test, adjusted for age, sex and 333
BMI; Table 4). It was positively correlated with BMI, HOMA-IR and -IS and fasting plasma 334
glucose (Table 4). Strong correlations were also observed for lipid metabolism parameters, 335
such as TG levels, total cholesterol, LDL and apolipoprotein B (Table 4). Correlations were 336
tested for a total of 95 accessible traits. After Bonferroni correction for multiple testing 337
(adjusted p-value for significance p < 5.2x10⁻⁴), correlations for BMI (p=1.2x10⁻⁵), fasting 338
glucose (p=9.0x10⁻⁶), TG (p=4.2x10⁻¹⁰), total cholesterol (p=3.3x10⁻⁵) and apolipoprotein B 339
(p=2.3x10⁻⁵) remained statistically significant. 340
341
.CC-BY-ND 4.0 International licenseIt is made available under a (which was not peer-reviewed) is the author/funder, who has granted bioRxiv a license to display the preprint in perpetuity.
The copyright holder for this preprint. http://dx.doi.org/10.1101/157578doi: bioRxiv preprint first posted online Jun. 30, 2017;
14
342
343
Discussion 344
The role of impaired intestinal permeability in metabolic diseases including obesity and T2D 345
has recently been acknowledged in multiple studies (3, 4, 27). The tight junction regulator 346
zonulin, which was identified as pre-HP2 by Tripathi et al. (14), is an established circulating 347
marker of intestinal permeability in humans (28, 29). Here, we aimed to investigate the 348
relationship between intestinal permeability, represented by circulating zonulin, and metabolic 349
traits related to obesity and T2D. We set out to measure zonulin with a widely used 350
commercially available ELISA kit in a metabolically well-characterized cohort of Sorbs from 351
Germany. Considering the identity of zonulin as pre-HP2, we also genotyped the haptoglobin 352
gene in DNA samples from all subjects. The genotype frequency of the HP1/1 genotype 353
corresponded to previously reported frequencies of 15% in populations of European ancestry 354
(16, 17). Assuming that the measured zonulin is identical with pre-HP2 as reported previously 355
(13), we expected subjects with the HP1/1 genotype to have no detectable, or if taking into 356
account cross-reactions, at least significantly lower zonulin levels. However, concentrations 357
measured in the HP1/1 homozygous subjects were comparable with those found in HP2/2 and 358
HP1/2 carriers. 359
The epitope used to generate the capture antibody in the zonulin ELISA is based on the 360
sequence GGVLVQPG published by Wang et al. (25) (communication with customer 361
support; Immundiagnostik AG, Bensheim, Germany), which was initially thought to represent 362
the N-terminal sequence of fetal zonulin (25). However, this sequence is not present in pre-363
HP2, which has since been proposed to be zonulin by the same authors (14). According to the 364
authors, the discrepancies between the previously reported zonulin sequence and the pre-HP2 365
sequence may be due to intraspecies variability associated with a high zonulin mutation rate 366
or due to sequencing errors at that time (14). In summary, the commercially available 367
.CC-BY-ND 4.0 International licenseIt is made available under a (which was not peer-reviewed) is the author/funder, who has granted bioRxiv a license to display the preprint in perpetuity.
The copyright holder for this preprint. http://dx.doi.org/10.1101/157578doi: bioRxiv preprint first posted online Jun. 30, 2017;
15
competitive ELISA does very likely not detect preHP2 or zonulin, but rather unknown targets 368
bound by the antibody raised against the sequence reported by Wang et al (25). 369
Based on database searches, the epitope could correspond to Glu-Rich2, a protein which 370
shares 7 out of 8 amino acids. The zonulin/preHP2 binding partner CD163 shows some 371
conformity with the epitope (30). Our antibody capture experiment and subsequent mass 372
spectrometry analysis did not provide any evidence for either protein. The most abundant 373
protein identified by MS, C3, is evidently an unspecific product overshadowing the real 374
targets. Indeed, the respective ELISA kit did not detect any complement C proteins obtained 375
from different suppliers when tested under native and denatured conditions, as well as diluted 376
in serum. Also, the same kit did not detect recombinant zonulin, mature HP1 or mature HP2. 377
Considering the additional MS hits, a few proteins stand out, although, without further 378
validation, we interpret these data with caution, since only more abundant proteins may be 379
identified by MS analysis, while our protein(s) of interest may be in low abundance in serum 380
samples and, therefore, not identifiable with this approach. The van Willebrand factor (vWF, 381
band A, Figure 2) is involved in the intrinsic coagulation pathway and the acute phase 382
response and known to be increased in inflammatory bowel disease and bacterial diarrhea 383
(31). Inter-alpha-inhibitor heavy chain 4 (band B, Figure 2) a large glycoportein cleaved into 384
smaller fragments by Kallikrein which is also involved in the intrinsic coagulation pathway. 385
One of these fragments, called urinary trypsin-inhibitor, attenuates LPS-induced endothelial 386
barrier dysfunction by upregulation of vascular endothelial-cadherin expression (32). 387
Complement component 9 (C9, band C, Figure 2) is an important component of the 388
membrane attacking complex within the complement cascade and is required for complement-389
mediated lipopolysaccharide release and outer membrane damage in bacteria (33). Protein 390
S100-A8, or Calprotectin, (band D, Figure 2) is a calcium- and zinc-binding protein which 391
plays a prominent role in the regulation of inflammatory processes and immune response (34). 392
However, based on the data presented in Figure 4, our most likely candidate(s) should be in 393
.CC-BY-ND 4.0 International licenseIt is made available under a (which was not peer-reviewed) is the author/funder, who has granted bioRxiv a license to display the preprint in perpetuity.
The copyright holder for this preprint. http://dx.doi.org/10.1101/157578doi: bioRxiv preprint first posted online Jun. 30, 2017;
16
the ~50 kDa range, were the polyclonal antibody signal was stronger. Therefore, the most 394
interesting candidate protein we have identified is properdin or factor P (band D, Figure 2), a 395
member of the complement alternative pathway that has a molecular weight (53 kDa), within 396
the range of those proteins recognized by the Immundiagnostik anti-AT1001 polyclonal 397
antibodies (Figures 4A and B) and serum levels (~25 ng/ml) (35) similar to the range of 398
detection of the kit. Our combined Western blot analysis (Figure 4B) and ELISA test 399
confirmed that the polyclonal antibodies raised against AT1001 detect properdin amongst 400
other proteins. However, when purified proteins/peptides, including the AT1001 peptide used 401
to raise the polyclonal antibodies, which is also used as internal control in the ELISA kit, 402
were tested by ELISA, they were highly under-estimated by the test. One possible explanation 403
for these results is that zonulin and also properdin are not the main targets detected by the 404
ELISA, however the fact that even AT1001 was under-estimated seems to suggest that this 405
hypothesis cannot entirely explain our results. Alternatively, it is possible that tertiary and 406
quaternary (multimers) structure arrangements present in sera samples but not in recombinant 407
proteins are necessary in order to properly detect both zonulin and properdin by this ELISA. 408
If this is the case and/or that the main target of this ELISA is/are additional proteins in the 409
~50kDa range present in human serum remains to be established. 410
Once released from neutrophils, T cells and macrophages in response to acute microbial 411
exposure, properdin causes production of chemotactic anaphylatoxin C3a and C5a with 412
subsequent formation of immune complexes that cause increased endothelial permeability 413
(35). Intriguingly, zonulin as pre-HP2 also causes generation of C3a and C5a, with 414
subsequent increased vascular permeability in several districts, including the lung, with 415
subsequent onset of acute lung injury (36). Another striking similarity between zonulin and 416
properdin is the fact that both are associated to viral respiratory tract infections (37, 38). 417
Notably, the peptide sequence used for the generation of the antibody is also not present in 418
any of the discussed proteins. The five proteins mentioned above, including properdin, have 419
.CC-BY-ND 4.0 International licenseIt is made available under a (which was not peer-reviewed) is the author/funder, who has granted bioRxiv a license to display the preprint in perpetuity.
The copyright holder for this preprint. http://dx.doi.org/10.1101/157578doi: bioRxiv preprint first posted online Jun. 30, 2017;
17
~50% similarity to this epitope. Zonulin as preHP-2 is a member of a larger family of tight 420
junction regulating proteins. Indeed, phylogenetic analyses suggest that haptoglobins evolved 421
from mannose-associated serine protease (MASP), a complement-associated protein (like 422
properdin), with their alpha-chain containing a complement control protein (CCP) (this 423
domain activates complement similarly to properdin), while the β-chain is related to 424
chymotrypsin-like serine proteases (SP domain) (39, 40). However, the SP domain of HP 425
lacks the essential catalytic amino acid residues required for protease function; structure-426
function analyses have implicated this domain in receptor recognition and binding (41). 427
Although not a serine protease, zonulin shares approximately 19% amino acid sequence 428
homology with chymotrypsin, and their genes both map on chromosome 16. Alignment of the 429
β-chain sequence of zonulin to that of several serine proteases is remarkably consistent except 430
for an insertion of 16 residues in the region corresponding to the methionyl loop of the serine 431
proteases. Comparison of the zonulin α-β junction region with the heavy-light-chain junction 432
of tissue-type plasminogen activator strengthens the evolutionary homology of zonulin and 433
serine proteases. The active-site residues typical of the serine proteases, His57 and Ser195, 434
are replaced in zonulin by lysine and alanine, respectively. Because of these mutations, during 435
evolution zonulin most likely lost its protease activity despite that zonulin and serine 436
proteases evolved from a common ancestor (18). Therefore, zonulin, and the serine proteases 437
represent a striking example of homologous proteins with different biological functions but 438
with the common characteristic of complement activation. Beside zonulin and properdin, 439
other members of the MASP family include a series of plasminogen-related growth factors 440
(epidermal growth factor (EGF), hepatocyte growth factor (HGF), etc.) involved in cell 441
growth, proliferation, differentiation and migration, and disruption of intercellular junctions. 442
In light of these considerations, other MASP members identified in our capturing experiments 443
in general, and properdin in particular, are intriguing possible targets (36). 444
.CC-BY-ND 4.0 International licenseIt is made available under a (which was not peer-reviewed) is the author/funder, who has granted bioRxiv a license to display the preprint in perpetuity.
The copyright holder for this preprint. http://dx.doi.org/10.1101/157578doi: bioRxiv preprint first posted online Jun. 30, 2017;

18
Analyzing the protein concentrations measured using this ELISA in subjects who have been 445
extensively characterized for metabolic phenotypes, our data suggest that it is upregulated 446
both in diabetic and obese patients. This is in line with previously reported findings using this 447
ELISA kit (19–21). Our data shows, that the ELISA target is potentially involved in the lipid 448
metabolism by showing in various linear stepwise regression models that triglyceride levels 449
and fasting glucose are the strongest independent available variables explaining the observed 450
variance in measured protein concentrations (Supplementary Table 3). 451
It is important to note, that our study, as it has not been initially designed to address the 452
question of ELISA specificity, has clear limitations. To obtain amounts of isolated protein in 453
the antibody capture experiments, we needed to change the experimental protocol provided by 454
the manufacturer. We used undiluted serum samples instead of a 50-fold dilution, which very 455
likely increased the risk of non-specific binding. Yet, we used sera from patient that exhibited 456
the highest and the lowest concentrations measured by the ELISA kit using the 457
manufacturer’s protocol. Thus, any non-specific binding should be detected as equally strong 458
bands in the silver stained gels after the antibody capture experiment. Yet, we observed band 459
intensities of affinity purified protein that clearly correlated with the concentrations measured 460
using the ELISA, in the silver stained gels (total protein) and in the Western blot using the 461
anti-C3-β-chain antibody, indicating a specific isolation of proteins recognized by the kit 462
antibody. Nevertheless, ELISA results that failed to recognize C3 disputed the notion that 463
complement C3 is the target of this kit. Also, we have performed this experiment using two 464
different Lot no. of the ELISA, using sera from eight different patients of each high and low 465
concentration and obtained the same results. 466
In conclusion, based on our data we suggest that the Immundiagnostik ELISA kit supposedly 467
testing serum zonulin (pre-HP2) levels could identify a variety of proteins structurally and 468
possibly functionally related to zonulin, suggesting the existence of a family of zonulin 469
proteins as previously hypothesized (42), rather than a single member of permeability-470
.CC-BY-ND 4.0 International licenseIt is made available under a (which was not peer-reviewed) is the author/funder, who has granted bioRxiv a license to display the preprint in perpetuity.
The copyright holder for this preprint. http://dx.doi.org/10.1101/157578doi: bioRxiv preprint first posted online Jun. 30, 2017;
19
regulating proteins. Additional studies are necessary to establish the primary target proteins 471
(zonulin, properdin and/or other structurally similar proteins) detected by this commercially 472
available ELISA. 473
Acknowledgements 474
We thank all those who participated in the studies, in particular our study subjects. We thank 475
Dr. Ingo Bechmann for helpful advice and discussions. 476
477
Funding 478
This work was supported by grants from the German Research Council (SFB-1052 ‘‘Obesity 479
mechanisms’’ B03, C01, C07), from the German Diabetes Association and from the DHFD 480
(Diabetes Hilfs- und Forschungsfonds Deutschland). IFB Adiposity Diseases is supported by 481
the Federal Ministry of Education and Research (BMBF), Germany, FKZ: 01EO1501 (AD2-482
060E, AD2-6E99), and by the National Institutes of Health (NIH) U.S.A. grants R01-483
DK104344 and P30-DK040461. 484
485
Author contributions 486
LS, PK and JTH conceived the study, designed and conducted experiments, analyzed data and 487
wrote the paper. AT recruited patients. CHI performed mass spectrometry experiments. AC, 488
HH, DS and MS interpreted and analyzed data. RF performed the zonulin ELISA test, MF 489
performed the Western blotting analysis, and AF critically revised the manuscript, contributed 490
to the study design of some of the performed experiments, and provided critical interpretation 491
of the data. All authors discussed results, edited and commented on the manuscript. All the 492
authors have accepted responsibility for the entire content of this submitted manuscript and 493
approved submission. 494
495
Disclosure statement: The authors have no conflicts of interest to declare. 496
.CC-BY-ND 4.0 International licenseIt is made available under a (which was not peer-reviewed) is the author/funder, who has granted bioRxiv a license to display the preprint in perpetuity.
The copyright holder for this preprint. http://dx.doi.org/10.1101/157578doi: bioRxiv preprint first posted online Jun. 30, 2017;

20
497
.CC-BY-ND 4.0 International licenseIt is made available under a (which was not peer-reviewed) is the author/funder, who has granted bioRxiv a license to display the preprint in perpetuity.
The copyright holder for this preprint. http://dx.doi.org/10.1101/157578doi: bioRxiv preprint first posted online Jun. 30, 2017;

21
References 498
1. Bischoff SC, Barbara G, Buurman W, Ockhuizen T, Schulzke J-D, Serino M, et al. Intestinal 499
permeability – a new target for disease prevention and therapy. BMC gastroenterology (2014) 500
14:189. doi:10.1186/s12876-014-0189-7. 501
2. Arrieta MC, Bistritz L, Meddings JB. Alterations in intestinal permeability. Gut (2006) 55:1512–20. 502
doi:10.1136/gut.2005.085373. 503
3. Cani PD, Bibiloni R, Knauf C, Waget A, Neyrinck AM, Delzenne NM, et al. Changes in gut 504
microbiota control metabolic endotoxemia-induced inflammation in high-fat diet-induced obesity 505
and diabetes in mice. Diabetes (2008) 57:1470–81. doi:10.2337/db07-1403. 506
4. Teixeira TF, Collado MC, Ferreira, Celia L L F, Bressan J, Peluzio, Maria do Carmo G. Potential 507
mechanisms for the emerging link between obesity and increased intestinal permeability. Nutrition 508
research (New York, N.Y.) (2012) 32:637–47. doi:10.1016/j.nutres.2012.07.003. 509
5. Frazier TH, DiBaise JK, McClain CJ. Gut microbiota, intestinal permeability, obesity-induced 510
inflammation, and liver injury. JPEN. Journal of parenteral and enteral nutrition (2011) 35:14–20. 511
doi:10.1177/0148607111413772. 512
6. Harris K, Kassis A, Major G, Chou CJ. Is the gut microbiota a new factor contributing to obesity 513
and its metabolic disorders? Journal of obesity (2012) 2012:879151. doi:10.1155/2012/879151. 514
7. Burcelin R, Serino M, Chabo C, Garidou L, Pomie C, Courtney M, et al. Metagenome and 515
metabolism: the tissue microbiota hypothesis. Diabetes, obesity & metabolism (2013) 15 Suppl 516
3:61–70. doi:10.1111/dom.12157. 517
8. Cani PD, Possemiers S, Van de Wiele, T, Guiot Y, Everard A, Rottier O, et al. Changes in gut 518
microbiota control inflammation in obese mice through a mechanism involving GLP-2-driven 519
improvement of gut permeability. Gut (2009) 58:1091–103. doi:10.1136/gut.2008.165886. 520
9. Turnbaugh PJ, Backhed F, Fulton L, Gordon JI. Diet-induced obesity is linked to marked but 521
reversible alterations in the mouse distal gut microbiome. Cell host & microbe (2008) 3:213–23. 522
doi:10.1016/j.chom.2008.02.015. 523
10. Ortiz S, Zapater P, Estrada JL, Enriquez P, Rey M, Abad A, et al. Bacterial DNA translocation 524
holds increased insulin resistance and systemic inflammatory levels in morbid obese patients. The 525
Journal of clinical endocrinology and metabolism (2014) 99:2575–83. doi:10.1210/jc.2013-4483. 526
.CC-BY-ND 4.0 International licenseIt is made available under a (which was not peer-reviewed) is the author/funder, who has granted bioRxiv a license to display the preprint in perpetuity.
The copyright holder for this preprint. http://dx.doi.org/10.1101/157578doi: bioRxiv preprint first posted online Jun. 30, 2017;

22
11. Sato J, Kanazawa A, Ikeda F, Yoshihara T, Goto H, Abe H, et al. Gut dysbiosis and detection of 527
"live gut bacteria" in blood of Japanese patients with type 2 diabetes. Diabetes care (2014) 528
37:2343–50. doi:10.2337/dc13-2817. 529
12. Fasano A, Baudry B, Pumplin DW, Wasserman SS, Tall BD, Ketley JM, et al. Vibrio cholerae 530
produces a second enterotoxin, which affects intestinal tight junctions. Proceedings of the 531
National Academy of Sciences of the United States of America (1991) 88:5242–6. 532
13. Fasano A, Fiorentini C, Donelli G, Uzzau S, Kaper JB, Margaretten K, et al. Zonula occludens 533
toxin modulates tight junctions through protein kinase C-dependent actin reorganization, in vitro. 534
The Journal of clinical investigation (1995) 96:710–20. doi:10.1172/JCI118114. 535
14. Tripathi A, Lammers KM, Goldblum S, Shea-Donohue T, Netzel-Arnett S, Buzza MS, et al. 536
Identification of human zonulin, a physiological modulator of tight junctions, as prehaptoglobin-2. 537
Proceedings of the National Academy of Sciences of the United States of America (2009) 538
106:16799–804. doi:10.1073/pnas.0906773106. 539
15. Wobeto, VÃ\textcentnia Peretti de Albuquerque, Zaccariotto TR, Sonati Md. Polymorphism of 540
human haptoglobin and its clinical importance. Genetics and Molecular Biology 31:602–20. 541
16. Langlois MR, Delanghe JR. Biological and clinical significance of haptoglobin polymorphism in 542
humans. Clinical chemistry (1996) 42:1589–600. 543
17. Koch W, Latz W, Eichinger M, Roguin A, Levy AP, Schomig A, et al. Genotyping of the common 544
haptoglobin Hp 1/2 polymorphism based on PCR. Clinical chemistry (2002) 48:1377–82. 545
18. Fasano A. Zonulin and its regulation of intestinal barrier function: the biological door to 546
inflammation, autoimmunity, and cancer. Physiological reviews (2011) 91:151–75. 547
doi:10.1152/physrev.00003.2008. 548
19. Zhang D, Zhang L, Zheng Y, Yue F, Russell RD, Zeng Y. Circulating zonulin levels in newly 549
diagnosed Chinese type 2 diabetes patients. Diabetes research and clinical practice (2014) 550
106:312–8. doi:10.1016/j.diabres.2014.08.017. 551
20. Żak-Gołąb A, Kocełak P, Aptekorz M, Zientara M, Juszczyk Ł, Martirosian G, et al. Gut 552
Microbiota, Microinflammation, Metabolic Profile, and Zonulin Concentration in Obese and Normal 553
Weight Subjects. International Journal of Endocrinology (2013) 2013:9. doi:10.1155/2013/674106. 554
21. Moreno-Navarrete JM, Sabater M, Ortega F, Ricart W, Fernandez-Real JM. Circulating zonulin, a 555
marker of intestinal permeability, is increased in association with obesity-associated insulin 556
resistance. PloS one (2012) 7:e37160. doi:10.1371/journal.pone.0037160. 557
.CC-BY-ND 4.0 International licenseIt is made available under a (which was not peer-reviewed) is the author/funder, who has granted bioRxiv a license to display the preprint in perpetuity.
The copyright holder for this preprint. http://dx.doi.org/10.1101/157578doi: bioRxiv preprint first posted online Jun. 30, 2017;
23
22. Tonjes A, Zeggini E, Kovacs P, Bottcher Y, Schleinitz D, Dietrich K, et al. Association of FTO 558
variants with BMI and fat mass in the self-contained population of Sorbs in Germany. European 559
journal of human genetics EJHG (2010) 18:104–10. doi:10.1038/ejhg.2009.107. 560
23. Tonjes A, Koriath M, Schleinitz D, Dietrich K, Bottcher Y, Rayner NW, et al. Genetic variation in 561
GPR133 is associated with height: genome wide association study in the self-contained 562
population of Sorbs. Human molecular genetics (2009) 18:4662–8. doi:10.1093/hmg/ddp423. 563
24. Veeramah KR, Tönjes A, Kovacs P, Gross A, Wegmann D, Geary P, et al. Genetic variation in the 564
Sorbs of eastern Germany in the context of broader European genetic diversity. European Journal 565
of Human Genetics (2011) 19:995–1001. doi:10.1038/ejhg.2011.65. 566
25. Wang W, Uzzau S, Goldblum SE, Fasano A. Human zonulin, a potential modulator of intestinal 567
tight junctions. Journal of cell science (2000) 113 Pt 24:4435–40. 568
26. Shevchenko A, Tomas H, Havlis J, Olsen JV, Mann M. In-gel digestion for mass spectrometric 569
characterization of proteins and proteomes. Nature protocols (2006) 1:2856–60. 570
doi:10.1038/nprot.2006.468. 571
27. Damms-Machado A, Louis S, Schnitzer A, Volynets V, Rings A, Basrai M, et al. Gut permeability 572
is related to body weight, fatty liver disease, and insulin resistance in obese individuals 573
undergoing weight reduction. The American journal of clinical nutrition (2017) 105:127–35. 574
doi:10.3945/ajcn.116.131110. 575
28. Sapone A, Magistris L de, Pietzak M, Clemente MG, Tripathi A, Cucca F, et al. Zonulin 576
upregulation is associated with increased gut permeability in subjects with type 1 diabetes and 577
their relatives. Diabetes (2006) 55:1443–9. 578
29. Drago S, El Asmar R, Di Pierro M, Grazia Clemente M, Tripathi A, Sapone A, et al. Gliadin, 579
zonulin and gut permeability: Effects on celiac and non-celiac intestinal mucosa and intestinal cell 580
lines. Scandinavian journal of gastroenterology (2006) 41:408–19. 581
doi:10.1080/00365520500235334. 582
30. Thomsen JH, Etzerodt A, Svendsen P, Moestrup SK. The Haptoglobin-CD163-Heme Oxygenase-583
1 Pathway for Hemoglobin Scavenging. Oxidative Medicine and Cellular Longevity (2013) 584
2013:11. doi:10.1155/2013/523652. 585
31. Sadler JE. Biochemistry and Genetics of von Willebrand Factor. Annual Review of Biochemistry 586
(1998) 67:395–424. doi:10.1146/annurev.biochem.67.1.395. 587
.CC-BY-ND 4.0 International licenseIt is made available under a (which was not peer-reviewed) is the author/funder, who has granted bioRxiv a license to display the preprint in perpetuity.
The copyright holder for this preprint. http://dx.doi.org/10.1101/157578doi: bioRxiv preprint first posted online Jun. 30, 2017;

24
32. Chen J, Wang J, Su C, Qian W, Sun L, Sun H, et al. Urinary trypsin inhibitor attenuates LPS-588
induced endothelial barrier dysfunction by upregulation of vascular endothelial-cadherin 589
expression. Inflammation Research (2016) 65:213–24. doi:10.1007/s00011-015-0907-9. 590
33. Tegla CA, Cudrici C, Patel S, Trippe R, Rus V, Niculescu F, et al. MEMBRANE ATTACK BY 591
COMPLEMENT: THE ASSEMBLY AND BIOLOGY OF TERMINAL COMPLEMENT 592
COMPLEXES. Immunologic research (2011) 51:45–60. doi:10.1007/s12026-011-8239-5. 593
34. Yui S, Nakatani Y, Mikami M. Calprotectin (S100A8/S100A9), an inflammatory protein complex 594
from neutrophils with a broad apoptosis-inducing activity. Biological & pharmaceutical bulletin 595
(2003) 26:753–60. 596
35. Kouser L, Abdul-Aziz M, Nayak A, Stover CM, Sim RB, Kishore U. Properdin and Factor H: 597
Opposing Players on the Alternative Complement Pathway “See-Saw”. Frontiers in Immunology 598
(2013) 4:93. doi:10.3389/fimmu.2013.00093. 599
36. Rittirsch D, Flierl MA, Nadeau BA, Day DE, Huber-Lang MS, Grailer JJ, et al. Zonulin as 600
prehaptoglobin2 regulates lung permeability and activates the complement system. American 601
journal of physiology. Lung cellular and molecular physiology (2013) 304:72. 602
doi:10.1152/ajplung.00196.2012. 603
37. Shirey KA, Lai W, Patel MC, Pletneva LM, Pang C, Kurt-Jones E, et al. Novel strategies for 604
targeting innate immune responses to influenza. Mucosal immunology (2016) 9:1173–82. 605
doi:10.1038/mi.2015.141. 606
38. Ahout IM, Brand KH, Zomer A, van den Hurk WH, Schilders G, Brouwer ML, et al. Prospective 607
observational study in two Dutch hospitals to assess the performance of inflammatory plasma 608
markers to determine disease severity of viral respiratory tract infections in children. BMJ open 609
(2017) 7:e014596. doi:10.1136/bmjopen-2016-014596. 610
39. Wicher KB, Fries E. Haptoglobin, a hemoglobin-binding plasma protein, is present in bony fish 611
and mammals but not in frog and chicken. Proceedings of the National Academy of Sciences of 612
the United States of America (2005) 103:4168–73. doi:10.1073/pnas.0508723103. 613
40. Kurosky A, Barnett DR, Lee TH, Touchstone B, Hay RE, Arnott MS, et al. Covalent structure of 614
human haptoglobin: A serine protease homolog. Proceedings of the National Academy of 615
Sciences of the United States of America (1980) 77:3388–92. 616
41. Nielsen MJ, Petersen SV, Jacobsen C, Thirup S, Enghild JJ, Graversen JH, et al. A unique loop 617
extension in the serine protease domain of haptoglobin is essential for CD163 recognition of the 618
.CC-BY-ND 4.0 International licenseIt is made available under a (which was not peer-reviewed) is the author/funder, who has granted bioRxiv a license to display the preprint in perpetuity.
The copyright holder for this preprint. http://dx.doi.org/10.1101/157578doi: bioRxiv preprint first posted online Jun. 30, 2017;

25
haptoglobin-hemoglobin complex. The Journal of biological chemistry (2007) 282:1072–9. 619
doi:10.1074/jbc.M605684200. 620
42. Fasano A. Regulation of intercellular tight junctions by zonula occludens toxin and its eukaryotic 621
analogue zonulin. Annals of the New York Academy of Sciences (2000) 915:214–22. 622
.CC-BY-ND 4.0 International licenseIt is made available under a (which was not peer-reviewed) is the author/funder, who has granted bioRxiv a license to display the preprint in perpetuity.
The copyright holder for this preprint. http://dx.doi.org/10.1101/157578doi: bioRxiv preprint first posted online Jun. 30, 2017;

26
Tables 623
Table 1: Composition of the study cohort included in zonulin measurements. 624 all female male n 376 233 143 Age (years) 53.3 ± 16.2 52.7 ± 15.8 54.2 ± 16.8 BMI (kg/m²) 28.1 ± 5.6 27.9 ±5.9 28.5 ± 5.1 NGT 191 (50.8%) 124 (53.2%) 67 (46.8%) IGT 79 (21.0%) 49 (21.0%) 30 (21.0%) T2D 106 (28.2 %) 60 (25.8%) 46 (32.2%) Age and BMI are mean ± SD, NGT, IGT, T2D as absolute number (percentage); NGT: 625 normal glucose tolerance; IGT: impaired glucose tolerance; IFG: impaired fasting glucose 626 627
Table 2: Main characteristics of the study participants. 628 NGT IGT T2D n 191 79 106 Age (years) 45.4 ± 15.6 59.7 ± 29.4** 62.9 ± 11.2** BMI (kg/m²) 25.8 ± 5 29.7 ± 4.6** 30.97 ± 5.53** WHR 0.84 ± 0.10 0.92 ± 0.09 0.94 ± 0.09** FPG (mmol/l) 5.15 ± 0.50 5.68 ± 0.56** 7.72 ± 2.43** °° 120 min PG (mmol/l) 5.00 ± 1.40 8.95 ± 0.98** 5.78 ± 6.86 °° Triglycerides (mmol/l) 1.29 ± 0.94 1.56 ± 0.92* 1.87 ± 1.24** Fasting Insulin (pmol/l) 35.90 ± 25.98 53.56 ± 25.98** 62.38 ± 43.07** 120 min Insulin (pmol/l) 148.39 ± 133.58 409.28 ± 232.81** 182.22 ± 272.34 °° HDL (mmol/l) 1.69 ± 0.40 1.56 ± 0.36* 1.43 ± 0.39** ° LDL (mmol/l) 3.20 ± 0.96 3.70 ± 1.06** 3.33 ± 0.95 ° Total cholesterol (mmol/l) 5.12 ± 1.03 5.57 ± 1.18* 5.27 ± 0.99 HOMA IR (pmol/l*mmol/l) 1.34 ± 1.06 2.30 ± 1.1** 3.58 ± 2.87** °° HOMA IS (ratio) 1.07 ± 0.76 0.67 ± 0.78** 0.68 ± 1.63** CRP (mg/l) 2.22 ± 4.20 3.19 ±4.54 3.87 ± 4.76** Zonulin (ng/ml) 67.25 ± 25.45 71.88 ± 29.36 81.78 ± 25.31** °° 629 *: p<0.05 vs NGT; **: p<0.01 vs NGT 630 °: p<0.05 vs IGT; °°: p<0.01 vs IGT 631 All data given as mean ± standard deviation, NGT: normal glucose tolerance, IGT: impaired 632 glucose tolerance, T2D: type 2 diabetes, CRP: C-reactive protein, HDL: High density 633 lipoprotein, LDL: Low density lipoprotein, FPG: Fasting plasma glucose, WHR: Waist to hip 634 ratio 635 636 Table 3: Correlation of ELISA signal with metabolic phenotypes. 637
Non-adjusted Adjusted for age, sex, BMI
r p-value r p-value
Anthropometric trait
Age 0.31 0.55 - - Sex -0.005 0.93 - -
BMI 0.221 1.2x10⁻⁵ - -
WHR 0.172 7.3x10⁻⁴ 0.118 2.1 x10⁻² Glucose metabolism
Glucose (0 min) 0.294 6.6x10⁻⁹ 0.227 9.0 x10⁻⁶ Glucose (120 min) -0.039 0.45 -0.046 0.38
Insulin (0 min) 0.173 7.7x10⁻⁴ 0.079 0.13
Insulin (120 min) -0.039 0.46 -0.044 0.39 HOMA IR 0.244 2.0x10⁻⁶ 0.149 4.0 x10⁻³
.CC-BY-ND 4.0 International licenseIt is made available under a (which was not peer-reviewed) is the author/funder, who has granted bioRxiv a license to display the preprint in perpetuity.
The copyright holder for this preprint. http://dx.doi.org/10.1101/157578doi: bioRxiv preprint first posted online Jun. 30, 2017;

27
HOMA IS -0.243 2.0x10⁻⁶ -0.145 4.9 x10⁻³ Lipid metabolism Triglycerides 0.370 6.5x10⁻¹⁴ 0.312 4.2 x10⁻¹⁰ Total cholesterol 0.219 1.5x10⁻⁵ 0.211 3.3x10⁻⁵ LDL 0.182 3.4x10⁻⁴ 0,160 1.7 x10⁻³ HDL -0.136 7.7x10⁻³ -0.063 0.22
Apolipoprotein B 0.247 9.9x10⁻⁷ 0.215 2.3x10⁻⁵ Adipokines
Adiponectin -0.215 2.2x10⁻⁶ -0.176 5.4x10⁻⁴ Progranulin 0.151 3.0x10⁻³ 0.129 1.1 x10⁻² Vaspin 0.027 0.6 0.05 0.33
Chemerin 0.103 4.3x10⁻² 0.065 0.21
FGF21 0.165 2.1x10⁻³ 0.152 4.7x10⁻³ Other
C-reactive protein 0.232 4.0x10⁻⁶ 0.166 1.1x10⁻³ Total protein 0.124 1.5x10⁻² 0,134 8.6x10⁻³ Hemoglobin 0.201 7.4x10⁻⁵ 0.143 5.1x10⁻³ Uric acid 0.176 5.2x10⁻⁴ 0.110 3.1 x10⁻²
638 bold: significant correlations after adjustment, underlined: significant after Bonferroni 639 adjustment for multiple testing (p<5.2x10⁻⁴); r: Spearman rank correlation coefficient, p: 640 significance level; BMI: Body Mass Index; HDL: High density lipoprotein, LDL: Low 641 density lipoprotein, WHR: Waist to hip ratio, FGF21: Fibroblast growth factor 21, HOMA-642 IR/IS: Homeostasis Model Assessment Insulin Resistance/ Insulin Sensitivity. 643 644
.CC-BY-ND 4.0 International licenseIt is made available under a (which was not peer-reviewed) is the author/funder, who has granted bioRxiv a license to display the preprint in perpetuity.
The copyright holder for this preprint. http://dx.doi.org/10.1101/157578doi: bioRxiv preprint first posted online Jun. 30, 2017;
28
Figure legends 645
646
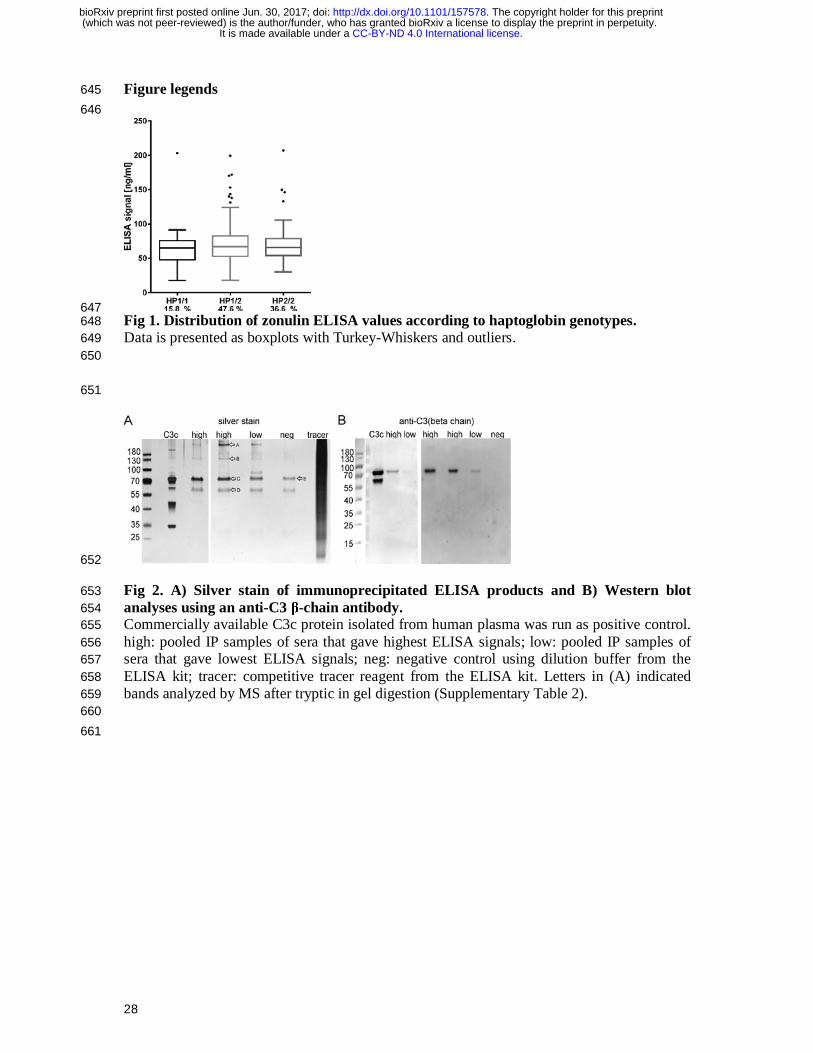
647 Fig 1. Distribution of zonulin ELISA values according to haptoglobin genotypes. 648 Data is presented as boxplots with Turkey-Whiskers and outliers. 649 650
651
652
Fig 2. A) Silver stain of immunoprecipitated ELISA products and B) Western blot 653 analyses using an anti-C3 β-chain antibody. 654 Commercially available C3c protein isolated from human plasma was run as positive control. 655 high: pooled IP samples of sera that gave highest ELISA signals; low: pooled IP samples of 656 sera that gave lowest ELISA signals; neg: negative control using dilution buffer from the 657 ELISA kit; tracer: competitive tracer reagent from the ELISA kit. Letters in (A) indicated 658 bands analyzed by MS after tryptic in gel digestion (Supplementary Table 2). 659 660
661
.CC-BY-ND 4.0 International licenseIt is made available under a (which was not peer-reviewed) is the author/funder, who has granted bioRxiv a license to display the preprint in perpetuity.
The copyright holder for this preprint. http://dx.doi.org/10.1101/157578doi: bioRxiv preprint first posted online Jun. 30, 2017;
662
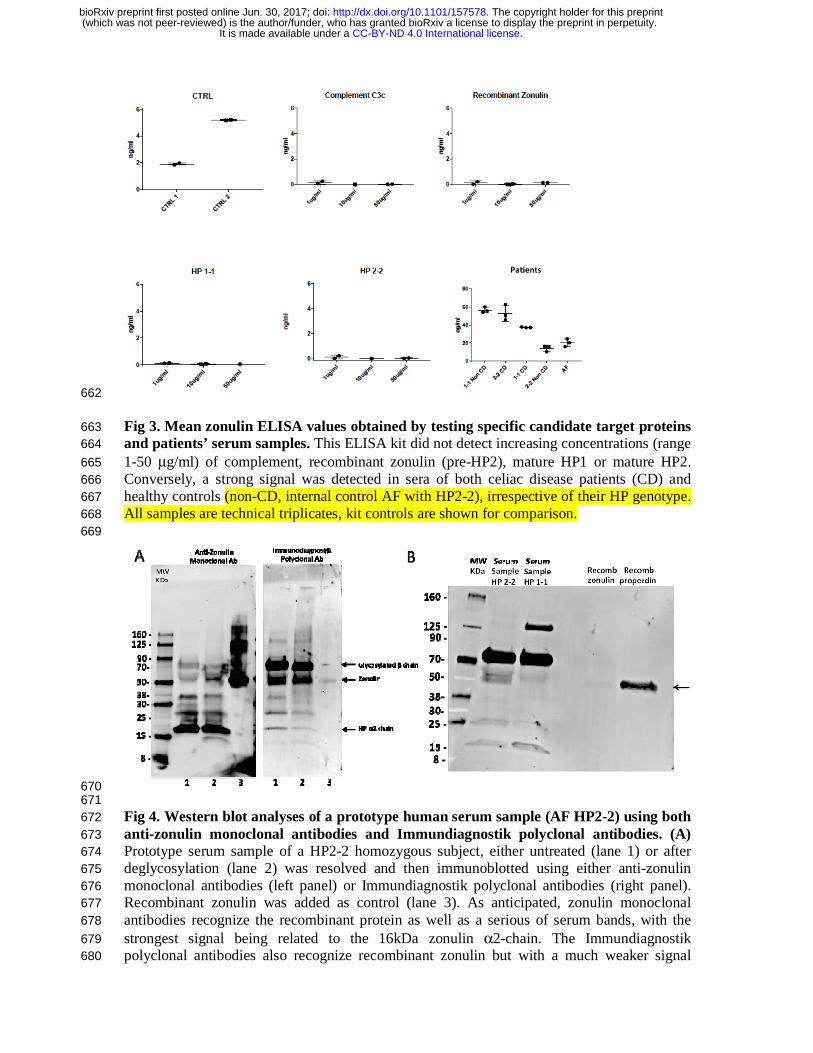
Fig 3. Mean zonulin ELISA values obtained by testing specific candidate target proteins 663 and patients’ serum samples. This ELISA kit did not detect increasing concentrations (range 664
1-50 μg/ml) of complement, recombinant zonulin (pre-HP2), mature HP1 or mature HP2. 665 Conversely, a strong signal was detected in sera of both celiac disease patients (CD) and 666 healthy controls (non-CD, internal control AF with HP2-2), irrespective of their HP genotype. 667 All samples are technical triplicates, kit controls are shown for comparison. 668 669
670 671 Fig 4. Western blot analyses of a prototype human serum sample (AF HP2-2) using both 672 anti-zonulin monoclonal antibodies and Immundiagnostik polyclonal antibodies. (A) 673 Prototype serum sample of a HP2-2 homozygous subject, either untreated (lane 1) or after 674 deglycosylation (lane 2) was resolved and then immunoblotted using either anti-zonulin 675 monoclonal antibodies (left panel) or Immundiagnostik polyclonal antibodies (right panel). 676 Recombinant zonulin was added as control (lane 3). As anticipated, zonulin monoclonal 677 antibodies recognize the recombinant protein as well as a serious of serum bands, with the 678
strongest signal being related to the 16kDa zonulin α2-chain. The Immundiagnostik 679 polyclonal antibodies also recognize recombinant zonulin but with a much weaker signal 680
.CC-BY-ND 4.0 International licenseIt is made available under a (which was not peer-reviewed) is the author/funder, who has granted bioRxiv a license to display the preprint in perpetuity.
The copyright holder for this preprint. http://dx.doi.org/10.1101/157578doi: bioRxiv preprint first posted online Jun. 30, 2017;
30
compared to the monoclonal antibodies. These antibodies also recognize the same serum 681 bands detected by the zonulin monoclonal antibodies, with the ~70 and 52 kDa bands being 682 highlighted with the strongest signal. Sample’s deglycosyltation showed the shift of the 70 683 kDa band to a lower MW, suggesting that this may represent the zonulin β-chain as we have 684 previously shown (14). (B) Prototype serum samples of a HP1-1 and a HP2-2 homozygous 685 subject were resolved and immunoblotted using the Immundiagnostik polyclonal antibodies. 686 Recombinant zonulin and properdin were added as control. The antibodies also detect 687 properdin that migrated at the same molecular weight of zonulin and serum bands recognized 688 by the antibodies in both HP2-2 and HP 1-1 subjects. 689
690
691
692
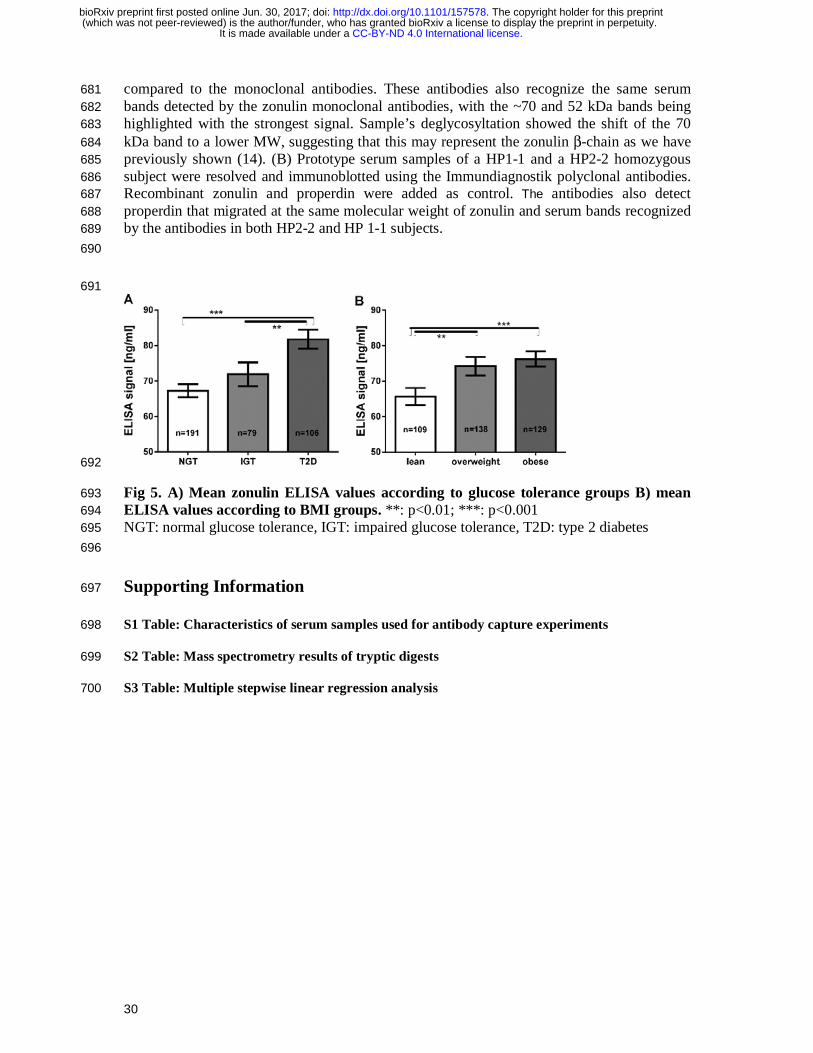
Fig 5. A) Mean zonulin ELISA values according to glucose tolerance groups B) mean 693 ELISA values according to BMI groups. **: p<0.01; ***: p<0.001 694 NGT: normal glucose tolerance, IGT: impaired glucose tolerance, T2D: type 2 diabetes 695
696
Supporting Information 697
S1 Table: Characteristics of serum samples used for antibody capture experiments 698
S2 Table: Mass spectrometry results of tryptic digests 699
S3 Table: Multiple stepwise linear regression analysis 700
.CC-BY-ND 4.0 International licenseIt is made available under a (which was not peer-reviewed) is the author/funder, who has granted bioRxiv a license to display the preprint in perpetuity.
The copyright holder for this preprint. http://dx.doi.org/10.1101/157578doi: bioRxiv preprint first posted online Jun. 30, 2017;
Top Related