


Languages
Pages
Legal


TVE 13 024 juni
Examensarbete 15 hpJuni 2013
Why buildings’ energy use differ from expected values A study of sustainable building with focus
on the planned area Östra Sala backe
Ida ErikssonLisa PetterssonSofia Stadler

Teknisk- naturvetenskaplig fakultet UTH-enheten Besöksadress: Ångströmlaboratoriet Lägerhyddsvägen 1 Hus 4, Plan 0 Postadress: Box 536 751 21 Uppsala Telefon: 018 – 471 30 03 Telefax: 018 – 471 30 00 Hemsida: http://www.teknat.uu.se/student
Abstract
Why buildings’ energy use differ from expected values
Ida Eriksson, Lisa Pettersson, Sofia Stadler
The municipality of Uppsala together with eight constructors are currently planning asustainable residential area in Östra Sala backe. The aim of this report is to identifythe main factors that are important when calculating the specific energy use in anapartment building. Two previous similar projects, Västra Hamnen in the city ofMalmö and Hammarby Sjöstad in the city of Stockholm, are studied and simulations inVIP-energy are performed. Sensitivity analyses concerning the indoor temperature,the efficiency of FTX-systems and the U-values of windows are also executed.
The simulations are based on information from the constructors of Östra Sala backe,standard values and mean values from Västra Hamnen and Hammarby Sjöstad. Theresults show that differences between the estimated and measured values in specificenergy use can reach about 50 %, or 25.2 kWh per m2 ATEMP and year, and that theefficiency of the FTX-system is the most important parameter.
ISSN: 1650-8319, UPTEC STS13 024Examinator: Joakim WidénÄmnesgranskare: Magnus ÅbergHandledare: Anders Hollinder

Definitions ATEMP The area of all floors that is intended to be heated to more
than 10° Celsius (National Board of Housing, Building and
Planning, 2011).
GFA Gross floor area. The living area usable for accommodation,
wholly or partly above ground. This term does not include
storage rooms, garbage rooms and other not heated areas
(Swedish Energy Agency , 2013a).
GTA Gross total area. The total area of the building, including the
living area and all other parts of a building, such as storage
rooms and garbage rooms.
Specific energy use The energy use of the building divided by ATEMP. The unit is
kWh per m2
ATEMP and year (National Board of Housing,
Building and Planning, 2011).
Total energy use The energy use, including the household electricity, of the
building divided by ATEMP. The unit is kWh per m2 ATEMP
and year.
Property electricity Electricity that is related to the needs of the building, for
example lightning of public areas, pumps and fans (National
Board of Housing, Building and Planning, 2011).
Household electricity The electricity that is used for household purposes, for
example the electricity use for dishwashers, washing
machines, stoves and fridges (National Board of Housing,
Building, and Planning, 2011).
Thermal bridge A detail in the construction where a material with poor
thermal insulation is connected to a material with good
thermal insulation (National Encyclopedia, 2013).
U-value The amount of lost heat per square metre at a difference of
one degree Kelvin between the indoor and the outdoor
temperature (Swedish Energy Agency, 2013b).
BBR A set of regulation regarding buildings set up by the National
Board of Housing, Building and Planning

1
Table of contents 1. Introduction ....................................................................................................................... 2
1.1 Aim of the report ............................................................................................................ 2
1.2 Delimitations .................................................................................................................. 3
1.3 Disposition ..................................................................................................................... 3
2. Östra Sala backe - A future sustainable residential area .............................................. 4
2.1 Sustainable vision for Östra Sala backe........................................................................ 5
3. Energy use in buildings .................................................................................................... 6
3.1 Parameters for calculating energy use .......................................................................... 6
3.1.1 Indoor temperature ................................................................................................ 7
3.1.2 FTX-system ........................................................................................................... 7
3.1.3 Internal heat gain from human presence............................................................... 8
3.1.4 Airing and energy efficient windows ...................................................................... 8
3.2 The National Board of Housing, Building and Planning ................................................ 9
3.3 Labelling of low energy buildings .................................................................................. 9
3.4 Building integrated energy utilisation ........................................................................... 10
4. Previous Swedish sustainable residential areas ......................................................... 10
4.1 Västra Hamnen ............................................................................................................ 10
4.2 Hammarby Sjöstad ...................................................................................................... 12
4.3 Summary of expected and measured values .............................................................. 14
5. Simulations of the energy use in a building in Östra Sala backe .............................. 15
5.1 VIP-energy ................................................................................................................... 16
5.2 Simulating three different cases .................................................................................. 16
5.3 Performing sensitivity analyses ................................................................................... 17
5.4 Calculating the energy use .......................................................................................... 17
6. Data for the building model and the sensitivity analyses ........................................... 18
7. Results from the simulations and sensitivity analyses .............................................. 19
8. Discussion ....................................................................................................................... 22
8.1 Västra Hamnen and Hammarby Sjöstad ..................................................................... 22
8.2 Östra Sala backe ......................................................................................................... 23
8.3 Improve sustainability in a residential area ................................................................. 24
9. Conclusions ..................................................................................................................... 26
10. References ....................................................................................................................... 27
10.1 Reports .................................................................................................................... 27
10.2 Web pages .............................................................................................................. 28
10.3 Other references ...................................................................................................... 30
Appendix .................................................................................................................................... 31
2
1. Introduction Energy systems are fundamental for human activities. The environmental impact of
some of those systems, such as emissions of greenhouse gases and ecosystem
degradations, is however significant (Dodoo, 2011). The world population is currently 7
billion people, and it is expected to exceed 9 billion by 2050 (United Nations, 2011). In
order for all people to have the same standard without jeopardising the environment, the
energy consumption must be reduced.
Due to the critical situation, the European Union has formed environmental goals that
should be reached by 2020. Two of the goals are to improve the energy efficiency with
20 %, and to increase the share of renewable energy to 20 % (European Commission,
2012). Each member state has formed national goals in order to achieve a sustainable
development (Wade et al., 2011). In Sweden, about 39 % of the total energy
consumption is consumed in buildings and by the building sector. Almost 60 % of this
energy is used for space heating and domestic hot water (Swedish Energy Agency,
2010).
Uppsala city is expanding rapidly and the need of dwellings increases. To manage the
migration rate, the expansion of the city and the current environmental issues, Uppsala
municipality has decided to build a sustainable residential area in Östra Sala backe. The
purpose of the project is to create a coherent urban structure with a distinct
environmental profile. The municipality of Uppsala wants the project of Östra Sala
backe to become a role model for similar projects, with high ambitions regarding
climate friendly solutions and a life-cycle perspective (Uppsala municipality, 2010).
Due to the fact that the energy consumption needs to be decreased, and that the building
sector in Sweden constitutes a large part of the Swedish energy use, it is important to
investigate the possibilities of minimizing the energy use in buildings. Sustainable
residential areas have previously been built in Sweden, two of those in Västra Hamnen
in Malmö and Hammarby Sjöstad in Stockholm. In both projects the ambitious goals for
the building’s energy use were not reached. By revising the previous projects and learn
from these, the municipality of Uppsala has the vision that Östra Sala backe should
become the most successful sustainable residential area in Sweden as yet.
1.1 Aim of the report
The aim of this report is to identify the main factors that are crucial to why the energy
use of a building may differ from expected values in the construction planning. This is
performed by analysing two previous projects concerning sustainable residential areas
in Sweden and comparing the results with the expected values for energy use for Östra
Sala backe. In order to do so, simulations and sensitivity analyses are executed, where
the values of the main factors are varied. The aim is also to compare the calculated
specific energy use with restrictions from BBR and Lågan and to discuss how the
sustainability in a residential area can be improved.

3
The research questions are:
Which factors are identified as the main reasons to why Hammarby Sjöstad and
Västra Hamnen did not reach their goals of specific energy use in buildings?
How could those factors affect the total and specific energy use of the buildings
in Östra Sala backe?
How can the sustainability in a residential area be improved?
1.2 Delimitations
In this thesis a model of one building in Östra Sala backe is used as a reference for all
calculations. The calculations do not consider all the different types of buildings that
will be built in Östra Sala backe. The calculations only include parameters that affect
the specific and total energy use in a building, and do not include other effects on
sustainability such as car pools, public transportation or recycling. These complex
topics are instead treated in the discussion in Section 8. When performing the sensitivity
analyses three parameters are considered, efficiency of the FTX-system, indoor
temperature and U-values for windows. All other parameters are disregarded.
1.3 Disposition
This report starts with information about the planning of Östra Sala backe and the
project’s goals for sustainability. It continues by describing the planning and the results
for the previous projects of Västra Hamnen in Malmö and Hammarby Sjöstad in
Stockholm. This is followed by a section with descriptions of energy use in buildings
and different labelling of low energy houses. Then the simulations and the data are
presented before the results of the calculations and discussion sections.
4
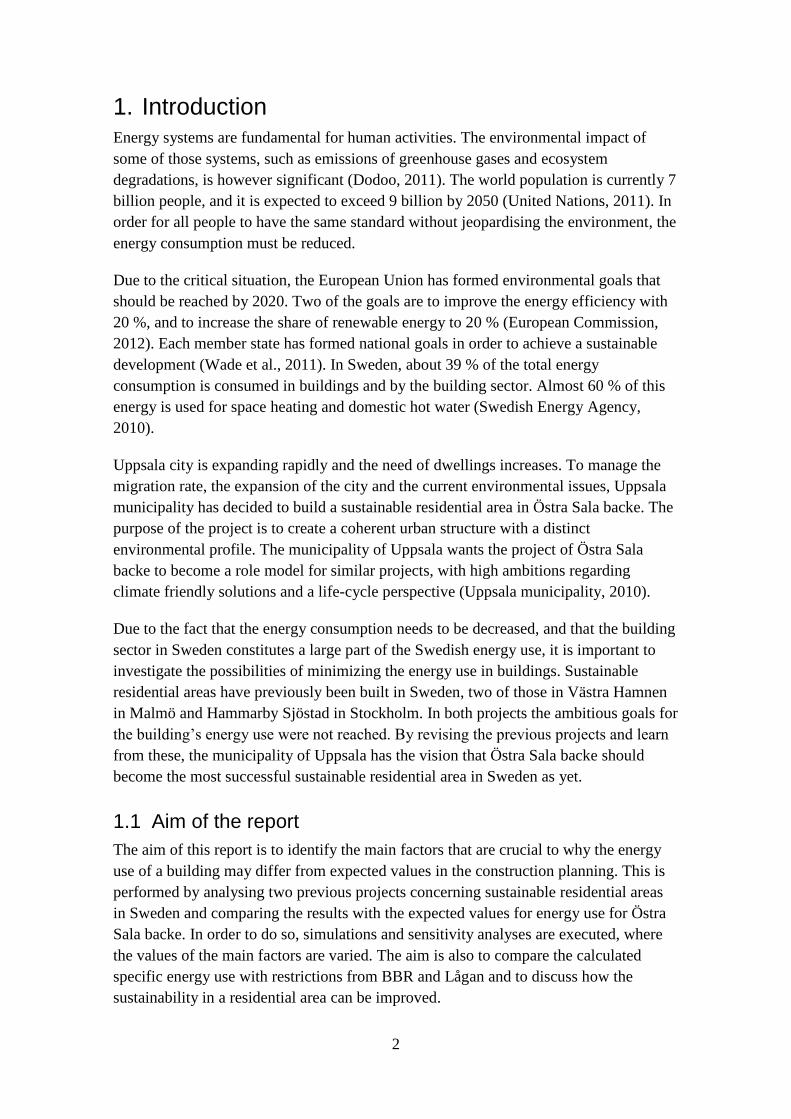
2. Östra Sala backe - A future sustainable residential area
This section provides a comprehensive description of the studied project and its
sustainable profile. Background information about Östra Sala backe is provided along
with the criteria for sustainability set for the area.
Uppsala is a fast growing city and there is a big need for new residential buildings.
Between the two city districts Fyrislund and Boländerna the new residential area of
Östra Sala backe is planned, as seen in Figure 1. This area previously consisted of a
wide power line street up until 2006 when the power line was removed. The removal of
the power line created room for about 2 500 new housings in the area and the
municipality also consider Östra Sala backe an opportunity to close the gap between the
current city districts of Sala Backe and Årsta. Uppsala municipality wants to create a
new unique residential district that focus on sustainability from ecological, economic
and social perspectives. The ambition for the project is to become the most
environmentally friendly residential area in Sweden. The project will also be a pilot
project in environmental constructions and climate adaption (Uppsala municipality,
2010).
In order to achieve this, Uppsala municipality for example wants to install solar cells on
the roofs of buildings, use environmentally friendly waste disposal, recycle heat from
wastewater and build houses with low energy use. The infrastructure of the Östra Sala
backe area will also encourage transportation by bike, public transportation or walking
(Uppsala municipality, 2010).
Figure 1. A map that shows were Östra Sala backe is located and a closer view over the
area (Bakgrund, Uppsala municipality, 2013).

5
A commonly used definition of sustainable development is the one stated by the United
Nations in the Brundtland Report: “development that meets the needs of the present
without compromising the ability of future generations to meet their own needs”
(United Nations, 1987). Sustainable development involves environmental protection,
economic development and social well-being. In order to understand the definitions of
sustainable development, the whole world must be seen as a system where actions in
one part of the world affect another part, and where the actions of today will affect the
world of tomorrow (International Institute for Sustainable Development, 2013).
2.1 Sustainable vision for Östra Sala backe
To support the planning, the implementation and the follow-up of Östra Sala backe, a
variety of criteria for sustainability have been developed. The criteria have been set in
collaboration between Uppsala municipality and the eight constructors who have
obtained permission to build in Östra Sala backe. There are a few criteria set regarding
climate and sustainable buildings, whereof two are shown below:
Östra Sala backe will be built sustainable and with a life-cycle perspective.
Östra Sala backe will be built to minimize the energy use in buildings and to be
profiled towards energy effective technology.
One outcome of these goals is a vision that the buildings will have a specific energy use
of between 30 and 40 kWh per m2 ATEMP and year, and that renewable energy will be
produced locally. Technical systems and concepts that support low energy consumption,
such as heat exchange systems, will be installed. In order to achieve an international
environmental label, the municipality of Uppsala aims to use an environmental
assessment method called BREAAM (Hollinder, 2013).
Eight building constructors have been hired to implement the construction of Östra Sala
backe. The constructors now have a ground permit based on blueprints and plans for the
construction of Östra Sala backe. All constructors listed estimations for the total and
specific energy in the buildings and specified values for parameters such as domestic
hot water, indoor temperature, property and household electricity and the potential use
of building integrated energy utilization. Out of all the constructors, seven have listed
the use of a heating exchange system, and three have stated that the system will have an
efficiency of 90 %. In two of the applications the factor airing can be recognized, but it
is possible that this factor is included in the specific energy use given by all constructors
(Hamrefors et al., 2012). Table 1 contains the average values the constructors listed in
the application to Uppsala municipality.

6
Table 1.The average of expected values for some parameters in buildings in Östra Sala
backe (Hamrefors et al., 2012).
Parameter Expected value
Indoor temperature [° Celsius] 20.6
Specific energy use [kWh per m2 ATEMP and year] 56.0
Space heating [kWh per m2 ATEMP and year] 21.4
Domestic hot water [kWh per m2 ATEMP and year] 23.5
Household electricity [kWh per m2 ATEMP and year] 34.7
Property electricity [kWh per m2 ATEMP and year] 12.9
3. Energy use in buildings When calculating the energy use in buildings, several parameters must be included.
Some of these are shown in Figure 4. All the parameters that are used in the calculations
in this thesis will be introduced in this section. Some requirements and environmental
classifications that can be considered and used as references for specific energy use are
also presented.
3.1 Parameters for calculating energy use
A range of criteria has to be considered when calculating the energy use of a building.
Energy is added to space heating, domestic hot water and the use of electricity. Energy
is gained from a heat exchanger, solar cells on the roof, solar radiation through windows
and internal gain from human presence. Losses occur through airing and leakages
through the building shell (National Board of Housing, Building and Planning, 2009).

7
Figure 4. All parameters included in the calculations (National Board of Housing,
Building and Planning, 2009).
3.1.1 Indoor temperature
When estimating the energy use in a building, the expected indoor temperature must be
considered. The lowest indoor temperature to achieve thermal comfort is 18° Celsius
according to the National Board of Housing, Building and Planning. If the indoor
temperature is unknown in the planning stage, 22° Celsius is recommended to be used
for energy use estimations (National Board of Housing, Building and Planning, 2012).
A survey performed by the Swedish Energy Agency shows that the average indoor
temperature in apartments in Sweden is 22.5° Celsius (Swedish Energy Agency, 2007).
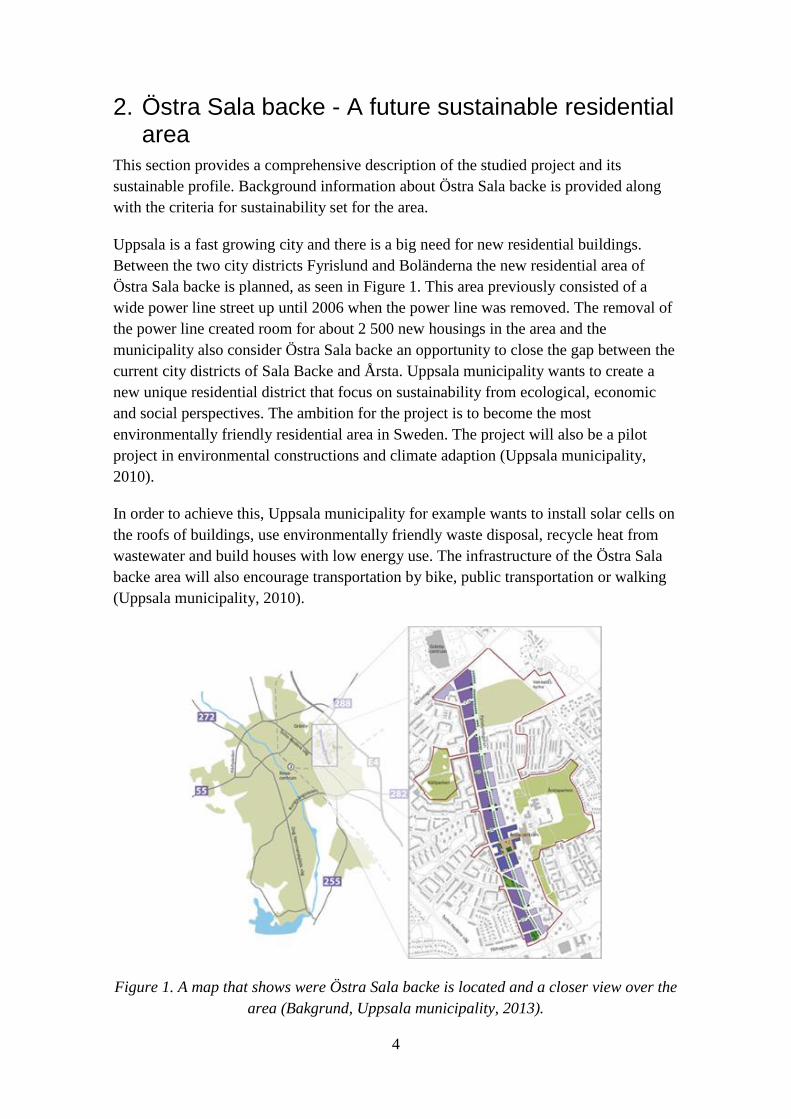
3.1.2 FTX-system
An FTX-system is an energy efficient solution, where the exhaust air is taken from the
kitchen and the bathroom, and the supply air is lead to the bedroom and the living room.
In the heat exchanger, the heat from the warm exhaust air is transferred to the cold
supply air from outdoors (Swedish Energy Agency, 2011a). An illustration of an FTX-
system is shown in Figure 5. The efficiency of an FTX-system is usually between 75
and 85 % (Energihuskalkyl, 2013), but there is one investigation indicating that FTX-
systems in apartment buildings can have efficiencies as low as 20 % (Andreasson et al.,
2009).
FTX -
system
Domestic
hot water
Internal heatgain
Airing and and heat losses
Space heating
Property electricity
8
Figure 5.A FTX-system. The numbers in the figure show: 1. Supply air, 2. Heat
exchanger, 3. Heated supply air, 4. Exhaust air and 5. Chilled Exhaust air (Swedish
Energy Agency, 2011a).
3.1.3 Internal heat gain from human presence
When approximating the heat gain from human presence in a building, a mean value of
80 W per person can be used. The average time that a person spends at home is 14 hours
per day, and the number of persons living in different types of apartments can be
estimated according to the figures in Table 5 (Sveby, 2012).
Table 5.Recommended numbers of residents per apartment of varying sizes (Sveby,
2012).
Size of
apartment
1
bedroom
2
bedrooms
3
bedrooms
4
bedrooms
5
bedrooms
6 +
bedrooms
Number of
residents
1.42 1.63 2.18 2.79 3.51 3.51
3.1.4 Airing and energy efficient windows
Airing is a parameter that affects the energy use in buildings and relates to the resident’s
activities. How much the residents air depend on what type of ventilation system the
building has, how much wind the building is exposed to and the behaviour of the
residents. Research show that airing has a large impact on the energy performance of a
building and Sveby recommends that 4 kWh per m2 and year should be added to the
specific energy use to represent airing (Sveby, 2012).
When building a new house, windows with the maximum U-value 1.0 W per m2 and
Kelvin should be used. Energy labelled windows with the U-value 0.9 W per m2 and
Kelvin or less are the best windows available on the market (Swedish Energy Agency,
2013c).

9
3.2 The National Board of Housing, Building and Planning
The National Board of Housing, Building and Planning in Sweden has defined
requirements that regulate energy performance, health, environment, construction and
safety of buildings (National Board of Housing, Building, and Planning, 2013). These
requirements for construction are compiled in a set of regulations called BBR. In order
to decrease the energy consumption in Swedish buildings, regulations for specific
energy use have been established. The National Board of Housing, Building and
Planning uses three different climate zones that represent northern, middle and southern
Sweden and the requirements for specific energy use differ depending on which climate
zone the building is located in. The specific energy use for a new building in the
Uppsala region, which is located in climate zone III, is 55 kWh per m2 ATEMP and year
if the building uses electricity for heating and 90 kWh per m2 ATEMP and year if another
source of heating, for example district heating, is used (National Board of Housing,
Building and Planning, 2011).
3.3 Labelling of low energy buildings
There are many methods for labelling low energy buildings, both national and
international. In this report classifications from Lågan and BREEAM are discussed.
Lågan was founded in 2010 and is a five-year program aiming to improve the energy
efficiency in buildings. It is partly financed by the Swedish Energy Agency and it is
coordinated and administered by the Swedish Construction Federation (Lågan, 2013).
Lågan has set up classifications of buildings, based on the BBR requirements:
Class A: Specific energy use 50 % better than the requirements in BBR
Class B: Specific energy use 25 % better than the requirements in BBR
Class C: Specific energy use better than or equal to the requirements in BBR
(Lågan, 2013).
BREEAM, BRE Environmental Assessment Method, is an environmental assessment
method and rating system for buildings. BREEAM was first launched in Great Britain
in 1990 and the method has spread all over Europe. There are now over 250 000
buildings certified with BREEAM’s assessment ratings and more than a million
buildings registered for assessment. The idea is to encourage designers, constructors and
others to think about low carbon and low impact design, and to minimize the energy
demands in buildings. The assessment uses measures of performance, which are set
against benchmarks, to evaluate a building’s specification, construction, design and use.
This gives a broad range of categories and criteria that represent aspects related to
energy and water use, the internal environment, pollution, transport, materials, waste,
ecology and management processes (Breeam, 2013). In order to simplify the
certification of buildings in Sweden, the Sweden Green Building Council is currently
working on the adjustment of BREEAM to Swedish conditions. The Swedish manual is
expected to be released in 2013 (Swedish Green Building Council, 2011).
10
3.4 Building integrated energy utilisation
In order to lower the net energy consumption in buildings, a building integrated energy
system can be installed. There are different types of these systems, for example solar
cells, solar thermal collectors or small-scale wind power mills. For building integrated
energy utilisation, solar energy has proven much more efficient than wind power in
order to lower the building’s energy use (Netterstedt, 2012). This thesis therefore only
discusses building integrated solar energy systems.
In solar cells, the sun’s radiation is transformed into electricity. When sunlight hits the
solar cell a voltage occurs that sets the cell’s electrons in movement. The movement of
electrons creates a current, which is lead from the solar cell by wires. The process does
not need any fuel, it does not move and it is completely quiet. Another advantage with
solar cells is that an installation can be integrated in the building and thereby generate
electricity close to the user (Swedish Energy Agency, 2011b). In solar thermal
collectors, the sun’s radiation is turned into heat when the sunlight hits a black, matte
surface. The heat is transported by water or by a gas to a tank filled with water. The
water in the tank is heated and transported to the hot water- and heating system in the
building (Swedish Energy Agency, 2011c). Since Östra Sala backe most probably will
be connected to the district heating system in Uppsala, and solar thermal collectors
therefore will compete with this system, this thesis will focus on the use of solar cells
and disregard solar thermal collectors.
4. Previous Swedish sustainable residential areas There are a few already existing areas in Sweden with an explicit focus on sustainable
development, like Östra Sala backe. Two of these projects will be presented in this
chapter, Västra Hamnen in the city of Malmö and Hammarby Sjöstad in the city of
Stockholm.
4.1 Västra Hamnen
Västra Hamnen is a residential area in Malmö containing the neighbourhood
Flagghusen, an area with 17 buildings built by 13 different constructors. In 2004, when
the decision to build Flagghusen was taken, the goal was to build sustainable dwellings
to a reasonable price, and to create a sustainable city concept that would be possible to
copy. When planning and building Flagghusen, the prioritized factors were to create
dwellings with a healthy indoor environment, an effective use of energy and an effective
use of resources. In order to reach these goals, four areas where prioritized: energy
efficiency, choice of material, moisture fuse and biological quality. The different
constructors chose different ways in order to reach the sustainability goals. One of the
constructors chose to build a passive house and another chose to build a house that was
energy self-sufficient (Hansson and Nordquist, 2010).

11
Estimations for energy use set for the buildings in the area of Västra Hamnen:
The energy use was set to a maximum of 120 kWh per m2 ATEMP and year,
including the household electricity.
The maximum domestic hot water use was set to 30 kWh per m2
ATEMP and year,
with the exception of the cases where an individual warm water measurement
would be used. The value was then set to 21 kWh per m2 ATEMP and year.
The household electricity was set to 38 kWh per m2 ATEMP and year, based on
the electricity use in the area of Västra Hamnen.
The indoor temperature was set to 22° Celsius, based on the mean value of
apartments according to the National Board of Housing, Building and Planning
(Hansson and Nordquist, 2010).
The requirement for specific energy use from the National Board of Housing, Building
and Planning is 90 kWh per m2
ATEMP and year for southern Sweden, but this number
does not include the household electricity (Hansson and Nordquist, 2010). The rules set
for Flagghusen are therefore stricter than the standard energy use limitations set by the
National Board of Housing, Building and Planning, since the energy use excluding the
target for the household electricity is 82 kWh per m2
ATEMP and year.
A follow up of the energy use and indoor environment of the neighbourhood was done
on behalf of Malmö municipality. The report shows that the energy use in all the 13
dwellings was higher than the calculated values, and only one of the buildings had an
energy use under the goal for total energy use of 120 kWh per m2 ATEMP and year. The
mean value for the total energy use of the dwellings was 141 kWh per m2
ATEMP and
year (Hansson and Nordquist, 2010). Table 2 shows the calculated values and the mean
values for the different components of the energy use.
Table 2. The mean values of the calculated and measured values for the energy use of
Flagghusen in Västra Hamnen (Hansson and Nordquist, 2010).
Parameter Expected value
[kWh per m2 ATEMP
and year]
Measured value
[kWh per m2 ATEMP
and year]
Percentage
[%]
Space heating and
domestic hot water
64.1 89.5 140.0
Property electricity 5.5 19.6 353.0
Specific energy use 69.6 109.1 157.0
Household electricity 38.0 37.4 98.0
Total energy use 107.6 146.5 136.0

12
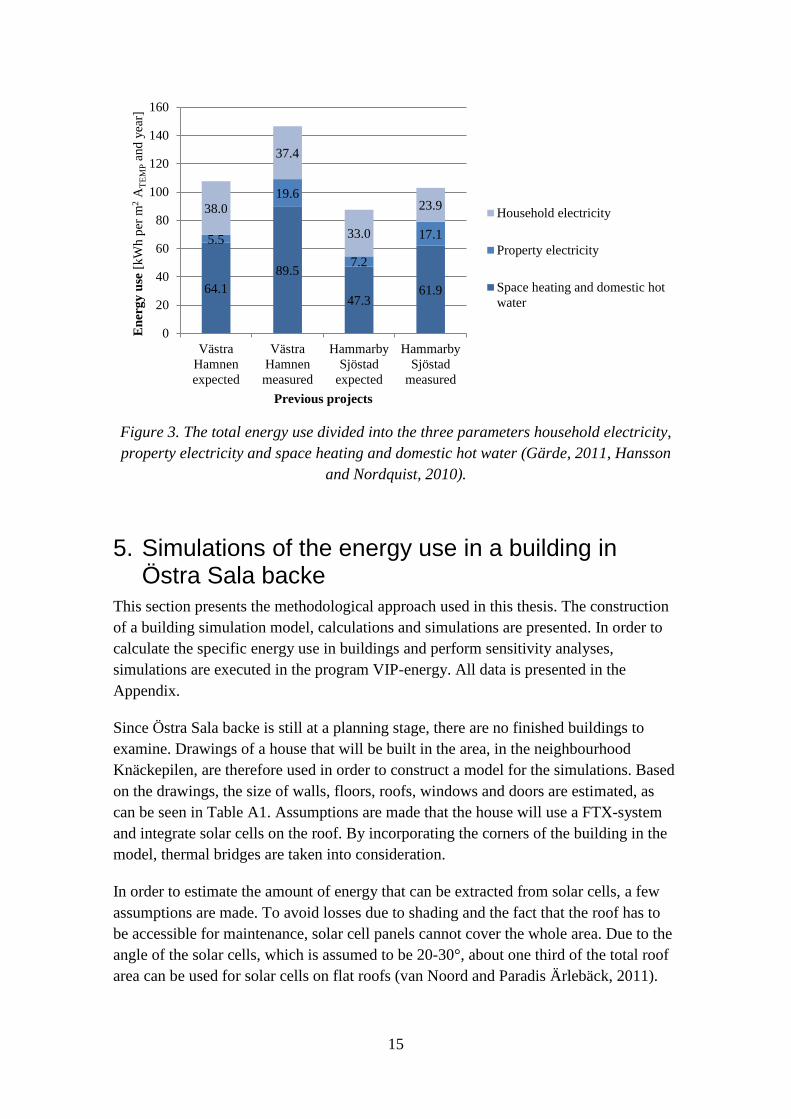
The property electricity has the greatest difference between the expected and the
measured values, which can be explained by the fact that the electricity for elevators
and facility lightning was included in the measurements but not in the calculations
(Hansson and Nordquist, 2010). Due to the difference in magnitude, the space heating
and the domestic hot water have the greatest impact on the measured values compared
to the calculated values. One reason to the greater use of space heating is that the indoor
temperature was calculated to be 22° Celsius but the mean value found when measuring
was 23° Celsius. Further reasons found were that the residents aired and that all the
electricity used in the apartments was assumed to be assimilated as warmth. According
to the Swedish Energy Agency, the assimilated warmth should be 70 % (Hansson and
Nordquist, 2010).
4.2 Hammarby Sjöstad
Hammarby Sjöstad is an on-going residential area project in Stockholm that has
received a great amount of attention for its environmental profile both nationally and
internationally. The aim of the project is to market Stockholm as a city with high
ambitions in the area of sustainable urban development and environmental technology.
The area is still expanding, but the infrastructure and many of the houses of the area are
completed (Brant and Pandis, 2009). Since the project of Hammarby Sjöstad started in
1996, a range of environmental and operational goals has been developed. These
include land use, waste treatment, building materials, energy supply, transportation,
water supply and wastewater (Hammarby Sjöstad, 2009).
Examples of operational goals regarding energy supply are:
The amount of energy supplied will not be more than 60 kWh per m2 ATEMP and
year, whereof electricity 20 kWh per m2 ATEMP and year.
80 % of the extractable energy content in waste and wastewater will be used.
100 % of the energy supply will be based on renewable energy sources (Brant
and Pandis, 2009).
The energy use in the buildings is affected by several parameters. These include
technical solutions, such as windows and insulation, and residential activities, such as
airing, choice of indoor temperature and consumption of hot water (Brant and Pandis,
2009).
Evaluations of Hammarby Sjöstad show that the operational goals have been regarded
as unrealistic and poorly supported by the construction companies. Some goals lack
references and are therefore difficult to measure and interpret. Consequently, there is
room for different interpretations of the goals (Brant and Pandis, 2009). Worth
mentioning is that the energy group Stockholm’s Energy considered 120 kWh per m2
ATEMP and year to be a realistic goal after investigations of the case, but despite this the
politicians set the goal to 60 kWh per m2 ATEMP and year. Neither the energy group nor

13
the constructors were willing to make the extra investments to reach these lower goals
(Green, 2006).
Evaluations of the goals show the following results:
None of the buildings in Hammarby Sjöstad reached the goal for energy use.
The average energy use lies between 142 and 165 kWh per m2 ATEMP and year.
In some of the evaluated buildings the amount of electricity reached 40 to 50
kWh per m2 ATEMP and year, which is more than twice the estimated amount
(Brant and Pandis, 2009).
The domestic waste is treated in the same way as the rest of the residential areas
in Stockholm, which means that 95 % of the waste is incinerated.
The energy supplier for the buildings in this area is Fortum, except for a few
cases where solar panels are used instead. Fortum uses 78 % renewable energy
in their district heating system. Electricity is provided by many different
suppliers and by some local energy sources, such as solar cells, and is therefore
difficult to calculate (Brant and Pandis, 2009).
One evaluation of Hammarby Sjöstad shows that many parameters were incorrectly
estimated. The most important parameters are presented in Table 3 and 4. Further, the
expected efficiency of the heat exchange system was 90 % but the measured value was
65.2 %, and in the estimations of the specific energy use airing was excluded.
Table 3.The estimated values and the measured values in houses in the neighborhood
Kajutan in Hammarby Sjöstad (Gärde, 2011).
Parameter Expected value
[kWh per m2ATEMP and
year]
Measured value
[kWh per m2ATEMP and
year]
Percentage
[%]
Space heating 19.2 40.1 209.0
Domestic hot
water
28.1 21.8 77.6
Property
electricity
7.2 17.1 237.5
Specific energy
use
54.5 79.0 145.0
Household
electricity
33.0 23.9 72.4
Total energy use 87.5 102.9 117.6

14
Table 4. The parameters included in the property electricity, both expected and
measured, in Hammarby Sjöstad (Gärde, 2011).
Parameter of property
electricity
Expected value
[kWh per m2ATEMP and
year]
Measured value
[kWh per m2ATEMP and
year]
Percentage
[%]
Ventilation 5.0 5.5 110.0
Garage fan and electronic
doors
0.0 0.2 -
Lights 1.3 8.7 669.0
Elevators 0.9 0.9 100.0
Pumps 0.0 0.9 -
4.3 Summary of expected and measured values
The bar graph in Figure 2 shows that the expected total energy use is 107.6 kWh per m2
ATEMP and year for Västra Hamnen and 87.5 kWh per m2 ATEMP and year for Hammarby
Sjöstad, and that the measured values are 140.5 kWh per m2 ATEMP and year and 102.9
kWh per m2 ATEMP and year. Figure 3 presents the total energy use in Västra Hamnen
and Hammarby Sjöstad divided into household electricity, property electricity and space
heating and domestic hot water.
Figure 2.The expected and the measured energy use in buildings in Västra Hamnen and
Hammarby Sjöstad (Gärde, 2011, Hansson and Nordquist, 2010).
69.6
109.1
54.5
79.0
107.6
146.5
87.5 102.9
0
20
40
60
80
100
120
140
160
Västra
Hamnen
expected
Västra
Hamnen
measured
Hammarby
Sjöstad
expected
Hammarby
Sjöstad
measured
En
erg
y u
se [
kW
h p
er m
2A
TE
MP a
nd
yea
r]
Previous projects
Specific energy use
Total energy use
15
Figure 3. The total energy use divided into the three parameters household electricity,
property electricity and space heating and domestic hot water (Gärde, 2011, Hansson
and Nordquist, 2010).
5. Simulations of the energy use in a building in Östra Sala backe
This section presents the methodological approach used in this thesis. The construction
of a building simulation model, calculations and simulations are presented. In order to
calculate the specific energy use in buildings and perform sensitivity analyses,
simulations are executed in the program VIP-energy. All data is presented in the
Appendix.
Since Östra Sala backe is still at a planning stage, there are no finished buildings to
examine. Drawings of a house that will be built in the area, in the neighbourhood
Knäckepilen, are therefore used in order to construct a model for the simulations. Based
on the drawings, the size of walls, floors, roofs, windows and doors are estimated, as
can be seen in Table A1. Assumptions are made that the house will use a FTX-system
and integrate solar cells on the roof. By incorporating the corners of the building in the
model, thermal bridges are taken into consideration.
In order to estimate the amount of energy that can be extracted from solar cells, a few
assumptions are made. To avoid losses due to shading and the fact that the roof has to
be accessible for maintenance, solar cell panels cannot cover the whole area. Due to the
angle of the solar cells, which is assumed to be 20-30°, about one third of the total roof
area can be used for solar cells on flat roofs (van Noord and Paradis Ärlebäck, 2011).
64.1
89.5
47.3 61.9
5.5
19.6
7.2
17.1
38.0
37.4
33.0
23.9
0
20
40
60
80
100
120
140
160
Västra
Hamnen
expected
Västra
Hamnen
measured
Hammarby
Sjöstad
expected
Hammarby
Sjöstad
measured
En
erg
y u
se [
kW
h p
er m
2 A
TE
MP a
nd
yea
r]
Previous projects
Household electricity
Property electricity
Space heating and domestic hot
water

16
The estimated amount of internal heat gained from human presence is calculated based
on data from Sveby and the numbers and sizes of the apartments in the dwelling. In
order to estimate the amount of household electricity that is used in the calculations, the
number of different apartments, the number of residents and the average values of
household electricity are considered. Those values are found in Table A2, A4, A5 and
A6.
5.1 VIP-energy
VIP-energy is a program that calculates the energy balance in a building. The
calculations include building material, building physics and climate factors, such as
wind, temperature and solar radiation. Building physics include for example thermal
bridges, air leakage and heat storage in materials. The software has twelve different
climate zones, which enables it to simulate buildings located in different geographical
places (Strusoft, 2009). The energy balance calculations in VIP-energy are based on an
energy flow chart and a simplified version of that flow chart is presented in Figure 6.
Only the parameters that are relevant for this thesis are represented in the figure.
Figure 6. A flow chart of relevant parameters used in VIP-energy.
5.2 Simulating three different cases
A model of a house that will be built in Östra Sala backe is created in VIP-energy. With
this building shell as a starting point, three cases with different internal parameters are
created. The parameters that are changed are indoor temperature, efficiency of FTX-
system and property electricity. The three different cases created are:
Recycled hot water
Building
Hot water
Heating system
Ventilation
losses
Recycled heat
Heating trough
ventilations system Leakage losses
Human heating
Transmission
Radiation from the
Internal process
energy

17
The Östra Sala backe case: Indoor temperature of 20.6° Celsius, efficiency of
FTX-system at 90 %, property electricity of 12.8 kWh per m2 ATEMP and year.
The Previous projects case: Indoor temperature of 23° Celsius, efficiency of
FTX-system at 65.2 %, property electricity of 18.4 kWh per m2 ATEMP and year.
The Statistics case: Indoor temperature of 22.5° Celsius, efficiency of FTX-
system at 80/70 %, property electricity of 19.3 kWh per m2 ATEMP and year.
5.3 Performing sensitivity analyses
In order to establish which parameters affect the specific energy use the most,
sensitivity analyses are performed for the Östra Sala backe case. The analysis is based
on information and data regarding the previous projects in Västra Hamnen and
Hammarby Sjöstad. The parameters that the sensitivity analyses focuses on are indoor
temperature, efficiency of FTX-system and U-value of windows. In order to analyse the
variations of energy use when the indoor temperature increases from the assumed
indoor temperature in Östra Sala backe, the temperature will be changed from 20.5 to
24° Celsius. The efficiency of the FTX-system will be decreased from 90 % to 60 %,
and it will further be modelled that the efficiency is lower when the outdoor temperature
is lower than negative 10° Celsius. The U-values of the windows are not mentioned as
reasons to the increased energy use in Västra Hamnen or Hammarby Sjöstad, but in
order to investigate the impact of the use of windows of different U-values a sensitivity
analyses is done where the U-value is increased from 0.9 to 1.3 W per m2 and Kelvin.
5.4 Calculating the energy use
The specific and total energy use of the building is calculated, in this report, by
summarising all the parameters as seen in equations (1) and (2).
(1)
(2)
ESPECIFIC = Specific energy use
ETOTAL = Total amount of energy per square meter
EVIP = Energy use calculated in VIP-energy
EHOUSEHOLD = Household electricity
EAIRING = Energy reduced for airing
ESOLAR = Energy extracted from solar cells
EEXTRA PROPERTY = Property electricity that is not included in the calculations in
VIP-energy, such as elevators and lights

18
6. Data for the building model and the sensitivity analyses
Information, such as drawings and documents, regarding the planned buildings in Östra
Sala backe is obtained from Anders Hollinder, energy strategist at the office of
Community Development at Uppsala municipality. All other data is collected from
published reports, publications from governmental agencies and web pages.
The data for the calculations concerns amount of floor, roof, walls, windows and doors,
number of people living in each apartment, amount of household electricity and energy
that can be extracted from solar cells. This data, except for the solar energy, is entered
in VIP-energy in order to construct the building model.
All data is presented in tables in the Appendix section. All areas used when constructing
the general model of a house is shown in Table A1, and the number of residents in the
model is presented in Table A2. The amount of energy possible to extract from solar
cells is shown in Table A3. In order to avoid too great losses due to shading, the whole
area is not to be used for solar panels. The final calculated value for energy that can be
extracted from solar cells on the roof of the building model and used in the house is 4.0
kWh per m2 ATEMP and year. The amount of household electricity used in different types
of households is displayed in Table A4. The household electricity used is calculated
depending on the number of people living in the apartment. Apartments with three
rooms or more were assumed to hold one family, while the one and two bedroom
apartments were separated into households of single persons and of couples without
children according to Table A5. The final result shows a mean value of energy use per
square metre in the modelled house, which is to be seen in Table A6.
19
7. Results from the simulations and sensitivity analyses
In Figure 7 the energy use for the three cases are presented. The specific and total
energy use are 48.5 and 83.2 kWh per m2 ATEMP and year for the Östra Sala backe case,
73.7 and 104.4 kWh per m2 ATEMP and year for the Previous project case and 64.2 and
103.0 kWh per m2 ATEMP and year for the Statistics case.
Figure 7. The specific energy use and total energy use for the three different cases.
In Figure 8, the change in specific and total energy use is shown when altering the
temperature. When increasing the temperature from 20.6° Celsius, which is the number
used in the Östra Sala backe case, to 22.5° Celsius, which is the value used in the
statistic case, the energy use increases with 3.6 kWh per m2 ATEMP and year. When
using 23° Celsius, which is the measured value from the Previous projects case, the
energy use increases with 4.6 kWh per m2 ATEMP and year.
48.46
73.71 64.19
83.16
104.36 102.99
0
20
40
60
80
100
120
Östra Sala backe Previous projects Statistics
En
erg
y u
se [
kW
h p
er m
2A
TE
MP
and
yea
r]
Specific energy use
Total energy use

20
Figure 8.The change in specific and total energy use when the temperature increases.
Figure 9 and Figure 10 displays how the specific and total energy use in the Östra Sala
backe case changes when the efficiency of the FTX-system decreases. In Figure 9 the
efficiency is constant and in Figure 10 the efficiency is lowered by 10 units when the
temperature outside the building is below negative 10° Celsius. If the efficiency is
decreased from 90 %, as used in the Östra Sala backe case, to 80/70 %, used in the
Statistic case, the specific and total energy use increases with 6.5 kWh per m2 ATEMP
and year. If the efficiency changes to 65.2 %, as used in the values from the Previous
projects case, the difference is 10.5 kWh per m2 ATEMP and year.
Figure 9. The change in specific and total energy use when the efficiency of the FTX-
system decreases.
48.28 49.19 50.12 51.08 52.06 53.09 54.14 55.23
82.98 83.89 84.82 85.78 86.76 87.79 88.84 89.93
0
10
20
30
40
50
60
70
80
90
100
20.5 21 21.5 22 22.5 23 23.5 24
En
erg
y u
se [
kW
h p
er m
2 A
TE
MP a
nd
yea
r]
Temperature [°Celsius]
Specific energy use
Total energy use
48.46 52.33
56.64 61.67
67.23
83.16 87.03
91.34 96.37
101.93
0
20
40
60
80
100
120
90% 80% 70% 60% 50%
En
erg
y u
se [
kW
h p
er m
2 A
TE
MP a
nd
yea
r]
Efficiency of FTX-system [%]
Specific energy use
Total energy use
21
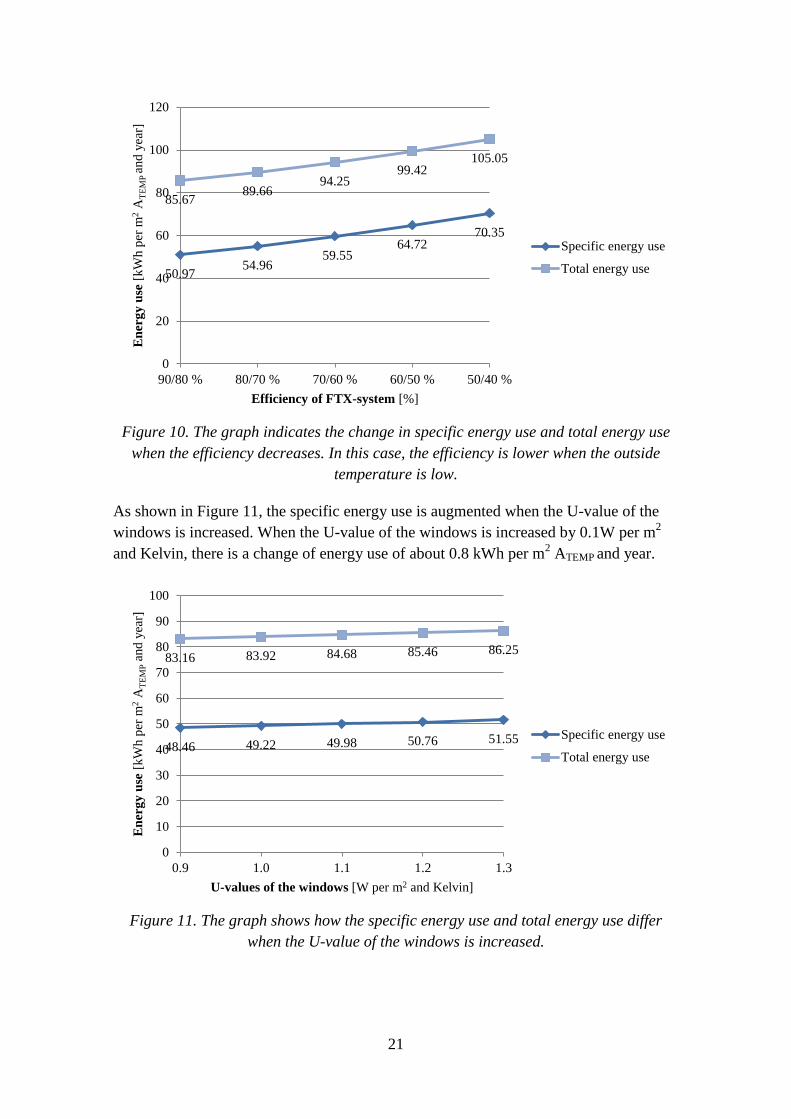
Figure 10. The graph indicates the change in specific energy use and total energy use
when the efficiency decreases. In this case, the efficiency is lower when the outside
temperature is low.
As shown in Figure 11, the specific energy use is augmented when the U-value of the
windows is increased. When the U-value of the windows is increased by 0.1W per m2
and Kelvin, there is a change of energy use of about 0.8 kWh per m2 ATEMP and year.
Figure 11. The graph shows how the specific energy use and total energy use differ
when the U-value of the windows is increased.
50.97 54.96
59.55 64.72
70.35
85.67 89.66
94.25 99.42
105.05
0
20
40
60
80
100
120
90/80 % 80/70 % 70/60 % 60/50 % 50/40 %
En
erg
y u
se [
kW
h p
er m
2 A
TE
MP
and
yea
r]
Efficiency of FTX-system [%]
Specific energy use
Total energy use
48.46 49.22 49.98 50.76 51.55
83.16 83.92 84.68 85.46 86.25
0
10
20
30
40
50
60
70
80
90
100
0.9 1.0 1.1 1.2 1.3
En
erg
y u
se [
kW
h p
er m
2 A
TE
MP a
nd
yea
r]
U-values of the windows [W per m2 and Kelvin]
Specific energy use
Total energy use
22
8. Discussion In this section the research questions of the thesis are discussed and analysed.
8.1 Västra Hamnen and Hammarby Sjöstad
As seen in Figure 2 and 3 in Section 3, the measured values for the specific and total
energy use in Västra Hamnen and Hammarby Sjöstad are much higher than the
expected values. The greatest differences are found in the space heating and the
property electricity, and the most significant reasons are that the indoor temperature
turned out to be higher than estimated, the efficiency of the FTX-system was lower than
expected and some parameters regarding the property electricity and airing were not
included in the calculations.
As seen in Figure 8, the indoor temperature is of importance and the energy use in the
building model accumulates with about 2 kWh per m2 ATEMP and year for each degree
that the indoor temperature is increasing. According to BBR, at least 22° Celsius should
be used when estimating the energy use when the expected indoor temperature is
unknown, whilst the Swedish Energy Agency estimates the mean value to 22.5° Celsius.
The measured value in Västra Hamnen was 23° Celsius and there is thus a difference of
2 kWh per m2 ATEMP and year to the BBR standard and of 1 kWh per m
2 ATEMP and year
to the Swedish Energy Agency standard.
Due to the differences in energy use that follows an increased indoor temperature, it is
important to make a good estimation. However, it is hard to predict the habits of the
residents and it is thus difficult to avoid the variation of indoor temperature. One
possible solution could be to install regulated heating systems, and thereby set the
temperature to a fixed value. This might however not be appreciated by the residents
since people might want different temperatures. It could also lead to the use of electric
heaters and even though the specific energy use would be lowered, the total energy use
would still be the same. Since the heating system will be connected to the district
heating system, it would further be more environmental friendly to use the heating
system than to use electric heating. Considering the human factor involved in the
problem, it is hard to avoid or affect the energy use due to indoor temperature. A
realistic estimation has to be done, and in order to reach the targets of the energy use the
estimation should rather be higher than lower. Another example of human activities that
was wrongly estimated is airing, which was not at all considered in the early
calculations. Since Sveby recommends an additional 4 kWh per m2 ATEMP and year to
the specific energy use it would have been reasonable to consider this parameter.
The neglecting of parameters in property electricity, such as pumps and lightning,
contributed to the differences in expected and measured values. The parameters were
significantly underestimated or not at all considered, which led to a distinct increase in
property electricity. The efficiency of the FTX-system in Hammarby Sjöstad was
expected to be 90 %, but turned out to be 65.2 %, which had a significant impact on the
23
amount of space heating which increased with 22 %, which is 10.5 kWh per m2 ATEMP
and year. There are several sources that indicate an efficiency of about 70 %, and one
investigation shows efficiencies of 20-30 % for FTX-systems. It is therefore unrealistic
to base the estimation of the specific energy use on an efficiency of 90 %.
According to the simulations and calculations in this report, seen in Figure 7, the factors
of airing, increased indoor temperature, increased property electricity and decreased
efficiency of the FTX-system will generate an increase of 25.3 kWh per m2 ATEMP to the
specific energy use of the modelled building. Figure 2 shows that the differences
between calculated and measured values in specific energy use in Västra Hamnen and
Hammarby Sjöstad reaches 39.5 and 24.5 kWh per m2 ATEMP and year. An increase of
about 14.2 kWh per m2 ATEMP and year in Västra Hamnen can thus not be explained by
the factors simulated in the building model. The measured values in Hammarby Sjöstad
however are consistent with this report’s calculated values.
Hammarby Sjöstad had the vision to use 100 % renewable energy, which was not
achieved since the energy supplier Fortum only uses 78 % renewable energy. In
Uppsala the municipality most likely will use Vattenfall’s district heating, and it would
be difficult for the municipality to affect Vattenfall’s choice of energy sources.
A problem when planning Hammarby Sjöstad was the fact that the municipality and the
constructors did not have a mutual vision. The goals regarding specific energy use set
by the municipality of Stockholm was dismissed as unrealistic by the constructors. The
fact that the goals also lacked references and were difficult to interpret resulted in even
more disagreements and confusion among the actors involved. The projects of Västra
Hamnen and Hammarby Sjöstad illustrate the importance of including all actors early in
the formulations of goals and to have distinct agreements, in order to avoid
misunderstandings and unrealistic visions. These results show that it is of great
importance to calculate and estimate the values of energy use accurate.
8.2 Östra Sala backe
As seen in Figure 7, the specific energy use for the simulated Östra Sala backe case is
48.5 kWh per m2
ATEMP and year. Even though this is just an estimated value, it is quite
consistent with the average value of 56 kWh per m2 ATEMP and year given by the
constructors. In this simulation, all the important parameters are given the mean value
of the figures listed by the constructors. When changing the same parameters to values
measured in the Previous projects case, the specific energy use increases by 52 % to the
value of 73.7 kWh m2 ATEMP and year. The goal of 56 kWh per m
2 ATEMP and year will
thereby fail by 32 %, or by 17.7 kWh per m2 ATEMP and year. The values in the Previous
project case are based on measurements in completed buildings in Västra Hamnen and
Hammarby Sjöstad and are therefore based on human behaviour. These values could
therefore be more reliable. The same comparison is made on the Statistics case where
all the parameters are based on statistics from Swedish households and
recommendations from the National Board of Housing, Building and Planning, and in

24
this case the difference between the goal and the specific energy use of the statistic case
is 14 %. The goal failed thus with about 8 kWh per m2 ATEMP and year.
In order to achieve a Class A classification regarding the specific energy use in a
building, the value must be less than 45 kWh per m2 ATEMP and year, and for Class B
the specific energy use must be less than 68 kWh per m2 ATEMP and year. If Östra Sala
backe wishes to become a sustainable residential area, a low energy use and a high
classification is wishful. The original vision from Uppsala municipality was that the
specific energy use should be 30 to 40 kWh per m2 ATEMP and year, and a class A
classification could then be achieved. Due to the calculations and evaluation performed
in this thesis, this target can be perceived as unrealistic. Since the average value given
by the constructors, of 56 kWh per m2 ATEMP and year, was accepted by the
municipality, the original goal should be considered abandoned. The Class A
certification is thus not reached for any of the case studies, while Class B classification
is reached for the Östra Sala backe case and for the Statistics case. The Previous
projects case only reaches a Class C classification.
The most important factor that is identified in this thesis is the efficiency of the FTX-
system. This is an issue the constructors should consider when planning the buildings in
Östra Sala backe. Even though this parameter appears to affect the specific energy use
the most, other parameters need to be taken into account as well. When changing the
temperature from 20.6° Celsius, which is the mean value given by the constructors, to
the more realistic value 22.5° Celsius, the specific energy use increases by 7 %. When
planning for temperatures around 20 to 21° Celsius, the constructors indicates a lack of
information as statistics clearly shows higher temperatures. When the efficiency of the
FTX-system is changed in the same manner, from 90 % to 80/70 %, the specific energy
use is increased by 13 %. The sensitivity analysis also compares different U-values in
windows, as seen in Figure 11. However, U-values are proven not to have a large
impact on the specific energy use and is therefore not of great importance in this
context.
One important part in developing a sustainable residential area is the formulations of
goals. Recurring issues concerning goals in Västra Hamnen and Hammarby Sjöstad is
that the goal of specific energy use is set without approval from the constructors and
that some goals are actually impossible to affect. The municipality of Uppsala included
the constructors early in the project, which gives good potential for an effective
collaboration. Even so, the municipality must set up clear guidelines for the
construction of Östra Sala backe so the visions of the project can be achieved.
8.3 Improve sustainability in a residential area
In order to build a sustainable residential area, more than sustainable buildings are
required. According to Jan Wijkmark, chief of sustainability at White Architects in
Stockholm, it does not matter how sustainable buildings are or how low the energy

25
consumption is, if the residential area is not planned for good, accessible public
transportations and a good social environment (Köhler, 2011).
In order to enable a lowered environmental impact, politicians and citizens have to use
technical solutions that will provide resource and energy efficiency, in combination
with a changed human behaviour. Two main paths to reach a sustainable development
are to consume goods that are resource effective and environmentally friendly and to
lower the consumption of goods in favour of resource efficient services (Statens
offentliga utredningar, 2005). By extensive recycling, materials can be reused and the
use of energy and primary resources can be lowered. Recycling can further decrease the
amount of domestic waste in the world (SABO, 2003).
One way to decrease the use of cars is to use carpools, which is a way of sharing cars
among a group of people. People who have joined carpools show a decreasing car use
and instead more often travel by bike, foot or public transportation, and companies that
have introduced carpools have decreased their car use by 10 %. Carpools also have
positive effects on accessibility, health, environment and it reduces the need for parking
spaces (Trafikverket, 2006).
Uppsala municipality has shown an understanding for this in the planning of Östra Sala
backe and are preparing for accessible public transportation, a great amount of biking
paths and other factors that are important when creating a sustainable residential area.
Since the power line was removed the area has a lot of untouched land area where
Uppsala municipality can build a completely new city district. The municipality of
Uppsala strives towards a BREEAM certification for Östra Sala backe, which could
provide an international acknowledgment and hopefully help Östra Sala backe to
become a role model in sustainable building.

26
9. Conclusions After examining evaluations from the project of Västra Hamnen and Hammarby
Sjöstad, this report shows the main reasons for not reaching the goals of specific energy
use. Unrealistic assumptions in human behaviour were of great importance and
therefore the energy used for space heating was underestimated. Parameters that
affected the property electricity and the efficiency of the FTX-system were wrongly
estimated. All this in combination led to a much higher specific energy use than first
estimated. However, there are still large differences in expected and measured values in
Västra Hamnen that cannot be explained by the parameters used in this report. It is
therefore reasonable to assume that there are more factors that can increase the specific
energy use that are not identified in this report.
All these parameters are important to consider when planning the construction of Östra
Sala backe. If making the same mistakes as in previous projects, the calculations of this
report show that Östra Sala backe can reach a specific energy use as great as 52 %, or
25.2 kWh per m2 ATEMP and year, higher than estimated. Further, it is of great
importance to place the building in a larger context and to consider the possibilities for
sustainable living.

27
10. References
10.1 Reports
Andreasson, M., Borgström, M., Werner, S. (2009), Värmeanvändning i flerbostadshus
och lokaler, ISBN 978-91-7381-019-7, Svensk Fjärrvärme AB
Andreasson, K., Edman, J., Hedberg, P (2010), Q-Cells SL1-75 - Energianalys av en
CIGS-solpanel
Brant, N., Pandis, S. (2009), Utvärdering av Hammarby Sjöstads miljöprofilering - vilka
erfarenheter ska tas med till nya stadsutvecklingsprojekt i Stockholm?, ISSN 1402-
7615, Department for Industrial Ecology, KTH: Stockholm.
Dodoo, A. (2011), Life Cycle Primary Energy Use and Carbon Emission of Residential
Buildings, ISSN 1652•-893X, Kopiering Mittuniversitetet: Sundsvall.
Green, A. (2006) Hållbar energianvändning i svensk stadsplanering, ISSN 0282-9800,
Linköping University: Linköping.
Gärde, V. (2011) Uppföljning av idrifttagning och energiprestanda för två
egenvärmehus i Hammarby Sjöstad, ISRN EGI-2011-122MSc, KTH Industrial
Engineering and Management: Stockholm
Hamrefors, J., Jöhnemark, B., Thulin, E. (2012), How to specify the building energy use
to realize sustainability in the upcoming project of Östra Sala backe: ISSN 1650-8319,
Uppsala Universitet: Uppsala
National Board of Housing, Building and Planning (2009), Energihushållning enligt
Boverkets byggregler, ISSN 1400-1012, Danagårds grafiska: Karlskrona
Netterstedt, C. (2012), Lågtempererad luftburen värme och byggnadsintegrerad
förnybar energiutvinning i hållbara Östra Sala backe, Uppsala, Polacksbackens repro,
Department of Engineering Science, Uppsala University: Uppsala
van Noord, Paradis Ärlebäck (2011), Solceller i samhällsplanering, Skapa bra
förutsättningar för solenergi, Elforsk rapport Nr 11:75
Statens offentliga utredningar (2005), Bilen, biffen, bostaden, Hållbara laster - smartare
konsumtion, ISSN 0375-250X, Edita Norstedts Tryckeri AB: Stockholm.
Swedish Energy Agency (2007), Hushåll och energibeteende - en rapport om energi och
miljömål, ISSN 1403-1892, Swedish Energy Agency, Eskilstuna.

28
10.2 Web pages
Breeam (2013), What is Breeam? Available online:
http://www.breeam.org/about.jsp?id=66 (2013-04-18)
Energihuskalkyl (2013), FAQ Småhus. Available online:
http://www.energihuskalkyl.se/menus/index/46 (2013-05-06)
European Commission (2012), The EU climate and energy package, Available online:
http://ec.europa.eu/clima/policies/package/index_en.htm (2013-04-10)
Hammarby Sjöstad (2009), Miljömål. Available online:
http://www.hammarbysjostad.se/(2013-04-08)
Hansson, A., Nordquist, B. (2010), Uppföljning Flagghusen - energi och inneklimat.
Available online:
http://lup.lub.lu.se/luur/download?func=downloadFile&recordOId=3173382&fileOId=3
173434 (2013-04-08)
International Institute for Sustainable Development (2013), What is sustainable
development? Environmental, economic and social well-being for today and tomorrow.
Available online: http://www.iisd.org/sd/ (2013-04-09)
Köhler, N. (2011), Byggindustrin, Växande intresse för hållbara stadsdelar. Available
online: http://www.byggindustrin.com/energi-miljo/vaxande-intresse-for-hallbara-
stadsdelar__9194 (2013-04-19)
Lågan (2013), Om lågan. Available online: http://marknad.laganbygg.se/ (2013-04-18)
National Board of Housing, Building and Planning (2011), Boverkets författarsamling.
Available online: https://rinfo.boverket.se/BBR%5CPDF%5CBFS2011-26-BBR19.pdf
(2013-04-09)
National Board of Housing, Building and Planning (2012), Vilken inomhustemperatur
kan användas vid energiberäkningar? Available online:
http://www.boverket.se/Kontakta-oss/Fragor-och-svar/Boverkets-byggregler-BBR/Om-
avsnitt-9-i-BBR/Berakning/Vilken-inomhustemperatur-ska-anvandas-vid-
energiberakning/ (2013-04-16)
National Board of Housing, Building and Planning (2013), Om Boverket. Available
online: http://www.boverket.se/Om-Boverket/ (2013-04-13)
National Encyclopedia (2013), Köldbrygga. Available online:
http://www.ne.se/k%C3%B6ldbrygga (2013-04-25)
SABO (2003), Alla sopor är inte skräp. Available online:
http://www.landskronahem.se/uploads/images/Hg-foldrar_SABO/Sopor.pdf
29
Strusoft, 2009, VIP-energy. Available online:
http://strusoft.com/images/stories/Contentimgs/PDF-vip/Broschyr_VIP_SWE.pdf
(2013-04-16)
Sveby (2012), Brukarindata bostäder. Available online: http://www.sveby.org/wp-
content/uploads/2012/10/Sveby_Brukarindata_bostader_version_1.0.pdf (2013-04-20)
Swedish Energy Agency (2010), Bostäder och service. Available online:
http://www.energikunskap.se/sv/FAKTABASEN/Energi-i-Sverige/Energianvandning-
per-sektor/Bostader-och-service/ (2013-04-08)
Swedish Energy Agency (2011a), Från- och tilluftsventilation med återvinning (FTX-
system), Available online: http://www.energimyndigheten.se/Hushall/Varmvatten-och-
ventilation/Ventilation/FTX-system/ (2013-04-16)
Swedish Energy Agency (2011b), Solceller. Available online:
http://www.energimyndigheten.se/sv/Foretag/Energieffektivt-byggande/Lokaler-och-
flerbostadshus/Bygga-och-renovera/Solceller/(2013-04-17)
Swedish Energy Agency (2011c), Solfångare. Available online:
http://www.energikunskap.se/sv/FAKTABASEN/Vad-ar-energi/Energibarare/Fornybar-
energi/Sol/Solfangare/ (2013-04-17)
Swedish Energy Agency (2013a), Definitioner. Available online:
http://www.energimyndigheten.se/sv/Offentlig-sektor/Energieffektiva-
myndigheter/Definitioner/ (2013-04-25)
Swedish Energy Agency (2013b), Isolering, Available online:
http://energimyndigheten.se/sv/Hushall/Din-uppvarmning/Isolering/ (Retrieved 2013-
04-19)
Swedish Energy Agency (2013c), Klimatskal. Available online:
http://energimyndigheten.se/sv/Hushall/Bygga-nytt-hus/Klimatskal/ (Retrieved 2013-
05-08)
Swedish Green Building Council (2011), BREEAM. Available online:
http://www.sgbc.se/certifieringssystem/breeam (2013-04-18)
Trafikverket (2006), Hållbara råd för bilpooler. Available online:
http://www.trafikverket.se/PageFiles/15688/hallbara_rad_for_bilpool.pdf (2013-04-16)
United Nations (1987), Our common future. Available online:
http://conspect.nl/pdf/Our_Common_Future-Brundtland_Report_1987.pdf (2013-04-09)
United Nations (2011), World Population to reach 10 billion by 2100 if Fertility in all
Countries

30
Converges to Replacement Level. Available online:
http://esa.un.org/unpd/wpp/Documentation/pdf/WPP2010_Press_Release.pdf (2013-04-
08)
Uppsala municipality (2010), Östra Sala backe Planprogram. Available online:
http://www.uppsala.se/Upload/Dokumentarkiv/Externt/Dokument/Bostad_o_byggande/
Stadsplanering/Ostra_Sala_backe/Planprogram%20Ostra%20Sala%20backe.pdf (2013-
04-08)
Uppsala municipality (2013), Bakgrund. Available online:
http://www.uppsala.se/sv/Boendemiljotrafik/Stadsutveckling--
planering/Utvecklingsomraden/Planerade-verksamhetsomraden/Ostra-Sala-
backe/Bakgrund/ (2013-04-13)
Wade, J., Guerther, P., Croft, D., Sunderland, L. (2011), National energy efficiency and
energy saving targets - further details on Member States. Available online:
http://www.eceee.org/Policy/Targets/Targets_Country_Specific_Information.pdf (2013-
04-10)
Zimmermann, J P. (2009) End-use metering campaign in 400 households In Sweden.
Available online:
http://www.energimyndigheten.se/Global/Statistik/F%C3%B6rb%C3%A4ttrad%20ener
gistatistik/Festis/Final_report.pdf (2013-04-23)
10.3 Other references
Hollinder, A. (2013) Material provided by Uppsala municipality
31
Appendix
Table A1. All data that is used when constructing the general model of a house
(Hollinder, 2013).
Parameter Area [m2]
Windows towards southeast 218.0
Windows towards northwest 212.0
Windows towards southwest 40.0
Windows towards northeast 59.0
Walls towards southeast 1433.0
Walls towards northwest 1433.0
Walls towards southwest 227.3
Walls towards northeast 227.3
Doors towards southeast 55.0
Doors towards northwest 59.0
Doors towards southwest 29.0
Doors towards northeast 29.0
Roof, total 833.5
Roof, for solar cells 619.0
Floor, against ground 833.5
Floor, ATEMP 5239.5
Floor, GFA 3772.0
Floor, GTA 6126.5

32
Table A2. The number of different apartments in the modelled house (Hollinder, 2013).
Size of
apartment
1
bedroom
2
bedrooms
3
bedrooms
4
bedrooms
6
bedrooms
Number 6 30 16 8 1
Table A3. Data and calculations for extracted energy from solar cells located in
Uppsala (Andreasson et al., 2010).
Energy extracted [kWh per m2 and year] 102.0
Area [m2] 619.0
Area of solar panel [m2] 206.0
Energy extracted [kWh per year] 21 046.0
Area ATEMP [m2] 5 240.0
Energy extracted [kWh per m2 ATEMP and year] 4.0
Table A4. Data for the amount of household electricity for different households in
apartments (Zimmermann, 2009).
Type of
household
Household electricity
[kWh per household and
year]
Household electricity
[kWh per m2 and year]
Household electricity
[kWh per person and
year]
Single person 1742 27 1742
Family 3710 44 1187
Couple
without
children
2404 36 1202
33
Table A5. The proportion between singles and couples living in 1 bedroom apartments
and 2 bedroom apartments in the modelled house.
Apartment size Single person
[%]
Couple
[%]
1 bedroom 58 42
2 bedrooms 37 63
Table A6. The use of household electricity in different kind of households in the
modelled house, and the mean value of the household electricity per square metre
(Hollinder, 2013).
Size of apartment Household electricity
[kWh per m2 and year]
GFA
[m2]
kWh and GFA
1 bedroom 30.8 172.5 5 310.0
2 bedrooms 32.7 1526.0 49 854.0
3 bedrooms 44.0 1257.5 55 330.0
4 bedrooms 44.0 691.5 30 426.0
6 bedrooms 44.0 124.0 5 456.0
Total 38.8 3772.0 46 376.0
Top Related