


Languages
Pages
Legal


NBER WORKING PAPER SERIES
WHEN EVIDENCE IS NOT ENOUGH: FINDINGS FROM A RANDOMIZED EVALUATION OF EVIDENCE-BASED LITERACY INSTRUCTION (EBLI)
Brian Jacob
Working Paper 21643http://www.nber.org/papers/w21643
NATIONAL BUREAU OF ECONOMIC RESEARCH1050 Massachusetts Avenue
Cambridge, MA 02138October 2015
I would like to thank the staff at the Grand Valley State University (GVSU) Charter School Officeand Evidence-Based Literacy Instruction (EBLI) for their assistance throughout this project. WendyMiller, Nora Chahbazi and Ram Ravikumar were especially generous with their time. I would alsolike to thank staff at the Education Policy Initiative for all their hard work, including Julie Monteirode Castro, Scott Krywko, Carrie (Wenjing) Xu, and Tedi Engler. All errors and omissions are my own.This RCT was registered in the American Economic Association Registry for randomized controltrials. The views expressed herein are those of the author and do not necessarily reflect the views ofthe National Bureau of Economic Research.
NBER working papers are circulated for discussion and comment purposes. They have not been peer-reviewed or been subject to the review by the NBER Board of Directors that accompanies officialNBER publications.
© 2015 by Brian Jacob. All rights reserved. Short sections of text, not to exceed two paragraphs, maybe quoted without explicit permission provided that full credit, including © notice, is given to the source.

When Evidence is Not Enough:¸˛Findings from a Randomized Evaluation of Evidence-BasedLiteracy Instruction (EBLI)Brian JacobNBER Working Paper No. 21643October 2015JEL No. I0,I20,I21,I28
ABSTRACT
This paper reports the results of an experimental evaluation of Evidence Based Literacy Instruction(EBLI). Developed over 15 years ago, EBLI aims to provide teachers with instructional strategiesto improve reading accuracy, fluency and comprehension. Sixty-three teachers in grades 2-5 in sevenMichigan charter schools were randomly assigned within school-grade blocks to receive EBLI trainingor a business-as-usual control condition. Comparing students in treatment and control classrooms duringthe 2014-15 school year, we find no significant impact on reading performance. Teacher survey responsesand interviews with program staff suggest that several implementation challenges may have playeda role in the null findings.
Brian JacobGerald R. Ford School of Public PolicyUniversity of Michigan735 South State StreetAnn Arbor, MI 48109and [email protected]

2
Introduction
Reading is arguably the single most important skill that students learn in elementary
school. Students who become competent and confident readers are well poised to develop in
other areas, not to mention being able to enjoy the myriad other benefits of reading. Recognizing
the importance of early literacy, dozens of states have adopted policies to ensure that students
master basic reading skills by third or fourth grade (Workman, 2014).
Yet, most elementary school children in the United States have, at best, a weak grasp of
basic reading skills. According to the 2013 National Assessment of Educational Progress
(NAEP) reading assessment, only 34 percent of fourth graders in the country were proficient
readers. Among economically disadvantaged students, the rate was only 20 percent. Indeed, only
half of economically disadvantaged fourth graders (51 percent) scored at the “Basic” level on the
NAEP reading assessment, with many falling into the “Below Basic” category.
Despite a tremendous amount of basic research on reading, only a modest number of
actual programs have been found to improve student performance based on rigorous evaluation
(Slavin et al., 2009). More generally, reading has proved less malleable than math in the face of
popular policy interventions. While reforms such as charter schools and test-based accountability
have been found to improve math scores, they often have little or no impact on reading scores. In
a comprehensive synthesis of prior research, Slavin et al. (2009) argue that programs aimed at
changing daily teaching practices show the most promise to improve student reading.
This paper reports the results of an experimental evaluation of just such a program,
Evidence Based Literacy Instruction (EBLI). Developed in Michigan over 15 years ago, this
program aims to provide teachers with several instructional strategies to improve reading
accuracy, fluency and comprehension. In summer 2014, 63 teachers in grades 2-5 in seven

3
Michigan charter schools were randomly assigned within school-grade blocks to receive EBLI
training either during the summer or the following year. While treatment teachers generally
expressed satisfaction with the program and reported utilizing some of the targeted strategies
more often than control teachers, there was no significant difference between reading
performance across the treatment and control classrooms. Teacher survey responses and
qualitative evidence suggest that several implementation challenges may have played a role in
the null findings.
The paper proceeds as follows. In section 2, I review the prior literature. In section 3, I
provide background on EBLI. Sections 4 and 5 present the methodology and results. Section 6
concludes.
Prior Literature
Given the importance of reading in elementary instruction in the United States, educators
have attempted a host of interventions to improve student performance, from whole-school
reform to 1-on-1 tutoring. Slavin et al. (2009) provide a comprehensive overview of the research
evidence on interventions aimed at improving reading ability among elementary school children.
The authors distinguish between four types of interventions: reading curricula, instructional
technologies, instructional process programs, and combinations of instructional and curricula
processes. Their analysis is particularly valuable as context to the current study in that it focuses
on evaluations of actual programs available to teachers and schools, rather than discussing
findings from basic research on how children learn to read.
In total, the authors review 63 beginning reading (grades K-1) and 79 upper elementary
(grades 2-5) reading studies, which meet various criteria to ensure that the studies can provide at

4
least moderately rigorous evidence on effectiveness. Not surprisingly, they find a wide range of
results, including some individual programs that appear to be effective and many that do not.
More generally, they find stronger evidence to support interventions designed to change daily
teaching practice, rather than programs that simply provide a new curriculum or engage students
in technology-aided instruction. Indeed, they find that programs that rely on curricular materials
or instructional technology alone typically have very little, if any, impact on student learning.
Conversely, they find that programs that incorporate multiple components – including
professional development aimed at improving teaching practices along with curricular materials
and other supports – are most effective at improving reading performance. Two of the largest and
most widely studied such programs are Success for All and Direct Instruction.
Unfortunately, none of the phonics-oriented professional development programs for
beginning readers and only one such program for upper elementary students was evaluated with
a random assignment design. However, the single randomized control trial of phonics-oriented
professional development was a large, well-designed study conducted by the American Institutes
of Research and MDRC that included 90 schools and 5,530 students in six urban districts across
the country (Garet et al., 2008). While the researchers found some positive impacts on teacher
knowledge of scientifically-based reading instruction and on some teacher instructional
practices, they found no significant impact on student reading test scores at the end of the one-
year intervention, or at the end of the next school year. Researchers found similar results when
evaluating Reading First, a $1 billion per year federal initiative to improve early elementary
reading largely by providing teachers with intensive, targeted professional development that
emphasized scientifically-based reading practices, especially those designed to enhance
phonemic awareness. Evaluations found that while teachers in Reading First schools spent more

5
time teaching reading and focused more on phonics and were more likely to know about
scientifically-based strategies (Moss et al., 2008), there was little evidence that their students
performed better than comparison students (Gamse et al., 2008).
Background
Developed in 2003, EBLI comprises several instructional strategies to improve reading
accuracy, fluency and comprehension. EBLI targets teachers and reading specialists at any grade
level (K-12) and instructs them on how to implement its literacy strategies in whole class, small
group or one-on-one sessions. Since first developing the system, EBLI has trained thousands of
teachers across the country and has reached tens of thousands of students. Over 260 schools,
mainly located in Michigan, have implemented the EBLI system.
At its core, EBLI is a phonics-based reading program. The program’s theory of change
states that mastered reading accuracy has subsequent beneficial effects on students’ reading
fluency and comprehension. The emphasis on improving reading accuracy differentiates EBLI
from other whole language/balanced literacy systems that focus first on fluency and speed by
encouraging word guessing when students are unsure about the correct pronunciation.
To achieve reading accuracy, EBLI uses awareness of sounds (phonetic awareness) and
the different ways the same sound can be spelled. The program emphasizes several key concepts.
The first concept (“1, 2, 3 or 4 Letters Can Represent a Sound”) highlights the fact that
individual sounds in the English language may be comprised of anywhere from one to four
letters. For instance, the sound “u” in up is made of one letter – u. The sound “e” in tea is made
of two letters – ea. The sound “ur” sound in earn is made of three letters – ear. And, finally, the
“ay” sound in weigh is made of four letters – eigh. The second concept (“Same Sound / Different
6
Spelling”) captures the idea that same sound can be spelled with many different combinations of
letters. For example, the “ee” sound in feet is spelled with ee; the “ee” sound in treat is spelled
with ea; the “ee” sound in brief is spelled with ie. The third concept (“Same Spelling / Different
Sound”) is the converse – namely, in the English language the same spelling may create different
sounds in words. For instance, the spelling “ea” sounds like the following sounds in different
words: sounds like “ee” in beast, “a” in break, and “e” in head.
EBLI teachers also learn how to teach students phonemic awareness skills such as
segmenting, blending and phoneme manipulation within the context of single and multi-syllable
words as opposed to in isolation. In segmenting, teachers break words into individual syllables
and further into sounds within syllables. For example, “brother” is separated into two syllables –
bro / ther and each of these syllables is broken into sounds – b r o / th er. This separation helps to
reinforce correct spelling. In blending, instruction focuses on pushing individual sounds together
to create a word. For the segmented “brother”, the sounds are blended back together to form the
full word and reinforce correct pronunciation. Phoneme manipulation activities help reinforce
word comprehension and spelling by removing letters from the words and reviewing what
remains. For instance, focusing on the word “spot”, the instructor will first ask how many sounds
are in the word spot, then will ask what “spot” is without the /s/, what “spot” is without the /p/.
The student may segment the individual sounds or may say “pot” or “sot”. Then the instructor
repeats the exercise, using dots in the place of letters. Using dots in place of letters forces the
student to listen to individual sounds.
According to its developers, EBLI differs in several important ways from other popular
phonics-based reading programs such as Orton-Gillingham, Open Court, Saxon Phonics, Wilson,
and Lexia (software). First, EBLI is a system of logic rather than a set of phonics rules,

7
exceptions and drills. Second, EBLI developers argue that typical phonics programs focus more
heavily on drill and worksheets with less focus on reading in books. Third, EBLI trains teachers
to be diagnostic and prescriptive when delivering instruction as opposed to training them to
simply deliver pre-fabricated materials to students. For example, the EBLI system of instruction
includes guidance for teachers on how to provide error corrections in the moment. Finally, EBLI
instruction is multi-sensory, with students saying, seeing, hearing and writing in the course of
EBLI activities.
During a three-day in-person training, program staff introduce teachers to the EBLI
philosophy and teach them specific strategies and instructional techniques. Trainees practice the
three concepts described above in isolation, and then pull them together with EBLI’s multi-
syllable strategy of segmenting, blending, and phoneme manipulation. Teachers learn how to
diagnose student reading difficulties and strategically insert some of the EBLI strategies above to
help students overcome their challenges. Teachers also receive ideas about how to individualize
instruction within whole class settings. EBLI discourages word guessing and incorrect spelling
through several instructional techniques, including introduction of difficult words, immediate
error correction, student self-correction, reading varied and challenging text, and checking for
comprehension. During the training, teachers have the opportunity to practice each of the EBLI
techniques to become familiar with the system and receive direct feedback in a training
environment. At the conclusion of the three-day session, trainees are provided with materials
required to teach the EBLI system. 1 Following this initial training, educators are supported with
1 Materials include: training binder with 15 lesson plans, additional centers and/or practice activities, stories with vocabulary to pre-teach, supplemental resources, and directions on infusing EBLI into content area curriculum; Chicken Soup book; 30 EBLI dry-erase markers; EBLI poster; 12 x 18 inch whiteboard and small eraser. Not included in the materials, but necessary for implementation, are 12 x 18 whiteboards and erasers for each student, as well as replacement markers. Trainees also receive a lifetime subscription to the EBLI Online Member’s Area, with videos, lessons and other EBLI-related resources.

8
online consultation resources, as well as three on-site instructional visits to clarify questions
about the implementation of EBLI in the classroom.
The Setting
Grand Valley State University (GVSU) is one of the largest charter authorizers in the
state of Michigan, overseeing 71 school buildings that serve over 34,000 students. Unlike many
charter authorizers, GVSU plays an active role in the operations of its schools, providing
instructional support to its teachers in a variety of areas. GVSU has worked with EBLI since
2012, during which time 402 teachers in 39 GVSU schools have received EBLI training outside
of the context of this study. In fall 2013, GVSU and EBLI expressed an interest in formally
evaluating the literacy intervention.
Teachers selected for the study (see below for more detail) attended the standard three-
day EBLI training in late August or early September of 2014. Teachers received the standard
trainee materials in order to implement the program in their own classrooms and also had access
to a variety of online resources including hundreds of videos of master teachers modeling various
lessons and additional content organized by activity, grade level and instructional setting.
During the course of the school year, EBLI trainers visited each treatment teacher’s
classroom three times. During the first visit, the EBLI coach taught an EBLI lesson to the class
while the teacher observed and took notes. The lesson taught was determined jointly by the
teacher and EBLI coach to best meet the needs of the teacher. During the second visit, the EBLI
coach typically taught alongside the teacher (e.g., modeling an activity and having the teacher
take over to teach it) and/or observed the teacher doing an EBLI lesson. After the lesson, the
EBLI coach provided the teacher with feedback to help her (him) to refine her (his) practice. In
the third and any subsequent visit, the EBLI trainer typically observed the teacher teach a lesson

9
and then provided the teacher feedback. It was also common for the trainer to model specific
lesson(s) requested by the teacher and discuss the progress of individual children with the
teacher.
Methodology
The evaluation was designed as a clustered randomized trial in which classrooms were
randomly assigned to treatment or control status within school-grade blocks.2 In consultation
with the program developers and school personnel, the research team determined that the
likelihood of substantial spillovers across teachers within the same grade was unlikely because
(a) the value of the intervention comes through participating in the training and 1-on-1 coaching
rather than through the provision of specific curricular materials, and (b) there was little if any
formal interaction between teachers at the same grade level (such as common planning time) in
these schools.3 Moreover, control teachers (and their administrators) were told that they would
receive training the next summer. As a further check, when possible we compared the fall to
spring reading growth in the intervention year (2014-15) to the growth for the same teachers in
the prior year (2013-14) and found no evidence of a change in performance across years for
control teachers.
The program developer and research team decided to focus on teachers in grades 2-5 for
several reasons. First, while the intervention has been used with older students, it is most
commonly used with beginning readers in early elementary grades. Second, several of the
kindergarten and first grade teachers at the target schools had been trained in EBLI before, but
none of the teachers in grades 2-5 in these schools had received training. Third, the target schools
2 Co-teachers and teacher aides were not trained, although the teacher who received training may have shared information with him or her. 3 Of course, we recognize that there were undoubtedly informal interactions.

10
each administered standardized reading exams to students in grades 2-5, which allowed us to
gather outcome data without administering additional assessments.
Seven schools agreed to participate in the study.4 Table 1 provides statistics to help
compare the study schools to other elementary schools in the state. Compared with the other
elementary schools supervised by GVSU, the study schools have fewer African-American
students and fewer students eligible for subsidized meals. Achievement levels at the study
schools are also somewhat higher than other GVSU schools. For example, 58.7 (34.2) percent of
students in study schools achieved proficiency in reading (math), compared with 53.5 (32.1)
percent in other GVSU schools. Compared with the local traditional public schools, the study
charter schools perform even better. For example, only 45.9 (20.7) percent of students in the
local public schools scored proficient in reading (math).5
We excluded four honors classes in one school from the study because students were not
randomly assigned to the teacher and there were not a sufficient number of such classes to form a
separate block. In another school, there was only a single ELA teacher per grade for grades 3-5,
so random assignment was not possible in these grades.
One teacher within each of the 22 school-grade blocks was randomly assigned to receive
EBLI training. With the exception of the honors classes mentioned above, the study schools did
not explicitly track students into particular classes. School leaders indicated that they assigned
students to classes in a semi-random manner, but with the explicit intention of balancing the size
and gender distribution across classes within the same grade. Occasionally they also considered
4 These were the only schools contacted. There were no schools that were contacted but refused to participate. 5 In order to identify the traditional public school associated with a particular study school, we matched each charter school to the traditional public school students would most likely attend had they not enrolled in the charter school. Since we did not have students’ assigned neighborhood schools, we used students’ assigned school districts, residential zip codes, and grade levels to identify the most likely neighborhood schools. We then selected the school that appeared most often (i.e., the modal school) as the matched public school for that charter school. In cases where charter schools spanned more than one school level (e.g., a K-8 charter school), we matched to multiple public schools to cover all the grades (e.g., a separate elementary and middle traditional public school).

11
other factors (e.g., a desire to separate or maintain sibling pairs, specific personality matches
between students, etc.) in determining class assignments.
Importantly, randomization occurred in summer 2014, after class rosters had been
determined. Students who enrolled in the school after this time (late summer or during the
following academic year) are typically assigned to classes based on enrollment in an effort to
maintain balanced class sizes. Of course, it is possible that administrators may have assigned
new students to teachers in part with an eye to which students would benefit most from the
intervention. We explore this possibility more below.
We dropped two blocks (which included 4 teachers) after the randomization. In one case,
the treatment teacher left the school in September for personal reasons and her replacement was
not trained. In another case, the treatment classroom ended up with twice as many students as the
control classroom. School leaders decided to provide a second teacher to the larger class rather
than opening a third class at that grade level. While the student-teacher ratio was thus the same
across treatment and control classes in that block, we felt that the experience for students might
have been quite different. Finally, we dropped a fifth classroom in which the teacher, who had
received training, left the school in early September for personal reasons. In this case, we
randomly assigned one of the two remaining control teachers to receive training in mid-
September, and were thus able to keep the block in the study. In total, we were left with a total of
63 classes, 22 treatment and 41 control. The results presented below are based on this sample.
However, all of the results we present are robust to the inclusion of these five excluded
classrooms described above.

12
Data
The participating schools and GVSU provided the data for the study, including
demographics and student achievement measures for all students in treatment as well as control
classes. Our primary outcomes are standardized reading and math scores from the Measures of
Academic Progress (MAP). Developed by the Northwest Education Association (NWEA), MAP
are computer adaptive assessments that the study schools administered three times per year, in
September, January and May. In reading, the assessment uses multiple choice questions to
evaluate a student’s facility with word meaning, literacy comprehension, interpretive
comprehension and evaluative comprehension. For mathematics, the MAP examines a student’s
skills using multiple choice items in the seven domains of number/numeration systems,
operations/computation, equations/numerals, geometry, measurement, problem solving,
statistics/probability and applications (Wang et al 2013).
The MAP is intended to provide teachers diagnostic information to help them tailor
instruction for individual students. The tests are highly predictive of a student’s performance on
state tests. Student achievement measures are reported in terms of Rasch Units (RITs), an equal
interval scale that is design to allow one to measure year to year achievement growth (NWEA
2011). Like other measures based on item response theory, RITs assume a unidimensional latent
ability that can be estimated based on student performance on the administered test items.
Covariate Balance
Table 2 presents summary statistics on baseline characteristics for the study sample.
Columns 1 and 2 show mean values of each variable for the treatment and control classes
respectively. To examine covariate balance, we estimate the following OLS regression:
(0.1) 0 1ijk jk ijky treatment

13
where ijky is a student or classroom baseline characteristic for student i, in class j, within school
k. The binary variable treatment equals 1 if the teacher in classroom j received EBLI training.
The term jk indicates fixed effects for each randomization block. Standard errors are clustered
by classroom.
As expected, treatment and control classes are well balanced on all student demographics
and most of the prior achievement scores.6 One disturbing exception is that students in treatment
classrooms scored roughly 2.4 points (0.07 standard deviations) lower than their counterparts in
control classrooms on the fall 2014 MAP reading test. This is surprising given that the difference
in the Spring 2014 reading score and Fall 2014 math scores are only one-third this size and not
significantly different than zero.7
To test whether the observed differences between treatment and control students are
significantly different than one might expect by chance, we conduct a permutation test that
accounts not only for the clustering of students within classrooms, but also the correlation among
the various student characteristics. Specifically, in each of 1,000 permutations, we randomly
assign one classroom per block to the treatment condition, and then estimate a Seemingly
Unrelated Regression (SUR) that allows for correlations across the error term in each of the
outcome regressions. For each permutation, we then conduct a test of whether the coefficient on
the treatment indicator is jointly zero across all of the outcomes. We save the test statistic and p-
value for each permutation. Finally, we conduct the same estimation based on the actual random
6 It is worth noting that a small number of students in several schools received 1-on-1 tutoring from EBLI trained Title I teachers. However, as shown in the table, only 3 percent of students received this type of intervention and the fraction was identical across treatment and control classrooms within block. 7 If one focuses only on students with spring 2014 reading scores, there is still a significant difference across treatment and control classrooms in fall 2014 reading scores, suggesting it is not merely a composition difference that explains the fall 2014 reading score difference.

14
assignment in the study, and determine where the test statistic from the randomization falls in the
distribution of test statistics from these 1,000 permutations.
We find that the test statistic from the actual randomization falls at the 72nd percentile of
test statistics generated in our permutations, which implies a p-value of 0.28. This suggests that
the distribution of covariates across treatment and control classes that we find is not significantly
different than what one would expect to find by chance. However, given the potential importance
of the fall reading score, we adopt several estimation strategies to test the sensitivity of our
results.
Estimation
In theory, the successful randomization implies that we should be able to simply compare
the mean outcomes across treatment and control groups (within blocks) to determine the impact
of the program. We show these results below. In addition, in order to account for the few
differences we do see (most importantly the fall 2014 reading score), we also estimate OLS
models, such as the following, that control for a rich set of controls for student background
characteristics:
(0.2) 0 1ijk ij jk ijkreading treatment X
where reading is the spring 2015 MAP reading score, and X is a vector of student and classroom
characteristics. To facilitate interpretation, we standardize all test score measures using the mean
and standard deviation of the control classrooms. We control for all of the variables shown in
Table 2, as well as a variable indicating the date on which students in a particular class took the
spring 2015 exam. For students with missing spring 2014 test scores, we set the score to zero and
include a missing variable indicator. We allow all variables to vary by grade. To account for
heteroscedasticity, we present robust standard errors that are clustered by classroom.

15
Finally, we take advantage of the fact that we have fall and spring scores in math as well
as reading to further control for any remaining differences between treatment and control
students. Conceptually, we calculate what might be described as a difference-in-difference
estimate:
(0.3) , read, , ,y y y yread spring spring math spring math springtreat control treat controlDD
Or controlling for fall scores, we could calculate:
(0.4)
, , , ,
, , , ,
y y y y
y y y y
read spring read fall read spring read falltreat treat control control
math spring math fall math spring math falltreat treat control control
DDD
In practice, we estimate a more flexible version of the triple difference above that
includes other covariates and allows the effect of these covariates to differ by subject. We
expand the data so that we have two observations per student, with one capturing the child’s
reading score and the other reflecting the child’s math score, and estimate the following OLS
regression model.
(0.5) 0 1 2 3ijk ij jk ijkscore treatment reading treatmentXreading X
where reading is a binary variable that equals 1 if the outcome is a reading score and 0 if the
outcome is a math score, treatmentXreading is an interaction term, and the covariate vector X is
allowed to have separate effects for math and reading outcomes. If one is concerned about the
result of the initial random assignment, the estimate of the interaction term, 3 , provides an
additional robustness check. The only remaining concern would be the existence of unobservable
student factors that are correlated with treatment assignment and influence the growth of reading
scores differently than the growth of math scores, conditional on the other covariates included in
the model. In fact, to the extent that the intervention led teachers to shift class time and/or their

16
energy from math to reading, 3 might be biased upward. Hence, we believe it should be
interpreted as an upper bound on the treatment effect of the intervention on reading achievement.
Results
Table 3 presents the main results of the experiment. Each column reports the results from
a separate regression. The estimates in columns 1 and 2 document that there was no treatment-
control difference in the fraction of students taking the spring reading exam. Column 3 shows
that, when one simply controls for block fixed effects, treatment classes score roughly 0.14
standard deviations below control classes. However, once we control for student demographics
and prior test scores in column 4, the estimate drops more than 75 percent and is no longer
significant at conventional levels.
These estimates suggest that the intervention had no significant effect on student
performance. However, one might still be concerned about the modest baseline difference in
reading (though not math) scores. For this reason, we utilize student math performance across
classrooms as a robustness test. In columns 5-6, we show estimates from equation (0.5), which
compares student growth in reading relative to math in treatment versus control classrooms. The
point estimates on the treatment x reading interaction are positive, but small and statistically
insignificant. As noted above, these estimates should be interpreted as upper bounds on the
treatment effect because treatment teachers may have shifted effort across subjects. Based on
these set of results, we are able to rule out even small impacts. Using the estimate shown in
column 4, we can reject that the intervention improved reading scores on average by more than
0.03 standard deviations. Columns 7-8 show results for the winter 2015 reading exam. Students
in treatment classrooms were slightly more likely to take this exam relative to students in control

17
classrooms (column 7), but the point estimate of the intervention impact is virtually identical to
the estimate for the spring scores (column 8).
While the intervention had no effect on average, it is possible that it might have impacted
students differently. To explore this possibility, Table 4 shows estimates for several common
subgroups. It appears that the intervention actually reduced reading performance for male
students and non-black (predominantly Caucasian) students. The sex and race differences are
statistically significant with p-values of 0.03 and 0.04 respectively. There is some evidence that
the intervention was least effective for non-black and male students. Figure 1 shows point
estimates and 95% confidence intervals for the effect of the intervention in each of the seven
participating schools, arranged from left to right by the number of observations in the analysis
sample in the school.8 There is suggestive evidence that the intervention was effective in school
5, although we cannot reject that the individual school effects are statistically different than each
other at conventional levels.
Effects on teacher attitudes and behaviors
The results above suggest that the intervention had no impact on student reading
achievement overall. As in any situation in which a program is newly implemented, such null
effects might be the result of many factors. It might be the case that the treatment group did not
implement the intervention properly, the control group received some alternative intervention, or
that the intervention was implemented but simply did not influence student performance. Using a
survey administered to all study teachers in spring 2015 along with observations recorded by the
8 Because of problems with multicollinearity, the following controls are excluded from these specifications: class sizes, team teaching, changing teacher. In addition, because of the small number of clusters, we estimate these specifications with a mixed model which includes block fixed effects and random effects for classrooms, but does not cluster the standard errors by classroom.

18
EBLI trainer after school visits throughout the year, we attempt to explore what factors may have
contributed to the lack of any achievement effects.
The researchers administered a survey to all study teachers in spring 2015 to measure a
host of attitudes and behaviors associated with reading instruction. In addition to asking
treatment teachers to report on various aspects of the intervention, the survey asked both
treatment and control teachers to describe how confident they felt in their ability in various
aspects of teaching reading. In addition, teachers were asked to describe how often they utilized
different types of materials and how often they engaged in a variety of “best practice” reading
instructional techniques. These aspects of the survey were adapted from teacher surveys used in
the Reading First Implementation Evaluation (Moss et al., 2006), which were intended to
measure teacher knowledge and use of evidence-based practices. A complete version of the
survey can be found in Appendix A. Overall, the response rate was 81.5 percent, with 90.9
percent of treatment teachers responding and 76.7 percent of control teachers responding.
Table 5 provides information on how much treatment teachers reported using EBLI
resources and how satisfied they were with the training. The results are positive, but not
particularly strong. Only 55 percent of teachers indicated they were satisfied or very satisfied
with the EBLI program, although 75 percent indicated that they would recommend it to a
colleague. While all teachers reported that the web-based resources were easy to access and 80
percent stated they had received all necessary materials to implement the program, only 65
percent agreed that EBLI had positively impacted his or her students’ ability to read. Usage of
the online resources was somewhat lower than the program developers recommend, although it is
possible that teacher usage may have declined over the school year as teachers became more
comfortable with the program.

19
Table 6 looks at how the type and amount of professional development differed across
treatment and control teachers, as well as their self-reported level of understanding about
teaching reading. Columns 1 and 2 report the mean survey responses among control and
treatment teachers respectively. Columns 3 and 4 report the estimated difference between
treatment and control teachers based from an OLS model that controls for block fixed effects and
reports heteroscedasticity-robust p-values.
While 80 percent of treatment teachers reported receiving some professional development
in reading, so did 53 percent of control teachers. If teachers interpreted this question to include
the EBLI training, 100 percent of treatment teachers should have reported receiving professional
development. Hence, we suspect that some teachers interpreted this question differently. Overall,
treatment teachers report participating in roughly 35 hours of professional development in
reading compared with only 11 hours for control teachers. Despite this additional professional
development, there are few differences between treatment and control teachers in terms of how
well prepared they feel in various aspects of teaching. Virtually all teachers in both treatment and
control groups indicated that they had a good understanding of how children acquire language
skills and how to assess the progress of students in reading. Similarly, treatment and control
teachers were equally likely to feel prepared to diagnose the challenges faced by struggling
readers and bring these students to grade level.
The one exception is that treatment teachers were significantly more likely to report
feeling prepared to teach phonemic awareness. They were also substantially more likely to report
being comfortable teaching decoding, although the difference was not statistically significant.
Consistent with these results, there were few differences between treatment and control teachers

20
in the frequency with which they received various types of support in teaching reading, such as
mentoring by a reading coach or help diagnosing children for disabilities.
Table 7 looks at how instructional practices differed across treatment and control
teachers. We create composite measures of a teacher’s engagement in evidence-based practices
in four areas: reading text, working with sounds and words, use of reading materials and writing
activities. In each case, the measure reflects the fraction of practices that the teacher reports
doing at least weekly. For example, the 0.772 for control teachers in reading text means that in
the area of reading text control teachers reported doing 77 percent of evidence-based practices at
least 2-4 times per week. For more detail on the construction of these measures, see Appendix B.
Across all four measures, we see small and statistically insignificant differences between
treatment and control teachers. In addition to practices commonly endorsed by the literacy
community and included in prior research, we also asked teachers about specific strategies or
activities that EBLI either explicitly encourages or discourages. The result in rows 5 and 6
suggest that while EBLI-trained teachers were no more likely to engage in the encouraged
activities, they were considerably less likely to engage in the discouraged practices. In summary,
the results in Table 7 suggest that the intervention did not have an important impact on teachers’
instructional practices, although it may have discouraged them from engaging in a few particular
types of activities.
Heterogeneity by implementation quality
A common explanation for null results involves implementation challenges.
Unfortunately, it is typically difficult to explore such issues for at least two reasons: (1) it is often
hard to construct a measure of implementation quality; and (2) implementation quality – even if

21
measured – is not randomly assigned and thus one must hesitate in making causal inferences
with regard to this dimension of practice.
We face both challenges in this case, but we attempt to provide at least descriptive
information on implementation by using the notes taken by EBLI trainers when they visited
teacher classrooms throughout the year. After each visit, the trainer wrote a short assessment of
how well the teacher was using the EBLI protocols. Her assessment was based on discussions
with the teacher and observations of the class. The research team read through these assessments
and assigned a score from 1 (low) to 3 (high) for each visit. We averaged scores across all three
visits to come up with a final measure of implementation quality.9 It is worth emphasizing that
the trainer’s notes, and thus the measures constructed from them, combine adherence to the EBLI
techniques along with more general pedagogical skill. In this sense, our measure likely captures a
teacher’s general effectiveness, which might have been similar in the absence of the training.
Table 8 presents estimates from a model that allows for interactions between the
treatment indicator and terciles of implementation quality. Column 1 presents estimates from our
baseline model, corresponding to column 4 in Table 3. Column 2 presents estimates from the
triple difference model, corresponding to column 6 in Table 3. Note that because we have no
quality measure for control teachers, the estimates here are comparing treatment teachers with
different levels of implementation quality to the full set of control teachers. For this reason, and
because implementation quality was not randomly assigned, one cannot interpret these estimates
causally. With those caveats in mind, the results suggest that treatment teachers who
implemented EBLI with low quality were significantly less effective than control teachers, but
9 For examples of comments associated with different scores, see Appendix C.

22
that treatment teachers who implemented EBLI with moderate or high quality were equally
effective as control teachers.
Discussion and Conclusions
This experimental evaluation finds that the Evidence-Based Literacy Instruction (EBLI)
program had no significant impact on student reading performance. The estimates are quite
precise, allowing us to rule out positive effects larger than 0.02 standard deviations, and robust to
the inclusion of extensive controls for student demographics and baseline achievement.
Moreover, there are no significant positive effects for any of the subgroups examined, including
race, gender, and baseline achievement.
Teacher surveys suggest that control teachers did not receive any compensating
professional development, and that treatment teachers had access to the materials and online
resources they were supposed to receive. Yet, there were virtually no differences between
treatment and control teachers in their self-reported confidence in various aspects of teaching
reading or in their use of evidence-based instructional practices.
In assessing the external validity of these results, it is useful to consider the
characteristics of the sample. While the study schools were not among the first group to request
EBLI, with one exception they were initially quite interested in the program and very willing to
participate.10 The statistics in Table 1 suggest that, as a whole, the study schools have somewhat
fewer poor children and perform somewhat higher on standardized tests than other GVSU
schools or the local (non-charter) public schools.
So what might explain these null results? One possibility lies in the nature of the
intervention. EBLI is not a comprehensive reading program or a heavily scripted curriculum, but 10 One school was reluctant to participate, but eventually agreed after encouragement by the charter authorizer.

23
rather a set of strategies and techniques that teachers must integrate into their own reading
instruction. As such, EBLI requires teachers to not only fully understand the techniques
themselves, but also to figure out when and how to best incorporate them into their daily
instruction.
Initially, EBLI teachers are supposed to teach roughly 15 lessons to introduce students to
the key EBLI concepts and activities. Teachers receive guidance about these lessons in the initial
training and are provided lesson plans from which to work. Moreover, teachers are encouraged to
watch a series of online videos to see master teachers implementing these lessons and to obtain
other advice about how to structure the activities. Each lesson is intended to take about 30-40
minutes. Teachers can choose exactly how and when to integrate them into their normal reading
program, though they are expected to have completed these initial lessons by November. After
completing this initial set of lessons, teachers are encouraged to integrate the same type of
activities into their daily reading instruction, and to infuse the EBLI reading, writing, and
spelling activities into their content area instruction (in all subject areas). EBLI recommends that
teachers utilize these techniques/activities at least several times per week. Teachers are expected
to take advantage of the online resources for assistance.
Conversations with the staff from the charter authorizer suggest that most treatment
teachers did teach the initial set of prescribed lessons, but many teachers then found it difficult to
incorporate EBLI techniques into their reading instruction throughout the rest of the school year.
In this way, the results of this evaluation echo many of the conclusions of research on the
implementation of education reforms and the challenges of changing instructional practice. This
body of work emphasizes the complexity of school environments (Cohen and Ball, 1999, 2001)

24
and the importance of providing teachers sufficient structure and support for learning new
instructional practices (Rowan et al., 2009, Rowan and Correnti 2009).
The developer of EBLI notes that teaching EBLI is “a paradigm shift for teachers,
focusing more on teaching to the students than teaching to materials. This can be uncomfortable
for teachers initially, until they become more automatic at the process.” In describing the
common factors in schools that have successfully implemented EBLI, she lists things such as a
school-wide willingness to adopt EBLI, fully trained and/or highly involved administrators, and
the incorporation of EBLI videos and discussion in grade-level and other staff meetings.
In part based on the results of this evaluation, EBLI has initiated a series of changes
aimed at providing teachers with more guidance and support throughout the school year. Most
importantly, the program has increased its focus on making sure teachers incorporate EBLI
techniques into their daily instruction after the initial lessons are taught. For example, lesson
plans for upper grades have been changed to include templates to help teachers infuse EBLI into
all content-area instruction that includes reading, writing, and spelling. In addition, the program
created a thorough system of formative assessment that measures phonemic awareness, phonics,
fluency, vocabulary, comprehension, writing, and spelling, which is now available for teachers.
Finally, the program is in the process of creating an online training to replace the three-day in-
person training, and spread instruction for teachers over several weeks in a way that will allow
them to better integrate newly learned techniques into their class.
The hope is that this study is the start – and not the end – of a cycle of improvement and
evaluation – that will ultimately lead to the creation of a literacy program that is effective at
improving reading consistently for all children.
25
References
Ball, D. L. & Cohen, D.K. (2000). The Study of Instructional Improvement. Working Paper. Instructional Innovation: Reconsidering the Story. The University of Michigan. Ball, D. L. & Cohen, D. K. (2000). Challenges of improving instruction: A view from the classroom. Washington, DC: Council of Basic Education. Cohen, D. K. & Ball, D. L. (1999). Instruction, capacity, and improvement. (CPRE Research Report No. RR-043). Philadelphia, PA: University of Pennsylvania, Consortium for Policy Research in Education.
Cohen, D. K., & Ball, D. L. (2001). Making change: Instruction and its improvement. Kappan. Cohen, D.K., Moffitt, S.L., & Goldin, S. (2007). Policy and practice: The dilemma. American Journal of Education, 113. Correnti, R., & Rowan, B. (2007). Opening Up the Black Box: Literacy Instruction in Schools Participating in Three Comprehensive School Reform Programs. American Educational Research Journal, 44(2), 298-339. Garet, M., Cronen, S., Eaton, M., Kurki, A., Ludwig, M., & Jones, W. (2008). The impact of two professional development interventions on early reading instruction and achievement (Rep.). New York: MDRC. Moss, M., Fountain, A., Boulay, B., Horst, M., Rodger, C., & Browns-Lyons, M. (2008). Reading First implementation evaluation: Final report (Rep.). Cambridge, MA: Abt Associates. Moss, M., Jacob, R., Boulay, B., Horst, M., Rodger, C., & Browns-Lyons, M. (2006). Reading First implementation evaluation: Interim report (Rep.). Cambridge, MA: Abt Associates. Northwest Evaluation Association. (2011). Measures of academic progress® (MAP®) parent toolkit: A guide to NWEA™ assessments. Portland, OR: Author. Rowan, B., & Correnti, R. (2009). Interventions to improve instruction: How implementation strategies affect instructional change. In W. K. Hoy & M. DiPaola (Eds.), Studies in school improvement: A volume in theory and research in educational administration (Vol. 8). Greenwich, CT: Information Age. Rowan, B., Barnes, C., & Camburn, E. (2004). Benefiting from comprehensive school reform: A review of research on CSR implementation. In C. Cross (Ed.), Putting the pieces together: Lessons from comprehensive school reform research. Washington, DC: National Clearninghouse on Comprehensive School Reform.

26
Rowan, B., Camburn, E. M., Miller, R. J., & Correnti, R. (2009). School Improvement by Design: Lessons from a Study of Comprehensive School Reform Programs. In Handbook of education policy research. London: Taylor & Francis. Rowan, B., Correnti, R., Miller, R., & Camburn, E. (2009). School Improvement by Design: Lessons From a Study of Comprehensive School Reform Programs. Slavin, R. E., Lake, C., Chambers, B., Cheung, A., & Davis, S. (2009). Effective Reading Programs for the Elementary Grades: A Best-Evidence Synthesis. Review of Educational Research, 79(4), 1391-1466. Wang, S., Mccall, M., Jiao, H., & Harris, G. (2013). Construct Validity and Measurement Invariance of Computerized Adaptive Testing: Application to Measures of Academic Progress (MAP) Using Confirmatory Factor Analysis. Journal of Educational and Developmental Psychology JEDP, 3(1). Workman, E. (2014, December). Third-grade reading policies (Issue brief). Retrieved September 3, 2015, from Education Commission of the States website: http://www.ecs.org/clearinghouse/01/16/44/11644.pdf

Table 1 - Summary Statistics
Study SchoolsOther GVSU
Schools
Traditional public school comparisons for the
study schools
Student DemographicsFemale 0.497 0.492 0.516Black 0.631 0.530 0.684Caucasian 0.283 0.325 0.178Asian 0.024 0.065 0.067Hispanic 0.056 0.073 0.067Limited english proficient 0.030 0.053 0.098Special education 0.105 0.114 0.129Subsidized meals 0.736 0.677 0.814
Academic AchievementAverage reading score (std) -0.213 -0.186 -0.461fraction proficient in reading 0.587 0.592 0.459Average math score (std) -0.201 -0.151 -0.545fraction proficient in math 0.342 0.367 0.207
On state watch list for bottom 5% performing schools 0.000 0.129 0.412
Average enrollment per grade in grades 2-5 74 83 76Notes: Demographics based on 2014-15 school year. Standardized test scores are from Fall 2013. All statistics are weighted by student enrollment in the school. Source for priority school list: http://www.michigan.gov/documents/mde/2013-14_Priority_Schools_465225_7.pdf

Treatment Classes (n=22)
Control Classes (n=41) Diff = T - C p-value
Student BackgroundFemale 0.499 0.491 0.013 0.376Black 0.584 0.590 -0.017 0.218Caucasian 0.267 0.276 -0.002 0.884Asian 0.017 0.013 0.004 0.500Hispanic 0.056 0.063 -0.005 0.683Multiple races 0.065 0.053 0.015 0.148Special education 0.096 0.108 -0.019 0.123Received 1-on-1 tutoring 0.030 0.033 -0.003 0.582
Class Characteristics Fall class size 25.3 25.3 -0.668* 0.072Two teachers in the class at the same time (i.e., team teaching) 0.032 0.057 -0.027 0.545Teacher changed during the school 0.000 0.095 -0.089** 0.040
Spring 2014 NWEA ExamsReading score missing 0.232 0.215 0.011 0.490Reading score 190.944 191.467 -0.967 0.121Math score missing 0.230 0.216 0.008 0.602Math score 195.417 194.706 0.126 0.841
Fall 2014 NWEA ExamsReading score 185.134 187.664 -2.435*** 0.000Math score 189.737 190.437 -0.833 0.264
Table 2 - Covariate Balance between Treatment and Control Classes
Notes: Unless otherwise noted, the statistics reflect only those students who were present in the classroom in Fall 2014. Columns 3 and 4 reflect estimates of the treatment indicator from an OLS regression that includes randomization block fixed effects, with standard errors clustered at the classroom level.

Table 3 - The Effect of EBLI Training on Student Achievement
Took Winter 2015 Reading
Test
Winter 2015 Reading Score (standardized)
(1) (2) (3) (4) (5) (6) (7) (8)Treatment class -0.004 0.004 -0.143*** -0.032 -0.163** 0.086* -0.015
(0.010) (0.012) (0.048) (0.032) (0.066) (0.045) (0.032)
Treatment class * Reading Score 0.024 0.047
(0.066) (0.057)
Demographic and prior achievement controls
No Yes No Yes No Yes Yes Yes
Controls interacted with reading test
-- -- -- -- -- Yes -- --
Block fixed effects Yes Yes Yes Yes Yes No Yes YesStudent fixed effects No No No No No Yes No No
Number of students 1,537 1,537 1,454 1,454 2,908 2,908 1,457 1,355Number of classes 63 63 63 63 63 63 63 60Control mean 0.952 0.952 0.007 0.007 0.012 0.012 0.903 0.419Control s.d. 0.214 0.214 0.994 0.994 0.992 0.992 0.296 0.957Notes: All models include randomization block fixed effects. Controls include all of the student demographics and class characteristics shown in Table 1, as well as spring and fall 2014 math and reading NWEA scores, and the date on which the outcome test was taken. All covariates are allowed to vary with grade level. Standard errors are clustered by class.
Spring 2015 Score (standardized)
Took Spring 2015 Reading Test
Spring 2015 Reading Score (standardized)

Table 4 - The Effect of EBLI Training on Student Achievement, by Subgroup
Bottom Half of Fall Reading Scores in the
Class
Top Half of Fall Reading Scores in the
ClassMale Female Non-Black Black
Treatment -0.048 0.000 -0.118** -0.031 -0.132** -0.014(0.050) (0.048) (0.056) (0.034) (0.050) (0.048)
Number of students 668 758 726 727 603 850Number of classes 63 63 63 63 53 59Control mean -0.597 0.534 -0.066 0.082 0.349 -0.235Control s.d. (0.863) (0.788) (1.024) (0.958) (0.979) (0.933)
Grade 2 Grade 3 Grade 4 Grade 5Treatment -0.071 -0.056 -0.028 0.033
(0.074) (0.036) (0.056) (0.086)
Number of students 375 371 376 331Number of classes 17 15 17 15Control mean 0.010 -0.006 0.025 -0.002Control s.d. (0.984) (0.996) (1.001) (1.002)
Notes: The outcome measure in all cases is the spring 2015 NWEA reading score, standardized to the mean and standard deviation of the control group. The specification is identical to that shown in column 4 of Table 3. In the top panel standard errors are clustered by class. In the bottom panels, standard errors are adjusted to account for a random class effect because the number of clusters is small.

Table 5 - Usage and Satisfaction among Treatment Teachers
General Satisification with the EBLI training
Percent agree or strongly agree
Questions or reservations I had regarding Evidence-Based Literacy Instruction were answered or addressed during the 3-day training session. 75%I received all necessary materials to implement Evidence-Based Literacy Instruction effectively upon completion of the training session. 80%
After completing the training, I felt confident in my ability to teach my students using the Evidence-Based Literacy Instruction method. 70%
Member's Area resources are easy to find and access. (confirm that 100% claimed to use them) 100%
Did you receive sufficient support to implement the Evidence-Based Literacy Instruction program in your classroom this year? 85%
EBLI helped to positively impact my students' reading and/or writing ability. 65%EBLI helped to positively impact my students' behavior. 45%Overall, how satisfied are you with the Evidence-Based Literacy Instruction program? 55%
Percent recommend
Would you recommend the Evidence-Based Literacy Instruction program to others in your network 75%
Usage of Online Resources
Occassionally (2-4 times per month)
Frequently (at least 2-4 times per week)
% indicating that the
resource was helpful or very
helpful
Instructional Videos 55% 45% 95%
Helpful Hints Video 50% 30% 60%
Authentic Lesson Template 40% 40% 85%
EBLI Implementation Recommendations 40% 30% 60%
EBLI Recommended Resources 25% 50% 65%
Webinars 20% 10% 35%
Other resources (e.g. activities, worksheets, templates, etc.) 35% 60% 80%
Notes: Based on sample of 20 trained treatment teachers who completed the Spring 2015 survey.

Control Treatment Diff: T-C p-value
Did you take any University-based course in the teaching of reading or writing in the past 12 months (including last summer)?
0.194 0.200 0.025 0.865Other than coursework, did you receive any other professional development in the teaching of reading or writing in the past 12 months (including last summer)? 0.533 0.800 0.212 0.169Total hours spent in reading PD (conditional on answering yes above)
21.5 43.7 8.08 0.318Total hours spent in reading PD (unconditional on answering yes above)
11.1 34.5 29.37* 0.084Fraction who agree or strongly agree with the following statements about professional develompent and support for teaching reading:
I have a good understanding of how children acquire language and literacy skills. 0.931 1.000 0.051 0.294I know how to assess the progress of my students in reading.
0.931 0.950 0.017 0.856How well prepared do you feel you are to teach each of the following dimensions of literacy? (fraction reporting they feel well or extremely well prepared)
Phonemic awareness0.387 0.700 0.294* 0.088
Decoding0.516 0.700 0.168 0.233
Vocabulary0.742 0.750 -0.0672 0.660
Comprehension0.774 0.850 0.000 1.000
Fluency building0.548 0.700 0.143 0.385
Spelling0.645 0.700 -0.0252 0.856
Writing0.581 0.400 -0.269 0.108
Handwriting0.516 0.400 -0.151 0.341
How well prepared do you feel to handle each of the following situations? (fraction reporting well or extremely well prepared)
Help bring a struggling reader to grade level.0.516 0.500 -0.067 0.694
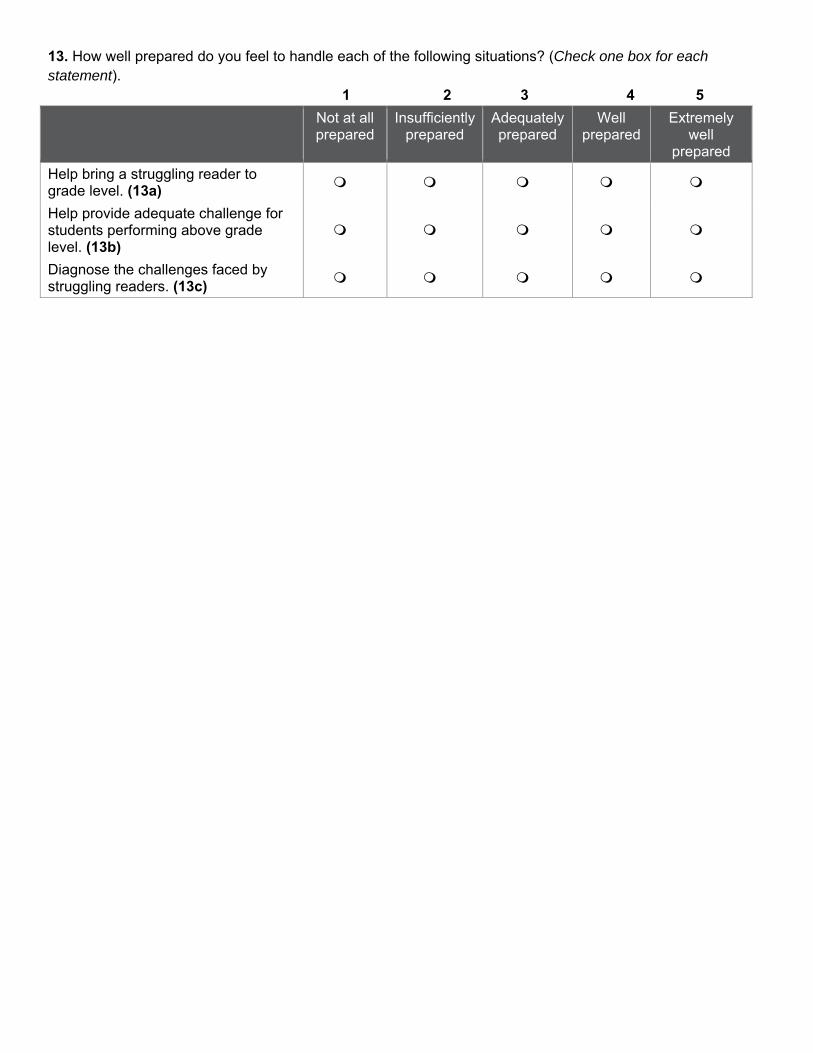
Help provide adequate challenge for students performing above grade level. 0.645 0.650 -0.008 0.961Diagnose the challenges faced by struggling readers.
0.548 0.600 0.008 0.963
Table 6 - Teacher Experiences with Professional Development and Self-Confidence about Teaching Reading

Control Treatment Diff: T-C p-value
Fraction reporting each of the following activities occurred at least once a month
Received mentoring by a reading coach0.194 0.350 0.067 0.645
Received help with diagnostic testing for individual students0.290 0.250 -0.008 0.951
Received help in coordinating reading interventions for struggling readers. 0.226 0.500 0.269* 0.058Received help using assessment data to determine topics that require additional instruction or practice. 0.290 0.600 0.378*** 0.007Attended grade-level or subject-specific meetings in my school devoted to reading. 0.355 0.400 0.076 0.616Accessed online videos, webinars or other online resources to enhance my teaching of reading. 0.290 0.450 0.067 0.676Utilized new methods of teaching reading as a result of professional development this year. 0.419 0.850 0.412*** 0.008
Total number of teachers 43 22# of teachers took survey 33 20% of teachers took survey 76.7% 90.9% 0.196** 0.039
Notes: Based on sample of teachers who completed the Spring 2015 survey. Columns 3 and 4 reflect estimates of the treatment indicator from an OLS regression that includes randomization block fixed effects, with robust standard errors.
Table 6 ctd. - Teacher Experiences with Professional Development and Self-Confidence about Teaching Reading

Practice Type Control Treatment Diff: T-C p-value
Reading Text 0.772 0.806 0.019 0.719Working w/ Sounds and Words 0.595 0.669 0.012 0.853Reading Materials 0.713 0.642 -0.068 0.273Writing Activites 0.638 0.656 -0.001 0.989
Practices explicitly encouraged by EBLI 0.709 0.764 0.023 0.657Practices explicitly discouraged by EBLI 0.517 0.225 -0.308*** 0.009
Table 7 - Teacher use of evidence-based literacy practices
Notes: Based on sample of teachers who completed the Spring 2015 survey. Columns 3 and 4 reflect estimates of the treatment indicator from an OLS regression that includes randomization block fixed effects, with robust standard errors. See Appendix B for the constructions of the measures.
Fraction of evidence-based practices that the teacher uses weekly

Table 8 - The Effect of EBLI Training by Quality of Implementation
Spring 2015 Reading Score
Spring 2015 Score
(1) (2)Treatment -0.110**
(0.042)Treatment x Moderate Quality 0.091
(0.074)Treatment x High Quality 0.117*
(0.059)Treatment x Read -0.015
(0.069)Treatment x Moderate Quality x Read 0.130
(0.098)Treatment x High Quality x Read 0.035
(0.148)
Demographic and prior achievement controls
Yes Yes
Block fixed effects Yes NoStudent fixed effects No YesNumber of students 1,454 2,908Number of classes 63 63Control mean 199.956 202.666Control s.d. 16.982 17.623Notes: All models include randomization block fixed effects. See text for description of the specifications.

‐0.11‐0.06
‐0.14
‐0.05
0.19
‐0.30
0.31
‐1.2
‐1.0
‐0.8
‐0.6
‐0.4
‐0.2
0.0
0.2
0.4
0.6
0.8
School 1(n=331)
School 2(n=315)
School 3(n=292)
School 4(n=246)
School 5(n=199)
School 6(n=36)
School 7(n=35)
Effect Size
Figure 1 ‐ The Impact of EBLI Traning on Student Achievement, by School
Note: Circles indicate point estimates and bars indicate the bounds of 95% confidence intervals around the estimates.
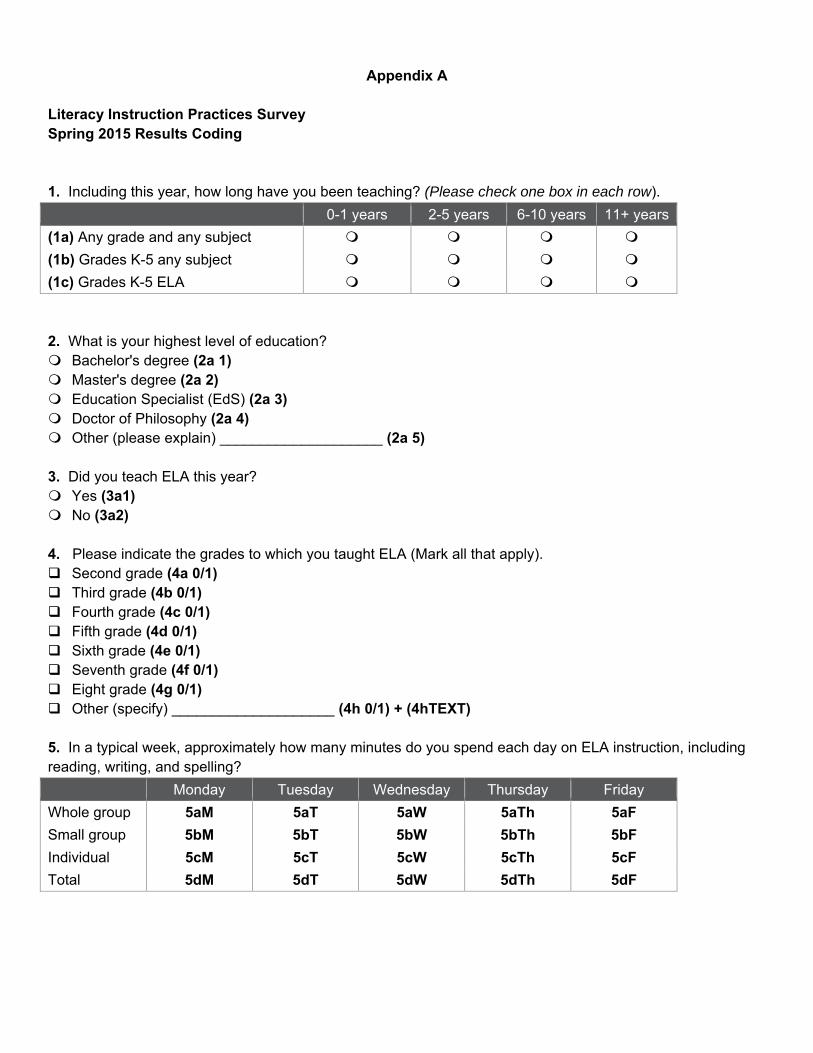
Appendix A
Literacy Instruction Practices Survey Spring 2015 Results Coding 1. Including this year, how long have you been teaching? (Please check one box in each row).
0-1 years 2-5 years 6-10 years 11+ years
(1a) Any grade and any subject
(1b) Grades K-5 any subject
(1c) Grades K-5 ELA 2. What is your highest level of education? Bachelor's degree (2a 1) Master's degree (2a 2) Education Specialist (EdS) (2a 3) Doctor of Philosophy (2a 4) Other (please explain) ____________________ (2a 5) 3. Did you teach ELA this year? Yes (3a1) No (3a2) 4. Please indicate the grades to which you taught ELA (Mark all that apply). Second grade (4a 0/1) Third grade (4b 0/1) Fourth grade (4c 0/1) Fifth grade (4d 0/1) Sixth grade (4e 0/1) Seventh grade (4f 0/1) Eight grade (4g 0/1) Other (specify) ____________________ (4h 0/1) + (4hTEXT) 5. In a typical week, approximately how many minutes do you spend each day on ELA instruction, including reading, writing, and spelling?
Monday Tuesday Wednesday Thursday Friday
Whole group 5aM 5aT 5aW 5aTh 5aF
Small group 5bM 5bT 5bW 5bTh 5bF
Individual 5cM 5cT 5cW 5cTh 5cF
Total 5dM 5dT 5dW 5dTh 5dF

6. Please describe your use of the following ELA instructional activities - Reading Text in the past year (Check one box for each statement).
1 2 3 4 5
Daily Frequently (2-5 times per week)
Occasionally (2-4 times per month)
Infrequently (once or twice per
year)
Never
Students read aloud unfamiliar text. (6a)
Students reread familiar stories multiple times. (6b)
I listen to students read aloud without correcting errors. (6c)
I listen to students read aloud and correct errors immediately. (6d)
I stop students while reading and have them self-correct misidentified words. (6e)
Please describe your use of the following ELA instructional activities - Reading Text in the past year (Check one box for each statement).
1 2 3 4 5
Daily Frequently (2-5 times per week)
Occasionally (2-4 times per month)
Infrequently (once or twice
per year)
Never
I provide error correction guidance, without pronouncing the word, when an error occurs during students’ reading. (6f)
I discuss new and unusual words before reading. (6g)
I pre-teach students how to read unfamiliar / multi-syllable vocabulary words before students encounter them in reading text. (6h)
Students are given time to read on their own for enjoyment. (6i)
I include writing opportunities in reading instruction. (6j)
I provide spelling instruction during reading instruction time. (6k)

7. Please describe your use of the following ELA instructional activities - Working with Sounds and Words in the past year (Check one box for each statement).
1 2 3 4 5
Daily Frequently (2-5 times per week)
Occasionally (2-4 times per month)
Infrequently (once or twice
per year)
Never
I teach students to decode multi-syllabic words in isolation. (7a)
I teach decoding skills while reading stories. (7b)
Students say sounds in unfamiliar words as they read and write. (7c)
Students memorize sight words. (7d)
Students read irregularly spelled words and non-sense words in isolation or on flash cards. (7e)
Students practice reading high frequency words for automatically. (7f)
Please describe your use of the following ELA instructional activities - Working with Sounds and Words in the past year (Check one box for each statement).
1 2 3 4 5
Daily Frequently (2-5 times per week)
Occasionally (2-4 times per month)
Infrequently (once or twice
per year)
Never
Students use knowledge of root words, prefixes, and suffixes to decode new words. (7g)
Students use context clues to identify unknown words. (7h)
Students practice reading and writing words as separate syllables. (7i)
I encourage students to guess unfamiliar words or insert a word that would make sense. (7j)
I encourage students to look at the picture to read text. (7k)

8. Please describe your use of the following ELA instructional activities - Reading Materials in the past year (Check one box for each statement).
1 2 3 4 5
Daily Frequently (2-5 times per week)
Occasionally (2-4 times per month)
Infrequently (once or twice
per year)
Never
Use books that are easy to decode. (8a)
Use books with patterned predictable language. (8b)
As a class we read current event or other non-fiction articles. (8c)
Students read leveled books. (8d)
Classroom instruction includes reading novels as a group. (8e)
Please describe your use of the following ELA instructional activities - Reading Materials in the past year (Check one box for each statement).
1 2 3 4 5
Daily Frequently (2-5 times per week)
Occasionally (2-4 times per month)
Infrequently (once or twice
per year)
Never
Use core reading series. (8f)
In class students read books that challenge them. (8g)
Students read books that they have chosen themselves from the library. (8h)
Students develop reading skills through science and social studies texts. (8i)

9. Please describe your use of the following ELA instructional activities - Writing Activities in the past year (Check one box for each statement).
1 2 3 4 5
Daily Frequently (2-5 times per week)
Occasionally (2-4 times per month)
Infrequently (once or twice
per year)
Never
I dictate sentences/paragraphs for students to write. (9a)
Students write vocabulary words in sentences. (9b)
Use whole-class scaffolded writing. (9c)
Students write on white boards or tablets. (9d)
Students write summary sentences for comprehension. (9e)
Please describe your use of the following ELA instructional activities - Writing Activities in the past year (Check one box for each statement).
1 2 3 4 5
Daily Frequently (2-5 times per week)
Occasionally (2-4 times per month)
Infrequently (once or twice
per year)
Never
Students use inventive spelling (I encourage students to use their own spellings of new words in their writing). (9f)
I correct capitalization and punctuation mistakes in students’ writing. (9g)
I correct spelling errors in students’ writing. (9h)
Students self-correct spelling errors in their writing. (9i)

10. How often do your students who are struggling readers receive each of the following supports? (Check only one box for each statement).
1 2 3 4 5
Daily Frequently (2-5 times per week)
Occasionally (2-4 times per month)
Infrequently (once or twice
per year)
Never
Diagnostic assessment to determine core deficits. (10a)
Extra instruction and practice in the classroom with phonemic awareness. (10b)
Extra instruction and practice in the classroom with decoding. (10c)
Extra instruction and practice in the classroom with reading fluency. (10d)
Extra instruction and practice in the classroom with reading comprehension. (10e)
How often do your students who are struggling readers receive each of the following supports? (Check only one box for each statement).
1 2 3 4 5
Daily Frequently (2-5 times per week)
Occasionally (2-4 times per month)
Infrequently (once or twice
per year)
Never
Extra content area/subject-matter instructional time. (10f)
Use materials that supplement the core reading program. (10g)
Placement in different level of core reading program. (10h)
Placement in separate core reading program. (10i)
How often do your students who are struggling readers receive each of the following supports? (Check only one box for each statement).
1 2 3 4 5
Daily Frequently (2-5 times per week)
Occasionally (2-4 times per month)
Infrequently (once or twice per
year)
Never
Student(s) work one-to-one with a reading specialist. (10j)
Student(s) work in a small group with a reading specialist. (10k)
Student(s) work with more advanced peer(s). (10L)
Special materials are given to parents to provide practice. (10m)

11. Please indicate the extent to which you agree or disagree with each statement. (Check one box for each statement). 1 2 3 4
Strongly Agree
Agree Disagree Strongly Disagree
I have a good understanding of how children acquire language and literacy skills. (11a)
I know how to assess the progress of my students in reading. (11b)
12. How well prepared do you feel you are to teach each of the following dimensions of literacy? (Check one box for each statement).
1 2 3 4 5
Not at all prepared
Insufficiently prepared
Adequately prepared
Well prepared
Extremely well prepared
Phonemic awareness (12a)
Decoding (12b)
Vocabulary (12c)
Comprehension(12d) How well prepared do you feel you are to teach each of the following dimensions of literacy? (Check one box for each statement).
1 2 3 4 5
Not at all prepared
Insufficiently prepared
Adequately prepared
Well prepared
Extremely well prepared
Fluency building (12e)
Spelling (12f)
Writing (12g)
Handwriting (12h)
13. How well prepared do you feel to handle each of the following situations? (Check one box for each statement).
1 2 3 4 5
Not at all prepared
Insufficiently prepared
Adequately prepared
Well prepared
Extremely well
prepared
Help bring a struggling reader to grade level. (13a)
Help provide adequate challenge for students performing above grade level. (13b)
Diagnose the challenges faced by struggling readers. (13c)

14. Please indicate how often you have received these supports during this past academic year. (Check one box for each statement).
1 2 3 4 5
Daily Frequently (2-5 times per week)
Occasionally (2-4 times per month)
Infrequently (once or twice
per year)
Never
Received mentoring by a reading coach*. (14a)
Received help with diagnostic testing for individual students. (14b)
Received help in coordinating reading interventions for struggling readers. (14c)
Received help using assessment data to determine topics that require additional instruction or practice. (14d)
Please indicate how often you have received these supports during this past academic year. (Check one box for each statement).
1 2 3 4 5
Daily Frequently (2-5 times per week)
Occasionally (2-4 times per month)
Infrequently (once or twice
per year)
Never
Attended grade-level or subject-specific meetings in my school devoted to reading. (14e)
Accessed online videos, webinars or other online resources to enhance my teaching of reading. (14f)
Utilized new methods of teaching reading as a result of professional development this year. (14g)
*A reading coach is someone whose primary role is to provide ongoing training and support to classroom teachers in the delivery of effective reading instruction. This assistance may include planning instruction, providing demonstration lessons, observing and providing feedback, using assessment results to guide instruction, etc.

15. Did you take any University-based courses in the teaching of reading or writing in the past 12 months (including last summer)? (Check one box). Yes (15a 1) No (15a 2) 16. How many courses did you enroll in? ________ (16a) 17. Other than coursework, did you receive any other professional development in the teaching of reading or writing in the past 12 months (including last summer)? (Check one box). Yes (17a 1) No (17a 2) 18. How much time did you devote to this professional development in the past 12 months?
Number of days ________ (18a) Average hours per day ______(18b)
19. Have you heard of or received training in Evidence-Based Literacy Instruction (EBLI)? (Please check one box). Heard of EBLI (19a 1) Received training in EBLI (19a 2) Have not heard of or received training in EBLI (19a 3) 20. If you have any comments on your previous responses, please use the space below to share them. (20a) 21. Did you utilize the Evidence-Based Literacy Instruction Program when teaching students this year? (21a) Yes No 22. When did you attend the Evidence-Based Literacy Instruction 3-day training session? Summer 2014 (22a 1) Fall 2014 (22a 2) Winter 2015 (22a 3) Other ____________________ (22a 4) + 22TEXT

23. Please indicate your overall agreement with each of the following statements about the Evidence-Based Literacy Instruction 3-day training session.
1 2 3 4 5
Strongly agree
Agree No opinion
Disagree Strongly disagree
Questions or reservations I had regarding Evidence-Based Literacy Instruction were answered or addressed during the 3-day training session. (23a)
I received all necessary materials to implement Evidence-Based Literacy Instruction effectively upon completion of the training session. (23b)
After completing the training, I felt confident in my ability to teach my students using the Evidence-Based Literacy Instruction method. (23c)
24. Did you receive any additional Evidence-Based Literacy Instruction training after the initial 3-day training session? Yes (24a 1) No (24a 2) 25. Did you utilize the Evidence-Based Literacy Instruction Online Member's Area at any point throughout the year? Yes (25a 1) No (25a 2) 26. Please indicate your agreement with each of the following statements regarding the Evidence-Based Literacy Instruction Online Member's Area.
1 2 3 4 5
Strongly agree
Agree No opinion
Disagree Strongly disagree
Member's Area resources are easy to find and access. (26a)
Evidence-Based Literacy Instruction training prepared me to know how to use the system. (26b)
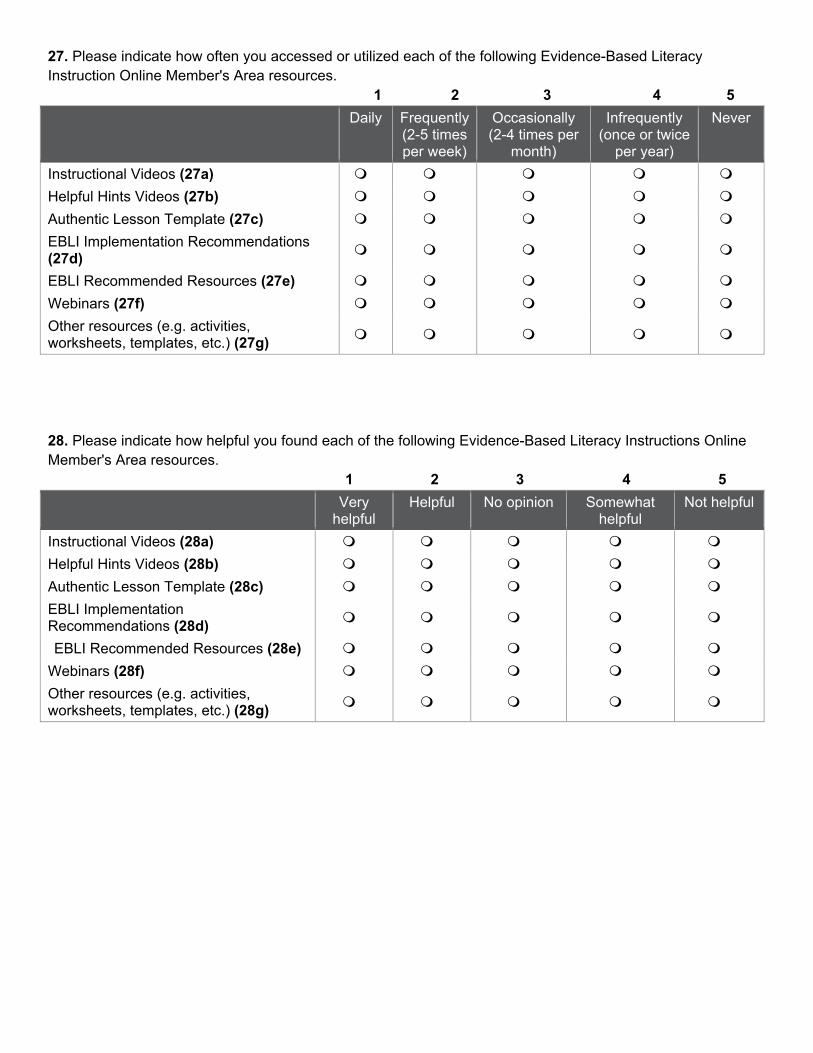
27. Please indicate how often you accessed or utilized each of the following Evidence-Based Literacy Instruction Online Member's Area resources.
1 2 3 4 5
Daily Frequently (2-5 times per week)
Occasionally (2-4 times per
month)
Infrequently (once or twice
per year)
Never
Instructional Videos (27a)
Helpful Hints Videos (27b)
Authentic Lesson Template (27c)
EBLI Implementation Recommendations (27d)
EBLI Recommended Resources (27e)
Webinars (27f)
Other resources (e.g. activities, worksheets, templates, etc.) (27g)
28. Please indicate how helpful you found each of the following Evidence-Based Literacy Instructions Online Member's Area resources. 1 2 3 4 5
Very helpful
Helpful No opinion Somewhat helpful
Not helpful
Instructional Videos (28a)
Helpful Hints Videos (28b)
Authentic Lesson Template (28c)
EBLI Implementation Recommendations (28d)
EBLI Recommended Resources (28e)
Webinars (28f)
Other resources (e.g. activities, worksheets, templates, etc.) (28g)

29. What kinds of resources were not available in the Member's Area, but would have been useful to you if they had been? (29a) 30. Did you receive sufficient support to implement the Evidence-Based Literacy Instruction program in your classroom this year? Yes (30a 1) No (30a 2) If not, please tell us what could have been improved. (30TEXT) 31. Do you feel that the Evidenced-Based Literacy Instruction program helped you to positively impact student reading or writing ability? Yes (31a 1) No (31a 2) Please describe the program's impact upon student reading or writing ability. (31b) Please indicate the basis for your comments (check all that apply). Direct observation in my classroom. (31c 1) Reading level assessments. Please enter name of assessment below. ____________________ (31c 2) +
(31d) Academic performance. Please enter name of assessment(s) below. ____________________ (31c3) +
(31d) Other ____________________ (31c 4) + (31d) 32. Do you feel that the Evidenced-Based Literacy Instruction program helped you to positively impact student behavior this year? Yes (32a 1) No (32a 2) Please describe the changes in student behavior. (32b)
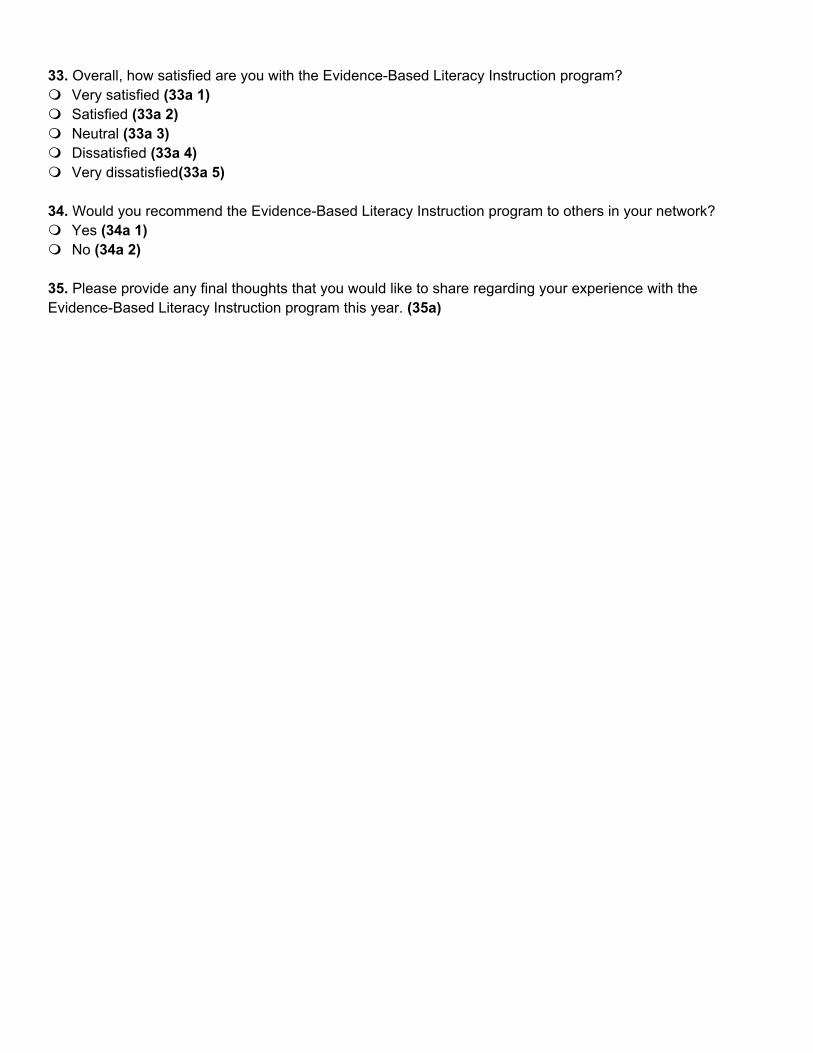
33. Overall, how satisfied are you with the Evidence-Based Literacy Instruction program? Very satisfied (33a 1) Satisfied (33a 2) Neutral (33a 3) Dissatisfied (33a 4) Very dissatisfied(33a 5) 34. Would you recommend the Evidence-Based Literacy Instruction program to others in your network? Yes (34a 1) No (34a 2) 35. Please provide any final thoughts that you would like to share regarding your experience with the Evidence-Based Literacy Instruction program this year. (35a)

Appendix B Each composite score is created by averaging the set of binary variables that indicate whether a teacher engages in certain activities at least weekly. Take the composite score for “Reading Text” as an example. This score comes from responses to the following 8 questions: 6a-e, 6g, 6i and 6j. For each question, a binary variable is coded as 1 if a teacher reports engaging in the activity at least weekly. Otherwise, the binary variable is coded with a value of 0. The composite score then is the average of the 8 binary variables. The remaining composite scores are constructed similarly, but vary in terms of the questions upon which each score is based. The composite score for “Working with Sounds and Words” is based on responses to 7a-c, 7e-i and 7k. The composite score for “Reading Materials” is based on responses to 8a, 8b, 8d, 8f, 8h and 8i. The composite score for “Writing Activities” is based on responses to 9b-9i. A similar rule is used to calculate the score for teachers’ engagement in a practice explicitly encouraged or discouraged by EBLI. By averaging the binary variables for question 6a, 6d, 6g, 6i, 6j, 7b, 7c, 7i, 9c-e and 9g-i, we obtain the composite score for “Teachers’ engagement in a practice encouraged by EBLI”. By averaging the binary variables for question 6b, 6c, 6e, 7e-h, 7k and 9f, we obtain the composite score for “Teachers’ engagement in a practice discouraged by EBLI”. The last two composite scores for “Encouraged (Discouraged) Practices” are generated from a different set of questions. The binary variables from responses to 6f, 6h, 6k, 7a, 8c, 8e and 8g are used to calculate the “Encouraged Practices” composite measure, and the binary variables from responses to 7d and 7j are used to calculate the “Discouraged Practices” composite measure.

Appendix C The following is an example of a visit that was assigned a score of “3”:
“XXX taught MS Spelling of the words mosquitoes and exaggerated like a champ! I shared that XXX can forego the clapping and just cue on the board. XXX moves very quickly; the students are fantastic and automatic with the EBLI process so easily move quickly with her! XXX taught EBLI Split Word Reading perfectly then taught read/read back small group. The process is pristine, with both teacher and students… This too is an amazing, model classroom for EBLI instruction!”
The following is an example of a visit that was assigned a score of “2”: “XXX is doing well with teaching EBLI though XXX does a lot of extra talking. XXX taught the vocabulary graphic organizer whole class then did read/read back small group… XXX is using blend and word family flash cards with her lower students (pl ane, sk ate). I encouraged XXX to do sound lines and have the students segment all the sounds. XXX was not open to that as she thinks those students are not capable. We did some refining with read/read back and XXX applied it immediately.”
The following is an example of a visit that was assigned a score of “1”:
“XXX is just going through the motions of EBLI. XXX says that XXX is doing so many ‘reading initiatives’ that XXX is confused herself. I am certain her students are confused too!! … it is very apparent the students are not at all familiar with the process of EBLI. They don’t say as they write, they are used to making syllable and sound lines independently (and incorrectly!) and making it ‘look like’ EBLI. We tried read/read back and the teacher stayed at the front and just gave the students the words when they paused or stumbled. There are so many problems with the instruction for this class that it seemed rather fruitless to try to fix all of them.”
Top Related