


Languages
Pages
Legal

Charts to WatchGlobal Market Update
November 17, 2014
Global Clients…Global Portfolios
disclosure: The opinions expressed in this Charts to Watch report are those of the author. The materials and commentary are strictly informational and should be used for research use only. This bulletin is not intended to provide investing or other advice or guidance with respect to the matters addressed in the bulletin. All relevant facts, including individual circumstances, need to be considered by the reader to arrive at investment conclusions that comply with matters addressed in this bulletin. Charts and information used in this report are sourced from Bloomberg.

Financial Conditions

5
Developed Markets – Month to Date

6
Emerging Markets – Month to Date

7
The VIX Index (S&P 500 Implied Volatility)
8
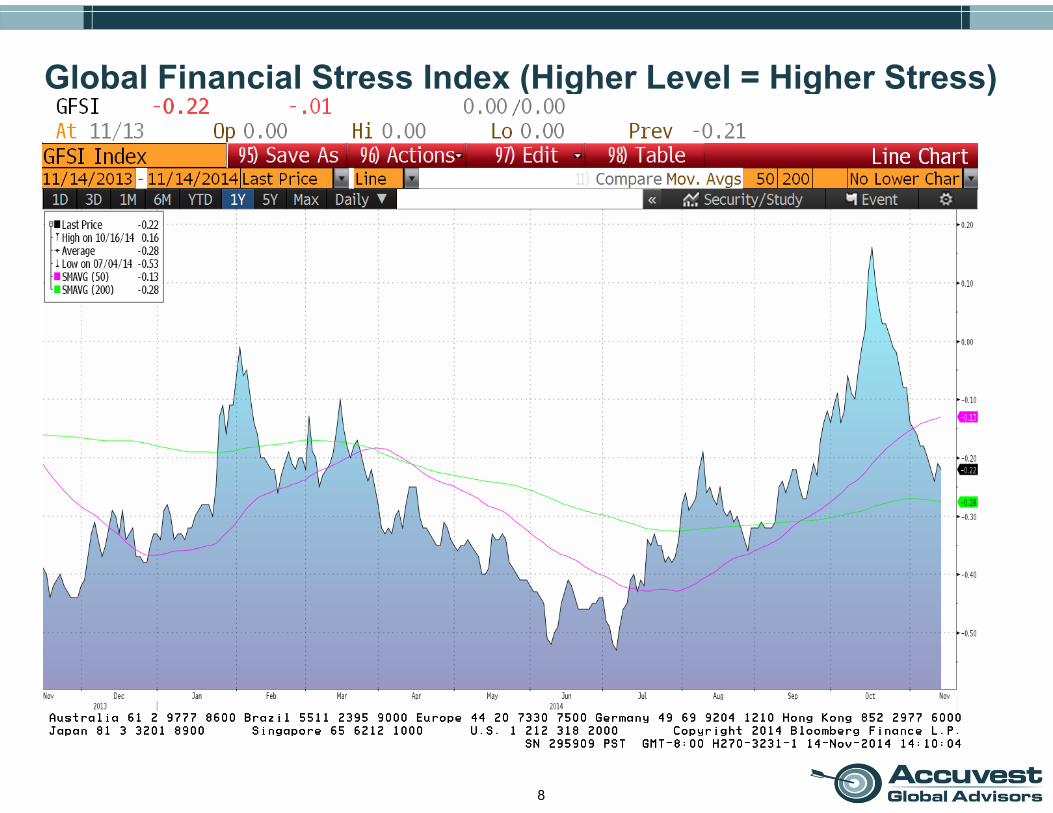
Global Financial Stress Index (Higher Level = Higher Stress)

9
High Yield Spreads vs. Global Financial Stress Index

Fixed Income & Credit
11
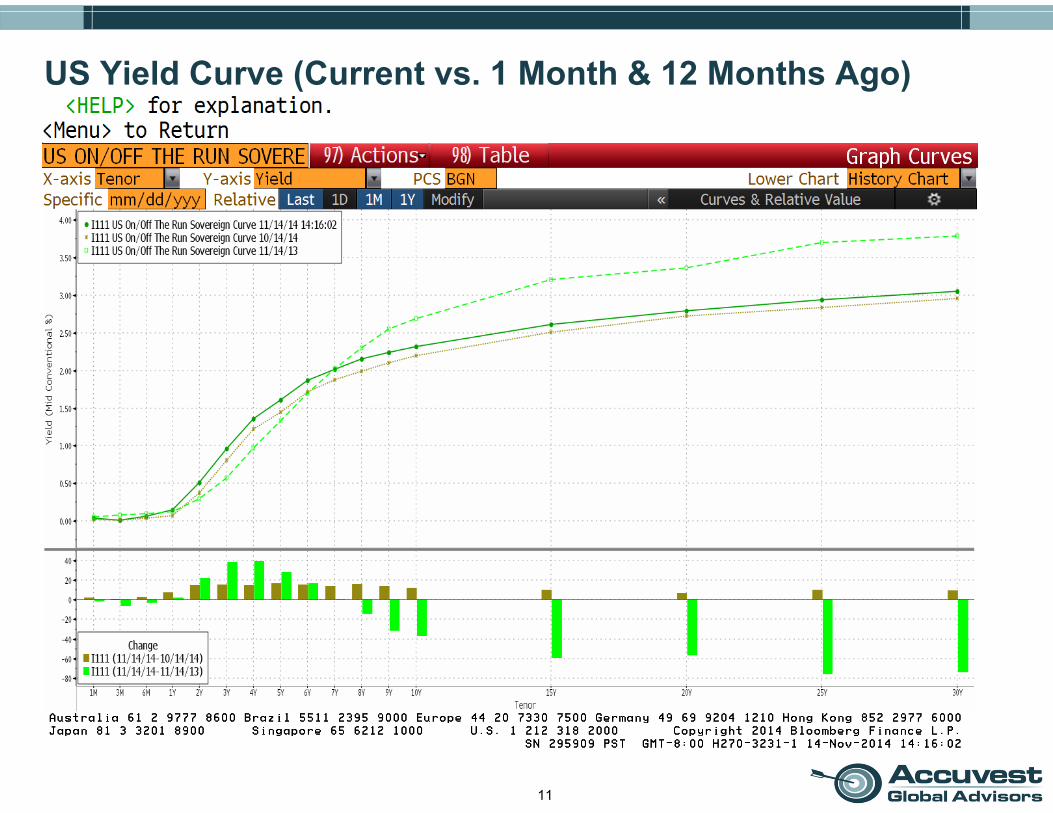
US Yield Curve (Current vs. 1 Month & 12 Months Ago)

12
UST Curve vs. US Investment Grade Curve
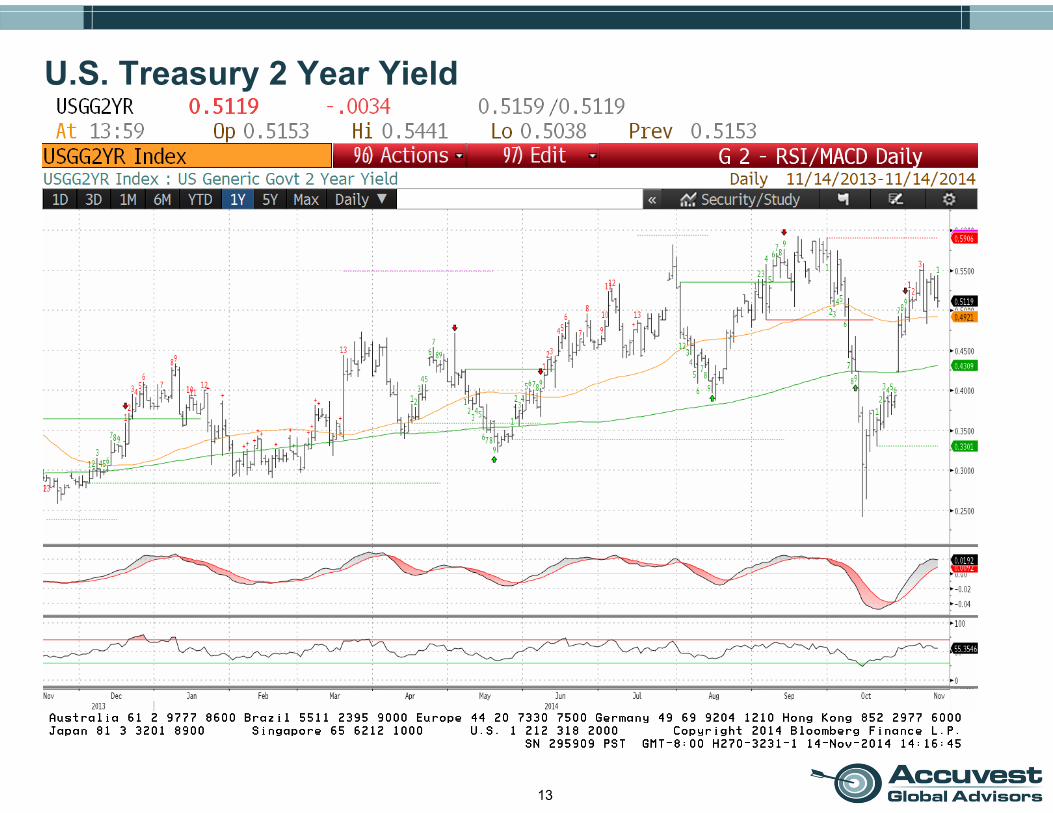
13
U.S. Treasury 2 Year Yield
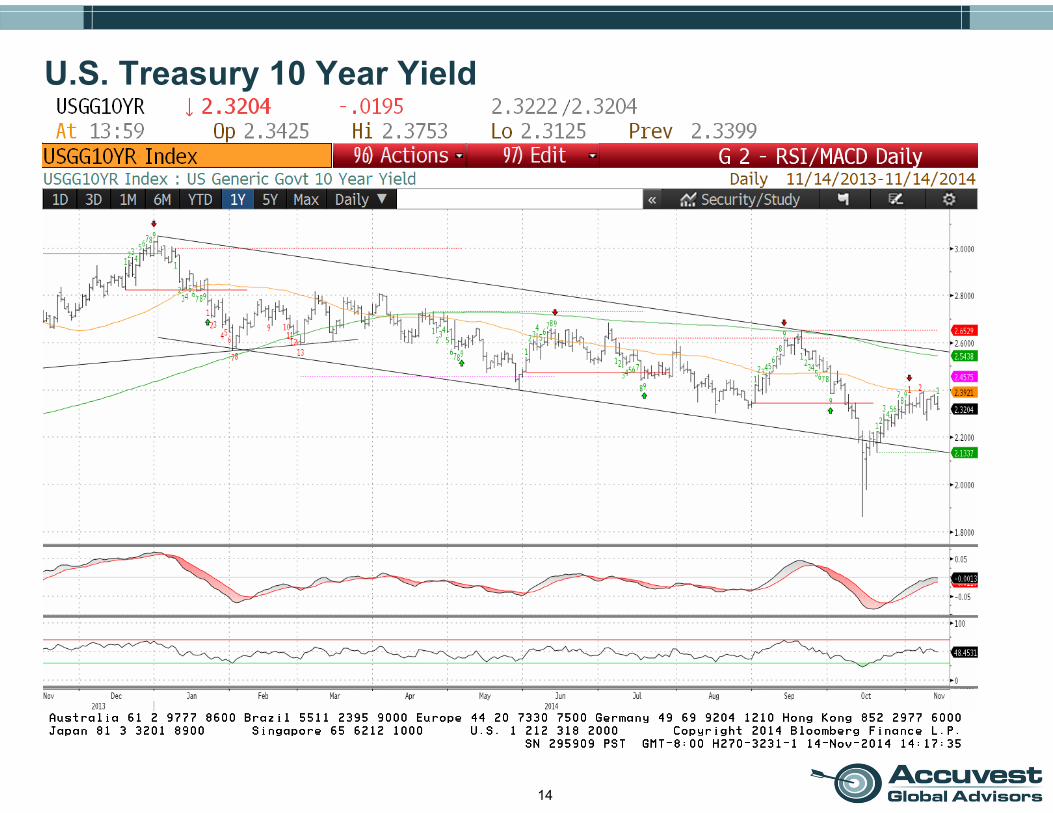
14
U.S. Treasury 10 Year Yield

15
U.S. Treasury 30 Year Yield

16
Fed’s 5 Year Forward Breakeven (Inflation Expectations)

17
Investment Grade Bond Prices
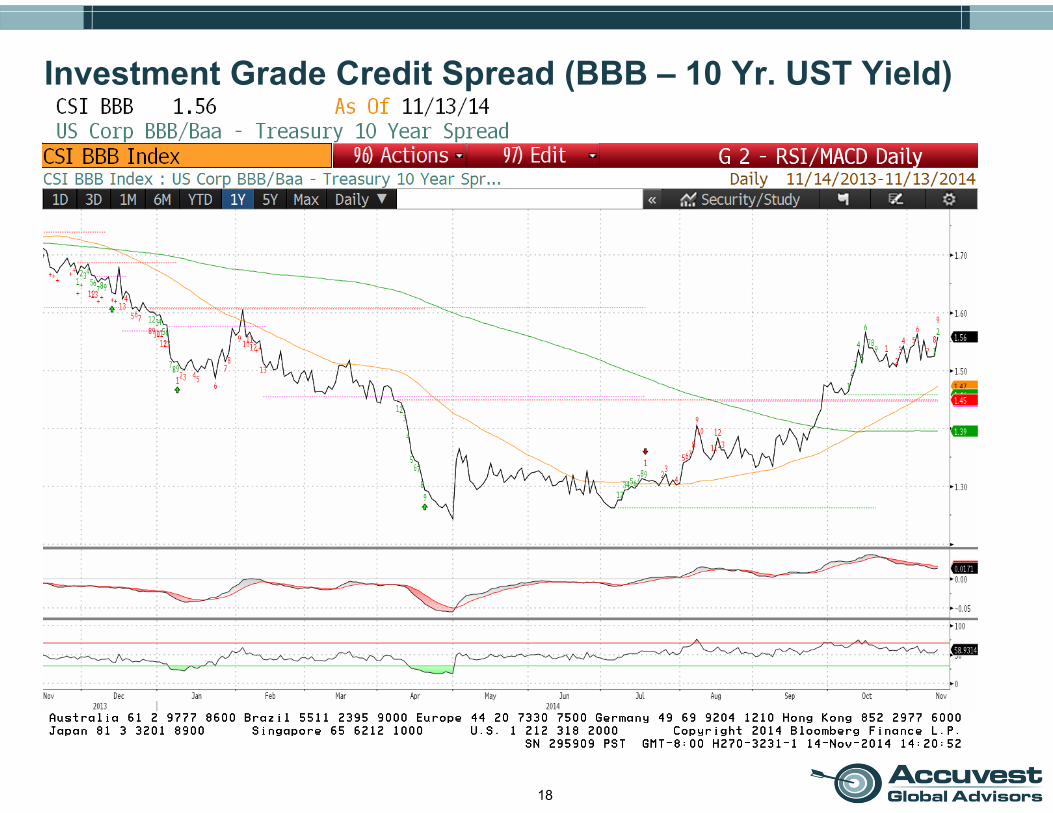
18
Investment Grade Credit Spread (BBB – 10 Yr. UST Yield)
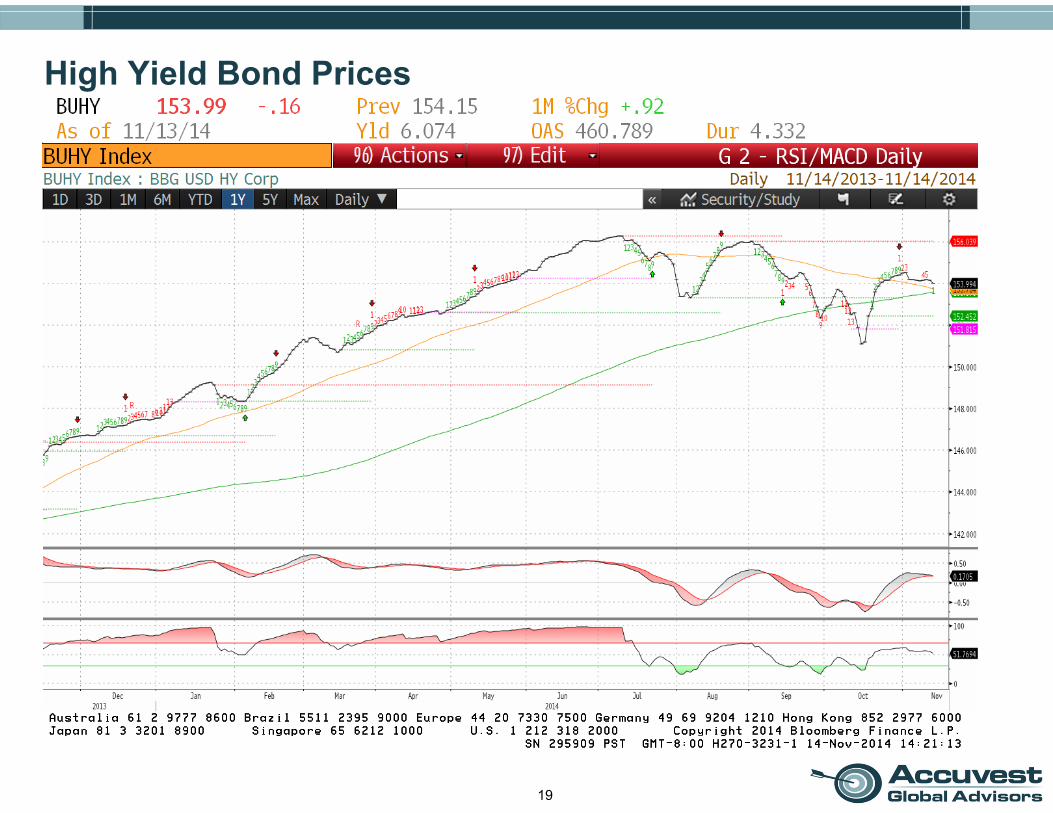
19
High Yield Bond Prices
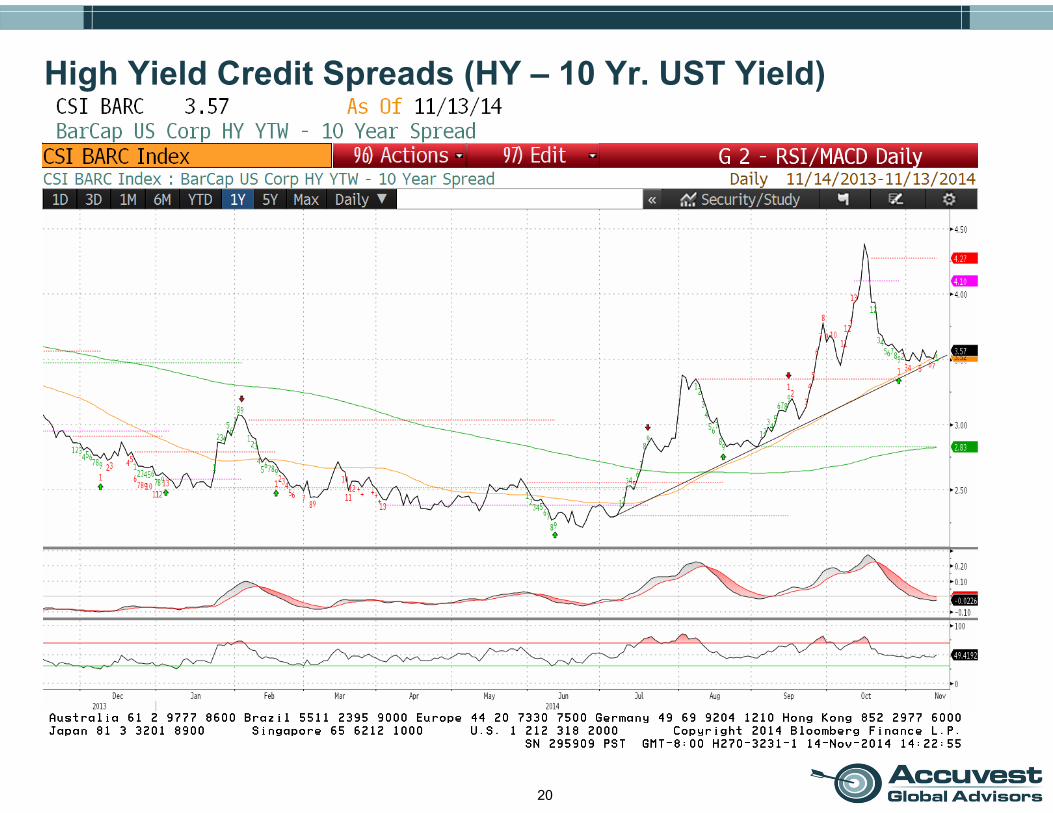
20
High Yield Credit Spreads (HY – 10 Yr. UST Yield)
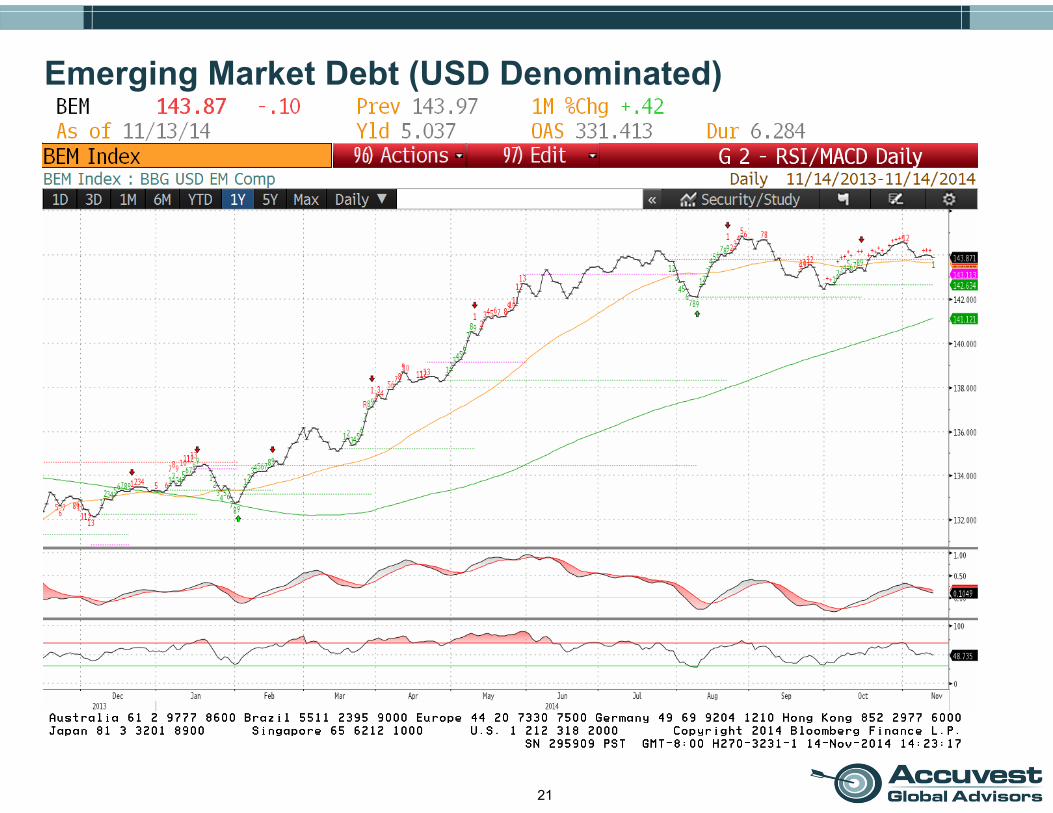
21
Emerging Market Debt (USD Denominated)

22
Emerging Market Bond Spreads

23
Relative Bond Spreads

Global Equities

25
MSCI All Country World Index - USD
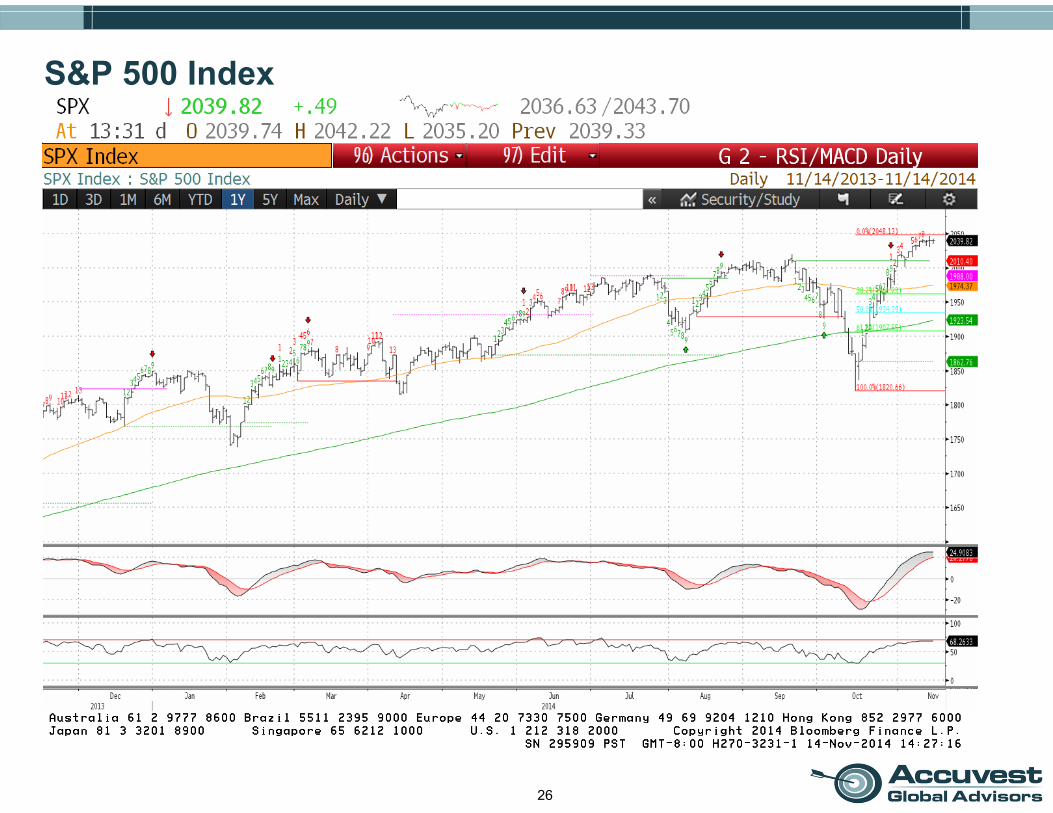
26
S&P 500 Index

27
MSCI EAFE (Europe, Australia, Far East) Index - USD

28
MSCI Emerging Markets Index - USD

29
SPX vs. EAFE vs. EM

30
Trend Analysis by Sector (S&P500)
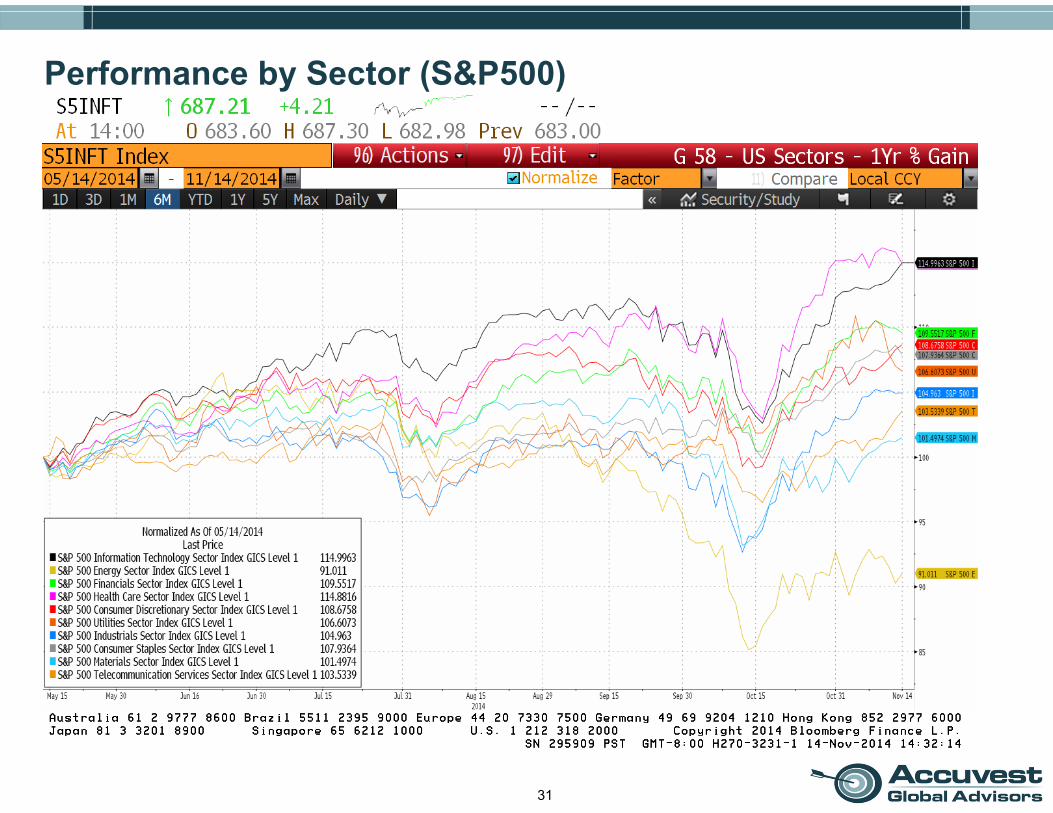
31
Performance by Sector (S&P500)

The Economy

33
Last week’s Economic Calendar
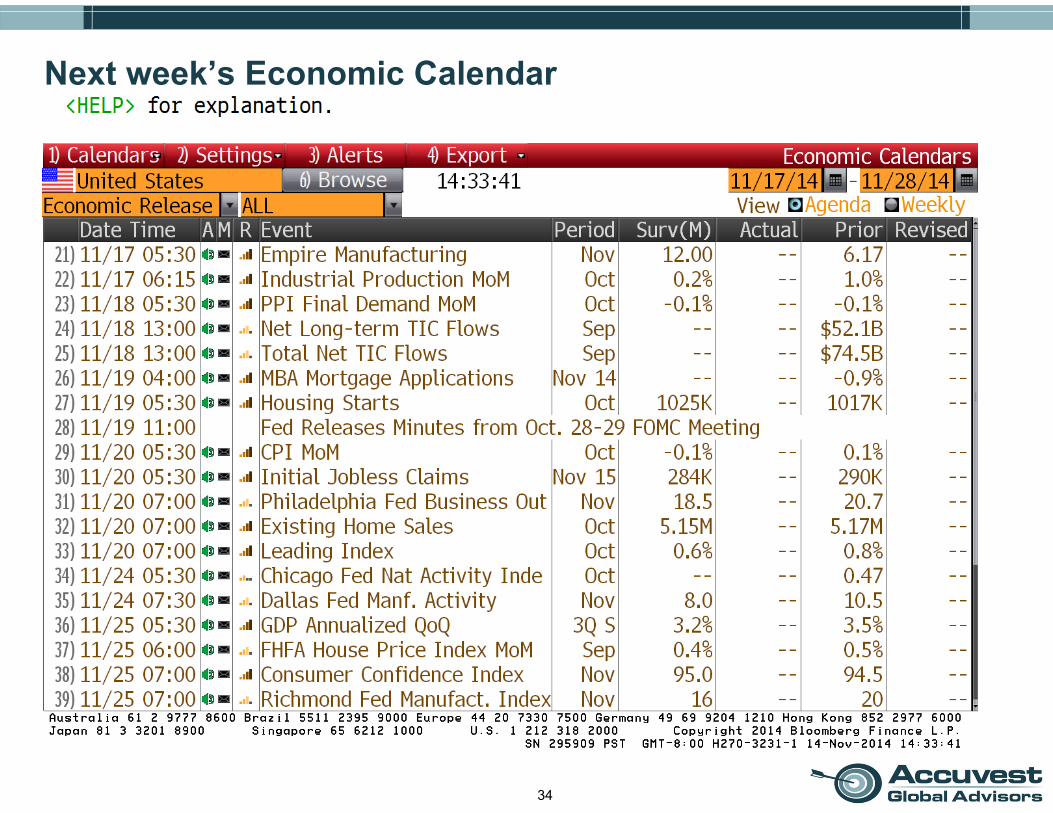
34
Next week’s Economic Calendar
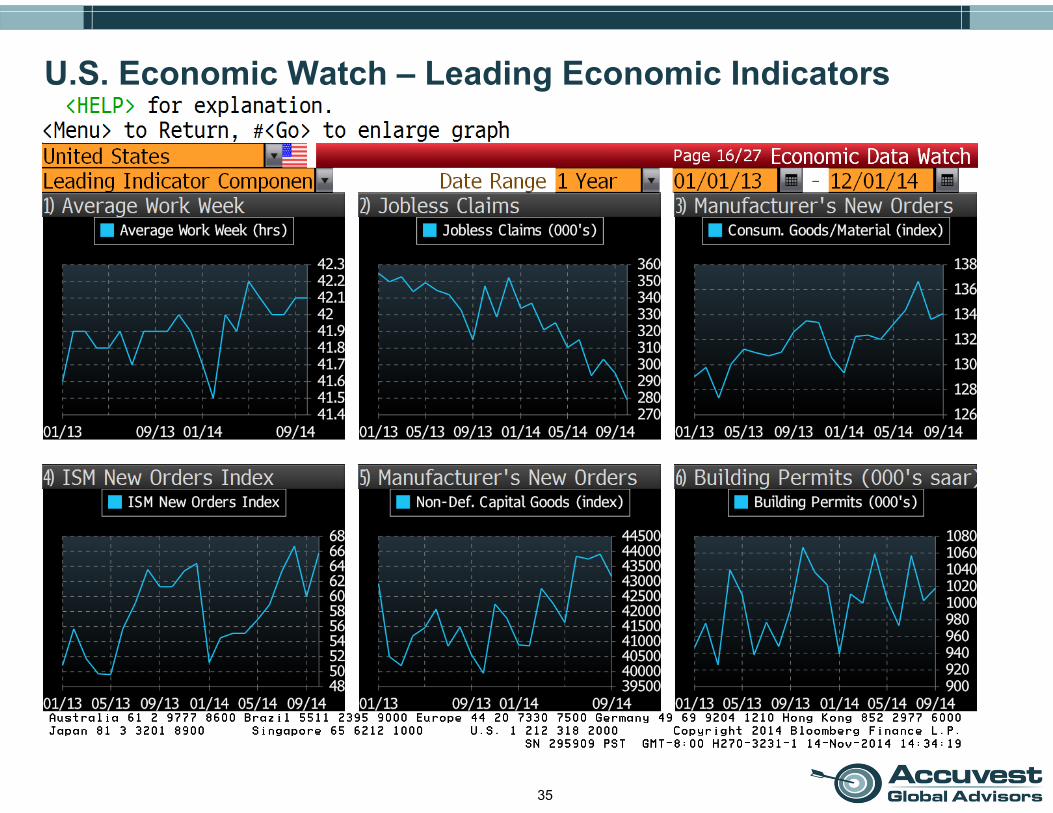
35
U.S. Economic Watch – Leading Economic Indicators
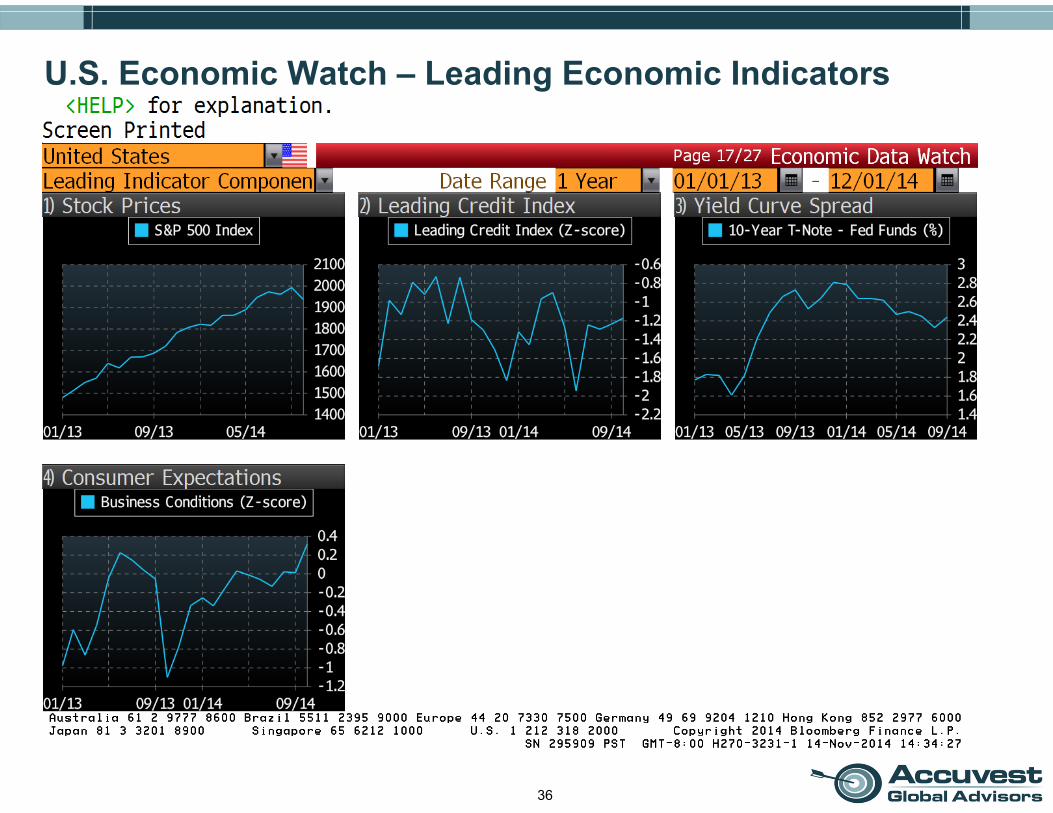
36
U.S. Economic Watch – Leading Economic Indicators
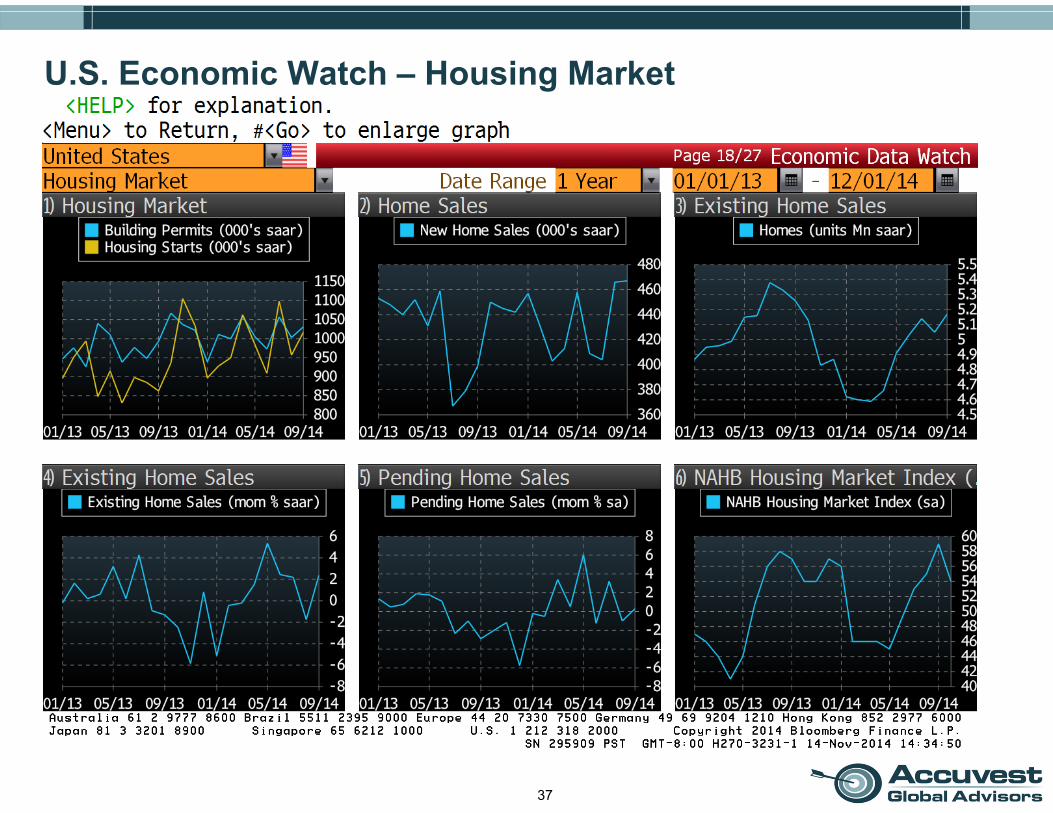
37
U.S. Economic Watch – Housing Market

38
U.S. Economic Watch – Housing Market
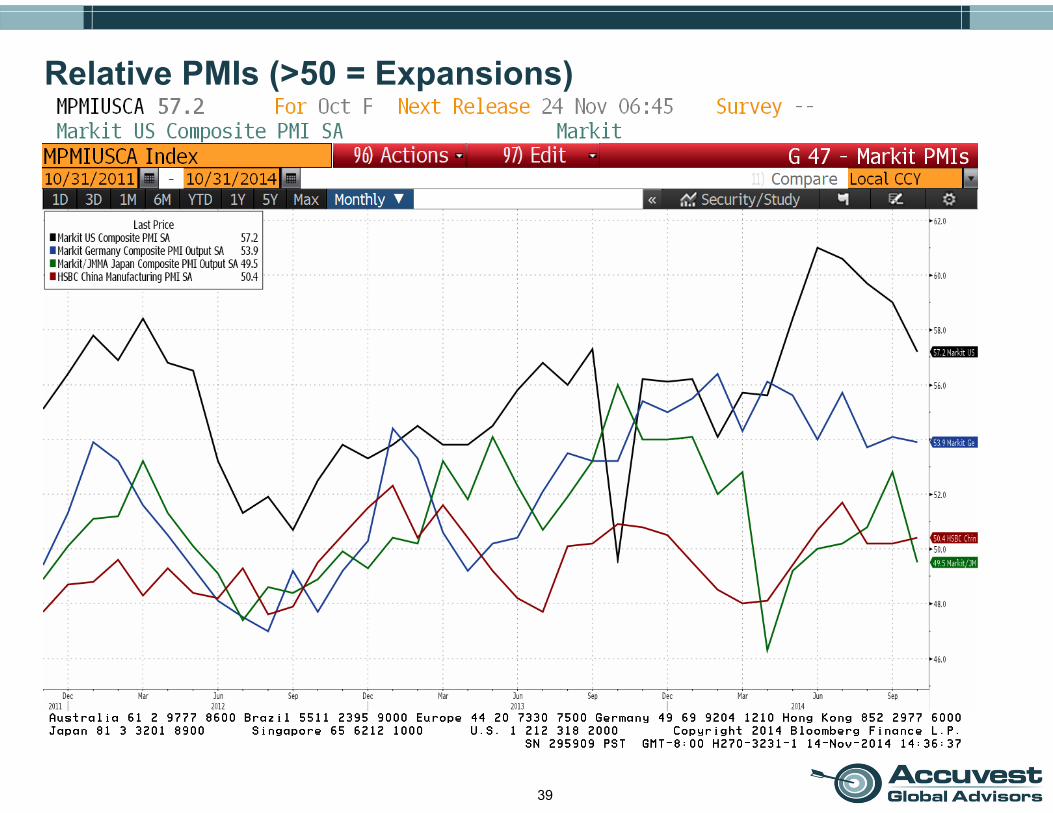
39
Relative PMIs (>50 = Expansions)

Currencies & Commodities

41
World Currencies vs. U.S. Dollar (6 Month Spot Returns)

42
World Currencies vs. U.S. Dollar (Spot Forecast: Q4 2014)

43
US Dollar $
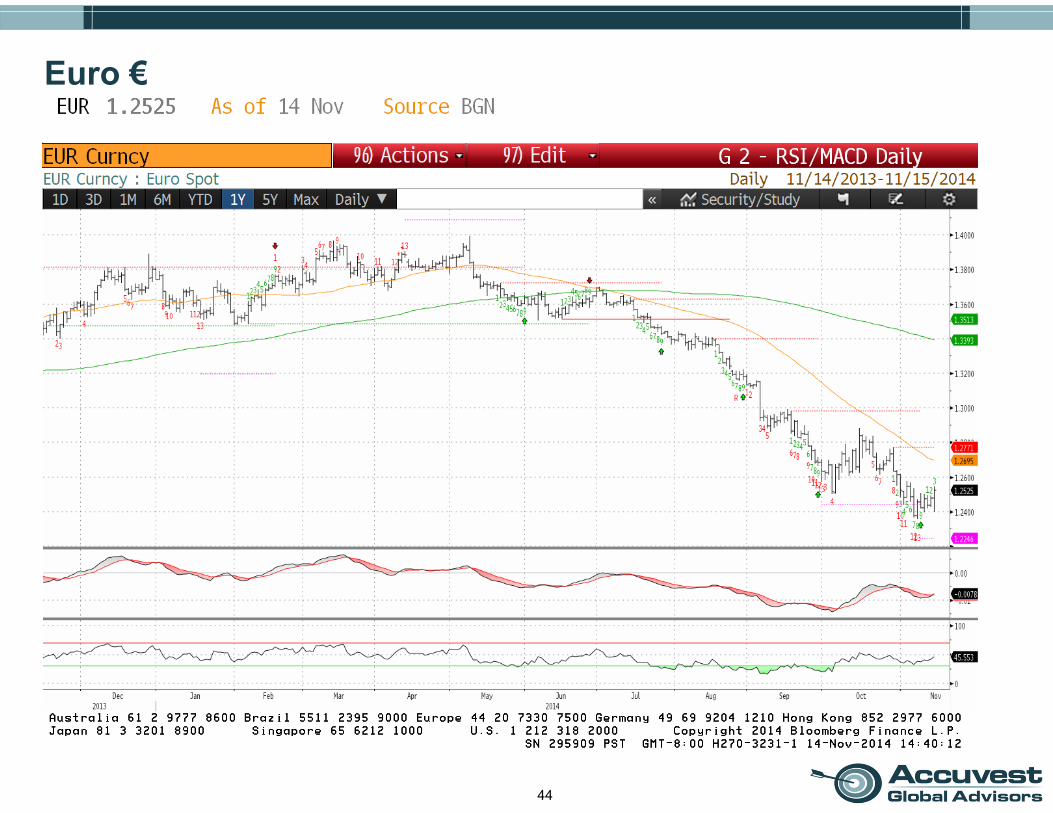
44
Euro €

45
Japanese Yen ¥
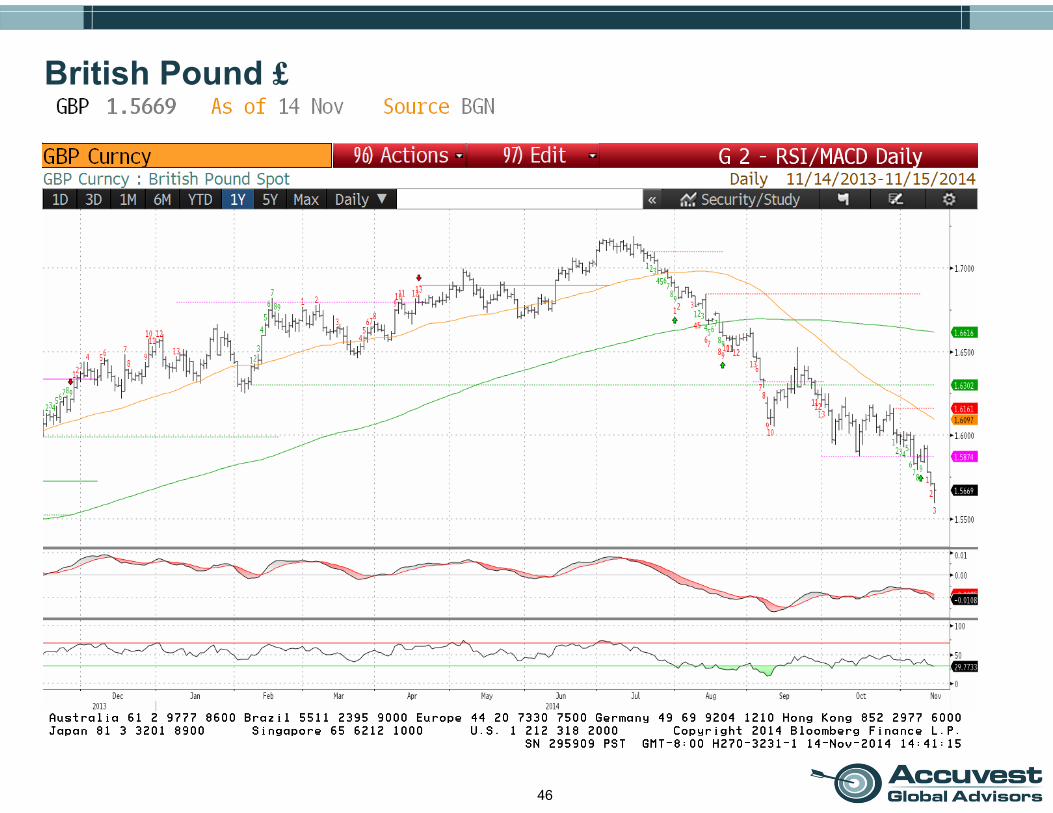
46
British Pound £

47
Mexican Peso

48
Global Commodity Prices

49
Continuous Commodity Index – 5 Years

50
Gold Prices – 5 Years
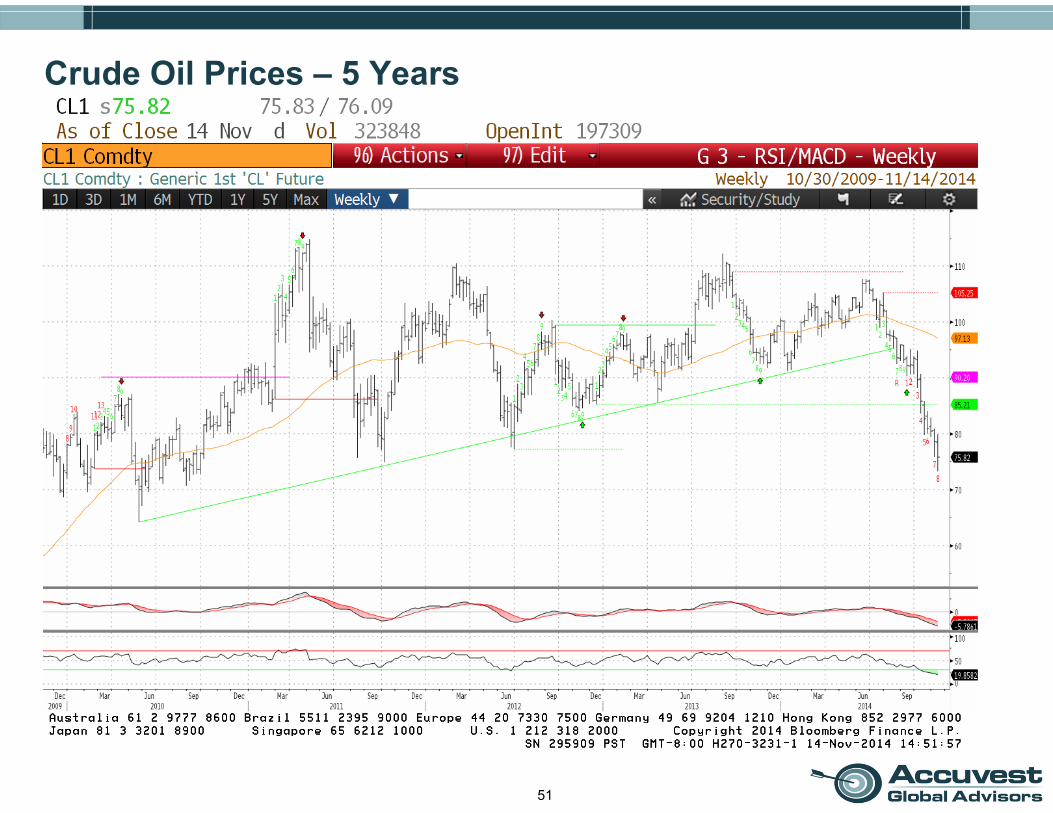
51
Crude Oil Prices – 5 Years

52
High Grade Copper – 5 Years
Top Related