


Languages
Pages
Legal


What is Six Sigma and how does it apply to
control materials?
2
Contents
Introduction . . . . . . . . . . . . . . . . . . . . . . . . . . . . . . . . . . . . . . . . . . . . . . . . . . . . . . . 3
What is Six Sigma and how does it apply to control materials? . . . . . . . . . . 4
Using IAMQC™ Peer to analyse your Sigma Metrics . . . . . . . . . . . . . . . . . . . . . 5
Summary . . . . . . . . . . . . . . . . . . . . . . . . . . . . . . . . . . . . . . . . . . . . . . . . . . . . . . . . . . 8
Reviewing Laboratory Quality Control frequency using Sigma Metrics . . . 9
Next Steps . . . . . . . . . . . . . . . . . . . . . . . . . . . . . . . . . . . . . . . . . . . . . . . . . . . . . . . . . 10
References . . . . . . . . . . . . . . . . . . . . . . . . . . . . . . . . . . . . . . . . . . . . . . . . . . . . . . . . 11
3
What challenge are we addressing in this report?
For decades, laboratories have been challenged with implementing standardised QC
processes and naturally have looked to some of the solutions that were seen as synonymous
with best practices for QC . However, given the latest generation of engineering, higher
precision methods, more automated instruments and the proliferation of new instruments,
new methods and new tests, many of the legacy solutions have quickly become outdated .
Now more than ever, there is a greater need for more advanced, more efficient QC
procedures .
What solutions do we propose?
Technopath and Westgard have combined forces, in a strategic partnership, to deliver
the most advanced QC solutions and educational services on the market . Combining
Technopath’s class-leading products with expert opinion and educational services from
Westgard will allow laboratories around the world to get access to the most up-to-date
information on advancements in quality control testing and analysis .
Technopath Clinical Diagnostics work in partnership with Westgard Inc .
to provide quality control training and education services to customers
around the world . Find our contact details at the end of this report .
Introduction
4
Six Sigma is a well-known quality management approach that uses multiple tools to achieve
the goal of reducing errors and defects in any process . Six Sigma began in companies like
General Electric and Motorola, but has spread to service sectors and even to healthcare
institutions and the clinical laboratory .
The central focus of Six Sigma is to measure the number of defects-per-million opportunities
(DPM, or DPMO) in any process . This DPM rate is then converted into a simple scale of 0
to 6, which is called the Sigma-metric of the process . Achieving Six Sigma on the short
term scale means that only 3 .4 defects are expected per million outcomes of the process .
To put it in laboratory terms, a Six Sigma test on that scale would only be expected to
produce about 4 defective results per million tests run . At the quality level of Six Sigma,
processes become highly efficient and effective, reducing the effort required to maintain
them and maximizing the reliability and profitability of that process .
On the other hand, a three Sigma process is expected to produce more than 67,000
defects per million outcomes . Outside of healthcare, a process that is below three Sigma
is often considered too costly and defect-prone to operate efficiently . In business and
manufacturing, a process below three Sigma would be identified as a target for radical
improvement, redesign or replacement . For analytical processes, the Sigma-metric is
calculated using data obtained from control materials . Imprecision from routine control
performance and Bias (Trueness) can be obtained by comparing the control mean of the
laboratory with the control mean of the peer group . Then a third variable is used, a quality
requirement in the form of an allowable Total Error (TEa), which represents the goal for
performance .
These three variables are arranged in the following equation to calculate the Sigma-metric:
Sigma-metric = (TEa – Bias) / CV
[all parameters expressed as %]
More detailed discussion of the Sigma-metric equation can be found in the literature and
reference manuals (1) .
What is Six Sigma and how does it apply to control materials?

5
IAMQC™ Peer now offers end-users the opportunity to automatically calculate and review
their sigma metric performance . The system will automatically calculate imprecision and
bias and once the end-user has defined their acceptability criteria (i .e Total Allowable
Error), the software will automatically calculate a sigma score for every assay that is
tested in the laboratory using the following calculation:
Sigma-metric = (TEa – Bias) / CV
[all parameters expressed as %]
Upon login the end-user selects SETUP>TOTAL ALLOWABLE ERROR:
Using IAMQC™ Peer to analyse your Sigma Metrics
6
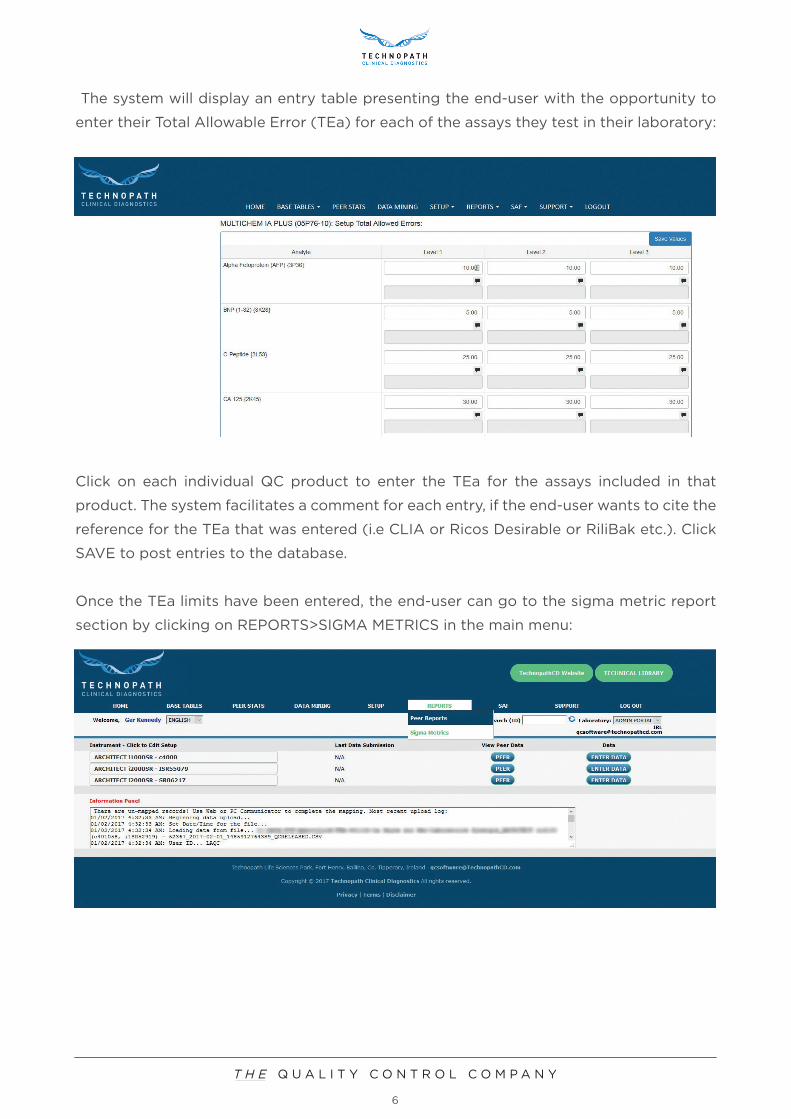
The system will display an entry table presenting the end-user with the opportunity to
enter their Total Allowable Error (TEa) for each of the assays they test in their laboratory:
Click on each individual QC product to enter the TEa for the assays included in that
product . The system facilitates a comment for each entry, if the end-user wants to cite the
reference for the TEa that was entered (i .e CLIA or Ricos Desirable or RiliBak etc .) . Click
SAVE to post entries to the database .
Once the TEa limits have been entered, the end-user can go to the sigma metric report
section by clicking on REPORTS>SIGMA METRICS in the main menu:

7
The system will display the Sigma Metric Report screen . Click on the product you would
like to review, followed by the lot number of interest, then click on the instrument of
interest or select ALL . Finally, click on the time period you wish to review:
The system will automatically calculate and display the sigma metric report for the criteria
selected:
This interactive report includes a normalised method decision chart (screen left)
displaying all assays for the criteria selected previously, a Sigma Metric summary table
(screen right) outlining the calculated sigma score for each assay and a detailed summary
table displaying further information on the statistics used for the calculation (NOTE: the
end-user must scroll down to review the detailed summary table – see the following
screen shot) . The end-user can click on an individual point on the normalised method
decision chart to view the information associated with that point .

8
The end-user can scroll down to review the following detailed summary table:
This table includes details on the individual instrument statistics for each assay, each level,
including; Mean, SD, CV, Peer Mean, % Bias from the peer mean, % TEa, Sigma Calculated
score, Given sigma score based on the calculation .
Summary
The Sigma Metric report in IAMQC Peer allows end-users to review an automatic calculation
of their sigma performance at any given time . This feature enables end-users to address
poor assay performance, adjust their QC protocol according to the sigma value (see next
section for more details) and continue to monitor their sigma performance on a regular
basis . End-users can work toward improvement of performance using sigma metric
trending .
9
In 2011 a collective opinion paper on findings of formal assembly of opinion leaders on
laboratory quality policies and procedures was published in Clinical Chemistry Laboratory
Medicine (2) .
The outcome of the discussions were that once an assay was assigned a Sigma score,
and based on this analysis and risk assessment, that a recommendation could be made
to outline recommended intervals for QC based on risk analysis . Assays could now be
divided into different performance categories with different QC requirements:
Six Sigma group performance indicators
• >6σ (excellent reliable assays) – evaluate with one QC per day (alternating levels
between days) and a 1:3 .5 s rule
• 4σ–6σ (suited for purpose assays) – evaluate with two levels of QC per day and the
1:2 .5 s rule .
• 3σ–4σ (poor performer assays) – use a combination of rules with two levels of QC
twice per day .
• <3σ (problematic assays) – maximum QC, three levels, three times a day . Consider
testing specimens in duplicate
Reviewing Laboratory Quality Control frequency using Sigma Metrics.

10
Technopath is happy to offer practical options to introduce more efficient and robust QC
procedures into the laboratory . Consolidated multi-analyte quality control materials, such
as the Multichem® range available from Technopath Clinical Diagnostics (Technopath),
enable clinical laboratories to significantly reduce handling requirements, reclaim storage
space and minimise waste, leading to a more efficient quality control process . Now in
addition multi-rules called ‘Westgard Sigma Rules’ are available to optimise the number
of rules and control measurements to take into account the analytical Sigma-metric of
the test method .
Whether you have questions about our products, services, or support, Technopath is here
to help . Choose from the options below . A Technopath representative will contact you .
IAMQC Software support: iamqcsupport@technopathcd .com
Sigma Verification Program services: info@technopathcd .com
Next Steps
11
1 . JO Westgard, Six Sigma Quality Design and Control, 2nd Edition . Westgard QC,
Madison WI 2006
2 . Cooper, et al . Collective opinion paper on findings of the 2010 convocation of experts
on laboratory Quality . Clinical Chemistry Laboratory Medicine . 2011; 49(5):793-802
References

www .technopathcd .com
info@technopathcd .com | Tel: +353 61 525700 | Fax: +353 61 203034
Technopath Life Sciences Park, Fort Henry, Ballina, Co . Tipperary, Ireland .
Top Related