


Languages
Pages
Legal


What Indonesia wants Analysis of Indonesias food demand to 2050 Caroline Gunning-Trant Yu Sheng Patrick Hamshere Trish Gleeson
and Brian Moir
Research by the Australian Bureau of Agricultural and Resource Economics and Sciences
Research report No 159 November 2015
copy Commonwealth of Australia 2015 Ownership of intellectual property rights Unless otherwise noted copyright (and any other intellectual property rights if any) in this publication is owned by the Commonwealth of Australia (referred to as the Commonwealth) Creative Commons licence All material in this publication is licensed under a Creative Commons Attribution 30 Australia Licence save for content supplied by third parties logos and the Commonwealth Coat of Arms
Creative Commons Attribution 30 Australia Licence is a standard form licence agreement that allows you to copy distribute transmit and adapt this publication provided you attribute the work A summary of the licence terms is available from creativecommonsorglicensesby30audeeden The full licence terms are available from creativecommonsorglicensesby30aulegalcode Cover photo Caitlin Murray Cataloguing data This publication (and any material sourced from it) should be attributed as Gunning-Trant C Sheng Y Hamshere P Gleeson T amp Moir B 2015 What Indonesia wants Analysis of Indonesias food demand to 2050 ABARES research report no 159 Canberra November CC BY 30 ISSN 978-1-74323-227-9 ISBN 1447-8358 ABARES project 43433 Internet What Indonesia wants Analysis of Indonesias food demand to 2050 is available at httpagriculturegovauabarespublications Australian Bureau of Agricultural and Resource Economics and Sciences (ABARES) Postal address GPO Box 858 Canberra ACT 2601 Switchboard +61 2 6272 3933 Email infoabaresagriculturegovau Web agriculturegovauabares Inquiries about the licence and any use of this document should be sent to copyrightagriculturegovau The Australian Government acting through the Department of Agriculture and Water Resources represented by the Australian Bureau of Agricultural and Resource Economics and Sciences has exercised due care and skill in preparing and compiling the information and data in this publication Notwithstanding the Department of Agriculture and Water Resources ABARES its employees and advisers disclaim all liability including for negligence and for any loss damage injury expense or cost incurred by any person as a result of accessing using or relying upon information or data in this publication to the maximum extent permitted by law Acknowledgements The authors thank Jammie Penm Sally Thorpe Matthew Hyde Dean Mansfield Matthew Miller and David Cui of ABARES for their insights and contributions to this report
iii
Foreword Indonesias role in South East Asia continues to strengthen with its rapid economic growth and increasing regional and global integration Indonesiarsquos economy differs significantly from Australias and there are likely to be major and mutual benefits from a deepening of the trade and investment relationship Australias agricultural sector is well poised geographically and strategically to benefit from Indonesias market potential The 2015 Agricultural Competitiveness White Paper demonstrates the Australian Governments commitment to strengthening the sector and to developing stronger relationships with overseas markets Australias engagement in the negotiations for the Regional Comprehensive Economic Partnership (RCEP) in which Indonesia is a party is a current example of that commitment These and future trade agreements will build enhanced opportunities for Australian agricultural exports
This report which is part of the What Asia wants series analyses future food consumption and trade trends in Indonesia over the long term Previous reports in this series are What Asia wants What China wants and What India wants
Karen Schneider Executive Director November 2015
iv
Contents Summary vi
1 Introduction 1
2 Drivers of food demand 2
Population 2
Incomes 4
Food consumption 5
3 Production constraints in Indonesian agriculture 9
Resource constraints 9
Productivity 14
4 Indonesian agricultural and food policies 17
Policies to support agricultural production 17
Policies to support consumers 19
Implications of agricultural and food policies 20
5 Simulation results 21
Baseline assumptions 21
Consumption 23
Production and trade 27
Lower-income growth scenario 29
6 Conclusion 31
References 33
Tables Table 1 Indonesia GDP growth 2009 to 2050 5
Table 2 International comparison of annual per person food consumption 2011 7
Table 3 Indonesian animal feed sources of primary ingredients 14
Table 4 Average annual food and non-food agricultural output and total factor productivity growth Indonesia 15
Table 5 Average annual yield growth of food and non-food cash crops Indonesia 16
Table 6 Average annual TFP growth rate by industry in Indonesia 2009 to 2050 22
Table 7 Indonesia GDP growth projections 2010 to 2050 29
v
Figures Figure S1 Agrifood consumption in Indonesia vi
Figure S2 Trade of selected agrifood commodities Indonesia vii
Figure 1 Indonesias population 2
Figure 2 Population distribution by age Indonesia 3
Figure 3 Urban and rural population Indonesia 4
Figure 4 GDP growth in Indonesia 4
Figure 5 Consumption of selected foods Indonesia 6
Figure 6 Total consumption of meats Indonesia 7
Figure 7 Expenditure on food items urban and rural residents 2013 Indonesia 8
Figure 8 Land use in Indonesia 10
Figure 9 Agriculture value added per farm worker Indonesia 12
Figure 10 Total fertilizer use in Indonesia by type 15
Figure 11 Average bound and applied tariffs by product groups 18
Figure 12 Raskin rice distribution and budgetary cost 20
Figure 13 Consumption of selected agricultural commodities Indonesia 23
Figure 14 Urban consumption of selected agricultural commodities Indonesia 25
Figure 15 Rural consumption of selected agricultural commodities Indonesia 26
Figure 16 Production of selected agricultural commodities Indonesia 27
Figure 17 Trade of selected agricultural commodities Indonesia 28
Figure 18 Import share of total consumption Indonesia 29
Figure 19 Agrifood consumption in 2050 under lower income growth assumption 30
Maps Map 1 Map of Indonesia 9
vi
Summary Indonesia has emerged as a growing and important market for Australian agricultural commodities In 2014 Australia was the second-largest exporter of agricultural products to Indonesia behind the United States supplying around US$26 billion of agricultural commodities
Over the next few decades sustained economic growth population increases and continued urbanisation are expected to change Indonesias demand for food Not only will total food consumption increase but diets are expected to become more diverse The value of agrifood consumption in Indonesia is projected to quadruple between 2009 and 2050
At the same time the Indonesian agrifood sector faces challenges to increase its production and productivity growth The Indonesian Governments commitment to agricultural investment will be required to mitigate or overcome the persistent challenges of a limited land supply an agricultural sector characterised by smallholdings a deteriorating resource base and ongoing competition between production of cash crops and food crops
The rise in the real value of food consumption in Indonesia will be characterised by a move to more diverse diets with higher intake of meat dairy products fruit and vegetables Between 2009 and 2050 the real value of beef consumption is projected to rise more than 14 times dairy ten times and fruit and vegetables three times (Figure S1) These increases are driven mainly by greater quantities demanded
Figure S1 Agrifood consumption in Indonesia
Note Starchy staples include pulses potatoes yams and cassava Source ABARES model output
For many commodities the value of consumption in 2050 is projected to rise from a very low base Average per person consumption is currently low because of high rates of poverty For example on a per person basis Indonesian consumption of meat in 2009 was between 70 per cent and 80 per cent less than that of Japan the Republic of Korea China and many other ASEAN
10 20 30 40 50 60
Wheat
Sheep and goat meat
Dairy
Sugar
Oil crops
Rice
Vegetables
Starchy staples
Beef
Poultry
Fruit
2050
2009
Billion(2009 US$)
552
66
231
1311
269
1319
256
246
935
1340
113
vii
nations As per person income rises there is significant potential for food consumption to increase in Indonesia
The upward trend in agrifood demand is most pronounced among urban households because of expected higher income growth and continued urbanisation to 2050 In rural households a declining rural population and relatively lower incomes will result in slower food consumption growth than urban households
The real value of Indonesias agrifood production is projected to more than double from US$81 billion in 2009 to almost US$173 billion in 2050 (in 2009 US dollars) This increase is driven by projected higher production of beef (up 209 per cent) poultry (187 per cent) starchy staples (115 per cent) vegetables (92 per cent) fruit (78 per cent) and rice and palm oil (up 77 per cent each)
Indonesia has a comparative advantage in the production of non-food cash crops such as natural rubber copra palm kernels coffee cocoa and spices In Indonesia the production of these cash crops competes with food crops for resources despite Indonesias policies that support food production and food self-sufficiency The production of non-food cash crops is also likely to increase over the projection period although modelling of these crops is outside the scope of this analysis
Under the assumption of no major policy changes to 2050 food imports are projected to be an increasingly important component of Indonesias food supply towards 2050 The real value of agrifood imports is projected to rise more than 20 times from 2009 to US$152 billion (in 2009 US dollars) in 2050 In 2050 imports of beef are projected to reach US$26 billion (in 2009 US dollars) compared with US$05 billion in 2009 (Figure S2) Imports of dairy products are projected to be US$7 billion in 2050 compared with US$04 billion in 2009 For fruit and vegetables the value of imports is expected to increase by almost US$25 billion and US$11 billion (in 2009 US dollars) respectively between 2009 and 2050
Figure S2 Trade of selected agrifood commodities Indonesia
Source ABARES model output
-30 -20 -10 0 10 20 30
Wheat
Sheep and goat meat
Dairy
Sugar
Rice
Beef
Starchy staples
Vegetables
Fruit
2050
2009
Billion (2009 US$)
Exports Imports
Palm oil
viii
Because of their geographic proximity Australia and Indonesia are well placed to benefit from advancing bilateral agricultural trade Indonesia is already an important market for Australian wheat sugar live cattle beef skim milk powder and horticultural products such as grapes and citrus Stronger projected demand for these commodities and others in Indonesia will create further opportunities for Australian exporters
1
1 Introduction World demand for agrifood products is expected to increase significantly over the period to 2050 with the real value of Asian agrifood demand expected to double (Linehan et al 2012a) The rise in the global population per person incomes and rates of urbanisation especially in developing countries are driving this increase In Indonesia projected strong population and economic growth over the coming decades are expected to result in a marked increase in total food consumption
Indonesia is becoming an increasingly important export destination for many Australian agricultural commodities In 2014 Australia was the second-largest exporter of agricultural products to Indonesia behind the United States Australia supplied around US$26 billion of agricultural commodities (excluding tobacco and its products) compared with US$680 million in 2000 (in 2014 US dollars)
The objective in this report the fourth in the What Asia wants series is to build upon existing ABARES analysis of global food consumption and production by examining the factors likely to influence the future pattern of Indonesias food consumption with particular attention to household consumption trends across urban and rural consumers
For this analysis an updated version of the ABARES agrifood model (Linehan et al 2012b) was developed The model is a partial equilibrium economic model of global agricultural production consumption and trade with a base year of 2009 The agrifood products in the model include both primary and lightly transformed agricultural products such as flour and meat Uses of agrifood products include direct food use feed use and industrial use Highly processed food items such as beverages and packaged foods are not included nor are non-food agricultural commodities and cash crops such as natural rubber copra palm kernels coffee cocoa and spices In this report Indonesias targeted consumer subsidy for rice Raskin is built into the model baseline
Chapter 2 of this report examines the factors expected to influence Indonesias food demand trends to 2050 and presents the income and population assumptions used in the analysis Chapter 3 discusses some of the production constraints and challenges with which Indonesia will have to contend over the longer term in order to increase its agricultural output Chapter 4 briefly outlines Indonesias principal agricultural policies supporting food security Chapter 5 discusses projected consumption production and trade trends to 2050 in a business-as-usual policy environment as well as in a lower economic growth scenario Chapter 6 summarises the main findings of the analysis
2
2 Drivers of food demand Food consumption at the national level relates to the size of the population and the amount of food consumed by each person Changes in per person food consumption as well as in the mix of foods consumed are largely influenced by growth in household incomes and by factors such as the age structure of the population lifestyle and the proportion of the population living in urban and rural areas This chapter discusses the contribution of these factors to the expected increase in Indonesian food demand to 2050
Population Indonesias population grew from just over 180 million in 1990 to more than 257 million in 2015 an average growth rate of 14 per cent a year (Figure 1) Under the medium-variant projection of the United Nations the population is expected to grow by an average of 06 per cent a year between 2010 and 2050 (United Nations Population Division 2015) At this rate the population would grow by some 65 million to reach 322 million in 2050
Figure 1 Indonesias population
Source World population prospects the 2015 revision United Nations Population Division (United Nations Population Division 2015)
Indonesias population growth during much of the past half century was partly the result of a significant decline in mortality rates Between 1950ndash55 and 2005ndash10 Indonesias crude death rate declined from 21 per 1 000 people to 7 per 1 000 people Between 1950ndash55 and 1970 the crude birth rate was high above 40 births per 1 000 people However it began to decline in about 1970 reaching 21 births per 1 000 people by 2005ndash10
The declining birth and death rates in the four decades to 2010 resulted in a significant shift in the age distribution of the population (Figure 2) In 1970 67 per cent of the population was aged under 30 by 2010 this group constituted 55 per cent of the population By 2050 it is projected to be only 41 per cent Conversely the proportion of the over-50s in the population was 11 per cent in 1970 and 16 per cent in 2010 and is projected to increase to 31 per cent by 2050
Million
50
100
150
200
250
300
350
400
1990 2000 2010 2020 2030 2040 2050
Estimates to 2015
Medium
High
Low
3
Compared with other Asian countries Indonesias population is relatively young (Elias amp Noone 2011) The proportion of people of working age (15 to 64) in the population is forecast to remain above 65 per cent beyond 2045 (United Nations Population Division 2015) and the absolute number of people of working age is also expected to continue to increase
Figure 2 Population distribution by age Indonesia
Source World population prospects the 2015 revision United Nations Population Division (United Nations Population Division 2015)
The changing age structure is likely to have an effect on patterns of food demand Nutritional requirements increase as children age to maturity and decline as adults age Older people generally consume less food and typically prefer more traditional foods
Urbanisation is an important determinant of consumer demand for food Urban dwellers typically have higher incomes than their rural counterparts and different dietary and shopping patterns Over the four decades from 1970 to 2010 Indonesias urban population expanded by an average of 45 per cent a year (Figure 3) The rural population grew more slowly than the urban population reaching a peak in 1995 Since 2010 the total number of urban residents has exceeded rural residents
Jakarta is by far Indonesias largest city with a population of just over 10 million (United Nations Population Division 2014) Jakarta has four times the population of the second-largest city Surabaya However most other cities are growing at faster rates than Jakarta In 2050 71 per cent of Indonesias population is projected to live in urban areas compared with 54 per cent in 2015 (United Nations Population Division 2014)
Million 10 20 30
0-4
10-14
20-24
30-34
40-44
50-54
60-64
70-74
80+
Age
grou
p
1970
Million 10 20 30
2010
Million 10 20 30
2050
4
Figure 3 Urban and rural population Indonesia
Source World urbanisation prospects the 2014 revision United Nations Population Division (United Nations Population Division 2014)
Incomes The Indonesian economy has grown consistently over the past two decades apart from the Asian financial crisis of 1998 (Figure 4) Indonesian GDP in constant prices almost tripled between 1990 and 2012 (IMF 2015) Average incomes per person in constant prices doubled over the same period
Figure 4 GDP growth in Indonesia
Source World Economic Outlook Database International Monetary Fund (IMF 2015)
10
20
30
40
50
60
70
80
90
Million
50
100
150
200
250
300
350
1970 1980 1990 2000 2010 2020 2030 2040 2050
Rural
Urban
Share of rural population (right axis)
-10
-5
0
5
10
1990 1995 2000 2005 2010
5
Indonesias economic growth has not been shared equally across the population Although the middle class (defined as those with daily expenditure of between US$2 and US$20 in 2005 purchasing power parity terms) expanded from around 25 per cent of the population in 2000 to 57 per cent in 2010 income inequality has increased (Afif 2014 Indonesian Central Bureau of Statistics 2015a) Income growth and income inequality both have important implications for food consumption The expansion of the middle class has been a significant factor behind the increase in Indonesias total food consumption However the rise in inequality implies there remains a considerable proportion of the population with low incomes and limited capacity to buy food
In the baseline projections presented in this report Indonesian GDP is assumed to grow according to OECD (2012a) projections (Table 1) Between 2011 and 2030 real GDP growth is assumed to increase at an average of 53 per cent a year before weakening between 2030 and 2050 to average 34 per cent a year Urban incomes are assumed to continue to grow faster than rural incomes over the period to 2050 averaging 56 per cent and 21 per cent a year respectively An alternative scenario of lower economic growth is also examined based on World Bank (2015) projections (see Chapter 5 Table 7)
Table 1 Indonesia GDP growth 2009 to 2050
1991-2010 2011-2020 2021-30 2031-40 2041-50
Average annual growth ()
44 53 53 34 34
Source Looking to 2060 A global vision of long-term growth Economics Department Policy Notes no 15 Organisation for Economic Co-operation and Development (OECD 2012a)
Food consumption Total food consumption in Indonesia has increased in response to rising incomes and population Between 1990 and 2013 total consumption of wheat fruit and milk each increased by more than 200 per cent (Figure 5) Consumption of vegetables more than doubled over the same period and meat consumption almost doubled Consumption of ricemdasha staple food in Indonesian dietsmdashincreased by only 32 per cent
6
Figure 5 Consumption of selected foods Indonesia
Source FAOSTAT Food and Agriculture Organization of the United Nations (FAO 2015)
Between 1990 and 2013 the average calorie intake per person in Indonesia increased by 19 per cent The contribution of starchy roots and pulses to individuals calorie intake declined while the contribution of fruit and vegetables meat and fish increased Average per person consumption of milk and other dairy products more than doubled but remained of limited significance
Poultry is the major source of meat in Indonesia accounting for over half the total meat consumed in 2013 (Figure 6) Pig meat constituted almost a quarter of total meat consumption in 2013 consumed by non-Muslim people Consumption of beef which ranks third has been increasing more slowly than chicken meat consumption because it is relatively more expensive (FAO 2015) Sheep and goat meat accounted for less than 5 per cent of total meat consumption
Million tonnes
5
10
15
20
25
30
35
40
1990 1992 1994 1996 1998 2000 2002 2004 2006 2008 2010 2012
Rice (milled equivalent)
Fruit
Vegetables
Wheat
Meat
Milk (excluding butter)
7
Figure 6 Total consumption of meats Indonesia
Source FAOSTAT Food and Agriculture Organization of the United Nations (FAO 2015)
On a per person basis Indonesias consumption of many food groups is relatively low This is because a high portion of its population lives at or near the poverty line Per person consumption of meat in 2011 was between 70 per cent and 80 per cent less than that of Japan the Republic of Korea China and many other ASEAN nations (Table 2) For dairy it was around 80 per cent less than that of Japan 56 per cent less than China 47 per cent less than the Republic of Korea and lower than other ASEAN countries For fruit and vegetables it was between 30 per cent and 65 per cent less than that of Japan and the Republic of Korea 74 per cent less than China and lower than other ASEAN countries These relatively low per person consumption levels underline the potential for sizable increases in per person food consumption as incomes rise
Table 2 International comparison of annual per person food consumption 2011
Country Meats kg
Dairy kg
Fruit and vegetables kg
Cereals kg
Japan 488 713 1524 1044
Republic of Korea 622 264 2888 1515
China 577 315 4178 1515
Malaysia 533 322 1131 1466
Philippines 345 145 1796 1577
Vietnam 576 151 1445 1670
Indonesia 129 139 1075 1906 Source FAOSTAT Food and Agriculture Organization of the United Nations (FAO 2015)
Diets of urban residents are usually different from their rural counterparts In 2013 Indonesias urban residents spent an average of 414 000 rupiah a month on food compared with 299 000 rupiah by rural residents (Indonesian Central Bureau of Statistics 2015b) Urban residents spent more than rural residents on meat fish eggs fruit and prepared (cooked and packaged) foods Rural residents spent more on cereals and tubers (Figure 7) with 24 per cent of their food budget devoted to cereals alone compared with only 15 per cent for urban residents
000 tonnes
200
400
600
800
1000
1200
1400
1600
1800
2000
1990 1992 1994 1996 1998 2000 2002 2004 2006 2008 2010 2012
Poultry meat
Pig meat
Bovine meat
Sheep and goat meat
8
Figure 7 Expenditure on food items urban and rural residents 2013 Indonesia
Source Indonesian Central Bureau of Statistics 2015b
Food marketing in Indonesia is also changing In the 1980s supermarkets occupied only a small niche in food retailing By the mid-1990s they were still confined to the urban upper income sector Supermarkets only began to spread quickly in Indonesia after 1998 By 2007 they accounted for about 30 per cent of overall retail food expenditure (World Bank 2007)
The development of supermarkets is typically associated with closer vertical coordination along value chains as the supermarkets maintain close relationships with their suppliers This often involves contractual arrangements with farmers or in the case of food imports with suppliers in other countries Asian supermarket chains have developed direct relationships with suppliers of fresh horticultural and dairy produce in the United States New Zealand and Australia (Glover 2011)
000 rupiah
20
40
60
80
100
120
140
Cere
als
Tube
rs
Fish
Mea
t
Eggs
and
milk
Vege
tabl
es
Legu
mes
Frui
ts
Oil
and
fats
Beve
rage
s
Misc
food
item
sPr
epar
ed fo
odan
dhellip
Urban
Rural
9
3 Production constraints in Indonesian agriculture
The agriculture sector is a key component of the Indonesian economy contributing about 14 per cent of Indonesias GDP in 2014 (Statistics Indonesia 2015) Thirty per cent of Indonesias land area is used for agricultural purposes and the sector employs 41 million people or 35 per cent of the nations work force The sector is a strong contributor to Indonesias trade with agricultural exports accounting for 24 per cent of the value of total merchandise exports in 2012 (World Bank 2014)
Indonesias agriculture is generally characterised by fertile volcanic soils and abundant renewable water resources High population density has resulted in a sector dominated by smallholdings Agricultural land area per person in Indonesia is low at just 022 hectares This is equivalent to a third of the world average (World Bank 2014) Challenges to agricultural production and productivity growth include the availability and quality of natural resources insecure land tenure underemployment of labour and lack of infrastructure
Resource constraints Land availability Indonesia is the worlds largest nation archipelago made up of 17 508 islands of which just over a third are inhabited Java is the most densely populated island accommodating more than half of Indonesias population (57 per cent in 2013) on only 7 per cent of the total land area (Map 1)
Map 1 Map of Indonesia
Source GeoNetwork Food and Agriculture Organization of the United Nations (FAO 2012)
About 30 per cent of Indonesias land area (545 000 square kilometres) is classified as agricultural land (World Bank 2014) Of this 43 per cent or 235 000 square kilometres is considered arable that is land under annual crops or any fallow or pasture land used for annual crops within any five-year period The remaining agricultural land is either devoted to plantation crops (such as oil palm coconut rubber coffee and sugar cane) or permanent pasture (natural or seeded grassland that remains unploughed for many years)
10
The islands of Java Bali and large parts of Sumatra are home to irrigated lowland rice-paddy terraces and upland rain fed farming The average size of farms producing rice and other food crops such as maize peanuts and cassava ranges from 03 hectares on Java to 14 hectares elsewhere (OECD 2013) Java produces around half of Indonesias rice Expansion of the lowland rice area in Java is limited because of increasing competition for land with other crops and non-agricultural uses such as industry uses housing and roads (FAO 2005)
The plantation and industrial crops sector dominated by oil palm coconut and natural rubber makes up 15 per cent of total crop area Large private and state-owned farms are involved in these perennial cropsmdashmainly in Kalimantan and Sumatra and mainly for producing oil palm and natural rubbermdashbut there are also many smallholders The average farm size in this sector is 2 600 hectares (OECD 2013)
Until 2010 growth in agricultural production relied largely on converting forested areas into agricultural land particularly to oil palm plantations In the past two decades millions of hectares were cleared for this purpose Just over half of Indonesias total land was classified as forest area in 2011 compared with 65 per cent in 1990 (Figure 8) Driving this trend has been the growing global demand for edible oils and the price competitiveness of palm oil relative to alternatives such as soybean oil (Rabobank 2013) Much of the deforestation is concentrated in Sumatra and Kalimantan
Figure 8 Land use in Indonesia
Note Share of total land area Source World Development indicators World Bank Group (World Bank 2014)
Many less populated islands remain densely forested and are home to forest and coastal communities that sustain themselves through agriculture hunting foraging and fishing (USAID nd) Indonesias Ministry of Forestry estimates of bush shrub grass and barren land across Indonesia total 22 million hectaresmdasharound half of which is located in Kalimantan and Papua McKinsey Global Institute (2012) estimates almost 7 million hectares of this land (much of which used to be in agricultural production but has since been abandoned) could be developed for agricultural production Alexandratos and Bruinsma (2012) project that between 2009 and 2050 total arable land in Indonesia will increase by 75 per centmdashan assumption used in the modelling in this report
20
40
60
80
100
1990 1993 1996 1999 2002 2005 2008 2011
Other
Agriculture
Forest area
11
Land degradation Indonesia is regularly described as being a highly fertile country but land quality varies across the archipelago The central islands have more fertile soils and hence are densely populated Agricultural land in Java in particular has benefited from high levels of mineral fertiliser application soil and water erosion control programmes and relatively good soil (FAO 2005) In contrast the soils of the outer less populated islands are characterised by highly weathered acidic soils that require higher fertiliser inputs to achieve the high crop yields obtained in Java and the other central islands Actual fertiliser use in the outer islands is generally lower than on Java resulting in soil nutrient depletion in the upland crop areas (FAO 2005)
Erosion and associated problems of nutrient depletion are minimal on Java because of the system of flat terracing and well-maintained irrigation schemes However in the lower-potential rain fed uplands where crops such as maize and cassava are produced on sloping hillsides erosion problems and nutrient depletion are more prevalent Where deforestation has occurred to make way for plantation crops loss of forest cover has led to watershed degradation silting of waterways flooding soil erosion and decline in soil quality and soil productivity (World Bank 2009)
Land tenure Land parcels in Indonesia are highly fragmented particularly on smallholder farms As land is passed down the generations it tends to become divided into smaller parcels (McKinsey Global Institute 2013) While the law requires that all land rights be registered most of these inherited parcels are unregistered less than 25 per cent of rural land parcel holders have been registered in the 40 years since land registration began (OECD 2012b) Additionally a large share of land off Java is communal rather than privately titled Land rights of these communities are often not formally recognised increasing the risk of conflict
The implications of the land tenure arrangements are that for large investors gaining access to land is a long and unclear process As a result only limited land rights are granted which compromises the extent to which production can increase (OECD 2012b) For smallholders unclear land tenure or nonexistence of certificated land registration compounds the difficulties of gaining access to credit from financial institutions This discourages investment in productivity-enhancing technology and biases farmers choices away from longer-term activities such as tree crops (World Bank 2010)
Fertiliser use The Indonesian Government maintains a ceiling price on fertiliser which depending on fertiliser type is between 50 per cent and 75 per cent lower than the market price (Sudaryanto 2014) Lower fertiliser prices are intended to encourage increased crop production particularly of rice The government provides a subsidy to fertiliser manufacturers to compensate them for selling fertiliser below market prices Despite the subsidy payment the incentives for fertiliser manufacturers to increase production and compete with one another are limited by government regulation of production quantities prices and locations where fertiliser can be sold (Osorio et al 2011)
The use of fertiliser is unevenly distributed across the archipelago Among food crops the highest application rates per hectare are for rice followed by maize and soybeans The lowest are for peanut and cassava The subsidy and resulting increase in fertiliser use led to more than a doubling of rice production between 1970 and 2000 Over that period total annual fertiliser
12
use increased from 635 000 tonnes to 59 million tonnes more than half of which was used to increase rice production (FAO 2005)
Fertilisers remain underused on plantation crops Large areas of plantation crops are owned and managed by smallholder farmers For many the lack of knowledge about appropriate fertilisation technology and the lack of reliable and timely access to the right fertilisers at village level lead to inadequate and unbalanced application (FAO 2005)
Apart from the budgetary burden subsidising domestic fertiliser prices results in inefficient fertiliser use at the farm level Studies in West Java report rice farmers applying levels of fertilisers higher than the recommended rates with some soil tests showing nutrient reserves had built up to high levels negatively affecting yields (FAO 2005 Osorio et al 2011)
Farm labour and mechanisation Indonesian agriculture is dominated by abundant labour in relation to available agricultural land contributing to the issue of small-scale production The agriculture forestry and fishing sector employs around 40 million people or 35 per cent of the workforce (15 years and over) and is the main source of employment in rural areas (Indonesian Central Bureau of Statistics 2015c McKinsey 2012) The proportion of landless and land-poor agricultural households is especially high on Java Of more than 17 million households on Java characterised as farmer or agricultural labourer households 39 per cent neither lease nor own any crop land and another 44 per cent lease or own less than 05 hectares (USAID nd)
Tradition is one obstacle to agricultural development in Indonesia (Shahaf 2009) In many cases farmers grow the same crops as previous generations using the same such methods and tools Sometimes two or three generations work the same farm
Traditionally particularly in Java harvesting is undertaken primarily by manual labour (Yamauchi 2014) Machines are rarely used However outside Java the emergence of larger scale farmers had led to operations scaling up through mechanisation This has contributed to a rise in farm labour productivity since 2000 (Figure 9)
Figure 9 Agriculture value added per farm worker Indonesia
Source World Development indicators World Bank Group (World Bank 2014)
Currently tractors are used for land preparation activities such as primary and secondary tillage while seeding and planting activities continue to be done manually Threshers are used in more developed areas where agricultural labour has become scarce as a result of competitive wages in other industries
2005 US$
200
400
600
800
1 000
1 200
1980 1984 1988 1992 1996 2000 2004 2008 2012
13
Wage growth in recent years may have led to the introduction of labour saving practices among relatively large farmers such as renting more land and acquiring machinery (Yamauchi 2014) In contrast small farmers have not significantly changed their behaviours
Infrastructure As the worlds largest archipelago Indonesias insufficient and poor quality infrastructure is a major challenge for connectivity between the islands High transport costs also undermine the competitiveness of agricultural industries and associated supply chains (Rabobank 2013 OECD 2012b) With most transport developments concentrated in Java access to markets for the rest of Indonesia is poor
Ninety per cent of freight and 80 per cent of passenger traffic in Indonesia moves by road However roads are heavily congested and their quality in urban and provincial areas is poor (The Canadian Trade Commissioner Service 2011) Because connectivity with markets is compromised by an inadequate road system returns to agricultural producers are often discounted because of spoilage incurred during transport (Global Business Guide Indonesia 2012)
Indonesia has around 300 ports spread throughout the archipelago Inter-island shipping consisting of ferry and cargo shipping services accounts for around 60 per cent of total seaborne cargo in the country (World Bank 2013) Seaports in Indonesia are outdated and investment in port facilities has not matched the rapid growth of traffic moving through them As a result inefficiencies in the shipping system such as bottlenecks and delays in cargo handling are common Vessels also often leave the main port Tanjung Priok before they are fully loaded to keep to published schedules (The Canadian Trade Commissioner Service 2011)
Current infrastructure does not support internal trade well and challenges Indonesiarsquos ability to provide its own food to its own people Developing an efficient transport and logistics system would not only increase the competitiveness of Indonesias external trade but would also provide easier and cheaper access for local agricultural products to domestic markets with reduced losses through spoilage Until this is achieved Indonesian supply chains will continue to be uncompetitive inefficient and looking to other markets to satisfy agrifood demand particularly in urban centres
Water availability While Indonesias water supplies may be sufficient for current agricultural production deterioration of the existing irrigation infrastructure and investment constraints to improve or develop new infrastructure may limit Indonesias future water availability given rapid urbanisation and food demands
Growing municipal water needs and the needs of the agriculture sector to increase production to meet the demands of urban consumers is likely to result in water shortages in coming decades The McKinsey Global Institute projects that by 2030 water supplies will fall short of demand by around 18 per cent (McKinsey 2012) Significant investment is required to improve water productivity and reduce water transmission losses through rehabilitating old and damaged irrigation infrastructure Up to half of Indonesias piped water supply is estimated to be lost in transmission (McKinsey 2012)
Feed availability Increasing demand for meat protein has stimulated the establishment of large scale commercial poultry farms and beef cattle feedlots Data from the Indonesian Feed Millers Association show
14
the poultry industry consumes 83 per cent of Indonesias animal feed the aquaculture industry consumes 11 per cent and cattle and pig industries the remaining 6 per cent (USDAndashFAS 2014)
On average Indonesias livestock feed is composed of maize (50 per cent) soybean meal (15 to 20 per cent) rice bran (15 per cent) wheat pollard (8 per cent) fish meal (5 per cent) maize gluten meal (3 per cent) and crude palm oil (2 per cent) (USDAndashFAS 2014) While most maize is sourced domestically inconsistent seasonal supplies and storage challenges such as high moisture content and aflatoxin levels are major factors that are leading feed millers to import increasing quantities of maize Canola meal is being used increasingly in poultry diets as a cost competitive alternative to soybean meal However its use is restricted to less than full replacement of soybean meal because of canolarsquos lower energy and protein content and the presence of antinutritional factors such as lower amino acid digestibility than in soybean meal (Khajali and Slominski 2012) Apart from maize and agri-industrial by-products such as rice bran copra meal and palm kernel meal other feed ingredients are largely imported (Table 3)
In food crop producing areas fibrous agricultural residues have become the main feed source for ruminant animals raised by small scale livestock producers Rice straw is fed as a base roughage but additional good quality feedstuff or concentratesmdashsuch as leaves and stalks of cassava leaves of maize and sugarcane leaves stems and peelings of banana rice bran pods and peelings of cacao and the fronds pressed fibre and palm kernel cake from oil palmmdashare required to gain higher production performance (Djajanegara 1999) Such feeds are available in various locations but their unequal distribution and high prices at the farm level limit their use by smallholder farmers Lack of storage and labour shortages during harvest time also restrict the collection of rice straw These limitations as well as the seasonal nature of these feedstuffs affect continuity of supply and therefore the productivity potential of smallholder livestock producers
Table 3 Indonesian animal feed sources of primary ingredients
Feed ingredient Local share () Imported share ()
Maize 90ndash95 5ndash10
Fish meal 5ndash10 90ndash95
Meat and bone meal (MBM) 0 100
Soybean meal 0 100
Rapeseed meal 0 100
Maize gluten meal 0 100
Feed additive 0 100
Rice bran 100 0
Copra meal 100 0
Palm kernel meal 100 0
Crude palm oil (CPO) 100 0 Source Indonesia grain and feed annual report 2014 United States Department of Agriculture (USDAndashFAS 2014)
Productivity There has been significant growth in the volume of total agricultural output in Indonesia over the past 50 years although the rate of growth has varied markedly over the decades The contribution of increased total factor productivity (TFP) to total agricultural output growth (including food crops and non-food cash crops) was strong during the 1960s and 1970s as new
15
technologies and improved crop varieties were widely adopted during the green revolution (Table 4) (Fuglie 2010 2012) In the 1980s land and labour use expanded enabling total agricultural output to grow but TFP growth slowed During the 1990s average agricultural output growth declined to less than 2 per cent a year as the green revolution crop varieties had already been widely adopted and no newer higher yielding varieties were suitable or available However TFP growth was stronger than the previous decade
Table 4 Average annual food and non-food agricultural output and total factor productivity growth Indonesia
Years Agricultural output Agricultural TFP
1961ndash1970 271 175
1971ndash1980 334 140
1981ndash1990 464 059
1991ndash2000 187 099
2001ndash2009 486 368 Note Agricultural output measured in volume Source Fuglie 2012
Between 2001 and 2009 strong output and TFP growth resumed for a number of reasons Newly available crop land achieved by the clearing of forested areas supported the expansion and diversification of agriculture into higher value non-staple commodities such as tropical perennials horticulture and livestock At the same time the relatively low price of fertilisers and chemicals available to producers led to a 50 per cent increase in their use between 2002 and 2009 (Figure 10) resulting in a marked improvement in crop yields compared with the previous decade (OECDndashFAO 2014) Improved literacy and education of the farm labour force also contributed to productivity growth (OECD 2012b)
Figure 10 Total fertilizer use in Indonesia by type
Note 2001 data not available Source FAOSTAT Food and Agriculture Organization of the United Nations (FAO 2015)
TFP estimates do not exist for the period since 2010 While yield growth is not as robust a measure of technical change as TFP yield trends can provide a partial indication of changes in productivity Average annual yield growth between 2011 and 2013 was lower than in the
Mt
1
2
3
2002 2003 2004 2005 2006 2007 2008 2009
Nitrogen
Potash
Phosphate
16
periods 2001ndash05 and 2006ndash10 across a range of food and non-food crops (Table 5) A number of factors explain this slowdown The rate of conversion of forest land to cropping slowed significantly reducing the rate of agricultural output growth achieved through additional agricultural land (OECD 2012b) In addition the sustained overuse of fertilizers and chemicals throughout the 2000s has led to decreasing returns to scale for these intermediate inputs As a result any future increase in the productivity of food and non-food crops is unlikely to be achieved through the application of chemicals or fertilisers
Table 5 Average annual yield growth of food and non-food cash crops Indonesia
Commodity Unit 1991-95 1996-00 2001-05 2006-10 2011-13
Food crops
Rice 02 03 08 19 09
Maize 12 42 46 52 30
Cassava -06 15 50 49 36
Mung beans -03 -67 44 23 -02
Soybeans 04 17 11 11 12
Groundnuts -34 58 15 16 02
Vegetables a 93 -08 35 -17 -68
Cash crops
Rubber na -01 45 58 48
Crude palm oil na -72 108 -06 12
Palm kernel na -104 120 08 -10
Cocoa na 05 143 21 -30
Coffee na 24 14 62 37
Tea na 02 30 -05 -11 a Vegetable data available to 2012 Source FAOSTAT Food and Agriculture Organization of the United Nations (FAO 2015)
With reduced scope for expansion in agricultural production through both conversion of forest land and increased use of fertilisers and chemicals future agricultural productivity growth is likely to be achieved through the more efficient use of inputs The dominance of smallholdings remains a constraint to achieving higher agricultural productivity growth in future as small plots impede the implementation of more productive practices This is compounded by inefficient fertiliser use limited mechanisation and an inadequate supply of other important inputs such as high-yielding seeds irrigation systems extension services and access to credit Addressing these issues will be key to future productivity trends
17
4 Indonesian agricultural and food policies
The objectives of Indonesias agricultural policy as stated by the Indonesian Ministry of Agriculture in 2010 are to
1) achieve food self-sufficiency
2) enhance diversification of production and consumption
3) raise the competitiveness and value added of production and
4) increase farmersrsquo welfare (OECD 2012b)
To achieve its objectives the Indonesian Government intervenes in the farm sector with multiple policy instruments The government also implements policies to protect consumers from fluctuations in prices of key food products such as wheat rice and vegetable oils and to insulate domestic producers from foreign competition Food for consumers is subsidised which effectively maintains the price of food within a narrow price band Producers benefit from tariffs applied to imported food which keep the price of domestically produced food competitive with imports Additionally producers are directly supported by government food purchases at guaranteed prices and subsidies on farm inputs such as fertiliser seed and farm equipment
Policies to support agricultural production Reference prices and import restrictions The Indonesian Government sets reference prices for rice sugar and beef which it aims to maintain through various policy instruments
On average around 70 per cent of domestic rice production is consumed within the farming household (OECD 2012b) The remainder is sold through either private or government-run channels such as Indonesias National Food Logistics Agency known as Badan Ursan Logistik (BULOG) BULOG purchases a limited amount of rice at the reference price to fulfil two objectives
1) stockholding for emergency purposes and
2) redistribution as part of the consumer subsidy programme Raskin (discussed below) (OECD 2012b)
In 2010 BULOG procured around 6 per cent of total domestic rice production equivalent to around 20 per cent of all marketed rice (OECD 2012b)
For sugar the government supports the producer price by imposing legal requirements on domestic sugar millers who control the domestic sugar market Sugar millers are required to purchase 75 per cent of their sugar cane requirements from domestic sugar cane growers and to pay growers a government-determined price
The Indonesian rice and sugar industries are also protected by import restrictions Companies that import rice and sugar are required to support the domestic industry by buying domestically produced product if the mill price falls below the reference price
18
For beef and live cattle imports the Indonesian Government sets a reference price which it aims to achieve by managing import volumes through an import permit system Since 2014 the reference price has been 76 000 rupiah (A$720) a kilogram Under the system import permits are not issued if domestic beef prices fall below the reference price (ABARES 2013) Weight restrictions on cattle imports also usually apply limiting imports to young lighter cattle destined for feedlots
The Indonesian Government also restricts imports of other commodities such as soybeans maize horticulture certain processed foods and animals and animal products (including fresh chilled and frozen meat and eggs) Importing these commodities is generally not permitted if the Ministry of Trade considers it will cause injury to the domestic industry (WTO 2013) Companies seeking to import these commodities are required to gain approval from the Indonesian Ministry of Trade (OECD 2012b)
Tariffs Tariffs are applied to most imported food products in Indonesia However they are relatively low and are not a major policy instrument used to protect domestic industries The average applied agricultural tariff was 53 per cent in 2010 (OECD 2012b) Around 85 per cent of agricultural imports are subject to tariffs between zero and 5 per cent with almost 66 per cent entering duty free All agricultural tariffs are ad valorem except for rice and sugar which have specific tariffs (OECD 2012b)
While applied tariffs are low bound tariff rates or the ceiling rate that can be applied under World Trade Organisation rules remain high (Figure 11) On average the bound rate on agricultural products is 47 per cent (OECD 2012b) The highest bound tariff is 210 per cent for milk powders although the applied rate is just 5 per cent Rice has a bound tariff of 160 per cent and an applied specific rate of 450 rupiah a kilogram (equivalent to an ad valorem tariff of 10 per cent when using the average export price for 15 per cent broken rice from Thailand in 2010) (OECD 2012b)
Figure 11 Average bound and applied tariffs by product groups
Source OECD Review of Agricultural Policies Indonesia 2012 Organisation for Economic Co-operation and Development (OECD 2012b)
0
20
40
60
80
Fruit and vegetables
Sugars and confectionery
Cereals Dairy products
Animals and animal
products
Oilseeds fats and oils
Average bound tariff
Average applied tariff
19
Input subsidies The Indonesian Government supports farmers by subsiding inputs such as fertiliser seeds and ad hoc products including power tools and rice milling units Fertiliser support is the largest component of budgetary support for agriculture accounting for 37 per cent in 2008ndash09 (OECD 2012b) Not all farmers receive input subsidies because eligibility requirements apply in many cases For example subsidised fertiliser is only available to farmers producing on less than 2 hectares
Policies to support consumers Price intervention The Indonesian Government intervenes in the domestic market for wheat flour maize and cooking oil when it considers retail prices too high for the poor It does this using a broad range of measures from simply asking manufacturers and wholesalers to be socially responsible with their pricing to purchasing these products and distributing them directly to poor households (OECD 2012b) Another policy often used is the government covered value tax under which the government waives the existing 10 per cent value added tax on the final price of certain food items For example the government has used this policy to reduce the price of non-branded cooking oil since 2007 In 2010 this policy cost the Indonesian Government around 250 billion rupiah (A$299 million)
Food subsidies The Indonesian Government operates a targeted rice subsidy programme known as Raskin to combat food insecurity The programmes objective is to make available a set quantity of rice (procured by BULOG) at a subsidised price to Indonesias poorest households on a monthly basis Raskins intention is to provide rice to those on official lists of households living under or near the national poverty line (World Bank 2012b) The poverty line in 2014 was around 318 500 rupiah per person a month in urban areas and 286 100 rupiah per person a month in rural areas (Indonesian Central Bureau of Statistics 2015a) Those with incomes within 20 per cent of the poverty line are defined as being near the poverty line (World Bank 2012b)
Despite the objectives of Raskin to target the most vulnerable since allocations of Raskin rice to households are decided by local authorities poor and non-poor households alike benefit from the programme In 2010 around 175 million households received Raskin rice (OECD 2012b) at a cost of around 14 trillion rupiah (A$17 billion) to the Indonesian Government (Figure 12) Between 2005 and 2010 the subsidised price was 1 600 rupiah (A$019) a kilogram representing about 20 to 25 per cent of the average market price (World Bank 2012a)
The quantity of rice per household the subsidised price the number of months a year that rice is distributed and the classification of the poorest households have all been altered over the period of the programme For example monthly allocations per household have been set as low as 10 kilograms and as high as 20 kilograms over the programme period although households rarely benefit from the full amount of the allocation (OECD 2012b World Bank 2012a)
20
Figure 12 Raskin rice distribution and budgetary cost
Source OECD Review of Agricultural Policies Indonesia 2012 Organisation for Economic Co-operation and Development (OECD 2012b)
Implications of agricultural and food policies Public expenditure on Indonesian agriculture has increased under its current policy settings In 2009 public spending was around 615 trillion rupiah (A$75 billion) This was equivalent to 56 per cent of total government expenditure compared with 27 per cent in 2001 (World Bank 2011) The fertiliser subsidy and Raskin have been the biggest drivers of increased spending over this period
In addition to the direct budget cost of Indonesias agricultural and food policies there have also been allocative effects Indonesian policies tend to focus on rice maize and sugar leading to increased production of these commodities and improved availability from domestic sources However expansion of these crops has come at the expense of horticulture and other commodities in which Indonesia has a comparative advantage such as natural rubber cocoa and spices (World Bank 2011)
The administration of some support programmes the fertiliser subsidy in particular is inefficient (Sudaryanto 2014) As discussed in Chapter 3 subsidising fertiliser companies in an environment where quantities prices and distribution channels are regulated reduces incentives for these companies to effectively compete This inefficiency has resulted in the under-production of fertiliser leading to shortages At the same time the artificially low price has led to an over-reliance on fertiliser by producers to increase yield rather than using other methods such as improved seeds (World Bank 2011)
4000
8000
12000
16000
2000 2002 2004 2006 2008 20100
1
2
3
4
Expenditure on RASKIN
Quantity of rice distributed (right axis)
Million tonnes
Billionrupiah
21
5 Simulation results Baseline assumptions The objective in this analysis is to identify and quantify projected changes in Indonesian demand for a range of agrifood commodities over the longer term across urban and rural households An updated version of the ABARES agrifood model (Linehan et al 2012a) is used to investigate these potential trends The model has been modified to include Indonesias consumer subsidy policy (Raskin) and a re-aggregation of some country and commodity groups to allow more detailed analysis
Indonesia has a comparative advantage in the production of many cash crops and non-food agricultural commodities that are not included in the ABARES agrifood model such as natural rubber copra palm kernels coffee cocoa and spices (FAO 2013) In Indonesia the production of these commodities competes with food commodities for resources despite a policy environment targeted at food production and food self-sufficiency
Given Indonesias limited supply of arable land and the quality and availability of its water supply the capacity of the domestic agricultural sector to meet the growing demand for food in Indonesia will depend heavily on improvements in productivity Total factor productivity (TFP) growth in Indonesian agriculture is estimated to have averaged 154 per cent a year since 1961 It is expected that yield growth in Indonesia will not decline from this average annual rate in the future because the potential for productivity growth remains significant However nor is it expected to continue at the relatively high rates estimated for the period 2001 to 2009 which were made possible from the expansion of agriculture into higher-value non-staple commodities on newly deforested land and a significant increase in the use of chemical fertilisers (see Chapter 4)
Productivity growth since 2010 is estimated to have slowed from the decade 2001ndash2009 The Indonesian Governments policy initiative Reducing Emissions from Deforestation and Forest Degradation (REDD) in 2010 and declaration of a two-year Forest Moratorium in 2011 have slowed the rate of forest conversion to crop land (OECD 2012b) In addition agricultural production continues to be constrained by the issues outlined in Chapter 4 (including decreasing returns to scale for chemical inputs lack of widespread mechanisation and deteriorating resource base) With ongoing competition between the production of food crops and non-food cash crops (in which Indonesia has a comparative advantage) and little prospects in the foreseeable future for major policy changes on food consumption and production TFP growth for food crops in Indonesia is assumed to average 154 per cent a year between 2009 and 2050 This is close to the forecast by Ludena et al (2007) of 152 per cent a year to 2040 (FAO 2013 USDAndashFAS 2014)
Growth rates for TFP for individual commodities have in the past shown similar patterns to growth in yields Assumptions of TFP growth rates for individual commodities are therefore derived by apportioning the assumed rate for the whole of agriculture by historical growth in the yields of each commodity (Table 6)
22
Table 6 Average annual TFP growth rate by industry in Indonesia 2009 to 2050
Industry
Rice 214
Maize 337
Coarse grains 335
Other cereals 239
Oilseeds 388
Vegetables 232
Fruit 303
Beef 032
Sheep and goat meat 144
Poultry 144
Eggs 135
Dairy 215
All Agriculture 154 Source ABARES model assumption
In the reference case no change to Indonesias market support policies is assumed over the projection period On the production side these include the principal forms of market support of state trading input subsidies and import restrictions Additionally the Indonesian Governments minimum support prices for rice and wheat are maintained in real terms as are other ad hoc interventions on a range of agricultural commodities
The government support received by consumers through the consumer subsidy policy Raskin is also maintained in real terms over the projection period (discussed in Chapter 4)
The baseline projections determined in the agrifood model for Indonesia are also dependent on a set of assumptions discussed in Chapters 2 and 3 To summarise
bull population growth is assumed to average 07 per cent a year between 2010 and 2050
bull the proportion of the population in urban areas is assumed to increase from 50 per cent in 2009 to 72 per cent by 2050
bull average annual GDP growth in Indonesia is assumed to average 53 per cent a year between 2010 and 2030 before weakening between 2030 and 2050 to average 34 per cent a year (Table 1)
bull average annual income growth is assumed to be 56 per cent a year in urban areas and 21 per cent a year in rural areas
agricultural productivity in Indonesia is assumed to continue to increase according to the growth estimates provided in Table 6
The population is divided into two income stratamdashurban income and rural income households Across these two household types the income growth assumptions to 2050 for urban and rural areas are based on historical income data from the Indonesian Central Bureau of Statistics (2011) These data demonstrate that not only is average urban income higher than average rural income but with urbanisation average income growth in urban areas has also been higher than
23
in rural areas This has been the result of a relatively faster rate of economic development and higher wages which have stemmed from the growth in the manufacturing and services sectors prevalent in urban areas The model assumes this trend in income growth will continue to 2050 Indonesian household food consumption data in the base year of the model are from the Indonesian Central Bureau of Statistics (2014) and Widarjono (2012) These data were used as the basis in the model to project food consumption across urban and rural households to 2050
In the model total and per person Indonesian food consumption and total urban and rural food consumption is apparent consumption which reflects the total use of agrifood products (food feed and industrial use) In contrast per person urban and rural consumption is direct food consumption only it excludes feed use and industrial use of agrifood products to better reflect changes in diets
Consumption The real value of total food consumption in Indonesia (including food feed and industrial use) is projected to quadruple between 2009 and 2050 to US$327 billion (in 2009 US dollars) The largest increases are for meat dairy products fruit and vegetables as real incomes increase (Figure 13) Together these commodities account for two-thirds of the projected rise in the real value of food consumption
Figure 13 Consumption of selected agricultural commodities Indonesia
Note Starchy staples include pulses yams potatoes and cassava Source ABARES model output
Between 2009 and 2050 the real value of Indonesian beef consumption is projected to rise more than 14 times to US$35 billion (in 2009 US dollars) dairy products ten times to almost US$9 billion and fruit and vegetables more than three times to US$50 billion and US$25 billion respectively For many commodities the value of consumption in 2050 is projected to rise from a very low base reflecting high poverty rates and a large rural population in 2009 By 2050 72 per cent of the population is projected to live in urban centres with higher incomes than the
10 20 30 40 50 60
Wheat
Sheep and goat meat
Dairy
Sugar
Oil crops
Rice
Vegetables
Starchy staples
Beef
Poultry
Fruit
2050
2009
Billion(2009 US$)
552
66
231
1311
269
1319
256
246
935
1340
113
24
rural cohort It is this expected transition of the population and income growth that drive the magnitude of projected consumption growth for many commodities Despite these large increases Indonesias per person food consumption in 2050 is projected to remain below that of China for many commodities (Hamshere et al 2014)
For cereals oil crops and starchy staples (pulses potatoes yams and cassava) consumption is also projected to increase Between 2009 and 2050 the real value of rice consumption is projected to rise by 66 per cent to nearly US$23 billion (in 2009 US dollars) maize by 182 per cent to US$8 billion oil crops by 246 per cent to US$22 billion and starchy staples by 256 per cent to almost US$29 billion Over this period the real value of sugar consumption is projected to rise more than six times to US$14 billion (in 2009 US dollars)
The projected rise in consumption of cereals oil crops and starchy staples is driven by a number of factors First cereals and starchy staples (such as cassava) are relatively affordable foods particularly for low and middle income consumers whose populations are projected to rise Although both cereals and starchy staples will remain important components of Indonesian diets to 2050 their relative contribution will decline as diets become more diversified with greater amounts of meats dairy products and fruit and vegetablesmdashthe continuation of a trend that began around 1990 (Figure 5)
The projected rise in consumption of cereals oil crops and starchy staples is also driven by feed requirements which will increase as the demand for meat protein rises to 2050 As discussed in Chapter 3 about 50 per cent of domestic maize production is used as feed Rice bran also comprises about 15 per cent of total Indonesian feed consumption Soybean meal comprises between 15 per cent and 20 per cent of total livestock feed all of which is imported Rapeseed meal can be used as a partial substitute for soybeans and it too is entirely imported In 2050 it is projected that feed use will account for around 42 per cent of total maize consumption 43 per cent of total oil crop consumption and 44 per cent of total starchy staple consumption a larger proportion of which will need to be imported compared with 2009
Urban and rural consumption In 2050 71 per cent of Indonesias population is projected to live in urban areas compared with 54 per cent in 2015 (United Nations Population Division 2014) By 2050 Indonesian consumers are projected to have more diverse diets with greater consumption of meat dairy products fruit and vegetables
In this section the results for total urban and rural consumption reflect apparent consumption However per person rural and urban consumption is direct food consumption only Feed use and industrial use of the agrifood products are excluded in the per person results in order to better understand the projected change in diets
High value commodities Urban consumers account for most of the growth in consumption of meat dairy products fruit and vegetables over the projection period because of rising urban populations and incomes Between 2009 and 2050 the real value of urban beef consumption is projected to rise more than 18 times to US$34 billion (in 2009 US dollars) Consumption of dairy products is projected to rise by more than 14 times to more than US$8 billion and fruit and vegetables more than four times to US$43 billion and almost US$21 billion respectively (Figure 14)
25
Figure 14 Urban consumption of selected agricultural commodities Indonesia
Source ABARES model output
In per person terms the value of urban beef consumption is projected to rise more than nine times between 2009 and 2050 dairy more than seven times and fruit and vegetables to more than double However consumption of rice is projected to fall by 4 per cent While these increases are large Indonesias urban per person consumption in 2050 is still projected to be lower than that of China in the same year for many commodities including vegetables (73 per cent lower) oilseeds (12 per cent) dairy products (41 per cent) and sheep and goat meat (24 per cent) In contrast Indonesias urban per person consumption is projected to be higher than Chinas for beef (52 per cent higher) sugar (400 per cent) cereals (23 per cent) and starchy staples (14 times higher) (Hamshere et al 2014) For beef higher Indonesian per person consumption relative to China in 2050 reflects the dominance of beef in Indonesian diets by that time compared with China where pig meat consumption is significant Similarly the projected rise in per person consumption of starches in Indonesia mainly reflects higher consumption of cassava a culturally important food crop
For rural consumers total growth in consumption of meat dairy products fruit and vegetables is lower than for urban households This can be attributed to relatively lower rural incomes and a decline in the absolute size of the rural population Between 2009 and 2050 total rural beef consumption is projected to rise by 95 per cent to more than US$1 billion (in 2009 US dollars) dairy products by 75 per cent to US$05 billion fruit by 41 per cent to almost US$7 billion and vegetables by 42 per cent to almost US$5 billion (Figure 15)
20 40 60
Wheat
Sheep and goat meat
Dairy
Sugar
Oil crops
Rice
Vegetables
Starchy staples
Beef
Poultry
Fruit
Billion(2009 US$)
387
1724
1734
426
875
370
547
1349
Total food consumption
1761
91
173
50 100 150 200
Wheat
Sheep and goat meat
Dairy
Sugar
Oil crops
Rice
Vegetables
Starchy staples
Beef
Poultry
Fruit
2009 US$
145
819
824
165
391
137
226
630
Per person consumption
837
-4
38
26
Figure 15 Rural consumption of selected agricultural commodities Indonesia
Source ABARES model output
Between 2009 and 2050 rural per person consumption of each of the agrifood commodity groups is projected to change by a similar magnitude as urban consumption In value terms rural per person consumption of beef is projected to rise by 162 per cent dairy products by 135 per cent fruit by 90 per cent and vegetables by 92 per cent Similar increases are projected for rice (96 per cent) wheat (128 per cent) and starchy staples (116 per cent)
Again despite these significant increases rural per person consumption in Indonesia is projected to be lower than that of China in 2050 for all products except sugar which is projected to be 117 per cent higher For all other commodity groups rural per person consumption is projected to be lower than in China including sheep and goat meat (85 per cent lower) dairy (54 per cent) starches (32 per cent) cereals (56 per cent) and vegetables (86 per cent)
For both rural and urban consumers the rise in the real value of total food consumption in 2050 is principally the result of an increase in the quantity consumed rather than a projected significant rise in the real price This is especially pronounced in urban households For example between 2009 and 2050 beef consumption by urban households is projected to rise by more than 15 times and sheep and goat meat by 13 times In contrast rural beef consumption over this period is projected to rise by 64 per cent and sheep and goat meat by 44 per cent
Projected consumption growth of cereals and starchy staples between 2009 and 2050 is most pronounced in urban areas Rising urban consumption of these commodities is largely the result of population growth Urban consumption of wheat is projected to rise by 173 per cent to around US$2 billion (in 2009 US dollars) rice by 91 per cent to US$9 billion and starchy staples (which includes pulses potatoes yams and cassava) by 426 per cent to US$13 billion
Rural consumption of cereals and starchy staples is projected to rise despite a falling rural population As incomes rise towards 2050 the relatively affordable prices of these commodities will drive rural consumption Between 2009 and 2050 rural consumption of wheat is projected
2 4 6 8 10
Wheat
Sheep and goat meat
Dairy
Sugar
Oil crops
Rice
Vegetables
Starchy staples
Beef
Poultry
Fruit
Billion(2009 US$)
94
95
61
96
42
101
Total consumption
41
75
98
45
69
50 100 150 200
Wheat
Sheep and goat meat
Dairy
Sugar
Oil crops
Rice
Vegetables
Starchy staples
Beef
Poultry
Fruit
2050
2009
2009 US$
90
161
162
116
165
92
170
135
Per person consumption
166
96
128
27
to rise by 69 per cent to US$1 billion (in 2009 US dollars) rice by 45 per cent to almost US$9 billion and starchy staples by 61 per cent to US$3 billion
Production and trade The real value of Indonesias total agrifood production (which includes production for food feed and industrial use) is projected to more than double from US$81 billion in 2009 to US$173 billion in 2050 (in 2009 US dollars) This increase is driven by a higher value of production (in 2009 US dollars) of beef (up 209 per cent) poultry (187 per cent) starchy staples (115 per cent) vegetables (92 per cent) fruit (78 per cent) and rice and palm oil (up 77 per cent each) (Figure 16) The value of maize production divided almost equally between feed and food use is projected to increase by 78 per cent
Figure 16 Production of selected agricultural commodities Indonesia
Source ABARES model output
For some agricultural products such as rice and beef rising production partly reflects domestic policies that favour their production For example the real value of rice production between 2009 and 2050 is projected to rise by 77 per cent because of the assumption that producers continue to receive a minimum support price and input subsidies Indonesia is projected to switch from being an importer to an exporter of rice by 2050 The real value of Indonesias rice exports in 2050 is projected to be around US$09 billion (in 2009 US dollars)
The real value of Indonesias palm oil production is projected to rise significantly in line with strong export demand and Indonesias comparative advantage in its production Between 2009 and 2050 Indonesias production of palm oil is projected to rise by US$13 billion to US$30 billion an increase of 77 per cent Over this period palm oil exports are projected to rise by 40 per cent to US$18 billion
10 20 30 40
Sheep and goat meat
Dairy
Sugar
Palm oil
Rice
Vegetables
Starchy staples
Beef
Poultry
Fruit
2050
2009
Billion(2009 US$)
78
187
209
115
92
77
77
76
115
361
28
Imports For some agricultural commodities such as rice and palm oil the rise in consumption by 2050 is projected to be met largely by a rise in domestic production However for most agrifood commodities production is projected to increase at a slower rate than consumption As a result food and feed imports will be an increasingly important component of Indonesias food supply towards 2050 The real value of Indonesias total agrifood imports is projected to rise more than 20 times from 2009 to US$152 billion (in 2009 US dollar terms) in 2050
By 2050 Indonesia is projected to import a wide range of horticultural products Given rising domestic demand the real value of Indonesiarsquos fruit and vegetable imports is projected to rise to US$25 billion and US$11 billion in 2050 respectively (in 2009 US dollars Figure 17) On this basis the share of imports in total Indonesian fruit consumption will rise from 3 per cent in 2009 to 53 per cent in 2050 (Figure 18) For vegetables it will rise from 9 per cent in 2009 to 47 per cent in 2050
Figure 17 Trade of selected agricultural commodities Indonesia
Source ABARES model output
-30 -20 -10 0 10 20 30
Wheat
Sheep and goat meat
Dairy
Sugar
Rice
Beef
Starchy staples
Vegetables
Fruit
2050
2009
Billion (2009 US$)
Exports Imports
Palm oil
29
Figure 18 Import share of total consumption Indonesia
Source ABARES model output
Lower-income growth scenario The baseline projections for Indonesian agrifood consumption production and trade to 2050 are reliant on the underlying assumptions presented at the beginning of this chapter Chief among these are the OECD (2012a) assumptions for Indonesian GDP growth to 2050 presented in Chapter 2 (Table 1 and Table 7) If Indonesia were to realise a lower level of income growth agrifood demand growth would be expected to be lower The World Bank projects that Indonesian GDP growth in each decade to 2050 will be markedly lower than the OECDs projections (World Bank 2015 Table 7) This scenario examines the potential effect on Indonesian agrifood consumption and import demand if GDP and hence income growth were slower over the projection period as suggested by the World Bank All other variables from the reference scenario are held constant
Table 7 Indonesia GDP growth projections 2010 to 2050
Period Baseline 1991-2010
2011-2020 2021-30 2031-40 2041-50
OECD average annual growth ()
440 530 530 340 340
World Bank average annual growth ()
440 350 350 225 225
Source OECD 2012a World Bank 2015
Results In this scenario lower economic and income growth throughout the projection period results in GDP in 2050 that is 44 per cent lower than the reference case Because agrifood consumption is sensitive to changes in income the total value of agrifood consumption in 2050 (in 2009 US dollars) is 10 per cent less than in the reference case (Figure 19) Weaker economic growth most
Fruit Vegetables Starchy staples
Beef Poultry Sugar Maize Dairy Sheep and goat meat
Wheat
10
20
30
40
50
2050 Imports
2050 Domestic production
2009 imports
2009 Domestic production
53
3
4743
86
8183
1007091
9
75846723
6
100
Billion(2009 US$)
21
50
30
strongly affects urban areas where average annual income growth in the reference case was assumed to be more than double that of rural areas As a result demand for high-value products such as meat and dairy products declines significantly Many of these products are imported In 2050 the total projected value of beef consumption (in 2009 US dollars) is 17 per cent lower than in the reference case and poultry and milk products are each 14 per cent lower The real value of consumption for many domestically produced products such as starches and maize also declines but by no more than 10 per cent for any single commodity
Weaker consumption growth leads to lower import growth over the projection period particularly for high-value commodities The total value of imports in 2050 is 16 per cent lower in this scenario compared with the reference case with the import share of total consumption 5 percentage points lower than the reference case at 42 per cent (Figure 19) Beef imports are projected to be 20 per cent lower than the reference scenario sheep and goat meat 26 per cent lower and dairy products 16 per cent lower Fruit and vegetable imports are 12 per cent and 19 per cent lower respectively
Figure 19 Agrifood consumption in 2050 under lower income growth assumption
Source ABARES model output
0 100 200 300 400
Low income scenario
Baseline case
Domestic production
Imports
Billion(2009 US$)
4258
53 47
31
6 Conclusion Continued strong income and population growth combined with greater urbanisation are driving Indonesias increasing demand for not only more food but for a wider variety of foods This demand growth is projected to be met by increases in both domestic production and imports
Assuming no major changes to Indonesias existing agricultural policies to 2050 the real value of food consumption in Indonesia is projected to increase more than four times between 2009 and 2050 The increase will be characterised by a move towards more diverse diets with higher intake of meat dairy products fruit and vegetables Between 2009 and 2050 the real value of beef consumption is projected to rise more than 14 times dairy tenfold and fruit and vegetables to more than triple These projected increases are from a relatively low base and are driven by a rise in the quantities consumed rather than any significant projected rise in real prices To support this rise in demand imports of many agrifood commodities are projected to increase to 2050
The contribution of meat dairy products fruit and vegetables in Indonesian diets will increase more quickly than cereals and staples to 2050 While cereals and starchy staples will remain important components of Indonesian diets their relative contribution will declinemdashthe continuation of a trend that began around 1990
The upward trend in food demand is most pronounced among urban households whose income growth is assumed to be more than double that of rural households A declining rural population and relatively lower incomes will result in slower growth in food consumption compared with the urban population
For most agricultural commodities assuming no significant change to historical TFP growth for total agriculture production is projected to increase at a slower rate than consumption As a result food imports will be an important component of Indonesias food and feed supply towards 2050 The real value of Indonesias agrifood imports is projected to rise more than 20 times from 2009 to US$152 billion (in 2009 US dollar terms) in 2050
The projected significant increases in consumption and import demand for food in Indonesia are based on the assumption of relatively strong income growth to 2050 Under a lower growth scenario consumption of protein-based food products such as meat and dairy products is projected to be around 14 to 17 per cent lower than the reference case at 2050 While consumption of domestically produced products is also projected to be lower in 2050 in the lower-income-growth scenario the declines are less significant compared with the baseline case
While not included in the modelling in this report there is scope for increased production of non-food agricultural commodities and cash crops in Indonesia in which it has a comparative advantage These include natural rubber copra palm kernels coffee cocoa and spices Indonesias current policies on food self-sufficiency favour investment in food industries rather than the non-food and cash crops industries This has the effect of allocating resources away from their most efficient use
Because of their geographic proximity Australia and Indonesia are well placed to benefit from advancing bilateral agricultural trade Indonesia is an important market for Australian wheat sugar live cattle beef skim milk powder and horticultural products such as grapes and citrus
32
Stronger demand for these commodities and others in Indonesia will create further opportunities for Australian exporters
33
References ABARES 2013 Agricultural commodities September quarter 2013 Australian Bureau of Agricultural and Resource Economics and Sciences Canberra pp 85-87 available at agriculturegovauabarespublications
Afif S 2014 The Rising of Middle Class in Indonesia Opportunity and Challenge Paper presented at the International Policy Exchange Conference Segovia Spain 28 September available at umdcipeorgconferencesDecliningMiddleClassesSpainpapers_presentationshtml
Alexandratos N amp Bruinsma J 2012 World agriculture towards 20302050 the 2012 revision ESA Working paper no 12-03 Food and Agriculture Organization of the United Nations Rome available at faoorgeconomicesaesagen
Djajanegara A 1999 Local livestock feed resources in Livestock industries of Indonesia prior to the Asian financial crisis Food and Agriculture Organization of the United Nations Rome available at faoorgdocrep004AB986Eab986e06htmbm06 accessed 22 January 2015
Elias S amp Noone C 2011 The growth and development of the Indonesian economy Bulletin December Quarter Reserve Bank of Australia Sydney available at rbagovaupublicationsbulletin2011dec4html
FAO 2015 lsquoFAOSTATrsquo Food and Agriculture Organization of the United Nations Rome available at faostat3faoorghomeE accessed 26 October 2015
mdashmdash 2013 Indonesia Food and Agriculture Organization of the United Nations Rome available at faoorgdocrep005y4632ey4632e0lhtm
mdashmdash2012 GeoNetwork Food and Agriculture Organization of the United Nations Rome available at faoorggeonetworksrvenmainhome accessed 15 February 2014
mdashmdash 2005 Fertiliser use by crop in Indonesia Food and Agriculture Organization of the United Nations Rome available at faoorgdocrep008y7063ey7063e00htm
Fuglie K 2012 lsquoProductivity growth and technology capital in the global agricultural economyrsquo in Fuglie KO Wang SL amp Ball VE (eds) Productivity growth in agriculture an international perspective CAB International Oxfordshire UK
mdashmdash2010 lsquoSources of growth in Indonesian agriculture Journal of Productivity Analysis vol 33 no 3 pp 225-240
Fuglie K amp Rada N 2014 International Agricultural Productivity United States Department of Agriculture Economic Research Service Washington DC available at ersusdagovdata-productsinternational-agricultural-productivityaspxU089bfmSzkd
Global Business Guide Indonesia 2012 Agriculture in Indonesia available at gbgindonesiacomenagriculturesector_overviewphp
Glover J 2011 lsquoAn international retailerrsquos perspectiversquo Paper presented at The Crawford Fund 2011 Annual Parliamentary Conference Parliament House Canberra 14 August available at crawfordfundorgevents2011-parliamentary-conference
34
Hamshere P Sheng Y Moir B Syed F amp Gunning-Trant C 2014 What China wants Analysis of Chinas food demand to 2050 ABARES research report Canberra March available at agriculturegovauabarespublications
IMF 2015 World Economic Outlook Database available at imforgexternalpubsftweo201302weodataindexaspx accessed 26 October 2015
Indonesian Central Bureau of Statistics 2015a Poverty available at bpsgoidSubjekviewid23subjekViewTab3|accordion-daftar-subjek1 accessed 27 October 2015
mdashmdash2015b Consumption and expenditure available at bpsgoidSubjekviewid5subjekViewTab3|accordion-daftar-subjek1 accessed 27 October 2015
mdashmdash2015c Population 15 Years of Age and Over Who Worked by Main Industry 2004-2014 available at bpsgoidlinkTabelStatisviewid970 accessed 27 October 2015
mdashmdash2014 Consumption and expenditure available at bpsgoidSubjekviewid5subjekViewTab3|accordion-daftar-subjek1 accessed 20 February 2014
mdashmdash2011 Total income by Household Group (billion rupiahs) available at bpsgoidSubjekviewid5subjekViewTab3|accordion-daftar-subjek1 accessed 1 August 2014
Khajali F amp Slominski BA 2012 lsquoFactors that affect the nutritive value of canola meal for poultryrsquo Poultry Science vol 91 no 10 pp 2564ndash2575 available at psoxfordjournalsorgcontent91102564fullxref-ref-95-1
Linehan V Thorpe S Andrews N amp Beaini F 2012a Food demand to 2050 Opportunities for Australian agriculture paper presented at 2012 ABARES Outlook conference Canberra 6ndash7 March available at daffgovauabarespublications
mdashmdash 2012b Food demand to 2050 Opportunities for Australian agriculturemdashalgebraic description of agrifood model technical annex to ABARES Outlook conference paper Canberra May available at daffgovauabarespublications
Ludena C Hertel T Preckel P Foster K and Nin A 2007 Productivity growth and convergence in crop ruminant and nonruminant production measurement and forecasts Agricultural Economics 37 available at onlinelibrarywileycomdoi101111j1574-0862200700218xabstract
McKinsey Global Institute 2012 The archipelago economy Unleashing Indonesias potential September Jakarta available at mckinseycominsightsasia-pacificthe_archipelago_economyashx
OECD 2013 Global Food Security Challenges for the Food and Agricultural System Organisation for Economic Cooperation and Development Paris available at oecd-ilibraryorgagriculture-and-foodglobal-food-security_9789264195363-en
mdashmdash2012a Looking to 2060 A global vision of long-term growth Economics Department Policy Notes no 15 Organisation for Economic Cooperation and Development Paris November available at oecdorgecomonetarypolicy-noteshtm
35
mdashmdash2012b OECD Review of Agricultural Policies Indonesia 2012 Organisation for Economic Cooperation and Development Paris available at oecd-ilibraryorgagriculture-and-foodoecd-review-of-agricultural-policies-indonesia-2012_9789264179011-en
OECDndashFAO 2014 OECDndashFAO Agricultural Outlook 2014 Organisation for Economic Cooperation and Development Paris available at oecd-ilibraryorgagriculture-and-foodoecd-fao-agricultural-outlook-2014_agr_outlook-2014-en
Osorio C Abriningrum D Armas E amp Firdaus M 2011 Who is benefiting from fertilizer subsidies in Indonesia Policy Research Working Paper 5758 World Bank Washington DC available at elibraryworldbankorgdoipdf1015961813-9450-5758
Rabobank 2013 Indonesia - islands of opportunity Agriculture in Focus Rabobank Food amp Agribusiness Research and Advisory Australia and New Zealand Spring Sydney
Shahaf E 2009 Agriculture in Indonesia Asia Technology Consulting available at techasiaconsultingcomagriculture_in_indonesiahtml
Statistics Indonesia 2015 Gross Domestic Product at Current Market Prices By Industrial Origin (Billion Rupiahs) 2000-2014 available at bpsgoidlinkTabelStatisviewid1199 accessed 26 October 2015
Sudaryanto T 2014 Fertilizer subsidy policy in Indonesia impacts and future perspectives Food and Fertiliser Technology Center for the Asian and Pacific Region Asia-Pacific Information Platform on Agricultural Policy (AP) available at apfftcagnetorgap_dbphpid=365
The Canadian Trade Commissioner Service 2011 lsquoAn Investment Guide to Indonesia available at tradecommissionergccaengdocumentjspdid=133467toc38
United Nations Population Division 2015 World population prospects the 2015 revision United Nations New York available at esaunorgunpdwppindexhtm accessed 12 August 2015
mdashmdash2014 World urbanisation prospects the 2014 revision United Nations New York available at esaunorgunpdwup accessed 19 March 2015
USAID nd lsquoIndonesia ndash Property rights amp resource governancersquo USAID Country Profile available at usaidlandtenurenetindonesia
USDAndashFAS 2014 Indonesia grain and feed annual report 2014 GAIN Report no ID1407 1 April Foreign Agricultural Service United States Department of Agriculture Washington DC available at usdaindonesiaorgcat=10
Widarjono A 2012 Food and nutrient demand in Indonesia PhD thesis Oklahoma State University available at shareokorgbitstreamhandle112446547Department20of20Agricultural20Economics_48pdfsequence=1
World Bank 2015 Global Economic Prospects January 2015 Having fiscal space and using it World Bank Group Washington DC available at worldbankorgenpublicationglobal-economic-prospects
mdashmdash2014 World development indicators World Bank Washington DC available at dataworldbankorgdata-catalogworld-development-indicators
36
mdashmdash2013 Transport in Indonesia World Bank Washington DC available at goworldbankorgPF2AFG64V0
mdashmdash 2012a Raskin subsidised rice delivery Public expenditure review (PER) Social assistance program and public expenditure review no 3 World Bank Washington DC available at documentsworldbankorgcurateden20120215893857raskin-subsidized-rice-delivery
mdashmdash2012b Targeting poor and vulnerable households in Indonesia World Bank Washington DC available at documentsworldbankorgcurateden20120115879773targeting-poor-vulnerable-households-indonesia
mdashmdash2011 Indonesia Agriculture Public Expenditure Review 2010 World Bank Jakarta available at documentsworldbankorgcurateden20110919456223indonesia-agriculture-public-expenditure-review-2010
mdashmdash2010 Completing decentralization World Bank Jakarta available at documentsworldbankorgcurateden20100112012453completing-decentralization
mdashmdash2009 Investing in a more sustainable Indonesia Country Environmental Analysis Report No 50762-ID World Bank CEA Series East Asia and Pacific Region available at openknowledgeworldbankorgbitstreamhandle109863135507620v20Revis1ox0info10CEA1englishpdfsequence=1
mdashmdash2007 Horticultural producers and supermarket development in Indonesia World Bank Washington DC available at documentsworldbankorgcurateden2007068235822horticultural-producers-supermarket-development-indonesia
WTO 2013 Trade policy review Indonesia WTO Document WTTPRS278 World Trade Organisation Geneva available at wtoorgenglishtratop_etpr_etp378_ehtm
Yamauchi F 2014 Wage Growth Landholding and Mechanization in Agriculture Evidence from Indonesia World Bank Washington DC February available at openknowledgeworldbankorghandle1098617324
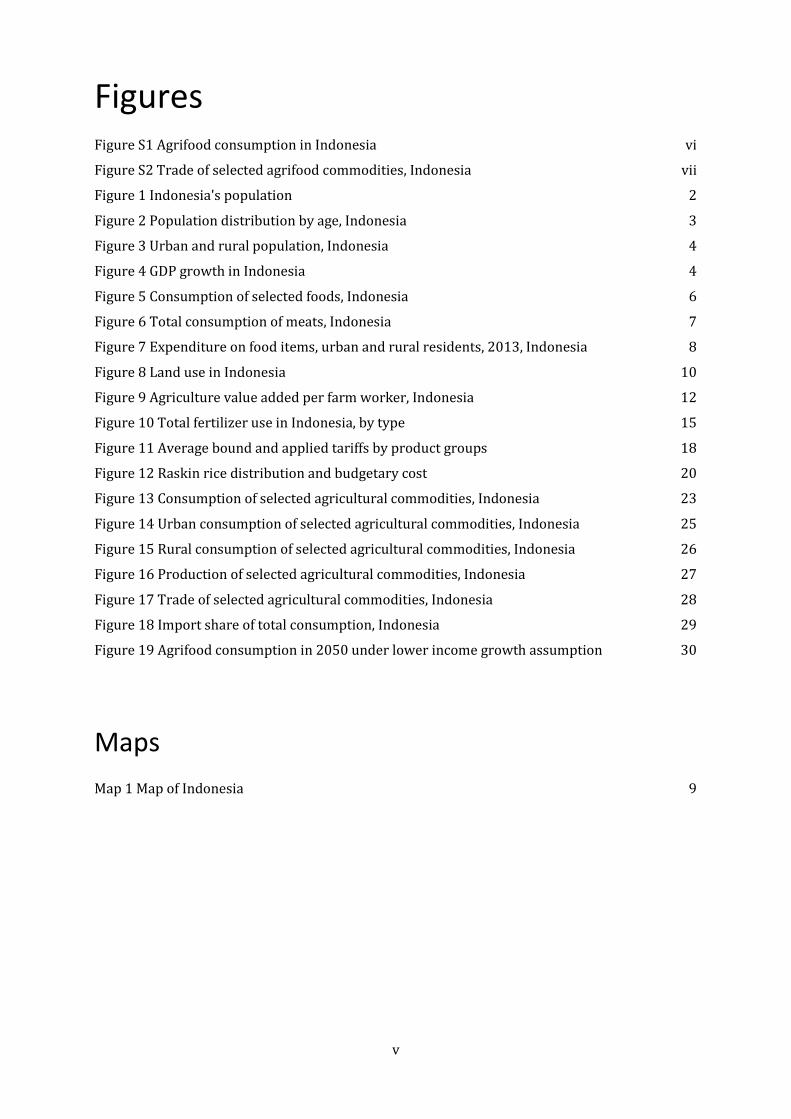
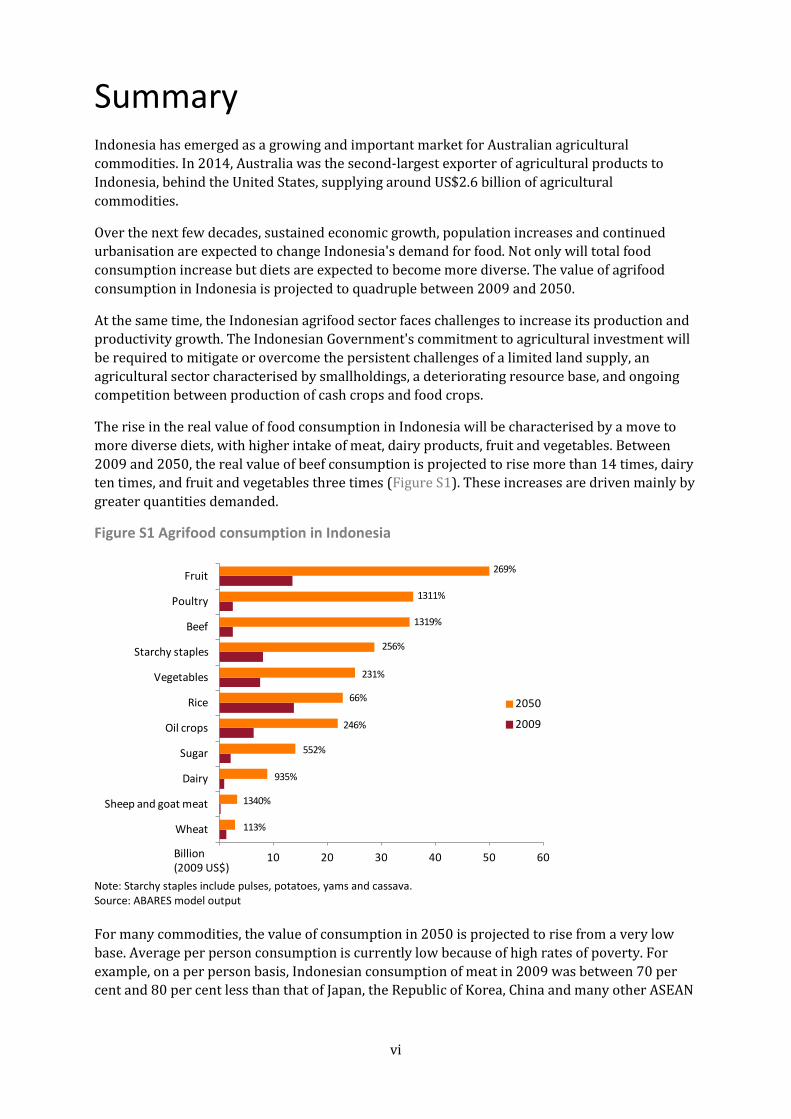
1
1 Introduction World demand for agrifood products is expected to increase significantly over the period to 2050 with the real value of Asian agrifood demand expected to double (Linehan et al 2012a) The rise in the global population per person incomes and rates of urbanisation especially in developing countries are driving this increase In Indonesia projected strong population and economic growth over the coming decades are expected to result in a marked increase in total food consumption
Indonesia is becoming an increasingly important export destination for many Australian agricultural commodities In 2014 Australia was the second-largest exporter of agricultural products to Indonesia behind the United States Australia supplied around US$26 billion of agricultural commodities (excluding tobacco and its products) compared with US$680 million in 2000 (in 2014 US dollars)
The objective in this report the fourth in the What Asia wants series is to build upon existing ABARES analysis of global food consumption and production by examining the factors likely to influence the future pattern of Indonesias food consumption with particular attention to household consumption trends across urban and rural consumers
For this analysis an updated version of the ABARES agrifood model (Linehan et al 2012b) was developed The model is a partial equilibrium economic model of global agricultural production consumption and trade with a base year of 2009 The agrifood products in the model include both primary and lightly transformed agricultural products such as flour and meat Uses of agrifood products include direct food use feed use and industrial use Highly processed food items such as beverages and packaged foods are not included nor are non-food agricultural commodities and cash crops such as natural rubber copra palm kernels coffee cocoa and spices In this report Indonesias targeted consumer subsidy for rice Raskin is built into the model baseline
Chapter 2 of this report examines the factors expected to influence Indonesias food demand trends to 2050 and presents the income and population assumptions used in the analysis Chapter 3 discusses some of the production constraints and challenges with which Indonesia will have to contend over the longer term in order to increase its agricultural output Chapter 4 briefly outlines Indonesias principal agricultural policies supporting food security Chapter 5 discusses projected consumption production and trade trends to 2050 in a business-as-usual policy environment as well as in a lower economic growth scenario Chapter 6 summarises the main findings of the analysis
2
2 Drivers of food demand Food consumption at the national level relates to the size of the population and the amount of food consumed by each person Changes in per person food consumption as well as in the mix of foods consumed are largely influenced by growth in household incomes and by factors such as the age structure of the population lifestyle and the proportion of the population living in urban and rural areas This chapter discusses the contribution of these factors to the expected increase in Indonesian food demand to 2050
Population Indonesias population grew from just over 180 million in 1990 to more than 257 million in 2015 an average growth rate of 14 per cent a year (Figure 1) Under the medium-variant projection of the United Nations the population is expected to grow by an average of 06 per cent a year between 2010 and 2050 (United Nations Population Division 2015) At this rate the population would grow by some 65 million to reach 322 million in 2050
Figure 1 Indonesias population
Source World population prospects the 2015 revision United Nations Population Division (United Nations Population Division 2015)
Indonesias population growth during much of the past half century was partly the result of a significant decline in mortality rates Between 1950ndash55 and 2005ndash10 Indonesias crude death rate declined from 21 per 1 000 people to 7 per 1 000 people Between 1950ndash55 and 1970 the crude birth rate was high above 40 births per 1 000 people However it began to decline in about 1970 reaching 21 births per 1 000 people by 2005ndash10
The declining birth and death rates in the four decades to 2010 resulted in a significant shift in the age distribution of the population (Figure 2) In 1970 67 per cent of the population was aged under 30 by 2010 this group constituted 55 per cent of the population By 2050 it is projected to be only 41 per cent Conversely the proportion of the over-50s in the population was 11 per cent in 1970 and 16 per cent in 2010 and is projected to increase to 31 per cent by 2050
Million
50
100
150
200
250
300
350
400
1990 2000 2010 2020 2030 2040 2050
Estimates to 2015
Medium
High
Low
3
Compared with other Asian countries Indonesias population is relatively young (Elias amp Noone 2011) The proportion of people of working age (15 to 64) in the population is forecast to remain above 65 per cent beyond 2045 (United Nations Population Division 2015) and the absolute number of people of working age is also expected to continue to increase
Figure 2 Population distribution by age Indonesia
Source World population prospects the 2015 revision United Nations Population Division (United Nations Population Division 2015)
The changing age structure is likely to have an effect on patterns of food demand Nutritional requirements increase as children age to maturity and decline as adults age Older people generally consume less food and typically prefer more traditional foods
Urbanisation is an important determinant of consumer demand for food Urban dwellers typically have higher incomes than their rural counterparts and different dietary and shopping patterns Over the four decades from 1970 to 2010 Indonesias urban population expanded by an average of 45 per cent a year (Figure 3) The rural population grew more slowly than the urban population reaching a peak in 1995 Since 2010 the total number of urban residents has exceeded rural residents
Jakarta is by far Indonesias largest city with a population of just over 10 million (United Nations Population Division 2014) Jakarta has four times the population of the second-largest city Surabaya However most other cities are growing at faster rates than Jakarta In 2050 71 per cent of Indonesias population is projected to live in urban areas compared with 54 per cent in 2015 (United Nations Population Division 2014)
Million 10 20 30
0-4
10-14
20-24
30-34
40-44
50-54
60-64
70-74
80+
Age
grou
p
1970
Million 10 20 30
2010
Million 10 20 30
2050
4
Figure 3 Urban and rural population Indonesia
Source World urbanisation prospects the 2014 revision United Nations Population Division (United Nations Population Division 2014)
Incomes The Indonesian economy has grown consistently over the past two decades apart from the Asian financial crisis of 1998 (Figure 4) Indonesian GDP in constant prices almost tripled between 1990 and 2012 (IMF 2015) Average incomes per person in constant prices doubled over the same period
Figure 4 GDP growth in Indonesia
Source World Economic Outlook Database International Monetary Fund (IMF 2015)
10
20
30
40
50
60
70
80
90
Million
50
100
150
200
250
300
350
1970 1980 1990 2000 2010 2020 2030 2040 2050
Rural
Urban
Share of rural population (right axis)
-10
-5
0
5
10
1990 1995 2000 2005 2010
5
Indonesias economic growth has not been shared equally across the population Although the middle class (defined as those with daily expenditure of between US$2 and US$20 in 2005 purchasing power parity terms) expanded from around 25 per cent of the population in 2000 to 57 per cent in 2010 income inequality has increased (Afif 2014 Indonesian Central Bureau of Statistics 2015a) Income growth and income inequality both have important implications for food consumption The expansion of the middle class has been a significant factor behind the increase in Indonesias total food consumption However the rise in inequality implies there remains a considerable proportion of the population with low incomes and limited capacity to buy food
In the baseline projections presented in this report Indonesian GDP is assumed to grow according to OECD (2012a) projections (Table 1) Between 2011 and 2030 real GDP growth is assumed to increase at an average of 53 per cent a year before weakening between 2030 and 2050 to average 34 per cent a year Urban incomes are assumed to continue to grow faster than rural incomes over the period to 2050 averaging 56 per cent and 21 per cent a year respectively An alternative scenario of lower economic growth is also examined based on World Bank (2015) projections (see Chapter 5 Table 7)
Table 1 Indonesia GDP growth 2009 to 2050
1991-2010 2011-2020 2021-30 2031-40 2041-50
Average annual growth ()
44 53 53 34 34
Source Looking to 2060 A global vision of long-term growth Economics Department Policy Notes no 15 Organisation for Economic Co-operation and Development (OECD 2012a)
Food consumption Total food consumption in Indonesia has increased in response to rising incomes and population Between 1990 and 2013 total consumption of wheat fruit and milk each increased by more than 200 per cent (Figure 5) Consumption of vegetables more than doubled over the same period and meat consumption almost doubled Consumption of ricemdasha staple food in Indonesian dietsmdashincreased by only 32 per cent
6
Figure 5 Consumption of selected foods Indonesia
Source FAOSTAT Food and Agriculture Organization of the United Nations (FAO 2015)
Between 1990 and 2013 the average calorie intake per person in Indonesia increased by 19 per cent The contribution of starchy roots and pulses to individuals calorie intake declined while the contribution of fruit and vegetables meat and fish increased Average per person consumption of milk and other dairy products more than doubled but remained of limited significance
Poultry is the major source of meat in Indonesia accounting for over half the total meat consumed in 2013 (Figure 6) Pig meat constituted almost a quarter of total meat consumption in 2013 consumed by non-Muslim people Consumption of beef which ranks third has been increasing more slowly than chicken meat consumption because it is relatively more expensive (FAO 2015) Sheep and goat meat accounted for less than 5 per cent of total meat consumption
Million tonnes
5
10
15
20
25
30
35
40
1990 1992 1994 1996 1998 2000 2002 2004 2006 2008 2010 2012
Rice (milled equivalent)
Fruit
Vegetables
Wheat
Meat
Milk (excluding butter)
7
Figure 6 Total consumption of meats Indonesia
Source FAOSTAT Food and Agriculture Organization of the United Nations (FAO 2015)
On a per person basis Indonesias consumption of many food groups is relatively low This is because a high portion of its population lives at or near the poverty line Per person consumption of meat in 2011 was between 70 per cent and 80 per cent less than that of Japan the Republic of Korea China and many other ASEAN nations (Table 2) For dairy it was around 80 per cent less than that of Japan 56 per cent less than China 47 per cent less than the Republic of Korea and lower than other ASEAN countries For fruit and vegetables it was between 30 per cent and 65 per cent less than that of Japan and the Republic of Korea 74 per cent less than China and lower than other ASEAN countries These relatively low per person consumption levels underline the potential for sizable increases in per person food consumption as incomes rise
Table 2 International comparison of annual per person food consumption 2011
Country Meats kg
Dairy kg
Fruit and vegetables kg
Cereals kg
Japan 488 713 1524 1044
Republic of Korea 622 264 2888 1515
China 577 315 4178 1515
Malaysia 533 322 1131 1466
Philippines 345 145 1796 1577
Vietnam 576 151 1445 1670
Indonesia 129 139 1075 1906 Source FAOSTAT Food and Agriculture Organization of the United Nations (FAO 2015)
Diets of urban residents are usually different from their rural counterparts In 2013 Indonesias urban residents spent an average of 414 000 rupiah a month on food compared with 299 000 rupiah by rural residents (Indonesian Central Bureau of Statistics 2015b) Urban residents spent more than rural residents on meat fish eggs fruit and prepared (cooked and packaged) foods Rural residents spent more on cereals and tubers (Figure 7) with 24 per cent of their food budget devoted to cereals alone compared with only 15 per cent for urban residents
000 tonnes
200
400
600
800
1000
1200
1400
1600
1800
2000
1990 1992 1994 1996 1998 2000 2002 2004 2006 2008 2010 2012
Poultry meat
Pig meat
Bovine meat
Sheep and goat meat
8
Figure 7 Expenditure on food items urban and rural residents 2013 Indonesia
Source Indonesian Central Bureau of Statistics 2015b
Food marketing in Indonesia is also changing In the 1980s supermarkets occupied only a small niche in food retailing By the mid-1990s they were still confined to the urban upper income sector Supermarkets only began to spread quickly in Indonesia after 1998 By 2007 they accounted for about 30 per cent of overall retail food expenditure (World Bank 2007)
The development of supermarkets is typically associated with closer vertical coordination along value chains as the supermarkets maintain close relationships with their suppliers This often involves contractual arrangements with farmers or in the case of food imports with suppliers in other countries Asian supermarket chains have developed direct relationships with suppliers of fresh horticultural and dairy produce in the United States New Zealand and Australia (Glover 2011)
000 rupiah
20
40
60
80
100
120
140
Cere
als
Tube
rs
Fish
Mea
t
Eggs
and
milk
Vege
tabl
es
Legu
mes
Frui
ts
Oil
and
fats
Beve
rage
s
Misc
food
item
sPr
epar
ed fo
odan
dhellip
Urban
Rural
9
3 Production constraints in Indonesian agriculture
The agriculture sector is a key component of the Indonesian economy contributing about 14 per cent of Indonesias GDP in 2014 (Statistics Indonesia 2015) Thirty per cent of Indonesias land area is used for agricultural purposes and the sector employs 41 million people or 35 per cent of the nations work force The sector is a strong contributor to Indonesias trade with agricultural exports accounting for 24 per cent of the value of total merchandise exports in 2012 (World Bank 2014)
Indonesias agriculture is generally characterised by fertile volcanic soils and abundant renewable water resources High population density has resulted in a sector dominated by smallholdings Agricultural land area per person in Indonesia is low at just 022 hectares This is equivalent to a third of the world average (World Bank 2014) Challenges to agricultural production and productivity growth include the availability and quality of natural resources insecure land tenure underemployment of labour and lack of infrastructure
Resource constraints Land availability Indonesia is the worlds largest nation archipelago made up of 17 508 islands of which just over a third are inhabited Java is the most densely populated island accommodating more than half of Indonesias population (57 per cent in 2013) on only 7 per cent of the total land area (Map 1)
Map 1 Map of Indonesia
Source GeoNetwork Food and Agriculture Organization of the United Nations (FAO 2012)
About 30 per cent of Indonesias land area (545 000 square kilometres) is classified as agricultural land (World Bank 2014) Of this 43 per cent or 235 000 square kilometres is considered arable that is land under annual crops or any fallow or pasture land used for annual crops within any five-year period The remaining agricultural land is either devoted to plantation crops (such as oil palm coconut rubber coffee and sugar cane) or permanent pasture (natural or seeded grassland that remains unploughed for many years)
10
The islands of Java Bali and large parts of Sumatra are home to irrigated lowland rice-paddy terraces and upland rain fed farming The average size of farms producing rice and other food crops such as maize peanuts and cassava ranges from 03 hectares on Java to 14 hectares elsewhere (OECD 2013) Java produces around half of Indonesias rice Expansion of the lowland rice area in Java is limited because of increasing competition for land with other crops and non-agricultural uses such as industry uses housing and roads (FAO 2005)
The plantation and industrial crops sector dominated by oil palm coconut and natural rubber makes up 15 per cent of total crop area Large private and state-owned farms are involved in these perennial cropsmdashmainly in Kalimantan and Sumatra and mainly for producing oil palm and natural rubbermdashbut there are also many smallholders The average farm size in this sector is 2 600 hectares (OECD 2013)
Until 2010 growth in agricultural production relied largely on converting forested areas into agricultural land particularly to oil palm plantations In the past two decades millions of hectares were cleared for this purpose Just over half of Indonesias total land was classified as forest area in 2011 compared with 65 per cent in 1990 (Figure 8) Driving this trend has been the growing global demand for edible oils and the price competitiveness of palm oil relative to alternatives such as soybean oil (Rabobank 2013) Much of the deforestation is concentrated in Sumatra and Kalimantan
Figure 8 Land use in Indonesia
Note Share of total land area Source World Development indicators World Bank Group (World Bank 2014)
Many less populated islands remain densely forested and are home to forest and coastal communities that sustain themselves through agriculture hunting foraging and fishing (USAID nd) Indonesias Ministry of Forestry estimates of bush shrub grass and barren land across Indonesia total 22 million hectaresmdasharound half of which is located in Kalimantan and Papua McKinsey Global Institute (2012) estimates almost 7 million hectares of this land (much of which used to be in agricultural production but has since been abandoned) could be developed for agricultural production Alexandratos and Bruinsma (2012) project that between 2009 and 2050 total arable land in Indonesia will increase by 75 per centmdashan assumption used in the modelling in this report
20
40
60
80
100
1990 1993 1996 1999 2002 2005 2008 2011
Other
Agriculture
Forest area
11
Land degradation Indonesia is regularly described as being a highly fertile country but land quality varies across the archipelago The central islands have more fertile soils and hence are densely populated Agricultural land in Java in particular has benefited from high levels of mineral fertiliser application soil and water erosion control programmes and relatively good soil (FAO 2005) In contrast the soils of the outer less populated islands are characterised by highly weathered acidic soils that require higher fertiliser inputs to achieve the high crop yields obtained in Java and the other central islands Actual fertiliser use in the outer islands is generally lower than on Java resulting in soil nutrient depletion in the upland crop areas (FAO 2005)
Erosion and associated problems of nutrient depletion are minimal on Java because of the system of flat terracing and well-maintained irrigation schemes However in the lower-potential rain fed uplands where crops such as maize and cassava are produced on sloping hillsides erosion problems and nutrient depletion are more prevalent Where deforestation has occurred to make way for plantation crops loss of forest cover has led to watershed degradation silting of waterways flooding soil erosion and decline in soil quality and soil productivity (World Bank 2009)
Land tenure Land parcels in Indonesia are highly fragmented particularly on smallholder farms As land is passed down the generations it tends to become divided into smaller parcels (McKinsey Global Institute 2013) While the law requires that all land rights be registered most of these inherited parcels are unregistered less than 25 per cent of rural land parcel holders have been registered in the 40 years since land registration began (OECD 2012b) Additionally a large share of land off Java is communal rather than privately titled Land rights of these communities are often not formally recognised increasing the risk of conflict
The implications of the land tenure arrangements are that for large investors gaining access to land is a long and unclear process As a result only limited land rights are granted which compromises the extent to which production can increase (OECD 2012b) For smallholders unclear land tenure or nonexistence of certificated land registration compounds the difficulties of gaining access to credit from financial institutions This discourages investment in productivity-enhancing technology and biases farmers choices away from longer-term activities such as tree crops (World Bank 2010)
Fertiliser use The Indonesian Government maintains a ceiling price on fertiliser which depending on fertiliser type is between 50 per cent and 75 per cent lower than the market price (Sudaryanto 2014) Lower fertiliser prices are intended to encourage increased crop production particularly of rice The government provides a subsidy to fertiliser manufacturers to compensate them for selling fertiliser below market prices Despite the subsidy payment the incentives for fertiliser manufacturers to increase production and compete with one another are limited by government regulation of production quantities prices and locations where fertiliser can be sold (Osorio et al 2011)
The use of fertiliser is unevenly distributed across the archipelago Among food crops the highest application rates per hectare are for rice followed by maize and soybeans The lowest are for peanut and cassava The subsidy and resulting increase in fertiliser use led to more than a doubling of rice production between 1970 and 2000 Over that period total annual fertiliser
12
use increased from 635 000 tonnes to 59 million tonnes more than half of which was used to increase rice production (FAO 2005)
Fertilisers remain underused on plantation crops Large areas of plantation crops are owned and managed by smallholder farmers For many the lack of knowledge about appropriate fertilisation technology and the lack of reliable and timely access to the right fertilisers at village level lead to inadequate and unbalanced application (FAO 2005)
Apart from the budgetary burden subsidising domestic fertiliser prices results in inefficient fertiliser use at the farm level Studies in West Java report rice farmers applying levels of fertilisers higher than the recommended rates with some soil tests showing nutrient reserves had built up to high levels negatively affecting yields (FAO 2005 Osorio et al 2011)
Farm labour and mechanisation Indonesian agriculture is dominated by abundant labour in relation to available agricultural land contributing to the issue of small-scale production The agriculture forestry and fishing sector employs around 40 million people or 35 per cent of the workforce (15 years and over) and is the main source of employment in rural areas (Indonesian Central Bureau of Statistics 2015c McKinsey 2012) The proportion of landless and land-poor agricultural households is especially high on Java Of more than 17 million households on Java characterised as farmer or agricultural labourer households 39 per cent neither lease nor own any crop land and another 44 per cent lease or own less than 05 hectares (USAID nd)
Tradition is one obstacle to agricultural development in Indonesia (Shahaf 2009) In many cases farmers grow the same crops as previous generations using the same such methods and tools Sometimes two or three generations work the same farm
Traditionally particularly in Java harvesting is undertaken primarily by manual labour (Yamauchi 2014) Machines are rarely used However outside Java the emergence of larger scale farmers had led to operations scaling up through mechanisation This has contributed to a rise in farm labour productivity since 2000 (Figure 9)
Figure 9 Agriculture value added per farm worker Indonesia
Source World Development indicators World Bank Group (World Bank 2014)
Currently tractors are used for land preparation activities such as primary and secondary tillage while seeding and planting activities continue to be done manually Threshers are used in more developed areas where agricultural labour has become scarce as a result of competitive wages in other industries
2005 US$
200
400
600
800
1 000
1 200
1980 1984 1988 1992 1996 2000 2004 2008 2012
13
Wage growth in recent years may have led to the introduction of labour saving practices among relatively large farmers such as renting more land and acquiring machinery (Yamauchi 2014) In contrast small farmers have not significantly changed their behaviours
Infrastructure As the worlds largest archipelago Indonesias insufficient and poor quality infrastructure is a major challenge for connectivity between the islands High transport costs also undermine the competitiveness of agricultural industries and associated supply chains (Rabobank 2013 OECD 2012b) With most transport developments concentrated in Java access to markets for the rest of Indonesia is poor
Ninety per cent of freight and 80 per cent of passenger traffic in Indonesia moves by road However roads are heavily congested and their quality in urban and provincial areas is poor (The Canadian Trade Commissioner Service 2011) Because connectivity with markets is compromised by an inadequate road system returns to agricultural producers are often discounted because of spoilage incurred during transport (Global Business Guide Indonesia 2012)
Indonesia has around 300 ports spread throughout the archipelago Inter-island shipping consisting of ferry and cargo shipping services accounts for around 60 per cent of total seaborne cargo in the country (World Bank 2013) Seaports in Indonesia are outdated and investment in port facilities has not matched the rapid growth of traffic moving through them As a result inefficiencies in the shipping system such as bottlenecks and delays in cargo handling are common Vessels also often leave the main port Tanjung Priok before they are fully loaded to keep to published schedules (The Canadian Trade Commissioner Service 2011)
Current infrastructure does not support internal trade well and challenges Indonesiarsquos ability to provide its own food to its own people Developing an efficient transport and logistics system would not only increase the competitiveness of Indonesias external trade but would also provide easier and cheaper access for local agricultural products to domestic markets with reduced losses through spoilage Until this is achieved Indonesian supply chains will continue to be uncompetitive inefficient and looking to other markets to satisfy agrifood demand particularly in urban centres
Water availability While Indonesias water supplies may be sufficient for current agricultural production deterioration of the existing irrigation infrastructure and investment constraints to improve or develop new infrastructure may limit Indonesias future water availability given rapid urbanisation and food demands
Growing municipal water needs and the needs of the agriculture sector to increase production to meet the demands of urban consumers is likely to result in water shortages in coming decades The McKinsey Global Institute projects that by 2030 water supplies will fall short of demand by around 18 per cent (McKinsey 2012) Significant investment is required to improve water productivity and reduce water transmission losses through rehabilitating old and damaged irrigation infrastructure Up to half of Indonesias piped water supply is estimated to be lost in transmission (McKinsey 2012)
Feed availability Increasing demand for meat protein has stimulated the establishment of large scale commercial poultry farms and beef cattle feedlots Data from the Indonesian Feed Millers Association show
14
the poultry industry consumes 83 per cent of Indonesias animal feed the aquaculture industry consumes 11 per cent and cattle and pig industries the remaining 6 per cent (USDAndashFAS 2014)
On average Indonesias livestock feed is composed of maize (50 per cent) soybean meal (15 to 20 per cent) rice bran (15 per cent) wheat pollard (8 per cent) fish meal (5 per cent) maize gluten meal (3 per cent) and crude palm oil (2 per cent) (USDAndashFAS 2014) While most maize is sourced domestically inconsistent seasonal supplies and storage challenges such as high moisture content and aflatoxin levels are major factors that are leading feed millers to import increasing quantities of maize Canola meal is being used increasingly in poultry diets as a cost competitive alternative to soybean meal However its use is restricted to less than full replacement of soybean meal because of canolarsquos lower energy and protein content and the presence of antinutritional factors such as lower amino acid digestibility than in soybean meal (Khajali and Slominski 2012) Apart from maize and agri-industrial by-products such as rice bran copra meal and palm kernel meal other feed ingredients are largely imported (Table 3)
In food crop producing areas fibrous agricultural residues have become the main feed source for ruminant animals raised by small scale livestock producers Rice straw is fed as a base roughage but additional good quality feedstuff or concentratesmdashsuch as leaves and stalks of cassava leaves of maize and sugarcane leaves stems and peelings of banana rice bran pods and peelings of cacao and the fronds pressed fibre and palm kernel cake from oil palmmdashare required to gain higher production performance (Djajanegara 1999) Such feeds are available in various locations but their unequal distribution and high prices at the farm level limit their use by smallholder farmers Lack of storage and labour shortages during harvest time also restrict the collection of rice straw These limitations as well as the seasonal nature of these feedstuffs affect continuity of supply and therefore the productivity potential of smallholder livestock producers
Table 3 Indonesian animal feed sources of primary ingredients
Feed ingredient Local share () Imported share ()
Maize 90ndash95 5ndash10
Fish meal 5ndash10 90ndash95
Meat and bone meal (MBM) 0 100
Soybean meal 0 100
Rapeseed meal 0 100
Maize gluten meal 0 100
Feed additive 0 100
Rice bran 100 0
Copra meal 100 0
Palm kernel meal 100 0
Crude palm oil (CPO) 100 0 Source Indonesia grain and feed annual report 2014 United States Department of Agriculture (USDAndashFAS 2014)
Productivity There has been significant growth in the volume of total agricultural output in Indonesia over the past 50 years although the rate of growth has varied markedly over the decades The contribution of increased total factor productivity (TFP) to total agricultural output growth (including food crops and non-food cash crops) was strong during the 1960s and 1970s as new
15
technologies and improved crop varieties were widely adopted during the green revolution (Table 4) (Fuglie 2010 2012) In the 1980s land and labour use expanded enabling total agricultural output to grow but TFP growth slowed During the 1990s average agricultural output growth declined to less than 2 per cent a year as the green revolution crop varieties had already been widely adopted and no newer higher yielding varieties were suitable or available However TFP growth was stronger than the previous decade
Table 4 Average annual food and non-food agricultural output and total factor productivity growth Indonesia
Years Agricultural output Agricultural TFP
1961ndash1970 271 175
1971ndash1980 334 140
1981ndash1990 464 059
1991ndash2000 187 099
2001ndash2009 486 368 Note Agricultural output measured in volume Source Fuglie 2012
Between 2001 and 2009 strong output and TFP growth resumed for a number of reasons Newly available crop land achieved by the clearing of forested areas supported the expansion and diversification of agriculture into higher value non-staple commodities such as tropical perennials horticulture and livestock At the same time the relatively low price of fertilisers and chemicals available to producers led to a 50 per cent increase in their use between 2002 and 2009 (Figure 10) resulting in a marked improvement in crop yields compared with the previous decade (OECDndashFAO 2014) Improved literacy and education of the farm labour force also contributed to productivity growth (OECD 2012b)
Figure 10 Total fertilizer use in Indonesia by type
Note 2001 data not available Source FAOSTAT Food and Agriculture Organization of the United Nations (FAO 2015)
TFP estimates do not exist for the period since 2010 While yield growth is not as robust a measure of technical change as TFP yield trends can provide a partial indication of changes in productivity Average annual yield growth between 2011 and 2013 was lower than in the
Mt
1
2
3
2002 2003 2004 2005 2006 2007 2008 2009
Nitrogen
Potash
Phosphate
16
periods 2001ndash05 and 2006ndash10 across a range of food and non-food crops (Table 5) A number of factors explain this slowdown The rate of conversion of forest land to cropping slowed significantly reducing the rate of agricultural output growth achieved through additional agricultural land (OECD 2012b) In addition the sustained overuse of fertilizers and chemicals throughout the 2000s has led to decreasing returns to scale for these intermediate inputs As a result any future increase in the productivity of food and non-food crops is unlikely to be achieved through the application of chemicals or fertilisers
Table 5 Average annual yield growth of food and non-food cash crops Indonesia
Commodity Unit 1991-95 1996-00 2001-05 2006-10 2011-13
Food crops
Rice 02 03 08 19 09
Maize 12 42 46 52 30
Cassava -06 15 50 49 36
Mung beans -03 -67 44 23 -02
Soybeans 04 17 11 11 12
Groundnuts -34 58 15 16 02
Vegetables a 93 -08 35 -17 -68
Cash crops
Rubber na -01 45 58 48
Crude palm oil na -72 108 -06 12
Palm kernel na -104 120 08 -10
Cocoa na 05 143 21 -30
Coffee na 24 14 62 37
Tea na 02 30 -05 -11 a Vegetable data available to 2012 Source FAOSTAT Food and Agriculture Organization of the United Nations (FAO 2015)
With reduced scope for expansion in agricultural production through both conversion of forest land and increased use of fertilisers and chemicals future agricultural productivity growth is likely to be achieved through the more efficient use of inputs The dominance of smallholdings remains a constraint to achieving higher agricultural productivity growth in future as small plots impede the implementation of more productive practices This is compounded by inefficient fertiliser use limited mechanisation and an inadequate supply of other important inputs such as high-yielding seeds irrigation systems extension services and access to credit Addressing these issues will be key to future productivity trends
17
4 Indonesian agricultural and food policies
The objectives of Indonesias agricultural policy as stated by the Indonesian Ministry of Agriculture in 2010 are to
1) achieve food self-sufficiency
2) enhance diversification of production and consumption
3) raise the competitiveness and value added of production and
4) increase farmersrsquo welfare (OECD 2012b)
To achieve its objectives the Indonesian Government intervenes in the farm sector with multiple policy instruments The government also implements policies to protect consumers from fluctuations in prices of key food products such as wheat rice and vegetable oils and to insulate domestic producers from foreign competition Food for consumers is subsidised which effectively maintains the price of food within a narrow price band Producers benefit from tariffs applied to imported food which keep the price of domestically produced food competitive with imports Additionally producers are directly supported by government food purchases at guaranteed prices and subsidies on farm inputs such as fertiliser seed and farm equipment
Policies to support agricultural production Reference prices and import restrictions The Indonesian Government sets reference prices for rice sugar and beef which it aims to maintain through various policy instruments
On average around 70 per cent of domestic rice production is consumed within the farming household (OECD 2012b) The remainder is sold through either private or government-run channels such as Indonesias National Food Logistics Agency known as Badan Ursan Logistik (BULOG) BULOG purchases a limited amount of rice at the reference price to fulfil two objectives
1) stockholding for emergency purposes and
2) redistribution as part of the consumer subsidy programme Raskin (discussed below) (OECD 2012b)
In 2010 BULOG procured around 6 per cent of total domestic rice production equivalent to around 20 per cent of all marketed rice (OECD 2012b)
For sugar the government supports the producer price by imposing legal requirements on domestic sugar millers who control the domestic sugar market Sugar millers are required to purchase 75 per cent of their sugar cane requirements from domestic sugar cane growers and to pay growers a government-determined price
The Indonesian rice and sugar industries are also protected by import restrictions Companies that import rice and sugar are required to support the domestic industry by buying domestically produced product if the mill price falls below the reference price
18
For beef and live cattle imports the Indonesian Government sets a reference price which it aims to achieve by managing import volumes through an import permit system Since 2014 the reference price has been 76 000 rupiah (A$720) a kilogram Under the system import permits are not issued if domestic beef prices fall below the reference price (ABARES 2013) Weight restrictions on cattle imports also usually apply limiting imports to young lighter cattle destined for feedlots
The Indonesian Government also restricts imports of other commodities such as soybeans maize horticulture certain processed foods and animals and animal products (including fresh chilled and frozen meat and eggs) Importing these commodities is generally not permitted if the Ministry of Trade considers it will cause injury to the domestic industry (WTO 2013) Companies seeking to import these commodities are required to gain approval from the Indonesian Ministry of Trade (OECD 2012b)
Tariffs Tariffs are applied to most imported food products in Indonesia However they are relatively low and are not a major policy instrument used to protect domestic industries The average applied agricultural tariff was 53 per cent in 2010 (OECD 2012b) Around 85 per cent of agricultural imports are subject to tariffs between zero and 5 per cent with almost 66 per cent entering duty free All agricultural tariffs are ad valorem except for rice and sugar which have specific tariffs (OECD 2012b)
While applied tariffs are low bound tariff rates or the ceiling rate that can be applied under World Trade Organisation rules remain high (Figure 11) On average the bound rate on agricultural products is 47 per cent (OECD 2012b) The highest bound tariff is 210 per cent for milk powders although the applied rate is just 5 per cent Rice has a bound tariff of 160 per cent and an applied specific rate of 450 rupiah a kilogram (equivalent to an ad valorem tariff of 10 per cent when using the average export price for 15 per cent broken rice from Thailand in 2010) (OECD 2012b)
Figure 11 Average bound and applied tariffs by product groups
Source OECD Review of Agricultural Policies Indonesia 2012 Organisation for Economic Co-operation and Development (OECD 2012b)
0
20
40
60
80
Fruit and vegetables
Sugars and confectionery
Cereals Dairy products
Animals and animal
products
Oilseeds fats and oils
Average bound tariff
Average applied tariff
19
Input subsidies The Indonesian Government supports farmers by subsiding inputs such as fertiliser seeds and ad hoc products including power tools and rice milling units Fertiliser support is the largest component of budgetary support for agriculture accounting for 37 per cent in 2008ndash09 (OECD 2012b) Not all farmers receive input subsidies because eligibility requirements apply in many cases For example subsidised fertiliser is only available to farmers producing on less than 2 hectares
Policies to support consumers Price intervention The Indonesian Government intervenes in the domestic market for wheat flour maize and cooking oil when it considers retail prices too high for the poor It does this using a broad range of measures from simply asking manufacturers and wholesalers to be socially responsible with their pricing to purchasing these products and distributing them directly to poor households (OECD 2012b) Another policy often used is the government covered value tax under which the government waives the existing 10 per cent value added tax on the final price of certain food items For example the government has used this policy to reduce the price of non-branded cooking oil since 2007 In 2010 this policy cost the Indonesian Government around 250 billion rupiah (A$299 million)
Food subsidies The Indonesian Government operates a targeted rice subsidy programme known as Raskin to combat food insecurity The programmes objective is to make available a set quantity of rice (procured by BULOG) at a subsidised price to Indonesias poorest households on a monthly basis Raskins intention is to provide rice to those on official lists of households living under or near the national poverty line (World Bank 2012b) The poverty line in 2014 was around 318 500 rupiah per person a month in urban areas and 286 100 rupiah per person a month in rural areas (Indonesian Central Bureau of Statistics 2015a) Those with incomes within 20 per cent of the poverty line are defined as being near the poverty line (World Bank 2012b)
Despite the objectives of Raskin to target the most vulnerable since allocations of Raskin rice to households are decided by local authorities poor and non-poor households alike benefit from the programme In 2010 around 175 million households received Raskin rice (OECD 2012b) at a cost of around 14 trillion rupiah (A$17 billion) to the Indonesian Government (Figure 12) Between 2005 and 2010 the subsidised price was 1 600 rupiah (A$019) a kilogram representing about 20 to 25 per cent of the average market price (World Bank 2012a)
The quantity of rice per household the subsidised price the number of months a year that rice is distributed and the classification of the poorest households have all been altered over the period of the programme For example monthly allocations per household have been set as low as 10 kilograms and as high as 20 kilograms over the programme period although households rarely benefit from the full amount of the allocation (OECD 2012b World Bank 2012a)
20
Figure 12 Raskin rice distribution and budgetary cost
Source OECD Review of Agricultural Policies Indonesia 2012 Organisation for Economic Co-operation and Development (OECD 2012b)
Implications of agricultural and food policies Public expenditure on Indonesian agriculture has increased under its current policy settings In 2009 public spending was around 615 trillion rupiah (A$75 billion) This was equivalent to 56 per cent of total government expenditure compared with 27 per cent in 2001 (World Bank 2011) The fertiliser subsidy and Raskin have been the biggest drivers of increased spending over this period
In addition to the direct budget cost of Indonesias agricultural and food policies there have also been allocative effects Indonesian policies tend to focus on rice maize and sugar leading to increased production of these commodities and improved availability from domestic sources However expansion of these crops has come at the expense of horticulture and other commodities in which Indonesia has a comparative advantage such as natural rubber cocoa and spices (World Bank 2011)
The administration of some support programmes the fertiliser subsidy in particular is inefficient (Sudaryanto 2014) As discussed in Chapter 3 subsidising fertiliser companies in an environment where quantities prices and distribution channels are regulated reduces incentives for these companies to effectively compete This inefficiency has resulted in the under-production of fertiliser leading to shortages At the same time the artificially low price has led to an over-reliance on fertiliser by producers to increase yield rather than using other methods such as improved seeds (World Bank 2011)
4000
8000
12000
16000
2000 2002 2004 2006 2008 20100
1
2
3
4
Expenditure on RASKIN
Quantity of rice distributed (right axis)
Million tonnes
Billionrupiah
21
5 Simulation results Baseline assumptions The objective in this analysis is to identify and quantify projected changes in Indonesian demand for a range of agrifood commodities over the longer term across urban and rural households An updated version of the ABARES agrifood model (Linehan et al 2012a) is used to investigate these potential trends The model has been modified to include Indonesias consumer subsidy policy (Raskin) and a re-aggregation of some country and commodity groups to allow more detailed analysis
Indonesia has a comparative advantage in the production of many cash crops and non-food agricultural commodities that are not included in the ABARES agrifood model such as natural rubber copra palm kernels coffee cocoa and spices (FAO 2013) In Indonesia the production of these commodities competes with food commodities for resources despite a policy environment targeted at food production and food self-sufficiency
Given Indonesias limited supply of arable land and the quality and availability of its water supply the capacity of the domestic agricultural sector to meet the growing demand for food in Indonesia will depend heavily on improvements in productivity Total factor productivity (TFP) growth in Indonesian agriculture is estimated to have averaged 154 per cent a year since 1961 It is expected that yield growth in Indonesia will not decline from this average annual rate in the future because the potential for productivity growth remains significant However nor is it expected to continue at the relatively high rates estimated for the period 2001 to 2009 which were made possible from the expansion of agriculture into higher-value non-staple commodities on newly deforested land and a significant increase in the use of chemical fertilisers (see Chapter 4)
Productivity growth since 2010 is estimated to have slowed from the decade 2001ndash2009 The Indonesian Governments policy initiative Reducing Emissions from Deforestation and Forest Degradation (REDD) in 2010 and declaration of a two-year Forest Moratorium in 2011 have slowed the rate of forest conversion to crop land (OECD 2012b) In addition agricultural production continues to be constrained by the issues outlined in Chapter 4 (including decreasing returns to scale for chemical inputs lack of widespread mechanisation and deteriorating resource base) With ongoing competition between the production of food crops and non-food cash crops (in which Indonesia has a comparative advantage) and little prospects in the foreseeable future for major policy changes on food consumption and production TFP growth for food crops in Indonesia is assumed to average 154 per cent a year between 2009 and 2050 This is close to the forecast by Ludena et al (2007) of 152 per cent a year to 2040 (FAO 2013 USDAndashFAS 2014)
Growth rates for TFP for individual commodities have in the past shown similar patterns to growth in yields Assumptions of TFP growth rates for individual commodities are therefore derived by apportioning the assumed rate for the whole of agriculture by historical growth in the yields of each commodity (Table 6)
22
Table 6 Average annual TFP growth rate by industry in Indonesia 2009 to 2050
Industry
Rice 214
Maize 337
Coarse grains 335
Other cereals 239
Oilseeds 388
Vegetables 232
Fruit 303
Beef 032
Sheep and goat meat 144
Poultry 144
Eggs 135
Dairy 215
All Agriculture 154 Source ABARES model assumption
In the reference case no change to Indonesias market support policies is assumed over the projection period On the production side these include the principal forms of market support of state trading input subsidies and import restrictions Additionally the Indonesian Governments minimum support prices for rice and wheat are maintained in real terms as are other ad hoc interventions on a range of agricultural commodities
The government support received by consumers through the consumer subsidy policy Raskin is also maintained in real terms over the projection period (discussed in Chapter 4)
The baseline projections determined in the agrifood model for Indonesia are also dependent on a set of assumptions discussed in Chapters 2 and 3 To summarise
bull population growth is assumed to average 07 per cent a year between 2010 and 2050
bull the proportion of the population in urban areas is assumed to increase from 50 per cent in 2009 to 72 per cent by 2050
bull average annual GDP growth in Indonesia is assumed to average 53 per cent a year between 2010 and 2030 before weakening between 2030 and 2050 to average 34 per cent a year (Table 1)
bull average annual income growth is assumed to be 56 per cent a year in urban areas and 21 per cent a year in rural areas
agricultural productivity in Indonesia is assumed to continue to increase according to the growth estimates provided in Table 6
The population is divided into two income stratamdashurban income and rural income households Across these two household types the income growth assumptions to 2050 for urban and rural areas are based on historical income data from the Indonesian Central Bureau of Statistics (2011) These data demonstrate that not only is average urban income higher than average rural income but with urbanisation average income growth in urban areas has also been higher than
23
in rural areas This has been the result of a relatively faster rate of economic development and higher wages which have stemmed from the growth in the manufacturing and services sectors prevalent in urban areas The model assumes this trend in income growth will continue to 2050 Indonesian household food consumption data in the base year of the model are from the Indonesian Central Bureau of Statistics (2014) and Widarjono (2012) These data were used as the basis in the model to project food consumption across urban and rural households to 2050
In the model total and per person Indonesian food consumption and total urban and rural food consumption is apparent consumption which reflects the total use of agrifood products (food feed and industrial use) In contrast per person urban and rural consumption is direct food consumption only it excludes feed use and industrial use of agrifood products to better reflect changes in diets
Consumption The real value of total food consumption in Indonesia (including food feed and industrial use) is projected to quadruple between 2009 and 2050 to US$327 billion (in 2009 US dollars) The largest increases are for meat dairy products fruit and vegetables as real incomes increase (Figure 13) Together these commodities account for two-thirds of the projected rise in the real value of food consumption
Figure 13 Consumption of selected agricultural commodities Indonesia
Note Starchy staples include pulses yams potatoes and cassava Source ABARES model output
Between 2009 and 2050 the real value of Indonesian beef consumption is projected to rise more than 14 times to US$35 billion (in 2009 US dollars) dairy products ten times to almost US$9 billion and fruit and vegetables more than three times to US$50 billion and US$25 billion respectively For many commodities the value of consumption in 2050 is projected to rise from a very low base reflecting high poverty rates and a large rural population in 2009 By 2050 72 per cent of the population is projected to live in urban centres with higher incomes than the
10 20 30 40 50 60
Wheat
Sheep and goat meat
Dairy
Sugar
Oil crops
Rice
Vegetables
Starchy staples
Beef
Poultry
Fruit
2050
2009
Billion(2009 US$)
552
66
231
1311
269
1319
256
246
935
1340
113
24
rural cohort It is this expected transition of the population and income growth that drive the magnitude of projected consumption growth for many commodities Despite these large increases Indonesias per person food consumption in 2050 is projected to remain below that of China for many commodities (Hamshere et al 2014)
For cereals oil crops and starchy staples (pulses potatoes yams and cassava) consumption is also projected to increase Between 2009 and 2050 the real value of rice consumption is projected to rise by 66 per cent to nearly US$23 billion (in 2009 US dollars) maize by 182 per cent to US$8 billion oil crops by 246 per cent to US$22 billion and starchy staples by 256 per cent to almost US$29 billion Over this period the real value of sugar consumption is projected to rise more than six times to US$14 billion (in 2009 US dollars)
The projected rise in consumption of cereals oil crops and starchy staples is driven by a number of factors First cereals and starchy staples (such as cassava) are relatively affordable foods particularly for low and middle income consumers whose populations are projected to rise Although both cereals and starchy staples will remain important components of Indonesian diets to 2050 their relative contribution will decline as diets become more diversified with greater amounts of meats dairy products and fruit and vegetablesmdashthe continuation of a trend that began around 1990 (Figure 5)
The projected rise in consumption of cereals oil crops and starchy staples is also driven by feed requirements which will increase as the demand for meat protein rises to 2050 As discussed in Chapter 3 about 50 per cent of domestic maize production is used as feed Rice bran also comprises about 15 per cent of total Indonesian feed consumption Soybean meal comprises between 15 per cent and 20 per cent of total livestock feed all of which is imported Rapeseed meal can be used as a partial substitute for soybeans and it too is entirely imported In 2050 it is projected that feed use will account for around 42 per cent of total maize consumption 43 per cent of total oil crop consumption and 44 per cent of total starchy staple consumption a larger proportion of which will need to be imported compared with 2009
Urban and rural consumption In 2050 71 per cent of Indonesias population is projected to live in urban areas compared with 54 per cent in 2015 (United Nations Population Division 2014) By 2050 Indonesian consumers are projected to have more diverse diets with greater consumption of meat dairy products fruit and vegetables
In this section the results for total urban and rural consumption reflect apparent consumption However per person rural and urban consumption is direct food consumption only Feed use and industrial use of the agrifood products are excluded in the per person results in order to better understand the projected change in diets
High value commodities Urban consumers account for most of the growth in consumption of meat dairy products fruit and vegetables over the projection period because of rising urban populations and incomes Between 2009 and 2050 the real value of urban beef consumption is projected to rise more than 18 times to US$34 billion (in 2009 US dollars) Consumption of dairy products is projected to rise by more than 14 times to more than US$8 billion and fruit and vegetables more than four times to US$43 billion and almost US$21 billion respectively (Figure 14)
25
Figure 14 Urban consumption of selected agricultural commodities Indonesia
Source ABARES model output
In per person terms the value of urban beef consumption is projected to rise more than nine times between 2009 and 2050 dairy more than seven times and fruit and vegetables to more than double However consumption of rice is projected to fall by 4 per cent While these increases are large Indonesias urban per person consumption in 2050 is still projected to be lower than that of China in the same year for many commodities including vegetables (73 per cent lower) oilseeds (12 per cent) dairy products (41 per cent) and sheep and goat meat (24 per cent) In contrast Indonesias urban per person consumption is projected to be higher than Chinas for beef (52 per cent higher) sugar (400 per cent) cereals (23 per cent) and starchy staples (14 times higher) (Hamshere et al 2014) For beef higher Indonesian per person consumption relative to China in 2050 reflects the dominance of beef in Indonesian diets by that time compared with China where pig meat consumption is significant Similarly the projected rise in per person consumption of starches in Indonesia mainly reflects higher consumption of cassava a culturally important food crop
For rural consumers total growth in consumption of meat dairy products fruit and vegetables is lower than for urban households This can be attributed to relatively lower rural incomes and a decline in the absolute size of the rural population Between 2009 and 2050 total rural beef consumption is projected to rise by 95 per cent to more than US$1 billion (in 2009 US dollars) dairy products by 75 per cent to US$05 billion fruit by 41 per cent to almost US$7 billion and vegetables by 42 per cent to almost US$5 billion (Figure 15)
20 40 60
Wheat
Sheep and goat meat
Dairy
Sugar
Oil crops
Rice
Vegetables
Starchy staples
Beef
Poultry
Fruit
Billion(2009 US$)
387
1724
1734
426
875
370
547
1349
Total food consumption
1761
91
173
50 100 150 200
Wheat
Sheep and goat meat
Dairy
Sugar
Oil crops
Rice
Vegetables
Starchy staples
Beef
Poultry
Fruit
2009 US$
145
819
824
165
391
137
226
630
Per person consumption
837
-4
38
26
Figure 15 Rural consumption of selected agricultural commodities Indonesia
Source ABARES model output
Between 2009 and 2050 rural per person consumption of each of the agrifood commodity groups is projected to change by a similar magnitude as urban consumption In value terms rural per person consumption of beef is projected to rise by 162 per cent dairy products by 135 per cent fruit by 90 per cent and vegetables by 92 per cent Similar increases are projected for rice (96 per cent) wheat (128 per cent) and starchy staples (116 per cent)
Again despite these significant increases rural per person consumption in Indonesia is projected to be lower than that of China in 2050 for all products except sugar which is projected to be 117 per cent higher For all other commodity groups rural per person consumption is projected to be lower than in China including sheep and goat meat (85 per cent lower) dairy (54 per cent) starches (32 per cent) cereals (56 per cent) and vegetables (86 per cent)
For both rural and urban consumers the rise in the real value of total food consumption in 2050 is principally the result of an increase in the quantity consumed rather than a projected significant rise in the real price This is especially pronounced in urban households For example between 2009 and 2050 beef consumption by urban households is projected to rise by more than 15 times and sheep and goat meat by 13 times In contrast rural beef consumption over this period is projected to rise by 64 per cent and sheep and goat meat by 44 per cent
Projected consumption growth of cereals and starchy staples between 2009 and 2050 is most pronounced in urban areas Rising urban consumption of these commodities is largely the result of population growth Urban consumption of wheat is projected to rise by 173 per cent to around US$2 billion (in 2009 US dollars) rice by 91 per cent to US$9 billion and starchy staples (which includes pulses potatoes yams and cassava) by 426 per cent to US$13 billion
Rural consumption of cereals and starchy staples is projected to rise despite a falling rural population As incomes rise towards 2050 the relatively affordable prices of these commodities will drive rural consumption Between 2009 and 2050 rural consumption of wheat is projected
2 4 6 8 10
Wheat
Sheep and goat meat
Dairy
Sugar
Oil crops
Rice
Vegetables
Starchy staples
Beef
Poultry
Fruit
Billion(2009 US$)
94
95
61
96
42
101
Total consumption
41
75
98
45
69
50 100 150 200
Wheat
Sheep and goat meat
Dairy
Sugar
Oil crops
Rice
Vegetables
Starchy staples
Beef
Poultry
Fruit
2050
2009
2009 US$
90
161
162
116
165
92
170
135
Per person consumption
166
96
128
27
to rise by 69 per cent to US$1 billion (in 2009 US dollars) rice by 45 per cent to almost US$9 billion and starchy staples by 61 per cent to US$3 billion
Production and trade The real value of Indonesias total agrifood production (which includes production for food feed and industrial use) is projected to more than double from US$81 billion in 2009 to US$173 billion in 2050 (in 2009 US dollars) This increase is driven by a higher value of production (in 2009 US dollars) of beef (up 209 per cent) poultry (187 per cent) starchy staples (115 per cent) vegetables (92 per cent) fruit (78 per cent) and rice and palm oil (up 77 per cent each) (Figure 16) The value of maize production divided almost equally between feed and food use is projected to increase by 78 per cent
Figure 16 Production of selected agricultural commodities Indonesia
Source ABARES model output
For some agricultural products such as rice and beef rising production partly reflects domestic policies that favour their production For example the real value of rice production between 2009 and 2050 is projected to rise by 77 per cent because of the assumption that producers continue to receive a minimum support price and input subsidies Indonesia is projected to switch from being an importer to an exporter of rice by 2050 The real value of Indonesias rice exports in 2050 is projected to be around US$09 billion (in 2009 US dollars)
The real value of Indonesias palm oil production is projected to rise significantly in line with strong export demand and Indonesias comparative advantage in its production Between 2009 and 2050 Indonesias production of palm oil is projected to rise by US$13 billion to US$30 billion an increase of 77 per cent Over this period palm oil exports are projected to rise by 40 per cent to US$18 billion
10 20 30 40
Sheep and goat meat
Dairy
Sugar
Palm oil
Rice
Vegetables
Starchy staples
Beef
Poultry
Fruit
2050
2009
Billion(2009 US$)
78
187
209
115
92
77
77
76
115
361
28
Imports For some agricultural commodities such as rice and palm oil the rise in consumption by 2050 is projected to be met largely by a rise in domestic production However for most agrifood commodities production is projected to increase at a slower rate than consumption As a result food and feed imports will be an increasingly important component of Indonesias food supply towards 2050 The real value of Indonesias total agrifood imports is projected to rise more than 20 times from 2009 to US$152 billion (in 2009 US dollar terms) in 2050
By 2050 Indonesia is projected to import a wide range of horticultural products Given rising domestic demand the real value of Indonesiarsquos fruit and vegetable imports is projected to rise to US$25 billion and US$11 billion in 2050 respectively (in 2009 US dollars Figure 17) On this basis the share of imports in total Indonesian fruit consumption will rise from 3 per cent in 2009 to 53 per cent in 2050 (Figure 18) For vegetables it will rise from 9 per cent in 2009 to 47 per cent in 2050
Figure 17 Trade of selected agricultural commodities Indonesia
Source ABARES model output
-30 -20 -10 0 10 20 30
Wheat
Sheep and goat meat
Dairy
Sugar
Rice
Beef
Starchy staples
Vegetables
Fruit
2050
2009
Billion (2009 US$)
Exports Imports
Palm oil
29
Figure 18 Import share of total consumption Indonesia
Source ABARES model output
Lower-income growth scenario The baseline projections for Indonesian agrifood consumption production and trade to 2050 are reliant on the underlying assumptions presented at the beginning of this chapter Chief among these are the OECD (2012a) assumptions for Indonesian GDP growth to 2050 presented in Chapter 2 (Table 1 and Table 7) If Indonesia were to realise a lower level of income growth agrifood demand growth would be expected to be lower The World Bank projects that Indonesian GDP growth in each decade to 2050 will be markedly lower than the OECDs projections (World Bank 2015 Table 7) This scenario examines the potential effect on Indonesian agrifood consumption and import demand if GDP and hence income growth were slower over the projection period as suggested by the World Bank All other variables from the reference scenario are held constant
Table 7 Indonesia GDP growth projections 2010 to 2050
Period Baseline 1991-2010
2011-2020 2021-30 2031-40 2041-50
OECD average annual growth ()
440 530 530 340 340
World Bank average annual growth ()
440 350 350 225 225
Source OECD 2012a World Bank 2015
Results In this scenario lower economic and income growth throughout the projection period results in GDP in 2050 that is 44 per cent lower than the reference case Because agrifood consumption is sensitive to changes in income the total value of agrifood consumption in 2050 (in 2009 US dollars) is 10 per cent less than in the reference case (Figure 19) Weaker economic growth most
Fruit Vegetables Starchy staples
Beef Poultry Sugar Maize Dairy Sheep and goat meat
Wheat
10
20
30
40
50
2050 Imports
2050 Domestic production
2009 imports
2009 Domestic production
53
3
4743
86
8183
1007091
9
75846723
6
100
Billion(2009 US$)
21
50
30
strongly affects urban areas where average annual income growth in the reference case was assumed to be more than double that of rural areas As a result demand for high-value products such as meat and dairy products declines significantly Many of these products are imported In 2050 the total projected value of beef consumption (in 2009 US dollars) is 17 per cent lower than in the reference case and poultry and milk products are each 14 per cent lower The real value of consumption for many domestically produced products such as starches and maize also declines but by no more than 10 per cent for any single commodity
Weaker consumption growth leads to lower import growth over the projection period particularly for high-value commodities The total value of imports in 2050 is 16 per cent lower in this scenario compared with the reference case with the import share of total consumption 5 percentage points lower than the reference case at 42 per cent (Figure 19) Beef imports are projected to be 20 per cent lower than the reference scenario sheep and goat meat 26 per cent lower and dairy products 16 per cent lower Fruit and vegetable imports are 12 per cent and 19 per cent lower respectively
Figure 19 Agrifood consumption in 2050 under lower income growth assumption
Source ABARES model output
0 100 200 300 400
Low income scenario
Baseline case
Domestic production
Imports
Billion(2009 US$)
4258
53 47
31
6 Conclusion Continued strong income and population growth combined with greater urbanisation are driving Indonesias increasing demand for not only more food but for a wider variety of foods This demand growth is projected to be met by increases in both domestic production and imports
Assuming no major changes to Indonesias existing agricultural policies to 2050 the real value of food consumption in Indonesia is projected to increase more than four times between 2009 and 2050 The increase will be characterised by a move towards more diverse diets with higher intake of meat dairy products fruit and vegetables Between 2009 and 2050 the real value of beef consumption is projected to rise more than 14 times dairy tenfold and fruit and vegetables to more than triple These projected increases are from a relatively low base and are driven by a rise in the quantities consumed rather than any significant projected rise in real prices To support this rise in demand imports of many agrifood commodities are projected to increase to 2050
The contribution of meat dairy products fruit and vegetables in Indonesian diets will increase more quickly than cereals and staples to 2050 While cereals and starchy staples will remain important components of Indonesian diets their relative contribution will declinemdashthe continuation of a trend that began around 1990
The upward trend in food demand is most pronounced among urban households whose income growth is assumed to be more than double that of rural households A declining rural population and relatively lower incomes will result in slower growth in food consumption compared with the urban population
For most agricultural commodities assuming no significant change to historical TFP growth for total agriculture production is projected to increase at a slower rate than consumption As a result food imports will be an important component of Indonesias food and feed supply towards 2050 The real value of Indonesias agrifood imports is projected to rise more than 20 times from 2009 to US$152 billion (in 2009 US dollar terms) in 2050
The projected significant increases in consumption and import demand for food in Indonesia are based on the assumption of relatively strong income growth to 2050 Under a lower growth scenario consumption of protein-based food products such as meat and dairy products is projected to be around 14 to 17 per cent lower than the reference case at 2050 While consumption of domestically produced products is also projected to be lower in 2050 in the lower-income-growth scenario the declines are less significant compared with the baseline case
While not included in the modelling in this report there is scope for increased production of non-food agricultural commodities and cash crops in Indonesia in which it has a comparative advantage These include natural rubber copra palm kernels coffee cocoa and spices Indonesias current policies on food self-sufficiency favour investment in food industries rather than the non-food and cash crops industries This has the effect of allocating resources away from their most efficient use
Because of their geographic proximity Australia and Indonesia are well placed to benefit from advancing bilateral agricultural trade Indonesia is an important market for Australian wheat sugar live cattle beef skim milk powder and horticultural products such as grapes and citrus
32
Stronger demand for these commodities and others in Indonesia will create further opportunities for Australian exporters
33
References ABARES 2013 Agricultural commodities September quarter 2013 Australian Bureau of Agricultural and Resource Economics and Sciences Canberra pp 85-87 available at agriculturegovauabarespublications
Afif S 2014 The Rising of Middle Class in Indonesia Opportunity and Challenge Paper presented at the International Policy Exchange Conference Segovia Spain 28 September available at umdcipeorgconferencesDecliningMiddleClassesSpainpapers_presentationshtml
Alexandratos N amp Bruinsma J 2012 World agriculture towards 20302050 the 2012 revision ESA Working paper no 12-03 Food and Agriculture Organization of the United Nations Rome available at faoorgeconomicesaesagen
Djajanegara A 1999 Local livestock feed resources in Livestock industries of Indonesia prior to the Asian financial crisis Food and Agriculture Organization of the United Nations Rome available at faoorgdocrep004AB986Eab986e06htmbm06 accessed 22 January 2015
Elias S amp Noone C 2011 The growth and development of the Indonesian economy Bulletin December Quarter Reserve Bank of Australia Sydney available at rbagovaupublicationsbulletin2011dec4html
FAO 2015 lsquoFAOSTATrsquo Food and Agriculture Organization of the United Nations Rome available at faostat3faoorghomeE accessed 26 October 2015
mdashmdash 2013 Indonesia Food and Agriculture Organization of the United Nations Rome available at faoorgdocrep005y4632ey4632e0lhtm
mdashmdash2012 GeoNetwork Food and Agriculture Organization of the United Nations Rome available at faoorggeonetworksrvenmainhome accessed 15 February 2014
mdashmdash 2005 Fertiliser use by crop in Indonesia Food and Agriculture Organization of the United Nations Rome available at faoorgdocrep008y7063ey7063e00htm
Fuglie K 2012 lsquoProductivity growth and technology capital in the global agricultural economyrsquo in Fuglie KO Wang SL amp Ball VE (eds) Productivity growth in agriculture an international perspective CAB International Oxfordshire UK
mdashmdash2010 lsquoSources of growth in Indonesian agriculture Journal of Productivity Analysis vol 33 no 3 pp 225-240
Fuglie K amp Rada N 2014 International Agricultural Productivity United States Department of Agriculture Economic Research Service Washington DC available at ersusdagovdata-productsinternational-agricultural-productivityaspxU089bfmSzkd
Global Business Guide Indonesia 2012 Agriculture in Indonesia available at gbgindonesiacomenagriculturesector_overviewphp
Glover J 2011 lsquoAn international retailerrsquos perspectiversquo Paper presented at The Crawford Fund 2011 Annual Parliamentary Conference Parliament House Canberra 14 August available at crawfordfundorgevents2011-parliamentary-conference
34
Hamshere P Sheng Y Moir B Syed F amp Gunning-Trant C 2014 What China wants Analysis of Chinas food demand to 2050 ABARES research report Canberra March available at agriculturegovauabarespublications
IMF 2015 World Economic Outlook Database available at imforgexternalpubsftweo201302weodataindexaspx accessed 26 October 2015
Indonesian Central Bureau of Statistics 2015a Poverty available at bpsgoidSubjekviewid23subjekViewTab3|accordion-daftar-subjek1 accessed 27 October 2015
mdashmdash2015b Consumption and expenditure available at bpsgoidSubjekviewid5subjekViewTab3|accordion-daftar-subjek1 accessed 27 October 2015
mdashmdash2015c Population 15 Years of Age and Over Who Worked by Main Industry 2004-2014 available at bpsgoidlinkTabelStatisviewid970 accessed 27 October 2015
mdashmdash2014 Consumption and expenditure available at bpsgoidSubjekviewid5subjekViewTab3|accordion-daftar-subjek1 accessed 20 February 2014
mdashmdash2011 Total income by Household Group (billion rupiahs) available at bpsgoidSubjekviewid5subjekViewTab3|accordion-daftar-subjek1 accessed 1 August 2014
Khajali F amp Slominski BA 2012 lsquoFactors that affect the nutritive value of canola meal for poultryrsquo Poultry Science vol 91 no 10 pp 2564ndash2575 available at psoxfordjournalsorgcontent91102564fullxref-ref-95-1
Linehan V Thorpe S Andrews N amp Beaini F 2012a Food demand to 2050 Opportunities for Australian agriculture paper presented at 2012 ABARES Outlook conference Canberra 6ndash7 March available at daffgovauabarespublications
mdashmdash 2012b Food demand to 2050 Opportunities for Australian agriculturemdashalgebraic description of agrifood model technical annex to ABARES Outlook conference paper Canberra May available at daffgovauabarespublications
Ludena C Hertel T Preckel P Foster K and Nin A 2007 Productivity growth and convergence in crop ruminant and nonruminant production measurement and forecasts Agricultural Economics 37 available at onlinelibrarywileycomdoi101111j1574-0862200700218xabstract
McKinsey Global Institute 2012 The archipelago economy Unleashing Indonesias potential September Jakarta available at mckinseycominsightsasia-pacificthe_archipelago_economyashx
OECD 2013 Global Food Security Challenges for the Food and Agricultural System Organisation for Economic Cooperation and Development Paris available at oecd-ilibraryorgagriculture-and-foodglobal-food-security_9789264195363-en
mdashmdash2012a Looking to 2060 A global vision of long-term growth Economics Department Policy Notes no 15 Organisation for Economic Cooperation and Development Paris November available at oecdorgecomonetarypolicy-noteshtm
35
mdashmdash2012b OECD Review of Agricultural Policies Indonesia 2012 Organisation for Economic Cooperation and Development Paris available at oecd-ilibraryorgagriculture-and-foodoecd-review-of-agricultural-policies-indonesia-2012_9789264179011-en
OECDndashFAO 2014 OECDndashFAO Agricultural Outlook 2014 Organisation for Economic Cooperation and Development Paris available at oecd-ilibraryorgagriculture-and-foodoecd-fao-agricultural-outlook-2014_agr_outlook-2014-en
Osorio C Abriningrum D Armas E amp Firdaus M 2011 Who is benefiting from fertilizer subsidies in Indonesia Policy Research Working Paper 5758 World Bank Washington DC available at elibraryworldbankorgdoipdf1015961813-9450-5758
Rabobank 2013 Indonesia - islands of opportunity Agriculture in Focus Rabobank Food amp Agribusiness Research and Advisory Australia and New Zealand Spring Sydney
Shahaf E 2009 Agriculture in Indonesia Asia Technology Consulting available at techasiaconsultingcomagriculture_in_indonesiahtml
Statistics Indonesia 2015 Gross Domestic Product at Current Market Prices By Industrial Origin (Billion Rupiahs) 2000-2014 available at bpsgoidlinkTabelStatisviewid1199 accessed 26 October 2015
Sudaryanto T 2014 Fertilizer subsidy policy in Indonesia impacts and future perspectives Food and Fertiliser Technology Center for the Asian and Pacific Region Asia-Pacific Information Platform on Agricultural Policy (AP) available at apfftcagnetorgap_dbphpid=365
The Canadian Trade Commissioner Service 2011 lsquoAn Investment Guide to Indonesia available at tradecommissionergccaengdocumentjspdid=133467toc38
United Nations Population Division 2015 World population prospects the 2015 revision United Nations New York available at esaunorgunpdwppindexhtm accessed 12 August 2015
mdashmdash2014 World urbanisation prospects the 2014 revision United Nations New York available at esaunorgunpdwup accessed 19 March 2015
USAID nd lsquoIndonesia ndash Property rights amp resource governancersquo USAID Country Profile available at usaidlandtenurenetindonesia
USDAndashFAS 2014 Indonesia grain and feed annual report 2014 GAIN Report no ID1407 1 April Foreign Agricultural Service United States Department of Agriculture Washington DC available at usdaindonesiaorgcat=10
Widarjono A 2012 Food and nutrient demand in Indonesia PhD thesis Oklahoma State University available at shareokorgbitstreamhandle112446547Department20of20Agricultural20Economics_48pdfsequence=1
World Bank 2015 Global Economic Prospects January 2015 Having fiscal space and using it World Bank Group Washington DC available at worldbankorgenpublicationglobal-economic-prospects
mdashmdash2014 World development indicators World Bank Washington DC available at dataworldbankorgdata-catalogworld-development-indicators
36
mdashmdash2013 Transport in Indonesia World Bank Washington DC available at goworldbankorgPF2AFG64V0
mdashmdash 2012a Raskin subsidised rice delivery Public expenditure review (PER) Social assistance program and public expenditure review no 3 World Bank Washington DC available at documentsworldbankorgcurateden20120215893857raskin-subsidized-rice-delivery
mdashmdash2012b Targeting poor and vulnerable households in Indonesia World Bank Washington DC available at documentsworldbankorgcurateden20120115879773targeting-poor-vulnerable-households-indonesia
mdashmdash2011 Indonesia Agriculture Public Expenditure Review 2010 World Bank Jakarta available at documentsworldbankorgcurateden20110919456223indonesia-agriculture-public-expenditure-review-2010
mdashmdash2010 Completing decentralization World Bank Jakarta available at documentsworldbankorgcurateden20100112012453completing-decentralization
mdashmdash2009 Investing in a more sustainable Indonesia Country Environmental Analysis Report No 50762-ID World Bank CEA Series East Asia and Pacific Region available at openknowledgeworldbankorgbitstreamhandle109863135507620v20Revis1ox0info10CEA1englishpdfsequence=1
mdashmdash2007 Horticultural producers and supermarket development in Indonesia World Bank Washington DC available at documentsworldbankorgcurateden2007068235822horticultural-producers-supermarket-development-indonesia
WTO 2013 Trade policy review Indonesia WTO Document WTTPRS278 World Trade Organisation Geneva available at wtoorgenglishtratop_etpr_etp378_ehtm
Yamauchi F 2014 Wage Growth Landholding and Mechanization in Agriculture Evidence from Indonesia World Bank Washington DC February available at openknowledgeworldbankorghandle1098617324
2
2 Drivers of food demand Food consumption at the national level relates to the size of the population and the amount of food consumed by each person Changes in per person food consumption as well as in the mix of foods consumed are largely influenced by growth in household incomes and by factors such as the age structure of the population lifestyle and the proportion of the population living in urban and rural areas This chapter discusses the contribution of these factors to the expected increase in Indonesian food demand to 2050
Population Indonesias population grew from just over 180 million in 1990 to more than 257 million in 2015 an average growth rate of 14 per cent a year (Figure 1) Under the medium-variant projection of the United Nations the population is expected to grow by an average of 06 per cent a year between 2010 and 2050 (United Nations Population Division 2015) At this rate the population would grow by some 65 million to reach 322 million in 2050
Figure 1 Indonesias population
Source World population prospects the 2015 revision United Nations Population Division (United Nations Population Division 2015)
Indonesias population growth during much of the past half century was partly the result of a significant decline in mortality rates Between 1950ndash55 and 2005ndash10 Indonesias crude death rate declined from 21 per 1 000 people to 7 per 1 000 people Between 1950ndash55 and 1970 the crude birth rate was high above 40 births per 1 000 people However it began to decline in about 1970 reaching 21 births per 1 000 people by 2005ndash10
The declining birth and death rates in the four decades to 2010 resulted in a significant shift in the age distribution of the population (Figure 2) In 1970 67 per cent of the population was aged under 30 by 2010 this group constituted 55 per cent of the population By 2050 it is projected to be only 41 per cent Conversely the proportion of the over-50s in the population was 11 per cent in 1970 and 16 per cent in 2010 and is projected to increase to 31 per cent by 2050
Million
50
100
150
200
250
300
350
400
1990 2000 2010 2020 2030 2040 2050
Estimates to 2015
Medium
High
Low
3
Compared with other Asian countries Indonesias population is relatively young (Elias amp Noone 2011) The proportion of people of working age (15 to 64) in the population is forecast to remain above 65 per cent beyond 2045 (United Nations Population Division 2015) and the absolute number of people of working age is also expected to continue to increase
Figure 2 Population distribution by age Indonesia
Source World population prospects the 2015 revision United Nations Population Division (United Nations Population Division 2015)
The changing age structure is likely to have an effect on patterns of food demand Nutritional requirements increase as children age to maturity and decline as adults age Older people generally consume less food and typically prefer more traditional foods
Urbanisation is an important determinant of consumer demand for food Urban dwellers typically have higher incomes than their rural counterparts and different dietary and shopping patterns Over the four decades from 1970 to 2010 Indonesias urban population expanded by an average of 45 per cent a year (Figure 3) The rural population grew more slowly than the urban population reaching a peak in 1995 Since 2010 the total number of urban residents has exceeded rural residents
Jakarta is by far Indonesias largest city with a population of just over 10 million (United Nations Population Division 2014) Jakarta has four times the population of the second-largest city Surabaya However most other cities are growing at faster rates than Jakarta In 2050 71 per cent of Indonesias population is projected to live in urban areas compared with 54 per cent in 2015 (United Nations Population Division 2014)
Million 10 20 30
0-4
10-14
20-24
30-34
40-44
50-54
60-64
70-74
80+
Age
grou
p
1970
Million 10 20 30
2010
Million 10 20 30
2050
4
Figure 3 Urban and rural population Indonesia
Source World urbanisation prospects the 2014 revision United Nations Population Division (United Nations Population Division 2014)
Incomes The Indonesian economy has grown consistently over the past two decades apart from the Asian financial crisis of 1998 (Figure 4) Indonesian GDP in constant prices almost tripled between 1990 and 2012 (IMF 2015) Average incomes per person in constant prices doubled over the same period
Figure 4 GDP growth in Indonesia
Source World Economic Outlook Database International Monetary Fund (IMF 2015)
10
20
30
40
50
60
70
80
90
Million
50
100
150
200
250
300
350
1970 1980 1990 2000 2010 2020 2030 2040 2050
Rural
Urban
Share of rural population (right axis)
-10
-5
0
5
10
1990 1995 2000 2005 2010
5
Indonesias economic growth has not been shared equally across the population Although the middle class (defined as those with daily expenditure of between US$2 and US$20 in 2005 purchasing power parity terms) expanded from around 25 per cent of the population in 2000 to 57 per cent in 2010 income inequality has increased (Afif 2014 Indonesian Central Bureau of Statistics 2015a) Income growth and income inequality both have important implications for food consumption The expansion of the middle class has been a significant factor behind the increase in Indonesias total food consumption However the rise in inequality implies there remains a considerable proportion of the population with low incomes and limited capacity to buy food
In the baseline projections presented in this report Indonesian GDP is assumed to grow according to OECD (2012a) projections (Table 1) Between 2011 and 2030 real GDP growth is assumed to increase at an average of 53 per cent a year before weakening between 2030 and 2050 to average 34 per cent a year Urban incomes are assumed to continue to grow faster than rural incomes over the period to 2050 averaging 56 per cent and 21 per cent a year respectively An alternative scenario of lower economic growth is also examined based on World Bank (2015) projections (see Chapter 5 Table 7)
Table 1 Indonesia GDP growth 2009 to 2050
1991-2010 2011-2020 2021-30 2031-40 2041-50
Average annual growth ()
44 53 53 34 34
Source Looking to 2060 A global vision of long-term growth Economics Department Policy Notes no 15 Organisation for Economic Co-operation and Development (OECD 2012a)
Food consumption Total food consumption in Indonesia has increased in response to rising incomes and population Between 1990 and 2013 total consumption of wheat fruit and milk each increased by more than 200 per cent (Figure 5) Consumption of vegetables more than doubled over the same period and meat consumption almost doubled Consumption of ricemdasha staple food in Indonesian dietsmdashincreased by only 32 per cent
6
Figure 5 Consumption of selected foods Indonesia
Source FAOSTAT Food and Agriculture Organization of the United Nations (FAO 2015)
Between 1990 and 2013 the average calorie intake per person in Indonesia increased by 19 per cent The contribution of starchy roots and pulses to individuals calorie intake declined while the contribution of fruit and vegetables meat and fish increased Average per person consumption of milk and other dairy products more than doubled but remained of limited significance
Poultry is the major source of meat in Indonesia accounting for over half the total meat consumed in 2013 (Figure 6) Pig meat constituted almost a quarter of total meat consumption in 2013 consumed by non-Muslim people Consumption of beef which ranks third has been increasing more slowly than chicken meat consumption because it is relatively more expensive (FAO 2015) Sheep and goat meat accounted for less than 5 per cent of total meat consumption
Million tonnes
5
10
15
20
25
30
35
40
1990 1992 1994 1996 1998 2000 2002 2004 2006 2008 2010 2012
Rice (milled equivalent)
Fruit
Vegetables
Wheat
Meat
Milk (excluding butter)
7
Figure 6 Total consumption of meats Indonesia
Source FAOSTAT Food and Agriculture Organization of the United Nations (FAO 2015)
On a per person basis Indonesias consumption of many food groups is relatively low This is because a high portion of its population lives at or near the poverty line Per person consumption of meat in 2011 was between 70 per cent and 80 per cent less than that of Japan the Republic of Korea China and many other ASEAN nations (Table 2) For dairy it was around 80 per cent less than that of Japan 56 per cent less than China 47 per cent less than the Republic of Korea and lower than other ASEAN countries For fruit and vegetables it was between 30 per cent and 65 per cent less than that of Japan and the Republic of Korea 74 per cent less than China and lower than other ASEAN countries These relatively low per person consumption levels underline the potential for sizable increases in per person food consumption as incomes rise
Table 2 International comparison of annual per person food consumption 2011
Country Meats kg
Dairy kg
Fruit and vegetables kg
Cereals kg
Japan 488 713 1524 1044
Republic of Korea 622 264 2888 1515
China 577 315 4178 1515
Malaysia 533 322 1131 1466
Philippines 345 145 1796 1577
Vietnam 576 151 1445 1670
Indonesia 129 139 1075 1906 Source FAOSTAT Food and Agriculture Organization of the United Nations (FAO 2015)
Diets of urban residents are usually different from their rural counterparts In 2013 Indonesias urban residents spent an average of 414 000 rupiah a month on food compared with 299 000 rupiah by rural residents (Indonesian Central Bureau of Statistics 2015b) Urban residents spent more than rural residents on meat fish eggs fruit and prepared (cooked and packaged) foods Rural residents spent more on cereals and tubers (Figure 7) with 24 per cent of their food budget devoted to cereals alone compared with only 15 per cent for urban residents
000 tonnes
200
400
600
800
1000
1200
1400
1600
1800
2000
1990 1992 1994 1996 1998 2000 2002 2004 2006 2008 2010 2012
Poultry meat
Pig meat
Bovine meat
Sheep and goat meat
8
Figure 7 Expenditure on food items urban and rural residents 2013 Indonesia
Source Indonesian Central Bureau of Statistics 2015b
Food marketing in Indonesia is also changing In the 1980s supermarkets occupied only a small niche in food retailing By the mid-1990s they were still confined to the urban upper income sector Supermarkets only began to spread quickly in Indonesia after 1998 By 2007 they accounted for about 30 per cent of overall retail food expenditure (World Bank 2007)
The development of supermarkets is typically associated with closer vertical coordination along value chains as the supermarkets maintain close relationships with their suppliers This often involves contractual arrangements with farmers or in the case of food imports with suppliers in other countries Asian supermarket chains have developed direct relationships with suppliers of fresh horticultural and dairy produce in the United States New Zealand and Australia (Glover 2011)
000 rupiah
20
40
60
80
100
120
140
Cere
als
Tube
rs
Fish
Mea
t
Eggs
and
milk
Vege
tabl
es
Legu
mes
Frui
ts
Oil
and
fats
Beve
rage
s
Misc
food
item
sPr
epar
ed fo
odan
dhellip
Urban
Rural
9
3 Production constraints in Indonesian agriculture
The agriculture sector is a key component of the Indonesian economy contributing about 14 per cent of Indonesias GDP in 2014 (Statistics Indonesia 2015) Thirty per cent of Indonesias land area is used for agricultural purposes and the sector employs 41 million people or 35 per cent of the nations work force The sector is a strong contributor to Indonesias trade with agricultural exports accounting for 24 per cent of the value of total merchandise exports in 2012 (World Bank 2014)
Indonesias agriculture is generally characterised by fertile volcanic soils and abundant renewable water resources High population density has resulted in a sector dominated by smallholdings Agricultural land area per person in Indonesia is low at just 022 hectares This is equivalent to a third of the world average (World Bank 2014) Challenges to agricultural production and productivity growth include the availability and quality of natural resources insecure land tenure underemployment of labour and lack of infrastructure
Resource constraints Land availability Indonesia is the worlds largest nation archipelago made up of 17 508 islands of which just over a third are inhabited Java is the most densely populated island accommodating more than half of Indonesias population (57 per cent in 2013) on only 7 per cent of the total land area (Map 1)
Map 1 Map of Indonesia
Source GeoNetwork Food and Agriculture Organization of the United Nations (FAO 2012)
About 30 per cent of Indonesias land area (545 000 square kilometres) is classified as agricultural land (World Bank 2014) Of this 43 per cent or 235 000 square kilometres is considered arable that is land under annual crops or any fallow or pasture land used for annual crops within any five-year period The remaining agricultural land is either devoted to plantation crops (such as oil palm coconut rubber coffee and sugar cane) or permanent pasture (natural or seeded grassland that remains unploughed for many years)
10
The islands of Java Bali and large parts of Sumatra are home to irrigated lowland rice-paddy terraces and upland rain fed farming The average size of farms producing rice and other food crops such as maize peanuts and cassava ranges from 03 hectares on Java to 14 hectares elsewhere (OECD 2013) Java produces around half of Indonesias rice Expansion of the lowland rice area in Java is limited because of increasing competition for land with other crops and non-agricultural uses such as industry uses housing and roads (FAO 2005)
The plantation and industrial crops sector dominated by oil palm coconut and natural rubber makes up 15 per cent of total crop area Large private and state-owned farms are involved in these perennial cropsmdashmainly in Kalimantan and Sumatra and mainly for producing oil palm and natural rubbermdashbut there are also many smallholders The average farm size in this sector is 2 600 hectares (OECD 2013)
Until 2010 growth in agricultural production relied largely on converting forested areas into agricultural land particularly to oil palm plantations In the past two decades millions of hectares were cleared for this purpose Just over half of Indonesias total land was classified as forest area in 2011 compared with 65 per cent in 1990 (Figure 8) Driving this trend has been the growing global demand for edible oils and the price competitiveness of palm oil relative to alternatives such as soybean oil (Rabobank 2013) Much of the deforestation is concentrated in Sumatra and Kalimantan
Figure 8 Land use in Indonesia
Note Share of total land area Source World Development indicators World Bank Group (World Bank 2014)
Many less populated islands remain densely forested and are home to forest and coastal communities that sustain themselves through agriculture hunting foraging and fishing (USAID nd) Indonesias Ministry of Forestry estimates of bush shrub grass and barren land across Indonesia total 22 million hectaresmdasharound half of which is located in Kalimantan and Papua McKinsey Global Institute (2012) estimates almost 7 million hectares of this land (much of which used to be in agricultural production but has since been abandoned) could be developed for agricultural production Alexandratos and Bruinsma (2012) project that between 2009 and 2050 total arable land in Indonesia will increase by 75 per centmdashan assumption used in the modelling in this report
20
40
60
80
100
1990 1993 1996 1999 2002 2005 2008 2011
Other
Agriculture
Forest area
11
Land degradation Indonesia is regularly described as being a highly fertile country but land quality varies across the archipelago The central islands have more fertile soils and hence are densely populated Agricultural land in Java in particular has benefited from high levels of mineral fertiliser application soil and water erosion control programmes and relatively good soil (FAO 2005) In contrast the soils of the outer less populated islands are characterised by highly weathered acidic soils that require higher fertiliser inputs to achieve the high crop yields obtained in Java and the other central islands Actual fertiliser use in the outer islands is generally lower than on Java resulting in soil nutrient depletion in the upland crop areas (FAO 2005)
Erosion and associated problems of nutrient depletion are minimal on Java because of the system of flat terracing and well-maintained irrigation schemes However in the lower-potential rain fed uplands where crops such as maize and cassava are produced on sloping hillsides erosion problems and nutrient depletion are more prevalent Where deforestation has occurred to make way for plantation crops loss of forest cover has led to watershed degradation silting of waterways flooding soil erosion and decline in soil quality and soil productivity (World Bank 2009)
Land tenure Land parcels in Indonesia are highly fragmented particularly on smallholder farms As land is passed down the generations it tends to become divided into smaller parcels (McKinsey Global Institute 2013) While the law requires that all land rights be registered most of these inherited parcels are unregistered less than 25 per cent of rural land parcel holders have been registered in the 40 years since land registration began (OECD 2012b) Additionally a large share of land off Java is communal rather than privately titled Land rights of these communities are often not formally recognised increasing the risk of conflict
The implications of the land tenure arrangements are that for large investors gaining access to land is a long and unclear process As a result only limited land rights are granted which compromises the extent to which production can increase (OECD 2012b) For smallholders unclear land tenure or nonexistence of certificated land registration compounds the difficulties of gaining access to credit from financial institutions This discourages investment in productivity-enhancing technology and biases farmers choices away from longer-term activities such as tree crops (World Bank 2010)
Fertiliser use The Indonesian Government maintains a ceiling price on fertiliser which depending on fertiliser type is between 50 per cent and 75 per cent lower than the market price (Sudaryanto 2014) Lower fertiliser prices are intended to encourage increased crop production particularly of rice The government provides a subsidy to fertiliser manufacturers to compensate them for selling fertiliser below market prices Despite the subsidy payment the incentives for fertiliser manufacturers to increase production and compete with one another are limited by government regulation of production quantities prices and locations where fertiliser can be sold (Osorio et al 2011)
The use of fertiliser is unevenly distributed across the archipelago Among food crops the highest application rates per hectare are for rice followed by maize and soybeans The lowest are for peanut and cassava The subsidy and resulting increase in fertiliser use led to more than a doubling of rice production between 1970 and 2000 Over that period total annual fertiliser
12
use increased from 635 000 tonnes to 59 million tonnes more than half of which was used to increase rice production (FAO 2005)
Fertilisers remain underused on plantation crops Large areas of plantation crops are owned and managed by smallholder farmers For many the lack of knowledge about appropriate fertilisation technology and the lack of reliable and timely access to the right fertilisers at village level lead to inadequate and unbalanced application (FAO 2005)
Apart from the budgetary burden subsidising domestic fertiliser prices results in inefficient fertiliser use at the farm level Studies in West Java report rice farmers applying levels of fertilisers higher than the recommended rates with some soil tests showing nutrient reserves had built up to high levels negatively affecting yields (FAO 2005 Osorio et al 2011)
Farm labour and mechanisation Indonesian agriculture is dominated by abundant labour in relation to available agricultural land contributing to the issue of small-scale production The agriculture forestry and fishing sector employs around 40 million people or 35 per cent of the workforce (15 years and over) and is the main source of employment in rural areas (Indonesian Central Bureau of Statistics 2015c McKinsey 2012) The proportion of landless and land-poor agricultural households is especially high on Java Of more than 17 million households on Java characterised as farmer or agricultural labourer households 39 per cent neither lease nor own any crop land and another 44 per cent lease or own less than 05 hectares (USAID nd)
Tradition is one obstacle to agricultural development in Indonesia (Shahaf 2009) In many cases farmers grow the same crops as previous generations using the same such methods and tools Sometimes two or three generations work the same farm
Traditionally particularly in Java harvesting is undertaken primarily by manual labour (Yamauchi 2014) Machines are rarely used However outside Java the emergence of larger scale farmers had led to operations scaling up through mechanisation This has contributed to a rise in farm labour productivity since 2000 (Figure 9)
Figure 9 Agriculture value added per farm worker Indonesia
Source World Development indicators World Bank Group (World Bank 2014)
Currently tractors are used for land preparation activities such as primary and secondary tillage while seeding and planting activities continue to be done manually Threshers are used in more developed areas where agricultural labour has become scarce as a result of competitive wages in other industries
2005 US$
200
400
600
800
1 000
1 200
1980 1984 1988 1992 1996 2000 2004 2008 2012
13
Wage growth in recent years may have led to the introduction of labour saving practices among relatively large farmers such as renting more land and acquiring machinery (Yamauchi 2014) In contrast small farmers have not significantly changed their behaviours
Infrastructure As the worlds largest archipelago Indonesias insufficient and poor quality infrastructure is a major challenge for connectivity between the islands High transport costs also undermine the competitiveness of agricultural industries and associated supply chains (Rabobank 2013 OECD 2012b) With most transport developments concentrated in Java access to markets for the rest of Indonesia is poor
Ninety per cent of freight and 80 per cent of passenger traffic in Indonesia moves by road However roads are heavily congested and their quality in urban and provincial areas is poor (The Canadian Trade Commissioner Service 2011) Because connectivity with markets is compromised by an inadequate road system returns to agricultural producers are often discounted because of spoilage incurred during transport (Global Business Guide Indonesia 2012)
Indonesia has around 300 ports spread throughout the archipelago Inter-island shipping consisting of ferry and cargo shipping services accounts for around 60 per cent of total seaborne cargo in the country (World Bank 2013) Seaports in Indonesia are outdated and investment in port facilities has not matched the rapid growth of traffic moving through them As a result inefficiencies in the shipping system such as bottlenecks and delays in cargo handling are common Vessels also often leave the main port Tanjung Priok before they are fully loaded to keep to published schedules (The Canadian Trade Commissioner Service 2011)
Current infrastructure does not support internal trade well and challenges Indonesiarsquos ability to provide its own food to its own people Developing an efficient transport and logistics system would not only increase the competitiveness of Indonesias external trade but would also provide easier and cheaper access for local agricultural products to domestic markets with reduced losses through spoilage Until this is achieved Indonesian supply chains will continue to be uncompetitive inefficient and looking to other markets to satisfy agrifood demand particularly in urban centres
Water availability While Indonesias water supplies may be sufficient for current agricultural production deterioration of the existing irrigation infrastructure and investment constraints to improve or develop new infrastructure may limit Indonesias future water availability given rapid urbanisation and food demands
Growing municipal water needs and the needs of the agriculture sector to increase production to meet the demands of urban consumers is likely to result in water shortages in coming decades The McKinsey Global Institute projects that by 2030 water supplies will fall short of demand by around 18 per cent (McKinsey 2012) Significant investment is required to improve water productivity and reduce water transmission losses through rehabilitating old and damaged irrigation infrastructure Up to half of Indonesias piped water supply is estimated to be lost in transmission (McKinsey 2012)
Feed availability Increasing demand for meat protein has stimulated the establishment of large scale commercial poultry farms and beef cattle feedlots Data from the Indonesian Feed Millers Association show
14
the poultry industry consumes 83 per cent of Indonesias animal feed the aquaculture industry consumes 11 per cent and cattle and pig industries the remaining 6 per cent (USDAndashFAS 2014)
On average Indonesias livestock feed is composed of maize (50 per cent) soybean meal (15 to 20 per cent) rice bran (15 per cent) wheat pollard (8 per cent) fish meal (5 per cent) maize gluten meal (3 per cent) and crude palm oil (2 per cent) (USDAndashFAS 2014) While most maize is sourced domestically inconsistent seasonal supplies and storage challenges such as high moisture content and aflatoxin levels are major factors that are leading feed millers to import increasing quantities of maize Canola meal is being used increasingly in poultry diets as a cost competitive alternative to soybean meal However its use is restricted to less than full replacement of soybean meal because of canolarsquos lower energy and protein content and the presence of antinutritional factors such as lower amino acid digestibility than in soybean meal (Khajali and Slominski 2012) Apart from maize and agri-industrial by-products such as rice bran copra meal and palm kernel meal other feed ingredients are largely imported (Table 3)
In food crop producing areas fibrous agricultural residues have become the main feed source for ruminant animals raised by small scale livestock producers Rice straw is fed as a base roughage but additional good quality feedstuff or concentratesmdashsuch as leaves and stalks of cassava leaves of maize and sugarcane leaves stems and peelings of banana rice bran pods and peelings of cacao and the fronds pressed fibre and palm kernel cake from oil palmmdashare required to gain higher production performance (Djajanegara 1999) Such feeds are available in various locations but their unequal distribution and high prices at the farm level limit their use by smallholder farmers Lack of storage and labour shortages during harvest time also restrict the collection of rice straw These limitations as well as the seasonal nature of these feedstuffs affect continuity of supply and therefore the productivity potential of smallholder livestock producers
Table 3 Indonesian animal feed sources of primary ingredients
Feed ingredient Local share () Imported share ()
Maize 90ndash95 5ndash10
Fish meal 5ndash10 90ndash95
Meat and bone meal (MBM) 0 100
Soybean meal 0 100
Rapeseed meal 0 100
Maize gluten meal 0 100
Feed additive 0 100
Rice bran 100 0
Copra meal 100 0
Palm kernel meal 100 0
Crude palm oil (CPO) 100 0 Source Indonesia grain and feed annual report 2014 United States Department of Agriculture (USDAndashFAS 2014)
Productivity There has been significant growth in the volume of total agricultural output in Indonesia over the past 50 years although the rate of growth has varied markedly over the decades The contribution of increased total factor productivity (TFP) to total agricultural output growth (including food crops and non-food cash crops) was strong during the 1960s and 1970s as new
15
technologies and improved crop varieties were widely adopted during the green revolution (Table 4) (Fuglie 2010 2012) In the 1980s land and labour use expanded enabling total agricultural output to grow but TFP growth slowed During the 1990s average agricultural output growth declined to less than 2 per cent a year as the green revolution crop varieties had already been widely adopted and no newer higher yielding varieties were suitable or available However TFP growth was stronger than the previous decade
Table 4 Average annual food and non-food agricultural output and total factor productivity growth Indonesia
Years Agricultural output Agricultural TFP
1961ndash1970 271 175
1971ndash1980 334 140
1981ndash1990 464 059
1991ndash2000 187 099
2001ndash2009 486 368 Note Agricultural output measured in volume Source Fuglie 2012
Between 2001 and 2009 strong output and TFP growth resumed for a number of reasons Newly available crop land achieved by the clearing of forested areas supported the expansion and diversification of agriculture into higher value non-staple commodities such as tropical perennials horticulture and livestock At the same time the relatively low price of fertilisers and chemicals available to producers led to a 50 per cent increase in their use between 2002 and 2009 (Figure 10) resulting in a marked improvement in crop yields compared with the previous decade (OECDndashFAO 2014) Improved literacy and education of the farm labour force also contributed to productivity growth (OECD 2012b)
Figure 10 Total fertilizer use in Indonesia by type
Note 2001 data not available Source FAOSTAT Food and Agriculture Organization of the United Nations (FAO 2015)
TFP estimates do not exist for the period since 2010 While yield growth is not as robust a measure of technical change as TFP yield trends can provide a partial indication of changes in productivity Average annual yield growth between 2011 and 2013 was lower than in the
Mt
1
2
3
2002 2003 2004 2005 2006 2007 2008 2009
Nitrogen
Potash
Phosphate
16
periods 2001ndash05 and 2006ndash10 across a range of food and non-food crops (Table 5) A number of factors explain this slowdown The rate of conversion of forest land to cropping slowed significantly reducing the rate of agricultural output growth achieved through additional agricultural land (OECD 2012b) In addition the sustained overuse of fertilizers and chemicals throughout the 2000s has led to decreasing returns to scale for these intermediate inputs As a result any future increase in the productivity of food and non-food crops is unlikely to be achieved through the application of chemicals or fertilisers
Table 5 Average annual yield growth of food and non-food cash crops Indonesia
Commodity Unit 1991-95 1996-00 2001-05 2006-10 2011-13
Food crops
Rice 02 03 08 19 09
Maize 12 42 46 52 30
Cassava -06 15 50 49 36
Mung beans -03 -67 44 23 -02
Soybeans 04 17 11 11 12
Groundnuts -34 58 15 16 02
Vegetables a 93 -08 35 -17 -68
Cash crops
Rubber na -01 45 58 48
Crude palm oil na -72 108 -06 12
Palm kernel na -104 120 08 -10
Cocoa na 05 143 21 -30
Coffee na 24 14 62 37
Tea na 02 30 -05 -11 a Vegetable data available to 2012 Source FAOSTAT Food and Agriculture Organization of the United Nations (FAO 2015)
With reduced scope for expansion in agricultural production through both conversion of forest land and increased use of fertilisers and chemicals future agricultural productivity growth is likely to be achieved through the more efficient use of inputs The dominance of smallholdings remains a constraint to achieving higher agricultural productivity growth in future as small plots impede the implementation of more productive practices This is compounded by inefficient fertiliser use limited mechanisation and an inadequate supply of other important inputs such as high-yielding seeds irrigation systems extension services and access to credit Addressing these issues will be key to future productivity trends
17
4 Indonesian agricultural and food policies
The objectives of Indonesias agricultural policy as stated by the Indonesian Ministry of Agriculture in 2010 are to
1) achieve food self-sufficiency
2) enhance diversification of production and consumption
3) raise the competitiveness and value added of production and
4) increase farmersrsquo welfare (OECD 2012b)
To achieve its objectives the Indonesian Government intervenes in the farm sector with multiple policy instruments The government also implements policies to protect consumers from fluctuations in prices of key food products such as wheat rice and vegetable oils and to insulate domestic producers from foreign competition Food for consumers is subsidised which effectively maintains the price of food within a narrow price band Producers benefit from tariffs applied to imported food which keep the price of domestically produced food competitive with imports Additionally producers are directly supported by government food purchases at guaranteed prices and subsidies on farm inputs such as fertiliser seed and farm equipment
Policies to support agricultural production Reference prices and import restrictions The Indonesian Government sets reference prices for rice sugar and beef which it aims to maintain through various policy instruments
On average around 70 per cent of domestic rice production is consumed within the farming household (OECD 2012b) The remainder is sold through either private or government-run channels such as Indonesias National Food Logistics Agency known as Badan Ursan Logistik (BULOG) BULOG purchases a limited amount of rice at the reference price to fulfil two objectives
1) stockholding for emergency purposes and
2) redistribution as part of the consumer subsidy programme Raskin (discussed below) (OECD 2012b)
In 2010 BULOG procured around 6 per cent of total domestic rice production equivalent to around 20 per cent of all marketed rice (OECD 2012b)
For sugar the government supports the producer price by imposing legal requirements on domestic sugar millers who control the domestic sugar market Sugar millers are required to purchase 75 per cent of their sugar cane requirements from domestic sugar cane growers and to pay growers a government-determined price
The Indonesian rice and sugar industries are also protected by import restrictions Companies that import rice and sugar are required to support the domestic industry by buying domestically produced product if the mill price falls below the reference price
18
For beef and live cattle imports the Indonesian Government sets a reference price which it aims to achieve by managing import volumes through an import permit system Since 2014 the reference price has been 76 000 rupiah (A$720) a kilogram Under the system import permits are not issued if domestic beef prices fall below the reference price (ABARES 2013) Weight restrictions on cattle imports also usually apply limiting imports to young lighter cattle destined for feedlots
The Indonesian Government also restricts imports of other commodities such as soybeans maize horticulture certain processed foods and animals and animal products (including fresh chilled and frozen meat and eggs) Importing these commodities is generally not permitted if the Ministry of Trade considers it will cause injury to the domestic industry (WTO 2013) Companies seeking to import these commodities are required to gain approval from the Indonesian Ministry of Trade (OECD 2012b)
Tariffs Tariffs are applied to most imported food products in Indonesia However they are relatively low and are not a major policy instrument used to protect domestic industries The average applied agricultural tariff was 53 per cent in 2010 (OECD 2012b) Around 85 per cent of agricultural imports are subject to tariffs between zero and 5 per cent with almost 66 per cent entering duty free All agricultural tariffs are ad valorem except for rice and sugar which have specific tariffs (OECD 2012b)
While applied tariffs are low bound tariff rates or the ceiling rate that can be applied under World Trade Organisation rules remain high (Figure 11) On average the bound rate on agricultural products is 47 per cent (OECD 2012b) The highest bound tariff is 210 per cent for milk powders although the applied rate is just 5 per cent Rice has a bound tariff of 160 per cent and an applied specific rate of 450 rupiah a kilogram (equivalent to an ad valorem tariff of 10 per cent when using the average export price for 15 per cent broken rice from Thailand in 2010) (OECD 2012b)
Figure 11 Average bound and applied tariffs by product groups
Source OECD Review of Agricultural Policies Indonesia 2012 Organisation for Economic Co-operation and Development (OECD 2012b)
0
20
40
60
80
Fruit and vegetables
Sugars and confectionery
Cereals Dairy products
Animals and animal
products
Oilseeds fats and oils
Average bound tariff
Average applied tariff
19
Input subsidies The Indonesian Government supports farmers by subsiding inputs such as fertiliser seeds and ad hoc products including power tools and rice milling units Fertiliser support is the largest component of budgetary support for agriculture accounting for 37 per cent in 2008ndash09 (OECD 2012b) Not all farmers receive input subsidies because eligibility requirements apply in many cases For example subsidised fertiliser is only available to farmers producing on less than 2 hectares
Policies to support consumers Price intervention The Indonesian Government intervenes in the domestic market for wheat flour maize and cooking oil when it considers retail prices too high for the poor It does this using a broad range of measures from simply asking manufacturers and wholesalers to be socially responsible with their pricing to purchasing these products and distributing them directly to poor households (OECD 2012b) Another policy often used is the government covered value tax under which the government waives the existing 10 per cent value added tax on the final price of certain food items For example the government has used this policy to reduce the price of non-branded cooking oil since 2007 In 2010 this policy cost the Indonesian Government around 250 billion rupiah (A$299 million)
Food subsidies The Indonesian Government operates a targeted rice subsidy programme known as Raskin to combat food insecurity The programmes objective is to make available a set quantity of rice (procured by BULOG) at a subsidised price to Indonesias poorest households on a monthly basis Raskins intention is to provide rice to those on official lists of households living under or near the national poverty line (World Bank 2012b) The poverty line in 2014 was around 318 500 rupiah per person a month in urban areas and 286 100 rupiah per person a month in rural areas (Indonesian Central Bureau of Statistics 2015a) Those with incomes within 20 per cent of the poverty line are defined as being near the poverty line (World Bank 2012b)
Despite the objectives of Raskin to target the most vulnerable since allocations of Raskin rice to households are decided by local authorities poor and non-poor households alike benefit from the programme In 2010 around 175 million households received Raskin rice (OECD 2012b) at a cost of around 14 trillion rupiah (A$17 billion) to the Indonesian Government (Figure 12) Between 2005 and 2010 the subsidised price was 1 600 rupiah (A$019) a kilogram representing about 20 to 25 per cent of the average market price (World Bank 2012a)
The quantity of rice per household the subsidised price the number of months a year that rice is distributed and the classification of the poorest households have all been altered over the period of the programme For example monthly allocations per household have been set as low as 10 kilograms and as high as 20 kilograms over the programme period although households rarely benefit from the full amount of the allocation (OECD 2012b World Bank 2012a)
20
Figure 12 Raskin rice distribution and budgetary cost
Source OECD Review of Agricultural Policies Indonesia 2012 Organisation for Economic Co-operation and Development (OECD 2012b)
Implications of agricultural and food policies Public expenditure on Indonesian agriculture has increased under its current policy settings In 2009 public spending was around 615 trillion rupiah (A$75 billion) This was equivalent to 56 per cent of total government expenditure compared with 27 per cent in 2001 (World Bank 2011) The fertiliser subsidy and Raskin have been the biggest drivers of increased spending over this period
In addition to the direct budget cost of Indonesias agricultural and food policies there have also been allocative effects Indonesian policies tend to focus on rice maize and sugar leading to increased production of these commodities and improved availability from domestic sources However expansion of these crops has come at the expense of horticulture and other commodities in which Indonesia has a comparative advantage such as natural rubber cocoa and spices (World Bank 2011)
The administration of some support programmes the fertiliser subsidy in particular is inefficient (Sudaryanto 2014) As discussed in Chapter 3 subsidising fertiliser companies in an environment where quantities prices and distribution channels are regulated reduces incentives for these companies to effectively compete This inefficiency has resulted in the under-production of fertiliser leading to shortages At the same time the artificially low price has led to an over-reliance on fertiliser by producers to increase yield rather than using other methods such as improved seeds (World Bank 2011)
4000
8000
12000
16000
2000 2002 2004 2006 2008 20100
1
2
3
4
Expenditure on RASKIN
Quantity of rice distributed (right axis)
Million tonnes
Billionrupiah
21
5 Simulation results Baseline assumptions The objective in this analysis is to identify and quantify projected changes in Indonesian demand for a range of agrifood commodities over the longer term across urban and rural households An updated version of the ABARES agrifood model (Linehan et al 2012a) is used to investigate these potential trends The model has been modified to include Indonesias consumer subsidy policy (Raskin) and a re-aggregation of some country and commodity groups to allow more detailed analysis
Indonesia has a comparative advantage in the production of many cash crops and non-food agricultural commodities that are not included in the ABARES agrifood model such as natural rubber copra palm kernels coffee cocoa and spices (FAO 2013) In Indonesia the production of these commodities competes with food commodities for resources despite a policy environment targeted at food production and food self-sufficiency
Given Indonesias limited supply of arable land and the quality and availability of its water supply the capacity of the domestic agricultural sector to meet the growing demand for food in Indonesia will depend heavily on improvements in productivity Total factor productivity (TFP) growth in Indonesian agriculture is estimated to have averaged 154 per cent a year since 1961 It is expected that yield growth in Indonesia will not decline from this average annual rate in the future because the potential for productivity growth remains significant However nor is it expected to continue at the relatively high rates estimated for the period 2001 to 2009 which were made possible from the expansion of agriculture into higher-value non-staple commodities on newly deforested land and a significant increase in the use of chemical fertilisers (see Chapter 4)
Productivity growth since 2010 is estimated to have slowed from the decade 2001ndash2009 The Indonesian Governments policy initiative Reducing Emissions from Deforestation and Forest Degradation (REDD) in 2010 and declaration of a two-year Forest Moratorium in 2011 have slowed the rate of forest conversion to crop land (OECD 2012b) In addition agricultural production continues to be constrained by the issues outlined in Chapter 4 (including decreasing returns to scale for chemical inputs lack of widespread mechanisation and deteriorating resource base) With ongoing competition between the production of food crops and non-food cash crops (in which Indonesia has a comparative advantage) and little prospects in the foreseeable future for major policy changes on food consumption and production TFP growth for food crops in Indonesia is assumed to average 154 per cent a year between 2009 and 2050 This is close to the forecast by Ludena et al (2007) of 152 per cent a year to 2040 (FAO 2013 USDAndashFAS 2014)
Growth rates for TFP for individual commodities have in the past shown similar patterns to growth in yields Assumptions of TFP growth rates for individual commodities are therefore derived by apportioning the assumed rate for the whole of agriculture by historical growth in the yields of each commodity (Table 6)
22
Table 6 Average annual TFP growth rate by industry in Indonesia 2009 to 2050
Industry
Rice 214
Maize 337
Coarse grains 335
Other cereals 239
Oilseeds 388
Vegetables 232
Fruit 303
Beef 032
Sheep and goat meat 144
Poultry 144
Eggs 135
Dairy 215
All Agriculture 154 Source ABARES model assumption
In the reference case no change to Indonesias market support policies is assumed over the projection period On the production side these include the principal forms of market support of state trading input subsidies and import restrictions Additionally the Indonesian Governments minimum support prices for rice and wheat are maintained in real terms as are other ad hoc interventions on a range of agricultural commodities
The government support received by consumers through the consumer subsidy policy Raskin is also maintained in real terms over the projection period (discussed in Chapter 4)
The baseline projections determined in the agrifood model for Indonesia are also dependent on a set of assumptions discussed in Chapters 2 and 3 To summarise
bull population growth is assumed to average 07 per cent a year between 2010 and 2050
bull the proportion of the population in urban areas is assumed to increase from 50 per cent in 2009 to 72 per cent by 2050
bull average annual GDP growth in Indonesia is assumed to average 53 per cent a year between 2010 and 2030 before weakening between 2030 and 2050 to average 34 per cent a year (Table 1)
bull average annual income growth is assumed to be 56 per cent a year in urban areas and 21 per cent a year in rural areas
agricultural productivity in Indonesia is assumed to continue to increase according to the growth estimates provided in Table 6
The population is divided into two income stratamdashurban income and rural income households Across these two household types the income growth assumptions to 2050 for urban and rural areas are based on historical income data from the Indonesian Central Bureau of Statistics (2011) These data demonstrate that not only is average urban income higher than average rural income but with urbanisation average income growth in urban areas has also been higher than
23
in rural areas This has been the result of a relatively faster rate of economic development and higher wages which have stemmed from the growth in the manufacturing and services sectors prevalent in urban areas The model assumes this trend in income growth will continue to 2050 Indonesian household food consumption data in the base year of the model are from the Indonesian Central Bureau of Statistics (2014) and Widarjono (2012) These data were used as the basis in the model to project food consumption across urban and rural households to 2050
In the model total and per person Indonesian food consumption and total urban and rural food consumption is apparent consumption which reflects the total use of agrifood products (food feed and industrial use) In contrast per person urban and rural consumption is direct food consumption only it excludes feed use and industrial use of agrifood products to better reflect changes in diets
Consumption The real value of total food consumption in Indonesia (including food feed and industrial use) is projected to quadruple between 2009 and 2050 to US$327 billion (in 2009 US dollars) The largest increases are for meat dairy products fruit and vegetables as real incomes increase (Figure 13) Together these commodities account for two-thirds of the projected rise in the real value of food consumption
Figure 13 Consumption of selected agricultural commodities Indonesia
Note Starchy staples include pulses yams potatoes and cassava Source ABARES model output
Between 2009 and 2050 the real value of Indonesian beef consumption is projected to rise more than 14 times to US$35 billion (in 2009 US dollars) dairy products ten times to almost US$9 billion and fruit and vegetables more than three times to US$50 billion and US$25 billion respectively For many commodities the value of consumption in 2050 is projected to rise from a very low base reflecting high poverty rates and a large rural population in 2009 By 2050 72 per cent of the population is projected to live in urban centres with higher incomes than the
10 20 30 40 50 60
Wheat
Sheep and goat meat
Dairy
Sugar
Oil crops
Rice
Vegetables
Starchy staples
Beef
Poultry
Fruit
2050
2009
Billion(2009 US$)
552
66
231
1311
269
1319
256
246
935
1340
113
24
rural cohort It is this expected transition of the population and income growth that drive the magnitude of projected consumption growth for many commodities Despite these large increases Indonesias per person food consumption in 2050 is projected to remain below that of China for many commodities (Hamshere et al 2014)
For cereals oil crops and starchy staples (pulses potatoes yams and cassava) consumption is also projected to increase Between 2009 and 2050 the real value of rice consumption is projected to rise by 66 per cent to nearly US$23 billion (in 2009 US dollars) maize by 182 per cent to US$8 billion oil crops by 246 per cent to US$22 billion and starchy staples by 256 per cent to almost US$29 billion Over this period the real value of sugar consumption is projected to rise more than six times to US$14 billion (in 2009 US dollars)
The projected rise in consumption of cereals oil crops and starchy staples is driven by a number of factors First cereals and starchy staples (such as cassava) are relatively affordable foods particularly for low and middle income consumers whose populations are projected to rise Although both cereals and starchy staples will remain important components of Indonesian diets to 2050 their relative contribution will decline as diets become more diversified with greater amounts of meats dairy products and fruit and vegetablesmdashthe continuation of a trend that began around 1990 (Figure 5)
The projected rise in consumption of cereals oil crops and starchy staples is also driven by feed requirements which will increase as the demand for meat protein rises to 2050 As discussed in Chapter 3 about 50 per cent of domestic maize production is used as feed Rice bran also comprises about 15 per cent of total Indonesian feed consumption Soybean meal comprises between 15 per cent and 20 per cent of total livestock feed all of which is imported Rapeseed meal can be used as a partial substitute for soybeans and it too is entirely imported In 2050 it is projected that feed use will account for around 42 per cent of total maize consumption 43 per cent of total oil crop consumption and 44 per cent of total starchy staple consumption a larger proportion of which will need to be imported compared with 2009
Urban and rural consumption In 2050 71 per cent of Indonesias population is projected to live in urban areas compared with 54 per cent in 2015 (United Nations Population Division 2014) By 2050 Indonesian consumers are projected to have more diverse diets with greater consumption of meat dairy products fruit and vegetables
In this section the results for total urban and rural consumption reflect apparent consumption However per person rural and urban consumption is direct food consumption only Feed use and industrial use of the agrifood products are excluded in the per person results in order to better understand the projected change in diets
High value commodities Urban consumers account for most of the growth in consumption of meat dairy products fruit and vegetables over the projection period because of rising urban populations and incomes Between 2009 and 2050 the real value of urban beef consumption is projected to rise more than 18 times to US$34 billion (in 2009 US dollars) Consumption of dairy products is projected to rise by more than 14 times to more than US$8 billion and fruit and vegetables more than four times to US$43 billion and almost US$21 billion respectively (Figure 14)
25
Figure 14 Urban consumption of selected agricultural commodities Indonesia
Source ABARES model output
In per person terms the value of urban beef consumption is projected to rise more than nine times between 2009 and 2050 dairy more than seven times and fruit and vegetables to more than double However consumption of rice is projected to fall by 4 per cent While these increases are large Indonesias urban per person consumption in 2050 is still projected to be lower than that of China in the same year for many commodities including vegetables (73 per cent lower) oilseeds (12 per cent) dairy products (41 per cent) and sheep and goat meat (24 per cent) In contrast Indonesias urban per person consumption is projected to be higher than Chinas for beef (52 per cent higher) sugar (400 per cent) cereals (23 per cent) and starchy staples (14 times higher) (Hamshere et al 2014) For beef higher Indonesian per person consumption relative to China in 2050 reflects the dominance of beef in Indonesian diets by that time compared with China where pig meat consumption is significant Similarly the projected rise in per person consumption of starches in Indonesia mainly reflects higher consumption of cassava a culturally important food crop
For rural consumers total growth in consumption of meat dairy products fruit and vegetables is lower than for urban households This can be attributed to relatively lower rural incomes and a decline in the absolute size of the rural population Between 2009 and 2050 total rural beef consumption is projected to rise by 95 per cent to more than US$1 billion (in 2009 US dollars) dairy products by 75 per cent to US$05 billion fruit by 41 per cent to almost US$7 billion and vegetables by 42 per cent to almost US$5 billion (Figure 15)
20 40 60
Wheat
Sheep and goat meat
Dairy
Sugar
Oil crops
Rice
Vegetables
Starchy staples
Beef
Poultry
Fruit
Billion(2009 US$)
387
1724
1734
426
875
370
547
1349
Total food consumption
1761
91
173
50 100 150 200
Wheat
Sheep and goat meat
Dairy
Sugar
Oil crops
Rice
Vegetables
Starchy staples
Beef
Poultry
Fruit
2009 US$
145
819
824
165
391
137
226
630
Per person consumption
837
-4
38
26
Figure 15 Rural consumption of selected agricultural commodities Indonesia
Source ABARES model output
Between 2009 and 2050 rural per person consumption of each of the agrifood commodity groups is projected to change by a similar magnitude as urban consumption In value terms rural per person consumption of beef is projected to rise by 162 per cent dairy products by 135 per cent fruit by 90 per cent and vegetables by 92 per cent Similar increases are projected for rice (96 per cent) wheat (128 per cent) and starchy staples (116 per cent)
Again despite these significant increases rural per person consumption in Indonesia is projected to be lower than that of China in 2050 for all products except sugar which is projected to be 117 per cent higher For all other commodity groups rural per person consumption is projected to be lower than in China including sheep and goat meat (85 per cent lower) dairy (54 per cent) starches (32 per cent) cereals (56 per cent) and vegetables (86 per cent)
For both rural and urban consumers the rise in the real value of total food consumption in 2050 is principally the result of an increase in the quantity consumed rather than a projected significant rise in the real price This is especially pronounced in urban households For example between 2009 and 2050 beef consumption by urban households is projected to rise by more than 15 times and sheep and goat meat by 13 times In contrast rural beef consumption over this period is projected to rise by 64 per cent and sheep and goat meat by 44 per cent
Projected consumption growth of cereals and starchy staples between 2009 and 2050 is most pronounced in urban areas Rising urban consumption of these commodities is largely the result of population growth Urban consumption of wheat is projected to rise by 173 per cent to around US$2 billion (in 2009 US dollars) rice by 91 per cent to US$9 billion and starchy staples (which includes pulses potatoes yams and cassava) by 426 per cent to US$13 billion
Rural consumption of cereals and starchy staples is projected to rise despite a falling rural population As incomes rise towards 2050 the relatively affordable prices of these commodities will drive rural consumption Between 2009 and 2050 rural consumption of wheat is projected
2 4 6 8 10
Wheat
Sheep and goat meat
Dairy
Sugar
Oil crops
Rice
Vegetables
Starchy staples
Beef
Poultry
Fruit
Billion(2009 US$)
94
95
61
96
42
101
Total consumption
41
75
98
45
69
50 100 150 200
Wheat
Sheep and goat meat
Dairy
Sugar
Oil crops
Rice
Vegetables
Starchy staples
Beef
Poultry
Fruit
2050
2009
2009 US$
90
161
162
116
165
92
170
135
Per person consumption
166
96
128
27
to rise by 69 per cent to US$1 billion (in 2009 US dollars) rice by 45 per cent to almost US$9 billion and starchy staples by 61 per cent to US$3 billion
Production and trade The real value of Indonesias total agrifood production (which includes production for food feed and industrial use) is projected to more than double from US$81 billion in 2009 to US$173 billion in 2050 (in 2009 US dollars) This increase is driven by a higher value of production (in 2009 US dollars) of beef (up 209 per cent) poultry (187 per cent) starchy staples (115 per cent) vegetables (92 per cent) fruit (78 per cent) and rice and palm oil (up 77 per cent each) (Figure 16) The value of maize production divided almost equally between feed and food use is projected to increase by 78 per cent
Figure 16 Production of selected agricultural commodities Indonesia
Source ABARES model output
For some agricultural products such as rice and beef rising production partly reflects domestic policies that favour their production For example the real value of rice production between 2009 and 2050 is projected to rise by 77 per cent because of the assumption that producers continue to receive a minimum support price and input subsidies Indonesia is projected to switch from being an importer to an exporter of rice by 2050 The real value of Indonesias rice exports in 2050 is projected to be around US$09 billion (in 2009 US dollars)
The real value of Indonesias palm oil production is projected to rise significantly in line with strong export demand and Indonesias comparative advantage in its production Between 2009 and 2050 Indonesias production of palm oil is projected to rise by US$13 billion to US$30 billion an increase of 77 per cent Over this period palm oil exports are projected to rise by 40 per cent to US$18 billion
10 20 30 40
Sheep and goat meat
Dairy
Sugar
Palm oil
Rice
Vegetables
Starchy staples
Beef
Poultry
Fruit
2050
2009
Billion(2009 US$)
78
187
209
115
92
77
77
76
115
361
28
Imports For some agricultural commodities such as rice and palm oil the rise in consumption by 2050 is projected to be met largely by a rise in domestic production However for most agrifood commodities production is projected to increase at a slower rate than consumption As a result food and feed imports will be an increasingly important component of Indonesias food supply towards 2050 The real value of Indonesias total agrifood imports is projected to rise more than 20 times from 2009 to US$152 billion (in 2009 US dollar terms) in 2050
By 2050 Indonesia is projected to import a wide range of horticultural products Given rising domestic demand the real value of Indonesiarsquos fruit and vegetable imports is projected to rise to US$25 billion and US$11 billion in 2050 respectively (in 2009 US dollars Figure 17) On this basis the share of imports in total Indonesian fruit consumption will rise from 3 per cent in 2009 to 53 per cent in 2050 (Figure 18) For vegetables it will rise from 9 per cent in 2009 to 47 per cent in 2050
Figure 17 Trade of selected agricultural commodities Indonesia
Source ABARES model output
-30 -20 -10 0 10 20 30
Wheat
Sheep and goat meat
Dairy
Sugar
Rice
Beef
Starchy staples
Vegetables
Fruit
2050
2009
Billion (2009 US$)
Exports Imports
Palm oil
29
Figure 18 Import share of total consumption Indonesia
Source ABARES model output
Lower-income growth scenario The baseline projections for Indonesian agrifood consumption production and trade to 2050 are reliant on the underlying assumptions presented at the beginning of this chapter Chief among these are the OECD (2012a) assumptions for Indonesian GDP growth to 2050 presented in Chapter 2 (Table 1 and Table 7) If Indonesia were to realise a lower level of income growth agrifood demand growth would be expected to be lower The World Bank projects that Indonesian GDP growth in each decade to 2050 will be markedly lower than the OECDs projections (World Bank 2015 Table 7) This scenario examines the potential effect on Indonesian agrifood consumption and import demand if GDP and hence income growth were slower over the projection period as suggested by the World Bank All other variables from the reference scenario are held constant
Table 7 Indonesia GDP growth projections 2010 to 2050
Period Baseline 1991-2010
2011-2020 2021-30 2031-40 2041-50
OECD average annual growth ()
440 530 530 340 340
World Bank average annual growth ()
440 350 350 225 225
Source OECD 2012a World Bank 2015
Results In this scenario lower economic and income growth throughout the projection period results in GDP in 2050 that is 44 per cent lower than the reference case Because agrifood consumption is sensitive to changes in income the total value of agrifood consumption in 2050 (in 2009 US dollars) is 10 per cent less than in the reference case (Figure 19) Weaker economic growth most
Fruit Vegetables Starchy staples
Beef Poultry Sugar Maize Dairy Sheep and goat meat
Wheat
10
20
30
40
50
2050 Imports
2050 Domestic production
2009 imports
2009 Domestic production
53
3
4743
86
8183
1007091
9
75846723
6
100
Billion(2009 US$)
21
50
30
strongly affects urban areas where average annual income growth in the reference case was assumed to be more than double that of rural areas As a result demand for high-value products such as meat and dairy products declines significantly Many of these products are imported In 2050 the total projected value of beef consumption (in 2009 US dollars) is 17 per cent lower than in the reference case and poultry and milk products are each 14 per cent lower The real value of consumption for many domestically produced products such as starches and maize also declines but by no more than 10 per cent for any single commodity
Weaker consumption growth leads to lower import growth over the projection period particularly for high-value commodities The total value of imports in 2050 is 16 per cent lower in this scenario compared with the reference case with the import share of total consumption 5 percentage points lower than the reference case at 42 per cent (Figure 19) Beef imports are projected to be 20 per cent lower than the reference scenario sheep and goat meat 26 per cent lower and dairy products 16 per cent lower Fruit and vegetable imports are 12 per cent and 19 per cent lower respectively
Figure 19 Agrifood consumption in 2050 under lower income growth assumption
Source ABARES model output
0 100 200 300 400
Low income scenario
Baseline case
Domestic production
Imports
Billion(2009 US$)
4258
53 47
31
6 Conclusion Continued strong income and population growth combined with greater urbanisation are driving Indonesias increasing demand for not only more food but for a wider variety of foods This demand growth is projected to be met by increases in both domestic production and imports
Assuming no major changes to Indonesias existing agricultural policies to 2050 the real value of food consumption in Indonesia is projected to increase more than four times between 2009 and 2050 The increase will be characterised by a move towards more diverse diets with higher intake of meat dairy products fruit and vegetables Between 2009 and 2050 the real value of beef consumption is projected to rise more than 14 times dairy tenfold and fruit and vegetables to more than triple These projected increases are from a relatively low base and are driven by a rise in the quantities consumed rather than any significant projected rise in real prices To support this rise in demand imports of many agrifood commodities are projected to increase to 2050
The contribution of meat dairy products fruit and vegetables in Indonesian diets will increase more quickly than cereals and staples to 2050 While cereals and starchy staples will remain important components of Indonesian diets their relative contribution will declinemdashthe continuation of a trend that began around 1990
The upward trend in food demand is most pronounced among urban households whose income growth is assumed to be more than double that of rural households A declining rural population and relatively lower incomes will result in slower growth in food consumption compared with the urban population
For most agricultural commodities assuming no significant change to historical TFP growth for total agriculture production is projected to increase at a slower rate than consumption As a result food imports will be an important component of Indonesias food and feed supply towards 2050 The real value of Indonesias agrifood imports is projected to rise more than 20 times from 2009 to US$152 billion (in 2009 US dollar terms) in 2050
The projected significant increases in consumption and import demand for food in Indonesia are based on the assumption of relatively strong income growth to 2050 Under a lower growth scenario consumption of protein-based food products such as meat and dairy products is projected to be around 14 to 17 per cent lower than the reference case at 2050 While consumption of domestically produced products is also projected to be lower in 2050 in the lower-income-growth scenario the declines are less significant compared with the baseline case
While not included in the modelling in this report there is scope for increased production of non-food agricultural commodities and cash crops in Indonesia in which it has a comparative advantage These include natural rubber copra palm kernels coffee cocoa and spices Indonesias current policies on food self-sufficiency favour investment in food industries rather than the non-food and cash crops industries This has the effect of allocating resources away from their most efficient use
Because of their geographic proximity Australia and Indonesia are well placed to benefit from advancing bilateral agricultural trade Indonesia is an important market for Australian wheat sugar live cattle beef skim milk powder and horticultural products such as grapes and citrus
32
Stronger demand for these commodities and others in Indonesia will create further opportunities for Australian exporters
33
References ABARES 2013 Agricultural commodities September quarter 2013 Australian Bureau of Agricultural and Resource Economics and Sciences Canberra pp 85-87 available at agriculturegovauabarespublications
Afif S 2014 The Rising of Middle Class in Indonesia Opportunity and Challenge Paper presented at the International Policy Exchange Conference Segovia Spain 28 September available at umdcipeorgconferencesDecliningMiddleClassesSpainpapers_presentationshtml
Alexandratos N amp Bruinsma J 2012 World agriculture towards 20302050 the 2012 revision ESA Working paper no 12-03 Food and Agriculture Organization of the United Nations Rome available at faoorgeconomicesaesagen
Djajanegara A 1999 Local livestock feed resources in Livestock industries of Indonesia prior to the Asian financial crisis Food and Agriculture Organization of the United Nations Rome available at faoorgdocrep004AB986Eab986e06htmbm06 accessed 22 January 2015
Elias S amp Noone C 2011 The growth and development of the Indonesian economy Bulletin December Quarter Reserve Bank of Australia Sydney available at rbagovaupublicationsbulletin2011dec4html
FAO 2015 lsquoFAOSTATrsquo Food and Agriculture Organization of the United Nations Rome available at faostat3faoorghomeE accessed 26 October 2015
mdashmdash 2013 Indonesia Food and Agriculture Organization of the United Nations Rome available at faoorgdocrep005y4632ey4632e0lhtm
mdashmdash2012 GeoNetwork Food and Agriculture Organization of the United Nations Rome available at faoorggeonetworksrvenmainhome accessed 15 February 2014
mdashmdash 2005 Fertiliser use by crop in Indonesia Food and Agriculture Organization of the United Nations Rome available at faoorgdocrep008y7063ey7063e00htm
Fuglie K 2012 lsquoProductivity growth and technology capital in the global agricultural economyrsquo in Fuglie KO Wang SL amp Ball VE (eds) Productivity growth in agriculture an international perspective CAB International Oxfordshire UK
mdashmdash2010 lsquoSources of growth in Indonesian agriculture Journal of Productivity Analysis vol 33 no 3 pp 225-240
Fuglie K amp Rada N 2014 International Agricultural Productivity United States Department of Agriculture Economic Research Service Washington DC available at ersusdagovdata-productsinternational-agricultural-productivityaspxU089bfmSzkd
Global Business Guide Indonesia 2012 Agriculture in Indonesia available at gbgindonesiacomenagriculturesector_overviewphp
Glover J 2011 lsquoAn international retailerrsquos perspectiversquo Paper presented at The Crawford Fund 2011 Annual Parliamentary Conference Parliament House Canberra 14 August available at crawfordfundorgevents2011-parliamentary-conference
34
Hamshere P Sheng Y Moir B Syed F amp Gunning-Trant C 2014 What China wants Analysis of Chinas food demand to 2050 ABARES research report Canberra March available at agriculturegovauabarespublications
IMF 2015 World Economic Outlook Database available at imforgexternalpubsftweo201302weodataindexaspx accessed 26 October 2015
Indonesian Central Bureau of Statistics 2015a Poverty available at bpsgoidSubjekviewid23subjekViewTab3|accordion-daftar-subjek1 accessed 27 October 2015
mdashmdash2015b Consumption and expenditure available at bpsgoidSubjekviewid5subjekViewTab3|accordion-daftar-subjek1 accessed 27 October 2015
mdashmdash2015c Population 15 Years of Age and Over Who Worked by Main Industry 2004-2014 available at bpsgoidlinkTabelStatisviewid970 accessed 27 October 2015
mdashmdash2014 Consumption and expenditure available at bpsgoidSubjekviewid5subjekViewTab3|accordion-daftar-subjek1 accessed 20 February 2014
mdashmdash2011 Total income by Household Group (billion rupiahs) available at bpsgoidSubjekviewid5subjekViewTab3|accordion-daftar-subjek1 accessed 1 August 2014
Khajali F amp Slominski BA 2012 lsquoFactors that affect the nutritive value of canola meal for poultryrsquo Poultry Science vol 91 no 10 pp 2564ndash2575 available at psoxfordjournalsorgcontent91102564fullxref-ref-95-1
Linehan V Thorpe S Andrews N amp Beaini F 2012a Food demand to 2050 Opportunities for Australian agriculture paper presented at 2012 ABARES Outlook conference Canberra 6ndash7 March available at daffgovauabarespublications
mdashmdash 2012b Food demand to 2050 Opportunities for Australian agriculturemdashalgebraic description of agrifood model technical annex to ABARES Outlook conference paper Canberra May available at daffgovauabarespublications
Ludena C Hertel T Preckel P Foster K and Nin A 2007 Productivity growth and convergence in crop ruminant and nonruminant production measurement and forecasts Agricultural Economics 37 available at onlinelibrarywileycomdoi101111j1574-0862200700218xabstract
McKinsey Global Institute 2012 The archipelago economy Unleashing Indonesias potential September Jakarta available at mckinseycominsightsasia-pacificthe_archipelago_economyashx
OECD 2013 Global Food Security Challenges for the Food and Agricultural System Organisation for Economic Cooperation and Development Paris available at oecd-ilibraryorgagriculture-and-foodglobal-food-security_9789264195363-en
mdashmdash2012a Looking to 2060 A global vision of long-term growth Economics Department Policy Notes no 15 Organisation for Economic Cooperation and Development Paris November available at oecdorgecomonetarypolicy-noteshtm
35
mdashmdash2012b OECD Review of Agricultural Policies Indonesia 2012 Organisation for Economic Cooperation and Development Paris available at oecd-ilibraryorgagriculture-and-foodoecd-review-of-agricultural-policies-indonesia-2012_9789264179011-en
OECDndashFAO 2014 OECDndashFAO Agricultural Outlook 2014 Organisation for Economic Cooperation and Development Paris available at oecd-ilibraryorgagriculture-and-foodoecd-fao-agricultural-outlook-2014_agr_outlook-2014-en
Osorio C Abriningrum D Armas E amp Firdaus M 2011 Who is benefiting from fertilizer subsidies in Indonesia Policy Research Working Paper 5758 World Bank Washington DC available at elibraryworldbankorgdoipdf1015961813-9450-5758
Rabobank 2013 Indonesia - islands of opportunity Agriculture in Focus Rabobank Food amp Agribusiness Research and Advisory Australia and New Zealand Spring Sydney
Shahaf E 2009 Agriculture in Indonesia Asia Technology Consulting available at techasiaconsultingcomagriculture_in_indonesiahtml
Statistics Indonesia 2015 Gross Domestic Product at Current Market Prices By Industrial Origin (Billion Rupiahs) 2000-2014 available at bpsgoidlinkTabelStatisviewid1199 accessed 26 October 2015
Sudaryanto T 2014 Fertilizer subsidy policy in Indonesia impacts and future perspectives Food and Fertiliser Technology Center for the Asian and Pacific Region Asia-Pacific Information Platform on Agricultural Policy (AP) available at apfftcagnetorgap_dbphpid=365
The Canadian Trade Commissioner Service 2011 lsquoAn Investment Guide to Indonesia available at tradecommissionergccaengdocumentjspdid=133467toc38
United Nations Population Division 2015 World population prospects the 2015 revision United Nations New York available at esaunorgunpdwppindexhtm accessed 12 August 2015
mdashmdash2014 World urbanisation prospects the 2014 revision United Nations New York available at esaunorgunpdwup accessed 19 March 2015
USAID nd lsquoIndonesia ndash Property rights amp resource governancersquo USAID Country Profile available at usaidlandtenurenetindonesia
USDAndashFAS 2014 Indonesia grain and feed annual report 2014 GAIN Report no ID1407 1 April Foreign Agricultural Service United States Department of Agriculture Washington DC available at usdaindonesiaorgcat=10
Widarjono A 2012 Food and nutrient demand in Indonesia PhD thesis Oklahoma State University available at shareokorgbitstreamhandle112446547Department20of20Agricultural20Economics_48pdfsequence=1
World Bank 2015 Global Economic Prospects January 2015 Having fiscal space and using it World Bank Group Washington DC available at worldbankorgenpublicationglobal-economic-prospects
mdashmdash2014 World development indicators World Bank Washington DC available at dataworldbankorgdata-catalogworld-development-indicators
36
mdashmdash2013 Transport in Indonesia World Bank Washington DC available at goworldbankorgPF2AFG64V0
mdashmdash 2012a Raskin subsidised rice delivery Public expenditure review (PER) Social assistance program and public expenditure review no 3 World Bank Washington DC available at documentsworldbankorgcurateden20120215893857raskin-subsidized-rice-delivery
mdashmdash2012b Targeting poor and vulnerable households in Indonesia World Bank Washington DC available at documentsworldbankorgcurateden20120115879773targeting-poor-vulnerable-households-indonesia
mdashmdash2011 Indonesia Agriculture Public Expenditure Review 2010 World Bank Jakarta available at documentsworldbankorgcurateden20110919456223indonesia-agriculture-public-expenditure-review-2010
mdashmdash2010 Completing decentralization World Bank Jakarta available at documentsworldbankorgcurateden20100112012453completing-decentralization
mdashmdash2009 Investing in a more sustainable Indonesia Country Environmental Analysis Report No 50762-ID World Bank CEA Series East Asia and Pacific Region available at openknowledgeworldbankorgbitstreamhandle109863135507620v20Revis1ox0info10CEA1englishpdfsequence=1
mdashmdash2007 Horticultural producers and supermarket development in Indonesia World Bank Washington DC available at documentsworldbankorgcurateden2007068235822horticultural-producers-supermarket-development-indonesia
WTO 2013 Trade policy review Indonesia WTO Document WTTPRS278 World Trade Organisation Geneva available at wtoorgenglishtratop_etpr_etp378_ehtm
Yamauchi F 2014 Wage Growth Landholding and Mechanization in Agriculture Evidence from Indonesia World Bank Washington DC February available at openknowledgeworldbankorghandle1098617324

3
Compared with other Asian countries Indonesias population is relatively young (Elias amp Noone 2011) The proportion of people of working age (15 to 64) in the population is forecast to remain above 65 per cent beyond 2045 (United Nations Population Division 2015) and the absolute number of people of working age is also expected to continue to increase
Figure 2 Population distribution by age Indonesia
Source World population prospects the 2015 revision United Nations Population Division (United Nations Population Division 2015)
The changing age structure is likely to have an effect on patterns of food demand Nutritional requirements increase as children age to maturity and decline as adults age Older people generally consume less food and typically prefer more traditional foods
Urbanisation is an important determinant of consumer demand for food Urban dwellers typically have higher incomes than their rural counterparts and different dietary and shopping patterns Over the four decades from 1970 to 2010 Indonesias urban population expanded by an average of 45 per cent a year (Figure 3) The rural population grew more slowly than the urban population reaching a peak in 1995 Since 2010 the total number of urban residents has exceeded rural residents
Jakarta is by far Indonesias largest city with a population of just over 10 million (United Nations Population Division 2014) Jakarta has four times the population of the second-largest city Surabaya However most other cities are growing at faster rates than Jakarta In 2050 71 per cent of Indonesias population is projected to live in urban areas compared with 54 per cent in 2015 (United Nations Population Division 2014)
Million 10 20 30
0-4
10-14
20-24
30-34
40-44
50-54
60-64
70-74
80+
Age
grou
p
1970
Million 10 20 30
2010
Million 10 20 30
2050
4
Figure 3 Urban and rural population Indonesia
Source World urbanisation prospects the 2014 revision United Nations Population Division (United Nations Population Division 2014)
Incomes The Indonesian economy has grown consistently over the past two decades apart from the Asian financial crisis of 1998 (Figure 4) Indonesian GDP in constant prices almost tripled between 1990 and 2012 (IMF 2015) Average incomes per person in constant prices doubled over the same period
Figure 4 GDP growth in Indonesia
Source World Economic Outlook Database International Monetary Fund (IMF 2015)
10
20
30
40
50
60
70
80
90
Million
50
100
150
200
250
300
350
1970 1980 1990 2000 2010 2020 2030 2040 2050
Rural
Urban
Share of rural population (right axis)
-10
-5
0
5
10
1990 1995 2000 2005 2010
5
Indonesias economic growth has not been shared equally across the population Although the middle class (defined as those with daily expenditure of between US$2 and US$20 in 2005 purchasing power parity terms) expanded from around 25 per cent of the population in 2000 to 57 per cent in 2010 income inequality has increased (Afif 2014 Indonesian Central Bureau of Statistics 2015a) Income growth and income inequality both have important implications for food consumption The expansion of the middle class has been a significant factor behind the increase in Indonesias total food consumption However the rise in inequality implies there remains a considerable proportion of the population with low incomes and limited capacity to buy food
In the baseline projections presented in this report Indonesian GDP is assumed to grow according to OECD (2012a) projections (Table 1) Between 2011 and 2030 real GDP growth is assumed to increase at an average of 53 per cent a year before weakening between 2030 and 2050 to average 34 per cent a year Urban incomes are assumed to continue to grow faster than rural incomes over the period to 2050 averaging 56 per cent and 21 per cent a year respectively An alternative scenario of lower economic growth is also examined based on World Bank (2015) projections (see Chapter 5 Table 7)
Table 1 Indonesia GDP growth 2009 to 2050
1991-2010 2011-2020 2021-30 2031-40 2041-50
Average annual growth ()
44 53 53 34 34
Source Looking to 2060 A global vision of long-term growth Economics Department Policy Notes no 15 Organisation for Economic Co-operation and Development (OECD 2012a)
Food consumption Total food consumption in Indonesia has increased in response to rising incomes and population Between 1990 and 2013 total consumption of wheat fruit and milk each increased by more than 200 per cent (Figure 5) Consumption of vegetables more than doubled over the same period and meat consumption almost doubled Consumption of ricemdasha staple food in Indonesian dietsmdashincreased by only 32 per cent
6
Figure 5 Consumption of selected foods Indonesia
Source FAOSTAT Food and Agriculture Organization of the United Nations (FAO 2015)
Between 1990 and 2013 the average calorie intake per person in Indonesia increased by 19 per cent The contribution of starchy roots and pulses to individuals calorie intake declined while the contribution of fruit and vegetables meat and fish increased Average per person consumption of milk and other dairy products more than doubled but remained of limited significance
Poultry is the major source of meat in Indonesia accounting for over half the total meat consumed in 2013 (Figure 6) Pig meat constituted almost a quarter of total meat consumption in 2013 consumed by non-Muslim people Consumption of beef which ranks third has been increasing more slowly than chicken meat consumption because it is relatively more expensive (FAO 2015) Sheep and goat meat accounted for less than 5 per cent of total meat consumption
Million tonnes
5
10
15
20
25
30
35
40
1990 1992 1994 1996 1998 2000 2002 2004 2006 2008 2010 2012
Rice (milled equivalent)
Fruit
Vegetables
Wheat
Meat
Milk (excluding butter)
7
Figure 6 Total consumption of meats Indonesia
Source FAOSTAT Food and Agriculture Organization of the United Nations (FAO 2015)
On a per person basis Indonesias consumption of many food groups is relatively low This is because a high portion of its population lives at or near the poverty line Per person consumption of meat in 2011 was between 70 per cent and 80 per cent less than that of Japan the Republic of Korea China and many other ASEAN nations (Table 2) For dairy it was around 80 per cent less than that of Japan 56 per cent less than China 47 per cent less than the Republic of Korea and lower than other ASEAN countries For fruit and vegetables it was between 30 per cent and 65 per cent less than that of Japan and the Republic of Korea 74 per cent less than China and lower than other ASEAN countries These relatively low per person consumption levels underline the potential for sizable increases in per person food consumption as incomes rise
Table 2 International comparison of annual per person food consumption 2011
Country Meats kg
Dairy kg
Fruit and vegetables kg
Cereals kg
Japan 488 713 1524 1044
Republic of Korea 622 264 2888 1515
China 577 315 4178 1515
Malaysia 533 322 1131 1466
Philippines 345 145 1796 1577
Vietnam 576 151 1445 1670
Indonesia 129 139 1075 1906 Source FAOSTAT Food and Agriculture Organization of the United Nations (FAO 2015)
Diets of urban residents are usually different from their rural counterparts In 2013 Indonesias urban residents spent an average of 414 000 rupiah a month on food compared with 299 000 rupiah by rural residents (Indonesian Central Bureau of Statistics 2015b) Urban residents spent more than rural residents on meat fish eggs fruit and prepared (cooked and packaged) foods Rural residents spent more on cereals and tubers (Figure 7) with 24 per cent of their food budget devoted to cereals alone compared with only 15 per cent for urban residents
000 tonnes
200
400
600
800
1000
1200
1400
1600
1800
2000
1990 1992 1994 1996 1998 2000 2002 2004 2006 2008 2010 2012
Poultry meat
Pig meat
Bovine meat
Sheep and goat meat
8
Figure 7 Expenditure on food items urban and rural residents 2013 Indonesia
Source Indonesian Central Bureau of Statistics 2015b
Food marketing in Indonesia is also changing In the 1980s supermarkets occupied only a small niche in food retailing By the mid-1990s they were still confined to the urban upper income sector Supermarkets only began to spread quickly in Indonesia after 1998 By 2007 they accounted for about 30 per cent of overall retail food expenditure (World Bank 2007)
The development of supermarkets is typically associated with closer vertical coordination along value chains as the supermarkets maintain close relationships with their suppliers This often involves contractual arrangements with farmers or in the case of food imports with suppliers in other countries Asian supermarket chains have developed direct relationships with suppliers of fresh horticultural and dairy produce in the United States New Zealand and Australia (Glover 2011)
000 rupiah
20
40
60
80
100
120
140
Cere
als
Tube
rs
Fish
Mea
t
Eggs
and
milk
Vege
tabl
es
Legu
mes
Frui
ts
Oil
and
fats
Beve
rage
s
Misc
food
item
sPr
epar
ed fo
odan
dhellip
Urban
Rural
9
3 Production constraints in Indonesian agriculture
The agriculture sector is a key component of the Indonesian economy contributing about 14 per cent of Indonesias GDP in 2014 (Statistics Indonesia 2015) Thirty per cent of Indonesias land area is used for agricultural purposes and the sector employs 41 million people or 35 per cent of the nations work force The sector is a strong contributor to Indonesias trade with agricultural exports accounting for 24 per cent of the value of total merchandise exports in 2012 (World Bank 2014)
Indonesias agriculture is generally characterised by fertile volcanic soils and abundant renewable water resources High population density has resulted in a sector dominated by smallholdings Agricultural land area per person in Indonesia is low at just 022 hectares This is equivalent to a third of the world average (World Bank 2014) Challenges to agricultural production and productivity growth include the availability and quality of natural resources insecure land tenure underemployment of labour and lack of infrastructure
Resource constraints Land availability Indonesia is the worlds largest nation archipelago made up of 17 508 islands of which just over a third are inhabited Java is the most densely populated island accommodating more than half of Indonesias population (57 per cent in 2013) on only 7 per cent of the total land area (Map 1)
Map 1 Map of Indonesia
Source GeoNetwork Food and Agriculture Organization of the United Nations (FAO 2012)
About 30 per cent of Indonesias land area (545 000 square kilometres) is classified as agricultural land (World Bank 2014) Of this 43 per cent or 235 000 square kilometres is considered arable that is land under annual crops or any fallow or pasture land used for annual crops within any five-year period The remaining agricultural land is either devoted to plantation crops (such as oil palm coconut rubber coffee and sugar cane) or permanent pasture (natural or seeded grassland that remains unploughed for many years)
10
The islands of Java Bali and large parts of Sumatra are home to irrigated lowland rice-paddy terraces and upland rain fed farming The average size of farms producing rice and other food crops such as maize peanuts and cassava ranges from 03 hectares on Java to 14 hectares elsewhere (OECD 2013) Java produces around half of Indonesias rice Expansion of the lowland rice area in Java is limited because of increasing competition for land with other crops and non-agricultural uses such as industry uses housing and roads (FAO 2005)
The plantation and industrial crops sector dominated by oil palm coconut and natural rubber makes up 15 per cent of total crop area Large private and state-owned farms are involved in these perennial cropsmdashmainly in Kalimantan and Sumatra and mainly for producing oil palm and natural rubbermdashbut there are also many smallholders The average farm size in this sector is 2 600 hectares (OECD 2013)
Until 2010 growth in agricultural production relied largely on converting forested areas into agricultural land particularly to oil palm plantations In the past two decades millions of hectares were cleared for this purpose Just over half of Indonesias total land was classified as forest area in 2011 compared with 65 per cent in 1990 (Figure 8) Driving this trend has been the growing global demand for edible oils and the price competitiveness of palm oil relative to alternatives such as soybean oil (Rabobank 2013) Much of the deforestation is concentrated in Sumatra and Kalimantan
Figure 8 Land use in Indonesia
Note Share of total land area Source World Development indicators World Bank Group (World Bank 2014)
Many less populated islands remain densely forested and are home to forest and coastal communities that sustain themselves through agriculture hunting foraging and fishing (USAID nd) Indonesias Ministry of Forestry estimates of bush shrub grass and barren land across Indonesia total 22 million hectaresmdasharound half of which is located in Kalimantan and Papua McKinsey Global Institute (2012) estimates almost 7 million hectares of this land (much of which used to be in agricultural production but has since been abandoned) could be developed for agricultural production Alexandratos and Bruinsma (2012) project that between 2009 and 2050 total arable land in Indonesia will increase by 75 per centmdashan assumption used in the modelling in this report
20
40
60
80
100
1990 1993 1996 1999 2002 2005 2008 2011
Other
Agriculture
Forest area
11
Land degradation Indonesia is regularly described as being a highly fertile country but land quality varies across the archipelago The central islands have more fertile soils and hence are densely populated Agricultural land in Java in particular has benefited from high levels of mineral fertiliser application soil and water erosion control programmes and relatively good soil (FAO 2005) In contrast the soils of the outer less populated islands are characterised by highly weathered acidic soils that require higher fertiliser inputs to achieve the high crop yields obtained in Java and the other central islands Actual fertiliser use in the outer islands is generally lower than on Java resulting in soil nutrient depletion in the upland crop areas (FAO 2005)
Erosion and associated problems of nutrient depletion are minimal on Java because of the system of flat terracing and well-maintained irrigation schemes However in the lower-potential rain fed uplands where crops such as maize and cassava are produced on sloping hillsides erosion problems and nutrient depletion are more prevalent Where deforestation has occurred to make way for plantation crops loss of forest cover has led to watershed degradation silting of waterways flooding soil erosion and decline in soil quality and soil productivity (World Bank 2009)
Land tenure Land parcels in Indonesia are highly fragmented particularly on smallholder farms As land is passed down the generations it tends to become divided into smaller parcels (McKinsey Global Institute 2013) While the law requires that all land rights be registered most of these inherited parcels are unregistered less than 25 per cent of rural land parcel holders have been registered in the 40 years since land registration began (OECD 2012b) Additionally a large share of land off Java is communal rather than privately titled Land rights of these communities are often not formally recognised increasing the risk of conflict
The implications of the land tenure arrangements are that for large investors gaining access to land is a long and unclear process As a result only limited land rights are granted which compromises the extent to which production can increase (OECD 2012b) For smallholders unclear land tenure or nonexistence of certificated land registration compounds the difficulties of gaining access to credit from financial institutions This discourages investment in productivity-enhancing technology and biases farmers choices away from longer-term activities such as tree crops (World Bank 2010)
Fertiliser use The Indonesian Government maintains a ceiling price on fertiliser which depending on fertiliser type is between 50 per cent and 75 per cent lower than the market price (Sudaryanto 2014) Lower fertiliser prices are intended to encourage increased crop production particularly of rice The government provides a subsidy to fertiliser manufacturers to compensate them for selling fertiliser below market prices Despite the subsidy payment the incentives for fertiliser manufacturers to increase production and compete with one another are limited by government regulation of production quantities prices and locations where fertiliser can be sold (Osorio et al 2011)
The use of fertiliser is unevenly distributed across the archipelago Among food crops the highest application rates per hectare are for rice followed by maize and soybeans The lowest are for peanut and cassava The subsidy and resulting increase in fertiliser use led to more than a doubling of rice production between 1970 and 2000 Over that period total annual fertiliser
12
use increased from 635 000 tonnes to 59 million tonnes more than half of which was used to increase rice production (FAO 2005)
Fertilisers remain underused on plantation crops Large areas of plantation crops are owned and managed by smallholder farmers For many the lack of knowledge about appropriate fertilisation technology and the lack of reliable and timely access to the right fertilisers at village level lead to inadequate and unbalanced application (FAO 2005)
Apart from the budgetary burden subsidising domestic fertiliser prices results in inefficient fertiliser use at the farm level Studies in West Java report rice farmers applying levels of fertilisers higher than the recommended rates with some soil tests showing nutrient reserves had built up to high levels negatively affecting yields (FAO 2005 Osorio et al 2011)
Farm labour and mechanisation Indonesian agriculture is dominated by abundant labour in relation to available agricultural land contributing to the issue of small-scale production The agriculture forestry and fishing sector employs around 40 million people or 35 per cent of the workforce (15 years and over) and is the main source of employment in rural areas (Indonesian Central Bureau of Statistics 2015c McKinsey 2012) The proportion of landless and land-poor agricultural households is especially high on Java Of more than 17 million households on Java characterised as farmer or agricultural labourer households 39 per cent neither lease nor own any crop land and another 44 per cent lease or own less than 05 hectares (USAID nd)
Tradition is one obstacle to agricultural development in Indonesia (Shahaf 2009) In many cases farmers grow the same crops as previous generations using the same such methods and tools Sometimes two or three generations work the same farm
Traditionally particularly in Java harvesting is undertaken primarily by manual labour (Yamauchi 2014) Machines are rarely used However outside Java the emergence of larger scale farmers had led to operations scaling up through mechanisation This has contributed to a rise in farm labour productivity since 2000 (Figure 9)
Figure 9 Agriculture value added per farm worker Indonesia
Source World Development indicators World Bank Group (World Bank 2014)
Currently tractors are used for land preparation activities such as primary and secondary tillage while seeding and planting activities continue to be done manually Threshers are used in more developed areas where agricultural labour has become scarce as a result of competitive wages in other industries
2005 US$
200
400
600
800
1 000
1 200
1980 1984 1988 1992 1996 2000 2004 2008 2012
13
Wage growth in recent years may have led to the introduction of labour saving practices among relatively large farmers such as renting more land and acquiring machinery (Yamauchi 2014) In contrast small farmers have not significantly changed their behaviours
Infrastructure As the worlds largest archipelago Indonesias insufficient and poor quality infrastructure is a major challenge for connectivity between the islands High transport costs also undermine the competitiveness of agricultural industries and associated supply chains (Rabobank 2013 OECD 2012b) With most transport developments concentrated in Java access to markets for the rest of Indonesia is poor
Ninety per cent of freight and 80 per cent of passenger traffic in Indonesia moves by road However roads are heavily congested and their quality in urban and provincial areas is poor (The Canadian Trade Commissioner Service 2011) Because connectivity with markets is compromised by an inadequate road system returns to agricultural producers are often discounted because of spoilage incurred during transport (Global Business Guide Indonesia 2012)
Indonesia has around 300 ports spread throughout the archipelago Inter-island shipping consisting of ferry and cargo shipping services accounts for around 60 per cent of total seaborne cargo in the country (World Bank 2013) Seaports in Indonesia are outdated and investment in port facilities has not matched the rapid growth of traffic moving through them As a result inefficiencies in the shipping system such as bottlenecks and delays in cargo handling are common Vessels also often leave the main port Tanjung Priok before they are fully loaded to keep to published schedules (The Canadian Trade Commissioner Service 2011)
Current infrastructure does not support internal trade well and challenges Indonesiarsquos ability to provide its own food to its own people Developing an efficient transport and logistics system would not only increase the competitiveness of Indonesias external trade but would also provide easier and cheaper access for local agricultural products to domestic markets with reduced losses through spoilage Until this is achieved Indonesian supply chains will continue to be uncompetitive inefficient and looking to other markets to satisfy agrifood demand particularly in urban centres
Water availability While Indonesias water supplies may be sufficient for current agricultural production deterioration of the existing irrigation infrastructure and investment constraints to improve or develop new infrastructure may limit Indonesias future water availability given rapid urbanisation and food demands
Growing municipal water needs and the needs of the agriculture sector to increase production to meet the demands of urban consumers is likely to result in water shortages in coming decades The McKinsey Global Institute projects that by 2030 water supplies will fall short of demand by around 18 per cent (McKinsey 2012) Significant investment is required to improve water productivity and reduce water transmission losses through rehabilitating old and damaged irrigation infrastructure Up to half of Indonesias piped water supply is estimated to be lost in transmission (McKinsey 2012)
Feed availability Increasing demand for meat protein has stimulated the establishment of large scale commercial poultry farms and beef cattle feedlots Data from the Indonesian Feed Millers Association show
14
the poultry industry consumes 83 per cent of Indonesias animal feed the aquaculture industry consumes 11 per cent and cattle and pig industries the remaining 6 per cent (USDAndashFAS 2014)
On average Indonesias livestock feed is composed of maize (50 per cent) soybean meal (15 to 20 per cent) rice bran (15 per cent) wheat pollard (8 per cent) fish meal (5 per cent) maize gluten meal (3 per cent) and crude palm oil (2 per cent) (USDAndashFAS 2014) While most maize is sourced domestically inconsistent seasonal supplies and storage challenges such as high moisture content and aflatoxin levels are major factors that are leading feed millers to import increasing quantities of maize Canola meal is being used increasingly in poultry diets as a cost competitive alternative to soybean meal However its use is restricted to less than full replacement of soybean meal because of canolarsquos lower energy and protein content and the presence of antinutritional factors such as lower amino acid digestibility than in soybean meal (Khajali and Slominski 2012) Apart from maize and agri-industrial by-products such as rice bran copra meal and palm kernel meal other feed ingredients are largely imported (Table 3)
In food crop producing areas fibrous agricultural residues have become the main feed source for ruminant animals raised by small scale livestock producers Rice straw is fed as a base roughage but additional good quality feedstuff or concentratesmdashsuch as leaves and stalks of cassava leaves of maize and sugarcane leaves stems and peelings of banana rice bran pods and peelings of cacao and the fronds pressed fibre and palm kernel cake from oil palmmdashare required to gain higher production performance (Djajanegara 1999) Such feeds are available in various locations but their unequal distribution and high prices at the farm level limit their use by smallholder farmers Lack of storage and labour shortages during harvest time also restrict the collection of rice straw These limitations as well as the seasonal nature of these feedstuffs affect continuity of supply and therefore the productivity potential of smallholder livestock producers
Table 3 Indonesian animal feed sources of primary ingredients
Feed ingredient Local share () Imported share ()
Maize 90ndash95 5ndash10
Fish meal 5ndash10 90ndash95
Meat and bone meal (MBM) 0 100
Soybean meal 0 100
Rapeseed meal 0 100
Maize gluten meal 0 100
Feed additive 0 100
Rice bran 100 0
Copra meal 100 0
Palm kernel meal 100 0
Crude palm oil (CPO) 100 0 Source Indonesia grain and feed annual report 2014 United States Department of Agriculture (USDAndashFAS 2014)
Productivity There has been significant growth in the volume of total agricultural output in Indonesia over the past 50 years although the rate of growth has varied markedly over the decades The contribution of increased total factor productivity (TFP) to total agricultural output growth (including food crops and non-food cash crops) was strong during the 1960s and 1970s as new
15
technologies and improved crop varieties were widely adopted during the green revolution (Table 4) (Fuglie 2010 2012) In the 1980s land and labour use expanded enabling total agricultural output to grow but TFP growth slowed During the 1990s average agricultural output growth declined to less than 2 per cent a year as the green revolution crop varieties had already been widely adopted and no newer higher yielding varieties were suitable or available However TFP growth was stronger than the previous decade
Table 4 Average annual food and non-food agricultural output and total factor productivity growth Indonesia
Years Agricultural output Agricultural TFP
1961ndash1970 271 175
1971ndash1980 334 140
1981ndash1990 464 059
1991ndash2000 187 099
2001ndash2009 486 368 Note Agricultural output measured in volume Source Fuglie 2012
Between 2001 and 2009 strong output and TFP growth resumed for a number of reasons Newly available crop land achieved by the clearing of forested areas supported the expansion and diversification of agriculture into higher value non-staple commodities such as tropical perennials horticulture and livestock At the same time the relatively low price of fertilisers and chemicals available to producers led to a 50 per cent increase in their use between 2002 and 2009 (Figure 10) resulting in a marked improvement in crop yields compared with the previous decade (OECDndashFAO 2014) Improved literacy and education of the farm labour force also contributed to productivity growth (OECD 2012b)
Figure 10 Total fertilizer use in Indonesia by type
Note 2001 data not available Source FAOSTAT Food and Agriculture Organization of the United Nations (FAO 2015)
TFP estimates do not exist for the period since 2010 While yield growth is not as robust a measure of technical change as TFP yield trends can provide a partial indication of changes in productivity Average annual yield growth between 2011 and 2013 was lower than in the
Mt
1
2
3
2002 2003 2004 2005 2006 2007 2008 2009
Nitrogen
Potash
Phosphate
16
periods 2001ndash05 and 2006ndash10 across a range of food and non-food crops (Table 5) A number of factors explain this slowdown The rate of conversion of forest land to cropping slowed significantly reducing the rate of agricultural output growth achieved through additional agricultural land (OECD 2012b) In addition the sustained overuse of fertilizers and chemicals throughout the 2000s has led to decreasing returns to scale for these intermediate inputs As a result any future increase in the productivity of food and non-food crops is unlikely to be achieved through the application of chemicals or fertilisers
Table 5 Average annual yield growth of food and non-food cash crops Indonesia
Commodity Unit 1991-95 1996-00 2001-05 2006-10 2011-13
Food crops
Rice 02 03 08 19 09
Maize 12 42 46 52 30
Cassava -06 15 50 49 36
Mung beans -03 -67 44 23 -02
Soybeans 04 17 11 11 12
Groundnuts -34 58 15 16 02
Vegetables a 93 -08 35 -17 -68
Cash crops
Rubber na -01 45 58 48
Crude palm oil na -72 108 -06 12
Palm kernel na -104 120 08 -10
Cocoa na 05 143 21 -30
Coffee na 24 14 62 37
Tea na 02 30 -05 -11 a Vegetable data available to 2012 Source FAOSTAT Food and Agriculture Organization of the United Nations (FAO 2015)
With reduced scope for expansion in agricultural production through both conversion of forest land and increased use of fertilisers and chemicals future agricultural productivity growth is likely to be achieved through the more efficient use of inputs The dominance of smallholdings remains a constraint to achieving higher agricultural productivity growth in future as small plots impede the implementation of more productive practices This is compounded by inefficient fertiliser use limited mechanisation and an inadequate supply of other important inputs such as high-yielding seeds irrigation systems extension services and access to credit Addressing these issues will be key to future productivity trends
17
4 Indonesian agricultural and food policies
The objectives of Indonesias agricultural policy as stated by the Indonesian Ministry of Agriculture in 2010 are to
1) achieve food self-sufficiency
2) enhance diversification of production and consumption
3) raise the competitiveness and value added of production and
4) increase farmersrsquo welfare (OECD 2012b)
To achieve its objectives the Indonesian Government intervenes in the farm sector with multiple policy instruments The government also implements policies to protect consumers from fluctuations in prices of key food products such as wheat rice and vegetable oils and to insulate domestic producers from foreign competition Food for consumers is subsidised which effectively maintains the price of food within a narrow price band Producers benefit from tariffs applied to imported food which keep the price of domestically produced food competitive with imports Additionally producers are directly supported by government food purchases at guaranteed prices and subsidies on farm inputs such as fertiliser seed and farm equipment
Policies to support agricultural production Reference prices and import restrictions The Indonesian Government sets reference prices for rice sugar and beef which it aims to maintain through various policy instruments
On average around 70 per cent of domestic rice production is consumed within the farming household (OECD 2012b) The remainder is sold through either private or government-run channels such as Indonesias National Food Logistics Agency known as Badan Ursan Logistik (BULOG) BULOG purchases a limited amount of rice at the reference price to fulfil two objectives
1) stockholding for emergency purposes and
2) redistribution as part of the consumer subsidy programme Raskin (discussed below) (OECD 2012b)
In 2010 BULOG procured around 6 per cent of total domestic rice production equivalent to around 20 per cent of all marketed rice (OECD 2012b)
For sugar the government supports the producer price by imposing legal requirements on domestic sugar millers who control the domestic sugar market Sugar millers are required to purchase 75 per cent of their sugar cane requirements from domestic sugar cane growers and to pay growers a government-determined price
The Indonesian rice and sugar industries are also protected by import restrictions Companies that import rice and sugar are required to support the domestic industry by buying domestically produced product if the mill price falls below the reference price
18
For beef and live cattle imports the Indonesian Government sets a reference price which it aims to achieve by managing import volumes through an import permit system Since 2014 the reference price has been 76 000 rupiah (A$720) a kilogram Under the system import permits are not issued if domestic beef prices fall below the reference price (ABARES 2013) Weight restrictions on cattle imports also usually apply limiting imports to young lighter cattle destined for feedlots
The Indonesian Government also restricts imports of other commodities such as soybeans maize horticulture certain processed foods and animals and animal products (including fresh chilled and frozen meat and eggs) Importing these commodities is generally not permitted if the Ministry of Trade considers it will cause injury to the domestic industry (WTO 2013) Companies seeking to import these commodities are required to gain approval from the Indonesian Ministry of Trade (OECD 2012b)
Tariffs Tariffs are applied to most imported food products in Indonesia However they are relatively low and are not a major policy instrument used to protect domestic industries The average applied agricultural tariff was 53 per cent in 2010 (OECD 2012b) Around 85 per cent of agricultural imports are subject to tariffs between zero and 5 per cent with almost 66 per cent entering duty free All agricultural tariffs are ad valorem except for rice and sugar which have specific tariffs (OECD 2012b)
While applied tariffs are low bound tariff rates or the ceiling rate that can be applied under World Trade Organisation rules remain high (Figure 11) On average the bound rate on agricultural products is 47 per cent (OECD 2012b) The highest bound tariff is 210 per cent for milk powders although the applied rate is just 5 per cent Rice has a bound tariff of 160 per cent and an applied specific rate of 450 rupiah a kilogram (equivalent to an ad valorem tariff of 10 per cent when using the average export price for 15 per cent broken rice from Thailand in 2010) (OECD 2012b)
Figure 11 Average bound and applied tariffs by product groups
Source OECD Review of Agricultural Policies Indonesia 2012 Organisation for Economic Co-operation and Development (OECD 2012b)
0
20
40
60
80
Fruit and vegetables
Sugars and confectionery
Cereals Dairy products
Animals and animal
products
Oilseeds fats and oils
Average bound tariff
Average applied tariff
19
Input subsidies The Indonesian Government supports farmers by subsiding inputs such as fertiliser seeds and ad hoc products including power tools and rice milling units Fertiliser support is the largest component of budgetary support for agriculture accounting for 37 per cent in 2008ndash09 (OECD 2012b) Not all farmers receive input subsidies because eligibility requirements apply in many cases For example subsidised fertiliser is only available to farmers producing on less than 2 hectares
Policies to support consumers Price intervention The Indonesian Government intervenes in the domestic market for wheat flour maize and cooking oil when it considers retail prices too high for the poor It does this using a broad range of measures from simply asking manufacturers and wholesalers to be socially responsible with their pricing to purchasing these products and distributing them directly to poor households (OECD 2012b) Another policy often used is the government covered value tax under which the government waives the existing 10 per cent value added tax on the final price of certain food items For example the government has used this policy to reduce the price of non-branded cooking oil since 2007 In 2010 this policy cost the Indonesian Government around 250 billion rupiah (A$299 million)
Food subsidies The Indonesian Government operates a targeted rice subsidy programme known as Raskin to combat food insecurity The programmes objective is to make available a set quantity of rice (procured by BULOG) at a subsidised price to Indonesias poorest households on a monthly basis Raskins intention is to provide rice to those on official lists of households living under or near the national poverty line (World Bank 2012b) The poverty line in 2014 was around 318 500 rupiah per person a month in urban areas and 286 100 rupiah per person a month in rural areas (Indonesian Central Bureau of Statistics 2015a) Those with incomes within 20 per cent of the poverty line are defined as being near the poverty line (World Bank 2012b)
Despite the objectives of Raskin to target the most vulnerable since allocations of Raskin rice to households are decided by local authorities poor and non-poor households alike benefit from the programme In 2010 around 175 million households received Raskin rice (OECD 2012b) at a cost of around 14 trillion rupiah (A$17 billion) to the Indonesian Government (Figure 12) Between 2005 and 2010 the subsidised price was 1 600 rupiah (A$019) a kilogram representing about 20 to 25 per cent of the average market price (World Bank 2012a)
The quantity of rice per household the subsidised price the number of months a year that rice is distributed and the classification of the poorest households have all been altered over the period of the programme For example monthly allocations per household have been set as low as 10 kilograms and as high as 20 kilograms over the programme period although households rarely benefit from the full amount of the allocation (OECD 2012b World Bank 2012a)
20
Figure 12 Raskin rice distribution and budgetary cost
Source OECD Review of Agricultural Policies Indonesia 2012 Organisation for Economic Co-operation and Development (OECD 2012b)
Implications of agricultural and food policies Public expenditure on Indonesian agriculture has increased under its current policy settings In 2009 public spending was around 615 trillion rupiah (A$75 billion) This was equivalent to 56 per cent of total government expenditure compared with 27 per cent in 2001 (World Bank 2011) The fertiliser subsidy and Raskin have been the biggest drivers of increased spending over this period
In addition to the direct budget cost of Indonesias agricultural and food policies there have also been allocative effects Indonesian policies tend to focus on rice maize and sugar leading to increased production of these commodities and improved availability from domestic sources However expansion of these crops has come at the expense of horticulture and other commodities in which Indonesia has a comparative advantage such as natural rubber cocoa and spices (World Bank 2011)
The administration of some support programmes the fertiliser subsidy in particular is inefficient (Sudaryanto 2014) As discussed in Chapter 3 subsidising fertiliser companies in an environment where quantities prices and distribution channels are regulated reduces incentives for these companies to effectively compete This inefficiency has resulted in the under-production of fertiliser leading to shortages At the same time the artificially low price has led to an over-reliance on fertiliser by producers to increase yield rather than using other methods such as improved seeds (World Bank 2011)
4000
8000
12000
16000
2000 2002 2004 2006 2008 20100
1
2
3
4
Expenditure on RASKIN
Quantity of rice distributed (right axis)
Million tonnes
Billionrupiah
21
5 Simulation results Baseline assumptions The objective in this analysis is to identify and quantify projected changes in Indonesian demand for a range of agrifood commodities over the longer term across urban and rural households An updated version of the ABARES agrifood model (Linehan et al 2012a) is used to investigate these potential trends The model has been modified to include Indonesias consumer subsidy policy (Raskin) and a re-aggregation of some country and commodity groups to allow more detailed analysis
Indonesia has a comparative advantage in the production of many cash crops and non-food agricultural commodities that are not included in the ABARES agrifood model such as natural rubber copra palm kernels coffee cocoa and spices (FAO 2013) In Indonesia the production of these commodities competes with food commodities for resources despite a policy environment targeted at food production and food self-sufficiency
Given Indonesias limited supply of arable land and the quality and availability of its water supply the capacity of the domestic agricultural sector to meet the growing demand for food in Indonesia will depend heavily on improvements in productivity Total factor productivity (TFP) growth in Indonesian agriculture is estimated to have averaged 154 per cent a year since 1961 It is expected that yield growth in Indonesia will not decline from this average annual rate in the future because the potential for productivity growth remains significant However nor is it expected to continue at the relatively high rates estimated for the period 2001 to 2009 which were made possible from the expansion of agriculture into higher-value non-staple commodities on newly deforested land and a significant increase in the use of chemical fertilisers (see Chapter 4)
Productivity growth since 2010 is estimated to have slowed from the decade 2001ndash2009 The Indonesian Governments policy initiative Reducing Emissions from Deforestation and Forest Degradation (REDD) in 2010 and declaration of a two-year Forest Moratorium in 2011 have slowed the rate of forest conversion to crop land (OECD 2012b) In addition agricultural production continues to be constrained by the issues outlined in Chapter 4 (including decreasing returns to scale for chemical inputs lack of widespread mechanisation and deteriorating resource base) With ongoing competition between the production of food crops and non-food cash crops (in which Indonesia has a comparative advantage) and little prospects in the foreseeable future for major policy changes on food consumption and production TFP growth for food crops in Indonesia is assumed to average 154 per cent a year between 2009 and 2050 This is close to the forecast by Ludena et al (2007) of 152 per cent a year to 2040 (FAO 2013 USDAndashFAS 2014)
Growth rates for TFP for individual commodities have in the past shown similar patterns to growth in yields Assumptions of TFP growth rates for individual commodities are therefore derived by apportioning the assumed rate for the whole of agriculture by historical growth in the yields of each commodity (Table 6)
22
Table 6 Average annual TFP growth rate by industry in Indonesia 2009 to 2050
Industry
Rice 214
Maize 337
Coarse grains 335
Other cereals 239
Oilseeds 388
Vegetables 232
Fruit 303
Beef 032
Sheep and goat meat 144
Poultry 144
Eggs 135
Dairy 215
All Agriculture 154 Source ABARES model assumption
In the reference case no change to Indonesias market support policies is assumed over the projection period On the production side these include the principal forms of market support of state trading input subsidies and import restrictions Additionally the Indonesian Governments minimum support prices for rice and wheat are maintained in real terms as are other ad hoc interventions on a range of agricultural commodities
The government support received by consumers through the consumer subsidy policy Raskin is also maintained in real terms over the projection period (discussed in Chapter 4)
The baseline projections determined in the agrifood model for Indonesia are also dependent on a set of assumptions discussed in Chapters 2 and 3 To summarise
bull population growth is assumed to average 07 per cent a year between 2010 and 2050
bull the proportion of the population in urban areas is assumed to increase from 50 per cent in 2009 to 72 per cent by 2050
bull average annual GDP growth in Indonesia is assumed to average 53 per cent a year between 2010 and 2030 before weakening between 2030 and 2050 to average 34 per cent a year (Table 1)
bull average annual income growth is assumed to be 56 per cent a year in urban areas and 21 per cent a year in rural areas
agricultural productivity in Indonesia is assumed to continue to increase according to the growth estimates provided in Table 6
The population is divided into two income stratamdashurban income and rural income households Across these two household types the income growth assumptions to 2050 for urban and rural areas are based on historical income data from the Indonesian Central Bureau of Statistics (2011) These data demonstrate that not only is average urban income higher than average rural income but with urbanisation average income growth in urban areas has also been higher than
23
in rural areas This has been the result of a relatively faster rate of economic development and higher wages which have stemmed from the growth in the manufacturing and services sectors prevalent in urban areas The model assumes this trend in income growth will continue to 2050 Indonesian household food consumption data in the base year of the model are from the Indonesian Central Bureau of Statistics (2014) and Widarjono (2012) These data were used as the basis in the model to project food consumption across urban and rural households to 2050
In the model total and per person Indonesian food consumption and total urban and rural food consumption is apparent consumption which reflects the total use of agrifood products (food feed and industrial use) In contrast per person urban and rural consumption is direct food consumption only it excludes feed use and industrial use of agrifood products to better reflect changes in diets
Consumption The real value of total food consumption in Indonesia (including food feed and industrial use) is projected to quadruple between 2009 and 2050 to US$327 billion (in 2009 US dollars) The largest increases are for meat dairy products fruit and vegetables as real incomes increase (Figure 13) Together these commodities account for two-thirds of the projected rise in the real value of food consumption
Figure 13 Consumption of selected agricultural commodities Indonesia
Note Starchy staples include pulses yams potatoes and cassava Source ABARES model output
Between 2009 and 2050 the real value of Indonesian beef consumption is projected to rise more than 14 times to US$35 billion (in 2009 US dollars) dairy products ten times to almost US$9 billion and fruit and vegetables more than three times to US$50 billion and US$25 billion respectively For many commodities the value of consumption in 2050 is projected to rise from a very low base reflecting high poverty rates and a large rural population in 2009 By 2050 72 per cent of the population is projected to live in urban centres with higher incomes than the
10 20 30 40 50 60
Wheat
Sheep and goat meat
Dairy
Sugar
Oil crops
Rice
Vegetables
Starchy staples
Beef
Poultry
Fruit
2050
2009
Billion(2009 US$)
552
66
231
1311
269
1319
256
246
935
1340
113
24
rural cohort It is this expected transition of the population and income growth that drive the magnitude of projected consumption growth for many commodities Despite these large increases Indonesias per person food consumption in 2050 is projected to remain below that of China for many commodities (Hamshere et al 2014)
For cereals oil crops and starchy staples (pulses potatoes yams and cassava) consumption is also projected to increase Between 2009 and 2050 the real value of rice consumption is projected to rise by 66 per cent to nearly US$23 billion (in 2009 US dollars) maize by 182 per cent to US$8 billion oil crops by 246 per cent to US$22 billion and starchy staples by 256 per cent to almost US$29 billion Over this period the real value of sugar consumption is projected to rise more than six times to US$14 billion (in 2009 US dollars)
The projected rise in consumption of cereals oil crops and starchy staples is driven by a number of factors First cereals and starchy staples (such as cassava) are relatively affordable foods particularly for low and middle income consumers whose populations are projected to rise Although both cereals and starchy staples will remain important components of Indonesian diets to 2050 their relative contribution will decline as diets become more diversified with greater amounts of meats dairy products and fruit and vegetablesmdashthe continuation of a trend that began around 1990 (Figure 5)
The projected rise in consumption of cereals oil crops and starchy staples is also driven by feed requirements which will increase as the demand for meat protein rises to 2050 As discussed in Chapter 3 about 50 per cent of domestic maize production is used as feed Rice bran also comprises about 15 per cent of total Indonesian feed consumption Soybean meal comprises between 15 per cent and 20 per cent of total livestock feed all of which is imported Rapeseed meal can be used as a partial substitute for soybeans and it too is entirely imported In 2050 it is projected that feed use will account for around 42 per cent of total maize consumption 43 per cent of total oil crop consumption and 44 per cent of total starchy staple consumption a larger proportion of which will need to be imported compared with 2009
Urban and rural consumption In 2050 71 per cent of Indonesias population is projected to live in urban areas compared with 54 per cent in 2015 (United Nations Population Division 2014) By 2050 Indonesian consumers are projected to have more diverse diets with greater consumption of meat dairy products fruit and vegetables
In this section the results for total urban and rural consumption reflect apparent consumption However per person rural and urban consumption is direct food consumption only Feed use and industrial use of the agrifood products are excluded in the per person results in order to better understand the projected change in diets
High value commodities Urban consumers account for most of the growth in consumption of meat dairy products fruit and vegetables over the projection period because of rising urban populations and incomes Between 2009 and 2050 the real value of urban beef consumption is projected to rise more than 18 times to US$34 billion (in 2009 US dollars) Consumption of dairy products is projected to rise by more than 14 times to more than US$8 billion and fruit and vegetables more than four times to US$43 billion and almost US$21 billion respectively (Figure 14)
25
Figure 14 Urban consumption of selected agricultural commodities Indonesia
Source ABARES model output
In per person terms the value of urban beef consumption is projected to rise more than nine times between 2009 and 2050 dairy more than seven times and fruit and vegetables to more than double However consumption of rice is projected to fall by 4 per cent While these increases are large Indonesias urban per person consumption in 2050 is still projected to be lower than that of China in the same year for many commodities including vegetables (73 per cent lower) oilseeds (12 per cent) dairy products (41 per cent) and sheep and goat meat (24 per cent) In contrast Indonesias urban per person consumption is projected to be higher than Chinas for beef (52 per cent higher) sugar (400 per cent) cereals (23 per cent) and starchy staples (14 times higher) (Hamshere et al 2014) For beef higher Indonesian per person consumption relative to China in 2050 reflects the dominance of beef in Indonesian diets by that time compared with China where pig meat consumption is significant Similarly the projected rise in per person consumption of starches in Indonesia mainly reflects higher consumption of cassava a culturally important food crop
For rural consumers total growth in consumption of meat dairy products fruit and vegetables is lower than for urban households This can be attributed to relatively lower rural incomes and a decline in the absolute size of the rural population Between 2009 and 2050 total rural beef consumption is projected to rise by 95 per cent to more than US$1 billion (in 2009 US dollars) dairy products by 75 per cent to US$05 billion fruit by 41 per cent to almost US$7 billion and vegetables by 42 per cent to almost US$5 billion (Figure 15)
20 40 60
Wheat
Sheep and goat meat
Dairy
Sugar
Oil crops
Rice
Vegetables
Starchy staples
Beef
Poultry
Fruit
Billion(2009 US$)
387
1724
1734
426
875
370
547
1349
Total food consumption
1761
91
173
50 100 150 200
Wheat
Sheep and goat meat
Dairy
Sugar
Oil crops
Rice
Vegetables
Starchy staples
Beef
Poultry
Fruit
2009 US$
145
819
824
165
391
137
226
630
Per person consumption
837
-4
38
26
Figure 15 Rural consumption of selected agricultural commodities Indonesia
Source ABARES model output
Between 2009 and 2050 rural per person consumption of each of the agrifood commodity groups is projected to change by a similar magnitude as urban consumption In value terms rural per person consumption of beef is projected to rise by 162 per cent dairy products by 135 per cent fruit by 90 per cent and vegetables by 92 per cent Similar increases are projected for rice (96 per cent) wheat (128 per cent) and starchy staples (116 per cent)
Again despite these significant increases rural per person consumption in Indonesia is projected to be lower than that of China in 2050 for all products except sugar which is projected to be 117 per cent higher For all other commodity groups rural per person consumption is projected to be lower than in China including sheep and goat meat (85 per cent lower) dairy (54 per cent) starches (32 per cent) cereals (56 per cent) and vegetables (86 per cent)
For both rural and urban consumers the rise in the real value of total food consumption in 2050 is principally the result of an increase in the quantity consumed rather than a projected significant rise in the real price This is especially pronounced in urban households For example between 2009 and 2050 beef consumption by urban households is projected to rise by more than 15 times and sheep and goat meat by 13 times In contrast rural beef consumption over this period is projected to rise by 64 per cent and sheep and goat meat by 44 per cent
Projected consumption growth of cereals and starchy staples between 2009 and 2050 is most pronounced in urban areas Rising urban consumption of these commodities is largely the result of population growth Urban consumption of wheat is projected to rise by 173 per cent to around US$2 billion (in 2009 US dollars) rice by 91 per cent to US$9 billion and starchy staples (which includes pulses potatoes yams and cassava) by 426 per cent to US$13 billion
Rural consumption of cereals and starchy staples is projected to rise despite a falling rural population As incomes rise towards 2050 the relatively affordable prices of these commodities will drive rural consumption Between 2009 and 2050 rural consumption of wheat is projected
2 4 6 8 10
Wheat
Sheep and goat meat
Dairy
Sugar
Oil crops
Rice
Vegetables
Starchy staples
Beef
Poultry
Fruit
Billion(2009 US$)
94
95
61
96
42
101
Total consumption
41
75
98
45
69
50 100 150 200
Wheat
Sheep and goat meat
Dairy
Sugar
Oil crops
Rice
Vegetables
Starchy staples
Beef
Poultry
Fruit
2050
2009
2009 US$
90
161
162
116
165
92
170
135
Per person consumption
166
96
128
27
to rise by 69 per cent to US$1 billion (in 2009 US dollars) rice by 45 per cent to almost US$9 billion and starchy staples by 61 per cent to US$3 billion
Production and trade The real value of Indonesias total agrifood production (which includes production for food feed and industrial use) is projected to more than double from US$81 billion in 2009 to US$173 billion in 2050 (in 2009 US dollars) This increase is driven by a higher value of production (in 2009 US dollars) of beef (up 209 per cent) poultry (187 per cent) starchy staples (115 per cent) vegetables (92 per cent) fruit (78 per cent) and rice and palm oil (up 77 per cent each) (Figure 16) The value of maize production divided almost equally between feed and food use is projected to increase by 78 per cent
Figure 16 Production of selected agricultural commodities Indonesia
Source ABARES model output
For some agricultural products such as rice and beef rising production partly reflects domestic policies that favour their production For example the real value of rice production between 2009 and 2050 is projected to rise by 77 per cent because of the assumption that producers continue to receive a minimum support price and input subsidies Indonesia is projected to switch from being an importer to an exporter of rice by 2050 The real value of Indonesias rice exports in 2050 is projected to be around US$09 billion (in 2009 US dollars)
The real value of Indonesias palm oil production is projected to rise significantly in line with strong export demand and Indonesias comparative advantage in its production Between 2009 and 2050 Indonesias production of palm oil is projected to rise by US$13 billion to US$30 billion an increase of 77 per cent Over this period palm oil exports are projected to rise by 40 per cent to US$18 billion
10 20 30 40
Sheep and goat meat
Dairy
Sugar
Palm oil
Rice
Vegetables
Starchy staples
Beef
Poultry
Fruit
2050
2009
Billion(2009 US$)
78
187
209
115
92
77
77
76
115
361
28
Imports For some agricultural commodities such as rice and palm oil the rise in consumption by 2050 is projected to be met largely by a rise in domestic production However for most agrifood commodities production is projected to increase at a slower rate than consumption As a result food and feed imports will be an increasingly important component of Indonesias food supply towards 2050 The real value of Indonesias total agrifood imports is projected to rise more than 20 times from 2009 to US$152 billion (in 2009 US dollar terms) in 2050
By 2050 Indonesia is projected to import a wide range of horticultural products Given rising domestic demand the real value of Indonesiarsquos fruit and vegetable imports is projected to rise to US$25 billion and US$11 billion in 2050 respectively (in 2009 US dollars Figure 17) On this basis the share of imports in total Indonesian fruit consumption will rise from 3 per cent in 2009 to 53 per cent in 2050 (Figure 18) For vegetables it will rise from 9 per cent in 2009 to 47 per cent in 2050
Figure 17 Trade of selected agricultural commodities Indonesia
Source ABARES model output
-30 -20 -10 0 10 20 30
Wheat
Sheep and goat meat
Dairy
Sugar
Rice
Beef
Starchy staples
Vegetables
Fruit
2050
2009
Billion (2009 US$)
Exports Imports
Palm oil
29
Figure 18 Import share of total consumption Indonesia
Source ABARES model output
Lower-income growth scenario The baseline projections for Indonesian agrifood consumption production and trade to 2050 are reliant on the underlying assumptions presented at the beginning of this chapter Chief among these are the OECD (2012a) assumptions for Indonesian GDP growth to 2050 presented in Chapter 2 (Table 1 and Table 7) If Indonesia were to realise a lower level of income growth agrifood demand growth would be expected to be lower The World Bank projects that Indonesian GDP growth in each decade to 2050 will be markedly lower than the OECDs projections (World Bank 2015 Table 7) This scenario examines the potential effect on Indonesian agrifood consumption and import demand if GDP and hence income growth were slower over the projection period as suggested by the World Bank All other variables from the reference scenario are held constant
Table 7 Indonesia GDP growth projections 2010 to 2050
Period Baseline 1991-2010
2011-2020 2021-30 2031-40 2041-50
OECD average annual growth ()
440 530 530 340 340
World Bank average annual growth ()
440 350 350 225 225
Source OECD 2012a World Bank 2015
Results In this scenario lower economic and income growth throughout the projection period results in GDP in 2050 that is 44 per cent lower than the reference case Because agrifood consumption is sensitive to changes in income the total value of agrifood consumption in 2050 (in 2009 US dollars) is 10 per cent less than in the reference case (Figure 19) Weaker economic growth most
Fruit Vegetables Starchy staples
Beef Poultry Sugar Maize Dairy Sheep and goat meat
Wheat
10
20
30
40
50
2050 Imports
2050 Domestic production
2009 imports
2009 Domestic production
53
3
4743
86
8183
1007091
9
75846723
6
100
Billion(2009 US$)
21
50
30
strongly affects urban areas where average annual income growth in the reference case was assumed to be more than double that of rural areas As a result demand for high-value products such as meat and dairy products declines significantly Many of these products are imported In 2050 the total projected value of beef consumption (in 2009 US dollars) is 17 per cent lower than in the reference case and poultry and milk products are each 14 per cent lower The real value of consumption for many domestically produced products such as starches and maize also declines but by no more than 10 per cent for any single commodity
Weaker consumption growth leads to lower import growth over the projection period particularly for high-value commodities The total value of imports in 2050 is 16 per cent lower in this scenario compared with the reference case with the import share of total consumption 5 percentage points lower than the reference case at 42 per cent (Figure 19) Beef imports are projected to be 20 per cent lower than the reference scenario sheep and goat meat 26 per cent lower and dairy products 16 per cent lower Fruit and vegetable imports are 12 per cent and 19 per cent lower respectively
Figure 19 Agrifood consumption in 2050 under lower income growth assumption
Source ABARES model output
0 100 200 300 400
Low income scenario
Baseline case
Domestic production
Imports
Billion(2009 US$)
4258
53 47
31
6 Conclusion Continued strong income and population growth combined with greater urbanisation are driving Indonesias increasing demand for not only more food but for a wider variety of foods This demand growth is projected to be met by increases in both domestic production and imports
Assuming no major changes to Indonesias existing agricultural policies to 2050 the real value of food consumption in Indonesia is projected to increase more than four times between 2009 and 2050 The increase will be characterised by a move towards more diverse diets with higher intake of meat dairy products fruit and vegetables Between 2009 and 2050 the real value of beef consumption is projected to rise more than 14 times dairy tenfold and fruit and vegetables to more than triple These projected increases are from a relatively low base and are driven by a rise in the quantities consumed rather than any significant projected rise in real prices To support this rise in demand imports of many agrifood commodities are projected to increase to 2050
The contribution of meat dairy products fruit and vegetables in Indonesian diets will increase more quickly than cereals and staples to 2050 While cereals and starchy staples will remain important components of Indonesian diets their relative contribution will declinemdashthe continuation of a trend that began around 1990
The upward trend in food demand is most pronounced among urban households whose income growth is assumed to be more than double that of rural households A declining rural population and relatively lower incomes will result in slower growth in food consumption compared with the urban population
For most agricultural commodities assuming no significant change to historical TFP growth for total agriculture production is projected to increase at a slower rate than consumption As a result food imports will be an important component of Indonesias food and feed supply towards 2050 The real value of Indonesias agrifood imports is projected to rise more than 20 times from 2009 to US$152 billion (in 2009 US dollar terms) in 2050
The projected significant increases in consumption and import demand for food in Indonesia are based on the assumption of relatively strong income growth to 2050 Under a lower growth scenario consumption of protein-based food products such as meat and dairy products is projected to be around 14 to 17 per cent lower than the reference case at 2050 While consumption of domestically produced products is also projected to be lower in 2050 in the lower-income-growth scenario the declines are less significant compared with the baseline case
While not included in the modelling in this report there is scope for increased production of non-food agricultural commodities and cash crops in Indonesia in which it has a comparative advantage These include natural rubber copra palm kernels coffee cocoa and spices Indonesias current policies on food self-sufficiency favour investment in food industries rather than the non-food and cash crops industries This has the effect of allocating resources away from their most efficient use
Because of their geographic proximity Australia and Indonesia are well placed to benefit from advancing bilateral agricultural trade Indonesia is an important market for Australian wheat sugar live cattle beef skim milk powder and horticultural products such as grapes and citrus
32
Stronger demand for these commodities and others in Indonesia will create further opportunities for Australian exporters
33
References ABARES 2013 Agricultural commodities September quarter 2013 Australian Bureau of Agricultural and Resource Economics and Sciences Canberra pp 85-87 available at agriculturegovauabarespublications
Afif S 2014 The Rising of Middle Class in Indonesia Opportunity and Challenge Paper presented at the International Policy Exchange Conference Segovia Spain 28 September available at umdcipeorgconferencesDecliningMiddleClassesSpainpapers_presentationshtml
Alexandratos N amp Bruinsma J 2012 World agriculture towards 20302050 the 2012 revision ESA Working paper no 12-03 Food and Agriculture Organization of the United Nations Rome available at faoorgeconomicesaesagen
Djajanegara A 1999 Local livestock feed resources in Livestock industries of Indonesia prior to the Asian financial crisis Food and Agriculture Organization of the United Nations Rome available at faoorgdocrep004AB986Eab986e06htmbm06 accessed 22 January 2015
Elias S amp Noone C 2011 The growth and development of the Indonesian economy Bulletin December Quarter Reserve Bank of Australia Sydney available at rbagovaupublicationsbulletin2011dec4html
FAO 2015 lsquoFAOSTATrsquo Food and Agriculture Organization of the United Nations Rome available at faostat3faoorghomeE accessed 26 October 2015
mdashmdash 2013 Indonesia Food and Agriculture Organization of the United Nations Rome available at faoorgdocrep005y4632ey4632e0lhtm
mdashmdash2012 GeoNetwork Food and Agriculture Organization of the United Nations Rome available at faoorggeonetworksrvenmainhome accessed 15 February 2014
mdashmdash 2005 Fertiliser use by crop in Indonesia Food and Agriculture Organization of the United Nations Rome available at faoorgdocrep008y7063ey7063e00htm
Fuglie K 2012 lsquoProductivity growth and technology capital in the global agricultural economyrsquo in Fuglie KO Wang SL amp Ball VE (eds) Productivity growth in agriculture an international perspective CAB International Oxfordshire UK
mdashmdash2010 lsquoSources of growth in Indonesian agriculture Journal of Productivity Analysis vol 33 no 3 pp 225-240
Fuglie K amp Rada N 2014 International Agricultural Productivity United States Department of Agriculture Economic Research Service Washington DC available at ersusdagovdata-productsinternational-agricultural-productivityaspxU089bfmSzkd
Global Business Guide Indonesia 2012 Agriculture in Indonesia available at gbgindonesiacomenagriculturesector_overviewphp
Glover J 2011 lsquoAn international retailerrsquos perspectiversquo Paper presented at The Crawford Fund 2011 Annual Parliamentary Conference Parliament House Canberra 14 August available at crawfordfundorgevents2011-parliamentary-conference
34
Hamshere P Sheng Y Moir B Syed F amp Gunning-Trant C 2014 What China wants Analysis of Chinas food demand to 2050 ABARES research report Canberra March available at agriculturegovauabarespublications
IMF 2015 World Economic Outlook Database available at imforgexternalpubsftweo201302weodataindexaspx accessed 26 October 2015
Indonesian Central Bureau of Statistics 2015a Poverty available at bpsgoidSubjekviewid23subjekViewTab3|accordion-daftar-subjek1 accessed 27 October 2015
mdashmdash2015b Consumption and expenditure available at bpsgoidSubjekviewid5subjekViewTab3|accordion-daftar-subjek1 accessed 27 October 2015
mdashmdash2015c Population 15 Years of Age and Over Who Worked by Main Industry 2004-2014 available at bpsgoidlinkTabelStatisviewid970 accessed 27 October 2015
mdashmdash2014 Consumption and expenditure available at bpsgoidSubjekviewid5subjekViewTab3|accordion-daftar-subjek1 accessed 20 February 2014
mdashmdash2011 Total income by Household Group (billion rupiahs) available at bpsgoidSubjekviewid5subjekViewTab3|accordion-daftar-subjek1 accessed 1 August 2014
Khajali F amp Slominski BA 2012 lsquoFactors that affect the nutritive value of canola meal for poultryrsquo Poultry Science vol 91 no 10 pp 2564ndash2575 available at psoxfordjournalsorgcontent91102564fullxref-ref-95-1
Linehan V Thorpe S Andrews N amp Beaini F 2012a Food demand to 2050 Opportunities for Australian agriculture paper presented at 2012 ABARES Outlook conference Canberra 6ndash7 March available at daffgovauabarespublications
mdashmdash 2012b Food demand to 2050 Opportunities for Australian agriculturemdashalgebraic description of agrifood model technical annex to ABARES Outlook conference paper Canberra May available at daffgovauabarespublications
Ludena C Hertel T Preckel P Foster K and Nin A 2007 Productivity growth and convergence in crop ruminant and nonruminant production measurement and forecasts Agricultural Economics 37 available at onlinelibrarywileycomdoi101111j1574-0862200700218xabstract
McKinsey Global Institute 2012 The archipelago economy Unleashing Indonesias potential September Jakarta available at mckinseycominsightsasia-pacificthe_archipelago_economyashx
OECD 2013 Global Food Security Challenges for the Food and Agricultural System Organisation for Economic Cooperation and Development Paris available at oecd-ilibraryorgagriculture-and-foodglobal-food-security_9789264195363-en
mdashmdash2012a Looking to 2060 A global vision of long-term growth Economics Department Policy Notes no 15 Organisation for Economic Cooperation and Development Paris November available at oecdorgecomonetarypolicy-noteshtm
35
mdashmdash2012b OECD Review of Agricultural Policies Indonesia 2012 Organisation for Economic Cooperation and Development Paris available at oecd-ilibraryorgagriculture-and-foodoecd-review-of-agricultural-policies-indonesia-2012_9789264179011-en
OECDndashFAO 2014 OECDndashFAO Agricultural Outlook 2014 Organisation for Economic Cooperation and Development Paris available at oecd-ilibraryorgagriculture-and-foodoecd-fao-agricultural-outlook-2014_agr_outlook-2014-en
Osorio C Abriningrum D Armas E amp Firdaus M 2011 Who is benefiting from fertilizer subsidies in Indonesia Policy Research Working Paper 5758 World Bank Washington DC available at elibraryworldbankorgdoipdf1015961813-9450-5758
Rabobank 2013 Indonesia - islands of opportunity Agriculture in Focus Rabobank Food amp Agribusiness Research and Advisory Australia and New Zealand Spring Sydney
Shahaf E 2009 Agriculture in Indonesia Asia Technology Consulting available at techasiaconsultingcomagriculture_in_indonesiahtml
Statistics Indonesia 2015 Gross Domestic Product at Current Market Prices By Industrial Origin (Billion Rupiahs) 2000-2014 available at bpsgoidlinkTabelStatisviewid1199 accessed 26 October 2015
Sudaryanto T 2014 Fertilizer subsidy policy in Indonesia impacts and future perspectives Food and Fertiliser Technology Center for the Asian and Pacific Region Asia-Pacific Information Platform on Agricultural Policy (AP) available at apfftcagnetorgap_dbphpid=365
The Canadian Trade Commissioner Service 2011 lsquoAn Investment Guide to Indonesia available at tradecommissionergccaengdocumentjspdid=133467toc38
United Nations Population Division 2015 World population prospects the 2015 revision United Nations New York available at esaunorgunpdwppindexhtm accessed 12 August 2015
mdashmdash2014 World urbanisation prospects the 2014 revision United Nations New York available at esaunorgunpdwup accessed 19 March 2015
USAID nd lsquoIndonesia ndash Property rights amp resource governancersquo USAID Country Profile available at usaidlandtenurenetindonesia
USDAndashFAS 2014 Indonesia grain and feed annual report 2014 GAIN Report no ID1407 1 April Foreign Agricultural Service United States Department of Agriculture Washington DC available at usdaindonesiaorgcat=10
Widarjono A 2012 Food and nutrient demand in Indonesia PhD thesis Oklahoma State University available at shareokorgbitstreamhandle112446547Department20of20Agricultural20Economics_48pdfsequence=1
World Bank 2015 Global Economic Prospects January 2015 Having fiscal space and using it World Bank Group Washington DC available at worldbankorgenpublicationglobal-economic-prospects
mdashmdash2014 World development indicators World Bank Washington DC available at dataworldbankorgdata-catalogworld-development-indicators
36
mdashmdash2013 Transport in Indonesia World Bank Washington DC available at goworldbankorgPF2AFG64V0
mdashmdash 2012a Raskin subsidised rice delivery Public expenditure review (PER) Social assistance program and public expenditure review no 3 World Bank Washington DC available at documentsworldbankorgcurateden20120215893857raskin-subsidized-rice-delivery
mdashmdash2012b Targeting poor and vulnerable households in Indonesia World Bank Washington DC available at documentsworldbankorgcurateden20120115879773targeting-poor-vulnerable-households-indonesia
mdashmdash2011 Indonesia Agriculture Public Expenditure Review 2010 World Bank Jakarta available at documentsworldbankorgcurateden20110919456223indonesia-agriculture-public-expenditure-review-2010
mdashmdash2010 Completing decentralization World Bank Jakarta available at documentsworldbankorgcurateden20100112012453completing-decentralization
mdashmdash2009 Investing in a more sustainable Indonesia Country Environmental Analysis Report No 50762-ID World Bank CEA Series East Asia and Pacific Region available at openknowledgeworldbankorgbitstreamhandle109863135507620v20Revis1ox0info10CEA1englishpdfsequence=1
mdashmdash2007 Horticultural producers and supermarket development in Indonesia World Bank Washington DC available at documentsworldbankorgcurateden2007068235822horticultural-producers-supermarket-development-indonesia
WTO 2013 Trade policy review Indonesia WTO Document WTTPRS278 World Trade Organisation Geneva available at wtoorgenglishtratop_etpr_etp378_ehtm
Yamauchi F 2014 Wage Growth Landholding and Mechanization in Agriculture Evidence from Indonesia World Bank Washington DC February available at openknowledgeworldbankorghandle1098617324

4
Figure 3 Urban and rural population Indonesia
Source World urbanisation prospects the 2014 revision United Nations Population Division (United Nations Population Division 2014)
Incomes The Indonesian economy has grown consistently over the past two decades apart from the Asian financial crisis of 1998 (Figure 4) Indonesian GDP in constant prices almost tripled between 1990 and 2012 (IMF 2015) Average incomes per person in constant prices doubled over the same period
Figure 4 GDP growth in Indonesia
Source World Economic Outlook Database International Monetary Fund (IMF 2015)
10
20
30
40
50
60
70
80
90
Million
50
100
150
200
250
300
350
1970 1980 1990 2000 2010 2020 2030 2040 2050
Rural
Urban
Share of rural population (right axis)
-10
-5
0
5
10
1990 1995 2000 2005 2010
5
Indonesias economic growth has not been shared equally across the population Although the middle class (defined as those with daily expenditure of between US$2 and US$20 in 2005 purchasing power parity terms) expanded from around 25 per cent of the population in 2000 to 57 per cent in 2010 income inequality has increased (Afif 2014 Indonesian Central Bureau of Statistics 2015a) Income growth and income inequality both have important implications for food consumption The expansion of the middle class has been a significant factor behind the increase in Indonesias total food consumption However the rise in inequality implies there remains a considerable proportion of the population with low incomes and limited capacity to buy food
In the baseline projections presented in this report Indonesian GDP is assumed to grow according to OECD (2012a) projections (Table 1) Between 2011 and 2030 real GDP growth is assumed to increase at an average of 53 per cent a year before weakening between 2030 and 2050 to average 34 per cent a year Urban incomes are assumed to continue to grow faster than rural incomes over the period to 2050 averaging 56 per cent and 21 per cent a year respectively An alternative scenario of lower economic growth is also examined based on World Bank (2015) projections (see Chapter 5 Table 7)
Table 1 Indonesia GDP growth 2009 to 2050
1991-2010 2011-2020 2021-30 2031-40 2041-50
Average annual growth ()
44 53 53 34 34
Source Looking to 2060 A global vision of long-term growth Economics Department Policy Notes no 15 Organisation for Economic Co-operation and Development (OECD 2012a)
Food consumption Total food consumption in Indonesia has increased in response to rising incomes and population Between 1990 and 2013 total consumption of wheat fruit and milk each increased by more than 200 per cent (Figure 5) Consumption of vegetables more than doubled over the same period and meat consumption almost doubled Consumption of ricemdasha staple food in Indonesian dietsmdashincreased by only 32 per cent
6
Figure 5 Consumption of selected foods Indonesia
Source FAOSTAT Food and Agriculture Organization of the United Nations (FAO 2015)
Between 1990 and 2013 the average calorie intake per person in Indonesia increased by 19 per cent The contribution of starchy roots and pulses to individuals calorie intake declined while the contribution of fruit and vegetables meat and fish increased Average per person consumption of milk and other dairy products more than doubled but remained of limited significance
Poultry is the major source of meat in Indonesia accounting for over half the total meat consumed in 2013 (Figure 6) Pig meat constituted almost a quarter of total meat consumption in 2013 consumed by non-Muslim people Consumption of beef which ranks third has been increasing more slowly than chicken meat consumption because it is relatively more expensive (FAO 2015) Sheep and goat meat accounted for less than 5 per cent of total meat consumption
Million tonnes
5
10
15
20
25
30
35
40
1990 1992 1994 1996 1998 2000 2002 2004 2006 2008 2010 2012
Rice (milled equivalent)
Fruit
Vegetables
Wheat
Meat
Milk (excluding butter)
7
Figure 6 Total consumption of meats Indonesia
Source FAOSTAT Food and Agriculture Organization of the United Nations (FAO 2015)
On a per person basis Indonesias consumption of many food groups is relatively low This is because a high portion of its population lives at or near the poverty line Per person consumption of meat in 2011 was between 70 per cent and 80 per cent less than that of Japan the Republic of Korea China and many other ASEAN nations (Table 2) For dairy it was around 80 per cent less than that of Japan 56 per cent less than China 47 per cent less than the Republic of Korea and lower than other ASEAN countries For fruit and vegetables it was between 30 per cent and 65 per cent less than that of Japan and the Republic of Korea 74 per cent less than China and lower than other ASEAN countries These relatively low per person consumption levels underline the potential for sizable increases in per person food consumption as incomes rise
Table 2 International comparison of annual per person food consumption 2011
Country Meats kg
Dairy kg
Fruit and vegetables kg
Cereals kg
Japan 488 713 1524 1044
Republic of Korea 622 264 2888 1515
China 577 315 4178 1515
Malaysia 533 322 1131 1466
Philippines 345 145 1796 1577
Vietnam 576 151 1445 1670
Indonesia 129 139 1075 1906 Source FAOSTAT Food and Agriculture Organization of the United Nations (FAO 2015)
Diets of urban residents are usually different from their rural counterparts In 2013 Indonesias urban residents spent an average of 414 000 rupiah a month on food compared with 299 000 rupiah by rural residents (Indonesian Central Bureau of Statistics 2015b) Urban residents spent more than rural residents on meat fish eggs fruit and prepared (cooked and packaged) foods Rural residents spent more on cereals and tubers (Figure 7) with 24 per cent of their food budget devoted to cereals alone compared with only 15 per cent for urban residents
000 tonnes
200
400
600
800
1000
1200
1400
1600
1800
2000
1990 1992 1994 1996 1998 2000 2002 2004 2006 2008 2010 2012
Poultry meat
Pig meat
Bovine meat
Sheep and goat meat
8
Figure 7 Expenditure on food items urban and rural residents 2013 Indonesia
Source Indonesian Central Bureau of Statistics 2015b
Food marketing in Indonesia is also changing In the 1980s supermarkets occupied only a small niche in food retailing By the mid-1990s they were still confined to the urban upper income sector Supermarkets only began to spread quickly in Indonesia after 1998 By 2007 they accounted for about 30 per cent of overall retail food expenditure (World Bank 2007)
The development of supermarkets is typically associated with closer vertical coordination along value chains as the supermarkets maintain close relationships with their suppliers This often involves contractual arrangements with farmers or in the case of food imports with suppliers in other countries Asian supermarket chains have developed direct relationships with suppliers of fresh horticultural and dairy produce in the United States New Zealand and Australia (Glover 2011)
000 rupiah
20
40
60
80
100
120
140
Cere
als
Tube
rs
Fish
Mea
t
Eggs
and
milk
Vege
tabl
es
Legu
mes
Frui
ts
Oil
and
fats
Beve
rage
s
Misc
food
item
sPr
epar
ed fo
odan
dhellip
Urban
Rural
9
3 Production constraints in Indonesian agriculture
The agriculture sector is a key component of the Indonesian economy contributing about 14 per cent of Indonesias GDP in 2014 (Statistics Indonesia 2015) Thirty per cent of Indonesias land area is used for agricultural purposes and the sector employs 41 million people or 35 per cent of the nations work force The sector is a strong contributor to Indonesias trade with agricultural exports accounting for 24 per cent of the value of total merchandise exports in 2012 (World Bank 2014)
Indonesias agriculture is generally characterised by fertile volcanic soils and abundant renewable water resources High population density has resulted in a sector dominated by smallholdings Agricultural land area per person in Indonesia is low at just 022 hectares This is equivalent to a third of the world average (World Bank 2014) Challenges to agricultural production and productivity growth include the availability and quality of natural resources insecure land tenure underemployment of labour and lack of infrastructure
Resource constraints Land availability Indonesia is the worlds largest nation archipelago made up of 17 508 islands of which just over a third are inhabited Java is the most densely populated island accommodating more than half of Indonesias population (57 per cent in 2013) on only 7 per cent of the total land area (Map 1)
Map 1 Map of Indonesia
Source GeoNetwork Food and Agriculture Organization of the United Nations (FAO 2012)
About 30 per cent of Indonesias land area (545 000 square kilometres) is classified as agricultural land (World Bank 2014) Of this 43 per cent or 235 000 square kilometres is considered arable that is land under annual crops or any fallow or pasture land used for annual crops within any five-year period The remaining agricultural land is either devoted to plantation crops (such as oil palm coconut rubber coffee and sugar cane) or permanent pasture (natural or seeded grassland that remains unploughed for many years)
10
The islands of Java Bali and large parts of Sumatra are home to irrigated lowland rice-paddy terraces and upland rain fed farming The average size of farms producing rice and other food crops such as maize peanuts and cassava ranges from 03 hectares on Java to 14 hectares elsewhere (OECD 2013) Java produces around half of Indonesias rice Expansion of the lowland rice area in Java is limited because of increasing competition for land with other crops and non-agricultural uses such as industry uses housing and roads (FAO 2005)
The plantation and industrial crops sector dominated by oil palm coconut and natural rubber makes up 15 per cent of total crop area Large private and state-owned farms are involved in these perennial cropsmdashmainly in Kalimantan and Sumatra and mainly for producing oil palm and natural rubbermdashbut there are also many smallholders The average farm size in this sector is 2 600 hectares (OECD 2013)
Until 2010 growth in agricultural production relied largely on converting forested areas into agricultural land particularly to oil palm plantations In the past two decades millions of hectares were cleared for this purpose Just over half of Indonesias total land was classified as forest area in 2011 compared with 65 per cent in 1990 (Figure 8) Driving this trend has been the growing global demand for edible oils and the price competitiveness of palm oil relative to alternatives such as soybean oil (Rabobank 2013) Much of the deforestation is concentrated in Sumatra and Kalimantan
Figure 8 Land use in Indonesia
Note Share of total land area Source World Development indicators World Bank Group (World Bank 2014)
Many less populated islands remain densely forested and are home to forest and coastal communities that sustain themselves through agriculture hunting foraging and fishing (USAID nd) Indonesias Ministry of Forestry estimates of bush shrub grass and barren land across Indonesia total 22 million hectaresmdasharound half of which is located in Kalimantan and Papua McKinsey Global Institute (2012) estimates almost 7 million hectares of this land (much of which used to be in agricultural production but has since been abandoned) could be developed for agricultural production Alexandratos and Bruinsma (2012) project that between 2009 and 2050 total arable land in Indonesia will increase by 75 per centmdashan assumption used in the modelling in this report
20
40
60
80
100
1990 1993 1996 1999 2002 2005 2008 2011
Other
Agriculture
Forest area
11
Land degradation Indonesia is regularly described as being a highly fertile country but land quality varies across the archipelago The central islands have more fertile soils and hence are densely populated Agricultural land in Java in particular has benefited from high levels of mineral fertiliser application soil and water erosion control programmes and relatively good soil (FAO 2005) In contrast the soils of the outer less populated islands are characterised by highly weathered acidic soils that require higher fertiliser inputs to achieve the high crop yields obtained in Java and the other central islands Actual fertiliser use in the outer islands is generally lower than on Java resulting in soil nutrient depletion in the upland crop areas (FAO 2005)
Erosion and associated problems of nutrient depletion are minimal on Java because of the system of flat terracing and well-maintained irrigation schemes However in the lower-potential rain fed uplands where crops such as maize and cassava are produced on sloping hillsides erosion problems and nutrient depletion are more prevalent Where deforestation has occurred to make way for plantation crops loss of forest cover has led to watershed degradation silting of waterways flooding soil erosion and decline in soil quality and soil productivity (World Bank 2009)
Land tenure Land parcels in Indonesia are highly fragmented particularly on smallholder farms As land is passed down the generations it tends to become divided into smaller parcels (McKinsey Global Institute 2013) While the law requires that all land rights be registered most of these inherited parcels are unregistered less than 25 per cent of rural land parcel holders have been registered in the 40 years since land registration began (OECD 2012b) Additionally a large share of land off Java is communal rather than privately titled Land rights of these communities are often not formally recognised increasing the risk of conflict
The implications of the land tenure arrangements are that for large investors gaining access to land is a long and unclear process As a result only limited land rights are granted which compromises the extent to which production can increase (OECD 2012b) For smallholders unclear land tenure or nonexistence of certificated land registration compounds the difficulties of gaining access to credit from financial institutions This discourages investment in productivity-enhancing technology and biases farmers choices away from longer-term activities such as tree crops (World Bank 2010)
Fertiliser use The Indonesian Government maintains a ceiling price on fertiliser which depending on fertiliser type is between 50 per cent and 75 per cent lower than the market price (Sudaryanto 2014) Lower fertiliser prices are intended to encourage increased crop production particularly of rice The government provides a subsidy to fertiliser manufacturers to compensate them for selling fertiliser below market prices Despite the subsidy payment the incentives for fertiliser manufacturers to increase production and compete with one another are limited by government regulation of production quantities prices and locations where fertiliser can be sold (Osorio et al 2011)
The use of fertiliser is unevenly distributed across the archipelago Among food crops the highest application rates per hectare are for rice followed by maize and soybeans The lowest are for peanut and cassava The subsidy and resulting increase in fertiliser use led to more than a doubling of rice production between 1970 and 2000 Over that period total annual fertiliser
12
use increased from 635 000 tonnes to 59 million tonnes more than half of which was used to increase rice production (FAO 2005)
Fertilisers remain underused on plantation crops Large areas of plantation crops are owned and managed by smallholder farmers For many the lack of knowledge about appropriate fertilisation technology and the lack of reliable and timely access to the right fertilisers at village level lead to inadequate and unbalanced application (FAO 2005)
Apart from the budgetary burden subsidising domestic fertiliser prices results in inefficient fertiliser use at the farm level Studies in West Java report rice farmers applying levels of fertilisers higher than the recommended rates with some soil tests showing nutrient reserves had built up to high levels negatively affecting yields (FAO 2005 Osorio et al 2011)
Farm labour and mechanisation Indonesian agriculture is dominated by abundant labour in relation to available agricultural land contributing to the issue of small-scale production The agriculture forestry and fishing sector employs around 40 million people or 35 per cent of the workforce (15 years and over) and is the main source of employment in rural areas (Indonesian Central Bureau of Statistics 2015c McKinsey 2012) The proportion of landless and land-poor agricultural households is especially high on Java Of more than 17 million households on Java characterised as farmer or agricultural labourer households 39 per cent neither lease nor own any crop land and another 44 per cent lease or own less than 05 hectares (USAID nd)
Tradition is one obstacle to agricultural development in Indonesia (Shahaf 2009) In many cases farmers grow the same crops as previous generations using the same such methods and tools Sometimes two or three generations work the same farm
Traditionally particularly in Java harvesting is undertaken primarily by manual labour (Yamauchi 2014) Machines are rarely used However outside Java the emergence of larger scale farmers had led to operations scaling up through mechanisation This has contributed to a rise in farm labour productivity since 2000 (Figure 9)
Figure 9 Agriculture value added per farm worker Indonesia
Source World Development indicators World Bank Group (World Bank 2014)
Currently tractors are used for land preparation activities such as primary and secondary tillage while seeding and planting activities continue to be done manually Threshers are used in more developed areas where agricultural labour has become scarce as a result of competitive wages in other industries
2005 US$
200
400
600
800
1 000
1 200
1980 1984 1988 1992 1996 2000 2004 2008 2012
13
Wage growth in recent years may have led to the introduction of labour saving practices among relatively large farmers such as renting more land and acquiring machinery (Yamauchi 2014) In contrast small farmers have not significantly changed their behaviours
Infrastructure As the worlds largest archipelago Indonesias insufficient and poor quality infrastructure is a major challenge for connectivity between the islands High transport costs also undermine the competitiveness of agricultural industries and associated supply chains (Rabobank 2013 OECD 2012b) With most transport developments concentrated in Java access to markets for the rest of Indonesia is poor
Ninety per cent of freight and 80 per cent of passenger traffic in Indonesia moves by road However roads are heavily congested and their quality in urban and provincial areas is poor (The Canadian Trade Commissioner Service 2011) Because connectivity with markets is compromised by an inadequate road system returns to agricultural producers are often discounted because of spoilage incurred during transport (Global Business Guide Indonesia 2012)
Indonesia has around 300 ports spread throughout the archipelago Inter-island shipping consisting of ferry and cargo shipping services accounts for around 60 per cent of total seaborne cargo in the country (World Bank 2013) Seaports in Indonesia are outdated and investment in port facilities has not matched the rapid growth of traffic moving through them As a result inefficiencies in the shipping system such as bottlenecks and delays in cargo handling are common Vessels also often leave the main port Tanjung Priok before they are fully loaded to keep to published schedules (The Canadian Trade Commissioner Service 2011)
Current infrastructure does not support internal trade well and challenges Indonesiarsquos ability to provide its own food to its own people Developing an efficient transport and logistics system would not only increase the competitiveness of Indonesias external trade but would also provide easier and cheaper access for local agricultural products to domestic markets with reduced losses through spoilage Until this is achieved Indonesian supply chains will continue to be uncompetitive inefficient and looking to other markets to satisfy agrifood demand particularly in urban centres
Water availability While Indonesias water supplies may be sufficient for current agricultural production deterioration of the existing irrigation infrastructure and investment constraints to improve or develop new infrastructure may limit Indonesias future water availability given rapid urbanisation and food demands
Growing municipal water needs and the needs of the agriculture sector to increase production to meet the demands of urban consumers is likely to result in water shortages in coming decades The McKinsey Global Institute projects that by 2030 water supplies will fall short of demand by around 18 per cent (McKinsey 2012) Significant investment is required to improve water productivity and reduce water transmission losses through rehabilitating old and damaged irrigation infrastructure Up to half of Indonesias piped water supply is estimated to be lost in transmission (McKinsey 2012)
Feed availability Increasing demand for meat protein has stimulated the establishment of large scale commercial poultry farms and beef cattle feedlots Data from the Indonesian Feed Millers Association show
14
the poultry industry consumes 83 per cent of Indonesias animal feed the aquaculture industry consumes 11 per cent and cattle and pig industries the remaining 6 per cent (USDAndashFAS 2014)
On average Indonesias livestock feed is composed of maize (50 per cent) soybean meal (15 to 20 per cent) rice bran (15 per cent) wheat pollard (8 per cent) fish meal (5 per cent) maize gluten meal (3 per cent) and crude palm oil (2 per cent) (USDAndashFAS 2014) While most maize is sourced domestically inconsistent seasonal supplies and storage challenges such as high moisture content and aflatoxin levels are major factors that are leading feed millers to import increasing quantities of maize Canola meal is being used increasingly in poultry diets as a cost competitive alternative to soybean meal However its use is restricted to less than full replacement of soybean meal because of canolarsquos lower energy and protein content and the presence of antinutritional factors such as lower amino acid digestibility than in soybean meal (Khajali and Slominski 2012) Apart from maize and agri-industrial by-products such as rice bran copra meal and palm kernel meal other feed ingredients are largely imported (Table 3)
In food crop producing areas fibrous agricultural residues have become the main feed source for ruminant animals raised by small scale livestock producers Rice straw is fed as a base roughage but additional good quality feedstuff or concentratesmdashsuch as leaves and stalks of cassava leaves of maize and sugarcane leaves stems and peelings of banana rice bran pods and peelings of cacao and the fronds pressed fibre and palm kernel cake from oil palmmdashare required to gain higher production performance (Djajanegara 1999) Such feeds are available in various locations but their unequal distribution and high prices at the farm level limit their use by smallholder farmers Lack of storage and labour shortages during harvest time also restrict the collection of rice straw These limitations as well as the seasonal nature of these feedstuffs affect continuity of supply and therefore the productivity potential of smallholder livestock producers
Table 3 Indonesian animal feed sources of primary ingredients
Feed ingredient Local share () Imported share ()
Maize 90ndash95 5ndash10
Fish meal 5ndash10 90ndash95
Meat and bone meal (MBM) 0 100
Soybean meal 0 100
Rapeseed meal 0 100
Maize gluten meal 0 100
Feed additive 0 100
Rice bran 100 0
Copra meal 100 0
Palm kernel meal 100 0
Crude palm oil (CPO) 100 0 Source Indonesia grain and feed annual report 2014 United States Department of Agriculture (USDAndashFAS 2014)
Productivity There has been significant growth in the volume of total agricultural output in Indonesia over the past 50 years although the rate of growth has varied markedly over the decades The contribution of increased total factor productivity (TFP) to total agricultural output growth (including food crops and non-food cash crops) was strong during the 1960s and 1970s as new
15
technologies and improved crop varieties were widely adopted during the green revolution (Table 4) (Fuglie 2010 2012) In the 1980s land and labour use expanded enabling total agricultural output to grow but TFP growth slowed During the 1990s average agricultural output growth declined to less than 2 per cent a year as the green revolution crop varieties had already been widely adopted and no newer higher yielding varieties were suitable or available However TFP growth was stronger than the previous decade
Table 4 Average annual food and non-food agricultural output and total factor productivity growth Indonesia
Years Agricultural output Agricultural TFP
1961ndash1970 271 175
1971ndash1980 334 140
1981ndash1990 464 059
1991ndash2000 187 099
2001ndash2009 486 368 Note Agricultural output measured in volume Source Fuglie 2012
Between 2001 and 2009 strong output and TFP growth resumed for a number of reasons Newly available crop land achieved by the clearing of forested areas supported the expansion and diversification of agriculture into higher value non-staple commodities such as tropical perennials horticulture and livestock At the same time the relatively low price of fertilisers and chemicals available to producers led to a 50 per cent increase in their use between 2002 and 2009 (Figure 10) resulting in a marked improvement in crop yields compared with the previous decade (OECDndashFAO 2014) Improved literacy and education of the farm labour force also contributed to productivity growth (OECD 2012b)
Figure 10 Total fertilizer use in Indonesia by type
Note 2001 data not available Source FAOSTAT Food and Agriculture Organization of the United Nations (FAO 2015)
TFP estimates do not exist for the period since 2010 While yield growth is not as robust a measure of technical change as TFP yield trends can provide a partial indication of changes in productivity Average annual yield growth between 2011 and 2013 was lower than in the
Mt
1
2
3
2002 2003 2004 2005 2006 2007 2008 2009
Nitrogen
Potash
Phosphate
16
periods 2001ndash05 and 2006ndash10 across a range of food and non-food crops (Table 5) A number of factors explain this slowdown The rate of conversion of forest land to cropping slowed significantly reducing the rate of agricultural output growth achieved through additional agricultural land (OECD 2012b) In addition the sustained overuse of fertilizers and chemicals throughout the 2000s has led to decreasing returns to scale for these intermediate inputs As a result any future increase in the productivity of food and non-food crops is unlikely to be achieved through the application of chemicals or fertilisers
Table 5 Average annual yield growth of food and non-food cash crops Indonesia
Commodity Unit 1991-95 1996-00 2001-05 2006-10 2011-13
Food crops
Rice 02 03 08 19 09
Maize 12 42 46 52 30
Cassava -06 15 50 49 36
Mung beans -03 -67 44 23 -02
Soybeans 04 17 11 11 12
Groundnuts -34 58 15 16 02
Vegetables a 93 -08 35 -17 -68
Cash crops
Rubber na -01 45 58 48
Crude palm oil na -72 108 -06 12
Palm kernel na -104 120 08 -10
Cocoa na 05 143 21 -30
Coffee na 24 14 62 37
Tea na 02 30 -05 -11 a Vegetable data available to 2012 Source FAOSTAT Food and Agriculture Organization of the United Nations (FAO 2015)
With reduced scope for expansion in agricultural production through both conversion of forest land and increased use of fertilisers and chemicals future agricultural productivity growth is likely to be achieved through the more efficient use of inputs The dominance of smallholdings remains a constraint to achieving higher agricultural productivity growth in future as small plots impede the implementation of more productive practices This is compounded by inefficient fertiliser use limited mechanisation and an inadequate supply of other important inputs such as high-yielding seeds irrigation systems extension services and access to credit Addressing these issues will be key to future productivity trends
17
4 Indonesian agricultural and food policies
The objectives of Indonesias agricultural policy as stated by the Indonesian Ministry of Agriculture in 2010 are to
1) achieve food self-sufficiency
2) enhance diversification of production and consumption
3) raise the competitiveness and value added of production and
4) increase farmersrsquo welfare (OECD 2012b)
To achieve its objectives the Indonesian Government intervenes in the farm sector with multiple policy instruments The government also implements policies to protect consumers from fluctuations in prices of key food products such as wheat rice and vegetable oils and to insulate domestic producers from foreign competition Food for consumers is subsidised which effectively maintains the price of food within a narrow price band Producers benefit from tariffs applied to imported food which keep the price of domestically produced food competitive with imports Additionally producers are directly supported by government food purchases at guaranteed prices and subsidies on farm inputs such as fertiliser seed and farm equipment
Policies to support agricultural production Reference prices and import restrictions The Indonesian Government sets reference prices for rice sugar and beef which it aims to maintain through various policy instruments
On average around 70 per cent of domestic rice production is consumed within the farming household (OECD 2012b) The remainder is sold through either private or government-run channels such as Indonesias National Food Logistics Agency known as Badan Ursan Logistik (BULOG) BULOG purchases a limited amount of rice at the reference price to fulfil two objectives
1) stockholding for emergency purposes and
2) redistribution as part of the consumer subsidy programme Raskin (discussed below) (OECD 2012b)
In 2010 BULOG procured around 6 per cent of total domestic rice production equivalent to around 20 per cent of all marketed rice (OECD 2012b)
For sugar the government supports the producer price by imposing legal requirements on domestic sugar millers who control the domestic sugar market Sugar millers are required to purchase 75 per cent of their sugar cane requirements from domestic sugar cane growers and to pay growers a government-determined price
The Indonesian rice and sugar industries are also protected by import restrictions Companies that import rice and sugar are required to support the domestic industry by buying domestically produced product if the mill price falls below the reference price
18
For beef and live cattle imports the Indonesian Government sets a reference price which it aims to achieve by managing import volumes through an import permit system Since 2014 the reference price has been 76 000 rupiah (A$720) a kilogram Under the system import permits are not issued if domestic beef prices fall below the reference price (ABARES 2013) Weight restrictions on cattle imports also usually apply limiting imports to young lighter cattle destined for feedlots
The Indonesian Government also restricts imports of other commodities such as soybeans maize horticulture certain processed foods and animals and animal products (including fresh chilled and frozen meat and eggs) Importing these commodities is generally not permitted if the Ministry of Trade considers it will cause injury to the domestic industry (WTO 2013) Companies seeking to import these commodities are required to gain approval from the Indonesian Ministry of Trade (OECD 2012b)
Tariffs Tariffs are applied to most imported food products in Indonesia However they are relatively low and are not a major policy instrument used to protect domestic industries The average applied agricultural tariff was 53 per cent in 2010 (OECD 2012b) Around 85 per cent of agricultural imports are subject to tariffs between zero and 5 per cent with almost 66 per cent entering duty free All agricultural tariffs are ad valorem except for rice and sugar which have specific tariffs (OECD 2012b)
While applied tariffs are low bound tariff rates or the ceiling rate that can be applied under World Trade Organisation rules remain high (Figure 11) On average the bound rate on agricultural products is 47 per cent (OECD 2012b) The highest bound tariff is 210 per cent for milk powders although the applied rate is just 5 per cent Rice has a bound tariff of 160 per cent and an applied specific rate of 450 rupiah a kilogram (equivalent to an ad valorem tariff of 10 per cent when using the average export price for 15 per cent broken rice from Thailand in 2010) (OECD 2012b)
Figure 11 Average bound and applied tariffs by product groups
Source OECD Review of Agricultural Policies Indonesia 2012 Organisation for Economic Co-operation and Development (OECD 2012b)
0
20
40
60
80
Fruit and vegetables
Sugars and confectionery
Cereals Dairy products
Animals and animal
products
Oilseeds fats and oils
Average bound tariff
Average applied tariff
19
Input subsidies The Indonesian Government supports farmers by subsiding inputs such as fertiliser seeds and ad hoc products including power tools and rice milling units Fertiliser support is the largest component of budgetary support for agriculture accounting for 37 per cent in 2008ndash09 (OECD 2012b) Not all farmers receive input subsidies because eligibility requirements apply in many cases For example subsidised fertiliser is only available to farmers producing on less than 2 hectares
Policies to support consumers Price intervention The Indonesian Government intervenes in the domestic market for wheat flour maize and cooking oil when it considers retail prices too high for the poor It does this using a broad range of measures from simply asking manufacturers and wholesalers to be socially responsible with their pricing to purchasing these products and distributing them directly to poor households (OECD 2012b) Another policy often used is the government covered value tax under which the government waives the existing 10 per cent value added tax on the final price of certain food items For example the government has used this policy to reduce the price of non-branded cooking oil since 2007 In 2010 this policy cost the Indonesian Government around 250 billion rupiah (A$299 million)
Food subsidies The Indonesian Government operates a targeted rice subsidy programme known as Raskin to combat food insecurity The programmes objective is to make available a set quantity of rice (procured by BULOG) at a subsidised price to Indonesias poorest households on a monthly basis Raskins intention is to provide rice to those on official lists of households living under or near the national poverty line (World Bank 2012b) The poverty line in 2014 was around 318 500 rupiah per person a month in urban areas and 286 100 rupiah per person a month in rural areas (Indonesian Central Bureau of Statistics 2015a) Those with incomes within 20 per cent of the poverty line are defined as being near the poverty line (World Bank 2012b)
Despite the objectives of Raskin to target the most vulnerable since allocations of Raskin rice to households are decided by local authorities poor and non-poor households alike benefit from the programme In 2010 around 175 million households received Raskin rice (OECD 2012b) at a cost of around 14 trillion rupiah (A$17 billion) to the Indonesian Government (Figure 12) Between 2005 and 2010 the subsidised price was 1 600 rupiah (A$019) a kilogram representing about 20 to 25 per cent of the average market price (World Bank 2012a)
The quantity of rice per household the subsidised price the number of months a year that rice is distributed and the classification of the poorest households have all been altered over the period of the programme For example monthly allocations per household have been set as low as 10 kilograms and as high as 20 kilograms over the programme period although households rarely benefit from the full amount of the allocation (OECD 2012b World Bank 2012a)
20
Figure 12 Raskin rice distribution and budgetary cost
Source OECD Review of Agricultural Policies Indonesia 2012 Organisation for Economic Co-operation and Development (OECD 2012b)
Implications of agricultural and food policies Public expenditure on Indonesian agriculture has increased under its current policy settings In 2009 public spending was around 615 trillion rupiah (A$75 billion) This was equivalent to 56 per cent of total government expenditure compared with 27 per cent in 2001 (World Bank 2011) The fertiliser subsidy and Raskin have been the biggest drivers of increased spending over this period
In addition to the direct budget cost of Indonesias agricultural and food policies there have also been allocative effects Indonesian policies tend to focus on rice maize and sugar leading to increased production of these commodities and improved availability from domestic sources However expansion of these crops has come at the expense of horticulture and other commodities in which Indonesia has a comparative advantage such as natural rubber cocoa and spices (World Bank 2011)
The administration of some support programmes the fertiliser subsidy in particular is inefficient (Sudaryanto 2014) As discussed in Chapter 3 subsidising fertiliser companies in an environment where quantities prices and distribution channels are regulated reduces incentives for these companies to effectively compete This inefficiency has resulted in the under-production of fertiliser leading to shortages At the same time the artificially low price has led to an over-reliance on fertiliser by producers to increase yield rather than using other methods such as improved seeds (World Bank 2011)
4000
8000
12000
16000
2000 2002 2004 2006 2008 20100
1
2
3
4
Expenditure on RASKIN
Quantity of rice distributed (right axis)
Million tonnes
Billionrupiah
21
5 Simulation results Baseline assumptions The objective in this analysis is to identify and quantify projected changes in Indonesian demand for a range of agrifood commodities over the longer term across urban and rural households An updated version of the ABARES agrifood model (Linehan et al 2012a) is used to investigate these potential trends The model has been modified to include Indonesias consumer subsidy policy (Raskin) and a re-aggregation of some country and commodity groups to allow more detailed analysis
Indonesia has a comparative advantage in the production of many cash crops and non-food agricultural commodities that are not included in the ABARES agrifood model such as natural rubber copra palm kernels coffee cocoa and spices (FAO 2013) In Indonesia the production of these commodities competes with food commodities for resources despite a policy environment targeted at food production and food self-sufficiency
Given Indonesias limited supply of arable land and the quality and availability of its water supply the capacity of the domestic agricultural sector to meet the growing demand for food in Indonesia will depend heavily on improvements in productivity Total factor productivity (TFP) growth in Indonesian agriculture is estimated to have averaged 154 per cent a year since 1961 It is expected that yield growth in Indonesia will not decline from this average annual rate in the future because the potential for productivity growth remains significant However nor is it expected to continue at the relatively high rates estimated for the period 2001 to 2009 which were made possible from the expansion of agriculture into higher-value non-staple commodities on newly deforested land and a significant increase in the use of chemical fertilisers (see Chapter 4)
Productivity growth since 2010 is estimated to have slowed from the decade 2001ndash2009 The Indonesian Governments policy initiative Reducing Emissions from Deforestation and Forest Degradation (REDD) in 2010 and declaration of a two-year Forest Moratorium in 2011 have slowed the rate of forest conversion to crop land (OECD 2012b) In addition agricultural production continues to be constrained by the issues outlined in Chapter 4 (including decreasing returns to scale for chemical inputs lack of widespread mechanisation and deteriorating resource base) With ongoing competition between the production of food crops and non-food cash crops (in which Indonesia has a comparative advantage) and little prospects in the foreseeable future for major policy changes on food consumption and production TFP growth for food crops in Indonesia is assumed to average 154 per cent a year between 2009 and 2050 This is close to the forecast by Ludena et al (2007) of 152 per cent a year to 2040 (FAO 2013 USDAndashFAS 2014)
Growth rates for TFP for individual commodities have in the past shown similar patterns to growth in yields Assumptions of TFP growth rates for individual commodities are therefore derived by apportioning the assumed rate for the whole of agriculture by historical growth in the yields of each commodity (Table 6)
22
Table 6 Average annual TFP growth rate by industry in Indonesia 2009 to 2050
Industry
Rice 214
Maize 337
Coarse grains 335
Other cereals 239
Oilseeds 388
Vegetables 232
Fruit 303
Beef 032
Sheep and goat meat 144
Poultry 144
Eggs 135
Dairy 215
All Agriculture 154 Source ABARES model assumption
In the reference case no change to Indonesias market support policies is assumed over the projection period On the production side these include the principal forms of market support of state trading input subsidies and import restrictions Additionally the Indonesian Governments minimum support prices for rice and wheat are maintained in real terms as are other ad hoc interventions on a range of agricultural commodities
The government support received by consumers through the consumer subsidy policy Raskin is also maintained in real terms over the projection period (discussed in Chapter 4)
The baseline projections determined in the agrifood model for Indonesia are also dependent on a set of assumptions discussed in Chapters 2 and 3 To summarise
bull population growth is assumed to average 07 per cent a year between 2010 and 2050
bull the proportion of the population in urban areas is assumed to increase from 50 per cent in 2009 to 72 per cent by 2050
bull average annual GDP growth in Indonesia is assumed to average 53 per cent a year between 2010 and 2030 before weakening between 2030 and 2050 to average 34 per cent a year (Table 1)
bull average annual income growth is assumed to be 56 per cent a year in urban areas and 21 per cent a year in rural areas
agricultural productivity in Indonesia is assumed to continue to increase according to the growth estimates provided in Table 6
The population is divided into two income stratamdashurban income and rural income households Across these two household types the income growth assumptions to 2050 for urban and rural areas are based on historical income data from the Indonesian Central Bureau of Statistics (2011) These data demonstrate that not only is average urban income higher than average rural income but with urbanisation average income growth in urban areas has also been higher than
23
in rural areas This has been the result of a relatively faster rate of economic development and higher wages which have stemmed from the growth in the manufacturing and services sectors prevalent in urban areas The model assumes this trend in income growth will continue to 2050 Indonesian household food consumption data in the base year of the model are from the Indonesian Central Bureau of Statistics (2014) and Widarjono (2012) These data were used as the basis in the model to project food consumption across urban and rural households to 2050
In the model total and per person Indonesian food consumption and total urban and rural food consumption is apparent consumption which reflects the total use of agrifood products (food feed and industrial use) In contrast per person urban and rural consumption is direct food consumption only it excludes feed use and industrial use of agrifood products to better reflect changes in diets
Consumption The real value of total food consumption in Indonesia (including food feed and industrial use) is projected to quadruple between 2009 and 2050 to US$327 billion (in 2009 US dollars) The largest increases are for meat dairy products fruit and vegetables as real incomes increase (Figure 13) Together these commodities account for two-thirds of the projected rise in the real value of food consumption
Figure 13 Consumption of selected agricultural commodities Indonesia
Note Starchy staples include pulses yams potatoes and cassava Source ABARES model output
Between 2009 and 2050 the real value of Indonesian beef consumption is projected to rise more than 14 times to US$35 billion (in 2009 US dollars) dairy products ten times to almost US$9 billion and fruit and vegetables more than three times to US$50 billion and US$25 billion respectively For many commodities the value of consumption in 2050 is projected to rise from a very low base reflecting high poverty rates and a large rural population in 2009 By 2050 72 per cent of the population is projected to live in urban centres with higher incomes than the
10 20 30 40 50 60
Wheat
Sheep and goat meat
Dairy
Sugar
Oil crops
Rice
Vegetables
Starchy staples
Beef
Poultry
Fruit
2050
2009
Billion(2009 US$)
552
66
231
1311
269
1319
256
246
935
1340
113
24
rural cohort It is this expected transition of the population and income growth that drive the magnitude of projected consumption growth for many commodities Despite these large increases Indonesias per person food consumption in 2050 is projected to remain below that of China for many commodities (Hamshere et al 2014)
For cereals oil crops and starchy staples (pulses potatoes yams and cassava) consumption is also projected to increase Between 2009 and 2050 the real value of rice consumption is projected to rise by 66 per cent to nearly US$23 billion (in 2009 US dollars) maize by 182 per cent to US$8 billion oil crops by 246 per cent to US$22 billion and starchy staples by 256 per cent to almost US$29 billion Over this period the real value of sugar consumption is projected to rise more than six times to US$14 billion (in 2009 US dollars)
The projected rise in consumption of cereals oil crops and starchy staples is driven by a number of factors First cereals and starchy staples (such as cassava) are relatively affordable foods particularly for low and middle income consumers whose populations are projected to rise Although both cereals and starchy staples will remain important components of Indonesian diets to 2050 their relative contribution will decline as diets become more diversified with greater amounts of meats dairy products and fruit and vegetablesmdashthe continuation of a trend that began around 1990 (Figure 5)
The projected rise in consumption of cereals oil crops and starchy staples is also driven by feed requirements which will increase as the demand for meat protein rises to 2050 As discussed in Chapter 3 about 50 per cent of domestic maize production is used as feed Rice bran also comprises about 15 per cent of total Indonesian feed consumption Soybean meal comprises between 15 per cent and 20 per cent of total livestock feed all of which is imported Rapeseed meal can be used as a partial substitute for soybeans and it too is entirely imported In 2050 it is projected that feed use will account for around 42 per cent of total maize consumption 43 per cent of total oil crop consumption and 44 per cent of total starchy staple consumption a larger proportion of which will need to be imported compared with 2009
Urban and rural consumption In 2050 71 per cent of Indonesias population is projected to live in urban areas compared with 54 per cent in 2015 (United Nations Population Division 2014) By 2050 Indonesian consumers are projected to have more diverse diets with greater consumption of meat dairy products fruit and vegetables
In this section the results for total urban and rural consumption reflect apparent consumption However per person rural and urban consumption is direct food consumption only Feed use and industrial use of the agrifood products are excluded in the per person results in order to better understand the projected change in diets
High value commodities Urban consumers account for most of the growth in consumption of meat dairy products fruit and vegetables over the projection period because of rising urban populations and incomes Between 2009 and 2050 the real value of urban beef consumption is projected to rise more than 18 times to US$34 billion (in 2009 US dollars) Consumption of dairy products is projected to rise by more than 14 times to more than US$8 billion and fruit and vegetables more than four times to US$43 billion and almost US$21 billion respectively (Figure 14)
25
Figure 14 Urban consumption of selected agricultural commodities Indonesia
Source ABARES model output
In per person terms the value of urban beef consumption is projected to rise more than nine times between 2009 and 2050 dairy more than seven times and fruit and vegetables to more than double However consumption of rice is projected to fall by 4 per cent While these increases are large Indonesias urban per person consumption in 2050 is still projected to be lower than that of China in the same year for many commodities including vegetables (73 per cent lower) oilseeds (12 per cent) dairy products (41 per cent) and sheep and goat meat (24 per cent) In contrast Indonesias urban per person consumption is projected to be higher than Chinas for beef (52 per cent higher) sugar (400 per cent) cereals (23 per cent) and starchy staples (14 times higher) (Hamshere et al 2014) For beef higher Indonesian per person consumption relative to China in 2050 reflects the dominance of beef in Indonesian diets by that time compared with China where pig meat consumption is significant Similarly the projected rise in per person consumption of starches in Indonesia mainly reflects higher consumption of cassava a culturally important food crop
For rural consumers total growth in consumption of meat dairy products fruit and vegetables is lower than for urban households This can be attributed to relatively lower rural incomes and a decline in the absolute size of the rural population Between 2009 and 2050 total rural beef consumption is projected to rise by 95 per cent to more than US$1 billion (in 2009 US dollars) dairy products by 75 per cent to US$05 billion fruit by 41 per cent to almost US$7 billion and vegetables by 42 per cent to almost US$5 billion (Figure 15)
20 40 60
Wheat
Sheep and goat meat
Dairy
Sugar
Oil crops
Rice
Vegetables
Starchy staples
Beef
Poultry
Fruit
Billion(2009 US$)
387
1724
1734
426
875
370
547
1349
Total food consumption
1761
91
173
50 100 150 200
Wheat
Sheep and goat meat
Dairy
Sugar
Oil crops
Rice
Vegetables
Starchy staples
Beef
Poultry
Fruit
2009 US$
145
819
824
165
391
137
226
630
Per person consumption
837
-4
38
26
Figure 15 Rural consumption of selected agricultural commodities Indonesia
Source ABARES model output
Between 2009 and 2050 rural per person consumption of each of the agrifood commodity groups is projected to change by a similar magnitude as urban consumption In value terms rural per person consumption of beef is projected to rise by 162 per cent dairy products by 135 per cent fruit by 90 per cent and vegetables by 92 per cent Similar increases are projected for rice (96 per cent) wheat (128 per cent) and starchy staples (116 per cent)
Again despite these significant increases rural per person consumption in Indonesia is projected to be lower than that of China in 2050 for all products except sugar which is projected to be 117 per cent higher For all other commodity groups rural per person consumption is projected to be lower than in China including sheep and goat meat (85 per cent lower) dairy (54 per cent) starches (32 per cent) cereals (56 per cent) and vegetables (86 per cent)
For both rural and urban consumers the rise in the real value of total food consumption in 2050 is principally the result of an increase in the quantity consumed rather than a projected significant rise in the real price This is especially pronounced in urban households For example between 2009 and 2050 beef consumption by urban households is projected to rise by more than 15 times and sheep and goat meat by 13 times In contrast rural beef consumption over this period is projected to rise by 64 per cent and sheep and goat meat by 44 per cent
Projected consumption growth of cereals and starchy staples between 2009 and 2050 is most pronounced in urban areas Rising urban consumption of these commodities is largely the result of population growth Urban consumption of wheat is projected to rise by 173 per cent to around US$2 billion (in 2009 US dollars) rice by 91 per cent to US$9 billion and starchy staples (which includes pulses potatoes yams and cassava) by 426 per cent to US$13 billion
Rural consumption of cereals and starchy staples is projected to rise despite a falling rural population As incomes rise towards 2050 the relatively affordable prices of these commodities will drive rural consumption Between 2009 and 2050 rural consumption of wheat is projected
2 4 6 8 10
Wheat
Sheep and goat meat
Dairy
Sugar
Oil crops
Rice
Vegetables
Starchy staples
Beef
Poultry
Fruit
Billion(2009 US$)
94
95
61
96
42
101
Total consumption
41
75
98
45
69
50 100 150 200
Wheat
Sheep and goat meat
Dairy
Sugar
Oil crops
Rice
Vegetables
Starchy staples
Beef
Poultry
Fruit
2050
2009
2009 US$
90
161
162
116
165
92
170
135
Per person consumption
166
96
128
27
to rise by 69 per cent to US$1 billion (in 2009 US dollars) rice by 45 per cent to almost US$9 billion and starchy staples by 61 per cent to US$3 billion
Production and trade The real value of Indonesias total agrifood production (which includes production for food feed and industrial use) is projected to more than double from US$81 billion in 2009 to US$173 billion in 2050 (in 2009 US dollars) This increase is driven by a higher value of production (in 2009 US dollars) of beef (up 209 per cent) poultry (187 per cent) starchy staples (115 per cent) vegetables (92 per cent) fruit (78 per cent) and rice and palm oil (up 77 per cent each) (Figure 16) The value of maize production divided almost equally between feed and food use is projected to increase by 78 per cent
Figure 16 Production of selected agricultural commodities Indonesia
Source ABARES model output
For some agricultural products such as rice and beef rising production partly reflects domestic policies that favour their production For example the real value of rice production between 2009 and 2050 is projected to rise by 77 per cent because of the assumption that producers continue to receive a minimum support price and input subsidies Indonesia is projected to switch from being an importer to an exporter of rice by 2050 The real value of Indonesias rice exports in 2050 is projected to be around US$09 billion (in 2009 US dollars)
The real value of Indonesias palm oil production is projected to rise significantly in line with strong export demand and Indonesias comparative advantage in its production Between 2009 and 2050 Indonesias production of palm oil is projected to rise by US$13 billion to US$30 billion an increase of 77 per cent Over this period palm oil exports are projected to rise by 40 per cent to US$18 billion
10 20 30 40
Sheep and goat meat
Dairy
Sugar
Palm oil
Rice
Vegetables
Starchy staples
Beef
Poultry
Fruit
2050
2009
Billion(2009 US$)
78
187
209
115
92
77
77
76
115
361
28
Imports For some agricultural commodities such as rice and palm oil the rise in consumption by 2050 is projected to be met largely by a rise in domestic production However for most agrifood commodities production is projected to increase at a slower rate than consumption As a result food and feed imports will be an increasingly important component of Indonesias food supply towards 2050 The real value of Indonesias total agrifood imports is projected to rise more than 20 times from 2009 to US$152 billion (in 2009 US dollar terms) in 2050
By 2050 Indonesia is projected to import a wide range of horticultural products Given rising domestic demand the real value of Indonesiarsquos fruit and vegetable imports is projected to rise to US$25 billion and US$11 billion in 2050 respectively (in 2009 US dollars Figure 17) On this basis the share of imports in total Indonesian fruit consumption will rise from 3 per cent in 2009 to 53 per cent in 2050 (Figure 18) For vegetables it will rise from 9 per cent in 2009 to 47 per cent in 2050
Figure 17 Trade of selected agricultural commodities Indonesia
Source ABARES model output
-30 -20 -10 0 10 20 30
Wheat
Sheep and goat meat
Dairy
Sugar
Rice
Beef
Starchy staples
Vegetables
Fruit
2050
2009
Billion (2009 US$)
Exports Imports
Palm oil
29
Figure 18 Import share of total consumption Indonesia
Source ABARES model output
Lower-income growth scenario The baseline projections for Indonesian agrifood consumption production and trade to 2050 are reliant on the underlying assumptions presented at the beginning of this chapter Chief among these are the OECD (2012a) assumptions for Indonesian GDP growth to 2050 presented in Chapter 2 (Table 1 and Table 7) If Indonesia were to realise a lower level of income growth agrifood demand growth would be expected to be lower The World Bank projects that Indonesian GDP growth in each decade to 2050 will be markedly lower than the OECDs projections (World Bank 2015 Table 7) This scenario examines the potential effect on Indonesian agrifood consumption and import demand if GDP and hence income growth were slower over the projection period as suggested by the World Bank All other variables from the reference scenario are held constant
Table 7 Indonesia GDP growth projections 2010 to 2050
Period Baseline 1991-2010
2011-2020 2021-30 2031-40 2041-50
OECD average annual growth ()
440 530 530 340 340
World Bank average annual growth ()
440 350 350 225 225
Source OECD 2012a World Bank 2015
Results In this scenario lower economic and income growth throughout the projection period results in GDP in 2050 that is 44 per cent lower than the reference case Because agrifood consumption is sensitive to changes in income the total value of agrifood consumption in 2050 (in 2009 US dollars) is 10 per cent less than in the reference case (Figure 19) Weaker economic growth most
Fruit Vegetables Starchy staples
Beef Poultry Sugar Maize Dairy Sheep and goat meat
Wheat
10
20
30
40
50
2050 Imports
2050 Domestic production
2009 imports
2009 Domestic production
53
3
4743
86
8183
1007091
9
75846723
6
100
Billion(2009 US$)
21
50
30
strongly affects urban areas where average annual income growth in the reference case was assumed to be more than double that of rural areas As a result demand for high-value products such as meat and dairy products declines significantly Many of these products are imported In 2050 the total projected value of beef consumption (in 2009 US dollars) is 17 per cent lower than in the reference case and poultry and milk products are each 14 per cent lower The real value of consumption for many domestically produced products such as starches and maize also declines but by no more than 10 per cent for any single commodity
Weaker consumption growth leads to lower import growth over the projection period particularly for high-value commodities The total value of imports in 2050 is 16 per cent lower in this scenario compared with the reference case with the import share of total consumption 5 percentage points lower than the reference case at 42 per cent (Figure 19) Beef imports are projected to be 20 per cent lower than the reference scenario sheep and goat meat 26 per cent lower and dairy products 16 per cent lower Fruit and vegetable imports are 12 per cent and 19 per cent lower respectively
Figure 19 Agrifood consumption in 2050 under lower income growth assumption
Source ABARES model output
0 100 200 300 400
Low income scenario
Baseline case
Domestic production
Imports
Billion(2009 US$)
4258
53 47
31
6 Conclusion Continued strong income and population growth combined with greater urbanisation are driving Indonesias increasing demand for not only more food but for a wider variety of foods This demand growth is projected to be met by increases in both domestic production and imports
Assuming no major changes to Indonesias existing agricultural policies to 2050 the real value of food consumption in Indonesia is projected to increase more than four times between 2009 and 2050 The increase will be characterised by a move towards more diverse diets with higher intake of meat dairy products fruit and vegetables Between 2009 and 2050 the real value of beef consumption is projected to rise more than 14 times dairy tenfold and fruit and vegetables to more than triple These projected increases are from a relatively low base and are driven by a rise in the quantities consumed rather than any significant projected rise in real prices To support this rise in demand imports of many agrifood commodities are projected to increase to 2050
The contribution of meat dairy products fruit and vegetables in Indonesian diets will increase more quickly than cereals and staples to 2050 While cereals and starchy staples will remain important components of Indonesian diets their relative contribution will declinemdashthe continuation of a trend that began around 1990
The upward trend in food demand is most pronounced among urban households whose income growth is assumed to be more than double that of rural households A declining rural population and relatively lower incomes will result in slower growth in food consumption compared with the urban population
For most agricultural commodities assuming no significant change to historical TFP growth for total agriculture production is projected to increase at a slower rate than consumption As a result food imports will be an important component of Indonesias food and feed supply towards 2050 The real value of Indonesias agrifood imports is projected to rise more than 20 times from 2009 to US$152 billion (in 2009 US dollar terms) in 2050
The projected significant increases in consumption and import demand for food in Indonesia are based on the assumption of relatively strong income growth to 2050 Under a lower growth scenario consumption of protein-based food products such as meat and dairy products is projected to be around 14 to 17 per cent lower than the reference case at 2050 While consumption of domestically produced products is also projected to be lower in 2050 in the lower-income-growth scenario the declines are less significant compared with the baseline case
While not included in the modelling in this report there is scope for increased production of non-food agricultural commodities and cash crops in Indonesia in which it has a comparative advantage These include natural rubber copra palm kernels coffee cocoa and spices Indonesias current policies on food self-sufficiency favour investment in food industries rather than the non-food and cash crops industries This has the effect of allocating resources away from their most efficient use
Because of their geographic proximity Australia and Indonesia are well placed to benefit from advancing bilateral agricultural trade Indonesia is an important market for Australian wheat sugar live cattle beef skim milk powder and horticultural products such as grapes and citrus
32
Stronger demand for these commodities and others in Indonesia will create further opportunities for Australian exporters
33
References ABARES 2013 Agricultural commodities September quarter 2013 Australian Bureau of Agricultural and Resource Economics and Sciences Canberra pp 85-87 available at agriculturegovauabarespublications
Afif S 2014 The Rising of Middle Class in Indonesia Opportunity and Challenge Paper presented at the International Policy Exchange Conference Segovia Spain 28 September available at umdcipeorgconferencesDecliningMiddleClassesSpainpapers_presentationshtml
Alexandratos N amp Bruinsma J 2012 World agriculture towards 20302050 the 2012 revision ESA Working paper no 12-03 Food and Agriculture Organization of the United Nations Rome available at faoorgeconomicesaesagen
Djajanegara A 1999 Local livestock feed resources in Livestock industries of Indonesia prior to the Asian financial crisis Food and Agriculture Organization of the United Nations Rome available at faoorgdocrep004AB986Eab986e06htmbm06 accessed 22 January 2015
Elias S amp Noone C 2011 The growth and development of the Indonesian economy Bulletin December Quarter Reserve Bank of Australia Sydney available at rbagovaupublicationsbulletin2011dec4html
FAO 2015 lsquoFAOSTATrsquo Food and Agriculture Organization of the United Nations Rome available at faostat3faoorghomeE accessed 26 October 2015
mdashmdash 2013 Indonesia Food and Agriculture Organization of the United Nations Rome available at faoorgdocrep005y4632ey4632e0lhtm
mdashmdash2012 GeoNetwork Food and Agriculture Organization of the United Nations Rome available at faoorggeonetworksrvenmainhome accessed 15 February 2014
mdashmdash 2005 Fertiliser use by crop in Indonesia Food and Agriculture Organization of the United Nations Rome available at faoorgdocrep008y7063ey7063e00htm
Fuglie K 2012 lsquoProductivity growth and technology capital in the global agricultural economyrsquo in Fuglie KO Wang SL amp Ball VE (eds) Productivity growth in agriculture an international perspective CAB International Oxfordshire UK
mdashmdash2010 lsquoSources of growth in Indonesian agriculture Journal of Productivity Analysis vol 33 no 3 pp 225-240
Fuglie K amp Rada N 2014 International Agricultural Productivity United States Department of Agriculture Economic Research Service Washington DC available at ersusdagovdata-productsinternational-agricultural-productivityaspxU089bfmSzkd
Global Business Guide Indonesia 2012 Agriculture in Indonesia available at gbgindonesiacomenagriculturesector_overviewphp
Glover J 2011 lsquoAn international retailerrsquos perspectiversquo Paper presented at The Crawford Fund 2011 Annual Parliamentary Conference Parliament House Canberra 14 August available at crawfordfundorgevents2011-parliamentary-conference
34
Hamshere P Sheng Y Moir B Syed F amp Gunning-Trant C 2014 What China wants Analysis of Chinas food demand to 2050 ABARES research report Canberra March available at agriculturegovauabarespublications
IMF 2015 World Economic Outlook Database available at imforgexternalpubsftweo201302weodataindexaspx accessed 26 October 2015
Indonesian Central Bureau of Statistics 2015a Poverty available at bpsgoidSubjekviewid23subjekViewTab3|accordion-daftar-subjek1 accessed 27 October 2015
mdashmdash2015b Consumption and expenditure available at bpsgoidSubjekviewid5subjekViewTab3|accordion-daftar-subjek1 accessed 27 October 2015
mdashmdash2015c Population 15 Years of Age and Over Who Worked by Main Industry 2004-2014 available at bpsgoidlinkTabelStatisviewid970 accessed 27 October 2015
mdashmdash2014 Consumption and expenditure available at bpsgoidSubjekviewid5subjekViewTab3|accordion-daftar-subjek1 accessed 20 February 2014
mdashmdash2011 Total income by Household Group (billion rupiahs) available at bpsgoidSubjekviewid5subjekViewTab3|accordion-daftar-subjek1 accessed 1 August 2014
Khajali F amp Slominski BA 2012 lsquoFactors that affect the nutritive value of canola meal for poultryrsquo Poultry Science vol 91 no 10 pp 2564ndash2575 available at psoxfordjournalsorgcontent91102564fullxref-ref-95-1
Linehan V Thorpe S Andrews N amp Beaini F 2012a Food demand to 2050 Opportunities for Australian agriculture paper presented at 2012 ABARES Outlook conference Canberra 6ndash7 March available at daffgovauabarespublications
mdashmdash 2012b Food demand to 2050 Opportunities for Australian agriculturemdashalgebraic description of agrifood model technical annex to ABARES Outlook conference paper Canberra May available at daffgovauabarespublications
Ludena C Hertel T Preckel P Foster K and Nin A 2007 Productivity growth and convergence in crop ruminant and nonruminant production measurement and forecasts Agricultural Economics 37 available at onlinelibrarywileycomdoi101111j1574-0862200700218xabstract
McKinsey Global Institute 2012 The archipelago economy Unleashing Indonesias potential September Jakarta available at mckinseycominsightsasia-pacificthe_archipelago_economyashx
OECD 2013 Global Food Security Challenges for the Food and Agricultural System Organisation for Economic Cooperation and Development Paris available at oecd-ilibraryorgagriculture-and-foodglobal-food-security_9789264195363-en
mdashmdash2012a Looking to 2060 A global vision of long-term growth Economics Department Policy Notes no 15 Organisation for Economic Cooperation and Development Paris November available at oecdorgecomonetarypolicy-noteshtm
35
mdashmdash2012b OECD Review of Agricultural Policies Indonesia 2012 Organisation for Economic Cooperation and Development Paris available at oecd-ilibraryorgagriculture-and-foodoecd-review-of-agricultural-policies-indonesia-2012_9789264179011-en
OECDndashFAO 2014 OECDndashFAO Agricultural Outlook 2014 Organisation for Economic Cooperation and Development Paris available at oecd-ilibraryorgagriculture-and-foodoecd-fao-agricultural-outlook-2014_agr_outlook-2014-en
Osorio C Abriningrum D Armas E amp Firdaus M 2011 Who is benefiting from fertilizer subsidies in Indonesia Policy Research Working Paper 5758 World Bank Washington DC available at elibraryworldbankorgdoipdf1015961813-9450-5758
Rabobank 2013 Indonesia - islands of opportunity Agriculture in Focus Rabobank Food amp Agribusiness Research and Advisory Australia and New Zealand Spring Sydney
Shahaf E 2009 Agriculture in Indonesia Asia Technology Consulting available at techasiaconsultingcomagriculture_in_indonesiahtml
Statistics Indonesia 2015 Gross Domestic Product at Current Market Prices By Industrial Origin (Billion Rupiahs) 2000-2014 available at bpsgoidlinkTabelStatisviewid1199 accessed 26 October 2015
Sudaryanto T 2014 Fertilizer subsidy policy in Indonesia impacts and future perspectives Food and Fertiliser Technology Center for the Asian and Pacific Region Asia-Pacific Information Platform on Agricultural Policy (AP) available at apfftcagnetorgap_dbphpid=365
The Canadian Trade Commissioner Service 2011 lsquoAn Investment Guide to Indonesia available at tradecommissionergccaengdocumentjspdid=133467toc38
United Nations Population Division 2015 World population prospects the 2015 revision United Nations New York available at esaunorgunpdwppindexhtm accessed 12 August 2015
mdashmdash2014 World urbanisation prospects the 2014 revision United Nations New York available at esaunorgunpdwup accessed 19 March 2015
USAID nd lsquoIndonesia ndash Property rights amp resource governancersquo USAID Country Profile available at usaidlandtenurenetindonesia
USDAndashFAS 2014 Indonesia grain and feed annual report 2014 GAIN Report no ID1407 1 April Foreign Agricultural Service United States Department of Agriculture Washington DC available at usdaindonesiaorgcat=10
Widarjono A 2012 Food and nutrient demand in Indonesia PhD thesis Oklahoma State University available at shareokorgbitstreamhandle112446547Department20of20Agricultural20Economics_48pdfsequence=1
World Bank 2015 Global Economic Prospects January 2015 Having fiscal space and using it World Bank Group Washington DC available at worldbankorgenpublicationglobal-economic-prospects
mdashmdash2014 World development indicators World Bank Washington DC available at dataworldbankorgdata-catalogworld-development-indicators
36
mdashmdash2013 Transport in Indonesia World Bank Washington DC available at goworldbankorgPF2AFG64V0
mdashmdash 2012a Raskin subsidised rice delivery Public expenditure review (PER) Social assistance program and public expenditure review no 3 World Bank Washington DC available at documentsworldbankorgcurateden20120215893857raskin-subsidized-rice-delivery
mdashmdash2012b Targeting poor and vulnerable households in Indonesia World Bank Washington DC available at documentsworldbankorgcurateden20120115879773targeting-poor-vulnerable-households-indonesia
mdashmdash2011 Indonesia Agriculture Public Expenditure Review 2010 World Bank Jakarta available at documentsworldbankorgcurateden20110919456223indonesia-agriculture-public-expenditure-review-2010
mdashmdash2010 Completing decentralization World Bank Jakarta available at documentsworldbankorgcurateden20100112012453completing-decentralization
mdashmdash2009 Investing in a more sustainable Indonesia Country Environmental Analysis Report No 50762-ID World Bank CEA Series East Asia and Pacific Region available at openknowledgeworldbankorgbitstreamhandle109863135507620v20Revis1ox0info10CEA1englishpdfsequence=1
mdashmdash2007 Horticultural producers and supermarket development in Indonesia World Bank Washington DC available at documentsworldbankorgcurateden2007068235822horticultural-producers-supermarket-development-indonesia
WTO 2013 Trade policy review Indonesia WTO Document WTTPRS278 World Trade Organisation Geneva available at wtoorgenglishtratop_etpr_etp378_ehtm
Yamauchi F 2014 Wage Growth Landholding and Mechanization in Agriculture Evidence from Indonesia World Bank Washington DC February available at openknowledgeworldbankorghandle1098617324
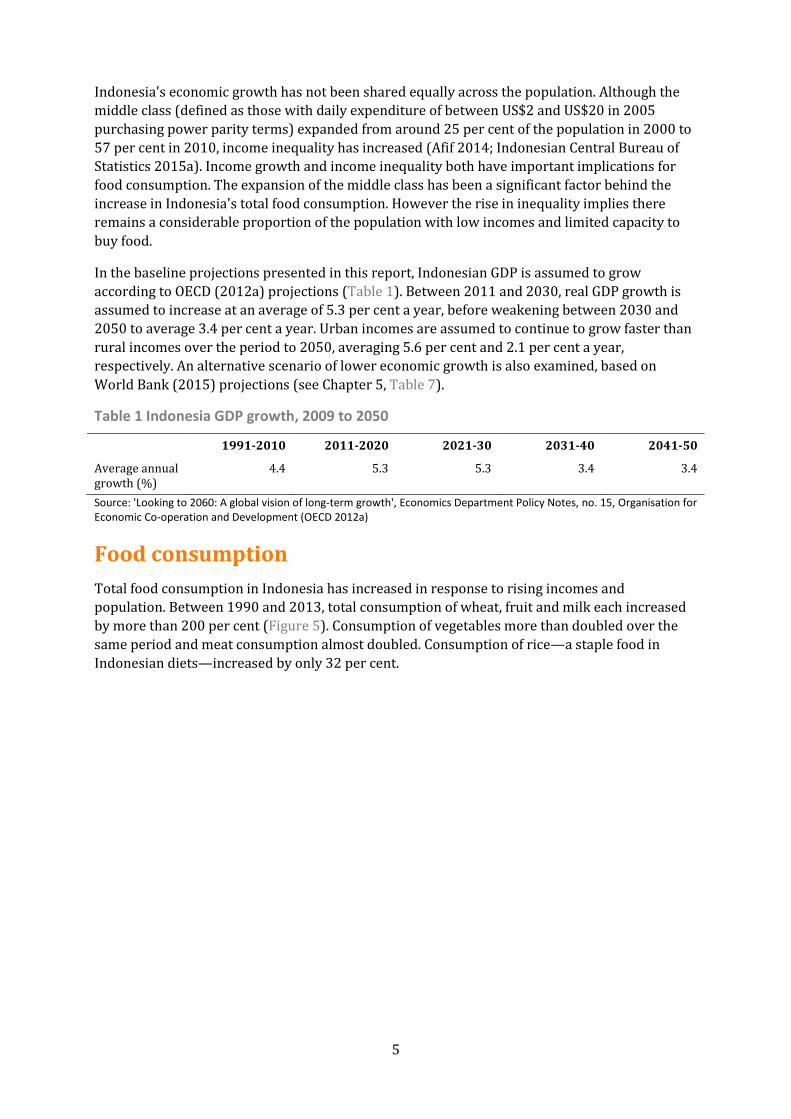
5
Indonesias economic growth has not been shared equally across the population Although the middle class (defined as those with daily expenditure of between US$2 and US$20 in 2005 purchasing power parity terms) expanded from around 25 per cent of the population in 2000 to 57 per cent in 2010 income inequality has increased (Afif 2014 Indonesian Central Bureau of Statistics 2015a) Income growth and income inequality both have important implications for food consumption The expansion of the middle class has been a significant factor behind the increase in Indonesias total food consumption However the rise in inequality implies there remains a considerable proportion of the population with low incomes and limited capacity to buy food
In the baseline projections presented in this report Indonesian GDP is assumed to grow according to OECD (2012a) projections (Table 1) Between 2011 and 2030 real GDP growth is assumed to increase at an average of 53 per cent a year before weakening between 2030 and 2050 to average 34 per cent a year Urban incomes are assumed to continue to grow faster than rural incomes over the period to 2050 averaging 56 per cent and 21 per cent a year respectively An alternative scenario of lower economic growth is also examined based on World Bank (2015) projections (see Chapter 5 Table 7)
Table 1 Indonesia GDP growth 2009 to 2050
1991-2010 2011-2020 2021-30 2031-40 2041-50
Average annual growth ()
44 53 53 34 34
Source Looking to 2060 A global vision of long-term growth Economics Department Policy Notes no 15 Organisation for Economic Co-operation and Development (OECD 2012a)
Food consumption Total food consumption in Indonesia has increased in response to rising incomes and population Between 1990 and 2013 total consumption of wheat fruit and milk each increased by more than 200 per cent (Figure 5) Consumption of vegetables more than doubled over the same period and meat consumption almost doubled Consumption of ricemdasha staple food in Indonesian dietsmdashincreased by only 32 per cent
6
Figure 5 Consumption of selected foods Indonesia
Source FAOSTAT Food and Agriculture Organization of the United Nations (FAO 2015)
Between 1990 and 2013 the average calorie intake per person in Indonesia increased by 19 per cent The contribution of starchy roots and pulses to individuals calorie intake declined while the contribution of fruit and vegetables meat and fish increased Average per person consumption of milk and other dairy products more than doubled but remained of limited significance
Poultry is the major source of meat in Indonesia accounting for over half the total meat consumed in 2013 (Figure 6) Pig meat constituted almost a quarter of total meat consumption in 2013 consumed by non-Muslim people Consumption of beef which ranks third has been increasing more slowly than chicken meat consumption because it is relatively more expensive (FAO 2015) Sheep and goat meat accounted for less than 5 per cent of total meat consumption
Million tonnes
5
10
15
20
25
30
35
40
1990 1992 1994 1996 1998 2000 2002 2004 2006 2008 2010 2012
Rice (milled equivalent)
Fruit
Vegetables
Wheat
Meat
Milk (excluding butter)
7
Figure 6 Total consumption of meats Indonesia
Source FAOSTAT Food and Agriculture Organization of the United Nations (FAO 2015)
On a per person basis Indonesias consumption of many food groups is relatively low This is because a high portion of its population lives at or near the poverty line Per person consumption of meat in 2011 was between 70 per cent and 80 per cent less than that of Japan the Republic of Korea China and many other ASEAN nations (Table 2) For dairy it was around 80 per cent less than that of Japan 56 per cent less than China 47 per cent less than the Republic of Korea and lower than other ASEAN countries For fruit and vegetables it was between 30 per cent and 65 per cent less than that of Japan and the Republic of Korea 74 per cent less than China and lower than other ASEAN countries These relatively low per person consumption levels underline the potential for sizable increases in per person food consumption as incomes rise
Table 2 International comparison of annual per person food consumption 2011
Country Meats kg
Dairy kg
Fruit and vegetables kg
Cereals kg
Japan 488 713 1524 1044
Republic of Korea 622 264 2888 1515
China 577 315 4178 1515
Malaysia 533 322 1131 1466
Philippines 345 145 1796 1577
Vietnam 576 151 1445 1670
Indonesia 129 139 1075 1906 Source FAOSTAT Food and Agriculture Organization of the United Nations (FAO 2015)
Diets of urban residents are usually different from their rural counterparts In 2013 Indonesias urban residents spent an average of 414 000 rupiah a month on food compared with 299 000 rupiah by rural residents (Indonesian Central Bureau of Statistics 2015b) Urban residents spent more than rural residents on meat fish eggs fruit and prepared (cooked and packaged) foods Rural residents spent more on cereals and tubers (Figure 7) with 24 per cent of their food budget devoted to cereals alone compared with only 15 per cent for urban residents
000 tonnes
200
400
600
800
1000
1200
1400
1600
1800
2000
1990 1992 1994 1996 1998 2000 2002 2004 2006 2008 2010 2012
Poultry meat
Pig meat
Bovine meat
Sheep and goat meat
8
Figure 7 Expenditure on food items urban and rural residents 2013 Indonesia
Source Indonesian Central Bureau of Statistics 2015b
Food marketing in Indonesia is also changing In the 1980s supermarkets occupied only a small niche in food retailing By the mid-1990s they were still confined to the urban upper income sector Supermarkets only began to spread quickly in Indonesia after 1998 By 2007 they accounted for about 30 per cent of overall retail food expenditure (World Bank 2007)
The development of supermarkets is typically associated with closer vertical coordination along value chains as the supermarkets maintain close relationships with their suppliers This often involves contractual arrangements with farmers or in the case of food imports with suppliers in other countries Asian supermarket chains have developed direct relationships with suppliers of fresh horticultural and dairy produce in the United States New Zealand and Australia (Glover 2011)
000 rupiah
20
40
60
80
100
120
140
Cere
als
Tube
rs
Fish
Mea
t
Eggs
and
milk
Vege
tabl
es
Legu
mes
Frui
ts
Oil
and
fats
Beve
rage
s
Misc
food
item
sPr
epar
ed fo
odan
dhellip
Urban
Rural
9
3 Production constraints in Indonesian agriculture
The agriculture sector is a key component of the Indonesian economy contributing about 14 per cent of Indonesias GDP in 2014 (Statistics Indonesia 2015) Thirty per cent of Indonesias land area is used for agricultural purposes and the sector employs 41 million people or 35 per cent of the nations work force The sector is a strong contributor to Indonesias trade with agricultural exports accounting for 24 per cent of the value of total merchandise exports in 2012 (World Bank 2014)
Indonesias agriculture is generally characterised by fertile volcanic soils and abundant renewable water resources High population density has resulted in a sector dominated by smallholdings Agricultural land area per person in Indonesia is low at just 022 hectares This is equivalent to a third of the world average (World Bank 2014) Challenges to agricultural production and productivity growth include the availability and quality of natural resources insecure land tenure underemployment of labour and lack of infrastructure
Resource constraints Land availability Indonesia is the worlds largest nation archipelago made up of 17 508 islands of which just over a third are inhabited Java is the most densely populated island accommodating more than half of Indonesias population (57 per cent in 2013) on only 7 per cent of the total land area (Map 1)
Map 1 Map of Indonesia
Source GeoNetwork Food and Agriculture Organization of the United Nations (FAO 2012)
About 30 per cent of Indonesias land area (545 000 square kilometres) is classified as agricultural land (World Bank 2014) Of this 43 per cent or 235 000 square kilometres is considered arable that is land under annual crops or any fallow or pasture land used for annual crops within any five-year period The remaining agricultural land is either devoted to plantation crops (such as oil palm coconut rubber coffee and sugar cane) or permanent pasture (natural or seeded grassland that remains unploughed for many years)
10
The islands of Java Bali and large parts of Sumatra are home to irrigated lowland rice-paddy terraces and upland rain fed farming The average size of farms producing rice and other food crops such as maize peanuts and cassava ranges from 03 hectares on Java to 14 hectares elsewhere (OECD 2013) Java produces around half of Indonesias rice Expansion of the lowland rice area in Java is limited because of increasing competition for land with other crops and non-agricultural uses such as industry uses housing and roads (FAO 2005)
The plantation and industrial crops sector dominated by oil palm coconut and natural rubber makes up 15 per cent of total crop area Large private and state-owned farms are involved in these perennial cropsmdashmainly in Kalimantan and Sumatra and mainly for producing oil palm and natural rubbermdashbut there are also many smallholders The average farm size in this sector is 2 600 hectares (OECD 2013)
Until 2010 growth in agricultural production relied largely on converting forested areas into agricultural land particularly to oil palm plantations In the past two decades millions of hectares were cleared for this purpose Just over half of Indonesias total land was classified as forest area in 2011 compared with 65 per cent in 1990 (Figure 8) Driving this trend has been the growing global demand for edible oils and the price competitiveness of palm oil relative to alternatives such as soybean oil (Rabobank 2013) Much of the deforestation is concentrated in Sumatra and Kalimantan
Figure 8 Land use in Indonesia
Note Share of total land area Source World Development indicators World Bank Group (World Bank 2014)
Many less populated islands remain densely forested and are home to forest and coastal communities that sustain themselves through agriculture hunting foraging and fishing (USAID nd) Indonesias Ministry of Forestry estimates of bush shrub grass and barren land across Indonesia total 22 million hectaresmdasharound half of which is located in Kalimantan and Papua McKinsey Global Institute (2012) estimates almost 7 million hectares of this land (much of which used to be in agricultural production but has since been abandoned) could be developed for agricultural production Alexandratos and Bruinsma (2012) project that between 2009 and 2050 total arable land in Indonesia will increase by 75 per centmdashan assumption used in the modelling in this report
20
40
60
80
100
1990 1993 1996 1999 2002 2005 2008 2011
Other
Agriculture
Forest area
11
Land degradation Indonesia is regularly described as being a highly fertile country but land quality varies across the archipelago The central islands have more fertile soils and hence are densely populated Agricultural land in Java in particular has benefited from high levels of mineral fertiliser application soil and water erosion control programmes and relatively good soil (FAO 2005) In contrast the soils of the outer less populated islands are characterised by highly weathered acidic soils that require higher fertiliser inputs to achieve the high crop yields obtained in Java and the other central islands Actual fertiliser use in the outer islands is generally lower than on Java resulting in soil nutrient depletion in the upland crop areas (FAO 2005)
Erosion and associated problems of nutrient depletion are minimal on Java because of the system of flat terracing and well-maintained irrigation schemes However in the lower-potential rain fed uplands where crops such as maize and cassava are produced on sloping hillsides erosion problems and nutrient depletion are more prevalent Where deforestation has occurred to make way for plantation crops loss of forest cover has led to watershed degradation silting of waterways flooding soil erosion and decline in soil quality and soil productivity (World Bank 2009)
Land tenure Land parcels in Indonesia are highly fragmented particularly on smallholder farms As land is passed down the generations it tends to become divided into smaller parcels (McKinsey Global Institute 2013) While the law requires that all land rights be registered most of these inherited parcels are unregistered less than 25 per cent of rural land parcel holders have been registered in the 40 years since land registration began (OECD 2012b) Additionally a large share of land off Java is communal rather than privately titled Land rights of these communities are often not formally recognised increasing the risk of conflict
The implications of the land tenure arrangements are that for large investors gaining access to land is a long and unclear process As a result only limited land rights are granted which compromises the extent to which production can increase (OECD 2012b) For smallholders unclear land tenure or nonexistence of certificated land registration compounds the difficulties of gaining access to credit from financial institutions This discourages investment in productivity-enhancing technology and biases farmers choices away from longer-term activities such as tree crops (World Bank 2010)
Fertiliser use The Indonesian Government maintains a ceiling price on fertiliser which depending on fertiliser type is between 50 per cent and 75 per cent lower than the market price (Sudaryanto 2014) Lower fertiliser prices are intended to encourage increased crop production particularly of rice The government provides a subsidy to fertiliser manufacturers to compensate them for selling fertiliser below market prices Despite the subsidy payment the incentives for fertiliser manufacturers to increase production and compete with one another are limited by government regulation of production quantities prices and locations where fertiliser can be sold (Osorio et al 2011)
The use of fertiliser is unevenly distributed across the archipelago Among food crops the highest application rates per hectare are for rice followed by maize and soybeans The lowest are for peanut and cassava The subsidy and resulting increase in fertiliser use led to more than a doubling of rice production between 1970 and 2000 Over that period total annual fertiliser
12
use increased from 635 000 tonnes to 59 million tonnes more than half of which was used to increase rice production (FAO 2005)
Fertilisers remain underused on plantation crops Large areas of plantation crops are owned and managed by smallholder farmers For many the lack of knowledge about appropriate fertilisation technology and the lack of reliable and timely access to the right fertilisers at village level lead to inadequate and unbalanced application (FAO 2005)
Apart from the budgetary burden subsidising domestic fertiliser prices results in inefficient fertiliser use at the farm level Studies in West Java report rice farmers applying levels of fertilisers higher than the recommended rates with some soil tests showing nutrient reserves had built up to high levels negatively affecting yields (FAO 2005 Osorio et al 2011)
Farm labour and mechanisation Indonesian agriculture is dominated by abundant labour in relation to available agricultural land contributing to the issue of small-scale production The agriculture forestry and fishing sector employs around 40 million people or 35 per cent of the workforce (15 years and over) and is the main source of employment in rural areas (Indonesian Central Bureau of Statistics 2015c McKinsey 2012) The proportion of landless and land-poor agricultural households is especially high on Java Of more than 17 million households on Java characterised as farmer or agricultural labourer households 39 per cent neither lease nor own any crop land and another 44 per cent lease or own less than 05 hectares (USAID nd)
Tradition is one obstacle to agricultural development in Indonesia (Shahaf 2009) In many cases farmers grow the same crops as previous generations using the same such methods and tools Sometimes two or three generations work the same farm
Traditionally particularly in Java harvesting is undertaken primarily by manual labour (Yamauchi 2014) Machines are rarely used However outside Java the emergence of larger scale farmers had led to operations scaling up through mechanisation This has contributed to a rise in farm labour productivity since 2000 (Figure 9)
Figure 9 Agriculture value added per farm worker Indonesia
Source World Development indicators World Bank Group (World Bank 2014)
Currently tractors are used for land preparation activities such as primary and secondary tillage while seeding and planting activities continue to be done manually Threshers are used in more developed areas where agricultural labour has become scarce as a result of competitive wages in other industries
2005 US$
200
400
600
800
1 000
1 200
1980 1984 1988 1992 1996 2000 2004 2008 2012
13
Wage growth in recent years may have led to the introduction of labour saving practices among relatively large farmers such as renting more land and acquiring machinery (Yamauchi 2014) In contrast small farmers have not significantly changed their behaviours
Infrastructure As the worlds largest archipelago Indonesias insufficient and poor quality infrastructure is a major challenge for connectivity between the islands High transport costs also undermine the competitiveness of agricultural industries and associated supply chains (Rabobank 2013 OECD 2012b) With most transport developments concentrated in Java access to markets for the rest of Indonesia is poor
Ninety per cent of freight and 80 per cent of passenger traffic in Indonesia moves by road However roads are heavily congested and their quality in urban and provincial areas is poor (The Canadian Trade Commissioner Service 2011) Because connectivity with markets is compromised by an inadequate road system returns to agricultural producers are often discounted because of spoilage incurred during transport (Global Business Guide Indonesia 2012)
Indonesia has around 300 ports spread throughout the archipelago Inter-island shipping consisting of ferry and cargo shipping services accounts for around 60 per cent of total seaborne cargo in the country (World Bank 2013) Seaports in Indonesia are outdated and investment in port facilities has not matched the rapid growth of traffic moving through them As a result inefficiencies in the shipping system such as bottlenecks and delays in cargo handling are common Vessels also often leave the main port Tanjung Priok before they are fully loaded to keep to published schedules (The Canadian Trade Commissioner Service 2011)
Current infrastructure does not support internal trade well and challenges Indonesiarsquos ability to provide its own food to its own people Developing an efficient transport and logistics system would not only increase the competitiveness of Indonesias external trade but would also provide easier and cheaper access for local agricultural products to domestic markets with reduced losses through spoilage Until this is achieved Indonesian supply chains will continue to be uncompetitive inefficient and looking to other markets to satisfy agrifood demand particularly in urban centres
Water availability While Indonesias water supplies may be sufficient for current agricultural production deterioration of the existing irrigation infrastructure and investment constraints to improve or develop new infrastructure may limit Indonesias future water availability given rapid urbanisation and food demands
Growing municipal water needs and the needs of the agriculture sector to increase production to meet the demands of urban consumers is likely to result in water shortages in coming decades The McKinsey Global Institute projects that by 2030 water supplies will fall short of demand by around 18 per cent (McKinsey 2012) Significant investment is required to improve water productivity and reduce water transmission losses through rehabilitating old and damaged irrigation infrastructure Up to half of Indonesias piped water supply is estimated to be lost in transmission (McKinsey 2012)
Feed availability Increasing demand for meat protein has stimulated the establishment of large scale commercial poultry farms and beef cattle feedlots Data from the Indonesian Feed Millers Association show
14
the poultry industry consumes 83 per cent of Indonesias animal feed the aquaculture industry consumes 11 per cent and cattle and pig industries the remaining 6 per cent (USDAndashFAS 2014)
On average Indonesias livestock feed is composed of maize (50 per cent) soybean meal (15 to 20 per cent) rice bran (15 per cent) wheat pollard (8 per cent) fish meal (5 per cent) maize gluten meal (3 per cent) and crude palm oil (2 per cent) (USDAndashFAS 2014) While most maize is sourced domestically inconsistent seasonal supplies and storage challenges such as high moisture content and aflatoxin levels are major factors that are leading feed millers to import increasing quantities of maize Canola meal is being used increasingly in poultry diets as a cost competitive alternative to soybean meal However its use is restricted to less than full replacement of soybean meal because of canolarsquos lower energy and protein content and the presence of antinutritional factors such as lower amino acid digestibility than in soybean meal (Khajali and Slominski 2012) Apart from maize and agri-industrial by-products such as rice bran copra meal and palm kernel meal other feed ingredients are largely imported (Table 3)
In food crop producing areas fibrous agricultural residues have become the main feed source for ruminant animals raised by small scale livestock producers Rice straw is fed as a base roughage but additional good quality feedstuff or concentratesmdashsuch as leaves and stalks of cassava leaves of maize and sugarcane leaves stems and peelings of banana rice bran pods and peelings of cacao and the fronds pressed fibre and palm kernel cake from oil palmmdashare required to gain higher production performance (Djajanegara 1999) Such feeds are available in various locations but their unequal distribution and high prices at the farm level limit their use by smallholder farmers Lack of storage and labour shortages during harvest time also restrict the collection of rice straw These limitations as well as the seasonal nature of these feedstuffs affect continuity of supply and therefore the productivity potential of smallholder livestock producers
Table 3 Indonesian animal feed sources of primary ingredients
Feed ingredient Local share () Imported share ()
Maize 90ndash95 5ndash10
Fish meal 5ndash10 90ndash95
Meat and bone meal (MBM) 0 100
Soybean meal 0 100
Rapeseed meal 0 100
Maize gluten meal 0 100
Feed additive 0 100
Rice bran 100 0
Copra meal 100 0
Palm kernel meal 100 0
Crude palm oil (CPO) 100 0 Source Indonesia grain and feed annual report 2014 United States Department of Agriculture (USDAndashFAS 2014)
Productivity There has been significant growth in the volume of total agricultural output in Indonesia over the past 50 years although the rate of growth has varied markedly over the decades The contribution of increased total factor productivity (TFP) to total agricultural output growth (including food crops and non-food cash crops) was strong during the 1960s and 1970s as new
15
technologies and improved crop varieties were widely adopted during the green revolution (Table 4) (Fuglie 2010 2012) In the 1980s land and labour use expanded enabling total agricultural output to grow but TFP growth slowed During the 1990s average agricultural output growth declined to less than 2 per cent a year as the green revolution crop varieties had already been widely adopted and no newer higher yielding varieties were suitable or available However TFP growth was stronger than the previous decade
Table 4 Average annual food and non-food agricultural output and total factor productivity growth Indonesia
Years Agricultural output Agricultural TFP
1961ndash1970 271 175
1971ndash1980 334 140
1981ndash1990 464 059
1991ndash2000 187 099
2001ndash2009 486 368 Note Agricultural output measured in volume Source Fuglie 2012
Between 2001 and 2009 strong output and TFP growth resumed for a number of reasons Newly available crop land achieved by the clearing of forested areas supported the expansion and diversification of agriculture into higher value non-staple commodities such as tropical perennials horticulture and livestock At the same time the relatively low price of fertilisers and chemicals available to producers led to a 50 per cent increase in their use between 2002 and 2009 (Figure 10) resulting in a marked improvement in crop yields compared with the previous decade (OECDndashFAO 2014) Improved literacy and education of the farm labour force also contributed to productivity growth (OECD 2012b)
Figure 10 Total fertilizer use in Indonesia by type
Note 2001 data not available Source FAOSTAT Food and Agriculture Organization of the United Nations (FAO 2015)
TFP estimates do not exist for the period since 2010 While yield growth is not as robust a measure of technical change as TFP yield trends can provide a partial indication of changes in productivity Average annual yield growth between 2011 and 2013 was lower than in the
Mt
1
2
3
2002 2003 2004 2005 2006 2007 2008 2009
Nitrogen
Potash
Phosphate
16
periods 2001ndash05 and 2006ndash10 across a range of food and non-food crops (Table 5) A number of factors explain this slowdown The rate of conversion of forest land to cropping slowed significantly reducing the rate of agricultural output growth achieved through additional agricultural land (OECD 2012b) In addition the sustained overuse of fertilizers and chemicals throughout the 2000s has led to decreasing returns to scale for these intermediate inputs As a result any future increase in the productivity of food and non-food crops is unlikely to be achieved through the application of chemicals or fertilisers
Table 5 Average annual yield growth of food and non-food cash crops Indonesia
Commodity Unit 1991-95 1996-00 2001-05 2006-10 2011-13
Food crops
Rice 02 03 08 19 09
Maize 12 42 46 52 30
Cassava -06 15 50 49 36
Mung beans -03 -67 44 23 -02
Soybeans 04 17 11 11 12
Groundnuts -34 58 15 16 02
Vegetables a 93 -08 35 -17 -68
Cash crops
Rubber na -01 45 58 48
Crude palm oil na -72 108 -06 12
Palm kernel na -104 120 08 -10
Cocoa na 05 143 21 -30
Coffee na 24 14 62 37
Tea na 02 30 -05 -11 a Vegetable data available to 2012 Source FAOSTAT Food and Agriculture Organization of the United Nations (FAO 2015)
With reduced scope for expansion in agricultural production through both conversion of forest land and increased use of fertilisers and chemicals future agricultural productivity growth is likely to be achieved through the more efficient use of inputs The dominance of smallholdings remains a constraint to achieving higher agricultural productivity growth in future as small plots impede the implementation of more productive practices This is compounded by inefficient fertiliser use limited mechanisation and an inadequate supply of other important inputs such as high-yielding seeds irrigation systems extension services and access to credit Addressing these issues will be key to future productivity trends
17
4 Indonesian agricultural and food policies
The objectives of Indonesias agricultural policy as stated by the Indonesian Ministry of Agriculture in 2010 are to
1) achieve food self-sufficiency
2) enhance diversification of production and consumption
3) raise the competitiveness and value added of production and
4) increase farmersrsquo welfare (OECD 2012b)
To achieve its objectives the Indonesian Government intervenes in the farm sector with multiple policy instruments The government also implements policies to protect consumers from fluctuations in prices of key food products such as wheat rice and vegetable oils and to insulate domestic producers from foreign competition Food for consumers is subsidised which effectively maintains the price of food within a narrow price band Producers benefit from tariffs applied to imported food which keep the price of domestically produced food competitive with imports Additionally producers are directly supported by government food purchases at guaranteed prices and subsidies on farm inputs such as fertiliser seed and farm equipment
Policies to support agricultural production Reference prices and import restrictions The Indonesian Government sets reference prices for rice sugar and beef which it aims to maintain through various policy instruments
On average around 70 per cent of domestic rice production is consumed within the farming household (OECD 2012b) The remainder is sold through either private or government-run channels such as Indonesias National Food Logistics Agency known as Badan Ursan Logistik (BULOG) BULOG purchases a limited amount of rice at the reference price to fulfil two objectives
1) stockholding for emergency purposes and
2) redistribution as part of the consumer subsidy programme Raskin (discussed below) (OECD 2012b)
In 2010 BULOG procured around 6 per cent of total domestic rice production equivalent to around 20 per cent of all marketed rice (OECD 2012b)
For sugar the government supports the producer price by imposing legal requirements on domestic sugar millers who control the domestic sugar market Sugar millers are required to purchase 75 per cent of their sugar cane requirements from domestic sugar cane growers and to pay growers a government-determined price
The Indonesian rice and sugar industries are also protected by import restrictions Companies that import rice and sugar are required to support the domestic industry by buying domestically produced product if the mill price falls below the reference price
18
For beef and live cattle imports the Indonesian Government sets a reference price which it aims to achieve by managing import volumes through an import permit system Since 2014 the reference price has been 76 000 rupiah (A$720) a kilogram Under the system import permits are not issued if domestic beef prices fall below the reference price (ABARES 2013) Weight restrictions on cattle imports also usually apply limiting imports to young lighter cattle destined for feedlots
The Indonesian Government also restricts imports of other commodities such as soybeans maize horticulture certain processed foods and animals and animal products (including fresh chilled and frozen meat and eggs) Importing these commodities is generally not permitted if the Ministry of Trade considers it will cause injury to the domestic industry (WTO 2013) Companies seeking to import these commodities are required to gain approval from the Indonesian Ministry of Trade (OECD 2012b)
Tariffs Tariffs are applied to most imported food products in Indonesia However they are relatively low and are not a major policy instrument used to protect domestic industries The average applied agricultural tariff was 53 per cent in 2010 (OECD 2012b) Around 85 per cent of agricultural imports are subject to tariffs between zero and 5 per cent with almost 66 per cent entering duty free All agricultural tariffs are ad valorem except for rice and sugar which have specific tariffs (OECD 2012b)
While applied tariffs are low bound tariff rates or the ceiling rate that can be applied under World Trade Organisation rules remain high (Figure 11) On average the bound rate on agricultural products is 47 per cent (OECD 2012b) The highest bound tariff is 210 per cent for milk powders although the applied rate is just 5 per cent Rice has a bound tariff of 160 per cent and an applied specific rate of 450 rupiah a kilogram (equivalent to an ad valorem tariff of 10 per cent when using the average export price for 15 per cent broken rice from Thailand in 2010) (OECD 2012b)
Figure 11 Average bound and applied tariffs by product groups
Source OECD Review of Agricultural Policies Indonesia 2012 Organisation for Economic Co-operation and Development (OECD 2012b)
0
20
40
60
80
Fruit and vegetables
Sugars and confectionery
Cereals Dairy products
Animals and animal
products
Oilseeds fats and oils
Average bound tariff
Average applied tariff
19
Input subsidies The Indonesian Government supports farmers by subsiding inputs such as fertiliser seeds and ad hoc products including power tools and rice milling units Fertiliser support is the largest component of budgetary support for agriculture accounting for 37 per cent in 2008ndash09 (OECD 2012b) Not all farmers receive input subsidies because eligibility requirements apply in many cases For example subsidised fertiliser is only available to farmers producing on less than 2 hectares
Policies to support consumers Price intervention The Indonesian Government intervenes in the domestic market for wheat flour maize and cooking oil when it considers retail prices too high for the poor It does this using a broad range of measures from simply asking manufacturers and wholesalers to be socially responsible with their pricing to purchasing these products and distributing them directly to poor households (OECD 2012b) Another policy often used is the government covered value tax under which the government waives the existing 10 per cent value added tax on the final price of certain food items For example the government has used this policy to reduce the price of non-branded cooking oil since 2007 In 2010 this policy cost the Indonesian Government around 250 billion rupiah (A$299 million)
Food subsidies The Indonesian Government operates a targeted rice subsidy programme known as Raskin to combat food insecurity The programmes objective is to make available a set quantity of rice (procured by BULOG) at a subsidised price to Indonesias poorest households on a monthly basis Raskins intention is to provide rice to those on official lists of households living under or near the national poverty line (World Bank 2012b) The poverty line in 2014 was around 318 500 rupiah per person a month in urban areas and 286 100 rupiah per person a month in rural areas (Indonesian Central Bureau of Statistics 2015a) Those with incomes within 20 per cent of the poverty line are defined as being near the poverty line (World Bank 2012b)
Despite the objectives of Raskin to target the most vulnerable since allocations of Raskin rice to households are decided by local authorities poor and non-poor households alike benefit from the programme In 2010 around 175 million households received Raskin rice (OECD 2012b) at a cost of around 14 trillion rupiah (A$17 billion) to the Indonesian Government (Figure 12) Between 2005 and 2010 the subsidised price was 1 600 rupiah (A$019) a kilogram representing about 20 to 25 per cent of the average market price (World Bank 2012a)
The quantity of rice per household the subsidised price the number of months a year that rice is distributed and the classification of the poorest households have all been altered over the period of the programme For example monthly allocations per household have been set as low as 10 kilograms and as high as 20 kilograms over the programme period although households rarely benefit from the full amount of the allocation (OECD 2012b World Bank 2012a)
20
Figure 12 Raskin rice distribution and budgetary cost
Source OECD Review of Agricultural Policies Indonesia 2012 Organisation for Economic Co-operation and Development (OECD 2012b)
Implications of agricultural and food policies Public expenditure on Indonesian agriculture has increased under its current policy settings In 2009 public spending was around 615 trillion rupiah (A$75 billion) This was equivalent to 56 per cent of total government expenditure compared with 27 per cent in 2001 (World Bank 2011) The fertiliser subsidy and Raskin have been the biggest drivers of increased spending over this period
In addition to the direct budget cost of Indonesias agricultural and food policies there have also been allocative effects Indonesian policies tend to focus on rice maize and sugar leading to increased production of these commodities and improved availability from domestic sources However expansion of these crops has come at the expense of horticulture and other commodities in which Indonesia has a comparative advantage such as natural rubber cocoa and spices (World Bank 2011)
The administration of some support programmes the fertiliser subsidy in particular is inefficient (Sudaryanto 2014) As discussed in Chapter 3 subsidising fertiliser companies in an environment where quantities prices and distribution channels are regulated reduces incentives for these companies to effectively compete This inefficiency has resulted in the under-production of fertiliser leading to shortages At the same time the artificially low price has led to an over-reliance on fertiliser by producers to increase yield rather than using other methods such as improved seeds (World Bank 2011)
4000
8000
12000
16000
2000 2002 2004 2006 2008 20100
1
2
3
4
Expenditure on RASKIN
Quantity of rice distributed (right axis)
Million tonnes
Billionrupiah
21
5 Simulation results Baseline assumptions The objective in this analysis is to identify and quantify projected changes in Indonesian demand for a range of agrifood commodities over the longer term across urban and rural households An updated version of the ABARES agrifood model (Linehan et al 2012a) is used to investigate these potential trends The model has been modified to include Indonesias consumer subsidy policy (Raskin) and a re-aggregation of some country and commodity groups to allow more detailed analysis
Indonesia has a comparative advantage in the production of many cash crops and non-food agricultural commodities that are not included in the ABARES agrifood model such as natural rubber copra palm kernels coffee cocoa and spices (FAO 2013) In Indonesia the production of these commodities competes with food commodities for resources despite a policy environment targeted at food production and food self-sufficiency
Given Indonesias limited supply of arable land and the quality and availability of its water supply the capacity of the domestic agricultural sector to meet the growing demand for food in Indonesia will depend heavily on improvements in productivity Total factor productivity (TFP) growth in Indonesian agriculture is estimated to have averaged 154 per cent a year since 1961 It is expected that yield growth in Indonesia will not decline from this average annual rate in the future because the potential for productivity growth remains significant However nor is it expected to continue at the relatively high rates estimated for the period 2001 to 2009 which were made possible from the expansion of agriculture into higher-value non-staple commodities on newly deforested land and a significant increase in the use of chemical fertilisers (see Chapter 4)
Productivity growth since 2010 is estimated to have slowed from the decade 2001ndash2009 The Indonesian Governments policy initiative Reducing Emissions from Deforestation and Forest Degradation (REDD) in 2010 and declaration of a two-year Forest Moratorium in 2011 have slowed the rate of forest conversion to crop land (OECD 2012b) In addition agricultural production continues to be constrained by the issues outlined in Chapter 4 (including decreasing returns to scale for chemical inputs lack of widespread mechanisation and deteriorating resource base) With ongoing competition between the production of food crops and non-food cash crops (in which Indonesia has a comparative advantage) and little prospects in the foreseeable future for major policy changes on food consumption and production TFP growth for food crops in Indonesia is assumed to average 154 per cent a year between 2009 and 2050 This is close to the forecast by Ludena et al (2007) of 152 per cent a year to 2040 (FAO 2013 USDAndashFAS 2014)
Growth rates for TFP for individual commodities have in the past shown similar patterns to growth in yields Assumptions of TFP growth rates for individual commodities are therefore derived by apportioning the assumed rate for the whole of agriculture by historical growth in the yields of each commodity (Table 6)
22
Table 6 Average annual TFP growth rate by industry in Indonesia 2009 to 2050
Industry
Rice 214
Maize 337
Coarse grains 335
Other cereals 239
Oilseeds 388
Vegetables 232
Fruit 303
Beef 032
Sheep and goat meat 144
Poultry 144
Eggs 135
Dairy 215
All Agriculture 154 Source ABARES model assumption
In the reference case no change to Indonesias market support policies is assumed over the projection period On the production side these include the principal forms of market support of state trading input subsidies and import restrictions Additionally the Indonesian Governments minimum support prices for rice and wheat are maintained in real terms as are other ad hoc interventions on a range of agricultural commodities
The government support received by consumers through the consumer subsidy policy Raskin is also maintained in real terms over the projection period (discussed in Chapter 4)
The baseline projections determined in the agrifood model for Indonesia are also dependent on a set of assumptions discussed in Chapters 2 and 3 To summarise
bull population growth is assumed to average 07 per cent a year between 2010 and 2050
bull the proportion of the population in urban areas is assumed to increase from 50 per cent in 2009 to 72 per cent by 2050
bull average annual GDP growth in Indonesia is assumed to average 53 per cent a year between 2010 and 2030 before weakening between 2030 and 2050 to average 34 per cent a year (Table 1)
bull average annual income growth is assumed to be 56 per cent a year in urban areas and 21 per cent a year in rural areas
agricultural productivity in Indonesia is assumed to continue to increase according to the growth estimates provided in Table 6
The population is divided into two income stratamdashurban income and rural income households Across these two household types the income growth assumptions to 2050 for urban and rural areas are based on historical income data from the Indonesian Central Bureau of Statistics (2011) These data demonstrate that not only is average urban income higher than average rural income but with urbanisation average income growth in urban areas has also been higher than
23
in rural areas This has been the result of a relatively faster rate of economic development and higher wages which have stemmed from the growth in the manufacturing and services sectors prevalent in urban areas The model assumes this trend in income growth will continue to 2050 Indonesian household food consumption data in the base year of the model are from the Indonesian Central Bureau of Statistics (2014) and Widarjono (2012) These data were used as the basis in the model to project food consumption across urban and rural households to 2050
In the model total and per person Indonesian food consumption and total urban and rural food consumption is apparent consumption which reflects the total use of agrifood products (food feed and industrial use) In contrast per person urban and rural consumption is direct food consumption only it excludes feed use and industrial use of agrifood products to better reflect changes in diets
Consumption The real value of total food consumption in Indonesia (including food feed and industrial use) is projected to quadruple between 2009 and 2050 to US$327 billion (in 2009 US dollars) The largest increases are for meat dairy products fruit and vegetables as real incomes increase (Figure 13) Together these commodities account for two-thirds of the projected rise in the real value of food consumption
Figure 13 Consumption of selected agricultural commodities Indonesia
Note Starchy staples include pulses yams potatoes and cassava Source ABARES model output
Between 2009 and 2050 the real value of Indonesian beef consumption is projected to rise more than 14 times to US$35 billion (in 2009 US dollars) dairy products ten times to almost US$9 billion and fruit and vegetables more than three times to US$50 billion and US$25 billion respectively For many commodities the value of consumption in 2050 is projected to rise from a very low base reflecting high poverty rates and a large rural population in 2009 By 2050 72 per cent of the population is projected to live in urban centres with higher incomes than the
10 20 30 40 50 60
Wheat
Sheep and goat meat
Dairy
Sugar
Oil crops
Rice
Vegetables
Starchy staples
Beef
Poultry
Fruit
2050
2009
Billion(2009 US$)
552
66
231
1311
269
1319
256
246
935
1340
113
24
rural cohort It is this expected transition of the population and income growth that drive the magnitude of projected consumption growth for many commodities Despite these large increases Indonesias per person food consumption in 2050 is projected to remain below that of China for many commodities (Hamshere et al 2014)
For cereals oil crops and starchy staples (pulses potatoes yams and cassava) consumption is also projected to increase Between 2009 and 2050 the real value of rice consumption is projected to rise by 66 per cent to nearly US$23 billion (in 2009 US dollars) maize by 182 per cent to US$8 billion oil crops by 246 per cent to US$22 billion and starchy staples by 256 per cent to almost US$29 billion Over this period the real value of sugar consumption is projected to rise more than six times to US$14 billion (in 2009 US dollars)
The projected rise in consumption of cereals oil crops and starchy staples is driven by a number of factors First cereals and starchy staples (such as cassava) are relatively affordable foods particularly for low and middle income consumers whose populations are projected to rise Although both cereals and starchy staples will remain important components of Indonesian diets to 2050 their relative contribution will decline as diets become more diversified with greater amounts of meats dairy products and fruit and vegetablesmdashthe continuation of a trend that began around 1990 (Figure 5)
The projected rise in consumption of cereals oil crops and starchy staples is also driven by feed requirements which will increase as the demand for meat protein rises to 2050 As discussed in Chapter 3 about 50 per cent of domestic maize production is used as feed Rice bran also comprises about 15 per cent of total Indonesian feed consumption Soybean meal comprises between 15 per cent and 20 per cent of total livestock feed all of which is imported Rapeseed meal can be used as a partial substitute for soybeans and it too is entirely imported In 2050 it is projected that feed use will account for around 42 per cent of total maize consumption 43 per cent of total oil crop consumption and 44 per cent of total starchy staple consumption a larger proportion of which will need to be imported compared with 2009
Urban and rural consumption In 2050 71 per cent of Indonesias population is projected to live in urban areas compared with 54 per cent in 2015 (United Nations Population Division 2014) By 2050 Indonesian consumers are projected to have more diverse diets with greater consumption of meat dairy products fruit and vegetables
In this section the results for total urban and rural consumption reflect apparent consumption However per person rural and urban consumption is direct food consumption only Feed use and industrial use of the agrifood products are excluded in the per person results in order to better understand the projected change in diets
High value commodities Urban consumers account for most of the growth in consumption of meat dairy products fruit and vegetables over the projection period because of rising urban populations and incomes Between 2009 and 2050 the real value of urban beef consumption is projected to rise more than 18 times to US$34 billion (in 2009 US dollars) Consumption of dairy products is projected to rise by more than 14 times to more than US$8 billion and fruit and vegetables more than four times to US$43 billion and almost US$21 billion respectively (Figure 14)
25
Figure 14 Urban consumption of selected agricultural commodities Indonesia
Source ABARES model output
In per person terms the value of urban beef consumption is projected to rise more than nine times between 2009 and 2050 dairy more than seven times and fruit and vegetables to more than double However consumption of rice is projected to fall by 4 per cent While these increases are large Indonesias urban per person consumption in 2050 is still projected to be lower than that of China in the same year for many commodities including vegetables (73 per cent lower) oilseeds (12 per cent) dairy products (41 per cent) and sheep and goat meat (24 per cent) In contrast Indonesias urban per person consumption is projected to be higher than Chinas for beef (52 per cent higher) sugar (400 per cent) cereals (23 per cent) and starchy staples (14 times higher) (Hamshere et al 2014) For beef higher Indonesian per person consumption relative to China in 2050 reflects the dominance of beef in Indonesian diets by that time compared with China where pig meat consumption is significant Similarly the projected rise in per person consumption of starches in Indonesia mainly reflects higher consumption of cassava a culturally important food crop
For rural consumers total growth in consumption of meat dairy products fruit and vegetables is lower than for urban households This can be attributed to relatively lower rural incomes and a decline in the absolute size of the rural population Between 2009 and 2050 total rural beef consumption is projected to rise by 95 per cent to more than US$1 billion (in 2009 US dollars) dairy products by 75 per cent to US$05 billion fruit by 41 per cent to almost US$7 billion and vegetables by 42 per cent to almost US$5 billion (Figure 15)
20 40 60
Wheat
Sheep and goat meat
Dairy
Sugar
Oil crops
Rice
Vegetables
Starchy staples
Beef
Poultry
Fruit
Billion(2009 US$)
387
1724
1734
426
875
370
547
1349
Total food consumption
1761
91
173
50 100 150 200
Wheat
Sheep and goat meat
Dairy
Sugar
Oil crops
Rice
Vegetables
Starchy staples
Beef
Poultry
Fruit
2009 US$
145
819
824
165
391
137
226
630
Per person consumption
837
-4
38
26
Figure 15 Rural consumption of selected agricultural commodities Indonesia
Source ABARES model output
Between 2009 and 2050 rural per person consumption of each of the agrifood commodity groups is projected to change by a similar magnitude as urban consumption In value terms rural per person consumption of beef is projected to rise by 162 per cent dairy products by 135 per cent fruit by 90 per cent and vegetables by 92 per cent Similar increases are projected for rice (96 per cent) wheat (128 per cent) and starchy staples (116 per cent)
Again despite these significant increases rural per person consumption in Indonesia is projected to be lower than that of China in 2050 for all products except sugar which is projected to be 117 per cent higher For all other commodity groups rural per person consumption is projected to be lower than in China including sheep and goat meat (85 per cent lower) dairy (54 per cent) starches (32 per cent) cereals (56 per cent) and vegetables (86 per cent)
For both rural and urban consumers the rise in the real value of total food consumption in 2050 is principally the result of an increase in the quantity consumed rather than a projected significant rise in the real price This is especially pronounced in urban households For example between 2009 and 2050 beef consumption by urban households is projected to rise by more than 15 times and sheep and goat meat by 13 times In contrast rural beef consumption over this period is projected to rise by 64 per cent and sheep and goat meat by 44 per cent
Projected consumption growth of cereals and starchy staples between 2009 and 2050 is most pronounced in urban areas Rising urban consumption of these commodities is largely the result of population growth Urban consumption of wheat is projected to rise by 173 per cent to around US$2 billion (in 2009 US dollars) rice by 91 per cent to US$9 billion and starchy staples (which includes pulses potatoes yams and cassava) by 426 per cent to US$13 billion
Rural consumption of cereals and starchy staples is projected to rise despite a falling rural population As incomes rise towards 2050 the relatively affordable prices of these commodities will drive rural consumption Between 2009 and 2050 rural consumption of wheat is projected
2 4 6 8 10
Wheat
Sheep and goat meat
Dairy
Sugar
Oil crops
Rice
Vegetables
Starchy staples
Beef
Poultry
Fruit
Billion(2009 US$)
94
95
61
96
42
101
Total consumption
41
75
98
45
69
50 100 150 200
Wheat
Sheep and goat meat
Dairy
Sugar
Oil crops
Rice
Vegetables
Starchy staples
Beef
Poultry
Fruit
2050
2009
2009 US$
90
161
162
116
165
92
170
135
Per person consumption
166
96
128
27
to rise by 69 per cent to US$1 billion (in 2009 US dollars) rice by 45 per cent to almost US$9 billion and starchy staples by 61 per cent to US$3 billion
Production and trade The real value of Indonesias total agrifood production (which includes production for food feed and industrial use) is projected to more than double from US$81 billion in 2009 to US$173 billion in 2050 (in 2009 US dollars) This increase is driven by a higher value of production (in 2009 US dollars) of beef (up 209 per cent) poultry (187 per cent) starchy staples (115 per cent) vegetables (92 per cent) fruit (78 per cent) and rice and palm oil (up 77 per cent each) (Figure 16) The value of maize production divided almost equally between feed and food use is projected to increase by 78 per cent
Figure 16 Production of selected agricultural commodities Indonesia
Source ABARES model output
For some agricultural products such as rice and beef rising production partly reflects domestic policies that favour their production For example the real value of rice production between 2009 and 2050 is projected to rise by 77 per cent because of the assumption that producers continue to receive a minimum support price and input subsidies Indonesia is projected to switch from being an importer to an exporter of rice by 2050 The real value of Indonesias rice exports in 2050 is projected to be around US$09 billion (in 2009 US dollars)
The real value of Indonesias palm oil production is projected to rise significantly in line with strong export demand and Indonesias comparative advantage in its production Between 2009 and 2050 Indonesias production of palm oil is projected to rise by US$13 billion to US$30 billion an increase of 77 per cent Over this period palm oil exports are projected to rise by 40 per cent to US$18 billion
10 20 30 40
Sheep and goat meat
Dairy
Sugar
Palm oil
Rice
Vegetables
Starchy staples
Beef
Poultry
Fruit
2050
2009
Billion(2009 US$)
78
187
209
115
92
77
77
76
115
361
28
Imports For some agricultural commodities such as rice and palm oil the rise in consumption by 2050 is projected to be met largely by a rise in domestic production However for most agrifood commodities production is projected to increase at a slower rate than consumption As a result food and feed imports will be an increasingly important component of Indonesias food supply towards 2050 The real value of Indonesias total agrifood imports is projected to rise more than 20 times from 2009 to US$152 billion (in 2009 US dollar terms) in 2050
By 2050 Indonesia is projected to import a wide range of horticultural products Given rising domestic demand the real value of Indonesiarsquos fruit and vegetable imports is projected to rise to US$25 billion and US$11 billion in 2050 respectively (in 2009 US dollars Figure 17) On this basis the share of imports in total Indonesian fruit consumption will rise from 3 per cent in 2009 to 53 per cent in 2050 (Figure 18) For vegetables it will rise from 9 per cent in 2009 to 47 per cent in 2050
Figure 17 Trade of selected agricultural commodities Indonesia
Source ABARES model output
-30 -20 -10 0 10 20 30
Wheat
Sheep and goat meat
Dairy
Sugar
Rice
Beef
Starchy staples
Vegetables
Fruit
2050
2009
Billion (2009 US$)
Exports Imports
Palm oil
29
Figure 18 Import share of total consumption Indonesia
Source ABARES model output
Lower-income growth scenario The baseline projections for Indonesian agrifood consumption production and trade to 2050 are reliant on the underlying assumptions presented at the beginning of this chapter Chief among these are the OECD (2012a) assumptions for Indonesian GDP growth to 2050 presented in Chapter 2 (Table 1 and Table 7) If Indonesia were to realise a lower level of income growth agrifood demand growth would be expected to be lower The World Bank projects that Indonesian GDP growth in each decade to 2050 will be markedly lower than the OECDs projections (World Bank 2015 Table 7) This scenario examines the potential effect on Indonesian agrifood consumption and import demand if GDP and hence income growth were slower over the projection period as suggested by the World Bank All other variables from the reference scenario are held constant
Table 7 Indonesia GDP growth projections 2010 to 2050
Period Baseline 1991-2010
2011-2020 2021-30 2031-40 2041-50
OECD average annual growth ()
440 530 530 340 340
World Bank average annual growth ()
440 350 350 225 225
Source OECD 2012a World Bank 2015
Results In this scenario lower economic and income growth throughout the projection period results in GDP in 2050 that is 44 per cent lower than the reference case Because agrifood consumption is sensitive to changes in income the total value of agrifood consumption in 2050 (in 2009 US dollars) is 10 per cent less than in the reference case (Figure 19) Weaker economic growth most
Fruit Vegetables Starchy staples
Beef Poultry Sugar Maize Dairy Sheep and goat meat
Wheat
10
20
30
40
50
2050 Imports
2050 Domestic production
2009 imports
2009 Domestic production
53
3
4743
86
8183
1007091
9
75846723
6
100
Billion(2009 US$)
21
50
30
strongly affects urban areas where average annual income growth in the reference case was assumed to be more than double that of rural areas As a result demand for high-value products such as meat and dairy products declines significantly Many of these products are imported In 2050 the total projected value of beef consumption (in 2009 US dollars) is 17 per cent lower than in the reference case and poultry and milk products are each 14 per cent lower The real value of consumption for many domestically produced products such as starches and maize also declines but by no more than 10 per cent for any single commodity
Weaker consumption growth leads to lower import growth over the projection period particularly for high-value commodities The total value of imports in 2050 is 16 per cent lower in this scenario compared with the reference case with the import share of total consumption 5 percentage points lower than the reference case at 42 per cent (Figure 19) Beef imports are projected to be 20 per cent lower than the reference scenario sheep and goat meat 26 per cent lower and dairy products 16 per cent lower Fruit and vegetable imports are 12 per cent and 19 per cent lower respectively
Figure 19 Agrifood consumption in 2050 under lower income growth assumption
Source ABARES model output
0 100 200 300 400
Low income scenario
Baseline case
Domestic production
Imports
Billion(2009 US$)
4258
53 47
31
6 Conclusion Continued strong income and population growth combined with greater urbanisation are driving Indonesias increasing demand for not only more food but for a wider variety of foods This demand growth is projected to be met by increases in both domestic production and imports
Assuming no major changes to Indonesias existing agricultural policies to 2050 the real value of food consumption in Indonesia is projected to increase more than four times between 2009 and 2050 The increase will be characterised by a move towards more diverse diets with higher intake of meat dairy products fruit and vegetables Between 2009 and 2050 the real value of beef consumption is projected to rise more than 14 times dairy tenfold and fruit and vegetables to more than triple These projected increases are from a relatively low base and are driven by a rise in the quantities consumed rather than any significant projected rise in real prices To support this rise in demand imports of many agrifood commodities are projected to increase to 2050
The contribution of meat dairy products fruit and vegetables in Indonesian diets will increase more quickly than cereals and staples to 2050 While cereals and starchy staples will remain important components of Indonesian diets their relative contribution will declinemdashthe continuation of a trend that began around 1990
The upward trend in food demand is most pronounced among urban households whose income growth is assumed to be more than double that of rural households A declining rural population and relatively lower incomes will result in slower growth in food consumption compared with the urban population
For most agricultural commodities assuming no significant change to historical TFP growth for total agriculture production is projected to increase at a slower rate than consumption As a result food imports will be an important component of Indonesias food and feed supply towards 2050 The real value of Indonesias agrifood imports is projected to rise more than 20 times from 2009 to US$152 billion (in 2009 US dollar terms) in 2050
The projected significant increases in consumption and import demand for food in Indonesia are based on the assumption of relatively strong income growth to 2050 Under a lower growth scenario consumption of protein-based food products such as meat and dairy products is projected to be around 14 to 17 per cent lower than the reference case at 2050 While consumption of domestically produced products is also projected to be lower in 2050 in the lower-income-growth scenario the declines are less significant compared with the baseline case
While not included in the modelling in this report there is scope for increased production of non-food agricultural commodities and cash crops in Indonesia in which it has a comparative advantage These include natural rubber copra palm kernels coffee cocoa and spices Indonesias current policies on food self-sufficiency favour investment in food industries rather than the non-food and cash crops industries This has the effect of allocating resources away from their most efficient use
Because of their geographic proximity Australia and Indonesia are well placed to benefit from advancing bilateral agricultural trade Indonesia is an important market for Australian wheat sugar live cattle beef skim milk powder and horticultural products such as grapes and citrus
32
Stronger demand for these commodities and others in Indonesia will create further opportunities for Australian exporters
33
References ABARES 2013 Agricultural commodities September quarter 2013 Australian Bureau of Agricultural and Resource Economics and Sciences Canberra pp 85-87 available at agriculturegovauabarespublications
Afif S 2014 The Rising of Middle Class in Indonesia Opportunity and Challenge Paper presented at the International Policy Exchange Conference Segovia Spain 28 September available at umdcipeorgconferencesDecliningMiddleClassesSpainpapers_presentationshtml
Alexandratos N amp Bruinsma J 2012 World agriculture towards 20302050 the 2012 revision ESA Working paper no 12-03 Food and Agriculture Organization of the United Nations Rome available at faoorgeconomicesaesagen
Djajanegara A 1999 Local livestock feed resources in Livestock industries of Indonesia prior to the Asian financial crisis Food and Agriculture Organization of the United Nations Rome available at faoorgdocrep004AB986Eab986e06htmbm06 accessed 22 January 2015
Elias S amp Noone C 2011 The growth and development of the Indonesian economy Bulletin December Quarter Reserve Bank of Australia Sydney available at rbagovaupublicationsbulletin2011dec4html
FAO 2015 lsquoFAOSTATrsquo Food and Agriculture Organization of the United Nations Rome available at faostat3faoorghomeE accessed 26 October 2015
mdashmdash 2013 Indonesia Food and Agriculture Organization of the United Nations Rome available at faoorgdocrep005y4632ey4632e0lhtm
mdashmdash2012 GeoNetwork Food and Agriculture Organization of the United Nations Rome available at faoorggeonetworksrvenmainhome accessed 15 February 2014
mdashmdash 2005 Fertiliser use by crop in Indonesia Food and Agriculture Organization of the United Nations Rome available at faoorgdocrep008y7063ey7063e00htm
Fuglie K 2012 lsquoProductivity growth and technology capital in the global agricultural economyrsquo in Fuglie KO Wang SL amp Ball VE (eds) Productivity growth in agriculture an international perspective CAB International Oxfordshire UK
mdashmdash2010 lsquoSources of growth in Indonesian agriculture Journal of Productivity Analysis vol 33 no 3 pp 225-240
Fuglie K amp Rada N 2014 International Agricultural Productivity United States Department of Agriculture Economic Research Service Washington DC available at ersusdagovdata-productsinternational-agricultural-productivityaspxU089bfmSzkd
Global Business Guide Indonesia 2012 Agriculture in Indonesia available at gbgindonesiacomenagriculturesector_overviewphp
Glover J 2011 lsquoAn international retailerrsquos perspectiversquo Paper presented at The Crawford Fund 2011 Annual Parliamentary Conference Parliament House Canberra 14 August available at crawfordfundorgevents2011-parliamentary-conference
34
Hamshere P Sheng Y Moir B Syed F amp Gunning-Trant C 2014 What China wants Analysis of Chinas food demand to 2050 ABARES research report Canberra March available at agriculturegovauabarespublications
IMF 2015 World Economic Outlook Database available at imforgexternalpubsftweo201302weodataindexaspx accessed 26 October 2015
Indonesian Central Bureau of Statistics 2015a Poverty available at bpsgoidSubjekviewid23subjekViewTab3|accordion-daftar-subjek1 accessed 27 October 2015
mdashmdash2015b Consumption and expenditure available at bpsgoidSubjekviewid5subjekViewTab3|accordion-daftar-subjek1 accessed 27 October 2015
mdashmdash2015c Population 15 Years of Age and Over Who Worked by Main Industry 2004-2014 available at bpsgoidlinkTabelStatisviewid970 accessed 27 October 2015
mdashmdash2014 Consumption and expenditure available at bpsgoidSubjekviewid5subjekViewTab3|accordion-daftar-subjek1 accessed 20 February 2014
mdashmdash2011 Total income by Household Group (billion rupiahs) available at bpsgoidSubjekviewid5subjekViewTab3|accordion-daftar-subjek1 accessed 1 August 2014
Khajali F amp Slominski BA 2012 lsquoFactors that affect the nutritive value of canola meal for poultryrsquo Poultry Science vol 91 no 10 pp 2564ndash2575 available at psoxfordjournalsorgcontent91102564fullxref-ref-95-1
Linehan V Thorpe S Andrews N amp Beaini F 2012a Food demand to 2050 Opportunities for Australian agriculture paper presented at 2012 ABARES Outlook conference Canberra 6ndash7 March available at daffgovauabarespublications
mdashmdash 2012b Food demand to 2050 Opportunities for Australian agriculturemdashalgebraic description of agrifood model technical annex to ABARES Outlook conference paper Canberra May available at daffgovauabarespublications
Ludena C Hertel T Preckel P Foster K and Nin A 2007 Productivity growth and convergence in crop ruminant and nonruminant production measurement and forecasts Agricultural Economics 37 available at onlinelibrarywileycomdoi101111j1574-0862200700218xabstract
McKinsey Global Institute 2012 The archipelago economy Unleashing Indonesias potential September Jakarta available at mckinseycominsightsasia-pacificthe_archipelago_economyashx
OECD 2013 Global Food Security Challenges for the Food and Agricultural System Organisation for Economic Cooperation and Development Paris available at oecd-ilibraryorgagriculture-and-foodglobal-food-security_9789264195363-en
mdashmdash2012a Looking to 2060 A global vision of long-term growth Economics Department Policy Notes no 15 Organisation for Economic Cooperation and Development Paris November available at oecdorgecomonetarypolicy-noteshtm
35
mdashmdash2012b OECD Review of Agricultural Policies Indonesia 2012 Organisation for Economic Cooperation and Development Paris available at oecd-ilibraryorgagriculture-and-foodoecd-review-of-agricultural-policies-indonesia-2012_9789264179011-en
OECDndashFAO 2014 OECDndashFAO Agricultural Outlook 2014 Organisation for Economic Cooperation and Development Paris available at oecd-ilibraryorgagriculture-and-foodoecd-fao-agricultural-outlook-2014_agr_outlook-2014-en
Osorio C Abriningrum D Armas E amp Firdaus M 2011 Who is benefiting from fertilizer subsidies in Indonesia Policy Research Working Paper 5758 World Bank Washington DC available at elibraryworldbankorgdoipdf1015961813-9450-5758
Rabobank 2013 Indonesia - islands of opportunity Agriculture in Focus Rabobank Food amp Agribusiness Research and Advisory Australia and New Zealand Spring Sydney
Shahaf E 2009 Agriculture in Indonesia Asia Technology Consulting available at techasiaconsultingcomagriculture_in_indonesiahtml
Statistics Indonesia 2015 Gross Domestic Product at Current Market Prices By Industrial Origin (Billion Rupiahs) 2000-2014 available at bpsgoidlinkTabelStatisviewid1199 accessed 26 October 2015
Sudaryanto T 2014 Fertilizer subsidy policy in Indonesia impacts and future perspectives Food and Fertiliser Technology Center for the Asian and Pacific Region Asia-Pacific Information Platform on Agricultural Policy (AP) available at apfftcagnetorgap_dbphpid=365
The Canadian Trade Commissioner Service 2011 lsquoAn Investment Guide to Indonesia available at tradecommissionergccaengdocumentjspdid=133467toc38
United Nations Population Division 2015 World population prospects the 2015 revision United Nations New York available at esaunorgunpdwppindexhtm accessed 12 August 2015
mdashmdash2014 World urbanisation prospects the 2014 revision United Nations New York available at esaunorgunpdwup accessed 19 March 2015
USAID nd lsquoIndonesia ndash Property rights amp resource governancersquo USAID Country Profile available at usaidlandtenurenetindonesia
USDAndashFAS 2014 Indonesia grain and feed annual report 2014 GAIN Report no ID1407 1 April Foreign Agricultural Service United States Department of Agriculture Washington DC available at usdaindonesiaorgcat=10
Widarjono A 2012 Food and nutrient demand in Indonesia PhD thesis Oklahoma State University available at shareokorgbitstreamhandle112446547Department20of20Agricultural20Economics_48pdfsequence=1
World Bank 2015 Global Economic Prospects January 2015 Having fiscal space and using it World Bank Group Washington DC available at worldbankorgenpublicationglobal-economic-prospects
mdashmdash2014 World development indicators World Bank Washington DC available at dataworldbankorgdata-catalogworld-development-indicators
36
mdashmdash2013 Transport in Indonesia World Bank Washington DC available at goworldbankorgPF2AFG64V0
mdashmdash 2012a Raskin subsidised rice delivery Public expenditure review (PER) Social assistance program and public expenditure review no 3 World Bank Washington DC available at documentsworldbankorgcurateden20120215893857raskin-subsidized-rice-delivery
mdashmdash2012b Targeting poor and vulnerable households in Indonesia World Bank Washington DC available at documentsworldbankorgcurateden20120115879773targeting-poor-vulnerable-households-indonesia
mdashmdash2011 Indonesia Agriculture Public Expenditure Review 2010 World Bank Jakarta available at documentsworldbankorgcurateden20110919456223indonesia-agriculture-public-expenditure-review-2010
mdashmdash2010 Completing decentralization World Bank Jakarta available at documentsworldbankorgcurateden20100112012453completing-decentralization
mdashmdash2009 Investing in a more sustainable Indonesia Country Environmental Analysis Report No 50762-ID World Bank CEA Series East Asia and Pacific Region available at openknowledgeworldbankorgbitstreamhandle109863135507620v20Revis1ox0info10CEA1englishpdfsequence=1
mdashmdash2007 Horticultural producers and supermarket development in Indonesia World Bank Washington DC available at documentsworldbankorgcurateden2007068235822horticultural-producers-supermarket-development-indonesia
WTO 2013 Trade policy review Indonesia WTO Document WTTPRS278 World Trade Organisation Geneva available at wtoorgenglishtratop_etpr_etp378_ehtm
Yamauchi F 2014 Wage Growth Landholding and Mechanization in Agriculture Evidence from Indonesia World Bank Washington DC February available at openknowledgeworldbankorghandle1098617324
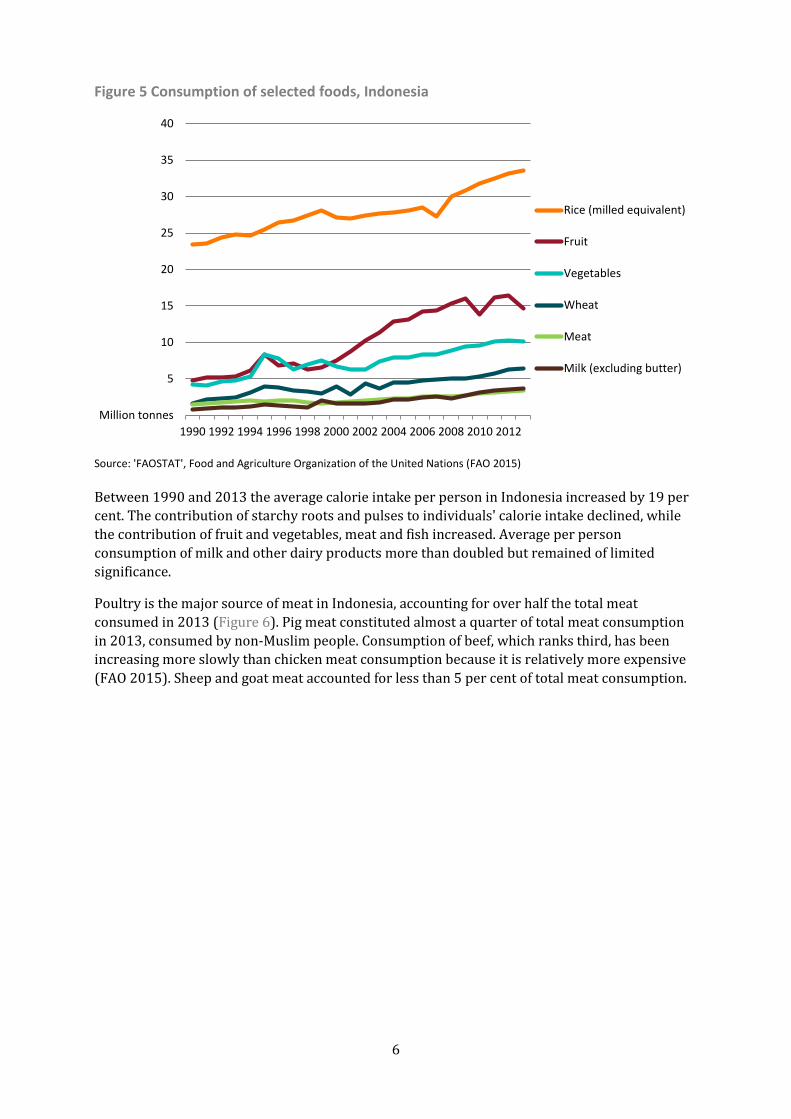
6
Figure 5 Consumption of selected foods Indonesia
Source FAOSTAT Food and Agriculture Organization of the United Nations (FAO 2015)
Between 1990 and 2013 the average calorie intake per person in Indonesia increased by 19 per cent The contribution of starchy roots and pulses to individuals calorie intake declined while the contribution of fruit and vegetables meat and fish increased Average per person consumption of milk and other dairy products more than doubled but remained of limited significance
Poultry is the major source of meat in Indonesia accounting for over half the total meat consumed in 2013 (Figure 6) Pig meat constituted almost a quarter of total meat consumption in 2013 consumed by non-Muslim people Consumption of beef which ranks third has been increasing more slowly than chicken meat consumption because it is relatively more expensive (FAO 2015) Sheep and goat meat accounted for less than 5 per cent of total meat consumption
Million tonnes
5
10
15
20
25
30
35
40
1990 1992 1994 1996 1998 2000 2002 2004 2006 2008 2010 2012
Rice (milled equivalent)
Fruit
Vegetables
Wheat
Meat
Milk (excluding butter)
7
Figure 6 Total consumption of meats Indonesia
Source FAOSTAT Food and Agriculture Organization of the United Nations (FAO 2015)
On a per person basis Indonesias consumption of many food groups is relatively low This is because a high portion of its population lives at or near the poverty line Per person consumption of meat in 2011 was between 70 per cent and 80 per cent less than that of Japan the Republic of Korea China and many other ASEAN nations (Table 2) For dairy it was around 80 per cent less than that of Japan 56 per cent less than China 47 per cent less than the Republic of Korea and lower than other ASEAN countries For fruit and vegetables it was between 30 per cent and 65 per cent less than that of Japan and the Republic of Korea 74 per cent less than China and lower than other ASEAN countries These relatively low per person consumption levels underline the potential for sizable increases in per person food consumption as incomes rise
Table 2 International comparison of annual per person food consumption 2011
Country Meats kg
Dairy kg
Fruit and vegetables kg
Cereals kg
Japan 488 713 1524 1044
Republic of Korea 622 264 2888 1515
China 577 315 4178 1515
Malaysia 533 322 1131 1466
Philippines 345 145 1796 1577
Vietnam 576 151 1445 1670
Indonesia 129 139 1075 1906 Source FAOSTAT Food and Agriculture Organization of the United Nations (FAO 2015)
Diets of urban residents are usually different from their rural counterparts In 2013 Indonesias urban residents spent an average of 414 000 rupiah a month on food compared with 299 000 rupiah by rural residents (Indonesian Central Bureau of Statistics 2015b) Urban residents spent more than rural residents on meat fish eggs fruit and prepared (cooked and packaged) foods Rural residents spent more on cereals and tubers (Figure 7) with 24 per cent of their food budget devoted to cereals alone compared with only 15 per cent for urban residents
000 tonnes
200
400
600
800
1000
1200
1400
1600
1800
2000
1990 1992 1994 1996 1998 2000 2002 2004 2006 2008 2010 2012
Poultry meat
Pig meat
Bovine meat
Sheep and goat meat
8
Figure 7 Expenditure on food items urban and rural residents 2013 Indonesia
Source Indonesian Central Bureau of Statistics 2015b
Food marketing in Indonesia is also changing In the 1980s supermarkets occupied only a small niche in food retailing By the mid-1990s they were still confined to the urban upper income sector Supermarkets only began to spread quickly in Indonesia after 1998 By 2007 they accounted for about 30 per cent of overall retail food expenditure (World Bank 2007)
The development of supermarkets is typically associated with closer vertical coordination along value chains as the supermarkets maintain close relationships with their suppliers This often involves contractual arrangements with farmers or in the case of food imports with suppliers in other countries Asian supermarket chains have developed direct relationships with suppliers of fresh horticultural and dairy produce in the United States New Zealand and Australia (Glover 2011)
000 rupiah
20
40
60
80
100
120
140
Cere
als
Tube
rs
Fish
Mea
t
Eggs
and
milk
Vege
tabl
es
Legu
mes
Frui
ts
Oil
and
fats
Beve
rage
s
Misc
food
item
sPr
epar
ed fo
odan
dhellip
Urban
Rural
9
3 Production constraints in Indonesian agriculture
The agriculture sector is a key component of the Indonesian economy contributing about 14 per cent of Indonesias GDP in 2014 (Statistics Indonesia 2015) Thirty per cent of Indonesias land area is used for agricultural purposes and the sector employs 41 million people or 35 per cent of the nations work force The sector is a strong contributor to Indonesias trade with agricultural exports accounting for 24 per cent of the value of total merchandise exports in 2012 (World Bank 2014)
Indonesias agriculture is generally characterised by fertile volcanic soils and abundant renewable water resources High population density has resulted in a sector dominated by smallholdings Agricultural land area per person in Indonesia is low at just 022 hectares This is equivalent to a third of the world average (World Bank 2014) Challenges to agricultural production and productivity growth include the availability and quality of natural resources insecure land tenure underemployment of labour and lack of infrastructure
Resource constraints Land availability Indonesia is the worlds largest nation archipelago made up of 17 508 islands of which just over a third are inhabited Java is the most densely populated island accommodating more than half of Indonesias population (57 per cent in 2013) on only 7 per cent of the total land area (Map 1)
Map 1 Map of Indonesia
Source GeoNetwork Food and Agriculture Organization of the United Nations (FAO 2012)
About 30 per cent of Indonesias land area (545 000 square kilometres) is classified as agricultural land (World Bank 2014) Of this 43 per cent or 235 000 square kilometres is considered arable that is land under annual crops or any fallow or pasture land used for annual crops within any five-year period The remaining agricultural land is either devoted to plantation crops (such as oil palm coconut rubber coffee and sugar cane) or permanent pasture (natural or seeded grassland that remains unploughed for many years)
10
The islands of Java Bali and large parts of Sumatra are home to irrigated lowland rice-paddy terraces and upland rain fed farming The average size of farms producing rice and other food crops such as maize peanuts and cassava ranges from 03 hectares on Java to 14 hectares elsewhere (OECD 2013) Java produces around half of Indonesias rice Expansion of the lowland rice area in Java is limited because of increasing competition for land with other crops and non-agricultural uses such as industry uses housing and roads (FAO 2005)
The plantation and industrial crops sector dominated by oil palm coconut and natural rubber makes up 15 per cent of total crop area Large private and state-owned farms are involved in these perennial cropsmdashmainly in Kalimantan and Sumatra and mainly for producing oil palm and natural rubbermdashbut there are also many smallholders The average farm size in this sector is 2 600 hectares (OECD 2013)
Until 2010 growth in agricultural production relied largely on converting forested areas into agricultural land particularly to oil palm plantations In the past two decades millions of hectares were cleared for this purpose Just over half of Indonesias total land was classified as forest area in 2011 compared with 65 per cent in 1990 (Figure 8) Driving this trend has been the growing global demand for edible oils and the price competitiveness of palm oil relative to alternatives such as soybean oil (Rabobank 2013) Much of the deforestation is concentrated in Sumatra and Kalimantan
Figure 8 Land use in Indonesia
Note Share of total land area Source World Development indicators World Bank Group (World Bank 2014)
Many less populated islands remain densely forested and are home to forest and coastal communities that sustain themselves through agriculture hunting foraging and fishing (USAID nd) Indonesias Ministry of Forestry estimates of bush shrub grass and barren land across Indonesia total 22 million hectaresmdasharound half of which is located in Kalimantan and Papua McKinsey Global Institute (2012) estimates almost 7 million hectares of this land (much of which used to be in agricultural production but has since been abandoned) could be developed for agricultural production Alexandratos and Bruinsma (2012) project that between 2009 and 2050 total arable land in Indonesia will increase by 75 per centmdashan assumption used in the modelling in this report
20
40
60
80
100
1990 1993 1996 1999 2002 2005 2008 2011
Other
Agriculture
Forest area
11
Land degradation Indonesia is regularly described as being a highly fertile country but land quality varies across the archipelago The central islands have more fertile soils and hence are densely populated Agricultural land in Java in particular has benefited from high levels of mineral fertiliser application soil and water erosion control programmes and relatively good soil (FAO 2005) In contrast the soils of the outer less populated islands are characterised by highly weathered acidic soils that require higher fertiliser inputs to achieve the high crop yields obtained in Java and the other central islands Actual fertiliser use in the outer islands is generally lower than on Java resulting in soil nutrient depletion in the upland crop areas (FAO 2005)
Erosion and associated problems of nutrient depletion are minimal on Java because of the system of flat terracing and well-maintained irrigation schemes However in the lower-potential rain fed uplands where crops such as maize and cassava are produced on sloping hillsides erosion problems and nutrient depletion are more prevalent Where deforestation has occurred to make way for plantation crops loss of forest cover has led to watershed degradation silting of waterways flooding soil erosion and decline in soil quality and soil productivity (World Bank 2009)
Land tenure Land parcels in Indonesia are highly fragmented particularly on smallholder farms As land is passed down the generations it tends to become divided into smaller parcels (McKinsey Global Institute 2013) While the law requires that all land rights be registered most of these inherited parcels are unregistered less than 25 per cent of rural land parcel holders have been registered in the 40 years since land registration began (OECD 2012b) Additionally a large share of land off Java is communal rather than privately titled Land rights of these communities are often not formally recognised increasing the risk of conflict
The implications of the land tenure arrangements are that for large investors gaining access to land is a long and unclear process As a result only limited land rights are granted which compromises the extent to which production can increase (OECD 2012b) For smallholders unclear land tenure or nonexistence of certificated land registration compounds the difficulties of gaining access to credit from financial institutions This discourages investment in productivity-enhancing technology and biases farmers choices away from longer-term activities such as tree crops (World Bank 2010)
Fertiliser use The Indonesian Government maintains a ceiling price on fertiliser which depending on fertiliser type is between 50 per cent and 75 per cent lower than the market price (Sudaryanto 2014) Lower fertiliser prices are intended to encourage increased crop production particularly of rice The government provides a subsidy to fertiliser manufacturers to compensate them for selling fertiliser below market prices Despite the subsidy payment the incentives for fertiliser manufacturers to increase production and compete with one another are limited by government regulation of production quantities prices and locations where fertiliser can be sold (Osorio et al 2011)
The use of fertiliser is unevenly distributed across the archipelago Among food crops the highest application rates per hectare are for rice followed by maize and soybeans The lowest are for peanut and cassava The subsidy and resulting increase in fertiliser use led to more than a doubling of rice production between 1970 and 2000 Over that period total annual fertiliser
12
use increased from 635 000 tonnes to 59 million tonnes more than half of which was used to increase rice production (FAO 2005)
Fertilisers remain underused on plantation crops Large areas of plantation crops are owned and managed by smallholder farmers For many the lack of knowledge about appropriate fertilisation technology and the lack of reliable and timely access to the right fertilisers at village level lead to inadequate and unbalanced application (FAO 2005)
Apart from the budgetary burden subsidising domestic fertiliser prices results in inefficient fertiliser use at the farm level Studies in West Java report rice farmers applying levels of fertilisers higher than the recommended rates with some soil tests showing nutrient reserves had built up to high levels negatively affecting yields (FAO 2005 Osorio et al 2011)
Farm labour and mechanisation Indonesian agriculture is dominated by abundant labour in relation to available agricultural land contributing to the issue of small-scale production The agriculture forestry and fishing sector employs around 40 million people or 35 per cent of the workforce (15 years and over) and is the main source of employment in rural areas (Indonesian Central Bureau of Statistics 2015c McKinsey 2012) The proportion of landless and land-poor agricultural households is especially high on Java Of more than 17 million households on Java characterised as farmer or agricultural labourer households 39 per cent neither lease nor own any crop land and another 44 per cent lease or own less than 05 hectares (USAID nd)
Tradition is one obstacle to agricultural development in Indonesia (Shahaf 2009) In many cases farmers grow the same crops as previous generations using the same such methods and tools Sometimes two or three generations work the same farm
Traditionally particularly in Java harvesting is undertaken primarily by manual labour (Yamauchi 2014) Machines are rarely used However outside Java the emergence of larger scale farmers had led to operations scaling up through mechanisation This has contributed to a rise in farm labour productivity since 2000 (Figure 9)
Figure 9 Agriculture value added per farm worker Indonesia
Source World Development indicators World Bank Group (World Bank 2014)
Currently tractors are used for land preparation activities such as primary and secondary tillage while seeding and planting activities continue to be done manually Threshers are used in more developed areas where agricultural labour has become scarce as a result of competitive wages in other industries
2005 US$
200
400
600
800
1 000
1 200
1980 1984 1988 1992 1996 2000 2004 2008 2012
13
Wage growth in recent years may have led to the introduction of labour saving practices among relatively large farmers such as renting more land and acquiring machinery (Yamauchi 2014) In contrast small farmers have not significantly changed their behaviours
Infrastructure As the worlds largest archipelago Indonesias insufficient and poor quality infrastructure is a major challenge for connectivity between the islands High transport costs also undermine the competitiveness of agricultural industries and associated supply chains (Rabobank 2013 OECD 2012b) With most transport developments concentrated in Java access to markets for the rest of Indonesia is poor
Ninety per cent of freight and 80 per cent of passenger traffic in Indonesia moves by road However roads are heavily congested and their quality in urban and provincial areas is poor (The Canadian Trade Commissioner Service 2011) Because connectivity with markets is compromised by an inadequate road system returns to agricultural producers are often discounted because of spoilage incurred during transport (Global Business Guide Indonesia 2012)
Indonesia has around 300 ports spread throughout the archipelago Inter-island shipping consisting of ferry and cargo shipping services accounts for around 60 per cent of total seaborne cargo in the country (World Bank 2013) Seaports in Indonesia are outdated and investment in port facilities has not matched the rapid growth of traffic moving through them As a result inefficiencies in the shipping system such as bottlenecks and delays in cargo handling are common Vessels also often leave the main port Tanjung Priok before they are fully loaded to keep to published schedules (The Canadian Trade Commissioner Service 2011)
Current infrastructure does not support internal trade well and challenges Indonesiarsquos ability to provide its own food to its own people Developing an efficient transport and logistics system would not only increase the competitiveness of Indonesias external trade but would also provide easier and cheaper access for local agricultural products to domestic markets with reduced losses through spoilage Until this is achieved Indonesian supply chains will continue to be uncompetitive inefficient and looking to other markets to satisfy agrifood demand particularly in urban centres
Water availability While Indonesias water supplies may be sufficient for current agricultural production deterioration of the existing irrigation infrastructure and investment constraints to improve or develop new infrastructure may limit Indonesias future water availability given rapid urbanisation and food demands
Growing municipal water needs and the needs of the agriculture sector to increase production to meet the demands of urban consumers is likely to result in water shortages in coming decades The McKinsey Global Institute projects that by 2030 water supplies will fall short of demand by around 18 per cent (McKinsey 2012) Significant investment is required to improve water productivity and reduce water transmission losses through rehabilitating old and damaged irrigation infrastructure Up to half of Indonesias piped water supply is estimated to be lost in transmission (McKinsey 2012)
Feed availability Increasing demand for meat protein has stimulated the establishment of large scale commercial poultry farms and beef cattle feedlots Data from the Indonesian Feed Millers Association show
14
the poultry industry consumes 83 per cent of Indonesias animal feed the aquaculture industry consumes 11 per cent and cattle and pig industries the remaining 6 per cent (USDAndashFAS 2014)
On average Indonesias livestock feed is composed of maize (50 per cent) soybean meal (15 to 20 per cent) rice bran (15 per cent) wheat pollard (8 per cent) fish meal (5 per cent) maize gluten meal (3 per cent) and crude palm oil (2 per cent) (USDAndashFAS 2014) While most maize is sourced domestically inconsistent seasonal supplies and storage challenges such as high moisture content and aflatoxin levels are major factors that are leading feed millers to import increasing quantities of maize Canola meal is being used increasingly in poultry diets as a cost competitive alternative to soybean meal However its use is restricted to less than full replacement of soybean meal because of canolarsquos lower energy and protein content and the presence of antinutritional factors such as lower amino acid digestibility than in soybean meal (Khajali and Slominski 2012) Apart from maize and agri-industrial by-products such as rice bran copra meal and palm kernel meal other feed ingredients are largely imported (Table 3)
In food crop producing areas fibrous agricultural residues have become the main feed source for ruminant animals raised by small scale livestock producers Rice straw is fed as a base roughage but additional good quality feedstuff or concentratesmdashsuch as leaves and stalks of cassava leaves of maize and sugarcane leaves stems and peelings of banana rice bran pods and peelings of cacao and the fronds pressed fibre and palm kernel cake from oil palmmdashare required to gain higher production performance (Djajanegara 1999) Such feeds are available in various locations but their unequal distribution and high prices at the farm level limit their use by smallholder farmers Lack of storage and labour shortages during harvest time also restrict the collection of rice straw These limitations as well as the seasonal nature of these feedstuffs affect continuity of supply and therefore the productivity potential of smallholder livestock producers
Table 3 Indonesian animal feed sources of primary ingredients
Feed ingredient Local share () Imported share ()
Maize 90ndash95 5ndash10
Fish meal 5ndash10 90ndash95
Meat and bone meal (MBM) 0 100
Soybean meal 0 100
Rapeseed meal 0 100
Maize gluten meal 0 100
Feed additive 0 100
Rice bran 100 0
Copra meal 100 0
Palm kernel meal 100 0
Crude palm oil (CPO) 100 0 Source Indonesia grain and feed annual report 2014 United States Department of Agriculture (USDAndashFAS 2014)
Productivity There has been significant growth in the volume of total agricultural output in Indonesia over the past 50 years although the rate of growth has varied markedly over the decades The contribution of increased total factor productivity (TFP) to total agricultural output growth (including food crops and non-food cash crops) was strong during the 1960s and 1970s as new
15
technologies and improved crop varieties were widely adopted during the green revolution (Table 4) (Fuglie 2010 2012) In the 1980s land and labour use expanded enabling total agricultural output to grow but TFP growth slowed During the 1990s average agricultural output growth declined to less than 2 per cent a year as the green revolution crop varieties had already been widely adopted and no newer higher yielding varieties were suitable or available However TFP growth was stronger than the previous decade
Table 4 Average annual food and non-food agricultural output and total factor productivity growth Indonesia
Years Agricultural output Agricultural TFP
1961ndash1970 271 175
1971ndash1980 334 140
1981ndash1990 464 059
1991ndash2000 187 099
2001ndash2009 486 368 Note Agricultural output measured in volume Source Fuglie 2012
Between 2001 and 2009 strong output and TFP growth resumed for a number of reasons Newly available crop land achieved by the clearing of forested areas supported the expansion and diversification of agriculture into higher value non-staple commodities such as tropical perennials horticulture and livestock At the same time the relatively low price of fertilisers and chemicals available to producers led to a 50 per cent increase in their use between 2002 and 2009 (Figure 10) resulting in a marked improvement in crop yields compared with the previous decade (OECDndashFAO 2014) Improved literacy and education of the farm labour force also contributed to productivity growth (OECD 2012b)
Figure 10 Total fertilizer use in Indonesia by type
Note 2001 data not available Source FAOSTAT Food and Agriculture Organization of the United Nations (FAO 2015)
TFP estimates do not exist for the period since 2010 While yield growth is not as robust a measure of technical change as TFP yield trends can provide a partial indication of changes in productivity Average annual yield growth between 2011 and 2013 was lower than in the
Mt
1
2
3
2002 2003 2004 2005 2006 2007 2008 2009
Nitrogen
Potash
Phosphate
16
periods 2001ndash05 and 2006ndash10 across a range of food and non-food crops (Table 5) A number of factors explain this slowdown The rate of conversion of forest land to cropping slowed significantly reducing the rate of agricultural output growth achieved through additional agricultural land (OECD 2012b) In addition the sustained overuse of fertilizers and chemicals throughout the 2000s has led to decreasing returns to scale for these intermediate inputs As a result any future increase in the productivity of food and non-food crops is unlikely to be achieved through the application of chemicals or fertilisers
Table 5 Average annual yield growth of food and non-food cash crops Indonesia
Commodity Unit 1991-95 1996-00 2001-05 2006-10 2011-13
Food crops
Rice 02 03 08 19 09
Maize 12 42 46 52 30
Cassava -06 15 50 49 36
Mung beans -03 -67 44 23 -02
Soybeans 04 17 11 11 12
Groundnuts -34 58 15 16 02
Vegetables a 93 -08 35 -17 -68
Cash crops
Rubber na -01 45 58 48
Crude palm oil na -72 108 -06 12
Palm kernel na -104 120 08 -10
Cocoa na 05 143 21 -30
Coffee na 24 14 62 37
Tea na 02 30 -05 -11 a Vegetable data available to 2012 Source FAOSTAT Food and Agriculture Organization of the United Nations (FAO 2015)
With reduced scope for expansion in agricultural production through both conversion of forest land and increased use of fertilisers and chemicals future agricultural productivity growth is likely to be achieved through the more efficient use of inputs The dominance of smallholdings remains a constraint to achieving higher agricultural productivity growth in future as small plots impede the implementation of more productive practices This is compounded by inefficient fertiliser use limited mechanisation and an inadequate supply of other important inputs such as high-yielding seeds irrigation systems extension services and access to credit Addressing these issues will be key to future productivity trends
17
4 Indonesian agricultural and food policies
The objectives of Indonesias agricultural policy as stated by the Indonesian Ministry of Agriculture in 2010 are to
1) achieve food self-sufficiency
2) enhance diversification of production and consumption
3) raise the competitiveness and value added of production and
4) increase farmersrsquo welfare (OECD 2012b)
To achieve its objectives the Indonesian Government intervenes in the farm sector with multiple policy instruments The government also implements policies to protect consumers from fluctuations in prices of key food products such as wheat rice and vegetable oils and to insulate domestic producers from foreign competition Food for consumers is subsidised which effectively maintains the price of food within a narrow price band Producers benefit from tariffs applied to imported food which keep the price of domestically produced food competitive with imports Additionally producers are directly supported by government food purchases at guaranteed prices and subsidies on farm inputs such as fertiliser seed and farm equipment
Policies to support agricultural production Reference prices and import restrictions The Indonesian Government sets reference prices for rice sugar and beef which it aims to maintain through various policy instruments
On average around 70 per cent of domestic rice production is consumed within the farming household (OECD 2012b) The remainder is sold through either private or government-run channels such as Indonesias National Food Logistics Agency known as Badan Ursan Logistik (BULOG) BULOG purchases a limited amount of rice at the reference price to fulfil two objectives
1) stockholding for emergency purposes and
2) redistribution as part of the consumer subsidy programme Raskin (discussed below) (OECD 2012b)
In 2010 BULOG procured around 6 per cent of total domestic rice production equivalent to around 20 per cent of all marketed rice (OECD 2012b)
For sugar the government supports the producer price by imposing legal requirements on domestic sugar millers who control the domestic sugar market Sugar millers are required to purchase 75 per cent of their sugar cane requirements from domestic sugar cane growers and to pay growers a government-determined price
The Indonesian rice and sugar industries are also protected by import restrictions Companies that import rice and sugar are required to support the domestic industry by buying domestically produced product if the mill price falls below the reference price
18
For beef and live cattle imports the Indonesian Government sets a reference price which it aims to achieve by managing import volumes through an import permit system Since 2014 the reference price has been 76 000 rupiah (A$720) a kilogram Under the system import permits are not issued if domestic beef prices fall below the reference price (ABARES 2013) Weight restrictions on cattle imports also usually apply limiting imports to young lighter cattle destined for feedlots
The Indonesian Government also restricts imports of other commodities such as soybeans maize horticulture certain processed foods and animals and animal products (including fresh chilled and frozen meat and eggs) Importing these commodities is generally not permitted if the Ministry of Trade considers it will cause injury to the domestic industry (WTO 2013) Companies seeking to import these commodities are required to gain approval from the Indonesian Ministry of Trade (OECD 2012b)
Tariffs Tariffs are applied to most imported food products in Indonesia However they are relatively low and are not a major policy instrument used to protect domestic industries The average applied agricultural tariff was 53 per cent in 2010 (OECD 2012b) Around 85 per cent of agricultural imports are subject to tariffs between zero and 5 per cent with almost 66 per cent entering duty free All agricultural tariffs are ad valorem except for rice and sugar which have specific tariffs (OECD 2012b)
While applied tariffs are low bound tariff rates or the ceiling rate that can be applied under World Trade Organisation rules remain high (Figure 11) On average the bound rate on agricultural products is 47 per cent (OECD 2012b) The highest bound tariff is 210 per cent for milk powders although the applied rate is just 5 per cent Rice has a bound tariff of 160 per cent and an applied specific rate of 450 rupiah a kilogram (equivalent to an ad valorem tariff of 10 per cent when using the average export price for 15 per cent broken rice from Thailand in 2010) (OECD 2012b)
Figure 11 Average bound and applied tariffs by product groups
Source OECD Review of Agricultural Policies Indonesia 2012 Organisation for Economic Co-operation and Development (OECD 2012b)
0
20
40
60
80
Fruit and vegetables
Sugars and confectionery
Cereals Dairy products
Animals and animal
products
Oilseeds fats and oils
Average bound tariff
Average applied tariff
19
Input subsidies The Indonesian Government supports farmers by subsiding inputs such as fertiliser seeds and ad hoc products including power tools and rice milling units Fertiliser support is the largest component of budgetary support for agriculture accounting for 37 per cent in 2008ndash09 (OECD 2012b) Not all farmers receive input subsidies because eligibility requirements apply in many cases For example subsidised fertiliser is only available to farmers producing on less than 2 hectares
Policies to support consumers Price intervention The Indonesian Government intervenes in the domestic market for wheat flour maize and cooking oil when it considers retail prices too high for the poor It does this using a broad range of measures from simply asking manufacturers and wholesalers to be socially responsible with their pricing to purchasing these products and distributing them directly to poor households (OECD 2012b) Another policy often used is the government covered value tax under which the government waives the existing 10 per cent value added tax on the final price of certain food items For example the government has used this policy to reduce the price of non-branded cooking oil since 2007 In 2010 this policy cost the Indonesian Government around 250 billion rupiah (A$299 million)
Food subsidies The Indonesian Government operates a targeted rice subsidy programme known as Raskin to combat food insecurity The programmes objective is to make available a set quantity of rice (procured by BULOG) at a subsidised price to Indonesias poorest households on a monthly basis Raskins intention is to provide rice to those on official lists of households living under or near the national poverty line (World Bank 2012b) The poverty line in 2014 was around 318 500 rupiah per person a month in urban areas and 286 100 rupiah per person a month in rural areas (Indonesian Central Bureau of Statistics 2015a) Those with incomes within 20 per cent of the poverty line are defined as being near the poverty line (World Bank 2012b)
Despite the objectives of Raskin to target the most vulnerable since allocations of Raskin rice to households are decided by local authorities poor and non-poor households alike benefit from the programme In 2010 around 175 million households received Raskin rice (OECD 2012b) at a cost of around 14 trillion rupiah (A$17 billion) to the Indonesian Government (Figure 12) Between 2005 and 2010 the subsidised price was 1 600 rupiah (A$019) a kilogram representing about 20 to 25 per cent of the average market price (World Bank 2012a)
The quantity of rice per household the subsidised price the number of months a year that rice is distributed and the classification of the poorest households have all been altered over the period of the programme For example monthly allocations per household have been set as low as 10 kilograms and as high as 20 kilograms over the programme period although households rarely benefit from the full amount of the allocation (OECD 2012b World Bank 2012a)
20
Figure 12 Raskin rice distribution and budgetary cost
Source OECD Review of Agricultural Policies Indonesia 2012 Organisation for Economic Co-operation and Development (OECD 2012b)
Implications of agricultural and food policies Public expenditure on Indonesian agriculture has increased under its current policy settings In 2009 public spending was around 615 trillion rupiah (A$75 billion) This was equivalent to 56 per cent of total government expenditure compared with 27 per cent in 2001 (World Bank 2011) The fertiliser subsidy and Raskin have been the biggest drivers of increased spending over this period
In addition to the direct budget cost of Indonesias agricultural and food policies there have also been allocative effects Indonesian policies tend to focus on rice maize and sugar leading to increased production of these commodities and improved availability from domestic sources However expansion of these crops has come at the expense of horticulture and other commodities in which Indonesia has a comparative advantage such as natural rubber cocoa and spices (World Bank 2011)
The administration of some support programmes the fertiliser subsidy in particular is inefficient (Sudaryanto 2014) As discussed in Chapter 3 subsidising fertiliser companies in an environment where quantities prices and distribution channels are regulated reduces incentives for these companies to effectively compete This inefficiency has resulted in the under-production of fertiliser leading to shortages At the same time the artificially low price has led to an over-reliance on fertiliser by producers to increase yield rather than using other methods such as improved seeds (World Bank 2011)
4000
8000
12000
16000
2000 2002 2004 2006 2008 20100
1
2
3
4
Expenditure on RASKIN
Quantity of rice distributed (right axis)
Million tonnes
Billionrupiah
21
5 Simulation results Baseline assumptions The objective in this analysis is to identify and quantify projected changes in Indonesian demand for a range of agrifood commodities over the longer term across urban and rural households An updated version of the ABARES agrifood model (Linehan et al 2012a) is used to investigate these potential trends The model has been modified to include Indonesias consumer subsidy policy (Raskin) and a re-aggregation of some country and commodity groups to allow more detailed analysis
Indonesia has a comparative advantage in the production of many cash crops and non-food agricultural commodities that are not included in the ABARES agrifood model such as natural rubber copra palm kernels coffee cocoa and spices (FAO 2013) In Indonesia the production of these commodities competes with food commodities for resources despite a policy environment targeted at food production and food self-sufficiency
Given Indonesias limited supply of arable land and the quality and availability of its water supply the capacity of the domestic agricultural sector to meet the growing demand for food in Indonesia will depend heavily on improvements in productivity Total factor productivity (TFP) growth in Indonesian agriculture is estimated to have averaged 154 per cent a year since 1961 It is expected that yield growth in Indonesia will not decline from this average annual rate in the future because the potential for productivity growth remains significant However nor is it expected to continue at the relatively high rates estimated for the period 2001 to 2009 which were made possible from the expansion of agriculture into higher-value non-staple commodities on newly deforested land and a significant increase in the use of chemical fertilisers (see Chapter 4)
Productivity growth since 2010 is estimated to have slowed from the decade 2001ndash2009 The Indonesian Governments policy initiative Reducing Emissions from Deforestation and Forest Degradation (REDD) in 2010 and declaration of a two-year Forest Moratorium in 2011 have slowed the rate of forest conversion to crop land (OECD 2012b) In addition agricultural production continues to be constrained by the issues outlined in Chapter 4 (including decreasing returns to scale for chemical inputs lack of widespread mechanisation and deteriorating resource base) With ongoing competition between the production of food crops and non-food cash crops (in which Indonesia has a comparative advantage) and little prospects in the foreseeable future for major policy changes on food consumption and production TFP growth for food crops in Indonesia is assumed to average 154 per cent a year between 2009 and 2050 This is close to the forecast by Ludena et al (2007) of 152 per cent a year to 2040 (FAO 2013 USDAndashFAS 2014)
Growth rates for TFP for individual commodities have in the past shown similar patterns to growth in yields Assumptions of TFP growth rates for individual commodities are therefore derived by apportioning the assumed rate for the whole of agriculture by historical growth in the yields of each commodity (Table 6)
22
Table 6 Average annual TFP growth rate by industry in Indonesia 2009 to 2050
Industry
Rice 214
Maize 337
Coarse grains 335
Other cereals 239
Oilseeds 388
Vegetables 232
Fruit 303
Beef 032
Sheep and goat meat 144
Poultry 144
Eggs 135
Dairy 215
All Agriculture 154 Source ABARES model assumption
In the reference case no change to Indonesias market support policies is assumed over the projection period On the production side these include the principal forms of market support of state trading input subsidies and import restrictions Additionally the Indonesian Governments minimum support prices for rice and wheat are maintained in real terms as are other ad hoc interventions on a range of agricultural commodities
The government support received by consumers through the consumer subsidy policy Raskin is also maintained in real terms over the projection period (discussed in Chapter 4)
The baseline projections determined in the agrifood model for Indonesia are also dependent on a set of assumptions discussed in Chapters 2 and 3 To summarise
bull population growth is assumed to average 07 per cent a year between 2010 and 2050
bull the proportion of the population in urban areas is assumed to increase from 50 per cent in 2009 to 72 per cent by 2050
bull average annual GDP growth in Indonesia is assumed to average 53 per cent a year between 2010 and 2030 before weakening between 2030 and 2050 to average 34 per cent a year (Table 1)
bull average annual income growth is assumed to be 56 per cent a year in urban areas and 21 per cent a year in rural areas
agricultural productivity in Indonesia is assumed to continue to increase according to the growth estimates provided in Table 6
The population is divided into two income stratamdashurban income and rural income households Across these two household types the income growth assumptions to 2050 for urban and rural areas are based on historical income data from the Indonesian Central Bureau of Statistics (2011) These data demonstrate that not only is average urban income higher than average rural income but with urbanisation average income growth in urban areas has also been higher than
23
in rural areas This has been the result of a relatively faster rate of economic development and higher wages which have stemmed from the growth in the manufacturing and services sectors prevalent in urban areas The model assumes this trend in income growth will continue to 2050 Indonesian household food consumption data in the base year of the model are from the Indonesian Central Bureau of Statistics (2014) and Widarjono (2012) These data were used as the basis in the model to project food consumption across urban and rural households to 2050
In the model total and per person Indonesian food consumption and total urban and rural food consumption is apparent consumption which reflects the total use of agrifood products (food feed and industrial use) In contrast per person urban and rural consumption is direct food consumption only it excludes feed use and industrial use of agrifood products to better reflect changes in diets
Consumption The real value of total food consumption in Indonesia (including food feed and industrial use) is projected to quadruple between 2009 and 2050 to US$327 billion (in 2009 US dollars) The largest increases are for meat dairy products fruit and vegetables as real incomes increase (Figure 13) Together these commodities account for two-thirds of the projected rise in the real value of food consumption
Figure 13 Consumption of selected agricultural commodities Indonesia
Note Starchy staples include pulses yams potatoes and cassava Source ABARES model output
Between 2009 and 2050 the real value of Indonesian beef consumption is projected to rise more than 14 times to US$35 billion (in 2009 US dollars) dairy products ten times to almost US$9 billion and fruit and vegetables more than three times to US$50 billion and US$25 billion respectively For many commodities the value of consumption in 2050 is projected to rise from a very low base reflecting high poverty rates and a large rural population in 2009 By 2050 72 per cent of the population is projected to live in urban centres with higher incomes than the
10 20 30 40 50 60
Wheat
Sheep and goat meat
Dairy
Sugar
Oil crops
Rice
Vegetables
Starchy staples
Beef
Poultry
Fruit
2050
2009
Billion(2009 US$)
552
66
231
1311
269
1319
256
246
935
1340
113
24
rural cohort It is this expected transition of the population and income growth that drive the magnitude of projected consumption growth for many commodities Despite these large increases Indonesias per person food consumption in 2050 is projected to remain below that of China for many commodities (Hamshere et al 2014)
For cereals oil crops and starchy staples (pulses potatoes yams and cassava) consumption is also projected to increase Between 2009 and 2050 the real value of rice consumption is projected to rise by 66 per cent to nearly US$23 billion (in 2009 US dollars) maize by 182 per cent to US$8 billion oil crops by 246 per cent to US$22 billion and starchy staples by 256 per cent to almost US$29 billion Over this period the real value of sugar consumption is projected to rise more than six times to US$14 billion (in 2009 US dollars)
The projected rise in consumption of cereals oil crops and starchy staples is driven by a number of factors First cereals and starchy staples (such as cassava) are relatively affordable foods particularly for low and middle income consumers whose populations are projected to rise Although both cereals and starchy staples will remain important components of Indonesian diets to 2050 their relative contribution will decline as diets become more diversified with greater amounts of meats dairy products and fruit and vegetablesmdashthe continuation of a trend that began around 1990 (Figure 5)
The projected rise in consumption of cereals oil crops and starchy staples is also driven by feed requirements which will increase as the demand for meat protein rises to 2050 As discussed in Chapter 3 about 50 per cent of domestic maize production is used as feed Rice bran also comprises about 15 per cent of total Indonesian feed consumption Soybean meal comprises between 15 per cent and 20 per cent of total livestock feed all of which is imported Rapeseed meal can be used as a partial substitute for soybeans and it too is entirely imported In 2050 it is projected that feed use will account for around 42 per cent of total maize consumption 43 per cent of total oil crop consumption and 44 per cent of total starchy staple consumption a larger proportion of which will need to be imported compared with 2009
Urban and rural consumption In 2050 71 per cent of Indonesias population is projected to live in urban areas compared with 54 per cent in 2015 (United Nations Population Division 2014) By 2050 Indonesian consumers are projected to have more diverse diets with greater consumption of meat dairy products fruit and vegetables
In this section the results for total urban and rural consumption reflect apparent consumption However per person rural and urban consumption is direct food consumption only Feed use and industrial use of the agrifood products are excluded in the per person results in order to better understand the projected change in diets
High value commodities Urban consumers account for most of the growth in consumption of meat dairy products fruit and vegetables over the projection period because of rising urban populations and incomes Between 2009 and 2050 the real value of urban beef consumption is projected to rise more than 18 times to US$34 billion (in 2009 US dollars) Consumption of dairy products is projected to rise by more than 14 times to more than US$8 billion and fruit and vegetables more than four times to US$43 billion and almost US$21 billion respectively (Figure 14)
25
Figure 14 Urban consumption of selected agricultural commodities Indonesia
Source ABARES model output
In per person terms the value of urban beef consumption is projected to rise more than nine times between 2009 and 2050 dairy more than seven times and fruit and vegetables to more than double However consumption of rice is projected to fall by 4 per cent While these increases are large Indonesias urban per person consumption in 2050 is still projected to be lower than that of China in the same year for many commodities including vegetables (73 per cent lower) oilseeds (12 per cent) dairy products (41 per cent) and sheep and goat meat (24 per cent) In contrast Indonesias urban per person consumption is projected to be higher than Chinas for beef (52 per cent higher) sugar (400 per cent) cereals (23 per cent) and starchy staples (14 times higher) (Hamshere et al 2014) For beef higher Indonesian per person consumption relative to China in 2050 reflects the dominance of beef in Indonesian diets by that time compared with China where pig meat consumption is significant Similarly the projected rise in per person consumption of starches in Indonesia mainly reflects higher consumption of cassava a culturally important food crop
For rural consumers total growth in consumption of meat dairy products fruit and vegetables is lower than for urban households This can be attributed to relatively lower rural incomes and a decline in the absolute size of the rural population Between 2009 and 2050 total rural beef consumption is projected to rise by 95 per cent to more than US$1 billion (in 2009 US dollars) dairy products by 75 per cent to US$05 billion fruit by 41 per cent to almost US$7 billion and vegetables by 42 per cent to almost US$5 billion (Figure 15)
20 40 60
Wheat
Sheep and goat meat
Dairy
Sugar
Oil crops
Rice
Vegetables
Starchy staples
Beef
Poultry
Fruit
Billion(2009 US$)
387
1724
1734
426
875
370
547
1349
Total food consumption
1761
91
173
50 100 150 200
Wheat
Sheep and goat meat
Dairy
Sugar
Oil crops
Rice
Vegetables
Starchy staples
Beef
Poultry
Fruit
2009 US$
145
819
824
165
391
137
226
630
Per person consumption
837
-4
38
26
Figure 15 Rural consumption of selected agricultural commodities Indonesia
Source ABARES model output
Between 2009 and 2050 rural per person consumption of each of the agrifood commodity groups is projected to change by a similar magnitude as urban consumption In value terms rural per person consumption of beef is projected to rise by 162 per cent dairy products by 135 per cent fruit by 90 per cent and vegetables by 92 per cent Similar increases are projected for rice (96 per cent) wheat (128 per cent) and starchy staples (116 per cent)
Again despite these significant increases rural per person consumption in Indonesia is projected to be lower than that of China in 2050 for all products except sugar which is projected to be 117 per cent higher For all other commodity groups rural per person consumption is projected to be lower than in China including sheep and goat meat (85 per cent lower) dairy (54 per cent) starches (32 per cent) cereals (56 per cent) and vegetables (86 per cent)
For both rural and urban consumers the rise in the real value of total food consumption in 2050 is principally the result of an increase in the quantity consumed rather than a projected significant rise in the real price This is especially pronounced in urban households For example between 2009 and 2050 beef consumption by urban households is projected to rise by more than 15 times and sheep and goat meat by 13 times In contrast rural beef consumption over this period is projected to rise by 64 per cent and sheep and goat meat by 44 per cent
Projected consumption growth of cereals and starchy staples between 2009 and 2050 is most pronounced in urban areas Rising urban consumption of these commodities is largely the result of population growth Urban consumption of wheat is projected to rise by 173 per cent to around US$2 billion (in 2009 US dollars) rice by 91 per cent to US$9 billion and starchy staples (which includes pulses potatoes yams and cassava) by 426 per cent to US$13 billion
Rural consumption of cereals and starchy staples is projected to rise despite a falling rural population As incomes rise towards 2050 the relatively affordable prices of these commodities will drive rural consumption Between 2009 and 2050 rural consumption of wheat is projected
2 4 6 8 10
Wheat
Sheep and goat meat
Dairy
Sugar
Oil crops
Rice
Vegetables
Starchy staples
Beef
Poultry
Fruit
Billion(2009 US$)
94
95
61
96
42
101
Total consumption
41
75
98
45
69
50 100 150 200
Wheat
Sheep and goat meat
Dairy
Sugar
Oil crops
Rice
Vegetables
Starchy staples
Beef
Poultry
Fruit
2050
2009
2009 US$
90
161
162
116
165
92
170
135
Per person consumption
166
96
128
27
to rise by 69 per cent to US$1 billion (in 2009 US dollars) rice by 45 per cent to almost US$9 billion and starchy staples by 61 per cent to US$3 billion
Production and trade The real value of Indonesias total agrifood production (which includes production for food feed and industrial use) is projected to more than double from US$81 billion in 2009 to US$173 billion in 2050 (in 2009 US dollars) This increase is driven by a higher value of production (in 2009 US dollars) of beef (up 209 per cent) poultry (187 per cent) starchy staples (115 per cent) vegetables (92 per cent) fruit (78 per cent) and rice and palm oil (up 77 per cent each) (Figure 16) The value of maize production divided almost equally between feed and food use is projected to increase by 78 per cent
Figure 16 Production of selected agricultural commodities Indonesia
Source ABARES model output
For some agricultural products such as rice and beef rising production partly reflects domestic policies that favour their production For example the real value of rice production between 2009 and 2050 is projected to rise by 77 per cent because of the assumption that producers continue to receive a minimum support price and input subsidies Indonesia is projected to switch from being an importer to an exporter of rice by 2050 The real value of Indonesias rice exports in 2050 is projected to be around US$09 billion (in 2009 US dollars)
The real value of Indonesias palm oil production is projected to rise significantly in line with strong export demand and Indonesias comparative advantage in its production Between 2009 and 2050 Indonesias production of palm oil is projected to rise by US$13 billion to US$30 billion an increase of 77 per cent Over this period palm oil exports are projected to rise by 40 per cent to US$18 billion
10 20 30 40
Sheep and goat meat
Dairy
Sugar
Palm oil
Rice
Vegetables
Starchy staples
Beef
Poultry
Fruit
2050
2009
Billion(2009 US$)
78
187
209
115
92
77
77
76
115
361
28
Imports For some agricultural commodities such as rice and palm oil the rise in consumption by 2050 is projected to be met largely by a rise in domestic production However for most agrifood commodities production is projected to increase at a slower rate than consumption As a result food and feed imports will be an increasingly important component of Indonesias food supply towards 2050 The real value of Indonesias total agrifood imports is projected to rise more than 20 times from 2009 to US$152 billion (in 2009 US dollar terms) in 2050
By 2050 Indonesia is projected to import a wide range of horticultural products Given rising domestic demand the real value of Indonesiarsquos fruit and vegetable imports is projected to rise to US$25 billion and US$11 billion in 2050 respectively (in 2009 US dollars Figure 17) On this basis the share of imports in total Indonesian fruit consumption will rise from 3 per cent in 2009 to 53 per cent in 2050 (Figure 18) For vegetables it will rise from 9 per cent in 2009 to 47 per cent in 2050
Figure 17 Trade of selected agricultural commodities Indonesia
Source ABARES model output
-30 -20 -10 0 10 20 30
Wheat
Sheep and goat meat
Dairy
Sugar
Rice
Beef
Starchy staples
Vegetables
Fruit
2050
2009
Billion (2009 US$)
Exports Imports
Palm oil
29
Figure 18 Import share of total consumption Indonesia
Source ABARES model output
Lower-income growth scenario The baseline projections for Indonesian agrifood consumption production and trade to 2050 are reliant on the underlying assumptions presented at the beginning of this chapter Chief among these are the OECD (2012a) assumptions for Indonesian GDP growth to 2050 presented in Chapter 2 (Table 1 and Table 7) If Indonesia were to realise a lower level of income growth agrifood demand growth would be expected to be lower The World Bank projects that Indonesian GDP growth in each decade to 2050 will be markedly lower than the OECDs projections (World Bank 2015 Table 7) This scenario examines the potential effect on Indonesian agrifood consumption and import demand if GDP and hence income growth were slower over the projection period as suggested by the World Bank All other variables from the reference scenario are held constant
Table 7 Indonesia GDP growth projections 2010 to 2050
Period Baseline 1991-2010
2011-2020 2021-30 2031-40 2041-50
OECD average annual growth ()
440 530 530 340 340
World Bank average annual growth ()
440 350 350 225 225
Source OECD 2012a World Bank 2015
Results In this scenario lower economic and income growth throughout the projection period results in GDP in 2050 that is 44 per cent lower than the reference case Because agrifood consumption is sensitive to changes in income the total value of agrifood consumption in 2050 (in 2009 US dollars) is 10 per cent less than in the reference case (Figure 19) Weaker economic growth most
Fruit Vegetables Starchy staples
Beef Poultry Sugar Maize Dairy Sheep and goat meat
Wheat
10
20
30
40
50
2050 Imports
2050 Domestic production
2009 imports
2009 Domestic production
53
3
4743
86
8183
1007091
9
75846723
6
100
Billion(2009 US$)
21
50
30
strongly affects urban areas where average annual income growth in the reference case was assumed to be more than double that of rural areas As a result demand for high-value products such as meat and dairy products declines significantly Many of these products are imported In 2050 the total projected value of beef consumption (in 2009 US dollars) is 17 per cent lower than in the reference case and poultry and milk products are each 14 per cent lower The real value of consumption for many domestically produced products such as starches and maize also declines but by no more than 10 per cent for any single commodity
Weaker consumption growth leads to lower import growth over the projection period particularly for high-value commodities The total value of imports in 2050 is 16 per cent lower in this scenario compared with the reference case with the import share of total consumption 5 percentage points lower than the reference case at 42 per cent (Figure 19) Beef imports are projected to be 20 per cent lower than the reference scenario sheep and goat meat 26 per cent lower and dairy products 16 per cent lower Fruit and vegetable imports are 12 per cent and 19 per cent lower respectively
Figure 19 Agrifood consumption in 2050 under lower income growth assumption
Source ABARES model output
0 100 200 300 400
Low income scenario
Baseline case
Domestic production
Imports
Billion(2009 US$)
4258
53 47
31
6 Conclusion Continued strong income and population growth combined with greater urbanisation are driving Indonesias increasing demand for not only more food but for a wider variety of foods This demand growth is projected to be met by increases in both domestic production and imports
Assuming no major changes to Indonesias existing agricultural policies to 2050 the real value of food consumption in Indonesia is projected to increase more than four times between 2009 and 2050 The increase will be characterised by a move towards more diverse diets with higher intake of meat dairy products fruit and vegetables Between 2009 and 2050 the real value of beef consumption is projected to rise more than 14 times dairy tenfold and fruit and vegetables to more than triple These projected increases are from a relatively low base and are driven by a rise in the quantities consumed rather than any significant projected rise in real prices To support this rise in demand imports of many agrifood commodities are projected to increase to 2050
The contribution of meat dairy products fruit and vegetables in Indonesian diets will increase more quickly than cereals and staples to 2050 While cereals and starchy staples will remain important components of Indonesian diets their relative contribution will declinemdashthe continuation of a trend that began around 1990
The upward trend in food demand is most pronounced among urban households whose income growth is assumed to be more than double that of rural households A declining rural population and relatively lower incomes will result in slower growth in food consumption compared with the urban population
For most agricultural commodities assuming no significant change to historical TFP growth for total agriculture production is projected to increase at a slower rate than consumption As a result food imports will be an important component of Indonesias food and feed supply towards 2050 The real value of Indonesias agrifood imports is projected to rise more than 20 times from 2009 to US$152 billion (in 2009 US dollar terms) in 2050
The projected significant increases in consumption and import demand for food in Indonesia are based on the assumption of relatively strong income growth to 2050 Under a lower growth scenario consumption of protein-based food products such as meat and dairy products is projected to be around 14 to 17 per cent lower than the reference case at 2050 While consumption of domestically produced products is also projected to be lower in 2050 in the lower-income-growth scenario the declines are less significant compared with the baseline case
While not included in the modelling in this report there is scope for increased production of non-food agricultural commodities and cash crops in Indonesia in which it has a comparative advantage These include natural rubber copra palm kernels coffee cocoa and spices Indonesias current policies on food self-sufficiency favour investment in food industries rather than the non-food and cash crops industries This has the effect of allocating resources away from their most efficient use
Because of their geographic proximity Australia and Indonesia are well placed to benefit from advancing bilateral agricultural trade Indonesia is an important market for Australian wheat sugar live cattle beef skim milk powder and horticultural products such as grapes and citrus
32
Stronger demand for these commodities and others in Indonesia will create further opportunities for Australian exporters
33
References ABARES 2013 Agricultural commodities September quarter 2013 Australian Bureau of Agricultural and Resource Economics and Sciences Canberra pp 85-87 available at agriculturegovauabarespublications
Afif S 2014 The Rising of Middle Class in Indonesia Opportunity and Challenge Paper presented at the International Policy Exchange Conference Segovia Spain 28 September available at umdcipeorgconferencesDecliningMiddleClassesSpainpapers_presentationshtml
Alexandratos N amp Bruinsma J 2012 World agriculture towards 20302050 the 2012 revision ESA Working paper no 12-03 Food and Agriculture Organization of the United Nations Rome available at faoorgeconomicesaesagen
Djajanegara A 1999 Local livestock feed resources in Livestock industries of Indonesia prior to the Asian financial crisis Food and Agriculture Organization of the United Nations Rome available at faoorgdocrep004AB986Eab986e06htmbm06 accessed 22 January 2015
Elias S amp Noone C 2011 The growth and development of the Indonesian economy Bulletin December Quarter Reserve Bank of Australia Sydney available at rbagovaupublicationsbulletin2011dec4html
FAO 2015 lsquoFAOSTATrsquo Food and Agriculture Organization of the United Nations Rome available at faostat3faoorghomeE accessed 26 October 2015
mdashmdash 2013 Indonesia Food and Agriculture Organization of the United Nations Rome available at faoorgdocrep005y4632ey4632e0lhtm
mdashmdash2012 GeoNetwork Food and Agriculture Organization of the United Nations Rome available at faoorggeonetworksrvenmainhome accessed 15 February 2014
mdashmdash 2005 Fertiliser use by crop in Indonesia Food and Agriculture Organization of the United Nations Rome available at faoorgdocrep008y7063ey7063e00htm
Fuglie K 2012 lsquoProductivity growth and technology capital in the global agricultural economyrsquo in Fuglie KO Wang SL amp Ball VE (eds) Productivity growth in agriculture an international perspective CAB International Oxfordshire UK
mdashmdash2010 lsquoSources of growth in Indonesian agriculture Journal of Productivity Analysis vol 33 no 3 pp 225-240
Fuglie K amp Rada N 2014 International Agricultural Productivity United States Department of Agriculture Economic Research Service Washington DC available at ersusdagovdata-productsinternational-agricultural-productivityaspxU089bfmSzkd
Global Business Guide Indonesia 2012 Agriculture in Indonesia available at gbgindonesiacomenagriculturesector_overviewphp
Glover J 2011 lsquoAn international retailerrsquos perspectiversquo Paper presented at The Crawford Fund 2011 Annual Parliamentary Conference Parliament House Canberra 14 August available at crawfordfundorgevents2011-parliamentary-conference
34
Hamshere P Sheng Y Moir B Syed F amp Gunning-Trant C 2014 What China wants Analysis of Chinas food demand to 2050 ABARES research report Canberra March available at agriculturegovauabarespublications
IMF 2015 World Economic Outlook Database available at imforgexternalpubsftweo201302weodataindexaspx accessed 26 October 2015
Indonesian Central Bureau of Statistics 2015a Poverty available at bpsgoidSubjekviewid23subjekViewTab3|accordion-daftar-subjek1 accessed 27 October 2015
mdashmdash2015b Consumption and expenditure available at bpsgoidSubjekviewid5subjekViewTab3|accordion-daftar-subjek1 accessed 27 October 2015
mdashmdash2015c Population 15 Years of Age and Over Who Worked by Main Industry 2004-2014 available at bpsgoidlinkTabelStatisviewid970 accessed 27 October 2015
mdashmdash2014 Consumption and expenditure available at bpsgoidSubjekviewid5subjekViewTab3|accordion-daftar-subjek1 accessed 20 February 2014
mdashmdash2011 Total income by Household Group (billion rupiahs) available at bpsgoidSubjekviewid5subjekViewTab3|accordion-daftar-subjek1 accessed 1 August 2014
Khajali F amp Slominski BA 2012 lsquoFactors that affect the nutritive value of canola meal for poultryrsquo Poultry Science vol 91 no 10 pp 2564ndash2575 available at psoxfordjournalsorgcontent91102564fullxref-ref-95-1
Linehan V Thorpe S Andrews N amp Beaini F 2012a Food demand to 2050 Opportunities for Australian agriculture paper presented at 2012 ABARES Outlook conference Canberra 6ndash7 March available at daffgovauabarespublications
mdashmdash 2012b Food demand to 2050 Opportunities for Australian agriculturemdashalgebraic description of agrifood model technical annex to ABARES Outlook conference paper Canberra May available at daffgovauabarespublications
Ludena C Hertel T Preckel P Foster K and Nin A 2007 Productivity growth and convergence in crop ruminant and nonruminant production measurement and forecasts Agricultural Economics 37 available at onlinelibrarywileycomdoi101111j1574-0862200700218xabstract
McKinsey Global Institute 2012 The archipelago economy Unleashing Indonesias potential September Jakarta available at mckinseycominsightsasia-pacificthe_archipelago_economyashx
OECD 2013 Global Food Security Challenges for the Food and Agricultural System Organisation for Economic Cooperation and Development Paris available at oecd-ilibraryorgagriculture-and-foodglobal-food-security_9789264195363-en
mdashmdash2012a Looking to 2060 A global vision of long-term growth Economics Department Policy Notes no 15 Organisation for Economic Cooperation and Development Paris November available at oecdorgecomonetarypolicy-noteshtm
35
mdashmdash2012b OECD Review of Agricultural Policies Indonesia 2012 Organisation for Economic Cooperation and Development Paris available at oecd-ilibraryorgagriculture-and-foodoecd-review-of-agricultural-policies-indonesia-2012_9789264179011-en
OECDndashFAO 2014 OECDndashFAO Agricultural Outlook 2014 Organisation for Economic Cooperation and Development Paris available at oecd-ilibraryorgagriculture-and-foodoecd-fao-agricultural-outlook-2014_agr_outlook-2014-en
Osorio C Abriningrum D Armas E amp Firdaus M 2011 Who is benefiting from fertilizer subsidies in Indonesia Policy Research Working Paper 5758 World Bank Washington DC available at elibraryworldbankorgdoipdf1015961813-9450-5758
Rabobank 2013 Indonesia - islands of opportunity Agriculture in Focus Rabobank Food amp Agribusiness Research and Advisory Australia and New Zealand Spring Sydney
Shahaf E 2009 Agriculture in Indonesia Asia Technology Consulting available at techasiaconsultingcomagriculture_in_indonesiahtml
Statistics Indonesia 2015 Gross Domestic Product at Current Market Prices By Industrial Origin (Billion Rupiahs) 2000-2014 available at bpsgoidlinkTabelStatisviewid1199 accessed 26 October 2015
Sudaryanto T 2014 Fertilizer subsidy policy in Indonesia impacts and future perspectives Food and Fertiliser Technology Center for the Asian and Pacific Region Asia-Pacific Information Platform on Agricultural Policy (AP) available at apfftcagnetorgap_dbphpid=365
The Canadian Trade Commissioner Service 2011 lsquoAn Investment Guide to Indonesia available at tradecommissionergccaengdocumentjspdid=133467toc38
United Nations Population Division 2015 World population prospects the 2015 revision United Nations New York available at esaunorgunpdwppindexhtm accessed 12 August 2015
mdashmdash2014 World urbanisation prospects the 2014 revision United Nations New York available at esaunorgunpdwup accessed 19 March 2015
USAID nd lsquoIndonesia ndash Property rights amp resource governancersquo USAID Country Profile available at usaidlandtenurenetindonesia
USDAndashFAS 2014 Indonesia grain and feed annual report 2014 GAIN Report no ID1407 1 April Foreign Agricultural Service United States Department of Agriculture Washington DC available at usdaindonesiaorgcat=10
Widarjono A 2012 Food and nutrient demand in Indonesia PhD thesis Oklahoma State University available at shareokorgbitstreamhandle112446547Department20of20Agricultural20Economics_48pdfsequence=1
World Bank 2015 Global Economic Prospects January 2015 Having fiscal space and using it World Bank Group Washington DC available at worldbankorgenpublicationglobal-economic-prospects
mdashmdash2014 World development indicators World Bank Washington DC available at dataworldbankorgdata-catalogworld-development-indicators
36
mdashmdash2013 Transport in Indonesia World Bank Washington DC available at goworldbankorgPF2AFG64V0
mdashmdash 2012a Raskin subsidised rice delivery Public expenditure review (PER) Social assistance program and public expenditure review no 3 World Bank Washington DC available at documentsworldbankorgcurateden20120215893857raskin-subsidized-rice-delivery
mdashmdash2012b Targeting poor and vulnerable households in Indonesia World Bank Washington DC available at documentsworldbankorgcurateden20120115879773targeting-poor-vulnerable-households-indonesia
mdashmdash2011 Indonesia Agriculture Public Expenditure Review 2010 World Bank Jakarta available at documentsworldbankorgcurateden20110919456223indonesia-agriculture-public-expenditure-review-2010
mdashmdash2010 Completing decentralization World Bank Jakarta available at documentsworldbankorgcurateden20100112012453completing-decentralization
mdashmdash2009 Investing in a more sustainable Indonesia Country Environmental Analysis Report No 50762-ID World Bank CEA Series East Asia and Pacific Region available at openknowledgeworldbankorgbitstreamhandle109863135507620v20Revis1ox0info10CEA1englishpdfsequence=1
mdashmdash2007 Horticultural producers and supermarket development in Indonesia World Bank Washington DC available at documentsworldbankorgcurateden2007068235822horticultural-producers-supermarket-development-indonesia
WTO 2013 Trade policy review Indonesia WTO Document WTTPRS278 World Trade Organisation Geneva available at wtoorgenglishtratop_etpr_etp378_ehtm
Yamauchi F 2014 Wage Growth Landholding and Mechanization in Agriculture Evidence from Indonesia World Bank Washington DC February available at openknowledgeworldbankorghandle1098617324

9
3 Production constraints in Indonesian agriculture
The agriculture sector is a key component of the Indonesian economy contributing about 14 per cent of Indonesias GDP in 2014 (Statistics Indonesia 2015) Thirty per cent of Indonesias land area is used for agricultural purposes and the sector employs 41 million people or 35 per cent of the nations work force The sector is a strong contributor to Indonesias trade with agricultural exports accounting for 24 per cent of the value of total merchandise exports in 2012 (World Bank 2014)
Indonesias agriculture is generally characterised by fertile volcanic soils and abundant renewable water resources High population density has resulted in a sector dominated by smallholdings Agricultural land area per person in Indonesia is low at just 022 hectares This is equivalent to a third of the world average (World Bank 2014) Challenges to agricultural production and productivity growth include the availability and quality of natural resources insecure land tenure underemployment of labour and lack of infrastructure
Resource constraints Land availability Indonesia is the worlds largest nation archipelago made up of 17 508 islands of which just over a third are inhabited Java is the most densely populated island accommodating more than half of Indonesias population (57 per cent in 2013) on only 7 per cent of the total land area (Map 1)
Map 1 Map of Indonesia
Source GeoNetwork Food and Agriculture Organization of the United Nations (FAO 2012)
About 30 per cent of Indonesias land area (545 000 square kilometres) is classified as agricultural land (World Bank 2014) Of this 43 per cent or 235 000 square kilometres is considered arable that is land under annual crops or any fallow or pasture land used for annual crops within any five-year period The remaining agricultural land is either devoted to plantation crops (such as oil palm coconut rubber coffee and sugar cane) or permanent pasture (natural or seeded grassland that remains unploughed for many years)
10
The islands of Java Bali and large parts of Sumatra are home to irrigated lowland rice-paddy terraces and upland rain fed farming The average size of farms producing rice and other food crops such as maize peanuts and cassava ranges from 03 hectares on Java to 14 hectares elsewhere (OECD 2013) Java produces around half of Indonesias rice Expansion of the lowland rice area in Java is limited because of increasing competition for land with other crops and non-agricultural uses such as industry uses housing and roads (FAO 2005)
The plantation and industrial crops sector dominated by oil palm coconut and natural rubber makes up 15 per cent of total crop area Large private and state-owned farms are involved in these perennial cropsmdashmainly in Kalimantan and Sumatra and mainly for producing oil palm and natural rubbermdashbut there are also many smallholders The average farm size in this sector is 2 600 hectares (OECD 2013)
Until 2010 growth in agricultural production relied largely on converting forested areas into agricultural land particularly to oil palm plantations In the past two decades millions of hectares were cleared for this purpose Just over half of Indonesias total land was classified as forest area in 2011 compared with 65 per cent in 1990 (Figure 8) Driving this trend has been the growing global demand for edible oils and the price competitiveness of palm oil relative to alternatives such as soybean oil (Rabobank 2013) Much of the deforestation is concentrated in Sumatra and Kalimantan
Figure 8 Land use in Indonesia
Note Share of total land area Source World Development indicators World Bank Group (World Bank 2014)
Many less populated islands remain densely forested and are home to forest and coastal communities that sustain themselves through agriculture hunting foraging and fishing (USAID nd) Indonesias Ministry of Forestry estimates of bush shrub grass and barren land across Indonesia total 22 million hectaresmdasharound half of which is located in Kalimantan and Papua McKinsey Global Institute (2012) estimates almost 7 million hectares of this land (much of which used to be in agricultural production but has since been abandoned) could be developed for agricultural production Alexandratos and Bruinsma (2012) project that between 2009 and 2050 total arable land in Indonesia will increase by 75 per centmdashan assumption used in the modelling in this report
20
40
60
80
100
1990 1993 1996 1999 2002 2005 2008 2011
Other
Agriculture
Forest area
11
Land degradation Indonesia is regularly described as being a highly fertile country but land quality varies across the archipelago The central islands have more fertile soils and hence are densely populated Agricultural land in Java in particular has benefited from high levels of mineral fertiliser application soil and water erosion control programmes and relatively good soil (FAO 2005) In contrast the soils of the outer less populated islands are characterised by highly weathered acidic soils that require higher fertiliser inputs to achieve the high crop yields obtained in Java and the other central islands Actual fertiliser use in the outer islands is generally lower than on Java resulting in soil nutrient depletion in the upland crop areas (FAO 2005)
Erosion and associated problems of nutrient depletion are minimal on Java because of the system of flat terracing and well-maintained irrigation schemes However in the lower-potential rain fed uplands where crops such as maize and cassava are produced on sloping hillsides erosion problems and nutrient depletion are more prevalent Where deforestation has occurred to make way for plantation crops loss of forest cover has led to watershed degradation silting of waterways flooding soil erosion and decline in soil quality and soil productivity (World Bank 2009)
Land tenure Land parcels in Indonesia are highly fragmented particularly on smallholder farms As land is passed down the generations it tends to become divided into smaller parcels (McKinsey Global Institute 2013) While the law requires that all land rights be registered most of these inherited parcels are unregistered less than 25 per cent of rural land parcel holders have been registered in the 40 years since land registration began (OECD 2012b) Additionally a large share of land off Java is communal rather than privately titled Land rights of these communities are often not formally recognised increasing the risk of conflict
The implications of the land tenure arrangements are that for large investors gaining access to land is a long and unclear process As a result only limited land rights are granted which compromises the extent to which production can increase (OECD 2012b) For smallholders unclear land tenure or nonexistence of certificated land registration compounds the difficulties of gaining access to credit from financial institutions This discourages investment in productivity-enhancing technology and biases farmers choices away from longer-term activities such as tree crops (World Bank 2010)
Fertiliser use The Indonesian Government maintains a ceiling price on fertiliser which depending on fertiliser type is between 50 per cent and 75 per cent lower than the market price (Sudaryanto 2014) Lower fertiliser prices are intended to encourage increased crop production particularly of rice The government provides a subsidy to fertiliser manufacturers to compensate them for selling fertiliser below market prices Despite the subsidy payment the incentives for fertiliser manufacturers to increase production and compete with one another are limited by government regulation of production quantities prices and locations where fertiliser can be sold (Osorio et al 2011)
The use of fertiliser is unevenly distributed across the archipelago Among food crops the highest application rates per hectare are for rice followed by maize and soybeans The lowest are for peanut and cassava The subsidy and resulting increase in fertiliser use led to more than a doubling of rice production between 1970 and 2000 Over that period total annual fertiliser
12
use increased from 635 000 tonnes to 59 million tonnes more than half of which was used to increase rice production (FAO 2005)
Fertilisers remain underused on plantation crops Large areas of plantation crops are owned and managed by smallholder farmers For many the lack of knowledge about appropriate fertilisation technology and the lack of reliable and timely access to the right fertilisers at village level lead to inadequate and unbalanced application (FAO 2005)
Apart from the budgetary burden subsidising domestic fertiliser prices results in inefficient fertiliser use at the farm level Studies in West Java report rice farmers applying levels of fertilisers higher than the recommended rates with some soil tests showing nutrient reserves had built up to high levels negatively affecting yields (FAO 2005 Osorio et al 2011)
Farm labour and mechanisation Indonesian agriculture is dominated by abundant labour in relation to available agricultural land contributing to the issue of small-scale production The agriculture forestry and fishing sector employs around 40 million people or 35 per cent of the workforce (15 years and over) and is the main source of employment in rural areas (Indonesian Central Bureau of Statistics 2015c McKinsey 2012) The proportion of landless and land-poor agricultural households is especially high on Java Of more than 17 million households on Java characterised as farmer or agricultural labourer households 39 per cent neither lease nor own any crop land and another 44 per cent lease or own less than 05 hectares (USAID nd)
Tradition is one obstacle to agricultural development in Indonesia (Shahaf 2009) In many cases farmers grow the same crops as previous generations using the same such methods and tools Sometimes two or three generations work the same farm
Traditionally particularly in Java harvesting is undertaken primarily by manual labour (Yamauchi 2014) Machines are rarely used However outside Java the emergence of larger scale farmers had led to operations scaling up through mechanisation This has contributed to a rise in farm labour productivity since 2000 (Figure 9)
Figure 9 Agriculture value added per farm worker Indonesia
Source World Development indicators World Bank Group (World Bank 2014)
Currently tractors are used for land preparation activities such as primary and secondary tillage while seeding and planting activities continue to be done manually Threshers are used in more developed areas where agricultural labour has become scarce as a result of competitive wages in other industries
2005 US$
200
400
600
800
1 000
1 200
1980 1984 1988 1992 1996 2000 2004 2008 2012
13
Wage growth in recent years may have led to the introduction of labour saving practices among relatively large farmers such as renting more land and acquiring machinery (Yamauchi 2014) In contrast small farmers have not significantly changed their behaviours
Infrastructure As the worlds largest archipelago Indonesias insufficient and poor quality infrastructure is a major challenge for connectivity between the islands High transport costs also undermine the competitiveness of agricultural industries and associated supply chains (Rabobank 2013 OECD 2012b) With most transport developments concentrated in Java access to markets for the rest of Indonesia is poor
Ninety per cent of freight and 80 per cent of passenger traffic in Indonesia moves by road However roads are heavily congested and their quality in urban and provincial areas is poor (The Canadian Trade Commissioner Service 2011) Because connectivity with markets is compromised by an inadequate road system returns to agricultural producers are often discounted because of spoilage incurred during transport (Global Business Guide Indonesia 2012)
Indonesia has around 300 ports spread throughout the archipelago Inter-island shipping consisting of ferry and cargo shipping services accounts for around 60 per cent of total seaborne cargo in the country (World Bank 2013) Seaports in Indonesia are outdated and investment in port facilities has not matched the rapid growth of traffic moving through them As a result inefficiencies in the shipping system such as bottlenecks and delays in cargo handling are common Vessels also often leave the main port Tanjung Priok before they are fully loaded to keep to published schedules (The Canadian Trade Commissioner Service 2011)
Current infrastructure does not support internal trade well and challenges Indonesiarsquos ability to provide its own food to its own people Developing an efficient transport and logistics system would not only increase the competitiveness of Indonesias external trade but would also provide easier and cheaper access for local agricultural products to domestic markets with reduced losses through spoilage Until this is achieved Indonesian supply chains will continue to be uncompetitive inefficient and looking to other markets to satisfy agrifood demand particularly in urban centres
Water availability While Indonesias water supplies may be sufficient for current agricultural production deterioration of the existing irrigation infrastructure and investment constraints to improve or develop new infrastructure may limit Indonesias future water availability given rapid urbanisation and food demands
Growing municipal water needs and the needs of the agriculture sector to increase production to meet the demands of urban consumers is likely to result in water shortages in coming decades The McKinsey Global Institute projects that by 2030 water supplies will fall short of demand by around 18 per cent (McKinsey 2012) Significant investment is required to improve water productivity and reduce water transmission losses through rehabilitating old and damaged irrigation infrastructure Up to half of Indonesias piped water supply is estimated to be lost in transmission (McKinsey 2012)
Feed availability Increasing demand for meat protein has stimulated the establishment of large scale commercial poultry farms and beef cattle feedlots Data from the Indonesian Feed Millers Association show
14
the poultry industry consumes 83 per cent of Indonesias animal feed the aquaculture industry consumes 11 per cent and cattle and pig industries the remaining 6 per cent (USDAndashFAS 2014)
On average Indonesias livestock feed is composed of maize (50 per cent) soybean meal (15 to 20 per cent) rice bran (15 per cent) wheat pollard (8 per cent) fish meal (5 per cent) maize gluten meal (3 per cent) and crude palm oil (2 per cent) (USDAndashFAS 2014) While most maize is sourced domestically inconsistent seasonal supplies and storage challenges such as high moisture content and aflatoxin levels are major factors that are leading feed millers to import increasing quantities of maize Canola meal is being used increasingly in poultry diets as a cost competitive alternative to soybean meal However its use is restricted to less than full replacement of soybean meal because of canolarsquos lower energy and protein content and the presence of antinutritional factors such as lower amino acid digestibility than in soybean meal (Khajali and Slominski 2012) Apart from maize and agri-industrial by-products such as rice bran copra meal and palm kernel meal other feed ingredients are largely imported (Table 3)
In food crop producing areas fibrous agricultural residues have become the main feed source for ruminant animals raised by small scale livestock producers Rice straw is fed as a base roughage but additional good quality feedstuff or concentratesmdashsuch as leaves and stalks of cassava leaves of maize and sugarcane leaves stems and peelings of banana rice bran pods and peelings of cacao and the fronds pressed fibre and palm kernel cake from oil palmmdashare required to gain higher production performance (Djajanegara 1999) Such feeds are available in various locations but their unequal distribution and high prices at the farm level limit their use by smallholder farmers Lack of storage and labour shortages during harvest time also restrict the collection of rice straw These limitations as well as the seasonal nature of these feedstuffs affect continuity of supply and therefore the productivity potential of smallholder livestock producers
Table 3 Indonesian animal feed sources of primary ingredients
Feed ingredient Local share () Imported share ()
Maize 90ndash95 5ndash10
Fish meal 5ndash10 90ndash95
Meat and bone meal (MBM) 0 100
Soybean meal 0 100
Rapeseed meal 0 100
Maize gluten meal 0 100
Feed additive 0 100
Rice bran 100 0
Copra meal 100 0
Palm kernel meal 100 0
Crude palm oil (CPO) 100 0 Source Indonesia grain and feed annual report 2014 United States Department of Agriculture (USDAndashFAS 2014)
Productivity There has been significant growth in the volume of total agricultural output in Indonesia over the past 50 years although the rate of growth has varied markedly over the decades The contribution of increased total factor productivity (TFP) to total agricultural output growth (including food crops and non-food cash crops) was strong during the 1960s and 1970s as new
15
technologies and improved crop varieties were widely adopted during the green revolution (Table 4) (Fuglie 2010 2012) In the 1980s land and labour use expanded enabling total agricultural output to grow but TFP growth slowed During the 1990s average agricultural output growth declined to less than 2 per cent a year as the green revolution crop varieties had already been widely adopted and no newer higher yielding varieties were suitable or available However TFP growth was stronger than the previous decade
Table 4 Average annual food and non-food agricultural output and total factor productivity growth Indonesia
Years Agricultural output Agricultural TFP
1961ndash1970 271 175
1971ndash1980 334 140
1981ndash1990 464 059
1991ndash2000 187 099
2001ndash2009 486 368 Note Agricultural output measured in volume Source Fuglie 2012
Between 2001 and 2009 strong output and TFP growth resumed for a number of reasons Newly available crop land achieved by the clearing of forested areas supported the expansion and diversification of agriculture into higher value non-staple commodities such as tropical perennials horticulture and livestock At the same time the relatively low price of fertilisers and chemicals available to producers led to a 50 per cent increase in their use between 2002 and 2009 (Figure 10) resulting in a marked improvement in crop yields compared with the previous decade (OECDndashFAO 2014) Improved literacy and education of the farm labour force also contributed to productivity growth (OECD 2012b)
Figure 10 Total fertilizer use in Indonesia by type
Note 2001 data not available Source FAOSTAT Food and Agriculture Organization of the United Nations (FAO 2015)
TFP estimates do not exist for the period since 2010 While yield growth is not as robust a measure of technical change as TFP yield trends can provide a partial indication of changes in productivity Average annual yield growth between 2011 and 2013 was lower than in the
Mt
1
2
3
2002 2003 2004 2005 2006 2007 2008 2009
Nitrogen
Potash
Phosphate
16
periods 2001ndash05 and 2006ndash10 across a range of food and non-food crops (Table 5) A number of factors explain this slowdown The rate of conversion of forest land to cropping slowed significantly reducing the rate of agricultural output growth achieved through additional agricultural land (OECD 2012b) In addition the sustained overuse of fertilizers and chemicals throughout the 2000s has led to decreasing returns to scale for these intermediate inputs As a result any future increase in the productivity of food and non-food crops is unlikely to be achieved through the application of chemicals or fertilisers
Table 5 Average annual yield growth of food and non-food cash crops Indonesia
Commodity Unit 1991-95 1996-00 2001-05 2006-10 2011-13
Food crops
Rice 02 03 08 19 09
Maize 12 42 46 52 30
Cassava -06 15 50 49 36
Mung beans -03 -67 44 23 -02
Soybeans 04 17 11 11 12
Groundnuts -34 58 15 16 02
Vegetables a 93 -08 35 -17 -68
Cash crops
Rubber na -01 45 58 48
Crude palm oil na -72 108 -06 12
Palm kernel na -104 120 08 -10
Cocoa na 05 143 21 -30
Coffee na 24 14 62 37
Tea na 02 30 -05 -11 a Vegetable data available to 2012 Source FAOSTAT Food and Agriculture Organization of the United Nations (FAO 2015)
With reduced scope for expansion in agricultural production through both conversion of forest land and increased use of fertilisers and chemicals future agricultural productivity growth is likely to be achieved through the more efficient use of inputs The dominance of smallholdings remains a constraint to achieving higher agricultural productivity growth in future as small plots impede the implementation of more productive practices This is compounded by inefficient fertiliser use limited mechanisation and an inadequate supply of other important inputs such as high-yielding seeds irrigation systems extension services and access to credit Addressing these issues will be key to future productivity trends
17
4 Indonesian agricultural and food policies
The objectives of Indonesias agricultural policy as stated by the Indonesian Ministry of Agriculture in 2010 are to
1) achieve food self-sufficiency
2) enhance diversification of production and consumption
3) raise the competitiveness and value added of production and
4) increase farmersrsquo welfare (OECD 2012b)
To achieve its objectives the Indonesian Government intervenes in the farm sector with multiple policy instruments The government also implements policies to protect consumers from fluctuations in prices of key food products such as wheat rice and vegetable oils and to insulate domestic producers from foreign competition Food for consumers is subsidised which effectively maintains the price of food within a narrow price band Producers benefit from tariffs applied to imported food which keep the price of domestically produced food competitive with imports Additionally producers are directly supported by government food purchases at guaranteed prices and subsidies on farm inputs such as fertiliser seed and farm equipment
Policies to support agricultural production Reference prices and import restrictions The Indonesian Government sets reference prices for rice sugar and beef which it aims to maintain through various policy instruments
On average around 70 per cent of domestic rice production is consumed within the farming household (OECD 2012b) The remainder is sold through either private or government-run channels such as Indonesias National Food Logistics Agency known as Badan Ursan Logistik (BULOG) BULOG purchases a limited amount of rice at the reference price to fulfil two objectives
1) stockholding for emergency purposes and
2) redistribution as part of the consumer subsidy programme Raskin (discussed below) (OECD 2012b)
In 2010 BULOG procured around 6 per cent of total domestic rice production equivalent to around 20 per cent of all marketed rice (OECD 2012b)
For sugar the government supports the producer price by imposing legal requirements on domestic sugar millers who control the domestic sugar market Sugar millers are required to purchase 75 per cent of their sugar cane requirements from domestic sugar cane growers and to pay growers a government-determined price
The Indonesian rice and sugar industries are also protected by import restrictions Companies that import rice and sugar are required to support the domestic industry by buying domestically produced product if the mill price falls below the reference price
18
For beef and live cattle imports the Indonesian Government sets a reference price which it aims to achieve by managing import volumes through an import permit system Since 2014 the reference price has been 76 000 rupiah (A$720) a kilogram Under the system import permits are not issued if domestic beef prices fall below the reference price (ABARES 2013) Weight restrictions on cattle imports also usually apply limiting imports to young lighter cattle destined for feedlots
The Indonesian Government also restricts imports of other commodities such as soybeans maize horticulture certain processed foods and animals and animal products (including fresh chilled and frozen meat and eggs) Importing these commodities is generally not permitted if the Ministry of Trade considers it will cause injury to the domestic industry (WTO 2013) Companies seeking to import these commodities are required to gain approval from the Indonesian Ministry of Trade (OECD 2012b)
Tariffs Tariffs are applied to most imported food products in Indonesia However they are relatively low and are not a major policy instrument used to protect domestic industries The average applied agricultural tariff was 53 per cent in 2010 (OECD 2012b) Around 85 per cent of agricultural imports are subject to tariffs between zero and 5 per cent with almost 66 per cent entering duty free All agricultural tariffs are ad valorem except for rice and sugar which have specific tariffs (OECD 2012b)
While applied tariffs are low bound tariff rates or the ceiling rate that can be applied under World Trade Organisation rules remain high (Figure 11) On average the bound rate on agricultural products is 47 per cent (OECD 2012b) The highest bound tariff is 210 per cent for milk powders although the applied rate is just 5 per cent Rice has a bound tariff of 160 per cent and an applied specific rate of 450 rupiah a kilogram (equivalent to an ad valorem tariff of 10 per cent when using the average export price for 15 per cent broken rice from Thailand in 2010) (OECD 2012b)
Figure 11 Average bound and applied tariffs by product groups
Source OECD Review of Agricultural Policies Indonesia 2012 Organisation for Economic Co-operation and Development (OECD 2012b)
0
20
40
60
80
Fruit and vegetables
Sugars and confectionery
Cereals Dairy products
Animals and animal
products
Oilseeds fats and oils
Average bound tariff
Average applied tariff
19
Input subsidies The Indonesian Government supports farmers by subsiding inputs such as fertiliser seeds and ad hoc products including power tools and rice milling units Fertiliser support is the largest component of budgetary support for agriculture accounting for 37 per cent in 2008ndash09 (OECD 2012b) Not all farmers receive input subsidies because eligibility requirements apply in many cases For example subsidised fertiliser is only available to farmers producing on less than 2 hectares
Policies to support consumers Price intervention The Indonesian Government intervenes in the domestic market for wheat flour maize and cooking oil when it considers retail prices too high for the poor It does this using a broad range of measures from simply asking manufacturers and wholesalers to be socially responsible with their pricing to purchasing these products and distributing them directly to poor households (OECD 2012b) Another policy often used is the government covered value tax under which the government waives the existing 10 per cent value added tax on the final price of certain food items For example the government has used this policy to reduce the price of non-branded cooking oil since 2007 In 2010 this policy cost the Indonesian Government around 250 billion rupiah (A$299 million)
Food subsidies The Indonesian Government operates a targeted rice subsidy programme known as Raskin to combat food insecurity The programmes objective is to make available a set quantity of rice (procured by BULOG) at a subsidised price to Indonesias poorest households on a monthly basis Raskins intention is to provide rice to those on official lists of households living under or near the national poverty line (World Bank 2012b) The poverty line in 2014 was around 318 500 rupiah per person a month in urban areas and 286 100 rupiah per person a month in rural areas (Indonesian Central Bureau of Statistics 2015a) Those with incomes within 20 per cent of the poverty line are defined as being near the poverty line (World Bank 2012b)
Despite the objectives of Raskin to target the most vulnerable since allocations of Raskin rice to households are decided by local authorities poor and non-poor households alike benefit from the programme In 2010 around 175 million households received Raskin rice (OECD 2012b) at a cost of around 14 trillion rupiah (A$17 billion) to the Indonesian Government (Figure 12) Between 2005 and 2010 the subsidised price was 1 600 rupiah (A$019) a kilogram representing about 20 to 25 per cent of the average market price (World Bank 2012a)
The quantity of rice per household the subsidised price the number of months a year that rice is distributed and the classification of the poorest households have all been altered over the period of the programme For example monthly allocations per household have been set as low as 10 kilograms and as high as 20 kilograms over the programme period although households rarely benefit from the full amount of the allocation (OECD 2012b World Bank 2012a)
20
Figure 12 Raskin rice distribution and budgetary cost
Source OECD Review of Agricultural Policies Indonesia 2012 Organisation for Economic Co-operation and Development (OECD 2012b)
Implications of agricultural and food policies Public expenditure on Indonesian agriculture has increased under its current policy settings In 2009 public spending was around 615 trillion rupiah (A$75 billion) This was equivalent to 56 per cent of total government expenditure compared with 27 per cent in 2001 (World Bank 2011) The fertiliser subsidy and Raskin have been the biggest drivers of increased spending over this period
In addition to the direct budget cost of Indonesias agricultural and food policies there have also been allocative effects Indonesian policies tend to focus on rice maize and sugar leading to increased production of these commodities and improved availability from domestic sources However expansion of these crops has come at the expense of horticulture and other commodities in which Indonesia has a comparative advantage such as natural rubber cocoa and spices (World Bank 2011)
The administration of some support programmes the fertiliser subsidy in particular is inefficient (Sudaryanto 2014) As discussed in Chapter 3 subsidising fertiliser companies in an environment where quantities prices and distribution channels are regulated reduces incentives for these companies to effectively compete This inefficiency has resulted in the under-production of fertiliser leading to shortages At the same time the artificially low price has led to an over-reliance on fertiliser by producers to increase yield rather than using other methods such as improved seeds (World Bank 2011)
4000
8000
12000
16000
2000 2002 2004 2006 2008 20100
1
2
3
4
Expenditure on RASKIN
Quantity of rice distributed (right axis)
Million tonnes
Billionrupiah
21
5 Simulation results Baseline assumptions The objective in this analysis is to identify and quantify projected changes in Indonesian demand for a range of agrifood commodities over the longer term across urban and rural households An updated version of the ABARES agrifood model (Linehan et al 2012a) is used to investigate these potential trends The model has been modified to include Indonesias consumer subsidy policy (Raskin) and a re-aggregation of some country and commodity groups to allow more detailed analysis
Indonesia has a comparative advantage in the production of many cash crops and non-food agricultural commodities that are not included in the ABARES agrifood model such as natural rubber copra palm kernels coffee cocoa and spices (FAO 2013) In Indonesia the production of these commodities competes with food commodities for resources despite a policy environment targeted at food production and food self-sufficiency
Given Indonesias limited supply of arable land and the quality and availability of its water supply the capacity of the domestic agricultural sector to meet the growing demand for food in Indonesia will depend heavily on improvements in productivity Total factor productivity (TFP) growth in Indonesian agriculture is estimated to have averaged 154 per cent a year since 1961 It is expected that yield growth in Indonesia will not decline from this average annual rate in the future because the potential for productivity growth remains significant However nor is it expected to continue at the relatively high rates estimated for the period 2001 to 2009 which were made possible from the expansion of agriculture into higher-value non-staple commodities on newly deforested land and a significant increase in the use of chemical fertilisers (see Chapter 4)
Productivity growth since 2010 is estimated to have slowed from the decade 2001ndash2009 The Indonesian Governments policy initiative Reducing Emissions from Deforestation and Forest Degradation (REDD) in 2010 and declaration of a two-year Forest Moratorium in 2011 have slowed the rate of forest conversion to crop land (OECD 2012b) In addition agricultural production continues to be constrained by the issues outlined in Chapter 4 (including decreasing returns to scale for chemical inputs lack of widespread mechanisation and deteriorating resource base) With ongoing competition between the production of food crops and non-food cash crops (in which Indonesia has a comparative advantage) and little prospects in the foreseeable future for major policy changes on food consumption and production TFP growth for food crops in Indonesia is assumed to average 154 per cent a year between 2009 and 2050 This is close to the forecast by Ludena et al (2007) of 152 per cent a year to 2040 (FAO 2013 USDAndashFAS 2014)
Growth rates for TFP for individual commodities have in the past shown similar patterns to growth in yields Assumptions of TFP growth rates for individual commodities are therefore derived by apportioning the assumed rate for the whole of agriculture by historical growth in the yields of each commodity (Table 6)
22
Table 6 Average annual TFP growth rate by industry in Indonesia 2009 to 2050
Industry
Rice 214
Maize 337
Coarse grains 335
Other cereals 239
Oilseeds 388
Vegetables 232
Fruit 303
Beef 032
Sheep and goat meat 144
Poultry 144
Eggs 135
Dairy 215
All Agriculture 154 Source ABARES model assumption
In the reference case no change to Indonesias market support policies is assumed over the projection period On the production side these include the principal forms of market support of state trading input subsidies and import restrictions Additionally the Indonesian Governments minimum support prices for rice and wheat are maintained in real terms as are other ad hoc interventions on a range of agricultural commodities
The government support received by consumers through the consumer subsidy policy Raskin is also maintained in real terms over the projection period (discussed in Chapter 4)
The baseline projections determined in the agrifood model for Indonesia are also dependent on a set of assumptions discussed in Chapters 2 and 3 To summarise
bull population growth is assumed to average 07 per cent a year between 2010 and 2050
bull the proportion of the population in urban areas is assumed to increase from 50 per cent in 2009 to 72 per cent by 2050
bull average annual GDP growth in Indonesia is assumed to average 53 per cent a year between 2010 and 2030 before weakening between 2030 and 2050 to average 34 per cent a year (Table 1)
bull average annual income growth is assumed to be 56 per cent a year in urban areas and 21 per cent a year in rural areas
agricultural productivity in Indonesia is assumed to continue to increase according to the growth estimates provided in Table 6
The population is divided into two income stratamdashurban income and rural income households Across these two household types the income growth assumptions to 2050 for urban and rural areas are based on historical income data from the Indonesian Central Bureau of Statistics (2011) These data demonstrate that not only is average urban income higher than average rural income but with urbanisation average income growth in urban areas has also been higher than
23
in rural areas This has been the result of a relatively faster rate of economic development and higher wages which have stemmed from the growth in the manufacturing and services sectors prevalent in urban areas The model assumes this trend in income growth will continue to 2050 Indonesian household food consumption data in the base year of the model are from the Indonesian Central Bureau of Statistics (2014) and Widarjono (2012) These data were used as the basis in the model to project food consumption across urban and rural households to 2050
In the model total and per person Indonesian food consumption and total urban and rural food consumption is apparent consumption which reflects the total use of agrifood products (food feed and industrial use) In contrast per person urban and rural consumption is direct food consumption only it excludes feed use and industrial use of agrifood products to better reflect changes in diets
Consumption The real value of total food consumption in Indonesia (including food feed and industrial use) is projected to quadruple between 2009 and 2050 to US$327 billion (in 2009 US dollars) The largest increases are for meat dairy products fruit and vegetables as real incomes increase (Figure 13) Together these commodities account for two-thirds of the projected rise in the real value of food consumption
Figure 13 Consumption of selected agricultural commodities Indonesia
Note Starchy staples include pulses yams potatoes and cassava Source ABARES model output
Between 2009 and 2050 the real value of Indonesian beef consumption is projected to rise more than 14 times to US$35 billion (in 2009 US dollars) dairy products ten times to almost US$9 billion and fruit and vegetables more than three times to US$50 billion and US$25 billion respectively For many commodities the value of consumption in 2050 is projected to rise from a very low base reflecting high poverty rates and a large rural population in 2009 By 2050 72 per cent of the population is projected to live in urban centres with higher incomes than the
10 20 30 40 50 60
Wheat
Sheep and goat meat
Dairy
Sugar
Oil crops
Rice
Vegetables
Starchy staples
Beef
Poultry
Fruit
2050
2009
Billion(2009 US$)
552
66
231
1311
269
1319
256
246
935
1340
113
24
rural cohort It is this expected transition of the population and income growth that drive the magnitude of projected consumption growth for many commodities Despite these large increases Indonesias per person food consumption in 2050 is projected to remain below that of China for many commodities (Hamshere et al 2014)
For cereals oil crops and starchy staples (pulses potatoes yams and cassava) consumption is also projected to increase Between 2009 and 2050 the real value of rice consumption is projected to rise by 66 per cent to nearly US$23 billion (in 2009 US dollars) maize by 182 per cent to US$8 billion oil crops by 246 per cent to US$22 billion and starchy staples by 256 per cent to almost US$29 billion Over this period the real value of sugar consumption is projected to rise more than six times to US$14 billion (in 2009 US dollars)
The projected rise in consumption of cereals oil crops and starchy staples is driven by a number of factors First cereals and starchy staples (such as cassava) are relatively affordable foods particularly for low and middle income consumers whose populations are projected to rise Although both cereals and starchy staples will remain important components of Indonesian diets to 2050 their relative contribution will decline as diets become more diversified with greater amounts of meats dairy products and fruit and vegetablesmdashthe continuation of a trend that began around 1990 (Figure 5)
The projected rise in consumption of cereals oil crops and starchy staples is also driven by feed requirements which will increase as the demand for meat protein rises to 2050 As discussed in Chapter 3 about 50 per cent of domestic maize production is used as feed Rice bran also comprises about 15 per cent of total Indonesian feed consumption Soybean meal comprises between 15 per cent and 20 per cent of total livestock feed all of which is imported Rapeseed meal can be used as a partial substitute for soybeans and it too is entirely imported In 2050 it is projected that feed use will account for around 42 per cent of total maize consumption 43 per cent of total oil crop consumption and 44 per cent of total starchy staple consumption a larger proportion of which will need to be imported compared with 2009
Urban and rural consumption In 2050 71 per cent of Indonesias population is projected to live in urban areas compared with 54 per cent in 2015 (United Nations Population Division 2014) By 2050 Indonesian consumers are projected to have more diverse diets with greater consumption of meat dairy products fruit and vegetables
In this section the results for total urban and rural consumption reflect apparent consumption However per person rural and urban consumption is direct food consumption only Feed use and industrial use of the agrifood products are excluded in the per person results in order to better understand the projected change in diets
High value commodities Urban consumers account for most of the growth in consumption of meat dairy products fruit and vegetables over the projection period because of rising urban populations and incomes Between 2009 and 2050 the real value of urban beef consumption is projected to rise more than 18 times to US$34 billion (in 2009 US dollars) Consumption of dairy products is projected to rise by more than 14 times to more than US$8 billion and fruit and vegetables more than four times to US$43 billion and almost US$21 billion respectively (Figure 14)
25
Figure 14 Urban consumption of selected agricultural commodities Indonesia
Source ABARES model output
In per person terms the value of urban beef consumption is projected to rise more than nine times between 2009 and 2050 dairy more than seven times and fruit and vegetables to more than double However consumption of rice is projected to fall by 4 per cent While these increases are large Indonesias urban per person consumption in 2050 is still projected to be lower than that of China in the same year for many commodities including vegetables (73 per cent lower) oilseeds (12 per cent) dairy products (41 per cent) and sheep and goat meat (24 per cent) In contrast Indonesias urban per person consumption is projected to be higher than Chinas for beef (52 per cent higher) sugar (400 per cent) cereals (23 per cent) and starchy staples (14 times higher) (Hamshere et al 2014) For beef higher Indonesian per person consumption relative to China in 2050 reflects the dominance of beef in Indonesian diets by that time compared with China where pig meat consumption is significant Similarly the projected rise in per person consumption of starches in Indonesia mainly reflects higher consumption of cassava a culturally important food crop
For rural consumers total growth in consumption of meat dairy products fruit and vegetables is lower than for urban households This can be attributed to relatively lower rural incomes and a decline in the absolute size of the rural population Between 2009 and 2050 total rural beef consumption is projected to rise by 95 per cent to more than US$1 billion (in 2009 US dollars) dairy products by 75 per cent to US$05 billion fruit by 41 per cent to almost US$7 billion and vegetables by 42 per cent to almost US$5 billion (Figure 15)
20 40 60
Wheat
Sheep and goat meat
Dairy
Sugar
Oil crops
Rice
Vegetables
Starchy staples
Beef
Poultry
Fruit
Billion(2009 US$)
387
1724
1734
426
875
370
547
1349
Total food consumption
1761
91
173
50 100 150 200
Wheat
Sheep and goat meat
Dairy
Sugar
Oil crops
Rice
Vegetables
Starchy staples
Beef
Poultry
Fruit
2009 US$
145
819
824
165
391
137
226
630
Per person consumption
837
-4
38
26
Figure 15 Rural consumption of selected agricultural commodities Indonesia
Source ABARES model output
Between 2009 and 2050 rural per person consumption of each of the agrifood commodity groups is projected to change by a similar magnitude as urban consumption In value terms rural per person consumption of beef is projected to rise by 162 per cent dairy products by 135 per cent fruit by 90 per cent and vegetables by 92 per cent Similar increases are projected for rice (96 per cent) wheat (128 per cent) and starchy staples (116 per cent)
Again despite these significant increases rural per person consumption in Indonesia is projected to be lower than that of China in 2050 for all products except sugar which is projected to be 117 per cent higher For all other commodity groups rural per person consumption is projected to be lower than in China including sheep and goat meat (85 per cent lower) dairy (54 per cent) starches (32 per cent) cereals (56 per cent) and vegetables (86 per cent)
For both rural and urban consumers the rise in the real value of total food consumption in 2050 is principally the result of an increase in the quantity consumed rather than a projected significant rise in the real price This is especially pronounced in urban households For example between 2009 and 2050 beef consumption by urban households is projected to rise by more than 15 times and sheep and goat meat by 13 times In contrast rural beef consumption over this period is projected to rise by 64 per cent and sheep and goat meat by 44 per cent
Projected consumption growth of cereals and starchy staples between 2009 and 2050 is most pronounced in urban areas Rising urban consumption of these commodities is largely the result of population growth Urban consumption of wheat is projected to rise by 173 per cent to around US$2 billion (in 2009 US dollars) rice by 91 per cent to US$9 billion and starchy staples (which includes pulses potatoes yams and cassava) by 426 per cent to US$13 billion
Rural consumption of cereals and starchy staples is projected to rise despite a falling rural population As incomes rise towards 2050 the relatively affordable prices of these commodities will drive rural consumption Between 2009 and 2050 rural consumption of wheat is projected
2 4 6 8 10
Wheat
Sheep and goat meat
Dairy
Sugar
Oil crops
Rice
Vegetables
Starchy staples
Beef
Poultry
Fruit
Billion(2009 US$)
94
95
61
96
42
101
Total consumption
41
75
98
45
69
50 100 150 200
Wheat
Sheep and goat meat
Dairy
Sugar
Oil crops
Rice
Vegetables
Starchy staples
Beef
Poultry
Fruit
2050
2009
2009 US$
90
161
162
116
165
92
170
135
Per person consumption
166
96
128
27
to rise by 69 per cent to US$1 billion (in 2009 US dollars) rice by 45 per cent to almost US$9 billion and starchy staples by 61 per cent to US$3 billion
Production and trade The real value of Indonesias total agrifood production (which includes production for food feed and industrial use) is projected to more than double from US$81 billion in 2009 to US$173 billion in 2050 (in 2009 US dollars) This increase is driven by a higher value of production (in 2009 US dollars) of beef (up 209 per cent) poultry (187 per cent) starchy staples (115 per cent) vegetables (92 per cent) fruit (78 per cent) and rice and palm oil (up 77 per cent each) (Figure 16) The value of maize production divided almost equally between feed and food use is projected to increase by 78 per cent
Figure 16 Production of selected agricultural commodities Indonesia
Source ABARES model output
For some agricultural products such as rice and beef rising production partly reflects domestic policies that favour their production For example the real value of rice production between 2009 and 2050 is projected to rise by 77 per cent because of the assumption that producers continue to receive a minimum support price and input subsidies Indonesia is projected to switch from being an importer to an exporter of rice by 2050 The real value of Indonesias rice exports in 2050 is projected to be around US$09 billion (in 2009 US dollars)
The real value of Indonesias palm oil production is projected to rise significantly in line with strong export demand and Indonesias comparative advantage in its production Between 2009 and 2050 Indonesias production of palm oil is projected to rise by US$13 billion to US$30 billion an increase of 77 per cent Over this period palm oil exports are projected to rise by 40 per cent to US$18 billion
10 20 30 40
Sheep and goat meat
Dairy
Sugar
Palm oil
Rice
Vegetables
Starchy staples
Beef
Poultry
Fruit
2050
2009
Billion(2009 US$)
78
187
209
115
92
77
77
76
115
361
28
Imports For some agricultural commodities such as rice and palm oil the rise in consumption by 2050 is projected to be met largely by a rise in domestic production However for most agrifood commodities production is projected to increase at a slower rate than consumption As a result food and feed imports will be an increasingly important component of Indonesias food supply towards 2050 The real value of Indonesias total agrifood imports is projected to rise more than 20 times from 2009 to US$152 billion (in 2009 US dollar terms) in 2050
By 2050 Indonesia is projected to import a wide range of horticultural products Given rising domestic demand the real value of Indonesiarsquos fruit and vegetable imports is projected to rise to US$25 billion and US$11 billion in 2050 respectively (in 2009 US dollars Figure 17) On this basis the share of imports in total Indonesian fruit consumption will rise from 3 per cent in 2009 to 53 per cent in 2050 (Figure 18) For vegetables it will rise from 9 per cent in 2009 to 47 per cent in 2050
Figure 17 Trade of selected agricultural commodities Indonesia
Source ABARES model output
-30 -20 -10 0 10 20 30
Wheat
Sheep and goat meat
Dairy
Sugar
Rice
Beef
Starchy staples
Vegetables
Fruit
2050
2009
Billion (2009 US$)
Exports Imports
Palm oil
29
Figure 18 Import share of total consumption Indonesia
Source ABARES model output
Lower-income growth scenario The baseline projections for Indonesian agrifood consumption production and trade to 2050 are reliant on the underlying assumptions presented at the beginning of this chapter Chief among these are the OECD (2012a) assumptions for Indonesian GDP growth to 2050 presented in Chapter 2 (Table 1 and Table 7) If Indonesia were to realise a lower level of income growth agrifood demand growth would be expected to be lower The World Bank projects that Indonesian GDP growth in each decade to 2050 will be markedly lower than the OECDs projections (World Bank 2015 Table 7) This scenario examines the potential effect on Indonesian agrifood consumption and import demand if GDP and hence income growth were slower over the projection period as suggested by the World Bank All other variables from the reference scenario are held constant
Table 7 Indonesia GDP growth projections 2010 to 2050
Period Baseline 1991-2010
2011-2020 2021-30 2031-40 2041-50
OECD average annual growth ()
440 530 530 340 340
World Bank average annual growth ()
440 350 350 225 225
Source OECD 2012a World Bank 2015
Results In this scenario lower economic and income growth throughout the projection period results in GDP in 2050 that is 44 per cent lower than the reference case Because agrifood consumption is sensitive to changes in income the total value of agrifood consumption in 2050 (in 2009 US dollars) is 10 per cent less than in the reference case (Figure 19) Weaker economic growth most
Fruit Vegetables Starchy staples
Beef Poultry Sugar Maize Dairy Sheep and goat meat
Wheat
10
20
30
40
50
2050 Imports
2050 Domestic production
2009 imports
2009 Domestic production
53
3
4743
86
8183
1007091
9
75846723
6
100
Billion(2009 US$)
21
50
30
strongly affects urban areas where average annual income growth in the reference case was assumed to be more than double that of rural areas As a result demand for high-value products such as meat and dairy products declines significantly Many of these products are imported In 2050 the total projected value of beef consumption (in 2009 US dollars) is 17 per cent lower than in the reference case and poultry and milk products are each 14 per cent lower The real value of consumption for many domestically produced products such as starches and maize also declines but by no more than 10 per cent for any single commodity
Weaker consumption growth leads to lower import growth over the projection period particularly for high-value commodities The total value of imports in 2050 is 16 per cent lower in this scenario compared with the reference case with the import share of total consumption 5 percentage points lower than the reference case at 42 per cent (Figure 19) Beef imports are projected to be 20 per cent lower than the reference scenario sheep and goat meat 26 per cent lower and dairy products 16 per cent lower Fruit and vegetable imports are 12 per cent and 19 per cent lower respectively
Figure 19 Agrifood consumption in 2050 under lower income growth assumption
Source ABARES model output
0 100 200 300 400
Low income scenario
Baseline case
Domestic production
Imports
Billion(2009 US$)
4258
53 47
31
6 Conclusion Continued strong income and population growth combined with greater urbanisation are driving Indonesias increasing demand for not only more food but for a wider variety of foods This demand growth is projected to be met by increases in both domestic production and imports
Assuming no major changes to Indonesias existing agricultural policies to 2050 the real value of food consumption in Indonesia is projected to increase more than four times between 2009 and 2050 The increase will be characterised by a move towards more diverse diets with higher intake of meat dairy products fruit and vegetables Between 2009 and 2050 the real value of beef consumption is projected to rise more than 14 times dairy tenfold and fruit and vegetables to more than triple These projected increases are from a relatively low base and are driven by a rise in the quantities consumed rather than any significant projected rise in real prices To support this rise in demand imports of many agrifood commodities are projected to increase to 2050
The contribution of meat dairy products fruit and vegetables in Indonesian diets will increase more quickly than cereals and staples to 2050 While cereals and starchy staples will remain important components of Indonesian diets their relative contribution will declinemdashthe continuation of a trend that began around 1990
The upward trend in food demand is most pronounced among urban households whose income growth is assumed to be more than double that of rural households A declining rural population and relatively lower incomes will result in slower growth in food consumption compared with the urban population
For most agricultural commodities assuming no significant change to historical TFP growth for total agriculture production is projected to increase at a slower rate than consumption As a result food imports will be an important component of Indonesias food and feed supply towards 2050 The real value of Indonesias agrifood imports is projected to rise more than 20 times from 2009 to US$152 billion (in 2009 US dollar terms) in 2050
The projected significant increases in consumption and import demand for food in Indonesia are based on the assumption of relatively strong income growth to 2050 Under a lower growth scenario consumption of protein-based food products such as meat and dairy products is projected to be around 14 to 17 per cent lower than the reference case at 2050 While consumption of domestically produced products is also projected to be lower in 2050 in the lower-income-growth scenario the declines are less significant compared with the baseline case
While not included in the modelling in this report there is scope for increased production of non-food agricultural commodities and cash crops in Indonesia in which it has a comparative advantage These include natural rubber copra palm kernels coffee cocoa and spices Indonesias current policies on food self-sufficiency favour investment in food industries rather than the non-food and cash crops industries This has the effect of allocating resources away from their most efficient use
Because of their geographic proximity Australia and Indonesia are well placed to benefit from advancing bilateral agricultural trade Indonesia is an important market for Australian wheat sugar live cattle beef skim milk powder and horticultural products such as grapes and citrus
32
Stronger demand for these commodities and others in Indonesia will create further opportunities for Australian exporters
33
References ABARES 2013 Agricultural commodities September quarter 2013 Australian Bureau of Agricultural and Resource Economics and Sciences Canberra pp 85-87 available at agriculturegovauabarespublications
Afif S 2014 The Rising of Middle Class in Indonesia Opportunity and Challenge Paper presented at the International Policy Exchange Conference Segovia Spain 28 September available at umdcipeorgconferencesDecliningMiddleClassesSpainpapers_presentationshtml
Alexandratos N amp Bruinsma J 2012 World agriculture towards 20302050 the 2012 revision ESA Working paper no 12-03 Food and Agriculture Organization of the United Nations Rome available at faoorgeconomicesaesagen
Djajanegara A 1999 Local livestock feed resources in Livestock industries of Indonesia prior to the Asian financial crisis Food and Agriculture Organization of the United Nations Rome available at faoorgdocrep004AB986Eab986e06htmbm06 accessed 22 January 2015
Elias S amp Noone C 2011 The growth and development of the Indonesian economy Bulletin December Quarter Reserve Bank of Australia Sydney available at rbagovaupublicationsbulletin2011dec4html
FAO 2015 lsquoFAOSTATrsquo Food and Agriculture Organization of the United Nations Rome available at faostat3faoorghomeE accessed 26 October 2015
mdashmdash 2013 Indonesia Food and Agriculture Organization of the United Nations Rome available at faoorgdocrep005y4632ey4632e0lhtm
mdashmdash2012 GeoNetwork Food and Agriculture Organization of the United Nations Rome available at faoorggeonetworksrvenmainhome accessed 15 February 2014
mdashmdash 2005 Fertiliser use by crop in Indonesia Food and Agriculture Organization of the United Nations Rome available at faoorgdocrep008y7063ey7063e00htm
Fuglie K 2012 lsquoProductivity growth and technology capital in the global agricultural economyrsquo in Fuglie KO Wang SL amp Ball VE (eds) Productivity growth in agriculture an international perspective CAB International Oxfordshire UK
mdashmdash2010 lsquoSources of growth in Indonesian agriculture Journal of Productivity Analysis vol 33 no 3 pp 225-240
Fuglie K amp Rada N 2014 International Agricultural Productivity United States Department of Agriculture Economic Research Service Washington DC available at ersusdagovdata-productsinternational-agricultural-productivityaspxU089bfmSzkd
Global Business Guide Indonesia 2012 Agriculture in Indonesia available at gbgindonesiacomenagriculturesector_overviewphp
Glover J 2011 lsquoAn international retailerrsquos perspectiversquo Paper presented at The Crawford Fund 2011 Annual Parliamentary Conference Parliament House Canberra 14 August available at crawfordfundorgevents2011-parliamentary-conference
34
Hamshere P Sheng Y Moir B Syed F amp Gunning-Trant C 2014 What China wants Analysis of Chinas food demand to 2050 ABARES research report Canberra March available at agriculturegovauabarespublications
IMF 2015 World Economic Outlook Database available at imforgexternalpubsftweo201302weodataindexaspx accessed 26 October 2015
Indonesian Central Bureau of Statistics 2015a Poverty available at bpsgoidSubjekviewid23subjekViewTab3|accordion-daftar-subjek1 accessed 27 October 2015
mdashmdash2015b Consumption and expenditure available at bpsgoidSubjekviewid5subjekViewTab3|accordion-daftar-subjek1 accessed 27 October 2015
mdashmdash2015c Population 15 Years of Age and Over Who Worked by Main Industry 2004-2014 available at bpsgoidlinkTabelStatisviewid970 accessed 27 October 2015
mdashmdash2014 Consumption and expenditure available at bpsgoidSubjekviewid5subjekViewTab3|accordion-daftar-subjek1 accessed 20 February 2014
mdashmdash2011 Total income by Household Group (billion rupiahs) available at bpsgoidSubjekviewid5subjekViewTab3|accordion-daftar-subjek1 accessed 1 August 2014
Khajali F amp Slominski BA 2012 lsquoFactors that affect the nutritive value of canola meal for poultryrsquo Poultry Science vol 91 no 10 pp 2564ndash2575 available at psoxfordjournalsorgcontent91102564fullxref-ref-95-1
Linehan V Thorpe S Andrews N amp Beaini F 2012a Food demand to 2050 Opportunities for Australian agriculture paper presented at 2012 ABARES Outlook conference Canberra 6ndash7 March available at daffgovauabarespublications
mdashmdash 2012b Food demand to 2050 Opportunities for Australian agriculturemdashalgebraic description of agrifood model technical annex to ABARES Outlook conference paper Canberra May available at daffgovauabarespublications
Ludena C Hertel T Preckel P Foster K and Nin A 2007 Productivity growth and convergence in crop ruminant and nonruminant production measurement and forecasts Agricultural Economics 37 available at onlinelibrarywileycomdoi101111j1574-0862200700218xabstract
McKinsey Global Institute 2012 The archipelago economy Unleashing Indonesias potential September Jakarta available at mckinseycominsightsasia-pacificthe_archipelago_economyashx
OECD 2013 Global Food Security Challenges for the Food and Agricultural System Organisation for Economic Cooperation and Development Paris available at oecd-ilibraryorgagriculture-and-foodglobal-food-security_9789264195363-en
mdashmdash2012a Looking to 2060 A global vision of long-term growth Economics Department Policy Notes no 15 Organisation for Economic Cooperation and Development Paris November available at oecdorgecomonetarypolicy-noteshtm
35
mdashmdash2012b OECD Review of Agricultural Policies Indonesia 2012 Organisation for Economic Cooperation and Development Paris available at oecd-ilibraryorgagriculture-and-foodoecd-review-of-agricultural-policies-indonesia-2012_9789264179011-en
OECDndashFAO 2014 OECDndashFAO Agricultural Outlook 2014 Organisation for Economic Cooperation and Development Paris available at oecd-ilibraryorgagriculture-and-foodoecd-fao-agricultural-outlook-2014_agr_outlook-2014-en
Osorio C Abriningrum D Armas E amp Firdaus M 2011 Who is benefiting from fertilizer subsidies in Indonesia Policy Research Working Paper 5758 World Bank Washington DC available at elibraryworldbankorgdoipdf1015961813-9450-5758
Rabobank 2013 Indonesia - islands of opportunity Agriculture in Focus Rabobank Food amp Agribusiness Research and Advisory Australia and New Zealand Spring Sydney
Shahaf E 2009 Agriculture in Indonesia Asia Technology Consulting available at techasiaconsultingcomagriculture_in_indonesiahtml
Statistics Indonesia 2015 Gross Domestic Product at Current Market Prices By Industrial Origin (Billion Rupiahs) 2000-2014 available at bpsgoidlinkTabelStatisviewid1199 accessed 26 October 2015
Sudaryanto T 2014 Fertilizer subsidy policy in Indonesia impacts and future perspectives Food and Fertiliser Technology Center for the Asian and Pacific Region Asia-Pacific Information Platform on Agricultural Policy (AP) available at apfftcagnetorgap_dbphpid=365
The Canadian Trade Commissioner Service 2011 lsquoAn Investment Guide to Indonesia available at tradecommissionergccaengdocumentjspdid=133467toc38
United Nations Population Division 2015 World population prospects the 2015 revision United Nations New York available at esaunorgunpdwppindexhtm accessed 12 August 2015
mdashmdash2014 World urbanisation prospects the 2014 revision United Nations New York available at esaunorgunpdwup accessed 19 March 2015
USAID nd lsquoIndonesia ndash Property rights amp resource governancersquo USAID Country Profile available at usaidlandtenurenetindonesia
USDAndashFAS 2014 Indonesia grain and feed annual report 2014 GAIN Report no ID1407 1 April Foreign Agricultural Service United States Department of Agriculture Washington DC available at usdaindonesiaorgcat=10
Widarjono A 2012 Food and nutrient demand in Indonesia PhD thesis Oklahoma State University available at shareokorgbitstreamhandle112446547Department20of20Agricultural20Economics_48pdfsequence=1
World Bank 2015 Global Economic Prospects January 2015 Having fiscal space and using it World Bank Group Washington DC available at worldbankorgenpublicationglobal-economic-prospects
mdashmdash2014 World development indicators World Bank Washington DC available at dataworldbankorgdata-catalogworld-development-indicators
36
mdashmdash2013 Transport in Indonesia World Bank Washington DC available at goworldbankorgPF2AFG64V0
mdashmdash 2012a Raskin subsidised rice delivery Public expenditure review (PER) Social assistance program and public expenditure review no 3 World Bank Washington DC available at documentsworldbankorgcurateden20120215893857raskin-subsidized-rice-delivery
mdashmdash2012b Targeting poor and vulnerable households in Indonesia World Bank Washington DC available at documentsworldbankorgcurateden20120115879773targeting-poor-vulnerable-households-indonesia
mdashmdash2011 Indonesia Agriculture Public Expenditure Review 2010 World Bank Jakarta available at documentsworldbankorgcurateden20110919456223indonesia-agriculture-public-expenditure-review-2010
mdashmdash2010 Completing decentralization World Bank Jakarta available at documentsworldbankorgcurateden20100112012453completing-decentralization
mdashmdash2009 Investing in a more sustainable Indonesia Country Environmental Analysis Report No 50762-ID World Bank CEA Series East Asia and Pacific Region available at openknowledgeworldbankorgbitstreamhandle109863135507620v20Revis1ox0info10CEA1englishpdfsequence=1
mdashmdash2007 Horticultural producers and supermarket development in Indonesia World Bank Washington DC available at documentsworldbankorgcurateden2007068235822horticultural-producers-supermarket-development-indonesia
WTO 2013 Trade policy review Indonesia WTO Document WTTPRS278 World Trade Organisation Geneva available at wtoorgenglishtratop_etpr_etp378_ehtm
Yamauchi F 2014 Wage Growth Landholding and Mechanization in Agriculture Evidence from Indonesia World Bank Washington DC February available at openknowledgeworldbankorghandle1098617324
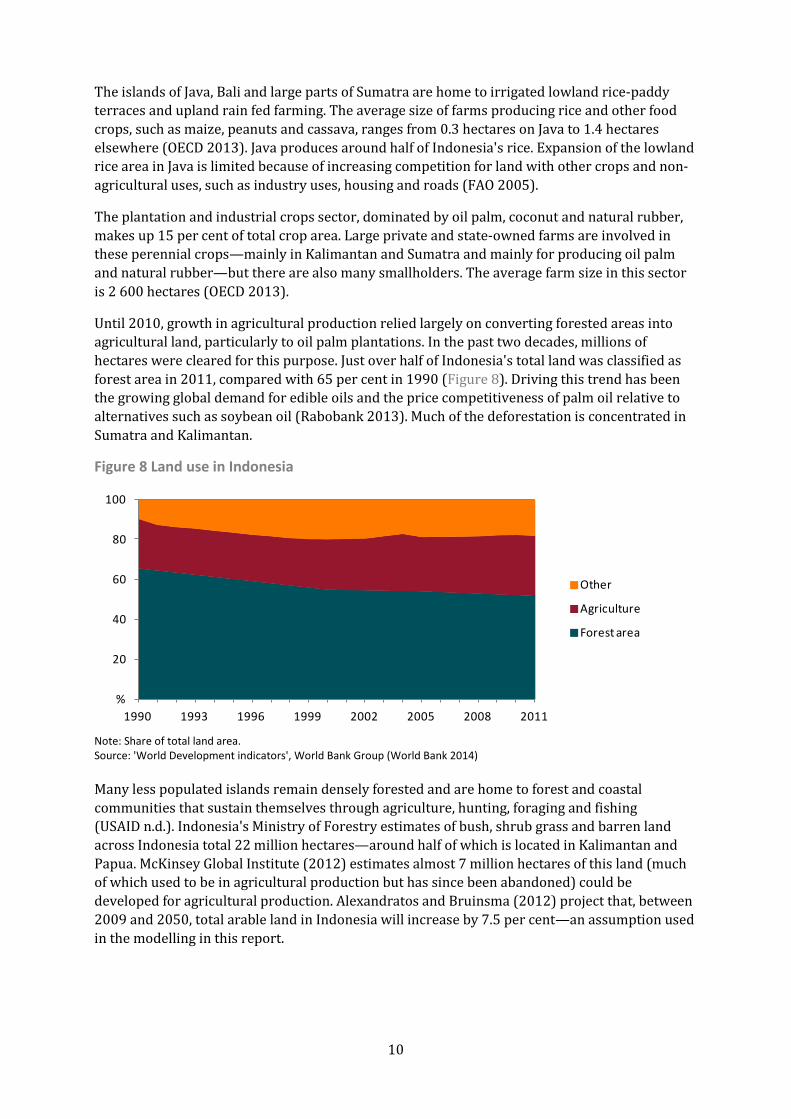
10
The islands of Java Bali and large parts of Sumatra are home to irrigated lowland rice-paddy terraces and upland rain fed farming The average size of farms producing rice and other food crops such as maize peanuts and cassava ranges from 03 hectares on Java to 14 hectares elsewhere (OECD 2013) Java produces around half of Indonesias rice Expansion of the lowland rice area in Java is limited because of increasing competition for land with other crops and non-agricultural uses such as industry uses housing and roads (FAO 2005)
The plantation and industrial crops sector dominated by oil palm coconut and natural rubber makes up 15 per cent of total crop area Large private and state-owned farms are involved in these perennial cropsmdashmainly in Kalimantan and Sumatra and mainly for producing oil palm and natural rubbermdashbut there are also many smallholders The average farm size in this sector is 2 600 hectares (OECD 2013)
Until 2010 growth in agricultural production relied largely on converting forested areas into agricultural land particularly to oil palm plantations In the past two decades millions of hectares were cleared for this purpose Just over half of Indonesias total land was classified as forest area in 2011 compared with 65 per cent in 1990 (Figure 8) Driving this trend has been the growing global demand for edible oils and the price competitiveness of palm oil relative to alternatives such as soybean oil (Rabobank 2013) Much of the deforestation is concentrated in Sumatra and Kalimantan
Figure 8 Land use in Indonesia
Note Share of total land area Source World Development indicators World Bank Group (World Bank 2014)
Many less populated islands remain densely forested and are home to forest and coastal communities that sustain themselves through agriculture hunting foraging and fishing (USAID nd) Indonesias Ministry of Forestry estimates of bush shrub grass and barren land across Indonesia total 22 million hectaresmdasharound half of which is located in Kalimantan and Papua McKinsey Global Institute (2012) estimates almost 7 million hectares of this land (much of which used to be in agricultural production but has since been abandoned) could be developed for agricultural production Alexandratos and Bruinsma (2012) project that between 2009 and 2050 total arable land in Indonesia will increase by 75 per centmdashan assumption used in the modelling in this report
20
40
60
80
100
1990 1993 1996 1999 2002 2005 2008 2011
Other
Agriculture
Forest area
11
Land degradation Indonesia is regularly described as being a highly fertile country but land quality varies across the archipelago The central islands have more fertile soils and hence are densely populated Agricultural land in Java in particular has benefited from high levels of mineral fertiliser application soil and water erosion control programmes and relatively good soil (FAO 2005) In contrast the soils of the outer less populated islands are characterised by highly weathered acidic soils that require higher fertiliser inputs to achieve the high crop yields obtained in Java and the other central islands Actual fertiliser use in the outer islands is generally lower than on Java resulting in soil nutrient depletion in the upland crop areas (FAO 2005)
Erosion and associated problems of nutrient depletion are minimal on Java because of the system of flat terracing and well-maintained irrigation schemes However in the lower-potential rain fed uplands where crops such as maize and cassava are produced on sloping hillsides erosion problems and nutrient depletion are more prevalent Where deforestation has occurred to make way for plantation crops loss of forest cover has led to watershed degradation silting of waterways flooding soil erosion and decline in soil quality and soil productivity (World Bank 2009)
Land tenure Land parcels in Indonesia are highly fragmented particularly on smallholder farms As land is passed down the generations it tends to become divided into smaller parcels (McKinsey Global Institute 2013) While the law requires that all land rights be registered most of these inherited parcels are unregistered less than 25 per cent of rural land parcel holders have been registered in the 40 years since land registration began (OECD 2012b) Additionally a large share of land off Java is communal rather than privately titled Land rights of these communities are often not formally recognised increasing the risk of conflict
The implications of the land tenure arrangements are that for large investors gaining access to land is a long and unclear process As a result only limited land rights are granted which compromises the extent to which production can increase (OECD 2012b) For smallholders unclear land tenure or nonexistence of certificated land registration compounds the difficulties of gaining access to credit from financial institutions This discourages investment in productivity-enhancing technology and biases farmers choices away from longer-term activities such as tree crops (World Bank 2010)
Fertiliser use The Indonesian Government maintains a ceiling price on fertiliser which depending on fertiliser type is between 50 per cent and 75 per cent lower than the market price (Sudaryanto 2014) Lower fertiliser prices are intended to encourage increased crop production particularly of rice The government provides a subsidy to fertiliser manufacturers to compensate them for selling fertiliser below market prices Despite the subsidy payment the incentives for fertiliser manufacturers to increase production and compete with one another are limited by government regulation of production quantities prices and locations where fertiliser can be sold (Osorio et al 2011)
The use of fertiliser is unevenly distributed across the archipelago Among food crops the highest application rates per hectare are for rice followed by maize and soybeans The lowest are for peanut and cassava The subsidy and resulting increase in fertiliser use led to more than a doubling of rice production between 1970 and 2000 Over that period total annual fertiliser
12
use increased from 635 000 tonnes to 59 million tonnes more than half of which was used to increase rice production (FAO 2005)
Fertilisers remain underused on plantation crops Large areas of plantation crops are owned and managed by smallholder farmers For many the lack of knowledge about appropriate fertilisation technology and the lack of reliable and timely access to the right fertilisers at village level lead to inadequate and unbalanced application (FAO 2005)
Apart from the budgetary burden subsidising domestic fertiliser prices results in inefficient fertiliser use at the farm level Studies in West Java report rice farmers applying levels of fertilisers higher than the recommended rates with some soil tests showing nutrient reserves had built up to high levels negatively affecting yields (FAO 2005 Osorio et al 2011)
Farm labour and mechanisation Indonesian agriculture is dominated by abundant labour in relation to available agricultural land contributing to the issue of small-scale production The agriculture forestry and fishing sector employs around 40 million people or 35 per cent of the workforce (15 years and over) and is the main source of employment in rural areas (Indonesian Central Bureau of Statistics 2015c McKinsey 2012) The proportion of landless and land-poor agricultural households is especially high on Java Of more than 17 million households on Java characterised as farmer or agricultural labourer households 39 per cent neither lease nor own any crop land and another 44 per cent lease or own less than 05 hectares (USAID nd)
Tradition is one obstacle to agricultural development in Indonesia (Shahaf 2009) In many cases farmers grow the same crops as previous generations using the same such methods and tools Sometimes two or three generations work the same farm
Traditionally particularly in Java harvesting is undertaken primarily by manual labour (Yamauchi 2014) Machines are rarely used However outside Java the emergence of larger scale farmers had led to operations scaling up through mechanisation This has contributed to a rise in farm labour productivity since 2000 (Figure 9)
Figure 9 Agriculture value added per farm worker Indonesia
Source World Development indicators World Bank Group (World Bank 2014)
Currently tractors are used for land preparation activities such as primary and secondary tillage while seeding and planting activities continue to be done manually Threshers are used in more developed areas where agricultural labour has become scarce as a result of competitive wages in other industries
2005 US$
200
400
600
800
1 000
1 200
1980 1984 1988 1992 1996 2000 2004 2008 2012
13
Wage growth in recent years may have led to the introduction of labour saving practices among relatively large farmers such as renting more land and acquiring machinery (Yamauchi 2014) In contrast small farmers have not significantly changed their behaviours
Infrastructure As the worlds largest archipelago Indonesias insufficient and poor quality infrastructure is a major challenge for connectivity between the islands High transport costs also undermine the competitiveness of agricultural industries and associated supply chains (Rabobank 2013 OECD 2012b) With most transport developments concentrated in Java access to markets for the rest of Indonesia is poor
Ninety per cent of freight and 80 per cent of passenger traffic in Indonesia moves by road However roads are heavily congested and their quality in urban and provincial areas is poor (The Canadian Trade Commissioner Service 2011) Because connectivity with markets is compromised by an inadequate road system returns to agricultural producers are often discounted because of spoilage incurred during transport (Global Business Guide Indonesia 2012)
Indonesia has around 300 ports spread throughout the archipelago Inter-island shipping consisting of ferry and cargo shipping services accounts for around 60 per cent of total seaborne cargo in the country (World Bank 2013) Seaports in Indonesia are outdated and investment in port facilities has not matched the rapid growth of traffic moving through them As a result inefficiencies in the shipping system such as bottlenecks and delays in cargo handling are common Vessels also often leave the main port Tanjung Priok before they are fully loaded to keep to published schedules (The Canadian Trade Commissioner Service 2011)
Current infrastructure does not support internal trade well and challenges Indonesiarsquos ability to provide its own food to its own people Developing an efficient transport and logistics system would not only increase the competitiveness of Indonesias external trade but would also provide easier and cheaper access for local agricultural products to domestic markets with reduced losses through spoilage Until this is achieved Indonesian supply chains will continue to be uncompetitive inefficient and looking to other markets to satisfy agrifood demand particularly in urban centres
Water availability While Indonesias water supplies may be sufficient for current agricultural production deterioration of the existing irrigation infrastructure and investment constraints to improve or develop new infrastructure may limit Indonesias future water availability given rapid urbanisation and food demands
Growing municipal water needs and the needs of the agriculture sector to increase production to meet the demands of urban consumers is likely to result in water shortages in coming decades The McKinsey Global Institute projects that by 2030 water supplies will fall short of demand by around 18 per cent (McKinsey 2012) Significant investment is required to improve water productivity and reduce water transmission losses through rehabilitating old and damaged irrigation infrastructure Up to half of Indonesias piped water supply is estimated to be lost in transmission (McKinsey 2012)
Feed availability Increasing demand for meat protein has stimulated the establishment of large scale commercial poultry farms and beef cattle feedlots Data from the Indonesian Feed Millers Association show
14
the poultry industry consumes 83 per cent of Indonesias animal feed the aquaculture industry consumes 11 per cent and cattle and pig industries the remaining 6 per cent (USDAndashFAS 2014)
On average Indonesias livestock feed is composed of maize (50 per cent) soybean meal (15 to 20 per cent) rice bran (15 per cent) wheat pollard (8 per cent) fish meal (5 per cent) maize gluten meal (3 per cent) and crude palm oil (2 per cent) (USDAndashFAS 2014) While most maize is sourced domestically inconsistent seasonal supplies and storage challenges such as high moisture content and aflatoxin levels are major factors that are leading feed millers to import increasing quantities of maize Canola meal is being used increasingly in poultry diets as a cost competitive alternative to soybean meal However its use is restricted to less than full replacement of soybean meal because of canolarsquos lower energy and protein content and the presence of antinutritional factors such as lower amino acid digestibility than in soybean meal (Khajali and Slominski 2012) Apart from maize and agri-industrial by-products such as rice bran copra meal and palm kernel meal other feed ingredients are largely imported (Table 3)
In food crop producing areas fibrous agricultural residues have become the main feed source for ruminant animals raised by small scale livestock producers Rice straw is fed as a base roughage but additional good quality feedstuff or concentratesmdashsuch as leaves and stalks of cassava leaves of maize and sugarcane leaves stems and peelings of banana rice bran pods and peelings of cacao and the fronds pressed fibre and palm kernel cake from oil palmmdashare required to gain higher production performance (Djajanegara 1999) Such feeds are available in various locations but their unequal distribution and high prices at the farm level limit their use by smallholder farmers Lack of storage and labour shortages during harvest time also restrict the collection of rice straw These limitations as well as the seasonal nature of these feedstuffs affect continuity of supply and therefore the productivity potential of smallholder livestock producers
Table 3 Indonesian animal feed sources of primary ingredients
Feed ingredient Local share () Imported share ()
Maize 90ndash95 5ndash10
Fish meal 5ndash10 90ndash95
Meat and bone meal (MBM) 0 100
Soybean meal 0 100
Rapeseed meal 0 100
Maize gluten meal 0 100
Feed additive 0 100
Rice bran 100 0
Copra meal 100 0
Palm kernel meal 100 0
Crude palm oil (CPO) 100 0 Source Indonesia grain and feed annual report 2014 United States Department of Agriculture (USDAndashFAS 2014)
Productivity There has been significant growth in the volume of total agricultural output in Indonesia over the past 50 years although the rate of growth has varied markedly over the decades The contribution of increased total factor productivity (TFP) to total agricultural output growth (including food crops and non-food cash crops) was strong during the 1960s and 1970s as new
15
technologies and improved crop varieties were widely adopted during the green revolution (Table 4) (Fuglie 2010 2012) In the 1980s land and labour use expanded enabling total agricultural output to grow but TFP growth slowed During the 1990s average agricultural output growth declined to less than 2 per cent a year as the green revolution crop varieties had already been widely adopted and no newer higher yielding varieties were suitable or available However TFP growth was stronger than the previous decade
Table 4 Average annual food and non-food agricultural output and total factor productivity growth Indonesia
Years Agricultural output Agricultural TFP
1961ndash1970 271 175
1971ndash1980 334 140
1981ndash1990 464 059
1991ndash2000 187 099
2001ndash2009 486 368 Note Agricultural output measured in volume Source Fuglie 2012
Between 2001 and 2009 strong output and TFP growth resumed for a number of reasons Newly available crop land achieved by the clearing of forested areas supported the expansion and diversification of agriculture into higher value non-staple commodities such as tropical perennials horticulture and livestock At the same time the relatively low price of fertilisers and chemicals available to producers led to a 50 per cent increase in their use between 2002 and 2009 (Figure 10) resulting in a marked improvement in crop yields compared with the previous decade (OECDndashFAO 2014) Improved literacy and education of the farm labour force also contributed to productivity growth (OECD 2012b)
Figure 10 Total fertilizer use in Indonesia by type
Note 2001 data not available Source FAOSTAT Food and Agriculture Organization of the United Nations (FAO 2015)
TFP estimates do not exist for the period since 2010 While yield growth is not as robust a measure of technical change as TFP yield trends can provide a partial indication of changes in productivity Average annual yield growth between 2011 and 2013 was lower than in the
Mt
1
2
3
2002 2003 2004 2005 2006 2007 2008 2009
Nitrogen
Potash
Phosphate
16
periods 2001ndash05 and 2006ndash10 across a range of food and non-food crops (Table 5) A number of factors explain this slowdown The rate of conversion of forest land to cropping slowed significantly reducing the rate of agricultural output growth achieved through additional agricultural land (OECD 2012b) In addition the sustained overuse of fertilizers and chemicals throughout the 2000s has led to decreasing returns to scale for these intermediate inputs As a result any future increase in the productivity of food and non-food crops is unlikely to be achieved through the application of chemicals or fertilisers
Table 5 Average annual yield growth of food and non-food cash crops Indonesia
Commodity Unit 1991-95 1996-00 2001-05 2006-10 2011-13
Food crops
Rice 02 03 08 19 09
Maize 12 42 46 52 30
Cassava -06 15 50 49 36
Mung beans -03 -67 44 23 -02
Soybeans 04 17 11 11 12
Groundnuts -34 58 15 16 02
Vegetables a 93 -08 35 -17 -68
Cash crops
Rubber na -01 45 58 48
Crude palm oil na -72 108 -06 12
Palm kernel na -104 120 08 -10
Cocoa na 05 143 21 -30
Coffee na 24 14 62 37
Tea na 02 30 -05 -11 a Vegetable data available to 2012 Source FAOSTAT Food and Agriculture Organization of the United Nations (FAO 2015)
With reduced scope for expansion in agricultural production through both conversion of forest land and increased use of fertilisers and chemicals future agricultural productivity growth is likely to be achieved through the more efficient use of inputs The dominance of smallholdings remains a constraint to achieving higher agricultural productivity growth in future as small plots impede the implementation of more productive practices This is compounded by inefficient fertiliser use limited mechanisation and an inadequate supply of other important inputs such as high-yielding seeds irrigation systems extension services and access to credit Addressing these issues will be key to future productivity trends
17
4 Indonesian agricultural and food policies
The objectives of Indonesias agricultural policy as stated by the Indonesian Ministry of Agriculture in 2010 are to
1) achieve food self-sufficiency
2) enhance diversification of production and consumption
3) raise the competitiveness and value added of production and
4) increase farmersrsquo welfare (OECD 2012b)
To achieve its objectives the Indonesian Government intervenes in the farm sector with multiple policy instruments The government also implements policies to protect consumers from fluctuations in prices of key food products such as wheat rice and vegetable oils and to insulate domestic producers from foreign competition Food for consumers is subsidised which effectively maintains the price of food within a narrow price band Producers benefit from tariffs applied to imported food which keep the price of domestically produced food competitive with imports Additionally producers are directly supported by government food purchases at guaranteed prices and subsidies on farm inputs such as fertiliser seed and farm equipment
Policies to support agricultural production Reference prices and import restrictions The Indonesian Government sets reference prices for rice sugar and beef which it aims to maintain through various policy instruments
On average around 70 per cent of domestic rice production is consumed within the farming household (OECD 2012b) The remainder is sold through either private or government-run channels such as Indonesias National Food Logistics Agency known as Badan Ursan Logistik (BULOG) BULOG purchases a limited amount of rice at the reference price to fulfil two objectives
1) stockholding for emergency purposes and
2) redistribution as part of the consumer subsidy programme Raskin (discussed below) (OECD 2012b)
In 2010 BULOG procured around 6 per cent of total domestic rice production equivalent to around 20 per cent of all marketed rice (OECD 2012b)
For sugar the government supports the producer price by imposing legal requirements on domestic sugar millers who control the domestic sugar market Sugar millers are required to purchase 75 per cent of their sugar cane requirements from domestic sugar cane growers and to pay growers a government-determined price
The Indonesian rice and sugar industries are also protected by import restrictions Companies that import rice and sugar are required to support the domestic industry by buying domestically produced product if the mill price falls below the reference price
18
For beef and live cattle imports the Indonesian Government sets a reference price which it aims to achieve by managing import volumes through an import permit system Since 2014 the reference price has been 76 000 rupiah (A$720) a kilogram Under the system import permits are not issued if domestic beef prices fall below the reference price (ABARES 2013) Weight restrictions on cattle imports also usually apply limiting imports to young lighter cattle destined for feedlots
The Indonesian Government also restricts imports of other commodities such as soybeans maize horticulture certain processed foods and animals and animal products (including fresh chilled and frozen meat and eggs) Importing these commodities is generally not permitted if the Ministry of Trade considers it will cause injury to the domestic industry (WTO 2013) Companies seeking to import these commodities are required to gain approval from the Indonesian Ministry of Trade (OECD 2012b)
Tariffs Tariffs are applied to most imported food products in Indonesia However they are relatively low and are not a major policy instrument used to protect domestic industries The average applied agricultural tariff was 53 per cent in 2010 (OECD 2012b) Around 85 per cent of agricultural imports are subject to tariffs between zero and 5 per cent with almost 66 per cent entering duty free All agricultural tariffs are ad valorem except for rice and sugar which have specific tariffs (OECD 2012b)
While applied tariffs are low bound tariff rates or the ceiling rate that can be applied under World Trade Organisation rules remain high (Figure 11) On average the bound rate on agricultural products is 47 per cent (OECD 2012b) The highest bound tariff is 210 per cent for milk powders although the applied rate is just 5 per cent Rice has a bound tariff of 160 per cent and an applied specific rate of 450 rupiah a kilogram (equivalent to an ad valorem tariff of 10 per cent when using the average export price for 15 per cent broken rice from Thailand in 2010) (OECD 2012b)
Figure 11 Average bound and applied tariffs by product groups
Source OECD Review of Agricultural Policies Indonesia 2012 Organisation for Economic Co-operation and Development (OECD 2012b)
0
20
40
60
80
Fruit and vegetables
Sugars and confectionery
Cereals Dairy products
Animals and animal
products
Oilseeds fats and oils
Average bound tariff
Average applied tariff
19
Input subsidies The Indonesian Government supports farmers by subsiding inputs such as fertiliser seeds and ad hoc products including power tools and rice milling units Fertiliser support is the largest component of budgetary support for agriculture accounting for 37 per cent in 2008ndash09 (OECD 2012b) Not all farmers receive input subsidies because eligibility requirements apply in many cases For example subsidised fertiliser is only available to farmers producing on less than 2 hectares
Policies to support consumers Price intervention The Indonesian Government intervenes in the domestic market for wheat flour maize and cooking oil when it considers retail prices too high for the poor It does this using a broad range of measures from simply asking manufacturers and wholesalers to be socially responsible with their pricing to purchasing these products and distributing them directly to poor households (OECD 2012b) Another policy often used is the government covered value tax under which the government waives the existing 10 per cent value added tax on the final price of certain food items For example the government has used this policy to reduce the price of non-branded cooking oil since 2007 In 2010 this policy cost the Indonesian Government around 250 billion rupiah (A$299 million)
Food subsidies The Indonesian Government operates a targeted rice subsidy programme known as Raskin to combat food insecurity The programmes objective is to make available a set quantity of rice (procured by BULOG) at a subsidised price to Indonesias poorest households on a monthly basis Raskins intention is to provide rice to those on official lists of households living under or near the national poverty line (World Bank 2012b) The poverty line in 2014 was around 318 500 rupiah per person a month in urban areas and 286 100 rupiah per person a month in rural areas (Indonesian Central Bureau of Statistics 2015a) Those with incomes within 20 per cent of the poverty line are defined as being near the poverty line (World Bank 2012b)
Despite the objectives of Raskin to target the most vulnerable since allocations of Raskin rice to households are decided by local authorities poor and non-poor households alike benefit from the programme In 2010 around 175 million households received Raskin rice (OECD 2012b) at a cost of around 14 trillion rupiah (A$17 billion) to the Indonesian Government (Figure 12) Between 2005 and 2010 the subsidised price was 1 600 rupiah (A$019) a kilogram representing about 20 to 25 per cent of the average market price (World Bank 2012a)
The quantity of rice per household the subsidised price the number of months a year that rice is distributed and the classification of the poorest households have all been altered over the period of the programme For example monthly allocations per household have been set as low as 10 kilograms and as high as 20 kilograms over the programme period although households rarely benefit from the full amount of the allocation (OECD 2012b World Bank 2012a)
20
Figure 12 Raskin rice distribution and budgetary cost
Source OECD Review of Agricultural Policies Indonesia 2012 Organisation for Economic Co-operation and Development (OECD 2012b)
Implications of agricultural and food policies Public expenditure on Indonesian agriculture has increased under its current policy settings In 2009 public spending was around 615 trillion rupiah (A$75 billion) This was equivalent to 56 per cent of total government expenditure compared with 27 per cent in 2001 (World Bank 2011) The fertiliser subsidy and Raskin have been the biggest drivers of increased spending over this period
In addition to the direct budget cost of Indonesias agricultural and food policies there have also been allocative effects Indonesian policies tend to focus on rice maize and sugar leading to increased production of these commodities and improved availability from domestic sources However expansion of these crops has come at the expense of horticulture and other commodities in which Indonesia has a comparative advantage such as natural rubber cocoa and spices (World Bank 2011)
The administration of some support programmes the fertiliser subsidy in particular is inefficient (Sudaryanto 2014) As discussed in Chapter 3 subsidising fertiliser companies in an environment where quantities prices and distribution channels are regulated reduces incentives for these companies to effectively compete This inefficiency has resulted in the under-production of fertiliser leading to shortages At the same time the artificially low price has led to an over-reliance on fertiliser by producers to increase yield rather than using other methods such as improved seeds (World Bank 2011)
4000
8000
12000
16000
2000 2002 2004 2006 2008 20100
1
2
3
4
Expenditure on RASKIN
Quantity of rice distributed (right axis)
Million tonnes
Billionrupiah
21
5 Simulation results Baseline assumptions The objective in this analysis is to identify and quantify projected changes in Indonesian demand for a range of agrifood commodities over the longer term across urban and rural households An updated version of the ABARES agrifood model (Linehan et al 2012a) is used to investigate these potential trends The model has been modified to include Indonesias consumer subsidy policy (Raskin) and a re-aggregation of some country and commodity groups to allow more detailed analysis
Indonesia has a comparative advantage in the production of many cash crops and non-food agricultural commodities that are not included in the ABARES agrifood model such as natural rubber copra palm kernels coffee cocoa and spices (FAO 2013) In Indonesia the production of these commodities competes with food commodities for resources despite a policy environment targeted at food production and food self-sufficiency
Given Indonesias limited supply of arable land and the quality and availability of its water supply the capacity of the domestic agricultural sector to meet the growing demand for food in Indonesia will depend heavily on improvements in productivity Total factor productivity (TFP) growth in Indonesian agriculture is estimated to have averaged 154 per cent a year since 1961 It is expected that yield growth in Indonesia will not decline from this average annual rate in the future because the potential for productivity growth remains significant However nor is it expected to continue at the relatively high rates estimated for the period 2001 to 2009 which were made possible from the expansion of agriculture into higher-value non-staple commodities on newly deforested land and a significant increase in the use of chemical fertilisers (see Chapter 4)
Productivity growth since 2010 is estimated to have slowed from the decade 2001ndash2009 The Indonesian Governments policy initiative Reducing Emissions from Deforestation and Forest Degradation (REDD) in 2010 and declaration of a two-year Forest Moratorium in 2011 have slowed the rate of forest conversion to crop land (OECD 2012b) In addition agricultural production continues to be constrained by the issues outlined in Chapter 4 (including decreasing returns to scale for chemical inputs lack of widespread mechanisation and deteriorating resource base) With ongoing competition between the production of food crops and non-food cash crops (in which Indonesia has a comparative advantage) and little prospects in the foreseeable future for major policy changes on food consumption and production TFP growth for food crops in Indonesia is assumed to average 154 per cent a year between 2009 and 2050 This is close to the forecast by Ludena et al (2007) of 152 per cent a year to 2040 (FAO 2013 USDAndashFAS 2014)
Growth rates for TFP for individual commodities have in the past shown similar patterns to growth in yields Assumptions of TFP growth rates for individual commodities are therefore derived by apportioning the assumed rate for the whole of agriculture by historical growth in the yields of each commodity (Table 6)
22
Table 6 Average annual TFP growth rate by industry in Indonesia 2009 to 2050
Industry
Rice 214
Maize 337
Coarse grains 335
Other cereals 239
Oilseeds 388
Vegetables 232
Fruit 303
Beef 032
Sheep and goat meat 144
Poultry 144
Eggs 135
Dairy 215
All Agriculture 154 Source ABARES model assumption
In the reference case no change to Indonesias market support policies is assumed over the projection period On the production side these include the principal forms of market support of state trading input subsidies and import restrictions Additionally the Indonesian Governments minimum support prices for rice and wheat are maintained in real terms as are other ad hoc interventions on a range of agricultural commodities
The government support received by consumers through the consumer subsidy policy Raskin is also maintained in real terms over the projection period (discussed in Chapter 4)
The baseline projections determined in the agrifood model for Indonesia are also dependent on a set of assumptions discussed in Chapters 2 and 3 To summarise
bull population growth is assumed to average 07 per cent a year between 2010 and 2050
bull the proportion of the population in urban areas is assumed to increase from 50 per cent in 2009 to 72 per cent by 2050
bull average annual GDP growth in Indonesia is assumed to average 53 per cent a year between 2010 and 2030 before weakening between 2030 and 2050 to average 34 per cent a year (Table 1)
bull average annual income growth is assumed to be 56 per cent a year in urban areas and 21 per cent a year in rural areas
agricultural productivity in Indonesia is assumed to continue to increase according to the growth estimates provided in Table 6
The population is divided into two income stratamdashurban income and rural income households Across these two household types the income growth assumptions to 2050 for urban and rural areas are based on historical income data from the Indonesian Central Bureau of Statistics (2011) These data demonstrate that not only is average urban income higher than average rural income but with urbanisation average income growth in urban areas has also been higher than
23
in rural areas This has been the result of a relatively faster rate of economic development and higher wages which have stemmed from the growth in the manufacturing and services sectors prevalent in urban areas The model assumes this trend in income growth will continue to 2050 Indonesian household food consumption data in the base year of the model are from the Indonesian Central Bureau of Statistics (2014) and Widarjono (2012) These data were used as the basis in the model to project food consumption across urban and rural households to 2050
In the model total and per person Indonesian food consumption and total urban and rural food consumption is apparent consumption which reflects the total use of agrifood products (food feed and industrial use) In contrast per person urban and rural consumption is direct food consumption only it excludes feed use and industrial use of agrifood products to better reflect changes in diets
Consumption The real value of total food consumption in Indonesia (including food feed and industrial use) is projected to quadruple between 2009 and 2050 to US$327 billion (in 2009 US dollars) The largest increases are for meat dairy products fruit and vegetables as real incomes increase (Figure 13) Together these commodities account for two-thirds of the projected rise in the real value of food consumption
Figure 13 Consumption of selected agricultural commodities Indonesia
Note Starchy staples include pulses yams potatoes and cassava Source ABARES model output
Between 2009 and 2050 the real value of Indonesian beef consumption is projected to rise more than 14 times to US$35 billion (in 2009 US dollars) dairy products ten times to almost US$9 billion and fruit and vegetables more than three times to US$50 billion and US$25 billion respectively For many commodities the value of consumption in 2050 is projected to rise from a very low base reflecting high poverty rates and a large rural population in 2009 By 2050 72 per cent of the population is projected to live in urban centres with higher incomes than the
10 20 30 40 50 60
Wheat
Sheep and goat meat
Dairy
Sugar
Oil crops
Rice
Vegetables
Starchy staples
Beef
Poultry
Fruit
2050
2009
Billion(2009 US$)
552
66
231
1311
269
1319
256
246
935
1340
113
24
rural cohort It is this expected transition of the population and income growth that drive the magnitude of projected consumption growth for many commodities Despite these large increases Indonesias per person food consumption in 2050 is projected to remain below that of China for many commodities (Hamshere et al 2014)
For cereals oil crops and starchy staples (pulses potatoes yams and cassava) consumption is also projected to increase Between 2009 and 2050 the real value of rice consumption is projected to rise by 66 per cent to nearly US$23 billion (in 2009 US dollars) maize by 182 per cent to US$8 billion oil crops by 246 per cent to US$22 billion and starchy staples by 256 per cent to almost US$29 billion Over this period the real value of sugar consumption is projected to rise more than six times to US$14 billion (in 2009 US dollars)
The projected rise in consumption of cereals oil crops and starchy staples is driven by a number of factors First cereals and starchy staples (such as cassava) are relatively affordable foods particularly for low and middle income consumers whose populations are projected to rise Although both cereals and starchy staples will remain important components of Indonesian diets to 2050 their relative contribution will decline as diets become more diversified with greater amounts of meats dairy products and fruit and vegetablesmdashthe continuation of a trend that began around 1990 (Figure 5)
The projected rise in consumption of cereals oil crops and starchy staples is also driven by feed requirements which will increase as the demand for meat protein rises to 2050 As discussed in Chapter 3 about 50 per cent of domestic maize production is used as feed Rice bran also comprises about 15 per cent of total Indonesian feed consumption Soybean meal comprises between 15 per cent and 20 per cent of total livestock feed all of which is imported Rapeseed meal can be used as a partial substitute for soybeans and it too is entirely imported In 2050 it is projected that feed use will account for around 42 per cent of total maize consumption 43 per cent of total oil crop consumption and 44 per cent of total starchy staple consumption a larger proportion of which will need to be imported compared with 2009
Urban and rural consumption In 2050 71 per cent of Indonesias population is projected to live in urban areas compared with 54 per cent in 2015 (United Nations Population Division 2014) By 2050 Indonesian consumers are projected to have more diverse diets with greater consumption of meat dairy products fruit and vegetables
In this section the results for total urban and rural consumption reflect apparent consumption However per person rural and urban consumption is direct food consumption only Feed use and industrial use of the agrifood products are excluded in the per person results in order to better understand the projected change in diets
High value commodities Urban consumers account for most of the growth in consumption of meat dairy products fruit and vegetables over the projection period because of rising urban populations and incomes Between 2009 and 2050 the real value of urban beef consumption is projected to rise more than 18 times to US$34 billion (in 2009 US dollars) Consumption of dairy products is projected to rise by more than 14 times to more than US$8 billion and fruit and vegetables more than four times to US$43 billion and almost US$21 billion respectively (Figure 14)
25
Figure 14 Urban consumption of selected agricultural commodities Indonesia
Source ABARES model output
In per person terms the value of urban beef consumption is projected to rise more than nine times between 2009 and 2050 dairy more than seven times and fruit and vegetables to more than double However consumption of rice is projected to fall by 4 per cent While these increases are large Indonesias urban per person consumption in 2050 is still projected to be lower than that of China in the same year for many commodities including vegetables (73 per cent lower) oilseeds (12 per cent) dairy products (41 per cent) and sheep and goat meat (24 per cent) In contrast Indonesias urban per person consumption is projected to be higher than Chinas for beef (52 per cent higher) sugar (400 per cent) cereals (23 per cent) and starchy staples (14 times higher) (Hamshere et al 2014) For beef higher Indonesian per person consumption relative to China in 2050 reflects the dominance of beef in Indonesian diets by that time compared with China where pig meat consumption is significant Similarly the projected rise in per person consumption of starches in Indonesia mainly reflects higher consumption of cassava a culturally important food crop
For rural consumers total growth in consumption of meat dairy products fruit and vegetables is lower than for urban households This can be attributed to relatively lower rural incomes and a decline in the absolute size of the rural population Between 2009 and 2050 total rural beef consumption is projected to rise by 95 per cent to more than US$1 billion (in 2009 US dollars) dairy products by 75 per cent to US$05 billion fruit by 41 per cent to almost US$7 billion and vegetables by 42 per cent to almost US$5 billion (Figure 15)
20 40 60
Wheat
Sheep and goat meat
Dairy
Sugar
Oil crops
Rice
Vegetables
Starchy staples
Beef
Poultry
Fruit
Billion(2009 US$)
387
1724
1734
426
875
370
547
1349
Total food consumption
1761
91
173
50 100 150 200
Wheat
Sheep and goat meat
Dairy
Sugar
Oil crops
Rice
Vegetables
Starchy staples
Beef
Poultry
Fruit
2009 US$
145
819
824
165
391
137
226
630
Per person consumption
837
-4
38
26
Figure 15 Rural consumption of selected agricultural commodities Indonesia
Source ABARES model output
Between 2009 and 2050 rural per person consumption of each of the agrifood commodity groups is projected to change by a similar magnitude as urban consumption In value terms rural per person consumption of beef is projected to rise by 162 per cent dairy products by 135 per cent fruit by 90 per cent and vegetables by 92 per cent Similar increases are projected for rice (96 per cent) wheat (128 per cent) and starchy staples (116 per cent)
Again despite these significant increases rural per person consumption in Indonesia is projected to be lower than that of China in 2050 for all products except sugar which is projected to be 117 per cent higher For all other commodity groups rural per person consumption is projected to be lower than in China including sheep and goat meat (85 per cent lower) dairy (54 per cent) starches (32 per cent) cereals (56 per cent) and vegetables (86 per cent)
For both rural and urban consumers the rise in the real value of total food consumption in 2050 is principally the result of an increase in the quantity consumed rather than a projected significant rise in the real price This is especially pronounced in urban households For example between 2009 and 2050 beef consumption by urban households is projected to rise by more than 15 times and sheep and goat meat by 13 times In contrast rural beef consumption over this period is projected to rise by 64 per cent and sheep and goat meat by 44 per cent
Projected consumption growth of cereals and starchy staples between 2009 and 2050 is most pronounced in urban areas Rising urban consumption of these commodities is largely the result of population growth Urban consumption of wheat is projected to rise by 173 per cent to around US$2 billion (in 2009 US dollars) rice by 91 per cent to US$9 billion and starchy staples (which includes pulses potatoes yams and cassava) by 426 per cent to US$13 billion
Rural consumption of cereals and starchy staples is projected to rise despite a falling rural population As incomes rise towards 2050 the relatively affordable prices of these commodities will drive rural consumption Between 2009 and 2050 rural consumption of wheat is projected
2 4 6 8 10
Wheat
Sheep and goat meat
Dairy
Sugar
Oil crops
Rice
Vegetables
Starchy staples
Beef
Poultry
Fruit
Billion(2009 US$)
94
95
61
96
42
101
Total consumption
41
75
98
45
69
50 100 150 200
Wheat
Sheep and goat meat
Dairy
Sugar
Oil crops
Rice
Vegetables
Starchy staples
Beef
Poultry
Fruit
2050
2009
2009 US$
90
161
162
116
165
92
170
135
Per person consumption
166
96
128
27
to rise by 69 per cent to US$1 billion (in 2009 US dollars) rice by 45 per cent to almost US$9 billion and starchy staples by 61 per cent to US$3 billion
Production and trade The real value of Indonesias total agrifood production (which includes production for food feed and industrial use) is projected to more than double from US$81 billion in 2009 to US$173 billion in 2050 (in 2009 US dollars) This increase is driven by a higher value of production (in 2009 US dollars) of beef (up 209 per cent) poultry (187 per cent) starchy staples (115 per cent) vegetables (92 per cent) fruit (78 per cent) and rice and palm oil (up 77 per cent each) (Figure 16) The value of maize production divided almost equally between feed and food use is projected to increase by 78 per cent
Figure 16 Production of selected agricultural commodities Indonesia
Source ABARES model output
For some agricultural products such as rice and beef rising production partly reflects domestic policies that favour their production For example the real value of rice production between 2009 and 2050 is projected to rise by 77 per cent because of the assumption that producers continue to receive a minimum support price and input subsidies Indonesia is projected to switch from being an importer to an exporter of rice by 2050 The real value of Indonesias rice exports in 2050 is projected to be around US$09 billion (in 2009 US dollars)
The real value of Indonesias palm oil production is projected to rise significantly in line with strong export demand and Indonesias comparative advantage in its production Between 2009 and 2050 Indonesias production of palm oil is projected to rise by US$13 billion to US$30 billion an increase of 77 per cent Over this period palm oil exports are projected to rise by 40 per cent to US$18 billion
10 20 30 40
Sheep and goat meat
Dairy
Sugar
Palm oil
Rice
Vegetables
Starchy staples
Beef
Poultry
Fruit
2050
2009
Billion(2009 US$)
78
187
209
115
92
77
77
76
115
361
28
Imports For some agricultural commodities such as rice and palm oil the rise in consumption by 2050 is projected to be met largely by a rise in domestic production However for most agrifood commodities production is projected to increase at a slower rate than consumption As a result food and feed imports will be an increasingly important component of Indonesias food supply towards 2050 The real value of Indonesias total agrifood imports is projected to rise more than 20 times from 2009 to US$152 billion (in 2009 US dollar terms) in 2050
By 2050 Indonesia is projected to import a wide range of horticultural products Given rising domestic demand the real value of Indonesiarsquos fruit and vegetable imports is projected to rise to US$25 billion and US$11 billion in 2050 respectively (in 2009 US dollars Figure 17) On this basis the share of imports in total Indonesian fruit consumption will rise from 3 per cent in 2009 to 53 per cent in 2050 (Figure 18) For vegetables it will rise from 9 per cent in 2009 to 47 per cent in 2050
Figure 17 Trade of selected agricultural commodities Indonesia
Source ABARES model output
-30 -20 -10 0 10 20 30
Wheat
Sheep and goat meat
Dairy
Sugar
Rice
Beef
Starchy staples
Vegetables
Fruit
2050
2009
Billion (2009 US$)
Exports Imports
Palm oil
29
Figure 18 Import share of total consumption Indonesia
Source ABARES model output
Lower-income growth scenario The baseline projections for Indonesian agrifood consumption production and trade to 2050 are reliant on the underlying assumptions presented at the beginning of this chapter Chief among these are the OECD (2012a) assumptions for Indonesian GDP growth to 2050 presented in Chapter 2 (Table 1 and Table 7) If Indonesia were to realise a lower level of income growth agrifood demand growth would be expected to be lower The World Bank projects that Indonesian GDP growth in each decade to 2050 will be markedly lower than the OECDs projections (World Bank 2015 Table 7) This scenario examines the potential effect on Indonesian agrifood consumption and import demand if GDP and hence income growth were slower over the projection period as suggested by the World Bank All other variables from the reference scenario are held constant
Table 7 Indonesia GDP growth projections 2010 to 2050
Period Baseline 1991-2010
2011-2020 2021-30 2031-40 2041-50
OECD average annual growth ()
440 530 530 340 340
World Bank average annual growth ()
440 350 350 225 225
Source OECD 2012a World Bank 2015
Results In this scenario lower economic and income growth throughout the projection period results in GDP in 2050 that is 44 per cent lower than the reference case Because agrifood consumption is sensitive to changes in income the total value of agrifood consumption in 2050 (in 2009 US dollars) is 10 per cent less than in the reference case (Figure 19) Weaker economic growth most
Fruit Vegetables Starchy staples
Beef Poultry Sugar Maize Dairy Sheep and goat meat
Wheat
10
20
30
40
50
2050 Imports
2050 Domestic production
2009 imports
2009 Domestic production
53
3
4743
86
8183
1007091
9
75846723
6
100
Billion(2009 US$)
21
50
30
strongly affects urban areas where average annual income growth in the reference case was assumed to be more than double that of rural areas As a result demand for high-value products such as meat and dairy products declines significantly Many of these products are imported In 2050 the total projected value of beef consumption (in 2009 US dollars) is 17 per cent lower than in the reference case and poultry and milk products are each 14 per cent lower The real value of consumption for many domestically produced products such as starches and maize also declines but by no more than 10 per cent for any single commodity
Weaker consumption growth leads to lower import growth over the projection period particularly for high-value commodities The total value of imports in 2050 is 16 per cent lower in this scenario compared with the reference case with the import share of total consumption 5 percentage points lower than the reference case at 42 per cent (Figure 19) Beef imports are projected to be 20 per cent lower than the reference scenario sheep and goat meat 26 per cent lower and dairy products 16 per cent lower Fruit and vegetable imports are 12 per cent and 19 per cent lower respectively
Figure 19 Agrifood consumption in 2050 under lower income growth assumption
Source ABARES model output
0 100 200 300 400
Low income scenario
Baseline case
Domestic production
Imports
Billion(2009 US$)
4258
53 47
31
6 Conclusion Continued strong income and population growth combined with greater urbanisation are driving Indonesias increasing demand for not only more food but for a wider variety of foods This demand growth is projected to be met by increases in both domestic production and imports
Assuming no major changes to Indonesias existing agricultural policies to 2050 the real value of food consumption in Indonesia is projected to increase more than four times between 2009 and 2050 The increase will be characterised by a move towards more diverse diets with higher intake of meat dairy products fruit and vegetables Between 2009 and 2050 the real value of beef consumption is projected to rise more than 14 times dairy tenfold and fruit and vegetables to more than triple These projected increases are from a relatively low base and are driven by a rise in the quantities consumed rather than any significant projected rise in real prices To support this rise in demand imports of many agrifood commodities are projected to increase to 2050
The contribution of meat dairy products fruit and vegetables in Indonesian diets will increase more quickly than cereals and staples to 2050 While cereals and starchy staples will remain important components of Indonesian diets their relative contribution will declinemdashthe continuation of a trend that began around 1990
The upward trend in food demand is most pronounced among urban households whose income growth is assumed to be more than double that of rural households A declining rural population and relatively lower incomes will result in slower growth in food consumption compared with the urban population
For most agricultural commodities assuming no significant change to historical TFP growth for total agriculture production is projected to increase at a slower rate than consumption As a result food imports will be an important component of Indonesias food and feed supply towards 2050 The real value of Indonesias agrifood imports is projected to rise more than 20 times from 2009 to US$152 billion (in 2009 US dollar terms) in 2050
The projected significant increases in consumption and import demand for food in Indonesia are based on the assumption of relatively strong income growth to 2050 Under a lower growth scenario consumption of protein-based food products such as meat and dairy products is projected to be around 14 to 17 per cent lower than the reference case at 2050 While consumption of domestically produced products is also projected to be lower in 2050 in the lower-income-growth scenario the declines are less significant compared with the baseline case
While not included in the modelling in this report there is scope for increased production of non-food agricultural commodities and cash crops in Indonesia in which it has a comparative advantage These include natural rubber copra palm kernels coffee cocoa and spices Indonesias current policies on food self-sufficiency favour investment in food industries rather than the non-food and cash crops industries This has the effect of allocating resources away from their most efficient use
Because of their geographic proximity Australia and Indonesia are well placed to benefit from advancing bilateral agricultural trade Indonesia is an important market for Australian wheat sugar live cattle beef skim milk powder and horticultural products such as grapes and citrus
32
Stronger demand for these commodities and others in Indonesia will create further opportunities for Australian exporters
33
References ABARES 2013 Agricultural commodities September quarter 2013 Australian Bureau of Agricultural and Resource Economics and Sciences Canberra pp 85-87 available at agriculturegovauabarespublications
Afif S 2014 The Rising of Middle Class in Indonesia Opportunity and Challenge Paper presented at the International Policy Exchange Conference Segovia Spain 28 September available at umdcipeorgconferencesDecliningMiddleClassesSpainpapers_presentationshtml
Alexandratos N amp Bruinsma J 2012 World agriculture towards 20302050 the 2012 revision ESA Working paper no 12-03 Food and Agriculture Organization of the United Nations Rome available at faoorgeconomicesaesagen
Djajanegara A 1999 Local livestock feed resources in Livestock industries of Indonesia prior to the Asian financial crisis Food and Agriculture Organization of the United Nations Rome available at faoorgdocrep004AB986Eab986e06htmbm06 accessed 22 January 2015
Elias S amp Noone C 2011 The growth and development of the Indonesian economy Bulletin December Quarter Reserve Bank of Australia Sydney available at rbagovaupublicationsbulletin2011dec4html
FAO 2015 lsquoFAOSTATrsquo Food and Agriculture Organization of the United Nations Rome available at faostat3faoorghomeE accessed 26 October 2015
mdashmdash 2013 Indonesia Food and Agriculture Organization of the United Nations Rome available at faoorgdocrep005y4632ey4632e0lhtm
mdashmdash2012 GeoNetwork Food and Agriculture Organization of the United Nations Rome available at faoorggeonetworksrvenmainhome accessed 15 February 2014
mdashmdash 2005 Fertiliser use by crop in Indonesia Food and Agriculture Organization of the United Nations Rome available at faoorgdocrep008y7063ey7063e00htm
Fuglie K 2012 lsquoProductivity growth and technology capital in the global agricultural economyrsquo in Fuglie KO Wang SL amp Ball VE (eds) Productivity growth in agriculture an international perspective CAB International Oxfordshire UK
mdashmdash2010 lsquoSources of growth in Indonesian agriculture Journal of Productivity Analysis vol 33 no 3 pp 225-240
Fuglie K amp Rada N 2014 International Agricultural Productivity United States Department of Agriculture Economic Research Service Washington DC available at ersusdagovdata-productsinternational-agricultural-productivityaspxU089bfmSzkd
Global Business Guide Indonesia 2012 Agriculture in Indonesia available at gbgindonesiacomenagriculturesector_overviewphp
Glover J 2011 lsquoAn international retailerrsquos perspectiversquo Paper presented at The Crawford Fund 2011 Annual Parliamentary Conference Parliament House Canberra 14 August available at crawfordfundorgevents2011-parliamentary-conference
34
Hamshere P Sheng Y Moir B Syed F amp Gunning-Trant C 2014 What China wants Analysis of Chinas food demand to 2050 ABARES research report Canberra March available at agriculturegovauabarespublications
IMF 2015 World Economic Outlook Database available at imforgexternalpubsftweo201302weodataindexaspx accessed 26 October 2015
Indonesian Central Bureau of Statistics 2015a Poverty available at bpsgoidSubjekviewid23subjekViewTab3|accordion-daftar-subjek1 accessed 27 October 2015
mdashmdash2015b Consumption and expenditure available at bpsgoidSubjekviewid5subjekViewTab3|accordion-daftar-subjek1 accessed 27 October 2015
mdashmdash2015c Population 15 Years of Age and Over Who Worked by Main Industry 2004-2014 available at bpsgoidlinkTabelStatisviewid970 accessed 27 October 2015
mdashmdash2014 Consumption and expenditure available at bpsgoidSubjekviewid5subjekViewTab3|accordion-daftar-subjek1 accessed 20 February 2014
mdashmdash2011 Total income by Household Group (billion rupiahs) available at bpsgoidSubjekviewid5subjekViewTab3|accordion-daftar-subjek1 accessed 1 August 2014
Khajali F amp Slominski BA 2012 lsquoFactors that affect the nutritive value of canola meal for poultryrsquo Poultry Science vol 91 no 10 pp 2564ndash2575 available at psoxfordjournalsorgcontent91102564fullxref-ref-95-1
Linehan V Thorpe S Andrews N amp Beaini F 2012a Food demand to 2050 Opportunities for Australian agriculture paper presented at 2012 ABARES Outlook conference Canberra 6ndash7 March available at daffgovauabarespublications
mdashmdash 2012b Food demand to 2050 Opportunities for Australian agriculturemdashalgebraic description of agrifood model technical annex to ABARES Outlook conference paper Canberra May available at daffgovauabarespublications
Ludena C Hertel T Preckel P Foster K and Nin A 2007 Productivity growth and convergence in crop ruminant and nonruminant production measurement and forecasts Agricultural Economics 37 available at onlinelibrarywileycomdoi101111j1574-0862200700218xabstract
McKinsey Global Institute 2012 The archipelago economy Unleashing Indonesias potential September Jakarta available at mckinseycominsightsasia-pacificthe_archipelago_economyashx
OECD 2013 Global Food Security Challenges for the Food and Agricultural System Organisation for Economic Cooperation and Development Paris available at oecd-ilibraryorgagriculture-and-foodglobal-food-security_9789264195363-en
mdashmdash2012a Looking to 2060 A global vision of long-term growth Economics Department Policy Notes no 15 Organisation for Economic Cooperation and Development Paris November available at oecdorgecomonetarypolicy-noteshtm
35
mdashmdash2012b OECD Review of Agricultural Policies Indonesia 2012 Organisation for Economic Cooperation and Development Paris available at oecd-ilibraryorgagriculture-and-foodoecd-review-of-agricultural-policies-indonesia-2012_9789264179011-en
OECDndashFAO 2014 OECDndashFAO Agricultural Outlook 2014 Organisation for Economic Cooperation and Development Paris available at oecd-ilibraryorgagriculture-and-foodoecd-fao-agricultural-outlook-2014_agr_outlook-2014-en
Osorio C Abriningrum D Armas E amp Firdaus M 2011 Who is benefiting from fertilizer subsidies in Indonesia Policy Research Working Paper 5758 World Bank Washington DC available at elibraryworldbankorgdoipdf1015961813-9450-5758
Rabobank 2013 Indonesia - islands of opportunity Agriculture in Focus Rabobank Food amp Agribusiness Research and Advisory Australia and New Zealand Spring Sydney
Shahaf E 2009 Agriculture in Indonesia Asia Technology Consulting available at techasiaconsultingcomagriculture_in_indonesiahtml
Statistics Indonesia 2015 Gross Domestic Product at Current Market Prices By Industrial Origin (Billion Rupiahs) 2000-2014 available at bpsgoidlinkTabelStatisviewid1199 accessed 26 October 2015
Sudaryanto T 2014 Fertilizer subsidy policy in Indonesia impacts and future perspectives Food and Fertiliser Technology Center for the Asian and Pacific Region Asia-Pacific Information Platform on Agricultural Policy (AP) available at apfftcagnetorgap_dbphpid=365
The Canadian Trade Commissioner Service 2011 lsquoAn Investment Guide to Indonesia available at tradecommissionergccaengdocumentjspdid=133467toc38
United Nations Population Division 2015 World population prospects the 2015 revision United Nations New York available at esaunorgunpdwppindexhtm accessed 12 August 2015
mdashmdash2014 World urbanisation prospects the 2014 revision United Nations New York available at esaunorgunpdwup accessed 19 March 2015
USAID nd lsquoIndonesia ndash Property rights amp resource governancersquo USAID Country Profile available at usaidlandtenurenetindonesia
USDAndashFAS 2014 Indonesia grain and feed annual report 2014 GAIN Report no ID1407 1 April Foreign Agricultural Service United States Department of Agriculture Washington DC available at usdaindonesiaorgcat=10
Widarjono A 2012 Food and nutrient demand in Indonesia PhD thesis Oklahoma State University available at shareokorgbitstreamhandle112446547Department20of20Agricultural20Economics_48pdfsequence=1
World Bank 2015 Global Economic Prospects January 2015 Having fiscal space and using it World Bank Group Washington DC available at worldbankorgenpublicationglobal-economic-prospects
mdashmdash2014 World development indicators World Bank Washington DC available at dataworldbankorgdata-catalogworld-development-indicators
36
mdashmdash2013 Transport in Indonesia World Bank Washington DC available at goworldbankorgPF2AFG64V0
mdashmdash 2012a Raskin subsidised rice delivery Public expenditure review (PER) Social assistance program and public expenditure review no 3 World Bank Washington DC available at documentsworldbankorgcurateden20120215893857raskin-subsidized-rice-delivery
mdashmdash2012b Targeting poor and vulnerable households in Indonesia World Bank Washington DC available at documentsworldbankorgcurateden20120115879773targeting-poor-vulnerable-households-indonesia
mdashmdash2011 Indonesia Agriculture Public Expenditure Review 2010 World Bank Jakarta available at documentsworldbankorgcurateden20110919456223indonesia-agriculture-public-expenditure-review-2010
mdashmdash2010 Completing decentralization World Bank Jakarta available at documentsworldbankorgcurateden20100112012453completing-decentralization
mdashmdash2009 Investing in a more sustainable Indonesia Country Environmental Analysis Report No 50762-ID World Bank CEA Series East Asia and Pacific Region available at openknowledgeworldbankorgbitstreamhandle109863135507620v20Revis1ox0info10CEA1englishpdfsequence=1
mdashmdash2007 Horticultural producers and supermarket development in Indonesia World Bank Washington DC available at documentsworldbankorgcurateden2007068235822horticultural-producers-supermarket-development-indonesia
WTO 2013 Trade policy review Indonesia WTO Document WTTPRS278 World Trade Organisation Geneva available at wtoorgenglishtratop_etpr_etp378_ehtm
Yamauchi F 2014 Wage Growth Landholding and Mechanization in Agriculture Evidence from Indonesia World Bank Washington DC February available at openknowledgeworldbankorghandle1098617324
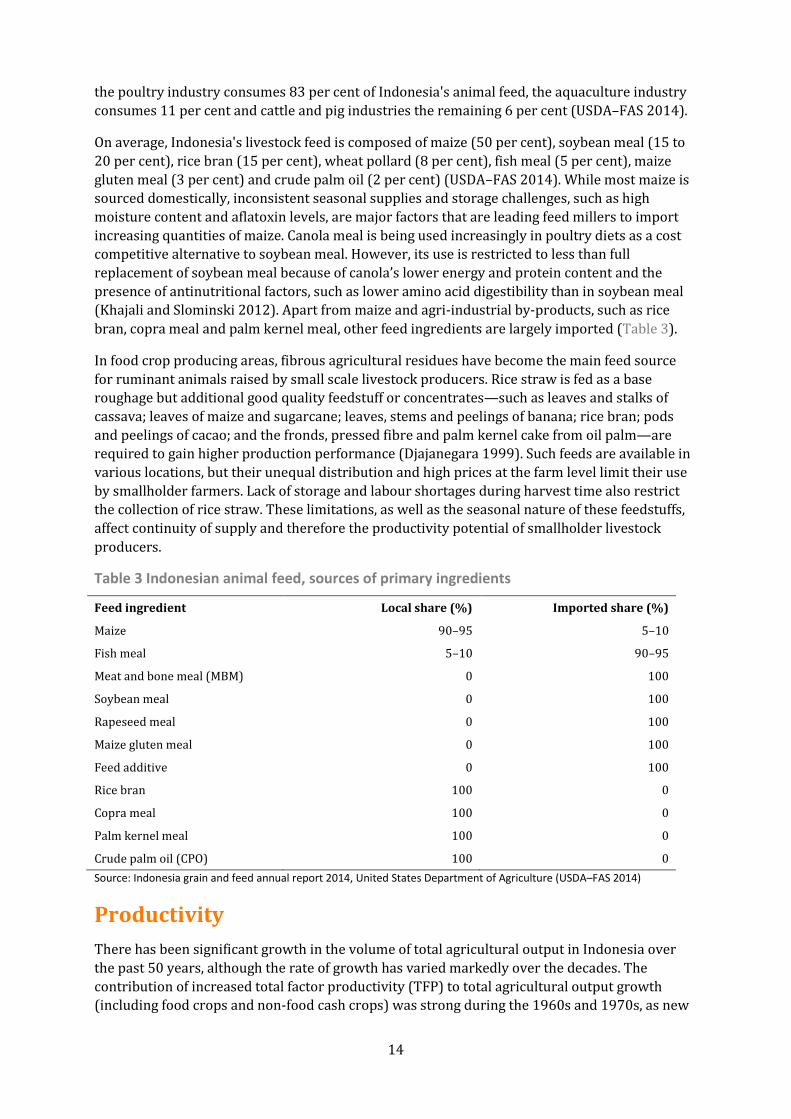
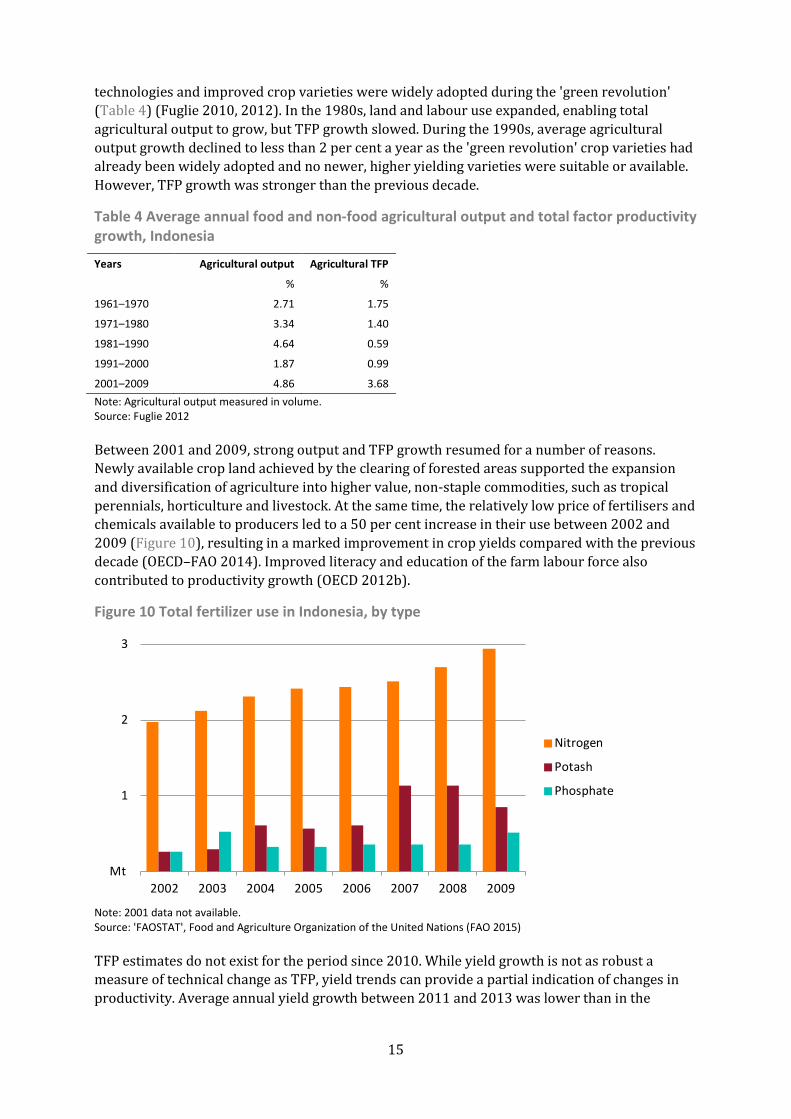
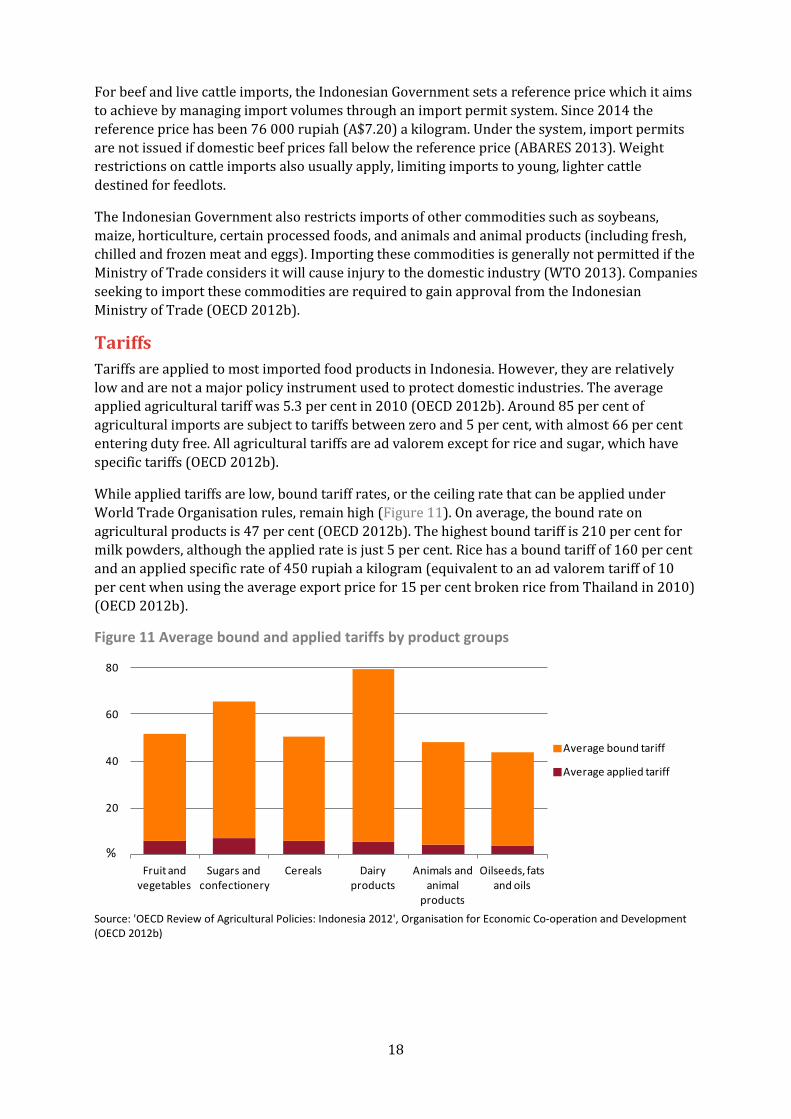

20
Figure 12 Raskin rice distribution and budgetary cost
Source OECD Review of Agricultural Policies Indonesia 2012 Organisation for Economic Co-operation and Development (OECD 2012b)
Implications of agricultural and food policies Public expenditure on Indonesian agriculture has increased under its current policy settings In 2009 public spending was around 615 trillion rupiah (A$75 billion) This was equivalent to 56 per cent of total government expenditure compared with 27 per cent in 2001 (World Bank 2011) The fertiliser subsidy and Raskin have been the biggest drivers of increased spending over this period
In addition to the direct budget cost of Indonesias agricultural and food policies there have also been allocative effects Indonesian policies tend to focus on rice maize and sugar leading to increased production of these commodities and improved availability from domestic sources However expansion of these crops has come at the expense of horticulture and other commodities in which Indonesia has a comparative advantage such as natural rubber cocoa and spices (World Bank 2011)
The administration of some support programmes the fertiliser subsidy in particular is inefficient (Sudaryanto 2014) As discussed in Chapter 3 subsidising fertiliser companies in an environment where quantities prices and distribution channels are regulated reduces incentives for these companies to effectively compete This inefficiency has resulted in the under-production of fertiliser leading to shortages At the same time the artificially low price has led to an over-reliance on fertiliser by producers to increase yield rather than using other methods such as improved seeds (World Bank 2011)
4000
8000
12000
16000
2000 2002 2004 2006 2008 20100
1
2
3
4
Expenditure on RASKIN
Quantity of rice distributed (right axis)
Million tonnes
Billionrupiah
21
5 Simulation results Baseline assumptions The objective in this analysis is to identify and quantify projected changes in Indonesian demand for a range of agrifood commodities over the longer term across urban and rural households An updated version of the ABARES agrifood model (Linehan et al 2012a) is used to investigate these potential trends The model has been modified to include Indonesias consumer subsidy policy (Raskin) and a re-aggregation of some country and commodity groups to allow more detailed analysis
Indonesia has a comparative advantage in the production of many cash crops and non-food agricultural commodities that are not included in the ABARES agrifood model such as natural rubber copra palm kernels coffee cocoa and spices (FAO 2013) In Indonesia the production of these commodities competes with food commodities for resources despite a policy environment targeted at food production and food self-sufficiency
Given Indonesias limited supply of arable land and the quality and availability of its water supply the capacity of the domestic agricultural sector to meet the growing demand for food in Indonesia will depend heavily on improvements in productivity Total factor productivity (TFP) growth in Indonesian agriculture is estimated to have averaged 154 per cent a year since 1961 It is expected that yield growth in Indonesia will not decline from this average annual rate in the future because the potential for productivity growth remains significant However nor is it expected to continue at the relatively high rates estimated for the period 2001 to 2009 which were made possible from the expansion of agriculture into higher-value non-staple commodities on newly deforested land and a significant increase in the use of chemical fertilisers (see Chapter 4)
Productivity growth since 2010 is estimated to have slowed from the decade 2001ndash2009 The Indonesian Governments policy initiative Reducing Emissions from Deforestation and Forest Degradation (REDD) in 2010 and declaration of a two-year Forest Moratorium in 2011 have slowed the rate of forest conversion to crop land (OECD 2012b) In addition agricultural production continues to be constrained by the issues outlined in Chapter 4 (including decreasing returns to scale for chemical inputs lack of widespread mechanisation and deteriorating resource base) With ongoing competition between the production of food crops and non-food cash crops (in which Indonesia has a comparative advantage) and little prospects in the foreseeable future for major policy changes on food consumption and production TFP growth for food crops in Indonesia is assumed to average 154 per cent a year between 2009 and 2050 This is close to the forecast by Ludena et al (2007) of 152 per cent a year to 2040 (FAO 2013 USDAndashFAS 2014)
Growth rates for TFP for individual commodities have in the past shown similar patterns to growth in yields Assumptions of TFP growth rates for individual commodities are therefore derived by apportioning the assumed rate for the whole of agriculture by historical growth in the yields of each commodity (Table 6)
22
Table 6 Average annual TFP growth rate by industry in Indonesia 2009 to 2050
Industry
Rice 214
Maize 337
Coarse grains 335
Other cereals 239
Oilseeds 388
Vegetables 232
Fruit 303
Beef 032
Sheep and goat meat 144
Poultry 144
Eggs 135
Dairy 215
All Agriculture 154 Source ABARES model assumption
In the reference case no change to Indonesias market support policies is assumed over the projection period On the production side these include the principal forms of market support of state trading input subsidies and import restrictions Additionally the Indonesian Governments minimum support prices for rice and wheat are maintained in real terms as are other ad hoc interventions on a range of agricultural commodities
The government support received by consumers through the consumer subsidy policy Raskin is also maintained in real terms over the projection period (discussed in Chapter 4)
The baseline projections determined in the agrifood model for Indonesia are also dependent on a set of assumptions discussed in Chapters 2 and 3 To summarise
bull population growth is assumed to average 07 per cent a year between 2010 and 2050
bull the proportion of the population in urban areas is assumed to increase from 50 per cent in 2009 to 72 per cent by 2050
bull average annual GDP growth in Indonesia is assumed to average 53 per cent a year between 2010 and 2030 before weakening between 2030 and 2050 to average 34 per cent a year (Table 1)
bull average annual income growth is assumed to be 56 per cent a year in urban areas and 21 per cent a year in rural areas
agricultural productivity in Indonesia is assumed to continue to increase according to the growth estimates provided in Table 6
The population is divided into two income stratamdashurban income and rural income households Across these two household types the income growth assumptions to 2050 for urban and rural areas are based on historical income data from the Indonesian Central Bureau of Statistics (2011) These data demonstrate that not only is average urban income higher than average rural income but with urbanisation average income growth in urban areas has also been higher than
23
in rural areas This has been the result of a relatively faster rate of economic development and higher wages which have stemmed from the growth in the manufacturing and services sectors prevalent in urban areas The model assumes this trend in income growth will continue to 2050 Indonesian household food consumption data in the base year of the model are from the Indonesian Central Bureau of Statistics (2014) and Widarjono (2012) These data were used as the basis in the model to project food consumption across urban and rural households to 2050
In the model total and per person Indonesian food consumption and total urban and rural food consumption is apparent consumption which reflects the total use of agrifood products (food feed and industrial use) In contrast per person urban and rural consumption is direct food consumption only it excludes feed use and industrial use of agrifood products to better reflect changes in diets
Consumption The real value of total food consumption in Indonesia (including food feed and industrial use) is projected to quadruple between 2009 and 2050 to US$327 billion (in 2009 US dollars) The largest increases are for meat dairy products fruit and vegetables as real incomes increase (Figure 13) Together these commodities account for two-thirds of the projected rise in the real value of food consumption
Figure 13 Consumption of selected agricultural commodities Indonesia
Note Starchy staples include pulses yams potatoes and cassava Source ABARES model output
Between 2009 and 2050 the real value of Indonesian beef consumption is projected to rise more than 14 times to US$35 billion (in 2009 US dollars) dairy products ten times to almost US$9 billion and fruit and vegetables more than three times to US$50 billion and US$25 billion respectively For many commodities the value of consumption in 2050 is projected to rise from a very low base reflecting high poverty rates and a large rural population in 2009 By 2050 72 per cent of the population is projected to live in urban centres with higher incomes than the
10 20 30 40 50 60
Wheat
Sheep and goat meat
Dairy
Sugar
Oil crops
Rice
Vegetables
Starchy staples
Beef
Poultry
Fruit
2050
2009
Billion(2009 US$)
552
66
231
1311
269
1319
256
246
935
1340
113
24
rural cohort It is this expected transition of the population and income growth that drive the magnitude of projected consumption growth for many commodities Despite these large increases Indonesias per person food consumption in 2050 is projected to remain below that of China for many commodities (Hamshere et al 2014)
For cereals oil crops and starchy staples (pulses potatoes yams and cassava) consumption is also projected to increase Between 2009 and 2050 the real value of rice consumption is projected to rise by 66 per cent to nearly US$23 billion (in 2009 US dollars) maize by 182 per cent to US$8 billion oil crops by 246 per cent to US$22 billion and starchy staples by 256 per cent to almost US$29 billion Over this period the real value of sugar consumption is projected to rise more than six times to US$14 billion (in 2009 US dollars)
The projected rise in consumption of cereals oil crops and starchy staples is driven by a number of factors First cereals and starchy staples (such as cassava) are relatively affordable foods particularly for low and middle income consumers whose populations are projected to rise Although both cereals and starchy staples will remain important components of Indonesian diets to 2050 their relative contribution will decline as diets become more diversified with greater amounts of meats dairy products and fruit and vegetablesmdashthe continuation of a trend that began around 1990 (Figure 5)
The projected rise in consumption of cereals oil crops and starchy staples is also driven by feed requirements which will increase as the demand for meat protein rises to 2050 As discussed in Chapter 3 about 50 per cent of domestic maize production is used as feed Rice bran also comprises about 15 per cent of total Indonesian feed consumption Soybean meal comprises between 15 per cent and 20 per cent of total livestock feed all of which is imported Rapeseed meal can be used as a partial substitute for soybeans and it too is entirely imported In 2050 it is projected that feed use will account for around 42 per cent of total maize consumption 43 per cent of total oil crop consumption and 44 per cent of total starchy staple consumption a larger proportion of which will need to be imported compared with 2009
Urban and rural consumption In 2050 71 per cent of Indonesias population is projected to live in urban areas compared with 54 per cent in 2015 (United Nations Population Division 2014) By 2050 Indonesian consumers are projected to have more diverse diets with greater consumption of meat dairy products fruit and vegetables
In this section the results for total urban and rural consumption reflect apparent consumption However per person rural and urban consumption is direct food consumption only Feed use and industrial use of the agrifood products are excluded in the per person results in order to better understand the projected change in diets
High value commodities Urban consumers account for most of the growth in consumption of meat dairy products fruit and vegetables over the projection period because of rising urban populations and incomes Between 2009 and 2050 the real value of urban beef consumption is projected to rise more than 18 times to US$34 billion (in 2009 US dollars) Consumption of dairy products is projected to rise by more than 14 times to more than US$8 billion and fruit and vegetables more than four times to US$43 billion and almost US$21 billion respectively (Figure 14)
25
Figure 14 Urban consumption of selected agricultural commodities Indonesia
Source ABARES model output
In per person terms the value of urban beef consumption is projected to rise more than nine times between 2009 and 2050 dairy more than seven times and fruit and vegetables to more than double However consumption of rice is projected to fall by 4 per cent While these increases are large Indonesias urban per person consumption in 2050 is still projected to be lower than that of China in the same year for many commodities including vegetables (73 per cent lower) oilseeds (12 per cent) dairy products (41 per cent) and sheep and goat meat (24 per cent) In contrast Indonesias urban per person consumption is projected to be higher than Chinas for beef (52 per cent higher) sugar (400 per cent) cereals (23 per cent) and starchy staples (14 times higher) (Hamshere et al 2014) For beef higher Indonesian per person consumption relative to China in 2050 reflects the dominance of beef in Indonesian diets by that time compared with China where pig meat consumption is significant Similarly the projected rise in per person consumption of starches in Indonesia mainly reflects higher consumption of cassava a culturally important food crop
For rural consumers total growth in consumption of meat dairy products fruit and vegetables is lower than for urban households This can be attributed to relatively lower rural incomes and a decline in the absolute size of the rural population Between 2009 and 2050 total rural beef consumption is projected to rise by 95 per cent to more than US$1 billion (in 2009 US dollars) dairy products by 75 per cent to US$05 billion fruit by 41 per cent to almost US$7 billion and vegetables by 42 per cent to almost US$5 billion (Figure 15)
20 40 60
Wheat
Sheep and goat meat
Dairy
Sugar
Oil crops
Rice
Vegetables
Starchy staples
Beef
Poultry
Fruit
Billion(2009 US$)
387
1724
1734
426
875
370
547
1349
Total food consumption
1761
91
173
50 100 150 200
Wheat
Sheep and goat meat
Dairy
Sugar
Oil crops
Rice
Vegetables
Starchy staples
Beef
Poultry
Fruit
2009 US$
145
819
824
165
391
137
226
630
Per person consumption
837
-4
38
26
Figure 15 Rural consumption of selected agricultural commodities Indonesia
Source ABARES model output
Between 2009 and 2050 rural per person consumption of each of the agrifood commodity groups is projected to change by a similar magnitude as urban consumption In value terms rural per person consumption of beef is projected to rise by 162 per cent dairy products by 135 per cent fruit by 90 per cent and vegetables by 92 per cent Similar increases are projected for rice (96 per cent) wheat (128 per cent) and starchy staples (116 per cent)
Again despite these significant increases rural per person consumption in Indonesia is projected to be lower than that of China in 2050 for all products except sugar which is projected to be 117 per cent higher For all other commodity groups rural per person consumption is projected to be lower than in China including sheep and goat meat (85 per cent lower) dairy (54 per cent) starches (32 per cent) cereals (56 per cent) and vegetables (86 per cent)
For both rural and urban consumers the rise in the real value of total food consumption in 2050 is principally the result of an increase in the quantity consumed rather than a projected significant rise in the real price This is especially pronounced in urban households For example between 2009 and 2050 beef consumption by urban households is projected to rise by more than 15 times and sheep and goat meat by 13 times In contrast rural beef consumption over this period is projected to rise by 64 per cent and sheep and goat meat by 44 per cent
Projected consumption growth of cereals and starchy staples between 2009 and 2050 is most pronounced in urban areas Rising urban consumption of these commodities is largely the result of population growth Urban consumption of wheat is projected to rise by 173 per cent to around US$2 billion (in 2009 US dollars) rice by 91 per cent to US$9 billion and starchy staples (which includes pulses potatoes yams and cassava) by 426 per cent to US$13 billion
Rural consumption of cereals and starchy staples is projected to rise despite a falling rural population As incomes rise towards 2050 the relatively affordable prices of these commodities will drive rural consumption Between 2009 and 2050 rural consumption of wheat is projected
2 4 6 8 10
Wheat
Sheep and goat meat
Dairy
Sugar
Oil crops
Rice
Vegetables
Starchy staples
Beef
Poultry
Fruit
Billion(2009 US$)
94
95
61
96
42
101
Total consumption
41
75
98
45
69
50 100 150 200
Wheat
Sheep and goat meat
Dairy
Sugar
Oil crops
Rice
Vegetables
Starchy staples
Beef
Poultry
Fruit
2050
2009
2009 US$
90
161
162
116
165
92
170
135
Per person consumption
166
96
128
27
to rise by 69 per cent to US$1 billion (in 2009 US dollars) rice by 45 per cent to almost US$9 billion and starchy staples by 61 per cent to US$3 billion
Production and trade The real value of Indonesias total agrifood production (which includes production for food feed and industrial use) is projected to more than double from US$81 billion in 2009 to US$173 billion in 2050 (in 2009 US dollars) This increase is driven by a higher value of production (in 2009 US dollars) of beef (up 209 per cent) poultry (187 per cent) starchy staples (115 per cent) vegetables (92 per cent) fruit (78 per cent) and rice and palm oil (up 77 per cent each) (Figure 16) The value of maize production divided almost equally between feed and food use is projected to increase by 78 per cent
Figure 16 Production of selected agricultural commodities Indonesia
Source ABARES model output
For some agricultural products such as rice and beef rising production partly reflects domestic policies that favour their production For example the real value of rice production between 2009 and 2050 is projected to rise by 77 per cent because of the assumption that producers continue to receive a minimum support price and input subsidies Indonesia is projected to switch from being an importer to an exporter of rice by 2050 The real value of Indonesias rice exports in 2050 is projected to be around US$09 billion (in 2009 US dollars)
The real value of Indonesias palm oil production is projected to rise significantly in line with strong export demand and Indonesias comparative advantage in its production Between 2009 and 2050 Indonesias production of palm oil is projected to rise by US$13 billion to US$30 billion an increase of 77 per cent Over this period palm oil exports are projected to rise by 40 per cent to US$18 billion
10 20 30 40
Sheep and goat meat
Dairy
Sugar
Palm oil
Rice
Vegetables
Starchy staples
Beef
Poultry
Fruit
2050
2009
Billion(2009 US$)
78
187
209
115
92
77
77
76
115
361
28
Imports For some agricultural commodities such as rice and palm oil the rise in consumption by 2050 is projected to be met largely by a rise in domestic production However for most agrifood commodities production is projected to increase at a slower rate than consumption As a result food and feed imports will be an increasingly important component of Indonesias food supply towards 2050 The real value of Indonesias total agrifood imports is projected to rise more than 20 times from 2009 to US$152 billion (in 2009 US dollar terms) in 2050
By 2050 Indonesia is projected to import a wide range of horticultural products Given rising domestic demand the real value of Indonesiarsquos fruit and vegetable imports is projected to rise to US$25 billion and US$11 billion in 2050 respectively (in 2009 US dollars Figure 17) On this basis the share of imports in total Indonesian fruit consumption will rise from 3 per cent in 2009 to 53 per cent in 2050 (Figure 18) For vegetables it will rise from 9 per cent in 2009 to 47 per cent in 2050
Figure 17 Trade of selected agricultural commodities Indonesia
Source ABARES model output
-30 -20 -10 0 10 20 30
Wheat
Sheep and goat meat
Dairy
Sugar
Rice
Beef
Starchy staples
Vegetables
Fruit
2050
2009
Billion (2009 US$)
Exports Imports
Palm oil
29
Figure 18 Import share of total consumption Indonesia
Source ABARES model output
Lower-income growth scenario The baseline projections for Indonesian agrifood consumption production and trade to 2050 are reliant on the underlying assumptions presented at the beginning of this chapter Chief among these are the OECD (2012a) assumptions for Indonesian GDP growth to 2050 presented in Chapter 2 (Table 1 and Table 7) If Indonesia were to realise a lower level of income growth agrifood demand growth would be expected to be lower The World Bank projects that Indonesian GDP growth in each decade to 2050 will be markedly lower than the OECDs projections (World Bank 2015 Table 7) This scenario examines the potential effect on Indonesian agrifood consumption and import demand if GDP and hence income growth were slower over the projection period as suggested by the World Bank All other variables from the reference scenario are held constant
Table 7 Indonesia GDP growth projections 2010 to 2050
Period Baseline 1991-2010
2011-2020 2021-30 2031-40 2041-50
OECD average annual growth ()
440 530 530 340 340
World Bank average annual growth ()
440 350 350 225 225
Source OECD 2012a World Bank 2015
Results In this scenario lower economic and income growth throughout the projection period results in GDP in 2050 that is 44 per cent lower than the reference case Because agrifood consumption is sensitive to changes in income the total value of agrifood consumption in 2050 (in 2009 US dollars) is 10 per cent less than in the reference case (Figure 19) Weaker economic growth most
Fruit Vegetables Starchy staples
Beef Poultry Sugar Maize Dairy Sheep and goat meat
Wheat
10
20
30
40
50
2050 Imports
2050 Domestic production
2009 imports
2009 Domestic production
53
3
4743
86
8183
1007091
9
75846723
6
100
Billion(2009 US$)
21
50
30
strongly affects urban areas where average annual income growth in the reference case was assumed to be more than double that of rural areas As a result demand for high-value products such as meat and dairy products declines significantly Many of these products are imported In 2050 the total projected value of beef consumption (in 2009 US dollars) is 17 per cent lower than in the reference case and poultry and milk products are each 14 per cent lower The real value of consumption for many domestically produced products such as starches and maize also declines but by no more than 10 per cent for any single commodity
Weaker consumption growth leads to lower import growth over the projection period particularly for high-value commodities The total value of imports in 2050 is 16 per cent lower in this scenario compared with the reference case with the import share of total consumption 5 percentage points lower than the reference case at 42 per cent (Figure 19) Beef imports are projected to be 20 per cent lower than the reference scenario sheep and goat meat 26 per cent lower and dairy products 16 per cent lower Fruit and vegetable imports are 12 per cent and 19 per cent lower respectively
Figure 19 Agrifood consumption in 2050 under lower income growth assumption
Source ABARES model output
0 100 200 300 400
Low income scenario
Baseline case
Domestic production
Imports
Billion(2009 US$)
4258
53 47
31
6 Conclusion Continued strong income and population growth combined with greater urbanisation are driving Indonesias increasing demand for not only more food but for a wider variety of foods This demand growth is projected to be met by increases in both domestic production and imports
Assuming no major changes to Indonesias existing agricultural policies to 2050 the real value of food consumption in Indonesia is projected to increase more than four times between 2009 and 2050 The increase will be characterised by a move towards more diverse diets with higher intake of meat dairy products fruit and vegetables Between 2009 and 2050 the real value of beef consumption is projected to rise more than 14 times dairy tenfold and fruit and vegetables to more than triple These projected increases are from a relatively low base and are driven by a rise in the quantities consumed rather than any significant projected rise in real prices To support this rise in demand imports of many agrifood commodities are projected to increase to 2050
The contribution of meat dairy products fruit and vegetables in Indonesian diets will increase more quickly than cereals and staples to 2050 While cereals and starchy staples will remain important components of Indonesian diets their relative contribution will declinemdashthe continuation of a trend that began around 1990
The upward trend in food demand is most pronounced among urban households whose income growth is assumed to be more than double that of rural households A declining rural population and relatively lower incomes will result in slower growth in food consumption compared with the urban population
For most agricultural commodities assuming no significant change to historical TFP growth for total agriculture production is projected to increase at a slower rate than consumption As a result food imports will be an important component of Indonesias food and feed supply towards 2050 The real value of Indonesias agrifood imports is projected to rise more than 20 times from 2009 to US$152 billion (in 2009 US dollar terms) in 2050
The projected significant increases in consumption and import demand for food in Indonesia are based on the assumption of relatively strong income growth to 2050 Under a lower growth scenario consumption of protein-based food products such as meat and dairy products is projected to be around 14 to 17 per cent lower than the reference case at 2050 While consumption of domestically produced products is also projected to be lower in 2050 in the lower-income-growth scenario the declines are less significant compared with the baseline case
While not included in the modelling in this report there is scope for increased production of non-food agricultural commodities and cash crops in Indonesia in which it has a comparative advantage These include natural rubber copra palm kernels coffee cocoa and spices Indonesias current policies on food self-sufficiency favour investment in food industries rather than the non-food and cash crops industries This has the effect of allocating resources away from their most efficient use
Because of their geographic proximity Australia and Indonesia are well placed to benefit from advancing bilateral agricultural trade Indonesia is an important market for Australian wheat sugar live cattle beef skim milk powder and horticultural products such as grapes and citrus
32
Stronger demand for these commodities and others in Indonesia will create further opportunities for Australian exporters
33
References ABARES 2013 Agricultural commodities September quarter 2013 Australian Bureau of Agricultural and Resource Economics and Sciences Canberra pp 85-87 available at agriculturegovauabarespublications
Afif S 2014 The Rising of Middle Class in Indonesia Opportunity and Challenge Paper presented at the International Policy Exchange Conference Segovia Spain 28 September available at umdcipeorgconferencesDecliningMiddleClassesSpainpapers_presentationshtml
Alexandratos N amp Bruinsma J 2012 World agriculture towards 20302050 the 2012 revision ESA Working paper no 12-03 Food and Agriculture Organization of the United Nations Rome available at faoorgeconomicesaesagen
Djajanegara A 1999 Local livestock feed resources in Livestock industries of Indonesia prior to the Asian financial crisis Food and Agriculture Organization of the United Nations Rome available at faoorgdocrep004AB986Eab986e06htmbm06 accessed 22 January 2015
Elias S amp Noone C 2011 The growth and development of the Indonesian economy Bulletin December Quarter Reserve Bank of Australia Sydney available at rbagovaupublicationsbulletin2011dec4html
FAO 2015 lsquoFAOSTATrsquo Food and Agriculture Organization of the United Nations Rome available at faostat3faoorghomeE accessed 26 October 2015
mdashmdash 2013 Indonesia Food and Agriculture Organization of the United Nations Rome available at faoorgdocrep005y4632ey4632e0lhtm
mdashmdash2012 GeoNetwork Food and Agriculture Organization of the United Nations Rome available at faoorggeonetworksrvenmainhome accessed 15 February 2014
mdashmdash 2005 Fertiliser use by crop in Indonesia Food and Agriculture Organization of the United Nations Rome available at faoorgdocrep008y7063ey7063e00htm
Fuglie K 2012 lsquoProductivity growth and technology capital in the global agricultural economyrsquo in Fuglie KO Wang SL amp Ball VE (eds) Productivity growth in agriculture an international perspective CAB International Oxfordshire UK
mdashmdash2010 lsquoSources of growth in Indonesian agriculture Journal of Productivity Analysis vol 33 no 3 pp 225-240
Fuglie K amp Rada N 2014 International Agricultural Productivity United States Department of Agriculture Economic Research Service Washington DC available at ersusdagovdata-productsinternational-agricultural-productivityaspxU089bfmSzkd
Global Business Guide Indonesia 2012 Agriculture in Indonesia available at gbgindonesiacomenagriculturesector_overviewphp
Glover J 2011 lsquoAn international retailerrsquos perspectiversquo Paper presented at The Crawford Fund 2011 Annual Parliamentary Conference Parliament House Canberra 14 August available at crawfordfundorgevents2011-parliamentary-conference
34
Hamshere P Sheng Y Moir B Syed F amp Gunning-Trant C 2014 What China wants Analysis of Chinas food demand to 2050 ABARES research report Canberra March available at agriculturegovauabarespublications
IMF 2015 World Economic Outlook Database available at imforgexternalpubsftweo201302weodataindexaspx accessed 26 October 2015
Indonesian Central Bureau of Statistics 2015a Poverty available at bpsgoidSubjekviewid23subjekViewTab3|accordion-daftar-subjek1 accessed 27 October 2015
mdashmdash2015b Consumption and expenditure available at bpsgoidSubjekviewid5subjekViewTab3|accordion-daftar-subjek1 accessed 27 October 2015
mdashmdash2015c Population 15 Years of Age and Over Who Worked by Main Industry 2004-2014 available at bpsgoidlinkTabelStatisviewid970 accessed 27 October 2015
mdashmdash2014 Consumption and expenditure available at bpsgoidSubjekviewid5subjekViewTab3|accordion-daftar-subjek1 accessed 20 February 2014
mdashmdash2011 Total income by Household Group (billion rupiahs) available at bpsgoidSubjekviewid5subjekViewTab3|accordion-daftar-subjek1 accessed 1 August 2014
Khajali F amp Slominski BA 2012 lsquoFactors that affect the nutritive value of canola meal for poultryrsquo Poultry Science vol 91 no 10 pp 2564ndash2575 available at psoxfordjournalsorgcontent91102564fullxref-ref-95-1
Linehan V Thorpe S Andrews N amp Beaini F 2012a Food demand to 2050 Opportunities for Australian agriculture paper presented at 2012 ABARES Outlook conference Canberra 6ndash7 March available at daffgovauabarespublications
mdashmdash 2012b Food demand to 2050 Opportunities for Australian agriculturemdashalgebraic description of agrifood model technical annex to ABARES Outlook conference paper Canberra May available at daffgovauabarespublications
Ludena C Hertel T Preckel P Foster K and Nin A 2007 Productivity growth and convergence in crop ruminant and nonruminant production measurement and forecasts Agricultural Economics 37 available at onlinelibrarywileycomdoi101111j1574-0862200700218xabstract
McKinsey Global Institute 2012 The archipelago economy Unleashing Indonesias potential September Jakarta available at mckinseycominsightsasia-pacificthe_archipelago_economyashx
OECD 2013 Global Food Security Challenges for the Food and Agricultural System Organisation for Economic Cooperation and Development Paris available at oecd-ilibraryorgagriculture-and-foodglobal-food-security_9789264195363-en
mdashmdash2012a Looking to 2060 A global vision of long-term growth Economics Department Policy Notes no 15 Organisation for Economic Cooperation and Development Paris November available at oecdorgecomonetarypolicy-noteshtm
35
mdashmdash2012b OECD Review of Agricultural Policies Indonesia 2012 Organisation for Economic Cooperation and Development Paris available at oecd-ilibraryorgagriculture-and-foodoecd-review-of-agricultural-policies-indonesia-2012_9789264179011-en
OECDndashFAO 2014 OECDndashFAO Agricultural Outlook 2014 Organisation for Economic Cooperation and Development Paris available at oecd-ilibraryorgagriculture-and-foodoecd-fao-agricultural-outlook-2014_agr_outlook-2014-en
Osorio C Abriningrum D Armas E amp Firdaus M 2011 Who is benefiting from fertilizer subsidies in Indonesia Policy Research Working Paper 5758 World Bank Washington DC available at elibraryworldbankorgdoipdf1015961813-9450-5758
Rabobank 2013 Indonesia - islands of opportunity Agriculture in Focus Rabobank Food amp Agribusiness Research and Advisory Australia and New Zealand Spring Sydney
Shahaf E 2009 Agriculture in Indonesia Asia Technology Consulting available at techasiaconsultingcomagriculture_in_indonesiahtml
Statistics Indonesia 2015 Gross Domestic Product at Current Market Prices By Industrial Origin (Billion Rupiahs) 2000-2014 available at bpsgoidlinkTabelStatisviewid1199 accessed 26 October 2015
Sudaryanto T 2014 Fertilizer subsidy policy in Indonesia impacts and future perspectives Food and Fertiliser Technology Center for the Asian and Pacific Region Asia-Pacific Information Platform on Agricultural Policy (AP) available at apfftcagnetorgap_dbphpid=365
The Canadian Trade Commissioner Service 2011 lsquoAn Investment Guide to Indonesia available at tradecommissionergccaengdocumentjspdid=133467toc38
United Nations Population Division 2015 World population prospects the 2015 revision United Nations New York available at esaunorgunpdwppindexhtm accessed 12 August 2015
mdashmdash2014 World urbanisation prospects the 2014 revision United Nations New York available at esaunorgunpdwup accessed 19 March 2015
USAID nd lsquoIndonesia ndash Property rights amp resource governancersquo USAID Country Profile available at usaidlandtenurenetindonesia
USDAndashFAS 2014 Indonesia grain and feed annual report 2014 GAIN Report no ID1407 1 April Foreign Agricultural Service United States Department of Agriculture Washington DC available at usdaindonesiaorgcat=10
Widarjono A 2012 Food and nutrient demand in Indonesia PhD thesis Oklahoma State University available at shareokorgbitstreamhandle112446547Department20of20Agricultural20Economics_48pdfsequence=1
World Bank 2015 Global Economic Prospects January 2015 Having fiscal space and using it World Bank Group Washington DC available at worldbankorgenpublicationglobal-economic-prospects
mdashmdash2014 World development indicators World Bank Washington DC available at dataworldbankorgdata-catalogworld-development-indicators
36
mdashmdash2013 Transport in Indonesia World Bank Washington DC available at goworldbankorgPF2AFG64V0
mdashmdash 2012a Raskin subsidised rice delivery Public expenditure review (PER) Social assistance program and public expenditure review no 3 World Bank Washington DC available at documentsworldbankorgcurateden20120215893857raskin-subsidized-rice-delivery
mdashmdash2012b Targeting poor and vulnerable households in Indonesia World Bank Washington DC available at documentsworldbankorgcurateden20120115879773targeting-poor-vulnerable-households-indonesia
mdashmdash2011 Indonesia Agriculture Public Expenditure Review 2010 World Bank Jakarta available at documentsworldbankorgcurateden20110919456223indonesia-agriculture-public-expenditure-review-2010
mdashmdash2010 Completing decentralization World Bank Jakarta available at documentsworldbankorgcurateden20100112012453completing-decentralization
mdashmdash2009 Investing in a more sustainable Indonesia Country Environmental Analysis Report No 50762-ID World Bank CEA Series East Asia and Pacific Region available at openknowledgeworldbankorgbitstreamhandle109863135507620v20Revis1ox0info10CEA1englishpdfsequence=1
mdashmdash2007 Horticultural producers and supermarket development in Indonesia World Bank Washington DC available at documentsworldbankorgcurateden2007068235822horticultural-producers-supermarket-development-indonesia
WTO 2013 Trade policy review Indonesia WTO Document WTTPRS278 World Trade Organisation Geneva available at wtoorgenglishtratop_etpr_etp378_ehtm
Yamauchi F 2014 Wage Growth Landholding and Mechanization in Agriculture Evidence from Indonesia World Bank Washington DC February available at openknowledgeworldbankorghandle1098617324
21
5 Simulation results Baseline assumptions The objective in this analysis is to identify and quantify projected changes in Indonesian demand for a range of agrifood commodities over the longer term across urban and rural households An updated version of the ABARES agrifood model (Linehan et al 2012a) is used to investigate these potential trends The model has been modified to include Indonesias consumer subsidy policy (Raskin) and a re-aggregation of some country and commodity groups to allow more detailed analysis
Indonesia has a comparative advantage in the production of many cash crops and non-food agricultural commodities that are not included in the ABARES agrifood model such as natural rubber copra palm kernels coffee cocoa and spices (FAO 2013) In Indonesia the production of these commodities competes with food commodities for resources despite a policy environment targeted at food production and food self-sufficiency
Given Indonesias limited supply of arable land and the quality and availability of its water supply the capacity of the domestic agricultural sector to meet the growing demand for food in Indonesia will depend heavily on improvements in productivity Total factor productivity (TFP) growth in Indonesian agriculture is estimated to have averaged 154 per cent a year since 1961 It is expected that yield growth in Indonesia will not decline from this average annual rate in the future because the potential for productivity growth remains significant However nor is it expected to continue at the relatively high rates estimated for the period 2001 to 2009 which were made possible from the expansion of agriculture into higher-value non-staple commodities on newly deforested land and a significant increase in the use of chemical fertilisers (see Chapter 4)
Productivity growth since 2010 is estimated to have slowed from the decade 2001ndash2009 The Indonesian Governments policy initiative Reducing Emissions from Deforestation and Forest Degradation (REDD) in 2010 and declaration of a two-year Forest Moratorium in 2011 have slowed the rate of forest conversion to crop land (OECD 2012b) In addition agricultural production continues to be constrained by the issues outlined in Chapter 4 (including decreasing returns to scale for chemical inputs lack of widespread mechanisation and deteriorating resource base) With ongoing competition between the production of food crops and non-food cash crops (in which Indonesia has a comparative advantage) and little prospects in the foreseeable future for major policy changes on food consumption and production TFP growth for food crops in Indonesia is assumed to average 154 per cent a year between 2009 and 2050 This is close to the forecast by Ludena et al (2007) of 152 per cent a year to 2040 (FAO 2013 USDAndashFAS 2014)
Growth rates for TFP for individual commodities have in the past shown similar patterns to growth in yields Assumptions of TFP growth rates for individual commodities are therefore derived by apportioning the assumed rate for the whole of agriculture by historical growth in the yields of each commodity (Table 6)
22
Table 6 Average annual TFP growth rate by industry in Indonesia 2009 to 2050
Industry
Rice 214
Maize 337
Coarse grains 335
Other cereals 239
Oilseeds 388
Vegetables 232
Fruit 303
Beef 032
Sheep and goat meat 144
Poultry 144
Eggs 135
Dairy 215
All Agriculture 154 Source ABARES model assumption
In the reference case no change to Indonesias market support policies is assumed over the projection period On the production side these include the principal forms of market support of state trading input subsidies and import restrictions Additionally the Indonesian Governments minimum support prices for rice and wheat are maintained in real terms as are other ad hoc interventions on a range of agricultural commodities
The government support received by consumers through the consumer subsidy policy Raskin is also maintained in real terms over the projection period (discussed in Chapter 4)
The baseline projections determined in the agrifood model for Indonesia are also dependent on a set of assumptions discussed in Chapters 2 and 3 To summarise
bull population growth is assumed to average 07 per cent a year between 2010 and 2050
bull the proportion of the population in urban areas is assumed to increase from 50 per cent in 2009 to 72 per cent by 2050
bull average annual GDP growth in Indonesia is assumed to average 53 per cent a year between 2010 and 2030 before weakening between 2030 and 2050 to average 34 per cent a year (Table 1)
bull average annual income growth is assumed to be 56 per cent a year in urban areas and 21 per cent a year in rural areas
agricultural productivity in Indonesia is assumed to continue to increase according to the growth estimates provided in Table 6
The population is divided into two income stratamdashurban income and rural income households Across these two household types the income growth assumptions to 2050 for urban and rural areas are based on historical income data from the Indonesian Central Bureau of Statistics (2011) These data demonstrate that not only is average urban income higher than average rural income but with urbanisation average income growth in urban areas has also been higher than
23
in rural areas This has been the result of a relatively faster rate of economic development and higher wages which have stemmed from the growth in the manufacturing and services sectors prevalent in urban areas The model assumes this trend in income growth will continue to 2050 Indonesian household food consumption data in the base year of the model are from the Indonesian Central Bureau of Statistics (2014) and Widarjono (2012) These data were used as the basis in the model to project food consumption across urban and rural households to 2050
In the model total and per person Indonesian food consumption and total urban and rural food consumption is apparent consumption which reflects the total use of agrifood products (food feed and industrial use) In contrast per person urban and rural consumption is direct food consumption only it excludes feed use and industrial use of agrifood products to better reflect changes in diets
Consumption The real value of total food consumption in Indonesia (including food feed and industrial use) is projected to quadruple between 2009 and 2050 to US$327 billion (in 2009 US dollars) The largest increases are for meat dairy products fruit and vegetables as real incomes increase (Figure 13) Together these commodities account for two-thirds of the projected rise in the real value of food consumption
Figure 13 Consumption of selected agricultural commodities Indonesia
Note Starchy staples include pulses yams potatoes and cassava Source ABARES model output
Between 2009 and 2050 the real value of Indonesian beef consumption is projected to rise more than 14 times to US$35 billion (in 2009 US dollars) dairy products ten times to almost US$9 billion and fruit and vegetables more than three times to US$50 billion and US$25 billion respectively For many commodities the value of consumption in 2050 is projected to rise from a very low base reflecting high poverty rates and a large rural population in 2009 By 2050 72 per cent of the population is projected to live in urban centres with higher incomes than the
10 20 30 40 50 60
Wheat
Sheep and goat meat
Dairy
Sugar
Oil crops
Rice
Vegetables
Starchy staples
Beef
Poultry
Fruit
2050
2009
Billion(2009 US$)
552
66
231
1311
269
1319
256
246
935
1340
113
24
rural cohort It is this expected transition of the population and income growth that drive the magnitude of projected consumption growth for many commodities Despite these large increases Indonesias per person food consumption in 2050 is projected to remain below that of China for many commodities (Hamshere et al 2014)
For cereals oil crops and starchy staples (pulses potatoes yams and cassava) consumption is also projected to increase Between 2009 and 2050 the real value of rice consumption is projected to rise by 66 per cent to nearly US$23 billion (in 2009 US dollars) maize by 182 per cent to US$8 billion oil crops by 246 per cent to US$22 billion and starchy staples by 256 per cent to almost US$29 billion Over this period the real value of sugar consumption is projected to rise more than six times to US$14 billion (in 2009 US dollars)
The projected rise in consumption of cereals oil crops and starchy staples is driven by a number of factors First cereals and starchy staples (such as cassava) are relatively affordable foods particularly for low and middle income consumers whose populations are projected to rise Although both cereals and starchy staples will remain important components of Indonesian diets to 2050 their relative contribution will decline as diets become more diversified with greater amounts of meats dairy products and fruit and vegetablesmdashthe continuation of a trend that began around 1990 (Figure 5)
The projected rise in consumption of cereals oil crops and starchy staples is also driven by feed requirements which will increase as the demand for meat protein rises to 2050 As discussed in Chapter 3 about 50 per cent of domestic maize production is used as feed Rice bran also comprises about 15 per cent of total Indonesian feed consumption Soybean meal comprises between 15 per cent and 20 per cent of total livestock feed all of which is imported Rapeseed meal can be used as a partial substitute for soybeans and it too is entirely imported In 2050 it is projected that feed use will account for around 42 per cent of total maize consumption 43 per cent of total oil crop consumption and 44 per cent of total starchy staple consumption a larger proportion of which will need to be imported compared with 2009
Urban and rural consumption In 2050 71 per cent of Indonesias population is projected to live in urban areas compared with 54 per cent in 2015 (United Nations Population Division 2014) By 2050 Indonesian consumers are projected to have more diverse diets with greater consumption of meat dairy products fruit and vegetables
In this section the results for total urban and rural consumption reflect apparent consumption However per person rural and urban consumption is direct food consumption only Feed use and industrial use of the agrifood products are excluded in the per person results in order to better understand the projected change in diets
High value commodities Urban consumers account for most of the growth in consumption of meat dairy products fruit and vegetables over the projection period because of rising urban populations and incomes Between 2009 and 2050 the real value of urban beef consumption is projected to rise more than 18 times to US$34 billion (in 2009 US dollars) Consumption of dairy products is projected to rise by more than 14 times to more than US$8 billion and fruit and vegetables more than four times to US$43 billion and almost US$21 billion respectively (Figure 14)
25
Figure 14 Urban consumption of selected agricultural commodities Indonesia
Source ABARES model output
In per person terms the value of urban beef consumption is projected to rise more than nine times between 2009 and 2050 dairy more than seven times and fruit and vegetables to more than double However consumption of rice is projected to fall by 4 per cent While these increases are large Indonesias urban per person consumption in 2050 is still projected to be lower than that of China in the same year for many commodities including vegetables (73 per cent lower) oilseeds (12 per cent) dairy products (41 per cent) and sheep and goat meat (24 per cent) In contrast Indonesias urban per person consumption is projected to be higher than Chinas for beef (52 per cent higher) sugar (400 per cent) cereals (23 per cent) and starchy staples (14 times higher) (Hamshere et al 2014) For beef higher Indonesian per person consumption relative to China in 2050 reflects the dominance of beef in Indonesian diets by that time compared with China where pig meat consumption is significant Similarly the projected rise in per person consumption of starches in Indonesia mainly reflects higher consumption of cassava a culturally important food crop
For rural consumers total growth in consumption of meat dairy products fruit and vegetables is lower than for urban households This can be attributed to relatively lower rural incomes and a decline in the absolute size of the rural population Between 2009 and 2050 total rural beef consumption is projected to rise by 95 per cent to more than US$1 billion (in 2009 US dollars) dairy products by 75 per cent to US$05 billion fruit by 41 per cent to almost US$7 billion and vegetables by 42 per cent to almost US$5 billion (Figure 15)
20 40 60
Wheat
Sheep and goat meat
Dairy
Sugar
Oil crops
Rice
Vegetables
Starchy staples
Beef
Poultry
Fruit
Billion(2009 US$)
387
1724
1734
426
875
370
547
1349
Total food consumption
1761
91
173
50 100 150 200
Wheat
Sheep and goat meat
Dairy
Sugar
Oil crops
Rice
Vegetables
Starchy staples
Beef
Poultry
Fruit
2009 US$
145
819
824
165
391
137
226
630
Per person consumption
837
-4
38
26
Figure 15 Rural consumption of selected agricultural commodities Indonesia
Source ABARES model output
Between 2009 and 2050 rural per person consumption of each of the agrifood commodity groups is projected to change by a similar magnitude as urban consumption In value terms rural per person consumption of beef is projected to rise by 162 per cent dairy products by 135 per cent fruit by 90 per cent and vegetables by 92 per cent Similar increases are projected for rice (96 per cent) wheat (128 per cent) and starchy staples (116 per cent)
Again despite these significant increases rural per person consumption in Indonesia is projected to be lower than that of China in 2050 for all products except sugar which is projected to be 117 per cent higher For all other commodity groups rural per person consumption is projected to be lower than in China including sheep and goat meat (85 per cent lower) dairy (54 per cent) starches (32 per cent) cereals (56 per cent) and vegetables (86 per cent)
For both rural and urban consumers the rise in the real value of total food consumption in 2050 is principally the result of an increase in the quantity consumed rather than a projected significant rise in the real price This is especially pronounced in urban households For example between 2009 and 2050 beef consumption by urban households is projected to rise by more than 15 times and sheep and goat meat by 13 times In contrast rural beef consumption over this period is projected to rise by 64 per cent and sheep and goat meat by 44 per cent
Projected consumption growth of cereals and starchy staples between 2009 and 2050 is most pronounced in urban areas Rising urban consumption of these commodities is largely the result of population growth Urban consumption of wheat is projected to rise by 173 per cent to around US$2 billion (in 2009 US dollars) rice by 91 per cent to US$9 billion and starchy staples (which includes pulses potatoes yams and cassava) by 426 per cent to US$13 billion
Rural consumption of cereals and starchy staples is projected to rise despite a falling rural population As incomes rise towards 2050 the relatively affordable prices of these commodities will drive rural consumption Between 2009 and 2050 rural consumption of wheat is projected
2 4 6 8 10
Wheat
Sheep and goat meat
Dairy
Sugar
Oil crops
Rice
Vegetables
Starchy staples
Beef
Poultry
Fruit
Billion(2009 US$)
94
95
61
96
42
101
Total consumption
41
75
98
45
69
50 100 150 200
Wheat
Sheep and goat meat
Dairy
Sugar
Oil crops
Rice
Vegetables
Starchy staples
Beef
Poultry
Fruit
2050
2009
2009 US$
90
161
162
116
165
92
170
135
Per person consumption
166
96
128
27
to rise by 69 per cent to US$1 billion (in 2009 US dollars) rice by 45 per cent to almost US$9 billion and starchy staples by 61 per cent to US$3 billion
Production and trade The real value of Indonesias total agrifood production (which includes production for food feed and industrial use) is projected to more than double from US$81 billion in 2009 to US$173 billion in 2050 (in 2009 US dollars) This increase is driven by a higher value of production (in 2009 US dollars) of beef (up 209 per cent) poultry (187 per cent) starchy staples (115 per cent) vegetables (92 per cent) fruit (78 per cent) and rice and palm oil (up 77 per cent each) (Figure 16) The value of maize production divided almost equally between feed and food use is projected to increase by 78 per cent
Figure 16 Production of selected agricultural commodities Indonesia
Source ABARES model output
For some agricultural products such as rice and beef rising production partly reflects domestic policies that favour their production For example the real value of rice production between 2009 and 2050 is projected to rise by 77 per cent because of the assumption that producers continue to receive a minimum support price and input subsidies Indonesia is projected to switch from being an importer to an exporter of rice by 2050 The real value of Indonesias rice exports in 2050 is projected to be around US$09 billion (in 2009 US dollars)
The real value of Indonesias palm oil production is projected to rise significantly in line with strong export demand and Indonesias comparative advantage in its production Between 2009 and 2050 Indonesias production of palm oil is projected to rise by US$13 billion to US$30 billion an increase of 77 per cent Over this period palm oil exports are projected to rise by 40 per cent to US$18 billion
10 20 30 40
Sheep and goat meat
Dairy
Sugar
Palm oil
Rice
Vegetables
Starchy staples
Beef
Poultry
Fruit
2050
2009
Billion(2009 US$)
78
187
209
115
92
77
77
76
115
361
28
Imports For some agricultural commodities such as rice and palm oil the rise in consumption by 2050 is projected to be met largely by a rise in domestic production However for most agrifood commodities production is projected to increase at a slower rate than consumption As a result food and feed imports will be an increasingly important component of Indonesias food supply towards 2050 The real value of Indonesias total agrifood imports is projected to rise more than 20 times from 2009 to US$152 billion (in 2009 US dollar terms) in 2050
By 2050 Indonesia is projected to import a wide range of horticultural products Given rising domestic demand the real value of Indonesiarsquos fruit and vegetable imports is projected to rise to US$25 billion and US$11 billion in 2050 respectively (in 2009 US dollars Figure 17) On this basis the share of imports in total Indonesian fruit consumption will rise from 3 per cent in 2009 to 53 per cent in 2050 (Figure 18) For vegetables it will rise from 9 per cent in 2009 to 47 per cent in 2050
Figure 17 Trade of selected agricultural commodities Indonesia
Source ABARES model output
-30 -20 -10 0 10 20 30
Wheat
Sheep and goat meat
Dairy
Sugar
Rice
Beef
Starchy staples
Vegetables
Fruit
2050
2009
Billion (2009 US$)
Exports Imports
Palm oil
29
Figure 18 Import share of total consumption Indonesia
Source ABARES model output
Lower-income growth scenario The baseline projections for Indonesian agrifood consumption production and trade to 2050 are reliant on the underlying assumptions presented at the beginning of this chapter Chief among these are the OECD (2012a) assumptions for Indonesian GDP growth to 2050 presented in Chapter 2 (Table 1 and Table 7) If Indonesia were to realise a lower level of income growth agrifood demand growth would be expected to be lower The World Bank projects that Indonesian GDP growth in each decade to 2050 will be markedly lower than the OECDs projections (World Bank 2015 Table 7) This scenario examines the potential effect on Indonesian agrifood consumption and import demand if GDP and hence income growth were slower over the projection period as suggested by the World Bank All other variables from the reference scenario are held constant
Table 7 Indonesia GDP growth projections 2010 to 2050
Period Baseline 1991-2010
2011-2020 2021-30 2031-40 2041-50
OECD average annual growth ()
440 530 530 340 340
World Bank average annual growth ()
440 350 350 225 225
Source OECD 2012a World Bank 2015
Results In this scenario lower economic and income growth throughout the projection period results in GDP in 2050 that is 44 per cent lower than the reference case Because agrifood consumption is sensitive to changes in income the total value of agrifood consumption in 2050 (in 2009 US dollars) is 10 per cent less than in the reference case (Figure 19) Weaker economic growth most
Fruit Vegetables Starchy staples
Beef Poultry Sugar Maize Dairy Sheep and goat meat
Wheat
10
20
30
40
50
2050 Imports
2050 Domestic production
2009 imports
2009 Domestic production
53
3
4743
86
8183
1007091
9
75846723
6
100
Billion(2009 US$)
21
50
30
strongly affects urban areas where average annual income growth in the reference case was assumed to be more than double that of rural areas As a result demand for high-value products such as meat and dairy products declines significantly Many of these products are imported In 2050 the total projected value of beef consumption (in 2009 US dollars) is 17 per cent lower than in the reference case and poultry and milk products are each 14 per cent lower The real value of consumption for many domestically produced products such as starches and maize also declines but by no more than 10 per cent for any single commodity
Weaker consumption growth leads to lower import growth over the projection period particularly for high-value commodities The total value of imports in 2050 is 16 per cent lower in this scenario compared with the reference case with the import share of total consumption 5 percentage points lower than the reference case at 42 per cent (Figure 19) Beef imports are projected to be 20 per cent lower than the reference scenario sheep and goat meat 26 per cent lower and dairy products 16 per cent lower Fruit and vegetable imports are 12 per cent and 19 per cent lower respectively
Figure 19 Agrifood consumption in 2050 under lower income growth assumption
Source ABARES model output
0 100 200 300 400
Low income scenario
Baseline case
Domestic production
Imports
Billion(2009 US$)
4258
53 47
31
6 Conclusion Continued strong income and population growth combined with greater urbanisation are driving Indonesias increasing demand for not only more food but for a wider variety of foods This demand growth is projected to be met by increases in both domestic production and imports
Assuming no major changes to Indonesias existing agricultural policies to 2050 the real value of food consumption in Indonesia is projected to increase more than four times between 2009 and 2050 The increase will be characterised by a move towards more diverse diets with higher intake of meat dairy products fruit and vegetables Between 2009 and 2050 the real value of beef consumption is projected to rise more than 14 times dairy tenfold and fruit and vegetables to more than triple These projected increases are from a relatively low base and are driven by a rise in the quantities consumed rather than any significant projected rise in real prices To support this rise in demand imports of many agrifood commodities are projected to increase to 2050
The contribution of meat dairy products fruit and vegetables in Indonesian diets will increase more quickly than cereals and staples to 2050 While cereals and starchy staples will remain important components of Indonesian diets their relative contribution will declinemdashthe continuation of a trend that began around 1990
The upward trend in food demand is most pronounced among urban households whose income growth is assumed to be more than double that of rural households A declining rural population and relatively lower incomes will result in slower growth in food consumption compared with the urban population
For most agricultural commodities assuming no significant change to historical TFP growth for total agriculture production is projected to increase at a slower rate than consumption As a result food imports will be an important component of Indonesias food and feed supply towards 2050 The real value of Indonesias agrifood imports is projected to rise more than 20 times from 2009 to US$152 billion (in 2009 US dollar terms) in 2050
The projected significant increases in consumption and import demand for food in Indonesia are based on the assumption of relatively strong income growth to 2050 Under a lower growth scenario consumption of protein-based food products such as meat and dairy products is projected to be around 14 to 17 per cent lower than the reference case at 2050 While consumption of domestically produced products is also projected to be lower in 2050 in the lower-income-growth scenario the declines are less significant compared with the baseline case
While not included in the modelling in this report there is scope for increased production of non-food agricultural commodities and cash crops in Indonesia in which it has a comparative advantage These include natural rubber copra palm kernels coffee cocoa and spices Indonesias current policies on food self-sufficiency favour investment in food industries rather than the non-food and cash crops industries This has the effect of allocating resources away from their most efficient use
Because of their geographic proximity Australia and Indonesia are well placed to benefit from advancing bilateral agricultural trade Indonesia is an important market for Australian wheat sugar live cattle beef skim milk powder and horticultural products such as grapes and citrus
32
Stronger demand for these commodities and others in Indonesia will create further opportunities for Australian exporters
33
References ABARES 2013 Agricultural commodities September quarter 2013 Australian Bureau of Agricultural and Resource Economics and Sciences Canberra pp 85-87 available at agriculturegovauabarespublications
Afif S 2014 The Rising of Middle Class in Indonesia Opportunity and Challenge Paper presented at the International Policy Exchange Conference Segovia Spain 28 September available at umdcipeorgconferencesDecliningMiddleClassesSpainpapers_presentationshtml
Alexandratos N amp Bruinsma J 2012 World agriculture towards 20302050 the 2012 revision ESA Working paper no 12-03 Food and Agriculture Organization of the United Nations Rome available at faoorgeconomicesaesagen
Djajanegara A 1999 Local livestock feed resources in Livestock industries of Indonesia prior to the Asian financial crisis Food and Agriculture Organization of the United Nations Rome available at faoorgdocrep004AB986Eab986e06htmbm06 accessed 22 January 2015
Elias S amp Noone C 2011 The growth and development of the Indonesian economy Bulletin December Quarter Reserve Bank of Australia Sydney available at rbagovaupublicationsbulletin2011dec4html
FAO 2015 lsquoFAOSTATrsquo Food and Agriculture Organization of the United Nations Rome available at faostat3faoorghomeE accessed 26 October 2015
mdashmdash 2013 Indonesia Food and Agriculture Organization of the United Nations Rome available at faoorgdocrep005y4632ey4632e0lhtm
mdashmdash2012 GeoNetwork Food and Agriculture Organization of the United Nations Rome available at faoorggeonetworksrvenmainhome accessed 15 February 2014
mdashmdash 2005 Fertiliser use by crop in Indonesia Food and Agriculture Organization of the United Nations Rome available at faoorgdocrep008y7063ey7063e00htm
Fuglie K 2012 lsquoProductivity growth and technology capital in the global agricultural economyrsquo in Fuglie KO Wang SL amp Ball VE (eds) Productivity growth in agriculture an international perspective CAB International Oxfordshire UK
mdashmdash2010 lsquoSources of growth in Indonesian agriculture Journal of Productivity Analysis vol 33 no 3 pp 225-240
Fuglie K amp Rada N 2014 International Agricultural Productivity United States Department of Agriculture Economic Research Service Washington DC available at ersusdagovdata-productsinternational-agricultural-productivityaspxU089bfmSzkd
Global Business Guide Indonesia 2012 Agriculture in Indonesia available at gbgindonesiacomenagriculturesector_overviewphp
Glover J 2011 lsquoAn international retailerrsquos perspectiversquo Paper presented at The Crawford Fund 2011 Annual Parliamentary Conference Parliament House Canberra 14 August available at crawfordfundorgevents2011-parliamentary-conference
34
Hamshere P Sheng Y Moir B Syed F amp Gunning-Trant C 2014 What China wants Analysis of Chinas food demand to 2050 ABARES research report Canberra March available at agriculturegovauabarespublications
IMF 2015 World Economic Outlook Database available at imforgexternalpubsftweo201302weodataindexaspx accessed 26 October 2015
Indonesian Central Bureau of Statistics 2015a Poverty available at bpsgoidSubjekviewid23subjekViewTab3|accordion-daftar-subjek1 accessed 27 October 2015
mdashmdash2015b Consumption and expenditure available at bpsgoidSubjekviewid5subjekViewTab3|accordion-daftar-subjek1 accessed 27 October 2015
mdashmdash2015c Population 15 Years of Age and Over Who Worked by Main Industry 2004-2014 available at bpsgoidlinkTabelStatisviewid970 accessed 27 October 2015
mdashmdash2014 Consumption and expenditure available at bpsgoidSubjekviewid5subjekViewTab3|accordion-daftar-subjek1 accessed 20 February 2014
mdashmdash2011 Total income by Household Group (billion rupiahs) available at bpsgoidSubjekviewid5subjekViewTab3|accordion-daftar-subjek1 accessed 1 August 2014
Khajali F amp Slominski BA 2012 lsquoFactors that affect the nutritive value of canola meal for poultryrsquo Poultry Science vol 91 no 10 pp 2564ndash2575 available at psoxfordjournalsorgcontent91102564fullxref-ref-95-1
Linehan V Thorpe S Andrews N amp Beaini F 2012a Food demand to 2050 Opportunities for Australian agriculture paper presented at 2012 ABARES Outlook conference Canberra 6ndash7 March available at daffgovauabarespublications
mdashmdash 2012b Food demand to 2050 Opportunities for Australian agriculturemdashalgebraic description of agrifood model technical annex to ABARES Outlook conference paper Canberra May available at daffgovauabarespublications
Ludena C Hertel T Preckel P Foster K and Nin A 2007 Productivity growth and convergence in crop ruminant and nonruminant production measurement and forecasts Agricultural Economics 37 available at onlinelibrarywileycomdoi101111j1574-0862200700218xabstract
McKinsey Global Institute 2012 The archipelago economy Unleashing Indonesias potential September Jakarta available at mckinseycominsightsasia-pacificthe_archipelago_economyashx
OECD 2013 Global Food Security Challenges for the Food and Agricultural System Organisation for Economic Cooperation and Development Paris available at oecd-ilibraryorgagriculture-and-foodglobal-food-security_9789264195363-en
mdashmdash2012a Looking to 2060 A global vision of long-term growth Economics Department Policy Notes no 15 Organisation for Economic Cooperation and Development Paris November available at oecdorgecomonetarypolicy-noteshtm
35
mdashmdash2012b OECD Review of Agricultural Policies Indonesia 2012 Organisation for Economic Cooperation and Development Paris available at oecd-ilibraryorgagriculture-and-foodoecd-review-of-agricultural-policies-indonesia-2012_9789264179011-en
OECDndashFAO 2014 OECDndashFAO Agricultural Outlook 2014 Organisation for Economic Cooperation and Development Paris available at oecd-ilibraryorgagriculture-and-foodoecd-fao-agricultural-outlook-2014_agr_outlook-2014-en
Osorio C Abriningrum D Armas E amp Firdaus M 2011 Who is benefiting from fertilizer subsidies in Indonesia Policy Research Working Paper 5758 World Bank Washington DC available at elibraryworldbankorgdoipdf1015961813-9450-5758
Rabobank 2013 Indonesia - islands of opportunity Agriculture in Focus Rabobank Food amp Agribusiness Research and Advisory Australia and New Zealand Spring Sydney
Shahaf E 2009 Agriculture in Indonesia Asia Technology Consulting available at techasiaconsultingcomagriculture_in_indonesiahtml
Statistics Indonesia 2015 Gross Domestic Product at Current Market Prices By Industrial Origin (Billion Rupiahs) 2000-2014 available at bpsgoidlinkTabelStatisviewid1199 accessed 26 October 2015
Sudaryanto T 2014 Fertilizer subsidy policy in Indonesia impacts and future perspectives Food and Fertiliser Technology Center for the Asian and Pacific Region Asia-Pacific Information Platform on Agricultural Policy (AP) available at apfftcagnetorgap_dbphpid=365
The Canadian Trade Commissioner Service 2011 lsquoAn Investment Guide to Indonesia available at tradecommissionergccaengdocumentjspdid=133467toc38
United Nations Population Division 2015 World population prospects the 2015 revision United Nations New York available at esaunorgunpdwppindexhtm accessed 12 August 2015
mdashmdash2014 World urbanisation prospects the 2014 revision United Nations New York available at esaunorgunpdwup accessed 19 March 2015
USAID nd lsquoIndonesia ndash Property rights amp resource governancersquo USAID Country Profile available at usaidlandtenurenetindonesia
USDAndashFAS 2014 Indonesia grain and feed annual report 2014 GAIN Report no ID1407 1 April Foreign Agricultural Service United States Department of Agriculture Washington DC available at usdaindonesiaorgcat=10
Widarjono A 2012 Food and nutrient demand in Indonesia PhD thesis Oklahoma State University available at shareokorgbitstreamhandle112446547Department20of20Agricultural20Economics_48pdfsequence=1
World Bank 2015 Global Economic Prospects January 2015 Having fiscal space and using it World Bank Group Washington DC available at worldbankorgenpublicationglobal-economic-prospects
mdashmdash2014 World development indicators World Bank Washington DC available at dataworldbankorgdata-catalogworld-development-indicators
36
mdashmdash2013 Transport in Indonesia World Bank Washington DC available at goworldbankorgPF2AFG64V0
mdashmdash 2012a Raskin subsidised rice delivery Public expenditure review (PER) Social assistance program and public expenditure review no 3 World Bank Washington DC available at documentsworldbankorgcurateden20120215893857raskin-subsidized-rice-delivery
mdashmdash2012b Targeting poor and vulnerable households in Indonesia World Bank Washington DC available at documentsworldbankorgcurateden20120115879773targeting-poor-vulnerable-households-indonesia
mdashmdash2011 Indonesia Agriculture Public Expenditure Review 2010 World Bank Jakarta available at documentsworldbankorgcurateden20110919456223indonesia-agriculture-public-expenditure-review-2010
mdashmdash2010 Completing decentralization World Bank Jakarta available at documentsworldbankorgcurateden20100112012453completing-decentralization
mdashmdash2009 Investing in a more sustainable Indonesia Country Environmental Analysis Report No 50762-ID World Bank CEA Series East Asia and Pacific Region available at openknowledgeworldbankorgbitstreamhandle109863135507620v20Revis1ox0info10CEA1englishpdfsequence=1
mdashmdash2007 Horticultural producers and supermarket development in Indonesia World Bank Washington DC available at documentsworldbankorgcurateden2007068235822horticultural-producers-supermarket-development-indonesia
WTO 2013 Trade policy review Indonesia WTO Document WTTPRS278 World Trade Organisation Geneva available at wtoorgenglishtratop_etpr_etp378_ehtm
Yamauchi F 2014 Wage Growth Landholding and Mechanization in Agriculture Evidence from Indonesia World Bank Washington DC February available at openknowledgeworldbankorghandle1098617324
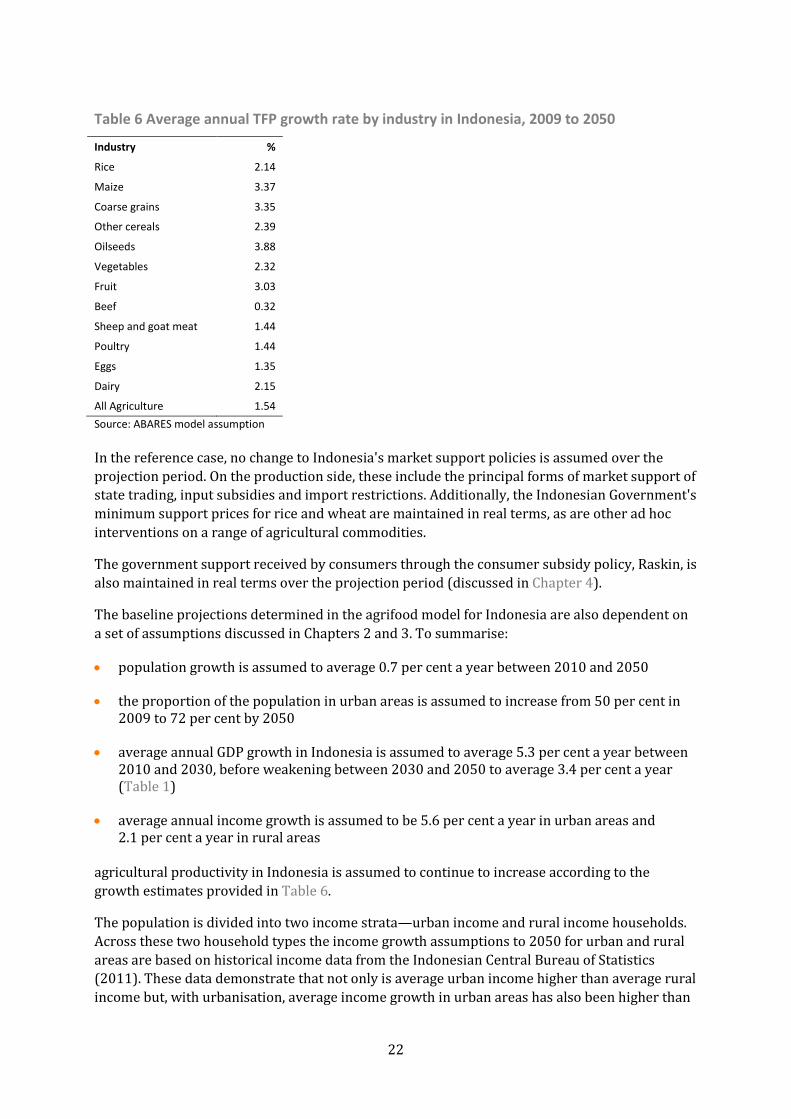
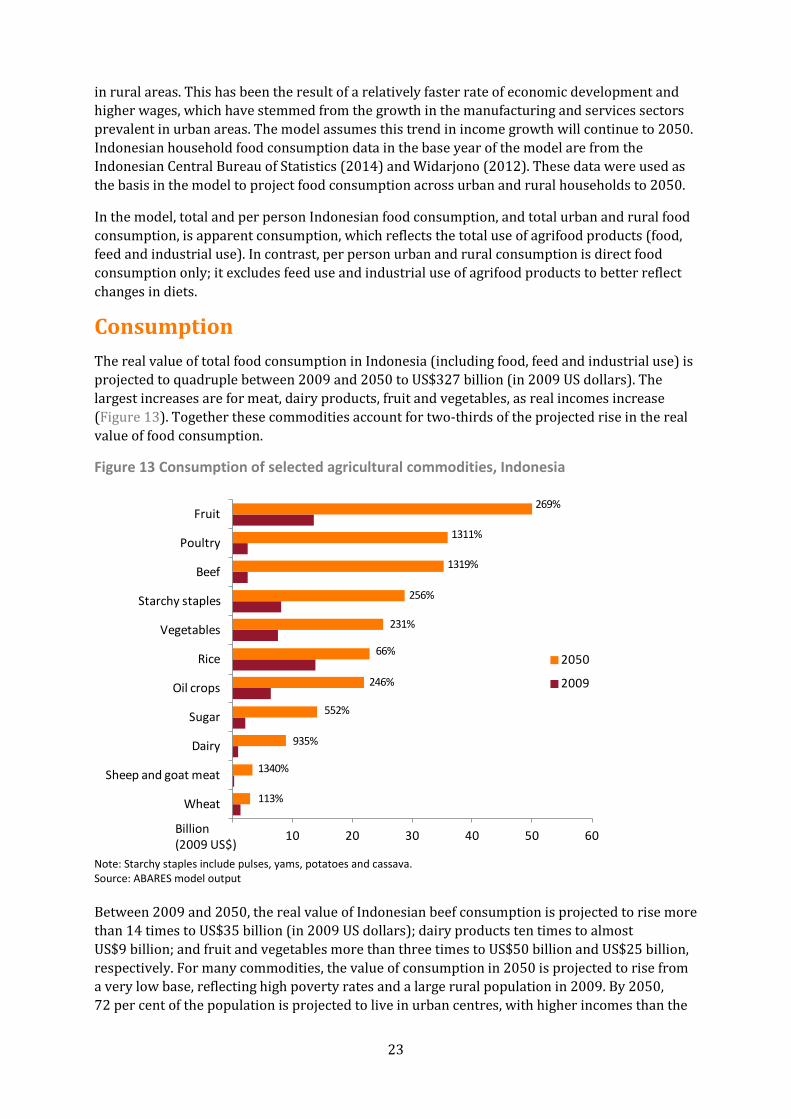
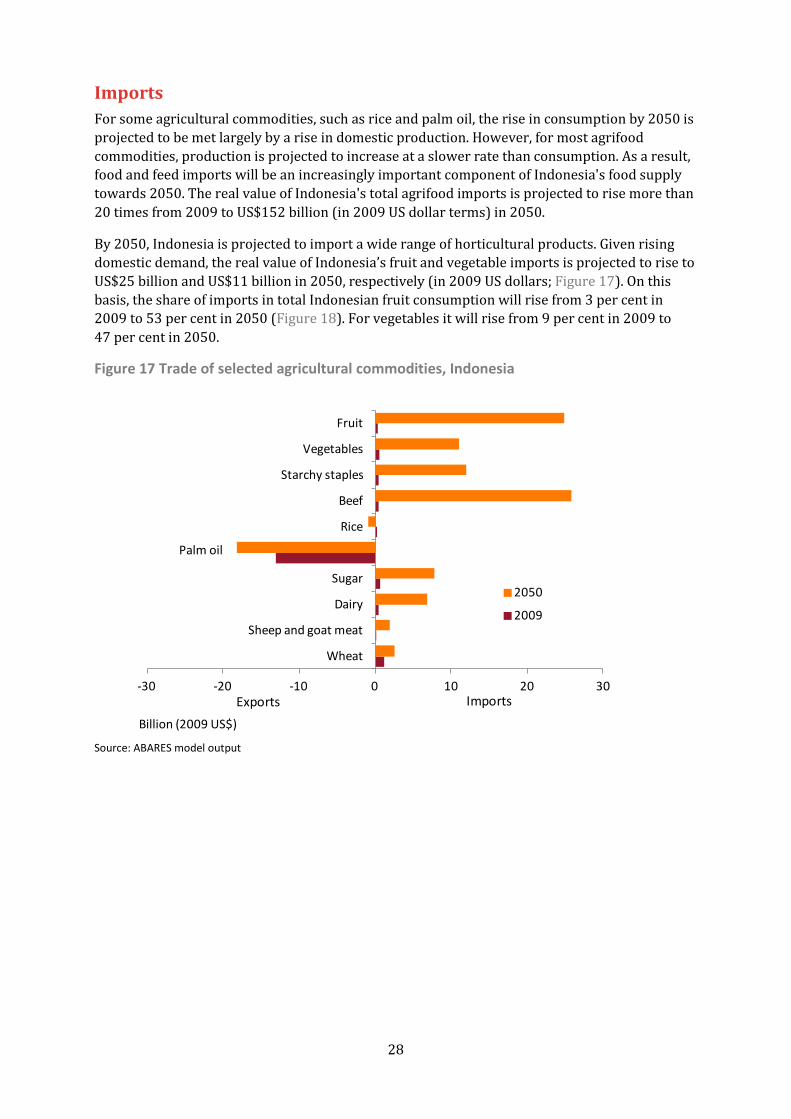
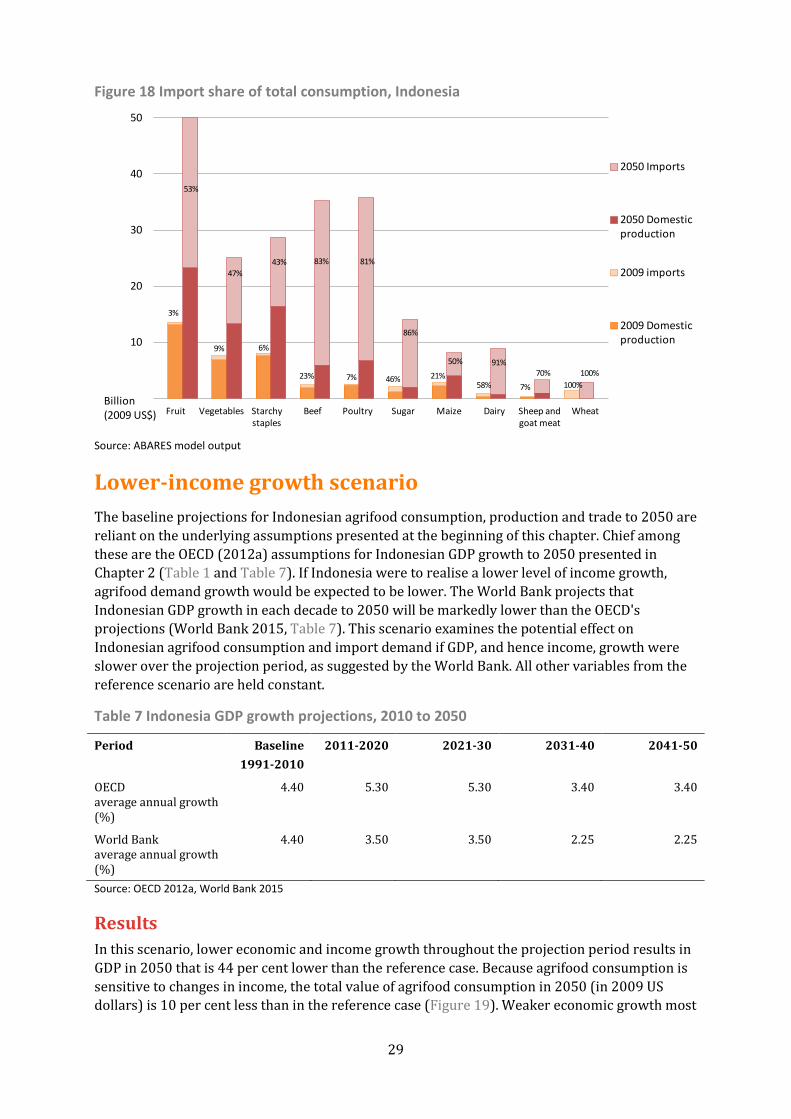
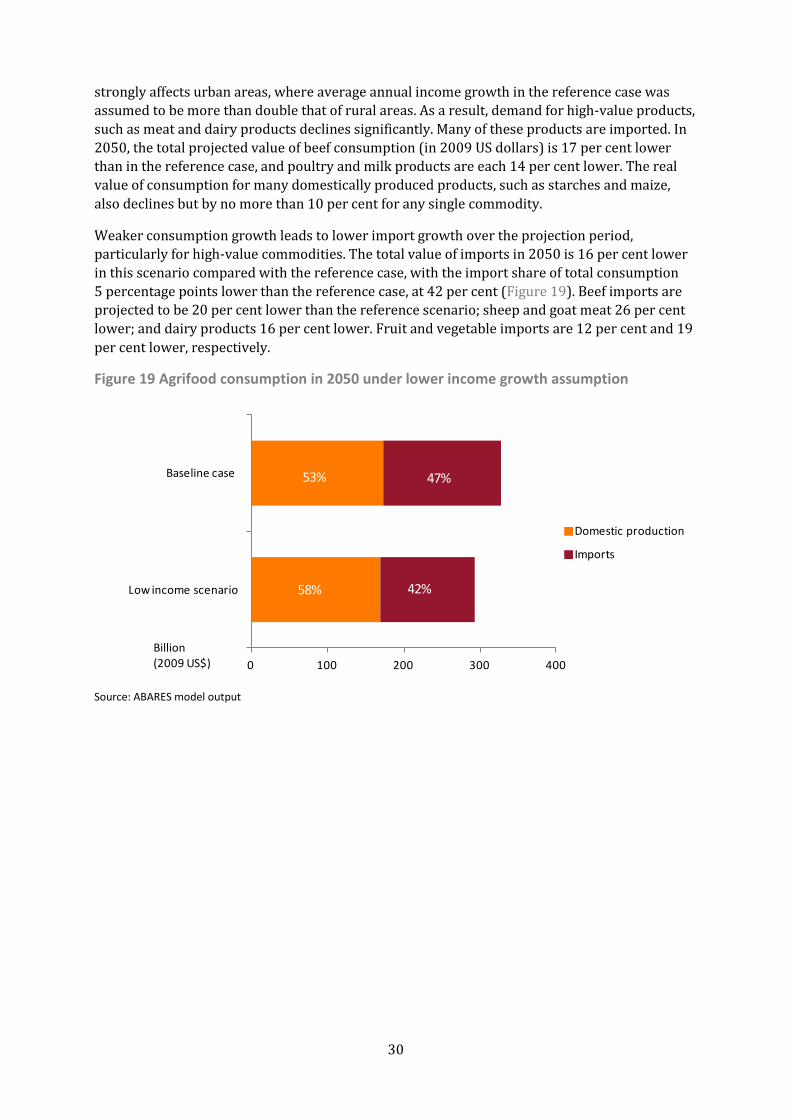
Top Related