


Languages
Pages
Legal

EAP Journal July 2017 9
WHAT CAN WE DO WITH THE ARCHIMATE LANGUAGE?
by Iver Band, Chair – Archimate Forum at The Open Group
June 24, 2017
Background: What is the ArchiMate Language?
Last year, the Open Group released version 3.0 of the ArchiMate® standard [1], which provides a
language with concepts for describing enterprise and solution architectures, a framework (
Figure 1) for organizing these concepts, a graphical notation for these concepts, and
recommendations for viewpoints, which are visualization templates that address the concerns of
particular stakeholders. The standard is public and free for end users. It can be extended through
specialization of its concepts and relationships, and is supported by an increasing number of tools,
consultancies and training organizations.

EAP Journal July 2017 10
Figure 1. The ArchiMate 3 Framework ©2016 The Open Group [1]
Figure 2 illustrates how the components of the ArchiMate language support all phases of the TOGAF®
[2] Architecture Development Method (ADM). In other words, as we will explore shortly, we can use
ArchiMate models to fully describe enterprises and their transformations.

EAP Journal July 2017
11
Figure 2. How the ArchiMate language supports all phases of the TOGAF ADM ©2016 The Open Group
[1]
But What Can We Do with It?
We will now use a fictitious—but realistic—case study to describe what we can do with the ArchiMate
language. Each of the next sections presents one or more views of an ArchiMate model that tells a
story about the collection and analysis of Big Data to create business value. Big Data consists of
datasets that cannot be handled efficiently with traditional centralized data architectures due to their
extensive volume, variety, velocity and variability. These characteristics demand scalable architectures
for efficient storage, manipulation and analysis [3].
So here is what we can do…
Depict an Industry Framework
The ArchiMate view in Figure 3 provides an overview of the US National Institute Standards and
Technology (NIST) Big Data Reference Architecture (NBDRA) [3]1. It shows the relationships between
three main groupings of capabilities, i.e. those provided by applications, infrastructure frameworks,
and supporting fabrics. It also depicts the key roles that realize2 or are served by these capabilities.
The view also shows flows of information and software between capabilities.
1 NIST has not, to the author’s knowledge, published an ArchiMate representation of the standard. The ArchiMate models in this article have not, to the author’s knowledge, been reviewed or approved by anyone representing NIST or its public working groups. 2 Realization is a key relationship in the ArchiMate language. Section 5.1.4 of the specification states that “The realization relationship indicates that an entity plays a critical role in the creation, achievement, sustenance, or operation of a more abstract entity” [1].

EAP Journal July 2017 12
Figure 3. An Overview of the NIST Big Data Reference Architecture [3]
The view in Figure 4. NBDRA Big Data Framework Capabilities with Resources [3] explores in greater
depth the Big Data Framework Capabilities introduced in Figure 3. It shows the resources that are
used to deliver, or in ArchiMate terms, are assigned to each capability, and also how Software-
Defined Data Centers aggregate two types of resource managers.
FIGURE 4. NBDRA BIG DATA FRAMEWORK CAPABILITIES WITH RESOURCES [3]
EAP Journal July 2017
13
Show What’s Driving an Organization
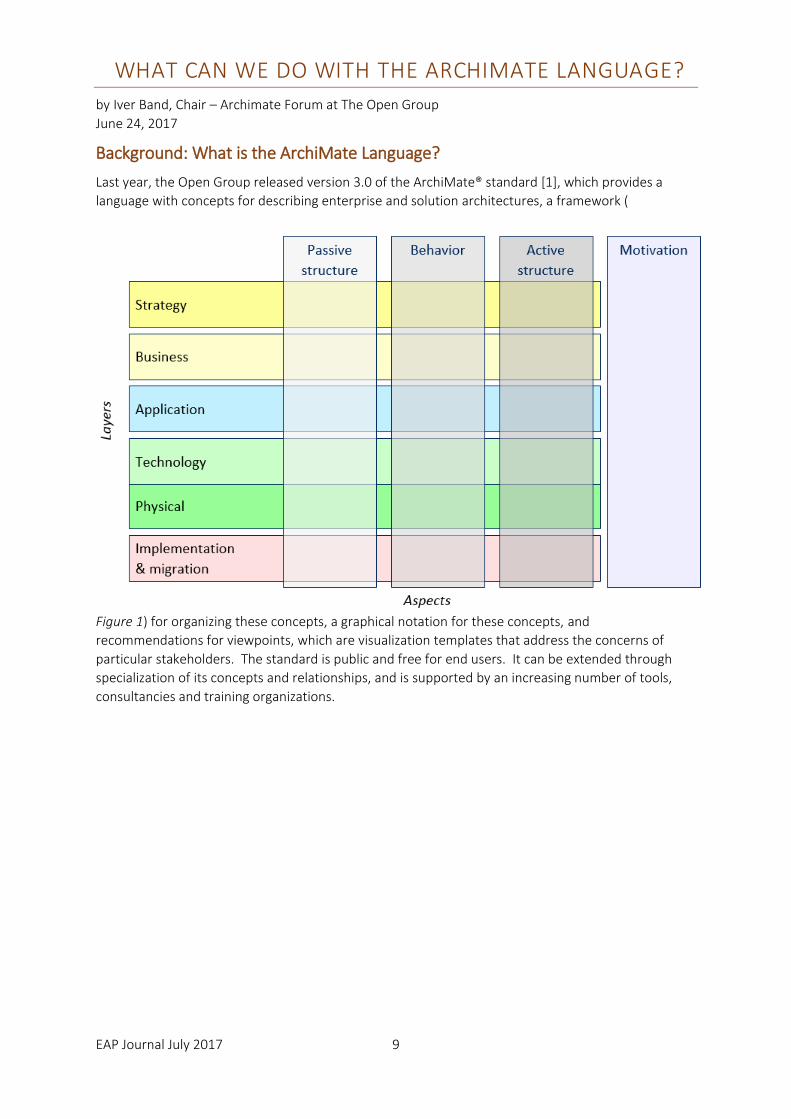
The view in Figure 5 shows the motivation of an enterprise, in this case a partnership between a
health insurer and a digital health platform. The CEOs of both organizations share the goal of
determining how tracked physical activity affects health, although they have different underlying
motivations. The health platform CEO is eager to demonstrate the value of his company’s offering,
while the health insurer CEO wants to justify the cost of achieving another goal. The health insurer is
providing fitness trackers to all new individual health plan members because of the CEO’s concerns
about the rate of growth of his company’s individual line of business, and resulting individual claims
experience, i.e. the types, frequencies and costs of claims.
In order to achieve their shared goal, the two CEOs must lead their organizations to satisfy four key
requirements. They must collect claims data, collect fitness tracker data, link the two data streams by
consumer and time period, and analyze the linked data. As seasoned leaders, they proceed to form
the right team.
Describe a Project Team
The Fitness Tracker Analytics project team (Figure 6) is led by a data scientist and a consulting
physician from the health insurer, along with a big data solutions architect and a project manager
from the health platform company. Together, these four fulfill the NBDRA role of System
Orchestrator, while other people and organizations, i.e. ArchiMate business actors, fulfill other
NBDRA roles. Both the health insurer and the health platform company are Data Providers, the health
platform company is the Big Data Application Provider, and both an actuary from the health insurer
and a market researcher from the health platform company are data consumers.
FIGURE 5. FITNESS TRACKER ANALYTICS MOTIVATIONS

EAP Journal July 2017 14
Describe Applications and Relate Them to Organizational Strategy
Figure 7 shows the NBDRA Big Data Application capabilities and how they are realized by application
behavior, specifically by a series of application processes. The Collection capability is realized by the
Gather Claims and Activity Data process, which takes input data and places it in the Data Lake. Then
the Link Data process, which realizes the Preparation capability, links together Activity, Claims, and
Demographics data by associating each record with a uniquely identified person. The Analytics
Capability is realized by the Compute Scores and Prepare Data for Visualization processes. Compute
Scores is at the core of the entire effort, since it prepares a set of statistics for each consumer,
including the degree to which tracked physical activity has improved the consumer’s health.
FIGURE 6. FITNESS TRACKER ANALYTICS PROJECT TEAM
FIGURE 7. FITNESS TRACKER ANALYTICS DATA PROCESSING

EAP Journal July 2017
15
Figure 8 examines a key part of the Compute Scores application process in detail. It contains a sub-
process, Compute Periodic Claims Scores, which in turn contains three sub-processes that execute a
MapReduce algorithm [4]. Beginning with Claims records that are linked to Person Ids3 and
partitioned across multiple physical servers, a mapping process groups claims by Person Id within
each partition. Then, a shuffling and sorting process groups claims by Person Id across all partitions,
i.e. so each partition contains all the records of one or more consumers. Finally, a reducing process
computes periodic claims scores for each consumer described in each partition. This results in
periodic cost and health scores for each consumer sufficiently described by the input data set. All of
these processes are executed by the Claims Analytics Script.
Besides describing application behavior along with a bit of application structure and underlying
technology, Figure 8 also relates that behavior to business strategy and motivation. The Compute
Periodic Claims Scores application process realizes the Analytics capability, which in turn realizes the
Develop Fitness Tracker Analytics course of action, i.e. the core strategy of this insurer-health
platform partnership. This strategy realizes the shared goal of determining how tracked physical
activity affects health.
Figure 9 describes the technology underlying the Claims Analytics Script, and ties the technology
components back to the NBDRA by assigning them to the Big Data Framework resources described in
Figure 4. The script uses a HADOOP stack [5]. Each system software component in the stack realizes
either the Batch Processing Framework, the Intra-Framework Resource Managers, or the File
Systems. The distributed processing environment realizes the Computing Infrastructure, while the
data center housing that environment realizes the Environmental Infrastructure.
3 In this scenario, each Person Id uniquely identifies a consumer of both insurance from the health insurer and activity tracking services provided by the health platform via wearable devices.
FIGURE 8. CLAIMS DATA PROCESSING WITH MAPREDUCE

EAP Journal July 2017 16
Depict a Multi-Phase Implementation Project
Figure 10 shows a series of plateaus4 realized by a corresponding series of project work packages. For
example, after the project is approved, the Develop Initial ETL (Extract, Transform, Load) Processes
work package realizes the Data Acquired plateau, in which the Gather Claims and Activity Data
application process writes to the Data Lake.
Model Order Fulfillment for a Physical Product
4 Section 13.2.4 of the ArchiMate 3.0 specification states that “A plateau represents a relatively stable state of the architecture that exists during a limited period of time” [1].
FIGURE 9. CLAIMS DATA PROCESSING TECHNOLOGY WITH RESOURCE REALIZATION
FIGURE 10. FITNESS TRACKER ANALYTICS IMPLEMENTATION PROJECT.

EAP Journal July 2017
17
Figure 11 shows how ArchiMate models can span the physical and cyber worlds. A connected health
device (CHD), such as a fitness tracker or a connected scale, is manufactured in Germany and sent to
a distribution center in California via intermodal freight. A consumer uses a website hosted in a
California data center to order a CHD. The order processing engine component underlying the
website transmits the order securely over the Internet to a distribution center, where a pick list is
printed and a worker uses it to pack and ship the order via overnight delivery to the consumer’s
mailbox.
Conclusion: What You Can Do with the ArchiMate Language
We have briefly touched on all major parts of the ArchiMate language (Figure 1), and have begun to
see that the ArchiMate standard provides a complete language for describing enterprises, how they
change, and the internal and external factors driving those changes. There is much more to the
language, but hopefully this whirlwind tour has whetted your appetite to learn more.
You should now have a general sense of what the language can do. To learn more about the language,
just start reading the specification [1], and download the free Archi tool [6], which is great for honing
your newfound knowledge and putting it to good use.
About the Author
Iver Band is Chair of the Open Group ArchiMate Forum, an Enterprise Architect at Cambia Health
Solutions in Portland, Oregon and a former editor of the Enterprise Architecture Professional Journal.
He has over thirty years of technology experience as an engineer, architect and manager in enterprise
IT and enterprise software R&D. For more about Iver, see his LinkedIn profile or his SlideShare site.
FIGURE 11. CONNECTED HEALTH DEVICE ORDER FULFILLMENT
Order
Processor
Internet
EAP Journal July 2017 18
References
The following materials are referenced in this article:
Please note that the links below function correctly at the time of writing but may not keep working.
[1] ArchiMate® 3.0 Specification, an Open Group Standard (C162), published by The Open Group,
June 2016; refer to: http://pubs.opengroup.org/architecture/archimate3-doc/.
[2] TOGAF® Version 9.1, an Open Group Standard (G116), published by The Open Group,
December 2011; refer to: https://www.opengroup.org/togaf.
[3] NIST Big Data Interoperability Framework Version 1.0, published by the US National Institute
of Standards and Technology, September 2015; refer to https://www.nist.gov/el/cyber-physical-
systems/big-data-pwg.
[4] MapReduce, published by Wikipedia contributors May 2017; refer to
https://en.wikipedia.org/wiki/MapReduce.
[5] What is Apache Hadoop®? published by the Apache Hadoop project, June 2017; refer to
https://hadoop.apache.org.
[6] Archi® version 4.02, software published June 2017 by Phil Beauvoir; refer to
https://www.archimatetool.com.
Top Related