


Languages
Pages
Legal


Wealth and Assets Survey Introduction to the survey and results
Simon Robinson and Matthew SteelOffice for National Statistics

Aims of the Presentation
• To introduce the Wealth and Assets Survey• To briefly outline its data collection and
methodological processes• To present some key findings from Wealth in
Great Britain 2010-12 and Wealth and Income 2010-12
• And to describe future plans for the survey

The Wealth and Assets Survey (WAS)
• WAS started in 2006
• WAS is a longitudinal household survey
• Collects data on• Savings and debt• Property ownership• Financial assets• Physical assets• Pensions and saving for retirement• Attitudes to saving• Financial capability• Income
• From around 30,000 households in first wave

How it works: Survey Design
• Longitudinal household survey
• Revisit households every two yearsWave 1 Wave 2 Wave 3 Wave 4 Wave 5
July 06–June 08 July 08-June 10 July 10-June12 July 12-June14 July 14-June16
• Keep In Touch Exercise between waves
• New cohort added
Year 1 Year 2 Year 1 Year 2 Year 1 Year 2 Year 1 Year 2 Year 1 Year 2

How it works: Sampling
• Systematic random sample• Over-sampling of wealthiest 10%• HMRC flags addresses likely to contain high wealth• Probability of selection increased by 3 times
-500
0
500
1,000
1,500
2,000
2,500
3,000
3,500
4,000
4,500
1st 2nd 3rd 4th 5th 6th 7th 8th 9th 10th
Billions (£)
Deciles
Private Pension Wealth
Physical Wealth
Financial Wealth (net)
Property Wealth (net)

Types of Wealth

Uses
• Distribution of wealth amongst UK population
• Value and types of assets held
• Saving for retirement
• Factors associated with saving and borrowing
• Wealth through the life cycle
• WAS is a unique longitudinal source of wealth, asset and debt data

Wave by Wave
• Waves 1 and 2• Available from UKDS
• Wave 3• Reports published (Wealth in Great Britain, Wealth & Income)
• Data to UKDS in July
• Wave 4• Year 1 processing• Year 2 data collection drawing to a close
• Wave 5• Questionnaire in the field
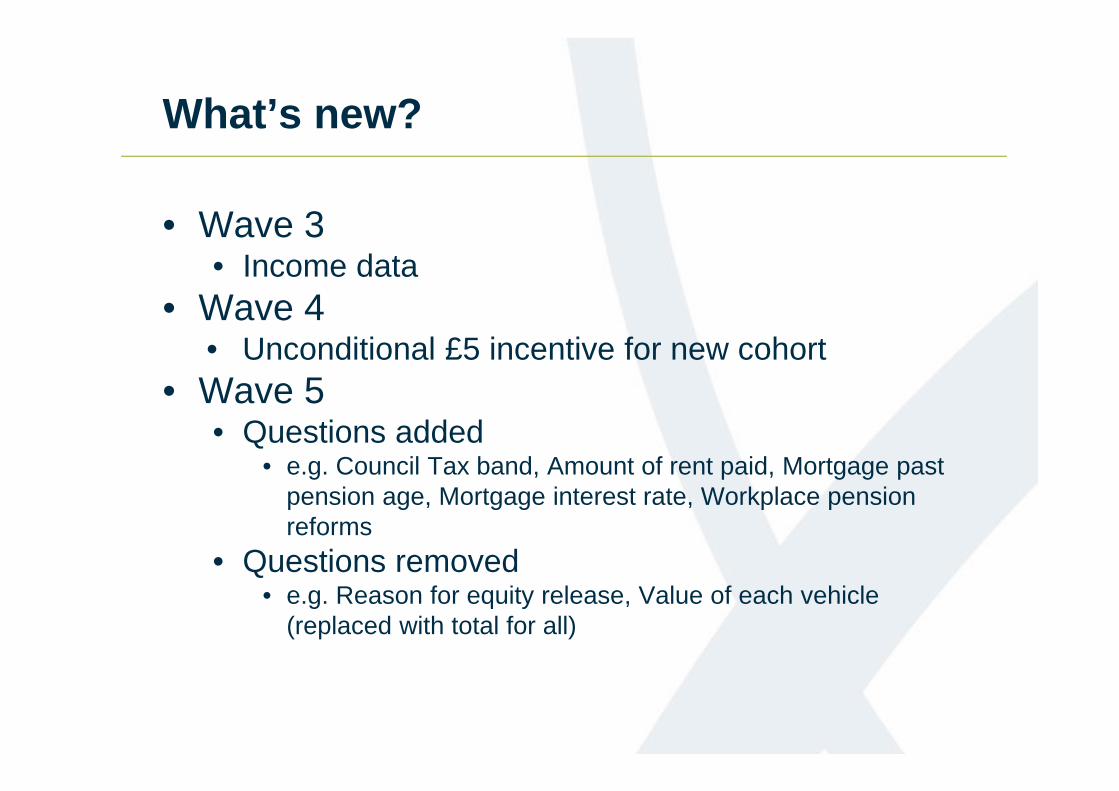
What’s new?
• Wave 3• Income data
• Wave 4• Unconditional £5 incentive for new cohort
• Wave 5• Questions added
• e.g. Council Tax band, Amount of rent paid, Mortgage past pension age, Mortgage interest rate, Workplace pension reforms
• Questions removed• e.g. Reason for equity release, Value of each vehicle
(replaced with total for all)

Response Rates
0%
10%
20%
30%
40%
50%
60%
70%
80%Ju
lS
epN
ov Jan
Mar
May Ju
lS
epN
ov Jan
Mar
May Ju
lS
epN
ov Jan
Mar
May Ju
lS
epN
ov Jan
Mar
May Ju
lS
epN
ov Jan
Mar
May Ju
lS
epN
ov Jan
Mar
May Ju
lS
epN
ov Jan
Mar
May Ju
lS
epN
ov Jan
Mar
May
Wave 1
Wave 2
Wave 3 Old Cohort
Wave 3 New Cohort
Wave 4 Old Cohort
Wave 4 New Cohort
New cohort: Apr13 48%, Apr14 54%

Quality assured data
• Checked & edited• Linked• Imputed• Weighted• Derived Variables added
• Ready for analysis
• Disclosure control• Delivery to customers and UKDA

UK Data Archive and user documentation

UK Data Archive and user documentation

Why is wealth so important?
• Personal asset holding is evolving – more of the population now own some kind of personal wealth– composition of wealth is changing
• Social policy has encouraged research to look at a broad evidence base including wealth when assessing peoples living standards.
• However…data on wealth was traditionally sparse• Consequently measures of household income are
often used as the sole gauge of economic well-being

WAS – Publications to dateWealth in Great Britain 2006-08December 2009
Wealth in Great Britain 2008-10 December 2011 - July 2012
Short Stories Series 2008-10Wealth of the Wealthiest, Property and Financial Debt Burden, Median Wealth Households, Inheritance
Wealth in Great Britain 2010-12 May 2014
Wealth and Income 2010-12July 2014

Analytical Potential
Households Eligible individuals
49,447 39,025W3 21,451
Individuals
30,641 24,898Linked W2 14,142
27,972 23,190Linked all 13,409


Some facts about wealth

Some facts about wealth

Some facts about wealth

Some facts about wealth

Analytical Potential
Households Eligible individuals
49,447 39,025W3 21,451
Individuals
30,641 24,898Linked W2 14,142
27,972 23,190Linked all 13,409

A longitudinal perspective of debt burden
0
500
1,000
1,500
2,000
2,500
3,000
2006/08 2008/10 2010/12
Indi
vidu
als
(thou
sand
s)
Year

A longitudinal perspective of debt burden
0
500
1,000
1,500
2,000
2,500
3,000
2006/08 2008/10 2010/12
Indi
vidu
als
(thou
sand
s)
Year
Non-persistent debtburdenPersistent debt burden

“Income and consumption are crucial for assessing living standards, but in the end they can only be gauged in conjunction with information on wealth”.
Report by the Commission on the Measurement of Economic Performance and Social Progress
Professors Joseph E. Stiglitz, Amartya Sen and Jean-Paul Fitoussi14 September 2009
Why is wealth so important?

Measures of National Well-being Wheel

Wealth and Income, 2010-12
0100200300400500600700800900
1,000
10 20 30 40 50 60 70 80 90
£ (T
hous
ands
)
Percentile
Total HouseholdIncomeTotal HouseholdWealth

Wealth and Income, 2010-12
0
10
20
30
40
50
60
70
80
90
100
0 20 40 60 80 100
Cumulative % Wealth/Income
Cumulative % Households
TotalWealthTotalIncome

Wealth and Income, 2010-12
0
10
20
30
40
50
60
70
80
90
100
Q1(Lowest)
Q2 Q3 Q4 Q5(Highest)
%
Income Quintile
Wealth Q5(Highest)Wealth Q4
Wealth Q3
Wealth Q2
Wealth Q1(Lowest)

Future Developments• Short Stories: Wealth and Well-being and
Financial Capability• Wave 3 microdata shortly available to users via
UKDS/VML• International comparisons: OECD tabulations
and Luxembourg Wealth Study• User Engagement
- Ongoing Development of user documentation- “How to analyse the Wealth and Assets
Survey” training courses
Top Related