


Languages
Pages
Legal


WATER AND RIVERS COMMISSIONANNUAL REPORT 2001–2002
WATER AND RIVERS COMMISSION
ANNUAL REPORT
NOVEMBER 2002

2
Water and Rivers Commission Annual Report 2001–2002
We welcome your feedback
A publication feedback form can
be found at the back of this publication,
or online at <www.wrc.wa.gov.au/public/feedback>
ISBN 1-920687-34-3
ISSN 1329-9816
November 2002
Recommended reference
The recommended reference for this publication is: Water and Rivers Commission2001 – 2002 Annual Report, Water and Rivers Commission, 2002.
Acknowledgments
This report was prepared by the Community Information and Publications section of theCommunications Branch.
For more information contact:
Water and Rivers CommissionLevel 2 Hyatt Centre3 Plain StreetEast Perth WA 6004
Telephone (08) 9278 0300Facsimile (08) 9278 0301
Postal address:PO Box 6740Hay StreetEast Perth WA 6892

3
Annual Report 2001–2002 Water and Rivers Commission
Letter to the Minister
Hon Dr Judy Edwards MLA
MINISTER FOR THE ENVIRONMENT AND HERITAGE
On behalf of the Board and in accordance with Section 65A of the Financial Administrationand Audit Act 1985, we have pleasure in submitting for presentation to Parliament the AnnualReport of the Water and Rivers Commission for the period 1 July 2001 to 30 June 2002.
This report has been prepared in accordance with provisions of the Financial Administrationand Audit Act 1985.
Ken WebsterCHAIRMAN OF THE BOARD
Perth, Western Australia30 August 2002

4
Water and Rivers Commission Annual Report 2001–2002
Chief Executive’s review
As predicted in last year’s annual report, 2001-02 was dominated by the challenge to build anew organisation, to develop our approach to environmental protection and natural resourcemanagement and to re-establish links with our stakeholders.
The task continues.
While legislatively we report as separate entities, the Water and Rivers Commission,Department of Environmental Protection and Keep Australia Beautiful Council are effectivelyoperating as one under the working title of Department of Environment, Water and CatchmentProtection.
Our role is to help manage the behaviours of community and industry to ensure a sustainablefuture for the environment and our quality of life.
We respond to this challenge by using a suite of approaches available to us: that is, to regulate,influence, educate, inspire and to negotiate.
Through this we are one of the key agents on behalf of the State for ensuring that sustainabledevelopment is allowed to proceed while maintaining Western’s Australia’s environmentaland ecosystem capital.
And we must achieve this complex and important balancing role while retaining credibilityand influence in a modern democracy.
We have the privilege of helping to deliver for our society, sustainable use and managementof the natural resources to achieve an appropriate quality of life: that is, socially acceptableecologically sustainable development.
And we should recognise that WA has potentially the best system for natural resourcemanagement and protection in Australia.
The merger of the former departments gives us the opportunity to define a new way toconduct our business and how we relate to the external world.
The merger brings with it the advantage of establishing an agency with the complete toolkitof negotiation, partnering and strong regulatory powers. And while I see these strongregulatory powers as a necessary part of our armoury, the department must also be adept atnegotiation and influence.
This does not imply a weakening of environmental standards. They are absolutely necessaryand rightly expected of us by the community.
This is about achieving good environmental performance in the most effective way. It isabout having as mature relationship with industry where real negotiation is possible and sitsalongside traditional enforcement.
We are also working across the agency to improve our links with the community and toengage them in meaningful ways in all aspects of our business.

5
Annual Report 2001–2002 Water and Rivers Commission
It is clear from the year in review that we have come a long way but that we also have muchwork to do.
I thank all of the staff of the amalgamating agencies who have continued to give their best inthis testing time.
I look forward to another productive year and the formal launch of the new department.
Roger F Payne
CHIEF EXECUTIVE

6
Water and Rivers Commission Annual Report 2001–2002
Contents
Acknowledgments 2
Recommended reference 2
Letter to the Minister 3
Chief Executive’s review 4
Contents 6
1 About the Water and Rivers Commission 9
1.1 Organisation structure 10
1.2 Changes to the Water and Rivers Commission following theMachinery of Government recommendations 11
2 Report on operations 14
2.1 Protection and enhancement 14
2.1.1 Salinity management 14
2.1.2 National Action Plan for Salinity and Water Quality 14
2.1.3 Waterways WA program 14
2.1.4 Wetlands 15
2.1.5 Constructed wetlands 15
2.1.6 Water source protection guidelines 15
2.1.7 State Algal Strategy 16
2.1.8 PhoslockTM work 16
2.1.9 New algae found 16
2.1.10 Research and development 17
2.1.11 Land clearing 17
2.1.12 Waterways and catchment protection 17
2.2 Allocation 18
2.2.1 Drought management 18
2.2.2 State Water Conservation Strategy 18
2.2.3 WA Water Re-use Forum 19
2.2.4 Water law reform 19
7
Annual Report 2001–2002 Water and Rivers Commission
2.3 Water information 20
2.3.1 Floodplain management 20
2.3.2 Water Information Database 20
2.3.3 Perth Groundwater Atlas 20
2.3.4 Indian Ocean Climate Initiative 20
2.3.5 Rural water plan 21
2.4 Corporate support 22
2.4.1 Community Involvement Framework 22
2.4.2 Freedom of Information 23
2.4.3 Information Services 24
2.4.4 People 25
3 Corporate governance report 28
3.1 Board overview 28
3.1.1 Board members 28
3.1.2 Changes to the Board 28
3.1.3 Accountability and independence 28
3.1.4 Performance monitoring and reporting 28
3.1.5 Board member profiles 29
3.1.6 Conflict of interest 30
3.1.7 Ministerial directions 30
3.1.8 Committees and other bodies 30
3.1.9 Board meetings 31
3.1.10 Waterways Management Authorities 32
3.1.11 Relationship with the Swan River Trust 32
4 Compliance reports 33
4.1 Responsible Minister 33
4.2 Statement of compliance with written law 33
4.2.1 Enabling legislation 33
4.2.2 Legislation administered 33
4.2.3 Other legislation impacting on Commission activities 33
4.2.4 Statement of compliance with Environmental Conditions 34
4.2.5 Advertising and sponsorship 35

8
Water and Rivers Commission Annual Report 2001–2002
5 Performance indicators 37
Statement by accountable authority on performance indicators 37
6 Financial statements 57
Appendix A – Regional Office details 80
Appendix B – Water words and glossary 81
Appendix C – Media releases 84
Appendix D – Publications produced during 2001-02 89
Publication feedback form 93

9
Annual Report 2001–2002 Water and Rivers Commission
1 About theWater and Rivers Commission
The Water and Rivers Commission is solely responsible for ensuring that Western Australia’swater resources are managed to support sustainable economic development and conservationof the environment, for the long-term benefit of the community.
The Commission achieves its outcomes and outputs by investigating and researching thequality, quantity and location of surface and groundwater resources, making decisions onthe allocation and management of water resources, and ensuring that water quality isconserved, protected and enhanced.
These activities are undertaken through four Divisions (Business Development andIntegration, Policy and Planning, Science and Evaluation, Regional Services), and aremanaged within four business areas (Protection and Enhancement, Water Allocation, WaterInformation, Corporate Support). Long-term plans and objectives are determined throughCouncils representing each business area. Divisions implement the projects through whichthese objectives can be achieved.
EVITUCEXEETAROPROC EVITUCEXESSENISUB
snoisiviD slicnuoCssenisuB
dnatnempoleveDssenisuBnoitargetnI
gninnalPdnayciloP
noitaulavEdnaecneicS
secivreSlanoigeR
troppuSetaroproC
noitacollAretaW
dnanoitcetorPtnemecnahnE
noitamrofnIretaW
seitilibisnopseR
tnemeganameniL•
ssenisubrevileD•
noissimmoCpoleveD•erutluc
ecnamrofreprotinoM•
DNANALPROTINOM
ETUBIRTNOC
seitilibisnopseR
sevitcejbossenisubteS•semoctuodna
snoitceridytiroirpredisnoC•stnemeriuqerecruoserdna
ecnamrofreprotinoM•
Figure 1: Water and Rivers Commission Business structure
Overall responsibility for corporate goals, direction, performance and budgets lies with theCommission’s governing body – the Board of Management.
During the 2001-02 reporting period, the Department of Environmental Protection, with theWater and Rivers Commission and the Keep Australia Beautiful Council, began working toa common, draft Vision and Mission, and with shared Principles.

10
Water and Rivers Commission Annual Report 2001–2002
Vision
A healthy environment and sustainable use of natural resources for the benefit of presentand future generations.
Mission
To lead the protection and enhancement of the State’s natural capital, working in partnershipwith the community. We achieve this through managing and influencing people’s attitudesand behaviours towards the environment and natural resources.
Our principles
For the environment and water resources, we will:
• Act in the long term public interest• Consider environmental, social and economic needs; and• Manage them in an integrated way with others.
And in all our dealings we will:
• Act with courage and integrity;• Respect our stakeholder’s views and contributions;• Be willing to make a constructive difference; and• Take responsibility for our individual and collective contribution.
1.1 Organisation structure
Early in the 2001-02 reporting period, the Water and Rivers Commission adopted a newdivisional structure jointly with the Department of Environmental Protection and the KeepAustralia Beautiful Council, which now operates under the Business Development Division.The amalgamation and restructure are detailed in the section on Changes to the Water andRivers Commission following the Machinery of Government Recommendations.
Minister for theEnvironment and Heritage
EnvironmentalProtection Authority
Policy andCoordination
EnvironmentalImpact
Assessment
BusinessDevelopment
ResourceManagement
EnvironmentalRegulation
ResourceScience
RegionalOperations
Chairman Director General
DEWCPDEP/WRC/KABC
Figure 2: New divisional structure of the amalgamating agency

11
Annual Report 2001–2002 Water and Rivers Commission
1.2 Changes to the Water and Rivers Commission followingthe Machinery of Government recommendations
The State Government’s 2001 Machinery of Government Taskforce report recommendedradical change for the environment and water resources portfolios. Most obvious and dramaticamong these was the formation of a new agency, the Department of Environment, Water andCatchment Protection. This department is being formed by the amalgamation of theDepartment of Environmental Protection, the Water and Rivers Commission and the KeepAustralia Beautiful Council.
Naturally, the scale and complexity of this change has ensured the project has consumedconsiderable resources during the past year. A key challenge has been to progress thedevelopment of the new department – organisationally and culturally – while maintainingour services to the community. This challenge has been difficult to meet in all cases but thebenefit in the future will be an integrated environment and natural resource managementagency for Western Australia.
The Department of Environment, Water and Catchment Protection’s key roles in resourcesassessment and allocation, coupled with strong environmental protection powers, will ensuresustainable use of resources for responsible development.
The new Department will continue the commitment to work with the community, all levelsof government and industry.
The Environmental Protection Authority remains as an independent statutory authority,serviced by its own staff for environmental policy development and environmental impactassessments. Its staff will be employed through the new Department but will report to theEPA.
Although the final operational model and governance structure is yet to be completed, thenew department is essentially operational as a combined entity.
The Department of Environment, Water and Catchment Protection’s roles are to:
• Investigate environmental systems such as waterways, groundwater and airsheds to ensurethey are managed to meet environmental quality objectives.
• Share environmental resources between competing uses to ensure sustainable use anddevelopment.
• Reduce the amount of waste produced and ensure that waste is managed to meet healthand environmental standards.
• Ensure discharges to the environment are minimised and that pollution of the environmentis prevented or abated.
• Provide local environmental and resource management services to key regions.
• Support development of environmental and water resources management policy.
• Ensure the community has the opportunity to provide input and to become involved inenvironment and water resource management initiatives.

12
Water and Rivers Commission Annual Report 2001–2002
Delivering better service
The amalgamation of the Department of Environmental Protection and the Water and RiversCommission is bringing together several resource and environmental management functionsin a way that provides a more integrated service to stakeholders and the wider community.Some areas where integration will be effective are:
• Pollution control, contaminated sites management and waste management, with the newagency having the complete toolkit of negotiation, partnering and strong regulatory powers.
• Water resources and airshed policy and guideline development.
• Resource protection licensing. For example, permitting and regulating activities that mayimpact on the environment.
• Development approvals. Industry stakeholders will no longer need to go through the twoseparate agencies when they deal with issues such as subdivision or mining proposals.
• Environmental monitoring. The new Department will have improved capacity formonitoring environmental systems such as waterways, groundwater and airsheds.
• Community liaison and education. Community education and involvement will continueto be essential to the Department’s way of operating.
• Regional services delivery, providing the opportunity to present single shopfronts for ourcustomers while still retaining sufficient specialisation in the issues we manage.
• Without doubt, one of the most important factors in improved land and water managementis engaging landholders in sustainable catchment management. The new Department willhelp to deliver ecologically sustainable development in rural and urban environments.
During the year the following actions have been undertaken to progress the creation of themerged entity.
• In some cases branches with the same functions have been amalgamated. Primarily thesebranches have been in the Corporate Services and Regional Services areas. In other casesbranches with similar functions have been brought into the same divisions. In each caseinterim structures have been established. Co-location for some merged units has beenachieved and is significantly advanced for others.
• Appointments to senior positions within the merged structure have been made and allother employees have been accommodated within it.
• The change-management process has been assisted by the development of a Staff LiaisonCommittee, cultural change initiatives, and working with stakeholders (within and outsideof the agency) to create the new organisation.
• A comprehensive staff communication strategy has been implemented to enable staff tounderstand the changes and to have input into the development of the new organisation.
• All human resource information for the agencies has been converted to a single system,the Concept HRMIS. This system enables further development of the e-businessrelationship with our employees. It provides a self-service module to all employees viathe agency intranet and allows access to personal information and Human Resource

13
Annual Report 2001–2002 Water and Rivers Commission
procedures. This further develops the self-sufficiency of managers and employees in thepeople management function.
• Waterways management authorities established under the Waterways Conservation Actwere disbanded and the functions subsumed into the Commission.
• A review of governance options for the proposed agency was conducted to define asustainable and effective agency structure prior to the definition of the legislative schemeto disband the Commission.
The corporate development and change program is continuing and will ensure that thedepartment is able to achieve the expected outcomes of the formation of the Department ofEnvironment, Water, and Catchment Protection.

14
Water and Rivers Commission Annual Report 2001–2002
2 Report on operations
2.1 Protection and enhancement
The Protection and Enhancement Business works to control salinity, protect and rehabilitatewaterways, protect drinking water supplies and develop natural resource managementstrategies, in partnership with the community. This year, the Swan River has been in goodcondition and no algal blooms were recorded.
2.1.1 Salinity management
During 2001-2002 a eucalypt sawlog program for salinity management was implementedand a business plan developed. In winter 2001, 170 hectares of eucalypt sawlogs were planted;400 hectares are planned for winter 2002.
Work has continued in Water Resource Recovery Catchments, including the evaluation ofmanagement options for the Collie River and the launch of the Collie statement in December2001. The recovery catchments strategy was implemented in Warren, Blackwood and Kentrivers and a salinity situation statement was released for the Denmark River Catchment.
The Commission evaluated engineering options for drainage at Spencer’s Gully, pumping atMaxon Farm, and relief wells at Lubkes and Kent River.
The Commission has also worked on arterial drainage and water management. A study wasdone in the Dumbleyung area and a management strategy devised for the Yenyening Lakes.
Future work will focus on the Salinity Investment Framework (SIF), which helps set prioritiesfor Government investment in salinity control. It has been trialled for statewide projects andregionally in the Avon.
2.1.2 National Action Plan for Salinity and Water Quality
The Commission has been a lead agency in the negotiations with the Commonwealth onimplementation of the National Action Plan for Salinity and Water Quality (NAP) and theextension to the Natural Heritage Trust (NH2) in WA. The two programs may provide around$40 million of Commonwealth funds to the State each year over the next five years, asignificant proportion of which will be used to implement regional Natural ResourceManagement (NRM) strategies that have been accredited through a process agreed by theNRM Ministerial Council.
The Commission staff are involved in assisting regional NRM groups in finalising theirregional strategies and in adopting the Salinity Investment Framework that is being used toidentify regional priorities for funding.
2.1.3 Waterways WA Program
The Waterways WA Program has, since 1996, supported on-ground restoration activitiesand worked to develop strategic directions for waterways management. During the past twoyears the Commission has provided advice on river restoration to over 700 groups, comprisedof more than 5000 people.
15
Annual Report 2001–2002 Water and Rivers Commission
In May 2002, the program’s River Restoration Manual was launched. This is a new guide tothe protection, rehabilitation and long-term management of metropolitan, south-west andgreat southern waterways. The River Restoration Manual, prepared by the Water and RiversCommission, is part of a successful program that teaches the community how to look afterand conserve our rivers. The manual describes how south-west rivers work, their ecologyand the techniques that can be used to rehabilitate them. The Commission produced themanual in response to growing community awareness and demand to tackle the causes ofwaterway degradation.
2.1.4 Wetlands
The Commission has worked to improve protection of “Conservation” Category Wetlands(CCWs) and will continue to do so. There is increasing recognition of the value of CCWsacross government and in the community. Work has continued on strategies to improve theirprotection.
2.1.5 Constructed wetlands
During 2001-02, the South Coast Region successfully completed a variety of best managementpractices for rural and urban drains, including three constructed wetlands. These werecompleted by working in partnership with local government, the Water Corporation,Environment Australia and local catchment groups. The wetlands are the first of their type inthe region, and among only a handful completed in WA. They are being monitored by theCommission to gauge their effectiveness in reducing nutrients entering coastal waters.
A manual is being prepared to assist others wishing to use constructed wetlands. In an alliedinitiative of the Swan Canning Cleanup Program, the Aquatic Science Branch has developeda state of the art design of a constructed wetland specific for Swan Coastal Plain conditions.This will treat urban runoff and address problems associated with high groundwater levelsusing a series of shallow vegetated swales within an ephemeral flood-plain.
2.1.6 Water source protection guidelines
The Commission works with other resource management agencies and appropriate industriesto develop guidelines for various land uses that could compromise surface and ground waterquality, particularly with respect to public drinking water supplies. These guidelines alsoserve to assist industry to manage their operations in a way that protects the quality ofprivate water supplies. During 2001-02 guidelines were completed on apiaries (standard siteconditions), cattle feedlots, horse facilities and activities, horticulture (with particular referenceto the potato growing industry), turf farms, and turf and grassed areas.
Work is currently being done on drainage, forestry, pastoral leases, pesticide use, androadworks in public drinking water supply areas (PDWSAs).
The development of guidelines for land use activities in PDWSAs is an essential requirementto enable the Statement of Planning Policy (SPP) for Drinking Water to be properly enactedand adopted by local governments and their planners. This SPP will require all localgovernment planners, when amending their local town planning schemes and regionalplanning schemes, to take into consideration the prior existence of any water reserves and toensure any rezoning of land is compliant to the priority classifications in the PDWS Protection

16
Water and Rivers Commission Annual Report 2001–2002
Plans. The SPP will also require a further 70 PDWSA protection plans to be completed as apriority.
In 2002-2003, guidelines will also need to be revised or developed for groundwater protection,urban stormwater management, sewerage systems (including effluent management, industrialwaste, sludge or biosolids management, use of reclaimed water, dealing with sewerage systemoverflows), dairy sheds, dairy processing plants, intensive piggeries, wool scouring, tanningand related industries, and effluent management for wineries and distilleries. Implementationof these guidelines is essential for compliance with the National Water Quality ManagementStrategy and for the State to receive Commonwealth funding from the National CompetitionCouncil.
2.1.7 State Algal Strategy
The Algal Bloom Strategy was completed in October 2001 and is now awaiting incorporationinto the Waterways WA Framework. The strategy documents what is being done, puts thatwork in a national and international perspective, and then looks at a revised approach. Itbuilds on statewide catchment management strategies. The main objectives of the strategyare to:
• Develop an understanding of the causes and triggers of algal blooms;• To maintain active surveillance of ‘at risk’ water bodies;• To reduce nutrient inputs from all catchment sources;• To facilitate community understanding of algal blooms and the factors that cause them;
and,• To develop a range of remedial options for in situ nutrient management in key waterways.
The Commission has worked with other Government agencies, particularly the Departmentof Health, to develop a coordinated statewide response strategy for algal blooms. TheDepartment of Fisheries is involved in this when fish kills are evident.
2.1.8 PhoslockTM work
This year the Commission continued to work with CSIRO on PhoslockTM. The Commissionhas completed two full-scale applications of PhoslockTM – one in the Vasse River in Busseltonand the other in the Canning River above Kent St Weir. Results indicate that PhoslockTM willbind available phosphorus in sediments; in both applications available phosphorus was reducedby 95 per cent. In the Vasse, algal activity was reduced in the treated area compared to theuntreated area and past records. In the Canning River results were less clear due to sufficientsources of phosphorus coming into the river from other sources.
For the first time water managers have a tool that can prevent phosphorus release from thesediment and can improve understanding of the effects of sediment phosphorus, runoff anddrain contribution.
2.1.9 New algae found
Research staff at the Commission identified a new strain of algae in Western Australia thisyear. Pfisteria is very toxic to fish and humans and extremely difficult to identify due to itslifecycle. To find and identify it was ground-breaking work.

17
Annual Report 2001–2002 Water and Rivers Commission
2.1.10 Research and Development
The Commission has maintained its investment in research and development activities overthe past year. Research and development activities are often incorporated into individualprojects proposals, although several significant individual activities have also been undertakenover the year. These include sponsorship of three honours projects, one masters project andtwo PhD projects at the University of WA and Edith Cowan University. Additional projectsare being undertaken by CSIRO and interstate universities on behalf of the Commission.Projects have focused on a range of issues, including water recycling, climatic andmeteorological studies, salinity, and sociology.
The Commission is also negotiating with CSIRO, State regulatory agencies and industrygroups to establish a Cooperative Research Centre for Contamination, Assessment andRemediation. The purpose of the CRC is to significantly improve the national capacity oncontaminated sites issues. A formal application developed and forwarded to theCommonwealth Government to be considered for funding, has been short-listed and thefinal stage of assessment will be completed at the end of October 2002. The new agencyformed by the amalgamation of the Commission and the Department of EnvironmentalProtection is a major player in the consortium, which involves an investment of $140 millionover a seven-year period.
2.1.11 Land clearing
The administration of the Country Areas Water Supply Act led to the issue of 21 clearinglicences covering 95.16 hectares. Five clearing licences were issued in the South CoastRegion, involving a total of 13.33 ha. Sixteen licences were issued in the South West Region,6 in the Wellington catchment (47.25 ha) and 10 in the Warren catchment (34.58 ha), involvinga total of 81.83 hectares.
2.1.12 Waterways and catchment protection
The Peel Waterways Economic Development and Recreation Management Plan review ofpublic submissions is in progress. Twenty-three submissions were received and it is plannedto release the final report in July 2002.
The Peel Inlet Management Authority (PIMA) continued to function in line with the directionof the Machinery of Government changes until members resolved on the 31 December 2001to formally submit letters of resignation. A Draft Partnership Agreement between the WRCBoard and the Authority was considered in December 2001.
The PIMA Communication and Education Working Group Action Plan has involvedidentifying key waterways stakeholders, surveying community concerns for the waterwaysand the promotion of PIMA and waterways management with community presentations.Community presentations have included six Progress Associations, Men of the Trees Peel,the Keep Mandurah Beautiful Committee and the Mandurah Licensed ProfessionalFishermen’s Association.
Significant progress in reducing the nutrient input from Gull Road Drain Amarillo into theSerpentine River included the fencing of a 2100 metre section, applying direct seeding andplanting 4000 seedlings.
To arrest estuary bank erosion along Coodanup Bay, 125 metres of rock revetment wallingwas installed.

18
Water and Rivers Commission Annual Report 2001–2002
2.2 Allocation
The Commission works with the community to ensure optimum use of the State’s waterresources for economic development within the bounds of acceptable environmental impactsand to meet the values of society. The most significant issue facing the Commission and thecommunity in this regard is the rapidly increasing demand for water. From 1985 to 2000,water use in WA doubled. It is expected to double again by 2020. The Commission is workingwith the community to determine how to best manage this problem.
The increased demand brings more areas under pressure from competing uses. TheCommission continues to work with the community to develop allocation policies. Forexample, the Gingin Water Resources Advisory Committee has guided the development of amerit selection process for allocating water to different purposes. Public meetings were heldto discuss different approaches and to help develop policies for allocating the water that canbe taken on a sustainable basis.
Another issue faced by the Allocation Business is that of increasing inter-regional competitionfor water. For example, Perth is a growing city but there are social, environmental andeconomic costs of bringing water to the city. Efficient water use is becoming critical. Allthese factors must be assessed and decisions made with stakeholder consultation.
2.2.1 Drought management
The challenge of increasing demand has been exacerbated by drought. The inflow into Perth’sstorage dams from the winter of 2001 is the second worst on record. It was only nine percent of the long-term average.
The Commission is the agency responsible for determining how much water can be taken;the Water Corporation delivers that water. In times of drought, the Commission’s job becomesone of balancing economic, social and environmental factors. For example, over the summerof 2001-02, the potential for environmental harm was not considered to be great enough tojustify the social cost of a total sprinkler ban. The Commission worked with the WaterCorporation, other government agencies, industry, and others to find the solution to balancingthe problem over the summer. The result was allowing sprinklers to be used two days a weekand encouraging people to minimise their water use. The community made a majorcontribution by reducing consumption by over 45 gigalitres, equivalent to more than 23 500Olympic-sized swimming pools.
2.2.2 State Water Conservation Strategy
The Commission is working with the Water Corporation to develop a State Water ConservationStrategy. It is planned to release the report in August 2002. Long-term, it is essential thatPerth increases its water efficiency.
The community is very interested in water issues and the Commission gives manypresentations at industry and community functions. It is essential that this high level ofpublic interest and commitment is maintained, as solutions to the State’s future water supplyissues can only be achieved through cooperative efforts. The focus will be on increasing thepolicy and planning framework to cope with future demand and to meet allocationrequirements.

19
Annual Report 2001–2002 Water and Rivers Commission
2.2.3 WA Water Re-use Forum
In line with the increasing focus on water efficiency, the Commission planned the WA Water
Re-use Forum to be held in the Kwinana Peel Region in July 2002. The forum will involve
local politicians, industry, local government and the Health Department. The aim is to establish
a Memorandum of Understanding to further promote the re-use of water on a regional scale.
Already, some industrial users have committed to converting to re-use water, saving an
estimated 3.6 gigalitres of scheme water over two years, with additional savings in the long
term.
The report from this forum will feed into the Water Taskforce, established by the Premier.
Following that, a three-day water symposium will be held in October 2002.
2.2.4 Water law reform
Work on water law reform continued this year in line with the National Competition Policy
(NCP) overseen by the Council of Australian Governments. In particular, work has progressed
on:
• Provision of water for the environment;
• Environment and water quality – integrated catchment management;
• Environment and water quality – National Water Quality Management Strategy; and,
• Water trading.
Progress has continued on the implementation of water allocations for the environment. The
Rights in Water and Irrigation Act 1914 formalises WA’s approach to providing water for
the environment through a tiered system of statutory water management plans on a regional,
subregional and local basis.
WA has endorsed an integrated catchment management/natural resource management policy
for the State. Partnership agreements between the WA Government and natural resource
management groups are being developed. These will provide support, clarify expectations
and quantify deliverables.
The State Water Quality Implementation Plan is being developed and will be a priority for
2002-2003. It was not prepared for release during 2001-2002 as priorities were diverted to
drought management. A draft implementation framework for Guidelines for Fresh and Marine
Water Quality and Water Quality Monitoring and Reporting are expected to be finalised by
August 2002. Dinking water supplies in WA are expected to meet these guidelines by
December 2002 (metropolitan areas) and 2005 (country areas). In the interim, local water
source protection plans are being prepared.
The National Competition Council assessed the Commission’s progress in implementing
the NCP and was satisfied with all aspects other than some elements of the water quality
protection program. The State and the NCC are now setting a program to complete the
outstanding items.

20
Water and Rivers Commission Annual Report 2001–2002
2.3 Water Information
The Water Information Business carries out monitoring studies and investigations to ensurethe Commission has high quality, verifiable and, in some cases, auditable data on waterresources.
2.3.1 Floodplain management
The WA Floodplain Management Council has developed a draft WA Floodplain ManagementStrategy in association with key stakeholders. It has been formulated to improve theeffectiveness of floodplain management and reduce losses and hardship caused by floods. Itwill also help stakeholders carry out floodplain management activities in an integrated manner.
Floodplain management studies were completed on the Gascoyne and Moore rivers. Theflood-monitoring network for the Blackwood River was also installed.
Of the ten basins previously identified as needing early-warning flood mitigation systems,most now have it in process. This is an internet-based system that enables anyone to log onand check water levels and potential dangers when a flood threatens. It is a valuable tool inpreventing damage to property, reducing panic and potentially saving lives.
2.3.2 Water Information Database
Access to the Water Information Database (WIN) has been improved this year. Externalaccess to data stored in WIN comes through a request to the WIN Provision Group. This canbe through the internet, over the phone or by email. The depth to groundwater in themetropolitan area can be supplied over the phone by the information officer.
Internal access to the database is available by requesting WIN training. Once staff membershave been trained, they are given access to the database and can extract data for their needswhenever they require. For infrequent users, it is more efficient to send a data request to theprovision team, who provide the data in the requested format. The turn-around time dependson the size of the data set and any value-adding required. It is generally within two days andis often the same day.
2.3.3 Perth Groundwater Atlas
The Resource Information Branch and the Irrigation Industry Association (WA) have appliedfor $30 000 from the Natural Heritage Trust to fund part of the redevelopment of the PerthGroundwater Atlas. The drilling and irrigation industry and hydrogeological consultants usethe atlas extensively. The printed version used in the field will be updated and reprinted.Funds from sales of the printed version will be used to redevelop the website. This providesa live version, which will be automatically updated whenever the underlying data sets aremodified.
2.3.4 Indian Ocean Climate Initiative
The fundamental aim of the Indian Ocean Climate Initiative (IOCI) is to support informeddecision-making for climate affected sectors within Western Australia’s socio-economic andenvironmental management and planning.

21
Annual Report 2001–2002 Water and Rivers Commission
IOCI is a partnership between state agencies and research partners CSIRO and the Bureau ofMeteorology Research Centre.
In mid 2001, the Commission and partner agencies, with the Australian Greenhouse Office,held a workshop on south west climate variability. Numerous briefings on climate have beenmade to government agencies and peak bodies including the Greenhouse Taskforce.
The immediate outcome goals for a renewed phase of the IOCI program are:
• a science based development and implementation of the State Greenhouse Strategy,particularly in respect to adaptation;
• significant benefits in planning outcomes through continued improvements inunderstanding regional climate change and in predicting future expectations;
• effective use of climate information in operational management decisions includingapplications where useful inter-seasonal forecasting has been developed; and
• well targeted communication of climatic information which is of real practical assistanceto policy-makers and decision-makers.
The importance of IOCI’s goals has been made evident by the change of climate regime inthe South-West over the last quarter century. These shifts appear to have involved an inter-play of natural phenomena and the Enhanced Greenhouse Effect. On-going research onWestern Australia’s climate is designed to support the drafting of the State GreenhouseStrategy as well as building upon past studies of natural variability. The initiative will continueto foster regional application of national and international development in climate research,and develop specific tools and applications relevant to regional decision-priorities.
2.3.5 Rural Water Plan
The Rural Water Plan is a new program in the Water and Rivers Commission followingtransfer of the program from the Office of Water Regulation in December 2001. Over thepast seven years the Plan has played a significant part in the successful implementation ofwater supply initiatives that have resulted in an improvement in water supplies to a numberof rural towns and communities as well as over 2000 farming businesses.
The year was highlighted by the integration of the Plan into the Commission’s Businessstructure and the continued delivery of rural water programs in the medium to lower rainfallareas of the State. Program delivery is consistent with directions set in the Farm Water Planreview undertaken in 2000/2001. The Plan provides strategic direction to address the problemof water deficiency in dryland farming districts of the agricultural area.
The Rural Water Program objectives are to:
• Encourage self-sufficiency in on-property (farm) water supply,• Improve the reliability, continuity and quality of on-property water supply, and• Provide rural communities with reliable emergency water supply arrangements.
The key Rural Water Plan programs are:
• Farm Water Grants Scheme,• Pastoral Water Grants Scheme,

22
Water and Rivers Commission Annual Report 2001–2002
• Community Water Supply Program,• Water Deficiency Arrangements, and• Agricultural Area Dams.
The Farm Water Grants Scheme, Community Water Supply Program, and the Rural WaterSupply Coordinating Committee have been very successful in promoting and encouragingthe development and installation of improved water supply infrastructure in those rural areasof the State suffering from serious water deficiency.
2.4 Corporate support
The Corporate Support Business, which provides systems, policies and practices to optimisethe Commission’s people, finances, information, assets and stakeholder interactions, washeavily influenced by amalgamation. Staff in the business have been busy bringing the variousoperating systems of the Commission and the Department of Environmental Protectiontogether into one system. The Commission had planned to introduce the State RecordElectronic Data Management system in 2001-2002 but this was deferred until next year inview of amalgamation.
The amalgamation of the WRC and DEP necessitated the immediate major reorganisationof the Corporate Support Business. Among the many challenges was provision of access forstaff of two previously separate agencies to common corporate support systems. Theseincluded financial reporting, human resource management, the communications networkand corporate data systems. Developing a unified approach to business processes that werepreviously subject to different policies presented a special challenge. These processes directlyaffected people’s daily working lives and involved change for many people. Although notwithout difficulties, the reorganisation of corporate services has been achieved successfully.
2.4.1 Community Involvement Framework
‘Working in partnership with the community’ has been identified as a key component of thebusiness of the new department. While community involvement has been an essential approachof the amalgamating agencies for many years, the birth of a new department provides a greatopportunity for recommitment and realignment to best practice and to new common goalsand to benefit from the synergies of complementary programs.
The department has begun developing a Framework for Community Involvement, whichwill encompass and draw together a coherent policy framework for all staff.
In summary the process includes:
• Targeted research into the underlying corporate culture fostering DEWCP communityinvolvement practices;
• Workshops with staff and external stakeholders; and
• Establishment of internal and external reference groups to provide input into theframework’s development.
Key elements of the framework will be a clear policy direction in community involvementfor DEWCP, a strategy for developing the community involvement culture in the agency and

23
Annual Report 2001–2002 Water and Rivers Commission
tools for program managers and officers to help incorporate community involvement inprograms.
The benefits of Community Involvement Framework will include:
• Improving communication and reducing tension between the wider community andgovernment departments;
• Better understanding public perceptions and better anticipating community response toactions and decisions of the department; and
• More effectively managing the expectations of the wider community and the departmentin consultation and involvement processes early in the development of projects.
The successful implementation of the Community Involvement Framework will require along-term process to influence the corporate culture of the Department.
Part of the strategy to effect this change is research into the current corporate culture ofDEWCP, and the motivators and barriers for implementation of a Community InvolvementFramework. This research showed divergent views about where we are now, but very highlyconsistent and positive views about where we need to be in the future; that is, an agency thatplaces very high value on communications and community involvement in our business.
As the framework is developed, with staff and stakeholder support, an intensive trainingprogram will be developed and implemented to ensure we have skills to deliver what isneeded.
In the meantime, the good community involvement work already under way in the departmentwill continue and, as the new department is finally launched, our relationships withstakeholders can be further consolidated.
This is already happening at an operational level, with the formation of a new CommunicationsBranch encompassing the community support and public affairs functions of the Water andRivers Commission, the Department of Environmental Protection and the Keep AustraliaBeautiful Council.
This area now hosts a suite of highly respected community education and involvementprograms such as AirWatch, Ribbons of Blue and WasteWise, as well as the busy areas ofmedia management, ministerial liaison, public information services and publications.
2.4.2 Freedom of Information
During the year, 40 Freedom of Information (FOI) applications were received by DEWCP.Of these, 38 were non-personal and two were personal. Nine of these were for the Commissionand 31 for the DEP. FOI applications to the Commission were made by:
Individuals/companies (6)
Members of Parliament (0)
Solicitors (2)
Community Groups (1)
In reference to documents released by the Commission, application packages ranged fromone document to 45 documents per package; the average number of documents per applicationpackage was 13.

24
Water and Rivers Commission Annual Report 2001–2002
No applications were refused. There were two internal reviews and two external reviews.The average processing time for each application was 37 days.
Areas of interest for FOI requests included land development, compliance of licensingconditions of premises, water rights, and proposals submitted for assessment. Exemptionclauses used were:
• Cabinet and Executive Council;• Personal Information;• Commercial or business information;• Law enforcement, public safety and property security;• Deliberative processes;• Legal Professional Privilege;• Confidential communications; and,• The State’s financial or property affairs.
2.4.3 Information Services
The merger of the WRC and DEP’s information services required consolidation to a commonstandard in a wide range of areas. These included servers, desktop machines and networkconfiguration; telecommunications and telephony; records and mail services; corporatesystems; software management; web sites (Internet and Intranet); Helpdesk services; emailand diary services. In each case, consultations with staff were held and feedback on proposedsolutions sought.
The most important issue was IT network service delivery – how PCs and servers are designedto interact with each other and deliver services across the network. The only commonalitywas in the software being used (Microsoft, Oracle and ESRI); hardware and network designwas significantly different. Because of the seriousness of the decision, impartial externalanalysis and advice was sought. Internal consultation with owners of corporate systemshelped ensure that the proposed solution was well explored and met requirements. The choicewas based on lowest risk, equal treatment of all users, lowest cost (including hardware,software, and support), and greatest flexibility; it will mean that DEP’s Macintoshes arereplaced with PCs. Regional staff were early beneficiaries of the decision through improvedaccess to corporate systems and data.
Central to the establishment of many merged services was the installation of a high-speedcommunications link between the Hyatt building and the Hartley Poynton building. It supportsthe IT network service delivery mentioned above, and also underpins record management, asingle communication and scheduling environment, Helpdesk services, and corporate businessmanagement tools.
Common corporate tools were established to assist business and cultural integration. Existingsystems for project management, business planning, phone manager, financial and humanresources systems, licensing systems, and the Ministerial Tracking System were redesignedto cover the new agency’s activities in the new IT environment. Extensive consultation withowners and users of these systems helped produce an improved suite of corporate tools.
Because of the number of staff relocations from the Hartley Poynton Building to the Hyatt,a new Hyatt PABX was purchased to handle the increase in extensions. A link between thePABXs enabled all inter-office calls to be internal calls.

25
Annual Report 2001–2002 Water and Rivers Commission
The integration of records management services was a big issue due to the number of recordsinvolved and the need to meet new legislative requirements. Records management softwarewas selected and an audit of both agencies’ holdings was conducted, allowing record typesto be identified and numbering systems proposed. A transfer of records into the new systemfollowed.
2.4.4 People
Staff Numbers (FTE)
2000-01 2001-02
Full-time permanent staff 243 265
Part-time permanent staff 11 21
Fixed term contract staff 97 89
Redeployees 2 0
Total staff 351 375
Staff recruited 37 98
Recruitment and selection
The Water and Rivers Commission manages recruitment and selection for the Commissionitself, the Swan River Trust and the Swan Catchment Centre. Ninety nine positions wereadvertised during the year (93 WRC/5 SRT). Seventy three (69 WRC/4 SRT) of these positionswere filled by internal applicants, and 25 by external applicants. One position was stillsubject to recruitment and selection action at the end of the reporting period.
Spherion Outsourcing Solutions supply recruitment and selection services to the Commission.The contract began in January 2001 and continues until January 2003, with a one-year option.Spherion won a contract due to its ability to partner the Commission in its recruitmentcampaigns, and its expertise in e-recruitment.
A 12-month review on the services provided by Spherion has been completed and an updatedMemorandum of Understanding signed by both parties.
Induction
The Water and Rivers Commission has an active Induction Program that ensures all newemployees are fully inducted into the Commission’s culture and objectives. Further reviewon the Induction Program is to take place as part of the formation of the DEWCP.
Human Resource Information System
During the year the personnel and payroll functions for the Department of EnvironmentalProtection, the Keep Australia Beautiful Council and the Office of the Heritage Councilwere converted from an external provider to the in-house run Concept HRMIS. The humanresource management function including payroll production is now provided via the mergedHuman Resource Branch. Improvements to system functionality have provided greater accessto people management data and processes. This has improved the self sufficiency of managersand staff in the people management function.

26
Water and Rivers Commission Annual Report 2001–2002
Workers Compensation
Five worker’s compensation claims were lodged during the financial year. There were threeclaims involving lost time, with a total of 24 days of work time lost.
Grievance Officers
The Commission currently has 10 grievance and contact officers, all formally trained ingrievance resolution.
Commission grievance officers have met with grievance officers of the Department ofEnvironmental Protection to form “GO Net”, a Grievance Officer Network. “GO Net” willmeet quarterly and run in-house sessions to ensure an open forum of discussion on issuesbeing dealt with by grievance officers.
Equal Employment Opportunity (EEO)
The Commission has an EEO Working Group that reviews and manages recommendationsof the Commission’s EEO Management Plan 1999-2000. An updated EEO ManagementPlan is being developed. This will encompass the formation of DEWCP and ensure that theagency’s managers and supervisors work towards the following objectives:
• The organisational culture values diversity and the workplace is free from harassment;
• The workplace is free from biased and discriminatory employment practices; and,
• Employment programs and practices include measures, where appropriate, to achievediversity and equality of opportunity for people of EEO groups.
A meeting of all grievance officers from the merging agencies has taken place. The recentlyestablished Grievance, Harassment and Discrimination Policies and Procedures are currentlybeing reviewed to ensure suitability for the newly forming DEWCP.
These new policies will reflect any legislative changes and also cover issues such as bullyingand intimidation currently not covered by EEO legislation.
Disability Services Plan
The Commission continues to provide appropriate services and facilities for stakeholderswith disabilities. Renovations undertaken within any Commission facility throughout theState take into account the recommendations of the Disability Access Audit.
Other initiatives currently in place include:
• All Commission stationery and reports note the National Relay Service fax and phonenumbers;
• The Commission’s contact details on the website advise of the availability of the NationalRelay Service; and
• The provision of services to people with disabilities is being outlined in the Commission’sGuide to our Services.

27
Annual Report 2001–2002 Water and Rivers Commission
2.4.4.1 Public Sector Standards
During 2001-02, no request for a right of review of the Public Sector Standards for Recruitmentand Selection was received.
All policies and procedures adopted by the Commission in support of Public Sector Standardsin Human Resource Management are accessible to staff on the Intranet.
2.4.4.2 Ethical Standards
The Commission requires all employees and contractors to exercise high standards of ethicalbehaviour in performing their duties, as set out in the Water and Rivers Commission Code ofConduct. The Water and Rivers Commission Code of Conduct for Board and Committeesguides the behaviour of our Board and Committee members.
There were two breaches of the Water and Rivers Commission Code of Conduct during2001-02. One of these breaches related to the inappropriate use of Commission resourcesand the other related to the inappropriate behaviour of an employee.
In one case, the breach was admitted by the staff member and was found to be minor and theofficer was disciplined for this minor offence by having a letter placed on his/her personalfile.
In one case, the breach was investigated and proved. The officer was found to have breachedthe Commission’s Code of Conduct as well as the Public Sector Management Act 1994. Thebreach was determined to be of such serious nature that dismissal was the only appropriatecourse of action.
Statement of compliance with Public Sector Standards
In the administration of the Water and Rivers Commission, I have complied with thePublic Sector Standards in Human Resource Management, the WA Public Sector Codeof Ethics and our Code of Conduct.
I have put in place procedures designed to ensure such compliance and have conductedappropriate internal assessments to satisfy myself that the statement made above is correct.
There were no applications for breach of standard reviews made during 2001-02.
Roger F PayneCHIEF EXECUTIVE

28
Water and Rivers Commission Annual Report 2001–2002
3 Corporate governance report
3.1 Board overview
The Board of Management is the governing body of the Water and Rivers Commission, withlegislative authority to perform the functions, determine the policies and control the affairsof the Commission. The Chief Executive is responsible for day-to-day operations.
The Board approves corporate goals, direction, performance targets, operating and capitalbudgets, and ensures proper risk management processes are in place. It monitors operating,financial, environmental and safety performance through monthly reports, and ensures legalcompliance and ethical behaviour.
Board meetings are normally held once a month in the Commission’s Boardroom in Perth.
3.1.1 Board members
The backgrounds and experience of the Board’s members are diverse. Its seven members aremade up by:
– Chairman.– Deputy Chairman.– Four members.– Chief Executive (appointed for the term of his office).
The Chairman, Deputy Chairman and non-executive Board members are appointed by theMinister. They hold office for up to three years. Non-executive Board members are eligiblefor re-appointment and their duties are not full-time. There is no limit on the time a Boardmember may serve on the Board. The Minister may at any time remove a Board memberfrom office.
3.1.2 Changes to the Board
Mr Ben Franklin resigned from the Board in September 2001.
3.1.3 Accountability and independence
The Board operates within the guidelines of the Water and Rivers Commission Act 1995.The Board operates in accordance with the Public Sector Management Act 1995 and theCommission’s Code of Conduct. The Board has also developed a Code of Conduct for allBoards and Committees of the Commission.
3.1.4 Performance monitoring and reporting
The Commission provides written monthly reports on its activities and financial statementsto the Board. Additionally, performance is evaluated at 31 December and 30 June each year.Annual performance is reported to the Minister and Parliament in the Commission’s AnnualReport.

29
Annual Report 2001–2002 Water and Rivers Commission
3.1.5 Board member profiles
Ken Webster – Chairman
Mr Webster was Chairman of the Water Authority of Western Australia from July 1990 untilDecember 1996, presiding over several major studies involving community consultationand a significant increase in the environmental awareness and commitment of the Authority.Previously he was Director of Water Resources with the Authority for five years. For 17years before that, he was Chief Engineer Water Resources with the Public Works Department.Mr Webster has comprehensive experience and expertise in management of natural resources,particularly in respect to land/water interactions and in planning and policy making forsustainable use of water resources, including membership on the WA Water ResourcesCouncil. He is a member in the General Division of the Order of Australia (AM) for hisservice to water resources.
Jos Chatfield – Deputy Chairman
Mrs Chatfield is a farmer and nursery proprietor from Tammin. She has practical experiencein large-scale revegetation, rural resource management and nature conservation. She hasbeen involved at local, state and national levels through her special interest in landcare andsalinity issues, having served on the National Soil Conservation Advisory Committee to theFederal Minister for Resources, and the Board of Greening Australia. Mrs Chatfield is aCommissioner of the Australian Heritage Commission, and the State Salinity Council,Advisory Council to the EPA, Gordon Reid Foundation for Conservation, and CSIRORegional Consultative Committee. She currently chairs the Commission’s State Water ReformCouncil.
Noel Robins
Mr Robins was Commissioner for Waterways (Western Australian Waterways Commission)from 1979 to 1995. He has had a distinguished career in business and sailing administration,including being Executive Director of the Royal Perth Yacht Club’s administration of the1987 America’s Cup Challenge. Extensive experience in river and estuary management hasincluded chairing the Canal Development Steering Committee, and playing a lead role increation of the Swan River Trust and community-based Management Authorities to tackleenvironmental problems in the Albany waterways, Wilson Inlet and the Avon River.
Des Kelly
Dr Kelly has more than 40 years experience in State Government and recently retired fromthe position of Chief Executive Officer, Department of Resources Development. He graduatedfrom the University of Western Australia in 1955 with a Bachelor of Engineering with FirstClass Honours in Civil Engineering and was awarded a PhD from the University of Londonin 1963. His early work was on construction projects with the Harbours and Rivers Branchof the Public Works Department. Subsequently, he was involved on behalf of the State in theestablishment of major resource developments and their associated infrastructure. In 1980,Dr Kelly was appointed Under Secretary of the Department of Minerals and Energy. Hisservice with that agency was acknowledged in 1992 when he was made a Member in theGeneral Division of the Order of Australia (AM) for his service to mining.

30
Water and Rivers Commission Annual Report 2001–2002
Rod Willox
Mr Willox is a former medical scientist and army officer (Colonel), now retired. He waseducated in Melbourne and Adelaide and is a graduate of the University of Western Australiaand Curtin University in pathology and medical science. Mr Willox also has a Diploma inOccupational Health and Safety and is a graduate from the Joint Services Staff College,Canberra. Mr Willox has been very active in community affairs and was Deputy Mayor ofthe City of Stirling between 1997 and 1999. He also served on the State Executive of theLocal Government Association. In addition Mr Willox is a member of the Local GovernmentAdvisory Board, Chairman of the Australia Day Council, and on the Board of ManagementRSL War Veterans Homes (WA).
Roger Payne – Chief Executive
Mr Payne has more than 30 years experience in the water industry gained through theMelbourne Water Corporation and its predecessors, and the consulting industry. Thisexperience has ranged from technical engineering through to customer service provision,community and political negotiations, and commercial innovation, through to corporatestrategy development and major change implementation.
3.1.6 Conflict of interest
The Commission has procedures for identifying, preventing or resolving conflicts of interest.These procedures are outlined in the Code of Conduct.
All Commission personnel with duties related to the negotiation of a contract must disclosecurrent or prospective interests to their immediate supervisor. The interest of a member’simmediate family must also be disclosed, if they are known. Where a person possesses suchan interest, then either the basis of that interest should be discontinued, or the person shouldcease the duties involved or obtain management permission to continue.
Board members are also required to declare conflicts of interest.
3.1.7 Ministerial directions
There were no ministerial directions given during 2001-02.
3.1.8 Committees and other bodies
The Board relies on a number of committees, councils and management authorities to adviseon the development and implementation of protection policies for the State’s water resources.In particular, the following councils and committees provide advice to the Board on variousmatters:
• State Water Reform Council – established to assist the Commission with the process oflegislative change.
• Rivers and Estuaries Council – established under the Waterways Conservation Act 1976to advise on the management and protection of rivers and estuaries.
• Stakeholder Council – established to advise on the Commission’s performance and keyissues.

31
Annual Report 2001–2002 Water and Rivers Commission
• Audit Committee – established to review and approve the Commission’s audit plans, reportsand activities.
• Water Resource Allocation Committee – established to advise on policy development,planning and management for surface and groundwater resources.
• Floodplain Management Council – established to coordinate floodplain managementactivities throughout the State.
3.1.9 Board meetings
The number of meetings of the Board and committees and number of meetings attended byeach member, during the 12 months ended 30 June 2002 are as follows:
Water and Audit Rivers and Water Swan State State StakeholderRivers Committee Estuaries Resources River Salinity Water Council
Commission Council Allocation Trust Council Reform CouncilBoard Committee
Meetings
MEETINGS HELD 11 1 1 8 23 0 0
Member
Mr K C Webster 11*
Mr D N Robins 10 1 17
Mrs J Chatfield 10
Dr D R Kelly 9 8*
Mr R M Willox 11 1*
Mr R F Payne 8 1
Mr B Franklin 1**(ResignedSeptember 2001)
** Chairman of Committee
** Mr Franklin was not present for the entire meeting
The Geographe Catchment Council was established in July 1997 as a community-basedcouncil to deliver integrated Natural Resource Management to the Geographe catchmentand adjacent marine environment.
The Cockburn Sound Management Council (CSMC) was officially launched in August 2000as a new Committee of the Board to coordinate environmental management and planningfor Cockburn Sound and its catchment. The Draft Management Plan was released for threemonth public comment in December 2001. The CSMC is currently amending the Plan inaccordance with public submissions. Feedback on the CSMC’s progress in managingCockburn Sound has to date been very positive. A highlight of the year was the completionof the study on the opportunities and constraints for enhancing multiple use management ofCockburn Sound.

32
Water and Rivers Commission Annual Report 2001–2002
3.1.10 Waterways Management Authorities
The Commission has begun the evolution of the management authorities established underthe Waterways Conservation Act to community waterways and catchment councils, whichwill advise the Commission on policy and management direction. To fulfil this function inthe interim, waterways management councils are being established as advisory committeesto the Water and Rivers Commission Board. Once the management authorities have beenformally dissolved, management powers will be delegated to the regional managers. Thiswill provide greater opportunities for community involvement in catchment management aswell as enabling the delivery of legislative provisions.
3.1.11 Relationship with the Swan River Trust
The Swan River Trust was established under the Swan River Trust Act 1988 to manage theSwan-Canning river system. The philosophies and functions of the Commission and Trustare very similar and complementary, with the Commission having a very close relationshipwith the Trust. The Swan River Trust is a separate legal entity and requires separate accountingand reporting.

33
Annual Report 2001–2002 Water and Rivers Commission
4 Compliance reports
4.1 Responsible Minister
The Water and Rivers Commission’s primary responsibility during the reporting period wasto the Minister for the Environment and Heritage, who exercised authority under the Waterand Rivers Commission Act 1995.
4.2 Statement of compliance with written law
4.2.1 Enabling legislation
The Water and Rivers commission was established under the Water and Rivers CommissionAct 1995. The Commission administers the Water and Rivers Commission Act 1995 and theWaterways Conservation Act 1976.
4.2.2 Legislation administered
The Commission also administers parts of the following Acts:
• Water Agencies (Powers) Act 1984
• Rights in Water and Irrigation Act 1914
• Metropolitan Water Supply, Sewerage and Drainage Act 1909
• Country Areas Water Supply Act 1947
• Metropolitan Water Authority Act 1982
• Water Boards Act 1904
4.2.3 Other legislation impacting on Commission activities
• Environmental Protection Act 1986
• Freedom of Information Act 1992
• Swan River Trust Act 1988
• Financial Administration and Audit Act 1985
• Public Sector Management Act 1994
• Salaries and Allowances Act 1975
• Equal Opportunity Act 1984
• Government Employees Superannuation Act 1987
• Occupational Health, Safety and Welfare Act 1987
• Worker’s Compensation and Assistance Act 1981
• Industrial Relations Act 1979 (Employment Acts) 1991
• State Supply Commission Act 1991
• Disability Services Act 1993

34
Water and Rivers Commission Annual Report 2001–2002
4.2.4 Statement of compliance with Environmental Conditions
As part of the conditions set by the Minister for the Environment on the Jandakot GroundwaterScheme Stage 2: Public Environmental Review, the Gnangara Mound Groundwater ResourcesReview of Proposed Changes to Environmental Conditions and the East GnangaraEnvironmental Water Provisions Plan Public Environmental Review, the Water and RiversCommission is responsible for meeting water level criteria for wetlands and vegetation onthe Gnangara and Jandakot groundwater mounds.
Over the 2001-02 financial year, 13 of the 79 criteria were not met. This compares to 11breaches over the 2000-01 financial year. The key factors contributing to these breacheswere very low rainfall, public and private groundwater abstraction, diversions in surfacewater drainage away from wetlands and water use from extensive pine plantations.
Nine breaches of criteria occurred on the Gnangara Mound, including breaches at fivewetlands. The preferred minimum spring peak water level was not achieved at Coogee Springsor Lake Mariginiup breaching the criteria of reaching these levels at least four in six years.Further delays were experienced in the commissioning of the artificial maintenance bore forCoogee Springs which was operational in early September of 2001. However, this did notprovide adequate time for pumping to raise water levels sufficiently to reach the preferredminimum peak water level by the end of spring. The absolute minimum criterion at Lexiawetland 186 was breached with some additional impacts related to increased abstractionfrom the Water Corporation’s Lexia scheme. The EWP criteria were also breached at LakeWilgarup, however these are interim rather than statutory criteria, so technically there wasno legal breach. Water levels at Lake Joondalup fell below the preferred minimum criterionbreaching the requirement for water levels not to fall below this level greater than two yearsin six.
Water level criteria were breached in four Gnangara vegetation monitoring bores, MM59B,PM6, JB5 and WM1. Water Corporation production bores closest to these monitoring boreswere shut down during 2001-02 to minimise the impacts of public abstraction upon waterlevels. Abstraction from the Pinjar scheme and the nearby pine plantation are the primaryfactors affecting water levels in PM6. Production bores around MM59B have been off for anumber of years, however water levels were still low enough to cause a breach of criteria atthis site. A continuation of low rainfall levels during the reporting period was a major factorinfluencing water levels over the Gnangara and Jandakot Mounds. Other factors influencingthe decline in water levels were public and private groundwater abstraction and water use bypine plantations (Gnangara Mound only).
There were four breaches of criteria on the Jandakot Mound during the 2001-02 period.Shirley Balla Swamp dried out before the end of January, therefore breaching its criteria.Production bores west and east of this wetland have been switched off since December1998. Beenyup Road Swamp which is close to Shirley Balla Swamp has also breached itspreferred minimum criteria this year. Forrestdale Lake breached its absolute minimum criteriaby 21 cm during the 2001-02 period. The nearest production bores to the west have beenshut down to minimise the impact of public abstraction upon Lake Forrestdale water levels.North Lake breached its absolute minimum criterion again in 2001-02 which it has alsobreached on a number of other occasions in recent years. The breaches primarily relate to a

35
Annual Report 2001–2002 Water and Rivers Commission
reduction in the volume of surface water entering North Lake from stormwater drainage,following the diversion of two drains away from the lake to improve water quality in thewetland. This criterion will be reviewed as part of the Section 46 process.
The Water and Rivers Commission is aware of the current drought situation and togetherwith the Water Corporation, has taken action to prevent or minimise breaches in criteria byswitching off a large number of production bores. In 2001-02, a total of 41 production wellswere switched off on the Jandakot and Gnangara Mounds. Despite these actions, breachesof criteria have still occurred. The very low rainfall in recent years has resulted in limitedrecharge to aquifers and consequently lower groundwater levels and wetlands water levels.
The number of breaches of water level criteria in recent years has prompted a Section 46review of environmental conditions set on Jandakot and Gnangara groundwater resources.The review is currently under way and will be undertaken in two stages. A preliminaryStage 1 Report on the state of the mounds and short term management measures was submittedto the Environmental Protection Authority in November 2001. A similar report on the statusof the mounds and recommended management measures for the 2002-03 summer will besubmitted to the EPA in November 2002. Stage 2 work on a more comprehensive review ofsustainability of the mounds and Ministerial conditions is underway. This is due to becompleted by December 2004. The review will consider not only water level criteria, butalso management of public and private groundwater use, pine management and internalcompliance monitoring and management issues. A significant focus will be the managementof Environmental Water Provisions under the current, and likely future, scenario of a dryclimate and increasing demand for water.
4.2.5 Advertising and sponsorship
Under Section 175Ze of the Electoral Act 1907, the Commission reports the followingexpenditure on marketing and advertising during 2001-2002:
Class of Expenditure Total Name of person/agency where totalexpenditure annual payments are greater than $1500for class
Advertising agencies $2 247 MJB&B Advertising and Marketing $2 247
Market Research organisations $7 525 Patterson Market Research $7 525Research
Polling organisations Nil -
Direct mail organisations Nil -
Media advertising $97 081 Marketforce Productions $57 005(includes advertising staff vacancies)
Media Decisions WA $40 076
Total Expenditure $116 853

36
Water and Rivers Commission Annual Report 2001–2002
AUDITOR GENERAL
To the Parliament of Western Australia
WATER AND RIVERS COMMISSION
PERFORMANCE INDICATORS FOR THE YEAR ENDED JUNE 30, 2002
Matters Relating to the Electronic Presentation of the Audited Performance Indicators
This audit opinion relates to the performance indicators of the Water and Rivers
Commission for the year ended June 30, 2002 included on the Commission’s web site. The
Board is responsible for the integrity of the Commission’s web site. I have not been
engaged to report on the integrity of the Commission’s web site. The audit opinion refers
only to the performance indicators named below. It does not provide an opinion on any
other information which may have been hyperlinked to or from these performance
indicators. If users of this opinion are concerned with the inherent risks arising from
electronic data communications, they are advised to refer to the hard copy of the audited
performance indicators to confirm the information included in the audited performance
indicators presented on this web site.
Scope
I have audited the key effectiveness and efficiency performance indicators of the Water and
Rivers Commission for the year ended June 30, 2002 under the provisions of the Financial
Administration and Audit Act 1985.
The Board is responsible for developing and maintaining proper records and systems for
preparing and presenting performance indicators. I have conducted an audit of the key
performance indicators in order to express an opinion on them to the Parliament as required
by the Act. No opinion is expressed on the output measures of quantity, quality, timeliness
and cost.
My audit was performed in accordance with section 79 of the Act to form an opinion based
on a reasonable level of assurance. The audit procedures included examining, on a test
basis, evidence supporting the amounts and other disclosures in the performance indicators,
and assessing the relevance and appropriateness of the performance indicators in assisting
users to assess the Commission’s performance. These procedures have been undertaken to
form an opinion as to whether, in all material respects, the performance indicators are
relevant and appropriate having regard to their purpose and fairly represent the indicated
performance.
The audit opinion expressed below has been formed on the above basis.
Audit Opinion
In my opinion, the key effectiveness and efficiency performance indicators of the Water and
Rivers Commission are relevant and appropriate for assisting users to assess the
Commission’s performance and fairly represent the indicated performance for the year
ended June 30, 2002.
K O O’NEIL
ACTING AUDITOR GENERAL
November 22, 2002
4th Floor Dumas House 2 Havelock Street West Perth 6005 Western Australia Tel: 08 9222 7500 Fax: 08 9322 5664

37
Annual Report 2001–2002 Water and Rivers Commission
5 Performance indicators
Statement by accountable authority on performance indicators
We hereby certify that the performance indicators are based on proper records, are relevantand appropriate for assisting users to assess the Water and Rivers Commission’sperformance, and fairly represent the performance of the Water and Rivers Commissionfor the financial year ended 30 June 2002.
Mr Ken WebsterBOARD CHAIRMAN
Mr Roger PayneCHIEF EXECUTIVE/BOARD MEMBER
31 August 2002
Performance Framework
The performance framework below shows the relationships between what we sought toachieve and our performance indicators. Our main outcome is divided into sub-outcomeswhich are separately identified into the allocation and protection and enhancement of waterresources.
Allocation relates to a series of activities that together enable the Commission to:
• Assess the quantity of water in its natural state,
• Establish the quantity of water required to sustain the body itself and the environment thatdepends on it,
• Allocate water for use by people to support economic or social needs;
• License and regulate the withdrawal of water from water sources without impacting onthe environment; and
• Educate and promote initiatives with other government agencies on the efficient use ofwater and support for rural sectors.

38
Water and Rivers Commission Annual Report 2001–2002
The key relationships between our performance indicators and the two primary functionsare:
Planning Management
Percentage of licensed use covered by a formalmanagement plan– Board approved– Senior management approved
Percentage of Groundwater Management Areas withlicensed allocation in excess of management objectives
Average accrual cost per Gigalitre of water managed inaccordance with agreed management plan (1888 GL)
Accrual cost of issuing, managing and administeringWater Allocation Licenses
Accrual Cost of building, maintaining and operating theState Reference Network for the collection of waterresources quality and quantity information
Average level of deficiency per grant round
Percentage of grant applications assessed within targetdeadline
Administrative cost per grant application
Protection and enhancement of the State’s water resources is aimed at maintaining orimproving the health of our waterways, wetlands and public water sources.
Like Allocation, there are two primary functions of planning and management. Managementincludes on the ground actions aimed at restoring or enhancing the land that surrounds thewater source.
Planning Management
Surface water quality – Annotated hydrograph of CollieRiver
The extent to which management objectives have beendeveloped for rivers, estuaries and wetlands
The extent to which rivers, estuaries and wetlands waterquality meet agreed management objectives
The extent to which the waterways are protected whileproviding facilities for public use
The extent to which management objectives have beendeveloped to guide the protection of the state’s publicwater supply catchments/basins
Accrual cost per km2 of catchment where managementand improvement activities are undertaken
Average accrual cost per statutory referral
Average water supply protection cost (per Gigalitre)covered by an agreed management plan (1888 GL)
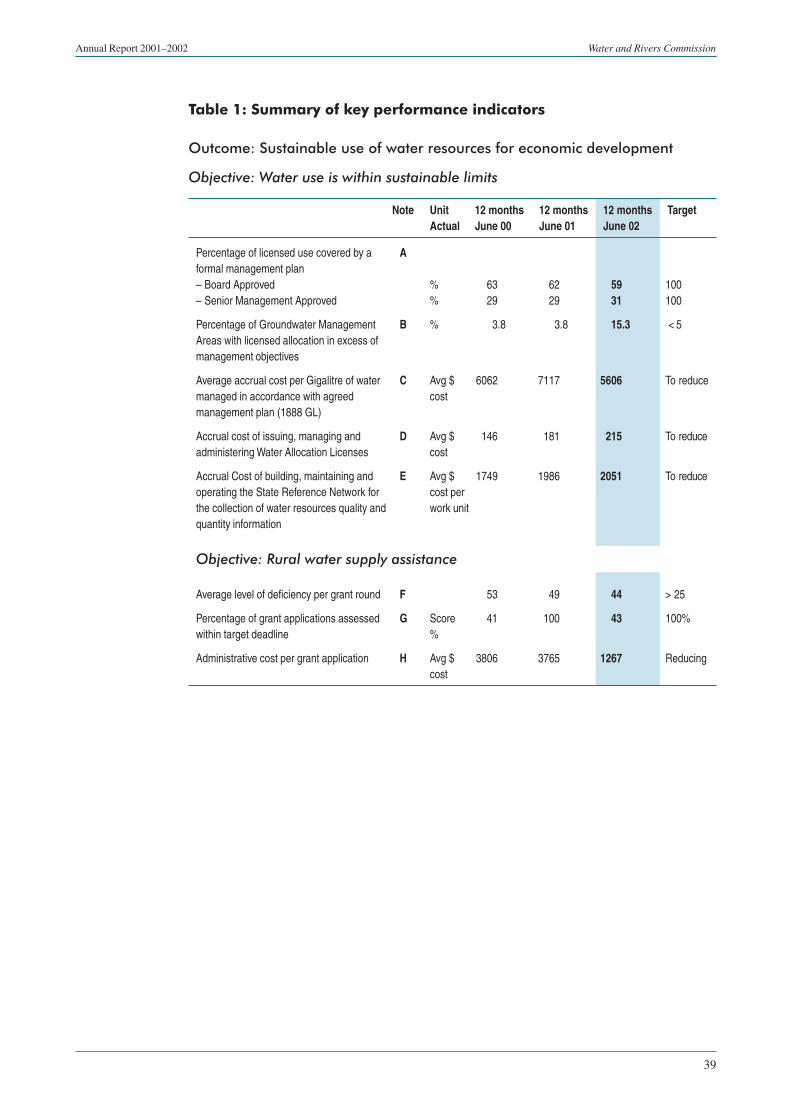
39
Annual Report 2001–2002 Water and Rivers Commission
Table 1: Summary of key performance indicators
Outcome: Sustainable use of water resources for economic development
Objective: Water use is within sustainable limits
Note Unit 12 months 12 months 12 months TargetNo. Actual June 00 June 01 June 02
Percentage of licensed use covered by a Aformal management plan– Board Approved % 63 62 59 100– Senior Management Approved % 29 29 31 100
Percentage of Groundwater Management B % 3.8 3.8 15.3 < 5Areas with licensed allocation in excess ofmanagement objectives
Average accrual cost per Gigalitre of water C Avg $ 6062 7117 5606 To reducemanaged in accordance with agreed costmanagement plan (1888 GL)
Accrual cost of issuing, managing and D Avg $ 146 181 215 To reduce administering Water Allocation Licenses cost
Accrual Cost of building, maintaining and E Avg $ 1749 1986 2051 To reduce operating the State Reference Network for cost perthe collection of water resources quality and work unitquantity information
Objective: Rural water supply assistance
Average level of deficiency per grant round F 53 49 44 > 25
Percentage of grant applications assessed G Score 41 100 43 100%within target deadline %
Administrative cost per grant application H Avg $ 3806 3765 1267 Reducingcost

40
Water and Rivers Commission Annual Report 2001–2002
Outcome: Protection and enhancement of the quality of the state’s surface and groundwater
Objective: Clean and healthy water resources
1. For Rivers, estuaries and wetlandsRestore high risk/critical water dependent systems to functional condition.Slow rate of decline of water salinity in priority catchments.Reduced algal blooms, pollution and fish kills in priority areas.
2. For public water supplyQuality of existing public water supply resources are maintained
Effectiveness Indicators
Note Unit 12 months 12 months 12 months TargetNo. Actual June 00 June 01 June 02
Surface water quality – Annotated I Graph Tohydrograph of Collie River improve
The extent to which management J % 63 63 63 60%objectives have been developed for rivers,estuaries and wetlands.
The extent to which rivers, estuaries and K % 61 64 64 Towetlands water quality meet agreed improvemanagement objectives
The extent to which the waterways are L No. of 164 123 114 To reduceprotected while providing facilities for pollutionpublic use complaints
The extent to which management M % 32 37 37 100%objectives have been developed to guidethe protection of the state’s public watersupply catchments/basins
Efficiency Indicators
Accrual cost per km2 of catchment where N Cost $ 47 40 52 To reducemanagement and improvement activities per km2
are undertaken
Average accrual cost per statutory referral O Cost $ per 567 1369 892 To reducereferral
Average water supply protection cost P Cost $ 1413 564 603 To reduce(per Gigalitre) covered by an agreed per GLmanagement plan (1888 GL)

41
Annual Report 2001–2002 Water and Rivers Commission
NOTES TO THE PERFORMANCE INDICATORSfor the year ended 30 June 2002
A. Percentage of licensed use covered by a formal management plan– Board approved– Senior management approved
Outcome: Sustainable use of water resources for economic development
Objective: Water use is within sustainable limits
The Commission aims to have formal plans indicating the amount of water available andallocation policies for all areas where licensing is carried out. The indicator may be used toassess performance by showing the extent to which water resources are being allocated tobeneficial uses following public consultation. The long term objective is ensure all waterallocated is covered by a plan that is agreed with stakeholders, and government representingthe environment and future generations.
Relevance to desired outcome
This indicator reflects the effectiveness of the Commission in managing water use inaccordance with formal (Board approved) management plans, for the sustainable benefit ofthe community. The present indicator relates to groundwater management.
The indicator has been derived by determining the volume of water licensed for use inaccordance with formal management plans and dividing by the total volume of water licensedfor use in the State. Not all the water used in the State requires licences. Licensing is introducedwhen use grows to levels which require management.
Effectiveness measure
Formal plans are defined to mean those plans which are endorsed by the previous WaterAuthority of Western Australia’s Board, or the current Water and Rivers Commission Boardfollowing an appropriate level of community involvement in their formulation. The formalplans also include independent review by the Allocation Committee before Board approval.Senior Management approved plans are plans which have not yet received Board andAllocation Committee approval.
The minor changes are a result of increased allocations in emerging groundwater resourceareas.
Note B provides a summary of the Commission’s performance in managing to these plannedobjectives.

42
Water and Rivers Commission Annual Report 2001–2002
B. Percentage of groundwater management areas with use in excess ofmanagement objectives
Outcome: Sustainable Use of Water Resources for Economic Development
Objective: Water use is within sustainable limits
Having set water allocations for environmental, social and economic demand in plans, the
Commission aims to license and regulate water usage, such that it does not exceed management
or sustainable levels.
The effectiveness of the management of the resource is reflected in whether the resource is
being used in excess of management objectives, based on assessed available resources.
Performance may be assessed by viewing increases in areas with over-use of the source as
indicative of the need for improved resource management in some areas.
Relevance to desired outcome
The indicator is relevant to the outcome because it shows how the Commission’s management
is in ensuring sustainable benefits from groundwater. The indicator has been derived by
determining the number of groundwater management areas with a licensed use greater than
the management objectives described in the plans and dividing by the total number of
groundwater management areas in the State.
Effectiveness measure
About three fifths of the licensed groundwater use is covered by formal ground water
management plans with the highest priority placed in areas with high utilisation levels.
About 10.9% (or 51 of 46) declared ground water management sub areas have allocations
close to, or at the level of sustainability. Exceeding management limits does not mean that
the resources are over-allocated. The Commission establishes precautionary management
levels allowing for the environment. The areas where licensed allocations exceed management
limits include Albany, Blackwood, Bolgart, Gascoyne and Gnangara.
Other groundwater sources are approaching the sustainable threshold and need closer
management to ensure sustainability. This closer management will require increased levels
of policy development, resource monitoring and re-evaluation, user compliance monitoring
and community education and awareness raising. Development pressures also require the
Water and Rivers Commission to extend the areas of licensed water use.
The Commission will also need to expedite its review of existing plans in high priority areas
with relatively high utilisation levels to maintain sustainability.

43
Annual Report 2001–2002 Water and Rivers Commission
C. Accrual cost per Gigalitre of water managed in accordance withagreed management plans
Outcome: Sustainable use of water resources for economic development
Objective: Water use is within sustainable limits
The Commission’s internal objective is to adequately manage the state’s water resources at
a minimum long-term cost. This indicator is holistic in that it considers the total planning
effort expended by the Commission and divides it by the quantity of groundwater allocated.
It is beneficial in that as demand for water grows, so too does the management effort required
by the Commission. The target for the Commission is to maintain a stable level of effort.
Relevance to desired outcome
This indicator shows the efficiency with which the Commission manages the allocation of
water to economic, social and environmental uses. The indicator represents the activities
associated with developing and implementing allocation management plans and policies.
Efficiency measure
The significant reduction in unit costs results from the continued increase in water allocated
to meet state development needs. The financial investment in this output has remained stable
and the efficiency gains are offset by minor increases in the delivery of other services,
notably cost of administering a license (see note D) and increased monitoring and inspections
(note E).
D. Cost of issuing, managing and administering water allocation licenses
Outcome: Sustainable use of water resources for economic development
Objective: Water use is within sustainable limits.
The Commission’s internal objective is to adequately manage the state’s water resources at
a minimum long-term cost. This indicator illustrates the cost of administering a water
allocation license – a key instrument in allocating water to users. As demand for water grows
and the volume of licenses increase, the Commission aims to maintain, or reduce, the average
cost of a license.
Relevance to desired outcome
This indicator shows the efficiency with which the Commission administers water allocation
licenses.
Licensing of allocations in declared areas is a statutory function of the Commission. Licensing
is essential to ensure the objectives of water management are met, and those inappropriate
precedents are not set. It is one of the primary mechanisms for managing the state’s water
allocations.

44
Water and Rivers Commission Annual Report 2001–2002
Efficiency measure
The indicator has been derived by determining the number of licences administered (24 690),
and dividing this into the actual costs of the Licensing ($5.318m). The increase in unit costs
is attributed to additional resources being applied to reviewing license applications,
particularly in those areas which are close to approved management allocations. These
applications are often complex and require additional resources in investigating the applicant’s
water requirements and balancing the new needs with those of existing licenses within the
management area. Costs have also increased as a result of customer appeals and the need for
the Commission to undertake further research to justify management decisions to an appeals
convenor.
The average licensing cost in these areas close to management limits are expected to further
increase.
E. Accrual cost of building, maintaining and operating the State ReferenceNetwork for the collection of water resources quality and quantityinformation
Outcome: Sustainable use of water resources for economic development
Objective: Water use is within sustainable limits
Underpinning water allocation planning and licensing is the need for timely and accurate
water resource and environmental information. The Commission maintains an extensive
network of water measurement sites. These surface water and ground water measurement
sites provide valuable information for the management of water resources, sustainable
development of water resources, and for the management of flood-related hazards.
Relevance to desired outcome
The indicator has been derived by determining the number of operating sites, and dividing
this into the total network operating costs ($6.53million). The Surface Water Reference
Network consists of approximately 506 surface water and 2678 groundwater bore work
units. Work units are generic names, which comprise gauging sites, rainfall measurement
sites, salinity measurement sites and water quality sites.
Efficiency measure
The increase in costs results from brining on-line new measurement stations and collecting
new or additional information to support business needs. Over the past three years the
Commission has continually reviewed its measurement network and decommissioned lower
priority sites.
Whilst some of these sites still exist as physical assets information is no longer collected
from the sites. The closure of these sites has yielded little operational savings, but will
reduce longer term asset replacement needs and costs. Additional funds have also been utilised
in enhancing computing models and reporting tools to support water allocation decisions.
45
Annual Report 2001–2002 Water and Rivers Commission
Rural Water Supply Assistance
Outcome: Sustainable use of water resources for economic development
Objective: Rural water supply assistance
The Commission provides a Farm Water Grants Scheme for farmers whose land is notconnected to a reticulated water supply. The Scheme provides grants for the investigation,design or development of water supplies for domestic, crop-spray and livestock use.
The Scheme assists commercial broadacre farmers in six key regions of the drylandagricultural area of the State receiving less than 600 mm of average annual rainfall andconsidered being subject to water shortage problems.
The Scheme is targeted at commercial broadacre farming businesses, which experience themost severe water shortages. Farm water shortages have traditionally led to productivitylosses, domestic hardship and increased water cartage costs for farmers.
The Scheme allows farmers in water-deficient areas to develop reliable, on-farm water supplieswith the assistance of Government funding of up to $15 000. Farmers have 18 months fromthe date their grant is approved to undertake on-farm water supply improvements and thenlodge a claim of payment with the Water and Rivers Commission.
F. Average level of deficiency per grant round
Outcome: Sustainable use of water resources for economic development
Objective: Assistance is provided to water deficient farmers
One of the primary outcome objectives of Farm Water Grants Scheme is to contribute to areduction in the level of on-farm water deficiency. It is expected that as more farmers sufferingfrom the most serious water shortages are allocated grants over time, the average level ofwater deficiency across the agricultural area will decline.
To be considered for farm water grant an applicant is required to demonstrate the need forimproved water supplies on their property. Applicants are assisted in this regard by an approvedFarm Water Assessor who determines the total water supply and demand on the farm,calculates the level of water deficiency and allocates an appropriate score to reflect thisdeficiency. The on-farm deficiency score is the mechanism used to determine an applicant’seligibility for a grant.
A minimum deficiency score of 25 is required to qualify for a farm water grant although onaverage the deficiency score for applicants approved to the end of 2000/2001 has beensignificantly higher than this.
Relevance to desired outcome
The use of deficiency scores for each applicant enables the Commission to ensure that theScheme is correctly targeting the farmland in the greatest need of water supply improvements.Moreover, average on-farm deficiency levels from one grant round to another can be monitoredto assess the overall trend in water deficiency levels across the various agricultural districtsof the State.

46
Water and Rivers Commission Annual Report 2001–2002
Effectiveness measure
Average level of deficiency98/99 99/00 00/01 01/02
52% 53% 49% 44%
A noticeable reduction in the average deficiency level was not expected to be evident in theinitial five to six year period the Scheme has been operating. It is far more likely that adownward trend in the level of water deficiency will become more prominent over a ten tofifteen year period when the full effect of on-farm water supply improvements, made possiblewith the availability of farm water grants, becomes measurable.
Fluctuations in the average level of deficiency from one grant round to another are to beexpected as evidenced in the table that records the average deficiency scores for the periodfrom September 1996 to March 2002. Factors such as low commodity prices and low farmincome limit the capacity of some farmers to plan on-farm water supply improvements andto apply for a grant. The same influences also discourage farmers from maintaining existingfarm water supply infrastructure, thus reducing water yield.
Additionally on-farm water deficiency itself may be affected by many other interacting factorssuch as:
• Rainfall and runoff variability from year to year;
• Salinity problems caused by raising groundwater tables;
• The adoption of minimum tillage techniques which lead to less runoff; and
• Increased tree planting which leads to less runoff.
The occurrence and impact of the first two of these factors are impossible to predict orcontrol either by farmers or the Water and Rivers Commission.
The latter two factors are generally decisions for the individual farmers that are made inisolation from issues such as water deficiency.
The combined effect of these factors means the average level of water deficiency may varysignificantly between grant rounds in the short to medium term.
It is also important to note that targeting of the Scheme up to the end of October 1999 gavepriority to those localities in the dryland agricultural area subject to the most severe watershortages and where the cost and difficulty of developing on-farm supplies was the highest.
G. Percentage of grant applications assessed within target deadline
Outcome: Sustainable use of water resources for economic development
Objective: Assistance is provided to water deficient farmers
The Commission has made a commitment to finalise assessment of grant applications andnotify all applicants within two months of a grant round closing.

47
Annual Report 2001–2002 Water and Rivers Commission
Relevance to desired outcome
The percentage of grant applications assessed within the target deadline is an indicator ofthe efficiency of the Commission in processing the application documents. Providing promptassistance and assurance of grants to farmers is critical to enabling farm planning and actionsto be taken to support farm practices.
Efficiency Measure
Total number of Farm Water Total number of Farm Water AUDITED KEYgrant applications grant applications assessed PERFORMANCE INDICATOR
within two months of the Percentage of grantgrants round closing applications assessed
within target deadlines
98/99 99/00 00/01 01/02 98/99 99/00 00/01 01/02 98/99 99/00 00/01 01/02
223 155 179 389 221 63 179 167 99% 41% 100% 43%
1. The result for 1999/2000 appears poor, however it does not reflect a trend across all grantrounds for that year. The June and October 1999 rounds saw 100% applications assessedwithin the target deadline. The February 2000 round proved difficult because of the largenumber of applications received (due to a concerted television advertising campaign) anddue to delays caused by the Easter and Anzac Day public holidays.
H. Administrative cost per grant application
Outcome: Sustainable use of water resources for economic development
Objective: Assistance is provided to water deficient farmers
The Commission has made a commitment to finalise assessment of grant applications andnotify all applicants within two months of a grant round closing.
Relevance to desired outcome
The administrative cost per grant application provides an indication of the efficiency of theCommission in administering the Farm Water Grants Scheme. The administrative costs includethose costs incurred in processing and determining grant applications, processing grantpayments and monitoring, evaluating and editing grants. Dividing the total cost of producingthis output has derived this indicator by the number of grant applications.
Efficiency Measure
Total number of Total cost in $000s AUDITED KEYgrant applications PERFORMANCE INDICATOR
Cost per grant application
98/99 99/00 00/01 01/02 98/99 99/00 00/01 01/02 98/99 99/00 00/01 01/02
223 155 179 389 506 590 674 493 2269 3806 3765 1267
The average cost per application is derived by dividing the total cost for the rural watersupply assistance output, less grants allocated. The output also includes grant payments

48
Water and Rivers Commission Annual Report 2001–2002
totalling $1.818m which are exempt from the calculation. The significant decrease in cost isattributable to the volume of grants processed. Whilst costs have reduced, it comes at theexpense of timeliness as outlined in the above indicator.
I. Surface Water Quality – Annotated Hydrograph of Collie River
Outcome: Protection and enhancement of the quality of the State’s surface andgroundwater.
Objective: Clean and healthy water resources – Slow rate of decline of watersalinity in priority catchments.
Salinity is a widespread problem in the State and similar management activities have beenput in place in other catchments. The Collie River is representative of the success of moreintensive management efforts.
Relevance to desired outcome
This indicator shows changes in the water quality of a surface water resource degraded byincreasing salinity. Whilst the Commission is implementing improvement strategies within5 key catchments, Wellington is used because of the data available and that it is the catchmentwhich has had the most management effort focussed. As more data becomes available,performance trends will be reported for the other catchments.
The initial increases in salinity have been a result of changes in land use, and the ongoingtrend reflects the effects of management activities aimed at limiting or reducing the salinity.
Infl
ow
sa
lin
ity
toW
ell
ing
ton
Re
se
rvo
ir(m
g/L
TD
S)
0
200
400
600
800
1000
1200
1400
1600
1800
2000
1940 1950 1960 1970 1980 1990 2000 2010 2020 2030 2040
Year
1990 Harris Damstarts operating
1980 Reforestationbegins
1976 Clearingcontrols begin
Predicted mediansalinity withoutclearing controls
Predicted median salinitywith WRC land replanted
Predicted mediansalinity withoutreforestation
Target salinity forWellington Reservoir
Observed mean
Observed median
Surface water quality in the Collie Catchment
The predicted salinities are those expected in years of median rainfall. The higher curveshows what was expected if clearing had continued in the catchment and there was no otheraction to limit the development of dryland salinity. The lower curve shows the expectedresult from limiting further clearing from 1976 and reforestation between 1980 and 1990.Subsequent initiatives to help farmers integrate water management with agriculture areexpected to result in even lower salinity in the long term.

49
Annual Report 2001–2002 Water and Rivers Commission
Observed salinities are lower in years of above median rainfall, and higher in years of belowmedian rainfall. Consequently, significant trends in observed values can only be determinedcertainly over a period of many years. The record unfolding in recent years is considered toshow a favourable result, although not conclusive evidence that, in the long run the salinityof inflow will be the same or lower than predicted. The 2001-02 result is significantly higherthan past results (and the current trend) as a result of the low annual rainfall.
A Strategic Action Plan for managing salinity in the Collie River catchment above theWellington Dam has been prepared by the Collie Recovery Team as required in the StateSalinity Strategy, 2000. The plan is based on a clear water quality target: to reduce thesalinity of the Collie River at Mungalup Tower Gauging Station (the nearest point ofmeasurement to the Wellington Dam) to 680 mg/L TDS by the year 2015. The target is toachieve an average of 500mg/L TDS in the dam itself. As the graph illustrates initiativessuch as reforestation, drainage and catchment management activities are slowly beginningto reduce salinity levels.
J. The extent to which management objectives have been developedfor rivers, estuaries and wetlands, and
K. The extent to which rivers, estuaries and wetlands water qualitymeet agreed management objectives
Outcome: Protection and enhancement of the quality of the state’s surface andgroundwater.
Objective: Clean and healthy water resources
1. For rivers, estuaries and wetlands• Restore high risk/critical water dependent systems to functional condition• Slow rate of decline of water salinity in priority catchments• Reduced algal blooms, pollution and fish kills in priority areas
Relevance to Desired Outcome
The aim of the Water and Rivers Commission is not to return catchments to the pre-developedstate. It is to help manage catchments so they remain economically productive withoutdegrading the resource.
Instead the Commission recommends using water quality targets as a series of benchmarksto be achieved. With this system no consideration is given to the pre-development state ofthe system or the condition of other similar systems. Only the waterbody’s current statedetermines the target. The target defines the ‘now’ and compliance monitoring definesdeviations from now. If water quality is currently known to be poor the target level is set soit will ‘fail’ the compliance test. It will continue to ‘fail’ until there has been a measurableimprovement in water quality.
The targets represent a series of management benchmarks that encourage continualimprovement towards an ultimate desired state. A continual lowering of the bar until waterquality is acceptable is the best the Commission can hope to achieve. For waterbodies inwhich water quality is known to be currently good, the target level will help identify emergingdegradations.

50
Water and Rivers Commission Annual Report 2001–2002
Effectiveness measure
In 2001/2002 the Commission has continued to work with many stakeholders and the result
is similar to past years. However, on a catchment by catchment basis there have been both
positive and negative changes. The extent to which the results are affected by low annual
rainfall in not exactly known. Whilst the Commission has achieved improvements in some
areas, it is too early to understand the effects of lower rainfall versus the continued catchment
works and improvements.
It would be extremely difficult to assess every single watercourse in Western Australia. This
has resulted in a set of key, significant watercourses being identified in each region. It is
against this “total” that the condition summary graphs have been prepared.
Summary of the condition of Western Australia’s rivers
0
20
40
60
80
100
Allocation
Per
cen
tag
eo
fas
sess
edri
vers
(%)
Salinity Nutrientenrichment
Loss offringing
vegetation
Erosion andsedimentation
Average
Contamination
Low Moderate High Unknown
Table outlines the key influences and impacts on the condition of the State’s rivers. Many of
our objectives are aimed at maintaining the existing impacts at a low or moderate level. An
extensive review of the Commission data and trends indicate that our water resources continue
to slowly degrade.
L. The extent to which the waterways are protected while providingfacilities for public use
Outcome: Protection and enhancement of the Quality of the State’s Surface andGroundwater
Objective: Clean and healthy water resources
1. For Rivers, estuaries and wetlands• Restore high risk/critical water dependent systems to functional condition• Reduced algal blooms, pollution and fish kills in priority areas
Relevance to desired outcome
This indicator is assessed through two measures.

51
Annual Report 2001–2002 Water and Rivers Commission
1. Number of pollution complaints
Management Number of Number of Number ofAuthority Complaints Complaints Complaints
1999-2000 2000-2001 2001-2002
Leschenault Inlet 10 5 7
Peel Inlet 124 104 96
Albany Waterways 25 6 9
Avon River 3 7 0
Wilson Inlet 2 1 2
Pollution complaints may relate to incidents which are not significant in their effects, or thepollution may not in fact reach the waterway because of effective pollution response by theCommission and other authorities. The Commission continues to encourage and educatecommunities and industry groups in the management of waterways. Community support inrestoration activities has reduced debris. The reduction in complaints can also be attributableto improved pollution management by industry.
2. Level of compliance with license conditions
Management Authority Number of licenses % Complianceadministered
Leschenault Inlet 3 All 100%
Peel Inlet 5 All 100%
Albany Waterways 4 All 100%
Compliance continues to be monitored.
M. The extent to which management objectives have been developed toadequately protect public water supply for current and futuregenerations
Outcome: Protection and enhancement of the quality of the state’s surface andgroundwater
Objective: Clean and healthy water resources – For public water supply• Quality of existing public water supply resources are maintained
Relevance to desired outcome
A key objective aim of the Water and Rivers Commission (WRC) is to provide adequateprotection of the state’s public water supplies. Protection is not just for today, but also forfuture generations. The effective management of surface and ground water catchment areasis paramount to minimising water supply production costs.
The primary impact on the quality of our water resources result from the activities carriedout in surface water catchments and on the land covering our groundwater resources. Insome area of the state these land uses are incompatible with protection objectives and the

52
Water and Rivers Commission Annual Report 2001–2002
resource itself is at risk. Dealing with these incompatible land uses and influencing otherplanning processes to avoid more, are the primary means of achieving good outcomes forthe state.
Western Australia relies heavily on groundwater for water supply and the generally sandysoils makes the underlying groundwater highly vulnerable to groundwater contamination inthis State. In 2001/02 there were 147 water source protection plans listed for completion inthe State, an increase of nine on the previous year. The plans are an essential tool for guidingland use, and in turn adequate levels of protection of water. New plans may be added to thelist as required and prioritised for completion.
Effectiveness Measure
In 2001/02 the Commission completed a further five water source protection plans or policiesto guide state and local planning authorities in managing land within catchments. Theseplans are an important instrument for regulating land development and ensuring future andexisting developments have minimal impact on important drinking water resources.
N. Accrual cost per km2 of catchment where management andimprovement activities are undertaken
Outcome: Protection and enhancement of the quality of the state’s surface andgroundwater
Objective: Clean and healthy water resources
1. For rivers, estuaries and wetlands• Restore high risk/critical water dependent systems to functional condition• Slow rate of decline of water salinity in priority catchments• Reduced algal blooms, pollution and fish kills in priority areas
2. For public water supply• Quality of existing public water supply resources are maintained
Relevance to Desired Outcome
This indicator shows the efficiency with which the Commission utilises its resources acrossthe key management areas (catchments) of the state. When combined with indicators G andH, an assessment can be made on the level of resourcing appropriate to the improvements orachievements being attained.
The objective of this indicator is to maintain the current level of achievements or improvementsin catchment and water resource standards at minimum cost.
Efficiency Measure
The 2001/02 total costs for protecting and enhancing key waterways including estuaries andwetlands was $29 340m. The total area of the key catchments which impact on waterways isapproximately 567 750 km2.
The increase in Waterways protection and enhancement service costs results from increasedfunding from external sources, namely Federal Funds and increased state funding for salinityinitiatives totalling $5.06m.

53
Annual Report 2001–2002 Water and Rivers Commission
O. Average accrual cost per statutory referral
Outcome: Protection and enhancement of the quality of the state’s surface andgroundwater.
Objective: Clean and healthy water resources
For rivers, estuaries and wetlands• Restore high risk/critical water dependent systems to functional condition• Slow rate of decline of water salinity in priority catchments• Reduced algal blooms, pollution and fish kills in priority areas
For public water supply• Quality of existing public water supply resources are maintained
Relevance to desired outcome
The primary impact on the quality of our water resources result from the activities carriedout in surface water catchments and on the land covering our groundwater resources. Insome area of the state these land uses are incompatible with protection objectives and theresource itself is at risk. Dealing with these incompatible land uses and influencing otherplanning processes to avoid more, are the primary means of achieving good outcomes forthe state.
The Commission provides advice on land and development proposals to the Ministry forPlanning, Local Government, and other land planning authorities. Our advice is commonlyknown as a Statutory Referral. Through this advice the Commission seeks to influence landplanning in order to protect water resources from potential pollution or adverse environmentalimpacts.
Efficiency measure
In 2001/02 the Commission received 2708 referrals from which advice was provided. Thesignificant decrease in costs results from the Commission investing time in assessing thecritical state development and land use proposals. Additionally, significant efficiency gainshave been achieved by process improvements and the delegation of more routine assessmentto local government. Land use and industry applications are becoming increasingly complexrequiring additional research from the Commission and input from other government agenciesand stakeholders. The impact of this on unit costs is unknown, and future performancetargets will need to be reviewed once sufficient data is available.
P. Average water supply protection cost (per allocated Gigalitre) coveredby an agreed management plan
Outcome: Protection and enhancement of the quality of the state’s surface andgroundwater
Objective: Clean and healthy water resources – For public water supply• Quality of existing public water supply resources are maintained

54
Water and Rivers Commission Annual Report 2001–2002
Relevance to desired outcome
Like allocation objectives, the Commission has a key objective to protect water supply sourcesand ensure water quality for current and future generations. This indicator reflects theefficiency at which the Commission provides a number of services (such as protection plans,policies and advice) for the volume of water that is protected.
Efficiency measure
The minor increase in unit costs results directly from an increase in capital user chargerelating to the management of Priority 1 Land which is held by the Commission to protectwater quality within critical groundwater reserves. Overall, the operational expenses weresimilar to past years and performance improved as a result of increased water undermanagement.
55
Annual Report 2001–2002 Water and Rivers Commission
AUDITOR GENERAL
4th Floor Dumas House 2 Havelock Street West Perth 6005 Western Australia Tel: 08 9222 7500 Fax: 08 9322 5664
To the Parliament of Western Australia
WATER AND RIVERS COMMISSION
FINANCIAL STATEMENTS FOR THE YEAR ENDED JUNE 30, 2002
Matters Relating to the Electronic Presentation of the Audited Financial Statements
This audit opinion relates to the financial statements of Water and Rivers Commission for
the year ended June 30, 2002 included on the Commission’s web site. The Board is
responsible for the integrity of the Commission’s web site. I have not been engaged to
report on the integrity of the Commission’s web site. The audit opinion refers only to the
statements named below. It does not provide an opinion on any other information which
may have been hyperlinked to or from these statements. If users of this opinion are
concerned with the inherent risks arising from electronic data communications, they are
advised to refer to the hard copy of the audited financial statements to confirm the
information included in the audited financial statements presented on this web site.
Scope
I have audited the accounts and financial statements of the Water and Rivers Commission
for the year ended June 30, 2002 under the provisions of the Financial Administration and
Audit Act 1985.
The Board is responsible for keeping proper accounts and maintaining adequate systems of
internal control, preparing and presenting the financial statements, and complying with the
Act and other relevant written law. The primary responsibility for the detection,
investigation and prevention of irregularities rests with the Board.
My audit was performed in accordance with section 79 of the Act to form an opinion based
on a reasonable level of assurance. The audit procedures included examining, on a test
basis, the controls exercised by the Commission to ensure financial regularity in accordance
with legislative provisions, evidence to provide reasonable assurance that the amounts and
other disclosures in the financial statements are free of material misstatement and the
evaluation of accounting policies and significant accounting estimates. These procedures
have been undertaken to form an opinion as to whether, in all material respects, the
financial statements are presented fairly in accordance with Accounting Standards and other
mandatory professional reporting requirements in Australia and the Treasurer’s Instructions
so as to present a view which is consistent with my understanding of the Commission’s
financial position, its financial performance and its cash flows.
The audit opinion expressed below has been formed on the above basis.

56
Water and Rivers Commission Annual Report 2001–2002
Water and Rivers Commission
Financial statements for the year ended June 30, 2002
Audit Opinion
In my opinion,
(i) the controls exercised by the Water and Rivers Commission provide reasonable
assurance that the receipt, expenditure and investment of moneys and the
acquisition and disposal of property and the incurring of liabilities have been in
accordance with legislative provisions; and
(ii) the Statement of Financial Performance, Statement of Financial Position and
Statement of Cash Flows and the Notes to and forming part of the financial
statements are based on proper accounts and present fairly in accordance with
applicable Accounting Standards and other mandatory professional reporting
requirements in Australia and the Treasurer’s Instructions, the financial position
of the Commission at June 30, 2002 and its financial performance and its cash
flows for the year then ended.
K O O’NEIL
ACTING AUDITOR GENERAL
November 22, 2002
4th Floor Dumas House 2 Havelock Street West Perth 6005 Western Australia Tel: 08 9222 7500 Fax: 08 9322 5664

57
Annual Report 2001–2002 Water and Rivers Commission
6 Financial statements
Certification of financial statements for the year ended 30 June 2002
The accompanying financial statements of the Water and Rivers Commission have beenprepared in compliance with the provisions of the Financial Administration and Audit Act1985 from proper accounts and records to present fairly the financial transactions for theyear ending 30 June 2002 and the financial position as at 30 June 2002.
At the date of signing, we are not aware of any circumstances which would render theparticulars included in the financial statements misleading or inaccurate.
Mr Peter KentPRINCIPAL ACCOUNTING OFFICER
Mr Ken WebsterBOARD CHAIRMAN
Roger F Payne
CHIEF EXECUTIVE
31 August 2001

58
Water and Rivers Commission Annual Report 2001–2002
Statement of financial performancefor the year ended 30 June 2002
Note 2002 2001$000 $000
COST OF SERVICES
Expenses from ordinary activities
Employee expenses 2 26 227 28 312
Borrowing costs expense 114 145
Depreciation and amortisation expense 3 1 616 1 598
Capital user charge 4 8 178 -
Grants and subsidies 5 4 076 1 846
Lease rentals 6 2 512 2 758
Service related expenses 7 10 054 12 448
Goods and materials 8 2 388 2 530
Other expenses from ordinary activities 9 2 685 2 992
Net loss on disposal of non-current assets 10 30 8
Total cost of services 57 880 52 637
Revenues from ordinary activities
Revenue from operating activities
User charges and fees 67 49
Commonwealth grants and contributions 11 3 487 6 686
Recoup from the Office of Water Regulation 184 184
Recoup from Swan River Trust 12 2 186 3 171
Revenue from non-operating activities
Interest revenue 214 265
Other revenues from ordinary activities 13 3 175 2 378
Total revenues from ordinary activities 9 313 12 733
NET COST OF SERVICES 48 567 39 904
REVENUES FROM GOVERNMENT 14
Output appropriation (a) 47 885 37 391
Assets assumed/(transferred) (253) -
Resources received free of charge 268 159
Total revenues from Government 47 900 37 550
TOTAL CHANGES IN EQUITY OTHER THAN THOSERESULTING FROM TRANSACTIONS WITH WESTERNAUSTRALIA STATE GOVERNMENT AS OWNERS (667) (2 354)
(a) Appropriation includes capital in 2002
The Statement of Financial Performance should be read in conjunction with the accompanyingnotes.
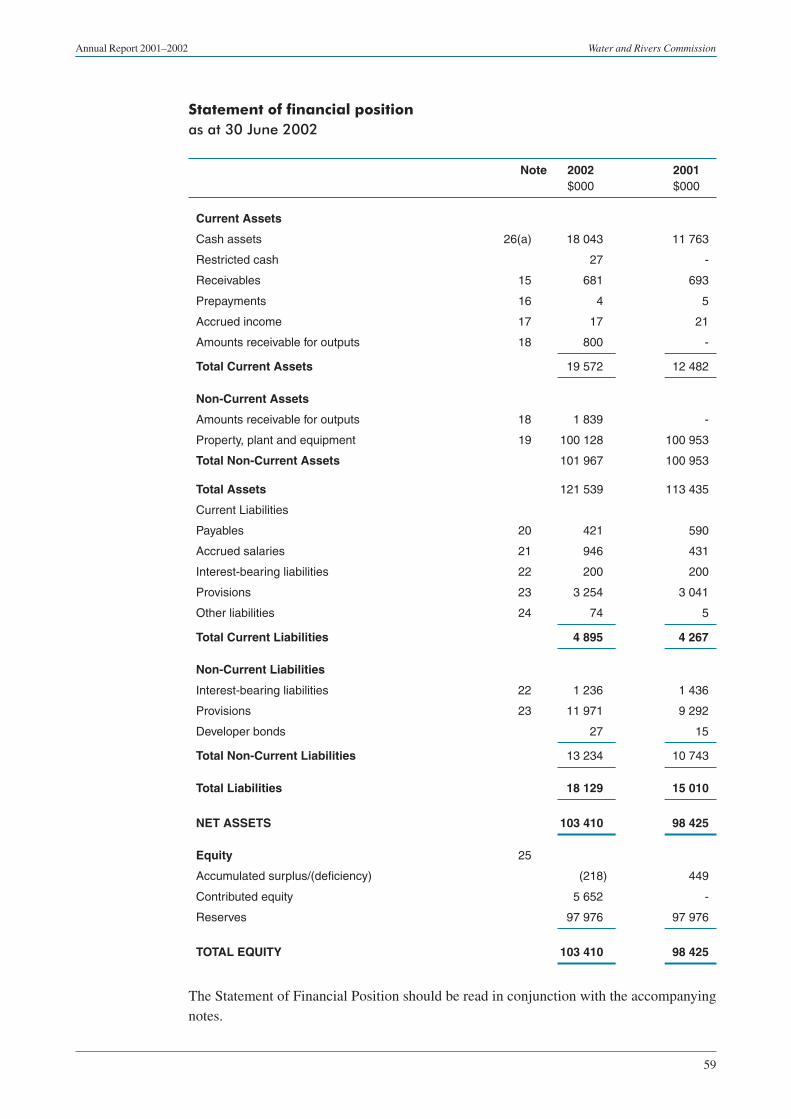
59
Annual Report 2001–2002 Water and Rivers Commission
Statement of financial positionas at 30 June 2002
Note 2002 2001$000 $000
Current Assets
Cash assets 26(a) 18 043 11 763
Restricted cash 27 -
Receivables 15 681 693
Prepayments 16 4 5
Accrued income 17 17 21
Amounts receivable for outputs 18 800 -
Total Current Assets 19 572 12 482
Non-Current Assets
Amounts receivable for outputs 18 1 839 -
Property, plant and equipment 19 100 128 100 953
Total Non-Current Assets 101 967 100 953
Total Assets 121 539 113 435
Current Liabilities
Payables 20 421 590
Accrued salaries 21 946 431
Interest-bearing liabilities 22 200 200
Provisions 23 3 254 3 041
Other liabilities 24 74 5
Total Current Liabilities 4 895 4 267
Non-Current Liabilities
Interest-bearing liabilities 22 1 236 1 436
Provisions 23 11 971 9 292
Developer bonds 27 15
Total Non-Current Liabilities 13 234 10 743
Total Liabilities 18 129 15 010
NET ASSETS 103 410 98 425
Equity 25
Accumulated surplus/(deficiency) (218) 449
Contributed equity 5 652 -
Reserves 97 976 97 976
TOTAL EQUITY 103 410 98 425
The Statement of Financial Position should be read in conjunction with the accompanyingnotes.

60
Water and Rivers Commission Annual Report 2001–2002
Statement of cash flowsfor the year ended 30 June 2002
Note 2002 2001Inflows Inflows
(Outflows) (Outflows)$000 $000
CASH FLOWS FROM GOVERNMENT
Output appropriations 45 246 36 591
Capital contributions (2001 appropriation) 2 700 800
Holding account drawdowns - -
Net cash provided by Government 47 946 37 391
Utilised as follows:
CASH FLOWS FROM OPERATING ACTIVITIES
Payments
Employee costs (22 760) (23 061)
Supplies and services (21 595) (22 608)
Capital user charge (8 178) -
Borrowing costs expense (113) (143)
GST payments on purchases (1 966) (2 041)
Receipts
User charges and fees 67 49
Commonwealth grants and contributions 3 487 6 686
Receipts from state government agencies 2 370 3 355
Interest received 218 263
Other operating receipts 3 157 2 474
GST receipts on sales 499 1 265
GST receipts from taxation authority 1 497 484
Net cash provided by/(used) in operating activities 26 (c) (43 317) (33 277)
CASH FLOWS FROM INVESTING ACTIVITIES
Purchase of non-current physical assets (1 080) (399)
Proceeds from sale of non-current physical assets 6 -
Net cash provided by/(used in) investing activities (1 074) (399)
CASH FLOWS FROM FINANCING ACTIVITIES
Repayment of borrowings (200) (318)
Net cash provided by/(used in) financing activities (200) (318)
Net increase/(decrease) in cash held 3 355 3 397
Cash assets at the beginning of the financial year 11 763 8 366
Cash assets transferred from other departments 2 952 -
CASH ASSETS AT THE END OF THE FINANCIAL YEAR 26 (a) 18 070 11 763
The Statement of Cash Flows should be read in conjunction with the accompanying notes.

61
Annual Report 2001–2002 Water and Rivers Commission
NOTES TO THE FINANCIAL STATEMENTSfor the year ended 30 June 2002
1. Significant accounting policies
The following accounting policies have been adopted in the preparation of the financialstatements. Unless otherwise stated these policies are consistent with those adopted in theprevious year.
General statement
The financial statements constitute a general purpose financial report which has been preparedin accordance with Australian Accounting Standards, Statements of Accounting Conceptsand other authoritative pronouncements of the Australian Accounting Standards Board andUrgent Issues Group (UIG) Consensus Views as applied by the Treasurer’s Instructions.Several of these are modified by the Treasurer’s Instructions to vary application, disclosure,format and wording. The Financial Administration and Audit Act and the Treasurer’sInstructions are legislative provisions governing the preparation of financial statements andtake precedence over Australian Accounting Standards, Statements of Accounting Conceptsand other authoritative pronouncements of the Australian Accounting Standards Board andUIG Consensus Views. The modifications are intended to fulfil the requirements of generalapplication to the public sector together with the need for greater disclosure and also tosatisfy accountability requirements.
If any such modification has a material or significant financial effect upon the reportedresults, details of that modification and, where practicable, the resulting financial effect, aredisclosed in individual notes to these financial statements.
The statements have been prepared on the accrual basis of accounting using the historicalcost convention, except for certain assets and liabilities which, as noted, are measured atvaluation.
(a) Output appropriations
Output Appropriations are recognised as revenues in the period in which the Commissiongains control of the appropriated funds. The Commission gains control of appropriated fundsat the time those funds are deposited into the Commission’s bank account or credited to theholding account held at the Department of Treasury and Finance.
(b) Contributed equity
Under UIG 38 “Contributions by Owners Made to Wholly-Owned Public Sector Entities”transfers in the nature of equity contributions must be designated by the Government (owners)as contributions by owners (at the time of, or prior to transfer) before such transfers can berecognised as equity contributions in the financial statements. Capital contributions(appropriations) have been designated as contributions by owners and have been crediteddirectly to Contributed Equity in the Statement of Financial Position. All other transfershave been recognised in the Statement of Financial Performance. Prior to the current reportingperiod, capital appropriations were recognised as revenue in the Statement of FinancialPerformance. Capital appropriations which are repayable to the Treasurer are recognised asliabilities.

62
Water and Rivers Commission Annual Report 2001–2002
(c) Grants and other contributions revenue
Grants, donations, gifts and other non-reciprocal contributions are recognised as revenuewhen the Commission obtains control over the assets comprising the contributions. Controlis normally obtained upon their receipt.
Contributions are recognised at their fair value. Contributions of services are only recognisedwhen a fair value can be reliably determined and the services would be purchased if notdonated.
(d) Revenue recognition
Revenues from licence fees and charges represents revenue earned from licence fees andcharges under the Rights in Water and Irrigation Act, the Waterways Conservation Act andthe Water and Rivers Commission Act. Other revenue is fully described in the Statement ofFinancial Performance and notes to the accounts.
Revenue from the sale of goods and disposal of other assets and the rendering of services, isrecognised when the Commission has passed control of the goods or other assets or deliveryof the service to the customer.
(e) Acquisition of assets
The cost method of accounting is used for all acquisitions of assets. Cost is measured as thefair value of the assets given up or liabilities undertaken at the date of acquisition plusincidental costs directly attributable to the acquisition.
Assets acquired at no cost or for nominal consideration, are initially recognised at their fairvalue at the date of acquisition.
(f) Depreciation of non-current assets
All non-current assets having a limited useful life are systematically depreciated over theiruseful lives in a manner which reflects the consumption of their future economic benefits.
Depreciation is calculated on the straight line basis, using rates which are reviewed annually.Useful lives for each class of depreciable asset are:
Buildings 20 - 80 years
Plant, machinery and equipment 5 - 20 years
Computing equipment and accessories 3 - 5 years
Furniture and fittings 7 - 10 years
Measurement sites 40 years
(g) Revaluation of land, buildings and infrastructure
The Commission has a policy of valuing land, buildings and infrastructure at fair value. Theannual revaluations of the Commission’s land and buildings undertaken by the Valuer GeneralOffice are recognised in the financial statements. Infrastructure assets are being progressivelyrevalued to fair value under the transitional provisions in AASB 1041 (8.12)(b).
Other assets are recognised at cost.

63
Annual Report 2001–2002 Water and Rivers Commission
(h) Leases
The Commission has entered into a number of operating lease arrangements for rent ofbuildings, office equipment and motor vehicles where the lessors effectively retain all of therisks and benefits incident to ownership of the items held under the operating leases. Equalinstalments of the lease payments are charged to the Statement of Financial Performanceover the lease term, as this is representative of the pattern of benefits to be derived from theleased property.
(i) Cash
For the purpose of the Statement of Cash Flows, cash includes cash assets and restrictedcash assets. These include short-term deposits that are readily convertible to cash on handand are subject to insignificant risk of changes in value.
(j) Receivables
Receivables are recognised at the amounts receivable as they are due for settlement no morethan 30 days from the date of recognition.
Collectability of receivables is reviewed on an ongoing basis. Debts which are known to beuncollectable are written off. A provision for doubtful debts is raised where some doubt as tocollection exists and in any event where the debt is more than 60 days overdue.
(k) Payables
Payables, including accruals not yet billed, are recognised when the Commission becomesobliged to make future payments as a result of a purchase of assets or services. Payables aregenerally settled within 30 days.
(l) Interest-bearing liabilities
Borrowings from WA Treasury Corporation predominantly represents debt assigned to theCommission on separation from the Water Authority. An additional amount was borrowedto fund land purchases in the Blackwood area.
Borrowings are recorded at an amount equal to the net proceeds received. Borrowing costsexpense is recognised on an accrual basis.
(m) Employee entitlements
Employee entitlements have been transferred from those Government Agencies for whomemployees worked prior to the creation of the Water and Rivers Commission on 1 January1996. Entitlements have been calculated on a continuing service basis as follows:
i) Annual and long service leave
Annual and long service leave entitlements are recognised at current remuneration ratesand is measured at the amount unpaid at the reporting date in respect to employees’ serviceup to that date.
Long service leave is calculated for employees who have accrued leave and are 55 yearsor older, or are employed under the Australian Workers Union Award. A pro-rata liability

64
Water and Rivers Commission Annual Report 2001–2002
for long service leave is also recognised for officers who have completed four or moreyears of service.
An actuarial assessment of long service leave was carried out as at 30 June 2001, and itwas determined that the actuarial assessment of the liability was not materially differentfrom the liability reported. This method of measurement of the liability is consistent withthe requirements of Australian Accounting Standard AAS 30 “Accounting for EmployeeEntitlements”.
ii) Superannuation
Staff may contribute to the Pension scheme, a defined benefits pension scheme now closedto new members, or to the Gold State Superannuation Scheme, a defined benefit andlump sum scheme now also closed to new members. All staff who do not contribute toeither of these schemes become non-contributory members of the West StateSuperannuation Scheme, an accumulation fund complying with the CommonwealthGovernment’s Superannuation Guarantee (Administration) Act 1992.
All of these schemes are administered by the Government Employees SuperannuationBoard (GESB). The Pension Scheme and the pre-transfer benefit for employees whotransferred to the Gold State Superannuation Scheme are extinguished by payment of theemployer contributions to the GESB.
The liability for superannuation charges under the Gold State Superannuation Schemeand West State Superannuation Scheme are extinguished by payment of employercontributions to the Government Employees Superannuation Board.
The note disclosure required by paragraph 51(e) of AAS 30 (being the employer’s shareof the difference between employee’s accrued superannuation benefits and the attributablenet market value of plan assets) has not been provided. State scheme deficiencies arerecognised by the State in its whole of government reporting. The Government EmployeesSuperannuation Board’s records are not structured to provide the information for theCommission. Accordingly, deriving the information for the Commission is impracticalunder current arrangements, and thus any benefits thereof would be exceeded by the costof obtaining the information.
(n) Accrued salaries
Accrued salaries (refer note 19) represent the amount due to staff but unpaid at the end of thefinancial year, as the end of the last pay period for that financial year does not coincide withthe end of the financial year. The Commission considers the carrying amount approximatesnet fair value.
(o) Resources received free of charge or for nominal value
Resources received free of charge or for nominal value which can be reliably measured arerecognised as revenues and as assets or expenses as appropriate at fair value.
(p) Comparative figures
Comparative figures are, where appropriate, reclassified so as to be comparable with thefigures presented in the current financial year.

65
Annual Report 2001–2002 Water and Rivers Commission
(q) Rounding
Amounts in the financial statements have been rounded to the nearest thousand dollars, or incertain cases, to the nearest dollar.
2002 2001$000 $000
2 Employee expenses
Salaries and wages 19 718 19 676
Superannuation 3 522 6 466
Change in long service leave entitlements 1 553 403
Change in annual leave entitlements 38 340
Payroll tax 1 169 1 156
Fringe benefits tax 227 271
26 227 28 312
3 Depreciation and amortisation expense
Buildings 167 160
Plant, machinery and equipment 258 259
Computing equipment and accessories 297 285
Furniture and fittings 12 12
Measurement sites 882 882
1 616 1 598
4 Capital user charge
8 178 -
A capital user charge rate of 8% has been set by the Government for 2002 and represents theopportunity cost of capital invested in the net assets of the Commission used in the provisionof outputs. The charge is calculated on the net assets adjusted to take account of exemptassets. Payments are made to the Department of Treasury and Finance on a quarterly basis.
5 Grants and subsidies
4 076 1 846
Grants and subsidies include research grants allocation, sponsorship, grants to farmers andsubsidies. The variance is due mainly to 2002 containing grants payable under the RuralWater Grant program.
6 Lease rentals
2 512 2 758
Operating lease and hire payments include lease of office accommodation, vehicles, plantand machinery and hire of other facilities.

66
Water and Rivers Commission Annual Report 2001–2002
2002 2001$000 $000
7 Service related expenses
10 054 12 448
Service related expenses include professional and non professional service contracts, chemicalanalysis, legal charges, consultants, insurance, advertising, public relations and other servicerelated expenses.
8 Goods and materials
2 388 2 530
Goods and materials include office supplies, library acquisitions, laboratory supplies, motorvehicle running expenses, utilities and other consumable equipment and materials.
9 Other expenses from ordinary activities
Communication expenses 1 347 1 243
Asset maintenance expenses 224 427
Doubtful debts expense 1 (10)
Sundry operating expenses 1 113 1 332
2 685 2 992
10 Net loss on disposal of non-current assets
Loss on Sales of Non-Current Assets
Plant and equipment 13 -
Computing equipment 17 -
Land - 8
Gross proceeds on disposal of asset 6 8
Net loss 30 8
11 Commonwealth grants and contributions
Land and Water Resources Research and Development Corporation 471 259
Natural Heritage Trust 2 231 4 189
Waterwatch Revenue - 490
Environment and Heritage 785 1 748
3 487 6 686
The variance is due to a reduction in the Natural Heritage Trust (NHT) program. The majorityof the Commission projects funded by the NHT were completed by end of 2000, with alimited number of projects extended into the last financial year.
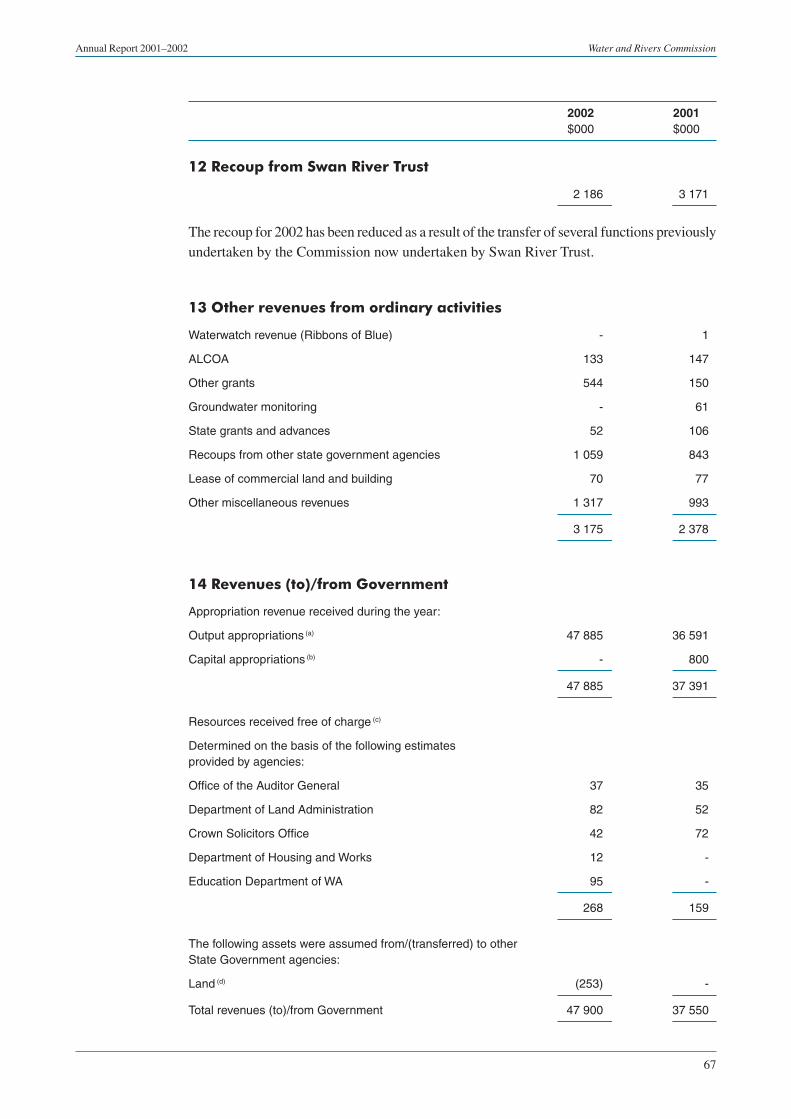
67
Annual Report 2001–2002 Water and Rivers Commission
2002 2001$000 $000
12 Recoup from Swan River Trust
2 186 3 171
The recoup for 2002 has been reduced as a result of the transfer of several functions previouslyundertaken by the Commission now undertaken by Swan River Trust.
13 Other revenues from ordinary activities
Waterwatch revenue (Ribbons of Blue) - 1
ALCOA 133 147
Other grants 544 150
Groundwater monitoring - 61
State grants and advances 52 106
Recoups from other state government agencies 1 059 843
Lease of commercial land and building 70 77
Other miscellaneous revenues 1 317 993
3 175 2 378
14 Revenues (to)/from Government
Appropriation revenue received during the year:
Output appropriations (a) 47 885 36 591
Capital appropriations (b) - 800
47 885 37 391
Resources received free of charge (c)
Determined on the basis of the following estimatesprovided by agencies:
Office of the Auditor General 37 35
Department of Land Administration 82 52
Crown Solicitors Office 42 72
Department of Housing and Works 12 -
Education Department of WA 95 -
268 159
The following assets were assumed from/(transferred) to otherState Government agencies:
Land (d) (253) -
Total revenues (to)/from Government 47 900 37 550

68
Water and Rivers Commission Annual Report 2001–2002
(a) Output appropriations are accrual amounts as from 1 July 2001, reflecting the full pricepaid for outputs purchased by the Government. The appropriation revenue comprises acash component and a receivable (asset). The receivable (holding account) comprisesthe depreciation expense for the year and any agreed increase in leave liability duringthe year.
(b) Capital appropriations were revenue in 2001 (year ended 30 June 2001). From 1 July2001, capital appropriations, termed Capital Contributions, have been designated ascontributions by owners and are credited straight to equity in the Statement of FinancialPosition.
(c) Where assets or services have been received free of charge or for nominal consideration,the Commission recognises revenues equivalent to the fair value of the assets and/or thefair value of those services that can be reliably determined and which would have beenpurchased if not donated, and those fair values shall be recognised as assets or expenses,as applicable.
(d) Proceeds from the sale of land are not reflected in the financial statements as theseproceeds are held by the Department of Treasury and Finance.
2002 2001$000 $000
15 Receivables
Current
Trade debtors 453 437
GST receivable 230 260
Provision for doubtful debts (2) (4)
681 693
16 Prepayments
Western Australian Treasury Corporation 4 5
17 Accrued income
Interest receivable 17 21
18 Amounts receivable for outputs
Current 800 -
Non-current 1 839 -
2 639 -
This asset represents the non-cash component of output appropriations. It is restricted in thatit can only be used for asset replacement or payment of leave liability.

69
Annual Report 2001–2002 Water and Rivers Commission
2002 2001$000 $000
19 Property, plant and equipmentLand at cost 160 -
Land at fair value 76 423 76 431
Disposals (253) (8)
76 330 76 423
Buildings at cost 3 323 3 324
Accumulated depreciation (729) (563)
2 594 2 761
Computing equipment at cost 2 634 2 377
Accumulated depreciation (1 975) (1 719)
659 658
Furniture and fittings at cost 82 82
Accumulated depreciation (55) (43)
27 39
Measurement sites at cost 25 425 25 425
Accumulated depreciation (6 093) (5 211)
19 332 20 214
Plant, machinery and equipment at cost 2 936 2 364
Accumulated depreciation (1 750) (1 506)
1 186 858
Total property, plant and equipment 100 128 100 953
An amount of $31 805 000 of land valuation increment was brought to asset revaluationreserve in 2001.
Reconciliations
Reconciliations of the carrying amounts of property, plant and equipment at the beginningand end of the current and previous financial year are set out below.
Land Buildings Computing Furniture Measure- Plant, Totalequipment and fittings ment sites machinery
andequipment
2002 $000 $000 $000 $000 $000 $000 $000
Carrying amountat start of year 76 423 2 761 658 39 20 214 858 100 953
Additions 160 - 317 - - 603 1 080
Disposal (253) - (19) - - (17) (289)
Revaluation increments - - - - - - -
Depreciation - (167) (297) (12) (882) (258) (1 616)
Carrying amountat end of year 76 330 2 594 659 27 19 332 1 186 100 128

70
Water and Rivers Commission Annual Report 2001–2002
2002 2001$000 $000
20 Payables
Trade payables 421 590
21 Accrued salaries
Amounts owing for 6 working days to 30 June 2002and (2001) – 6 working days 946 431
Accrued salaries includes severance payments amounting to $510 198. Payments were madeon the first pay week of 2003.
22 Interest-bearing liabilities
Current 200 200
Non-current 1 236 1 436
1 436 1 636
Net Fair Values
The Commission considers the carrying amount of borrowings approximates the net fairvalue.
23 Provisions
Current liabilities
Annual leave 1 780 1 660
Long service leave 1 474 1 381
3 254 3 041
Non-current liabilities
Long service leave 3 167 1 552
Superannuation 8 804 7 740
11 972 9 292
The superannuation liability has been established from data supplied by the GovernmentEmployees Superannuation Board.
The Commission considers the carrying amount of employee entitlements approximatestheir net fair values.
24 Other liabilities
Accrual fringe benefits tax 60 -
Stale cheque holding account 14 5
74 5

71
Annual Report 2001–2002 Water and Rivers Commission
2002 2001$000 $000
25 Equity
Contributed equity
Opening balance - -
Capital contributions (a) 2 700 -
Net capital contributed upon restructure (b) 2 952 -
Closing balance 5 652 -
(a) From 1 July 2001, capital appropriations, termed Capital Contributions, have beendesignated as contributions by owners and are credited straight to equity in the Statementof Financial Position.
(b) From 1 July 2001, Rural Water Assistance Program was transferred to the Water andRivers Commission. The transferred amount of $2 952 121 represents the cash balanceas at 30 June 2001.
Accumulated surplus/(deficiency)
Opening balance 449 2 803
Change in net assets (667) (2 354)
Closing balance (218) 449
Reserves
Asset revaluation reserve (a)
Opening balance 31 804 31 804
Net revaluation increments:
Land and buildings - -
Property, plant and equipment - -
Closing balance 31 804 31 804
Fixed assets acquired under restructuring arrangements 66 172 66 172
Total reserves 97 976 97 976
Total Equity 103 410 98 425
(a) The asset revaluation reserve is used to record increments and decrements on therevaluation of non-current assets, as described in accounting policy note 1(g).
26 Notes to the statement of cash flows
(a) Reconciliation of cash
Cash at the end of the financial year as shown in the Statement of Cash Flows is reconciledto the related items in the Statement of Financial Position as follows:
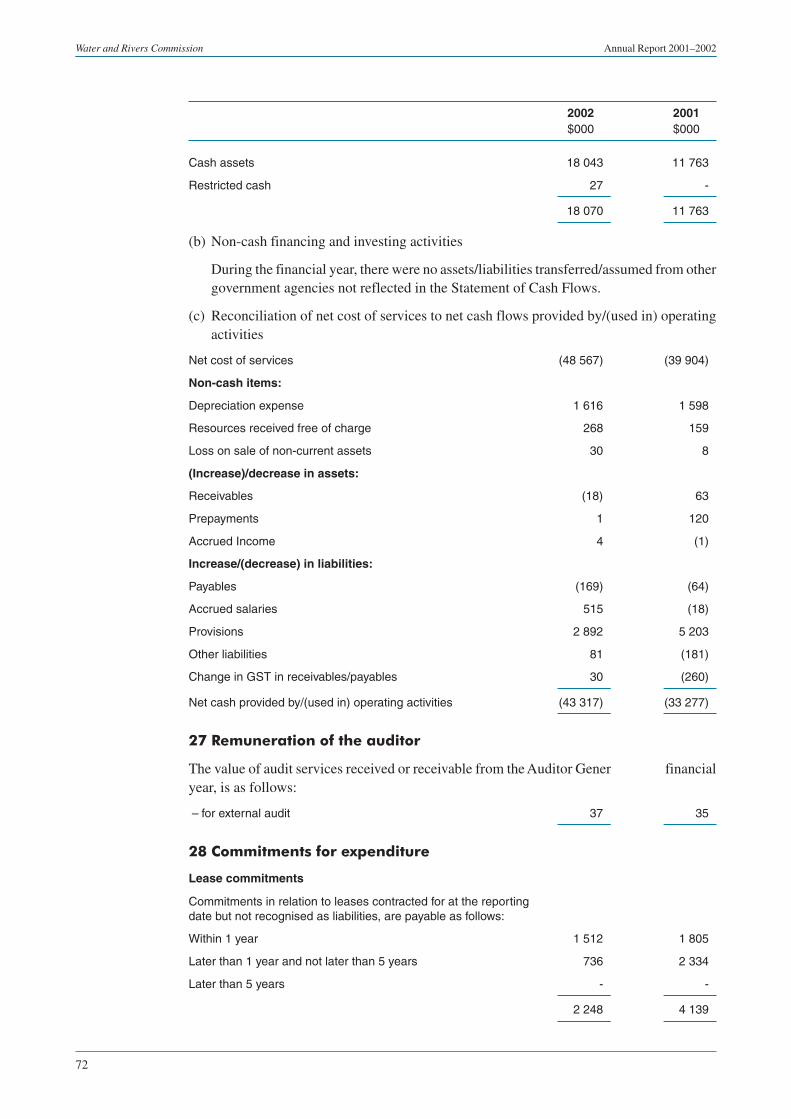
72
Water and Rivers Commission Annual Report 2001–2002
2002 2001$000 $000
Cash assets 18 043 11 763
Restricted cash 27 -
18 070 11 763
(b) Non-cash financing and investing activities
During the financial year, there were no assets/liabilities transferred/assumed from othergovernment agencies not reflected in the Statement of Cash Flows.
(c) Reconciliation of net cost of services to net cash flows provided by/(used in) operatingactivities
Net cost of services (48 567) (39 904)
Non-cash items:
Depreciation expense 1 616 1 598
Resources received free of charge 268 159
Loss on sale of non-current assets 30 8
(Increase)/decrease in assets:
Receivables (18) 63
Prepayments 1 120
Accrued Income 4 (1)
Increase/(decrease) in liabilities:
Payables (169) (64)
Accrued salaries 515 (18)
Provisions 2 892 5 203
Other liabilities 81 (181)
Change in GST in receivables/payables 30 (260)
Net cash provided by/(used in) operating activities (43 317) (33 277)
27 Remuneration of the auditor
The value of audit services received or receivable from the Auditor General for the financialyear, is as follows:
– for external audit 37 35
28 Commitments for expenditure
Lease commitments
Commitments in relation to leases contracted for at the reportingdate but not recognised as liabilities, are payable as follows:
Within 1 year 1 512 1 805
Later than 1 year and not later than 5 years 736 2 334
Later than 5 years - -
2 248 4 139

73
Annual Report 2001–2002 Water and Rivers Commission
29 Contingent liabilities
In addition to the liabilities incorporated in the financial statements, the Commission has the
following contingent liability:
Pay-roll tax assessment
The Commission was issued a preliminary assessment by the Department of Treasury and
Finance wherein approximately $520 000 may be payable. This was due to the omission of
employer superannuation contributions and Fringe Benefits Taxable amounts in the calculation
of payroll tax returns for the years 1998, 1999, 2000 and 2001.
30 Events occurring after reporting date
No events have occurred after reporting date which materially impact on the financial
statements.
31 Explanatory statements
(a) Significant variations between actual revenues and expenditures for the financialyear and revenues and expenditures for the immediately preceding financial year
Details and reasons for significant variations between actual revenue and expenditure
and the corresponding item of the preceding year are detailed below. Significant variations
are considered to be those greater than $500 000 where exceeding 10% of the preceding
year’s figure.
Note 2002 2001 VarianceActual Actual
$000 $000 $000
Expenses from ordinary activities
Employee expenses (i) 26 227 28 312 (2 085)
Borrowing costs expense 114 145 (31)
Depreciation and amortisation expense 1 616 1 598 18
Capital user charge 8 178 - 8 178
Grants and subsidies (ii) 4 076 1 846 2 230
Lease rentals 2 512 2 758 (246)
Service related expenses (iii) 10 054 12 448 (2 394)
Goods and materials 2 388 2 530 (142)
Other expenses from ordinary activities (iv) 2 685 2 992 (307)
Net loss on disposal of non-current assets 30 8 22
Total Expenses 57 880 52 637 5 243
Continued on next page…

74
Water and Rivers Commission Annual Report 2001–2002
…continued from previous page
Note 2002 2001 VarianceActual Actual
$000 $000 $000
Revenues
Licence fees and charges 67 49 18
Commonwealth grants and contributions (v) 3 487 6 686 (3 199)
Recoup from the Office of Water Regulation 184 184 -
Recoup from Swan River Trust (vi) 2 186 3 171 (985)
Interest 214 265 (51)
Other revenues from ordinary activities (vii) 3 175 2 378 797
Total revenues from ordinary activities 9 313 12 733 (3 420)
Net cost of services 48 567 39 904 8 663
Explanation of variances
(i) Employee expenses
The variation is mainly due to the additional superannuation expense raised in 2001 in
recognising the liability relating to the transfer of former Water Corporation employees
to the Commission.
(ii) Grants and subsidies
The variation in grants and subsidies is primarily due to the transfer of the Rural Water
Grant program from the Office of Water Regulation.
(iii) Service related expense
The variation is due to a reduction in the engagement of contractors particularly in the
Waterways Protection program.
(iv) Other expenses from ordinary activities
The variance is due to a general decrease in expenditure during the financial year.
(v) Commonwealth grants and contributions
The variation is primarily due to a reduction in Natural Heritage Trust (NHT) funding
and Environment and Heritage funding for the Coastal and Clean Seas program.
(vi) Recoup from Swan River Trust
The recoup for 2002 has been reduced as a result of the transfer of several functions
previously undertaken by the Commission which are now undertaken by Swan River
Trust.

75
Annual Report 2001–2002 Water and Rivers Commission
(vii) Other revenues from ordinary activities
The variation is primarily due to an increase in other grants and advances received
during the financial year.
(b) Comparison of Estimates and Actual Results
Section 42 of the Financial Administration and Audit Act requires statutory authorities
to prepare annual budget estimates. Treasurer’s instruction 945 requires an explanation
of significant variations between these estimates and actual results. Significant variations
are considered to be those greater than 10% of budget. The figures below represent the
total cost of the output on an accrual basis.
OUTPUTS Note Estimate Actual Variance2002 2002$000 $000 $000
Water allocation policies (i) 2 228 1 532 (696)
Water information and allocation plans for
Sustainable development (ii) 15 280 12 826 (2 454)
Regulation, licensing and community
awareness 7 277 7 982 705
Rural water supply assistance (iii) 1 561 2 307 746
Water protection policies, guidelines andregulation (iv) 14 943 9 529 (5 414)
Water resource information, protection
Plans and works 23 234 22 810 (424)
State development planning and approvals (v) 1 066 894 (172)
65 589 57 880 7 709
Explanation of variances – Actual to estimate
The combination of additional income and accrual expenses increased the overall costs for
all outputs. Output cost variations also resulted from the redirection of funds to emergent
priorities within alternative outputs. Details of these transfers are listed below.
(i) Water allocation policies
The Output was underspent mainly due to technical delays experienced within the
Kwinana Aquifer Storage and Recovery Pilot project.
(ii) Water information and allocation plans for sustainable development
The Estimate contained an overstatement of approximately $2m for the Capital User
Charge which was subsequently adjusted against the Commission’s appropriation during
the year, by the Department of Treasury and Finance.

76
Water and Rivers Commission Annual Report 2001–2002
(iii) Rural water supply assistance
Actual expenditure for 2002 includes grants paid to rural communities from past yearcarryover funds. Funds are held by the Commission and paid as rural communitiesachieve contracted milestones.
(iv) Water protection policies, guidelines and regulation
The Estimate contained an overstatement of approximately $6m for the Capital UserCharge which was subsequently adjusted against the Commission’s appropriation duringthe year, by the Department of Treasury and Finance.
(v) State development planning and approvals
Water research programs to provide information for assesssing state developmentproposals, were delayed due to weather conditions preventing access to resources anddelays in negotiating drilling and water research contracts with other agencies.
32 Financial instruments
(a) Interest rate risk exposure
The following table details the Commission’s exposure to interest rate risk as at thereporting date:
Fixed interest rate maturities
Weighted Variable Less than 1 to 5 years More than Non-interest Totalaverage rate 1 year 5 years bearingeffectiveinterest rate
2002 % $000 $000 $000 $000 $000 $000
Financial Assets
Cash assets 4.7 4 723 - - - 13 320 18 043
Restricted cash 4.7 27 - - - - 27
Receivables - - - - - 681 681
Interest receivable 4.7 17 - - - - 17
4 767 - - - 14 001 18 768
Financial Liabilities
Payables - - - - - 421 421
WATC 7.0 - 598 747 91 - 1 436
Other liabilities - - - - - 74 74
Developer bond - - - - - 27 27
- 598 747 91 522 1 958
2001
Financial assets 6.1 4 532 - - - 7 950 12 482
Financial liabilities 7.2 - 200 750 686 13 374 15 010

77
Annual Report 2001–2002 Water and Rivers Commission
(b) Credit Risk Exposure
The Commission does not have any significant exposure to any individual customer or
counter party. Amounts owing by other government agencies are guaranteed and therefore
no credit risk exists in respect to those amounts. In respect of other financial assets the
carrying amounts represent the Commission’s maximum exposure to credit risk in relation
to those assets. All financial assets are unsecured.
The following is an analysis of amounts owing within the categories of government and
private sector:
2002 2001$000 $000
Western Australian Government agencies 184 171
Government agencies of other jurisdictions 195 44
Private sector 72 218
Commonwealth Government – ATO (GST) 230 260
681 693
33 Remuneration of members of the accountable authority and seniorofficers
Remuneration of members of the accountable authority
The number of members of the Accountable Authority, whose total of fees, salaries,
superannuation and other benefits for the financial year, fall within the following bands are:
$ 2002 2001
0 - 10 000 1 2
10 001 - 20 000 4 2
20 001 - 30 000 0 1
30 001 - 40 000 1 0
140 001 - 150 000 0 1
The total remuneration of the members of theAccountable Authority is: 80 214
The superannuation included here represents the superannuation expense incurred by the
Commission in respect of members of the Accountable Authority.
No members of the Accountable Authority are members of the Pension Scheme.

78
Water and Rivers Commission Annual Report 2001–2002
2002 2001$000 $000
Remuneration of Senior Officers
The number of Senior Officers other than senior officers reported as members of the
Accountable Authority, whose total of fees, salaries, superannuation and other benefits for
the financial year, fall within the following bands are:
$ 2002 2001
100 001 - 110 000 4 4
170 001 - 180 000 1 1
The total remuneration of the members of theSenior Officers is: 636 830
The superannuation included here represents the superannuation expense incurred by the
Commission in respect Senior Officers other than Senior Officers reported as members of
the Accountable Authority.
One Senior Officer is a member of the Pension Scheme.
34 Related and affiliated bodies
The Water and Rivers Commission currently does not provide any assistance to other agencies
which would deem them to be regarded as related or affiliated bodies under the definitions
included in Treasurer’s Instruction 951.
35 Supplementary financial information
Write-Offs
Accounts receivable 2 164 1 028
Petty cash shortage 151 155
2 315 1 183
Losses Through Theft, Defaults And Other Clauses
Loss of property through theft/fraud - -
Amount recovered - -
Net loss of property through Theft/fraud - -
Gifts of public property
Gifts of public property provided by the Commission - -
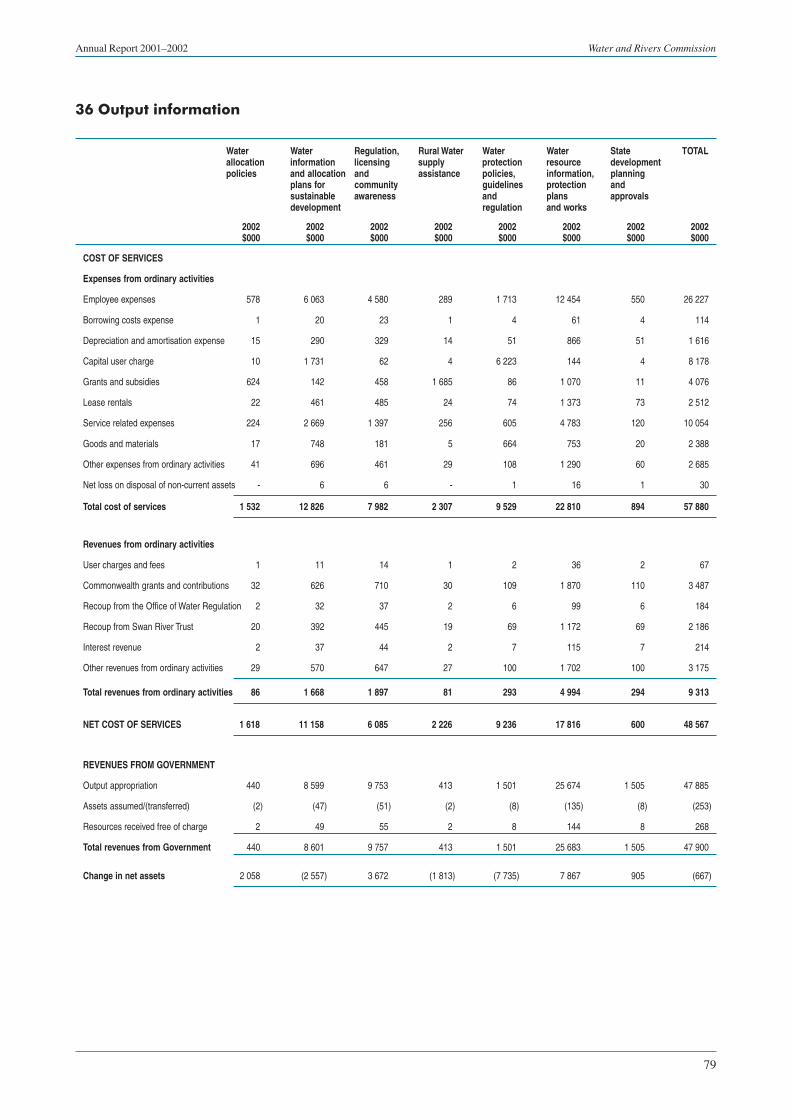
79
Annual Report 2001–2002 Water and Rivers Commission
36 Output information
Water Water Regulation, Rural Water Water Water State TOTALallocation information licensing supply protection resource developmentpolicies and allocation and assistance policies, information, planning
plans for community guidelines protection andsustainable awareness and plans approvalsdevelopment regulation and works
2002 2002 2002 2002 2002 2002 2002 2002$000 $000 $000 $000 $000 $000 $000 $000
COST OF SERVICES
Expenses from ordinary activities
Employee expenses 578 6 063 4 580 289 1 713 12 454 550 26 227
Borrowing costs expense 1 20 23 1 4 61 4 114
Depreciation and amortisation expense 15 290 329 14 51 866 51 1 616
Capital user charge 10 1 731 62 4 6 223 144 4 8 178
Grants and subsidies 624 142 458 1 685 86 1 070 11 4 076
Lease rentals 22 461 485 24 74 1 373 73 2 512
Service related expenses 224 2 669 1 397 256 605 4 783 120 10 054
Goods and materials 17 748 181 5 664 753 20 2 388
Other expenses from ordinary activities 41 696 461 29 108 1 290 60 2 685
Net loss on disposal of non-current assets - 6 6 - 1 16 1 30
Total cost of services 1 532 12 826 7 982 2 307 9 529 22 810 894 57 880
Revenues from ordinary activities
User charges and fees 1 11 14 1 2 36 2 67
Commonwealth grants and contributions 32 626 710 30 109 1 870 110 3 487
Recoup from the Office of Water Regulation 2 32 37 2 6 99 6 184
Recoup from Swan River Trust 20 392 445 19 69 1 172 69 2 186
Interest revenue 2 37 44 2 7 115 7 214
Other revenues from ordinary activities 29 570 647 27 100 1 702 100 3 175
Total revenues from ordinary activities 86 1 668 1 897 81 293 4 994 294 9 313
NET COST OF SERVICES 1 618 11 158 6 085 2 226 9 236 17 816 600 48 567
REVENUES FROM GOVERNMENT
Output appropriation 440 8 599 9 753 413 1 501 25 674 1 505 47 885
Assets assumed/(transferred) (2) (47) (51) (2) (8) (135) (8) (253)
Resources received free of charge 2 49 55 2 8 144 8 268
Total revenues from Government 440 8 601 9 757 413 1 501 25 683 1 505 47 900
Change in net assets 2 058 (2 557) 3 672 (1 813) (7 735) 7 867 905 (667)

80
Water and Rivers Commission Annual Report 2001–2002
Appendix A – Regional Office details
SWAN GOLDFIELDS AGRICULTURAL REGION7 Ellam StreetVICTORIA PARK WA 6100
Telephone (08) 6250 8000Facsimile (08) 6250 8050
Kalgoorlie officeViskovich House377 Hannan StreetKALGOORLIE WA 6430
Telephone (08) 9021 3243Facsimile (08) 9021 3529
Northam office254 Fitzgerald StreetNORTHAM WA 6401(PO Box 497, Northam WA 6401)
Telephone (08) 9622 7055Facsimile (08) 9622 7155
KWINANA PEEL REGION165 Gilmore AvenueKWINANA WA 6167(PO Box 454, Kwinana WA 6167)
Telephone (08) 9419 5500Facsimile (08) 9419 5897
Mandurah officeSuite 8, Sholl House,21 Sholl StreetMANDURAH WA 6210(PO Box 332, Mandurah WA 6210)
Telephone (08) 9535 3411Facsimile (08) 9581 4560
Cockburn Sound Management CouncilShop 1, 15 Railway ParadeROCKINGHAM WA 6168(PO Box 5161, Rockingham Beach WA 6969)
Telephone (08) 9591 3837Facsimile (08) 9528 5387
SOUTH WEST REGION21–35 McCombe RoadBUNBURY WA 6231(PO Box 261, Bunbury WA 6231)
Telephone (08) 9726 4111Facsimile (08) 9726 4100
Manjimup office52 Bath StreetMANJIMUP WA 6258
Telephone (08) 9771 1878Facsimile (08) 9771 8108
MID WEST GASCOYNE REGION25 Forrest StreetGERALDTON WA 6530(PO Box 73, Geraldton WA 6531)
Telephone (08) 9964 5978Facsimile (08) 9964 5983
Carnarvon office82 Olivia TerraceCARNARVON WA 6701
Telephone (08) 9941 4921Facsimile (08) 9941 4931
NORTH WEST REGIONLot 980 Cherratta Road, KIEKARRATHA WA 6714(PO Box 836 Karratha WA 6714)
Telephone (08) 9144 2000Facsimile (08) 9144 2610
Kununurra officeLot 225 Bandicoot DriveKUNUNURRA WA 6743(PO Box 625 Kununurra WA 6743)
Telephone (08) 9168 1082Facsimile (08) 9168 3174
SOUTH COAST REGION5 Bevan StreetALBANY WA 6330(PO Box 525 Albany WA 6331)
Telephone (08) 9842 5760Facsimile (08) 9842 1204
Denmark officeSuite 1, 55 Strickland StreetDENMARK WA 6333
Telephone (08) 9848 1866Facsimile (08) 9848 1733
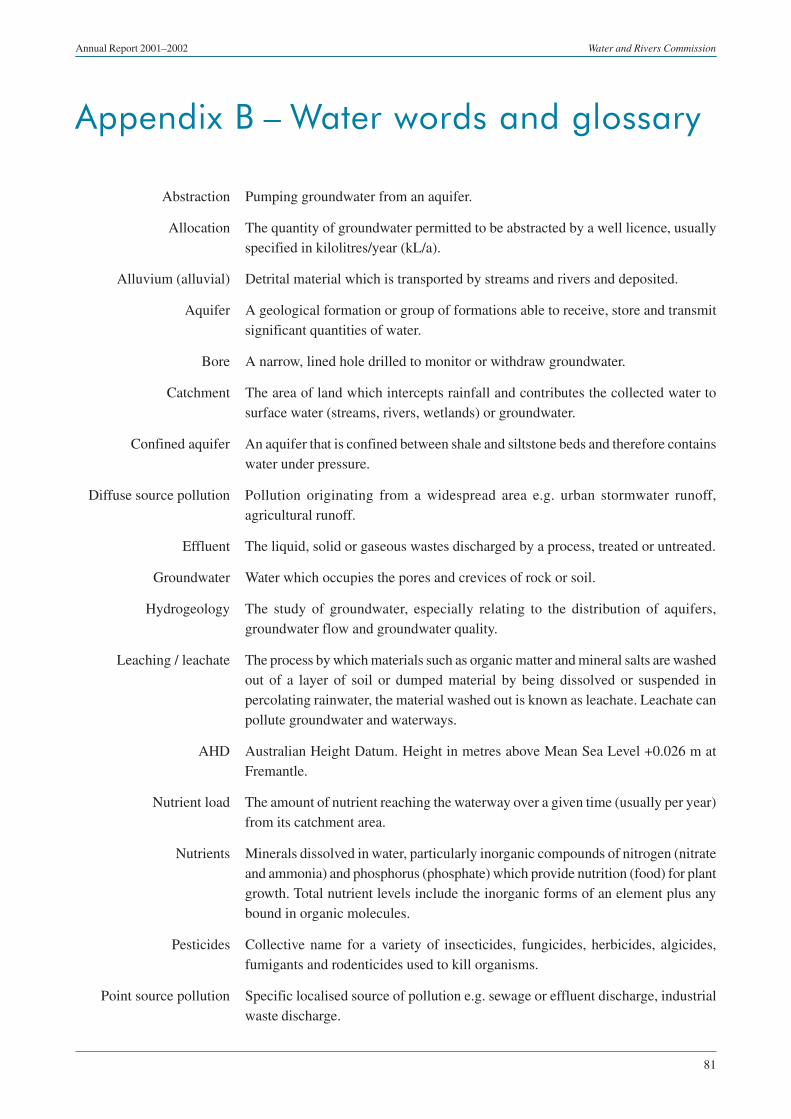
81
Annual Report 2001–2002 Water and Rivers Commission
Appendix B – Water words and glossary
Abstraction Pumping groundwater from an aquifer.
Allocation The quantity of groundwater permitted to be abstracted by a well licence, usuallyspecified in kilolitres/year (kL/a).
Alluvium (alluvial) Detrital material which is transported by streams and rivers and deposited.
Aquifer A geological formation or group of formations able to receive, store and transmitsignificant quantities of water.
Bore A narrow, lined hole drilled to monitor or withdraw groundwater.
Catchment The area of land which intercepts rainfall and contributes the collected water tosurface water (streams, rivers, wetlands) or groundwater.
Confined aquifer An aquifer that is confined between shale and siltstone beds and therefore containswater under pressure.
Diffuse source pollution Pollution originating from a widespread area e.g. urban stormwater runoff,agricultural runoff.
Effluent The liquid, solid or gaseous wastes discharged by a process, treated or untreated.
Groundwater Water which occupies the pores and crevices of rock or soil.
Hydrogeology The study of groundwater, especially relating to the distribution of aquifers,groundwater flow and groundwater quality.
Leaching / leachate The process by which materials such as organic matter and mineral salts are washedout of a layer of soil or dumped material by being dissolved or suspended inpercolating rainwater, the material washed out is known as leachate. Leachate canpollute groundwater and waterways.
AHD Australian Height Datum. Height in metres above Mean Sea Level +0.026 m atFremantle.
Nutrient load The amount of nutrient reaching the waterway over a given time (usually per year)from its catchment area.
Nutrients Minerals dissolved in water, particularly inorganic compounds of nitrogen (nitrateand ammonia) and phosphorus (phosphate) which provide nutrition (food) for plantgrowth. Total nutrient levels include the inorganic forms of an element plus anybound in organic molecules.
Pesticides Collective name for a variety of insecticides, fungicides, herbicides, algicides,fumigants and rodenticides used to kill organisms.
Point source pollution Specific localised source of pollution e.g. sewage or effluent discharge, industrialwaste discharge.

82
Water and Rivers Commission Annual Report 2001–2002
Pollution Water pollution occurs when waste products or other substances e.g. effluent, litter,refuse, sewage or contaminated runoff, change the physical, chemical, biologicalor thermal properties of the water, adversely affecting water quality, living speciesand beneficial uses.
Public Water Source Area (PWSA) As for UWPCA, but allowing the taking of groundwater for publicsupplies.
Recharge Water infiltrating to replenish an aquifer.
Recharge area An area through which water from a groundwater catchment percolates to replenish(recharge) an aquifer. An unconfined aquifer is recharged by rainfall throughoutits distribution. Confined aquifers are recharged in specific areas where water leaksfrom overlying aquifers, or where the aquifer rises to meet the surface.
Riparian Relating to a river.
Runoff Water that flows over the surface from a catchment area, including streams.
Saltwater intrusion The inland intrusion of saltwater into a layer of fresh groundwater.
Scheme supply Water diverted from a source (or sources) by a water authority or private companyand supplied via a distribution network to customers for urban, industrial orirrigation use.
Storage reservoir A major reservoir of water created in a river valley by building a dam.
Stormwater Rainwater which has run off the ground surface, roads, paved areas etc and isusually carried away by drains.
Treatment Application of techniques such as settlement, filtration and chlorination to renderwater suitable for specific purposes including drinking and discharge to theenvironment.
Unconfined aquifer An aquifer containing water, the upper surface of which is lower than the top ofthe aquifer. The upper surface of the groundwater within the aquifer is called thewatertable.
Underground Water (UWPCA) An area defined under the Metropolitan Water Supply Sewerage and
Pollution Control Area Drainage Act, in which restrictions are put on activities that may pollute thegroundwater.
Wastewater Water that has been used for some purpose and would normally be treated anddiscarded. Wastewater usually contains significant quantities of pollutant.
Water quality The physical, chemical and biological measures of water.
Watertable The upper saturated level of the unconfined groundwater.
Wellfield A group of bores to monitor or withdraw groundwater.

83
Annual Report 2001–2002 Water and Rivers Commission
Abbreviations
AGWEST Agriculture Western Australia
CALM Department of Conservation and Land Management
COAG Council of Australian Governments
EPA Environmental Protection Authority
ICM Integrated Catchment Management
LCDC Land Conservation District Committee
NHT Natural Heritage Trust
OWR Office of Water Regulation
WA Western Australia
WRC Water and Rivers Commission
HEAT HAZMAT Emergency Advisory Team
DCT Department of Commerce and Trade
UWA University of Western Australia
GL/yr Gigalitres per year
DEP Department of Environmental Protection
FTE Full-time equivalent
HRIS Human Resources Information Management System
IT Information Technology
NRM Natural Resource Management
BMRC Bureau of Meteorology Research Centre

84
Water and Rivers Commission Annual Report 2001–2002
Appendix C – Media releases
JUNE
27 June 2002 Mandurah school bores monitored by students
MAY
30 May 2002 Victoria Plains Rivercare Workshop
29 May 2002 Exmouth public drinking water source area legally protected
28 May 2002 Cleaner Production Training Package launch
24 May 2002 Discovery a first for Western Australia
21 May 2002 Call for comment on Samson Brook water source protection plan
20 May 2002 Proposed Gingin/Dandaragan Water Resource Management Committee
17 May 2002 Waste water discharge prompts investigation
15 May 2002 First Saltwatch campaign gets underway in WA
9 May 2002 Student focus on ecotourism for annual water competition
8 May 2002 City Consultants go wetland weeding and planting
1 May 2002 Dead fish in Collie River linked to Brunswick River fish kill
1 May 2002 Watheroo public drinking water source area legally protected
1 May 2002 Albany public drinking water source area legally protected
APRIL
30 April 2002 Fish deaths in Brunswick River follow rains
24 April 2002 New policies help bring balance to Ord River waterways
18 April 2002 Watershed Torbay project awash with community support
15 April 2002 Nuisance marine algae found along Kwinana and Mandurah beaches
11 April 2002 Biodiversity exhibit opened at Garden Week 2002 – Minister
10 April 2002 Commission recommends actions on Stirling acid water investigations
9 April 2002 Watershed Tobay - first in Australia to be launched
8 April 2002 Free community water quality data workshop
MARCH
28 March 2002 South West land division drought management still needed
14 March 2002 Potentially toxic algal bloom stops water-based recreation at Kent StreetWeir

85
Annual Report 2001–2002 Water and Rivers Commission
3 March 2002 City bankers go wetland weeding
1 March 2002 Another river foreshore rehabilitation project completed at South Perth –Minister
1 March 2002 Clean Up Australia Day gets down the drain
FEBRUARY
27 February 2002 Noneycup Creek facelift continues with action plan stage two
27 February 2002 South Coast Ribbons of Blue gets new coordinator
27 February 2002 Fitzroy River flood warnings provided by river watchdog system
25 February 2002 Have you say on recovering the Avon River between Northam andToodyay
25 February 2002 Leading by example to help Clean Up Australia
25 February 2002 Mortlock River’s north branch to be surveyed 23 February 2002Swan River Trust review to enhance structures – Minister
22 February 2002 Draft plan comment nets prize for local resident
20 February 2002 LIMA calls for navigation issues to be resolved
20 February 2002 Turf’s Up workshop teaches best management practices
14 February 2002 Esperance wetlands focus of one-day tour
14 February 2002 Water licensing reviewed by Carnarvon Water Allocation AdvisoryCommittee
13 February 2002 Mount Barker ‘Town Dam’ wetland nears completion
13 February 2002 Land clearing prosecution sets new precedent
7 February 2002 Albany’s Lake Seppings venue for World Wetlands Day event
4 February 2002 Action in the Warradarge catchment
4 February 2002 Nominations to the Cape to Cape Water Resource ManagementCommittee called
JANUARY
31 January 2002 Tides turn on Bullcreek Jetty future
29 January 2002 State Government funding pumped into on-farm water supplies –Minister
25 January 2002 Peel waterways plan out for public comment
25 January 2002 Algae scum and fish deaths on the Murray River
25 January 2002 Stirling water protection by-laws come under review
22 January 2002 Algae bloom stops recreation on Albany’s Lake Powell

86
Water and Rivers Commission Annual Report 2001–2002
15 January 2002 Quinninup Dam Water Resource Protection Plan open for publiccomment
11 January 2002 Aboriginal group secures water reserve lease
3 January 2002 Foreshore restoration program underway – Minister
DECEMBER
31 December 2001 Community to have long-term role in managing Wilson Inlet
21 December 2001 Restrictions on household garden bores begin today – Minister
19 December 2001 Trust buoys up boating on the river
19 December 2001 Scum causing algae found in Murray River
18 December 2001 More algal blooms predicted for South West rivers
18 December 2001 Wellstead Estuary fish deaths follow rains
17 December 2001 River floods swamp estuary killing cockles
12 December 2001 Office workers get dirty on river restoration
11 December 2001 Water shortage declared for South West of the State
7 December 2001 Sewage spill no threat to future river health
6 December 2001 Potentially toxic algal bloom in the Serpentine
5 December 2001 Guidelines for Water Trading officially established – Minister
4 December 2001 Erosion and weeds workshop on Collie River at Roelands
1 December 2001 Environmental volunteers honoured
NOVEMBER
30 November 2001 Kwinana-Peel Region steps out as new identity
28 November 2001 Algal bloom warning to green thumb gardeners
28 November 2001 Point Douro development in focus at workshop
27 November 2001 Community called to help on water use plans
26 November 2001 Lake Byleveld blooms nipped in the bud by local group
22 November 2001 Collie River salinity report offers potential solutions – Minister
22 November 2001 Swan Catchment Centre relocates
21 November 2001 Protecting the future of fishing
16 November 2001 Environmental guidelines for horses out for comment
16 November 2001 Homeowners urged to dig deep to ease water shortages
15 November 2001 Talbot Brook draft report showing good signs

87
Annual Report 2001–2002 Water and Rivers Commission
12 November 2001 Thieves clip the wings of feral duck program
8 November 2001 New trial area for Canning Phoslock treatment
8 November 2001 New Ribbons of Blue coordinator for Avon region
8 November 2001 Algal blooms in Melville-Shelley waters
7 November 2001 Brunswick Junction eco-tourism opportunity
6 November 2001 Algae bloom from Maylands to Success Hill
6 November 2001 Dawn blessing for Canning River Festival
1 November 2001 Carnarvon growers face licence suspension
1 November 2001 First AquaFest a flood of information and fun
1 November 2001 Local schools well designed to win competition
OCTOBER
31 October 2001 Taskforce calls for united front to battle drought
30 October 2001 Spring rains no relief for South West landholders
29 October 2001 Spencers Brook draft report showing good signs
19 October 2001 National winners of environment video competition announced –Minister
19 October 2001 Tree poisoning attempt nipped in the bud
16 October 2001 AquaFest highlights Swan Region waterway projects
11 October 2001 Phoslock trials begin in Vasse River – Minister
2 October 2001 Cue town water supply protected by new plan
SEPTEMBER
28 September 2001 Information flows at Leschenault Inlet symposium
26 September 2001 Protecting Bunbury town water supply
18 September 2001 Red Tide algae in the Canning River
18 September 2001 Algal blooms in the Swan River
17 September 2001 Show-time fun is ‘down the drain’ this year
12 September 2001 Geographe group wins top rivercare award
12 September 2001 Bannister Creek group recognised as WA’s top RATs
10 September 2001 Vasse River cleanup trials start again
10 September 2001 Moora water reserve gazetted
5 September 2001 Conservation training program reaps award
4 September 2001 Members needed for new Wilson Inlet Management Group

88
Water and Rivers Commission Annual Report 2001–2002
AUGUST
31 August 2001 Snapshot 2001
28 August 2001 Leschenault Inlet symposium
24 August 2001 Protecting Broome town water supply
18 August 2001 Progress being made to keep our Swan and Canning Rivers healthy:Minister
16 August 2001 From the roads to the rivers
13 August 2001 GeoCatch reports to the community
10 August 2001 $1000 Ribbons of Blue schools competition
10 August 2001 Life in water search
8 August 2001 Forum on water and salt in the Moore catchment
7 August 2001 Special kids help harbour
JULY
30 July 2001 Launch of new workboat
30 July 2001 SCCP City to Surf team
30 July 2001 Princess Royal Harbour nutrient audit
27 July 2001 Public information sessions on new water legislation
26 July 2001 Students to learn about protecting water resources through innovativeboard game
25 July 2001 Planning wiser groundwater use in the Mid-West
24 July 2001 Community forum for Swan and Canning rivers
23 July 2001 Wooroloo rivercare workshop
20 July 2001 GeoCatch reports to the community
20 July 2001 Protecting Mingenew town water supply
17 July 2001 Harvey River restoration course
13 July 2001 Rural outing benefits rivers
11 July 2001 Potentially toxic microcystis algae detected near Maylands
6 July 2001 Toodyay Brook report complete
6 July 2001 Management guidelines for Collie River islands
6 July 2001 Blue-green algal bloom in Lake Indoon
4 July 2001 Public input needed on management of Waroona Dam
3 July 2001 Rural outing benefits rivers
3 July 2001 Encouraging signs shown in Cockburn Sound study
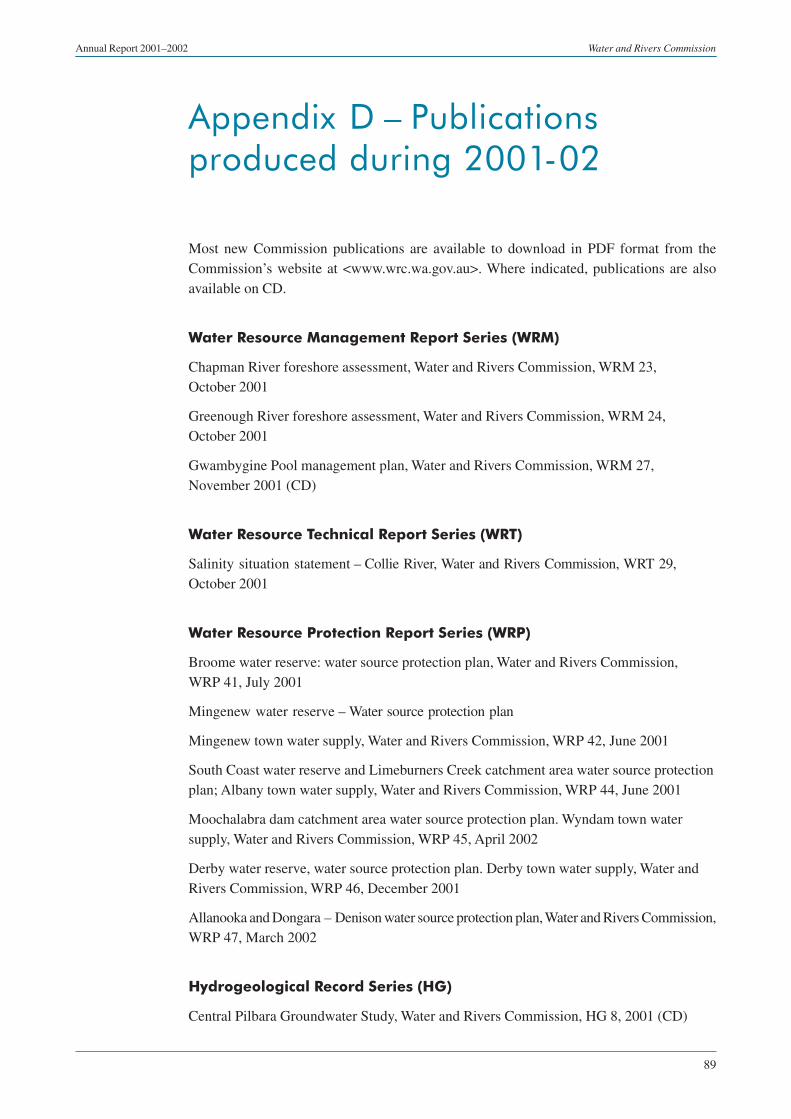
89
Annual Report 2001–2002 Water and Rivers Commission
Appendix D – Publicationsproduced during 2001-02
Most new Commission publications are available to download in PDF format from theCommission’s website at <www.wrc.wa.gov.au>. Where indicated, publications are alsoavailable on CD.
Water Resource Management Report Series (WRM)
Chapman River foreshore assessment, Water and Rivers Commission, WRM 23,October 2001
Greenough River foreshore assessment, Water and Rivers Commission, WRM 24,October 2001
Gwambygine Pool management plan, Water and Rivers Commission, WRM 27,November 2001 (CD)
Water Resource Technical Report Series (WRT)
Salinity situation statement – Collie River, Water and Rivers Commission, WRT 29,October 2001
Water Resource Protection Report Series (WRP)
Broome water reserve: water source protection plan, Water and Rivers Commission,WRP 41, July 2001
Mingenew water reserve – Water source protection plan
Mingenew town water supply, Water and Rivers Commission, WRP 42, June 2001
South Coast water reserve and Limeburners Creek catchment area water source protectionplan; Albany town water supply, Water and Rivers Commission, WRP 44, June 2001
Moochalabra dam catchment area water source protection plan. Wyndam town watersupply, Water and Rivers Commission, WRP 45, April 2002
Derby water reserve, water source protection plan. Derby town water supply, Water andRivers Commission, WRP 46, December 2001
Allanooka and Dongara – Denison water source protection plan, Water and Rivers Commission,WRP 47, March 2002
Hydrogeological Record Series (HG)
Central Pilbara Groundwater Study, Water and Rivers Commission, HG 8, 2001 (CD)

90
Water and Rivers Commission Annual Report 2001–2002
River Recovery Plan Series (RRP)
Avon River recovery plan. A plan for the recovery and future management of the AvonRiver, from Beverly to Edwards Crossing. Section 13, Water and Rivers Commission,RRP 4, January 2002 (CD)
Avon River recovery plan. A plan for the recovery and future management of the AvonRiver, from Beverly to Edwards Crossing. Sections 14, 15 and 16, Water and RiversCommission, RRP 5, January 2002 (CD)
Water Licensing
Application for a 5C licence to take surface water / Application for a 11/17/21A permit tointerfere with bed and banks (Form C), Water and Rivers Commission, October 2001
Application to amend a 5C licence to take groundwater / Application to renew a 5Clicence to take groundwater (Form B), Water and Rivers Commission, October 2001
Application for a 5C licence to take groundwater / Application for a 26D licence toconstruct or alter wells (Form A), Water and Rivers Commission, October 2001
Application to amend / renew surface water licence (Form D), Water and Rivers Commission,October 2001
Application for an agreement to take water (Form E), Water and Rivers Commission,October 2001
Application for transfer of water entitlement (Form F), Water and Rivers Commission,October 2001
Application for transfer of licence (Form G), Water and Rivers Commission, October 2001
Application for permit (Form H), Water and Rivers Commission, October 2001
Notice that licence holder not eligible to hold licence (Form I), Water and Rivers Commission,October 2001
Advert for a licence and/or permit (Form J), Water and Rivers Commission, October 2001
Statutory declaration (Form K), Water and Rivers Commission, October 2001
Application for notation/removal/variation of security interest (Form L), Water and RiversCommission, October 2001
Guidelines Series
Environmental Management Guidelines for Vineyards. Guidelines No.12, June 2002
Other Reports, Booklets and Catalogues
Managing the water resources of the Jurien Groundwater Area, Western Australia Interimsub-regional allocation strategy, Water and Rivers Commission, January 2002
Understanding groundwater, Water and Rivers Commission, February 2002

91
Annual Report 2001–2002 Water and Rivers Commission
Understanding water quality in the (5 target catchments) Esperance Lakes, Oldfield-Munglinup River, Gairdner River, Pallinup River, Gordon River, Water and RiversCommission, July 2001 (Separate booklet for each catchment)
Water and Rivers Commission Annual Report 2000 - 2001, Water and Rivers Commission,December 2001. (CD)
Managing the water resources of the Arrowsmith Groundwater Area, Western Australia Interimsub-regional allocation strategy, Water and Rivers Commission, January 2002
Reports to the Community
Wilson Inlet report to the community No.6, Water and Rivers Commission, June 2002
Water Notes (series also available on CD with Water facts)
Determining foreshore reserves, Water and Rivers Commission, WN 23, November 2001
The effects and management of deciduous trees on wetlands, Water and Rivers Commission,WN 25, January 2002
Simple Fishways, Water and Rivers Commission, WN 26, January 2002
Demonstration sites of waterways restoration in WA, Water and Rivers Commission, WN 27,February 2002
Monitoring and evaluating river restoration works, Water and Rivers Commission, WN 28,February 2002
Long term management of riparian vegetation, Water and Rivers Commission, WN 29,February 2002
Pamphlets, Brochures and Posters
“Bringing back the swans” flyer for school children, Water and Rivers Commission, 2001
DEWCAP corporate brochure, Water and Rivers, 2002
Artificial recharge on the Gascoyne River, Water and Rivers Commission, October 2001
Internet Publication
Statewide assessment of river water quality (report), Water and Rivers Commission,March 2002

93
Annual Report 2001–2002 Water and Rivers Commission
Publication feedback form
The Water and Rivers Commission welcomes feedback to help us to improve the quality
and effectiveness of our publications. Your assistance in completing this form would be
greatly appreciated.
Please consider each question carefully and rate them on a 1 to 5 scale, where 1 is poor
and 5 is excellent (please circle the appropriate number).
Publication title: WATER AND RIVERS COMMISSION ANNUAL REPORT 2001–2002
How did you rate the quality of information? 1 2 3 4 5
How did you rate the design and presentation of this publication? 1 2 3 4 5
How can it be improved?
...............................................................................................................................................................................................
...............................................................................................................................................................................................
...............................................................................................................................................................................................
...............................................................................................................................................................................................
How effective did you find the tables and figures
in communicating the data? 1 2 3 4 5
How can they be improved?
...............................................................................................................................................................................................
...............................................................................................................................................................................................
...............................................................................................................................................................................................
...............................................................................................................................................................................................
How did you rate this publication overall? 1 2 3 4 5
If you would like to see this publication in other formats, please specify. (E.g. CD)
...............................................................................................................................................................................................
Please cut along the dotted line on the left and return your completed response to:
Publications CoordinatorWater and Rivers Commission
Level 2, Hyatt Centre3 Plain Street
East Perth WA 6004
Facsimile: (08) 9278 0639
✁
Top Related