


Languages
Pages
Legal

© Copyright IBM Corporation 2009. All rights reserved.
WebSphere Application Server
Performance Tuning Case Study
July 2009
Chris Blythe,
David W. Hare
© Copyright IBM Corporation 2009. All rights reserved.
Tuning an Application Server for Performance
IBM® WebSphere® Application Server is a robust, enterprise class application server that
provides a core set of components, resources, and services for developers to utilize in their
applications. Every application has a unique set of requirements and often uses the application
server’s resources in vastly different ways. In order to provide a high degree of flexibility and
support this wide range of applications, WebSphere Application Server offers an extensive list of
tuning knobs and parameters that can be used to enhance the performance of an application.
Default values for the most commonly used tuning parameters in the server are set to ensure
adequate performance out of the box for the broadest range of applications. However, no two
applications are alike and use the server in exactly the same fashion. Consequently, there are no
guarantees that a single set of tuning parameters will be perfectly suited for every application.
This highlights the importance of conducting focused performance testing and tuning against
your application.
This white paper discusses several of the most commonly used parameters in WebSphere
Application Server and the methodologies used to tune them. However, unlike most documented
tuning recommendations, this white paper uses the Apache DayTrader Performance Benchmark
Sample Application to serve as a case study and provide context to the discussion. With the
DayTrader application, we can clearly identify the key server components in use, perform
focused tuning in these areas, and discuss the benefit associated with each tuning change.
Before proceeding, here are a few additional things to keep in mind when tuning the application
server for performance.
Increased performance often involves sacrificing a certain level of feature or function in
the application or the application server. The tradeoff between performance and feature
must be weighed carefully when evaluating performance tuning changes.
Several factors beyond the application server often impact performance including
hardware and OS configuration, other processes executing on the system, performance of
backend database resources, network latency, etc. These items should be taken into
consideration when conducting your own performance evaluations.
The performance improvements detailed within this paper are specific to the DayTrader
application, workload mix, and supporting hardware/software stack. Any performance
gains in your application associated with the tuning changes detailed in this paper will
certainly vary and should be evaluated with your own performance tests.
DayTrader
The Apache DayTrader Performance Benchmark Sample Application simulates a simple stock
trading application that allows users to login/logout, view their portfolio, lookup stock quotes,
buy and sell stock share, and manage account information. Originally based on the Trade
Performance Benchmark Sample Application for WebSphere Application Server, the application

© Copyright IBM Corporation 2009. All rights reserved.
was donated to the Apache Geronimo open source community in conjunction with IBM’s
delivery of WebSphere Application Server Community Edition in 2006.
DayTrader not only serves as an excellent application for functional testing, but also provides a
standard set of workloads for characterizing and measuring application server and component
level performance. Neither Trade, nor DayTrader were written to provide optimal performance.
Instead, these applications were meant to conduct relative performance comparisons between
application server releases and alternative implementation styles/patterns.
DayTrader is built on a core set of JavaTM
Enterprise Edition (Java EE) technologies that include
Java Servlets and JavaServer Pages (JSPs) for the presentation layer and Java database
connectivity (JDBC), Java Message Service (JMS), Enterprise JavaBeans (EJBs) and Message-
Driven Beans (MDBs) for the back-end business logic and persistence layer. The following
diagram provides a high-level overview of the application architecture.
In order to evaluate a few common Java EE persistence and transaction management patterns,
DayTrader provides three different implementations of the business services. These
implementations (or runtime modes) are detailed below.

© Copyright IBM Corporation 2009. All rights reserved.
Runtime
Mode Pattern Description
Direct Servlet-to-JDBC
Create, read, update, and delete (CRUD) operations are
performed directly against the database using custom JDBC code.
Database connections, commits, and rollbacks are managed
manually in the code.
Session
Direct
Servlet-to-Stateless
SessionBean-to-JDBC
CRUD operations are performed directly against the database
using custom JDBC code and database connections are managed
manually in the code. Database commits and rollbacks are
managed automatically by the Stateless Session Bean.
EJB
Servlet-to-
StatelessSessionBean-to-
EntityBean
The EJB Container assumes responsibility for all queries,
transactions, and database connections.
These runtime modes are included within the scope of this paper to demonstrate the impact each
tuning change has on these three common Java EE persistence and transaction implementation
styles.
Navigating the WebSphere Application Server Tunables
As previously mentioned, the importance of understanding the application architecture and the
server components and resources utilized by the application cannot be stressed enough when
conducting performance tuning. With this knowledge, you can quickly filter the list of tunable
parameters and focus on a core set of tunables that directly impact your application.
Performance tuning generally starts with the Java Virtual Machine (JVM) which serves as the
foundation for the application server. From that point forward, tuning is primarily driven by the
application server components that are used by the application. Using the DayTrader architecture
diagram above as an example, you can identify some of the key tunable server components
associated with the application: the Web and EJB Containers, associated thread pools, database
connection pools, and the default messaging provider. The remainder of this article discusses
several tuning options that impact the performance of DayTrader in detail based on the
components listed above. These options have been broken up into the following sections:
Basic Tuning – This group of tuning parameters covers a few of the most commonly
tuned and heavily used application server components starting with the JVM. These
settings traditionally provide the most bang for the buck.
Advanced Tuning – This secondary group of advanced tuning parameters are generally
specific to a certain scenario and are often used to squeak the absolute most performance
out of a system.
Asynchronous Messaging Tuning – The tuning/configuration options discussed within
this section are specific to applications which utilize WebSphere Application Server’s
messaging components for asynchronous messaging.
© Copyright IBM Corporation 2009. All rights reserved.
For each tuning parameter grouped in the sections above, we provide a detailed discussion of
applicability, functional tradeoffs, and ultimately the impact to performance (for each of the
persistence and transaction management patterns if appropriate). Any tools that may aid in the
tuning process for a given parameter are also presented. Finally, links to any associated
Information Center documentation or other related resources are also provided.
Basic Tuning Parameters
JVM Heap Size
The JVM heap size parameters directly influence garbage collection behavior. Increasing the
JVM heap size allows more objects to be created before an allocation failure occurs and triggers
a garbage collection. This naturally allows the application to run for a longer period of time
between garbage collection (GC) cycles. Unfortunately, an associated downside to increased
heap size is a corresponding increase in amount of time needed to find and process objects that
should be garbage collected. Consequently, JVM heap size tuning often involves a balance
between the interval between garbage collections and the pause time needed to perform the
garbage collection. In order to tune the JVM Heap size, verbose GC needs to be enabled. This
can be done in the Administrative Console at Servers > Application servers > server_name >
Process definition > Java Virtual Machine. By enabling verbose GC the JVM prints out useful
information at each garbage collection, such as: the amount of free and used bytes in the heap,
the interval between garbage collections, and the pause time. This information is logged to the
native_stderr.log file which can then be used by various tools to visualize the heap usage.
WebSphere Application Server's default heap settings are 50 MB for the Initial Heap size and
256 MB for the Maximum Heap size. We generally recommend setting the Minimum and
Maximum Heap sizes to the same value to prevent the JVM from dynamically resizing the heap.
This not only makes GC analysis easier by fixing a key variable to a constant value, but also
avoids the costly overhead associated with allocating and de-allocating more memory. The trade
off for setting the Min and Max Heap sizes to the same value is that the initial startup of the JVM
will be slower since the JVM must allocate the larger heap. There are scenarios where setting the
Min and Max heap settings to different values is advantageous. One such scenario is when
multiple application server instances running different workloads are hosted on the same server.
In this scenario, the JVM can dynamically respond to changing workload requirements and more
effectively utilize system memory.
Four tests were conducted with verbose GC enabled, with the Initial and Maximum Heap sizes
both set to 256 MB, 512 MB, 1024 MB, and 2048 MB respectively. Verbose GC can be
analyzed by hand but graphical tools make the process considerably easier. The "IBM
Monitoring and Diagnostic Tools for Java™ - Garbage Collection and Memory Visualizer"
tool was used to view the verbose GC data to make adjustments and find the appropriate heap
size for the DayTrader application. This tool is packaged as part of the IBM Support Assistant
which is freely available for download on the IBM WebSphere Application Server Support site.
© Copyright IBM Corporation 2009. All rights reserved.
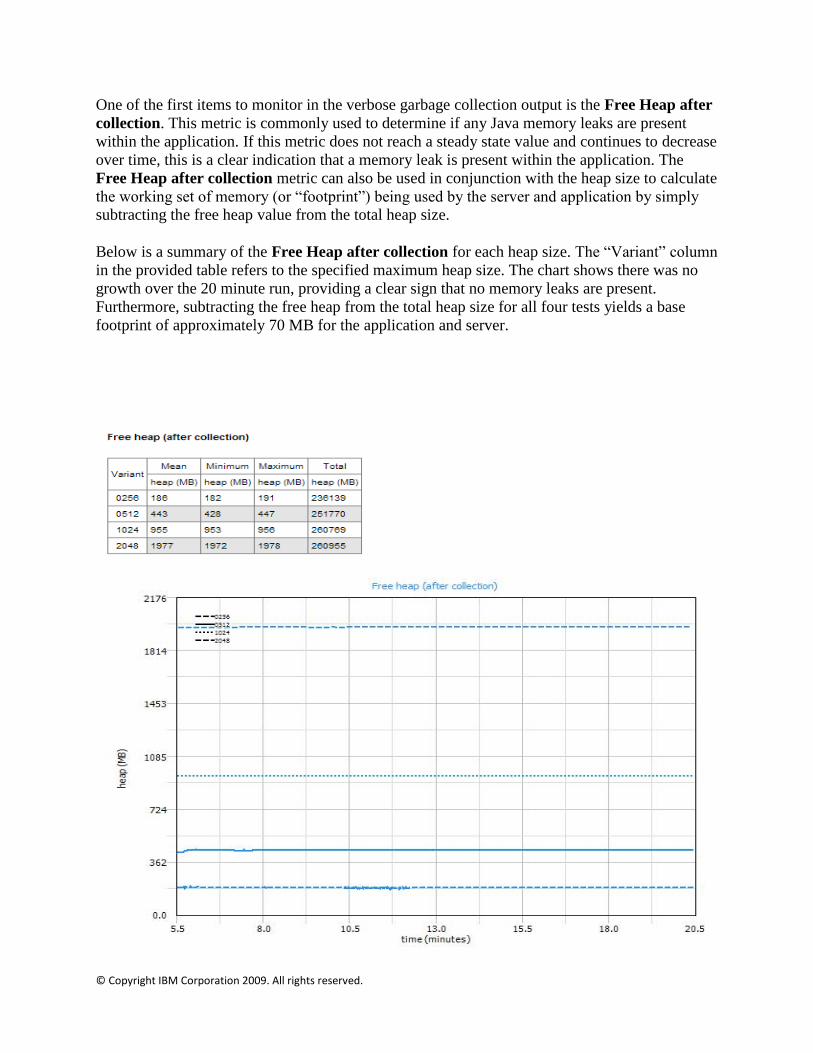
One of the first items to monitor in the verbose garbage collection output is the Free Heap after
collection. This metric is commonly used to determine if any Java memory leaks are present
within the application. If this metric does not reach a steady state value and continues to decrease
over time, this is a clear indication that a memory leak is present within the application. The
Free Heap after collection metric can also be used in conjunction with the heap size to calculate
the working set of memory (or “footprint”) being used by the server and application by simply
subtracting the free heap value from the total heap size.
Below is a summary of the Free Heap after collection for each heap size. The “Variant” column
in the provided table refers to the specified maximum heap size. The chart shows there was no
growth over the 20 minute run, providing a clear sign that no memory leaks are present.
Furthermore, subtracting the free heap from the total heap size for all four tests yields a base
footprint of approximately 70 MB for the application and server.
© Copyright IBM Corporation 2009. All rights reserved.
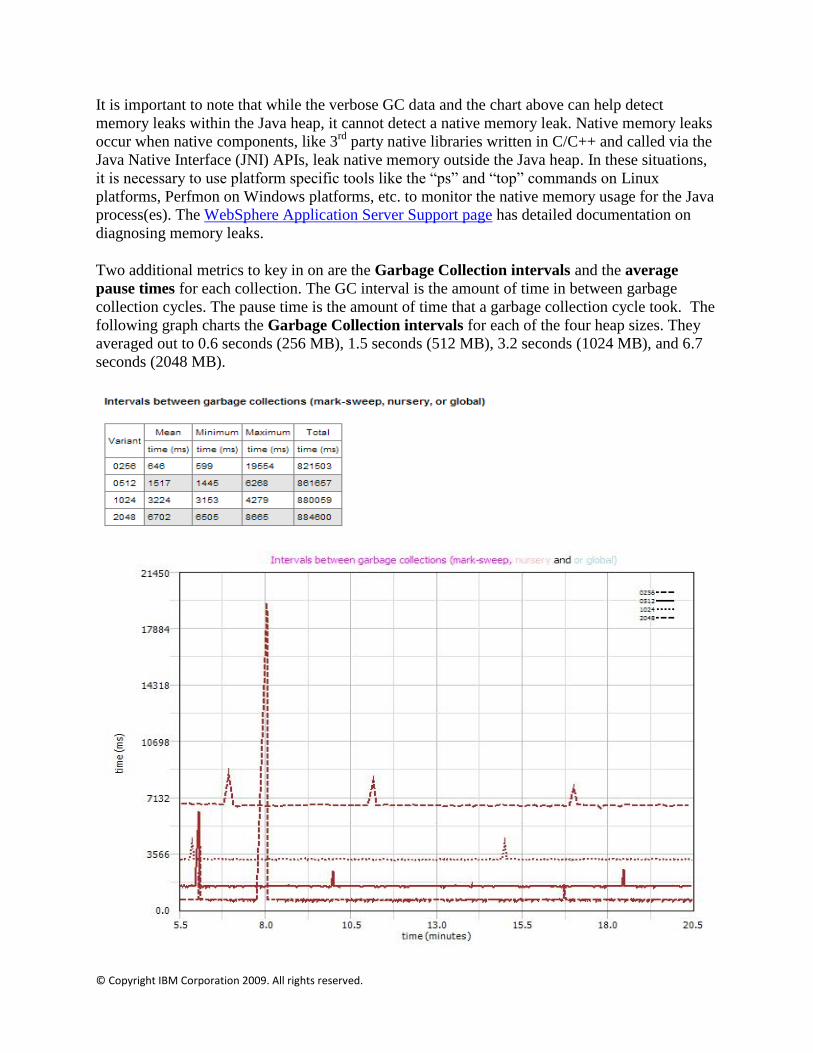
It is important to note that while the verbose GC data and the chart above can help detect
memory leaks within the Java heap, it cannot detect a native memory leak. Native memory leaks
occur when native components, like 3rd
party native libraries written in C/C++ and called via the
Java Native Interface (JNI) APIs, leak native memory outside the Java heap. In these situations,
it is necessary to use platform specific tools like the “ps” and “top” commands on Linux
platforms, Perfmon on Windows platforms, etc. to monitor the native memory usage for the Java
process(es). The WebSphere Application Server Support page has detailed documentation on
diagnosing memory leaks.
Two additional metrics to key in on are the Garbage Collection intervals and the average
pause times for each collection. The GC interval is the amount of time in between garbage
collection cycles. The pause time is the amount of time that a garbage collection cycle took. The
following graph charts the Garbage Collection intervals for each of the four heap sizes. They
averaged out to 0.6 seconds (256 MB), 1.5 seconds (512 MB), 3.2 seconds (1024 MB), and 6.7
seconds (2048 MB).
© Copyright IBM Corporation 2009. All rights reserved.
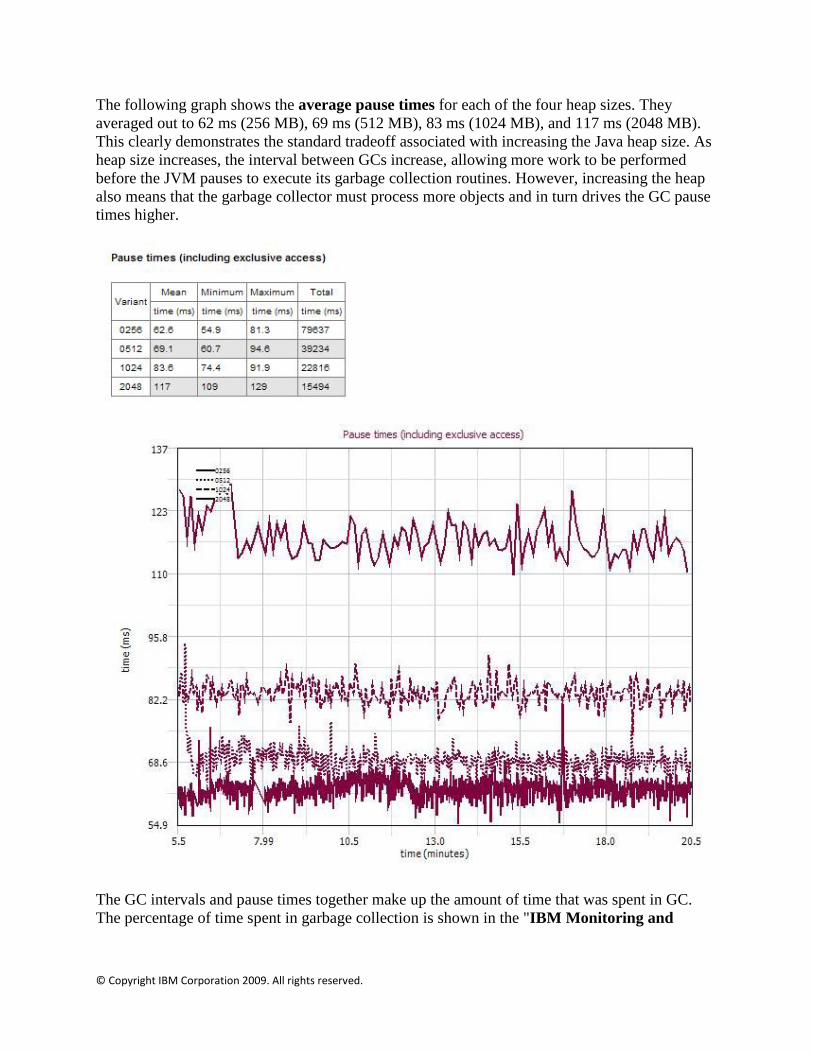
The following graph shows the average pause times for each of the four heap sizes. They
averaged out to 62 ms (256 MB), 69 ms (512 MB), 83 ms (1024 MB), and 117 ms (2048 MB).
This clearly demonstrates the standard tradeoff associated with increasing the Java heap size. As
heap size increases, the interval between GCs increase, allowing more work to be performed
before the JVM pauses to execute its garbage collection routines. However, increasing the heap
also means that the garbage collector must process more objects and in turn drives the GC pause
times higher.
The GC intervals and pause times together make up the amount of time that was spent in GC.
The percentage of time spent in garbage collection is shown in the "IBM Monitoring and

© Copyright IBM Corporation 2009. All rights reserved.
Diagnostic Tools for Java™ - Garbage Collection and Memory Visualizer" tool and can be
calculated as follows:
The amount of time spent in GC and the resulting throughput (requests / second) for each of
these runs is displayed below.
Therefore, a recommended setting for Initial and Maximum Heap size for the DayTrader
application would be 1024 MB. At this point, we reach a point of diminishing marginal returns
where increasing the heap size further does not yield a proportional performance benefit. This
provides a good balance of higher Garbage Collection intervals and lower pause times which
results in small amount of time spent in GC.
Another important aspect of JVM tuning is the garbage collection policy. The three main GC
policies are:
optthruput (default) - Performs the mark and sweep operations during the GC when the
application is paused to maximize application throughput.
optavgpause - Performs the mark and sweep concurrently while the application is
running to minimize pause times, which provides the best application response times.
gencon - Treats short-lived and long-lived objects differently to provide a combination of
lower pause times and high application throughput.
0%
1%
2%
3%
4%
5%
6%
7%
8%
9%
10%
98%
100%
102%
104%
106%
108%
110%
112%
0 500 1000 1500 2000 2500%
tim
e in
GC
Re
lati
ve T
hro
ugh
pu
t
Heap size (MB)
throughput
% time in GC
© Copyright IBM Corporation 2009. All rights reserved.
The DayTrader application does not utilize a lot of long-lived objects and typically runs best
with the default GC policy, optthruput. Each application is different, and it is recommended that
each GC policy is evaluated to find the best fit for your application. The developerWorks article
Garbage collection policies is a great resource for learning more about the GC policies.
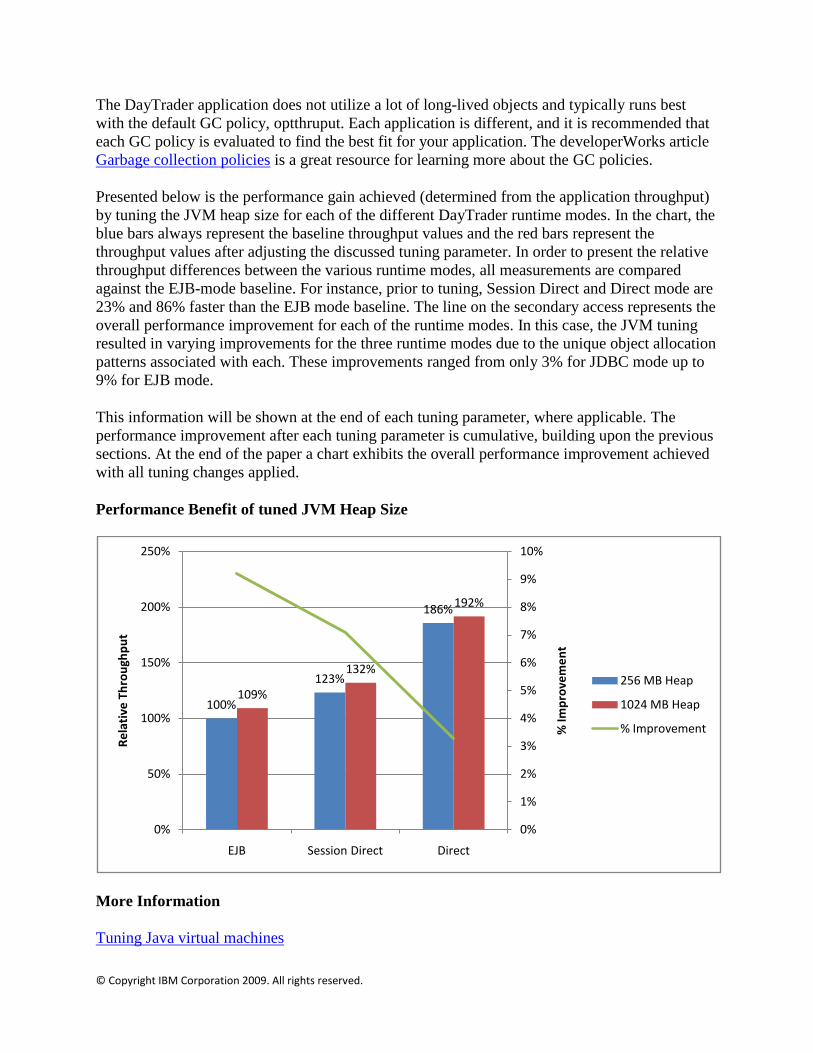
Presented below is the performance gain achieved (determined from the application throughput)
by tuning the JVM heap size for each of the different DayTrader runtime modes. In the chart, the
blue bars always represent the baseline throughput values and the red bars represent the
throughput values after adjusting the discussed tuning parameter. In order to present the relative
throughput differences between the various runtime modes, all measurements are compared
against the EJB-mode baseline. For instance, prior to tuning, Session Direct and Direct mode are
23% and 86% faster than the EJB mode baseline. The line on the secondary access represents the
overall performance improvement for each of the runtime modes. In this case, the JVM tuning
resulted in varying improvements for the three runtime modes due to the unique object allocation
patterns associated with each. These improvements ranged from only 3% for JDBC mode up to
9% for EJB mode.
This information will be shown at the end of each tuning parameter, where applicable. The
performance improvement after each tuning parameter is cumulative, building upon the previous
sections. At the end of the paper a chart exhibits the overall performance improvement achieved
with all tuning changes applied.
Performance Benefit of tuned JVM Heap Size
More Information
Tuning Java virtual machines
100%
123%
186%
109%
132%
192%
0%
1%
2%
3%
4%
5%
6%
7%
8%
9%
10%
0%
50%
100%
150%
200%
250%
EJB Session Direct Direct
% Im
pro
vem
en
t
Re
lati
ve T
hro
ugh
pu
t
256 MB Heap
1024 MB Heap
% Improvement

© Copyright IBM Corporation 2009. All rights reserved.
Garbage collection policies (developerWorks)
IBM Monitoring and Diagnostic Tools for Java™ - Garbage Collection and Memory Visualizer
Thread pool & Connection Pool Sizes
Thread Pool Tuning
Each task performed by the server runs on a thread obtained from one of WebSphere Application
Server’s many thread pools. A thread pool enables components of the server to reuse threads,
eliminating the need to create new threads at run time to service each new request. Three of the
most commonly used (and tuned) thread pools within the application server are detailed below.
Web Container Thread Pool - Used when requests come in over HTTP. From the
DayTrader architecture above, you can see that most traffic comes into DayTrader
through the Web Container Thread Pool.
Default Thread Pool - Used when requests come in for a message driven bean or if a
particular transport chain has not been defined to a specific thread pool.
ORB Thread Pool - Used when remote requests come in over RMI/IIOP for an
enterprise bean from an EJB application client, remote EJB interface or another
application server.
The important tunable options associated with thread pools are:
Setting Description
Minimum Size The minimum number of threads to allow in the pool. When an application server starts, no threads are initially assigned to the thread pool. Threads are added to the thread pool as the workload assigned to the application server requires them, until the number of threads in the pool equals the number specified in the Minimum size field. After this point in time, additional threads are added and removed as the workload changes. However the number of threads in the pool never decreases below the number specified in the Minimum size field, even if some of the threads are idle.
Maximum Size Specifies the maximum number of threads to maintain in the default thread pool.
Thread Inactivity
Timeout
Specifies the number of milliseconds of inactivity that should elapse before a thread is reclaimed. A value of 0 indicates not to wait and a negative value (less than 0) means to wait forever.
Assuming a single application server instance is on the machine, a good practice is to use 5
threads per server CPU core for the Default thread pool, and 10 threads per server CPU for the
ORB and Web Container thread pools. For a machine with up to 4 CPUs, the default settings are
usually a good start for most applications. If the machine has multiple application server
instances, then these sizes should be reduced accordingly. Conversely, there may be situations
where the thread pool size may need to be increased in order to account for slow I/O or long

© Copyright IBM Corporation 2009. All rights reserved.
running back end connections. The following table provides the default thread pool sizes and
inactivity timeouts for the most commonly tuned thread pools.
Thread Pool Minimum Size Maximum Size Inactivity Timeout
Default 20 20 5000 ms
ORB 10 50 3500 ms
Web Container 50 50 60000 ms
The Thread Pool settings can be changed in the Administrative Console at Servers >
Application Servers > server_name > Thread Pool. You can also use the Performance
Advisors to get recommendations on thread pool sizes as well as other settings. The Tivoli
Performance Viewer is a tool embedded into the Administrative Console that allows a user to
view the PMI (Performance Monitoring Infrastructure) data associated with almost any server
component. It provides advice to help tune systems for optimal performance and provides
recommendations on inefficient settings. Instructions for enabling and viewing PMI data with
the Tivoli Performance Viewer can be found here.
The following screen capture shows the PMI data for the Web Container thread pool while the
DayTrader application was ramped up and run under steady-state, peak load. The Pool Size
(orange) is the average number of threads in the pool. The Active Count (red) is the number of
concurrently active threads. The graph below shows that the default setting of 50 maximum Web
Container threads works well in this case as all 50 threads have not been allocated, and the
average concurrent workload is using around 18 threads. Since the default thread pool sizing was
sufficient, no modifications were made to the thread pool sizing.

© Copyright IBM Corporation 2009. All rights reserved.
Prior to WebSphere Application Server v6.x a one-to-one mapping existed between the number
of concurrent client connections and the threads in the Web Container thread pool. In other
words, if 40 clients were accessing an application, 40 threads were needed to service the
requests. However, in WebSphere Application Server v6.0 and v6.1, Native IO (NIO) and
Asynchronous IO (AIO) were introduced providing the ability to scale to thousands of client
connections using a relatively small number of threads. This explains why in the previous chart
an average of 18 threads were used to service 50 concurrent client connections from our HTTP
load driver. Based on this information, the thread pool size could be lowered to reduce the
overhead involved with managing a larger than needed thread pool. However, this would lessen
the ability of the server to respond to load spikes in which a large number of threads were
actually needed. Careful consideration should be taken in determining the thread pool sizes,
including what the expected average and peak workload could potentially be.

© Copyright IBM Corporation 2009. All rights reserved.
Connection Pool Tuning
Each time an application attempts to access a backend store (such as a database), it requires
resources to create, maintain, and release a connection to that data store. To mitigate the strain
this process can place on overall application resources, the Application Server enables
administrators to establish a pool of backend connections that applications can share on an
application server. Connection pooling spreads the connection overhead across several user
requests, thereby conserving application resources for future requests. The important tunable
options associated with connection pools are:
Setting Description
Minimum connections The minimum number of physical connections to maintain. If
the size of the connection pool is at or below the minimum
connection pool size, an Unused Timeout thread will not
discard physical connections. However, the pool does not
create connections solely to ensure that the minimum
connection pool size is maintained.
Maximum connections The maximum number of physical connections that can be
created in this pool. These are the physical connections to the
backend data store. When this number is reached, no new
physical connections are created; requestors must wait until a
physical connection that is currently in use is returned to the
pool , or a ConnectionWaitTimeoutException is thrown, based on the Connection Timeout setting. Setting a high Maximum Connections value can result in a load of connection requests that overwhelms your backend resource.
The goal of tuning the connection pool is to ensure that each thread that needs a connection to
the database has one, and that requests are not queued up waiting to access the database. For the
DayTrader application, each task performs a query against the database. Since each thread
performs a task, each concurrent thread needs a database connection. Typically all requests come
in over HTTP and are executed on a Web Container thread. Therefore, the maximum Connection
Pool size should be at least as large as the maximum size of the Web Container thread pool.
However, there are some cases where requests come in on the Default thread pool, such as in the
Asynchronous mode via Message Driven Beans. Overall, the general best practice is to
determine which thread pools service tasks that require a DataSource connection and to size the
pools accordingly. In this case, the maximum connection pool size was set to the sum of the
Maximum Size of the Default and Web Container thread pools (70). The Connection Pool
settings can be changed in the Administrative Console at Resources > JDBC > Data Sources >
data_source > Connection pool properties. Please keep in mind that all applications may not be
as well behaved as DayTrader from a connection management perspective and may use more
than one connection per thread.
The following shows the PMI data for the Connection Pool while the DayTrader application was
running under steady state peak load with the default Connection Pool sizes of 1 Min / 10 Max.
The FreePoolSize (orange) is the number of free connections in the pool. The UseTime (green) is
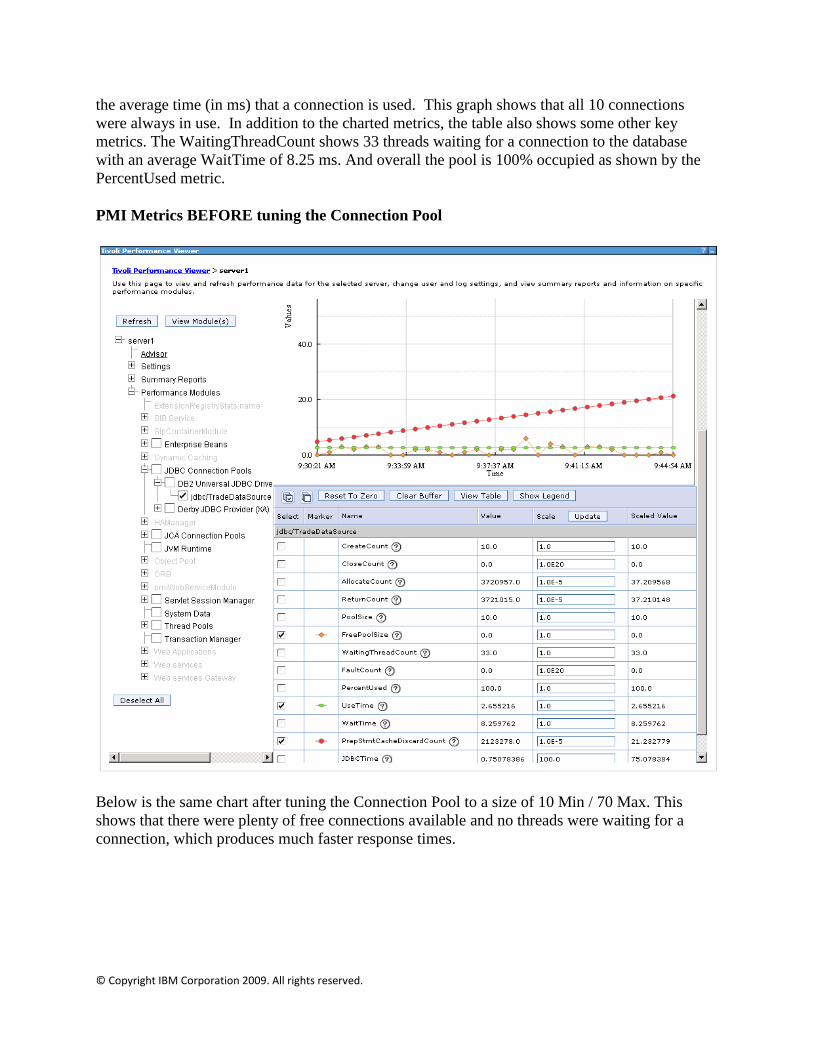
© Copyright IBM Corporation 2009. All rights reserved.
the average time (in ms) that a connection is used. This graph shows that all 10 connections
were always in use. In addition to the charted metrics, the table also shows some other key
metrics. The WaitingThreadCount shows 33 threads waiting for a connection to the database
with an average WaitTime of 8.25 ms. And overall the pool is 100% occupied as shown by the
PercentUsed metric.
PMI Metrics BEFORE tuning the Connection Pool
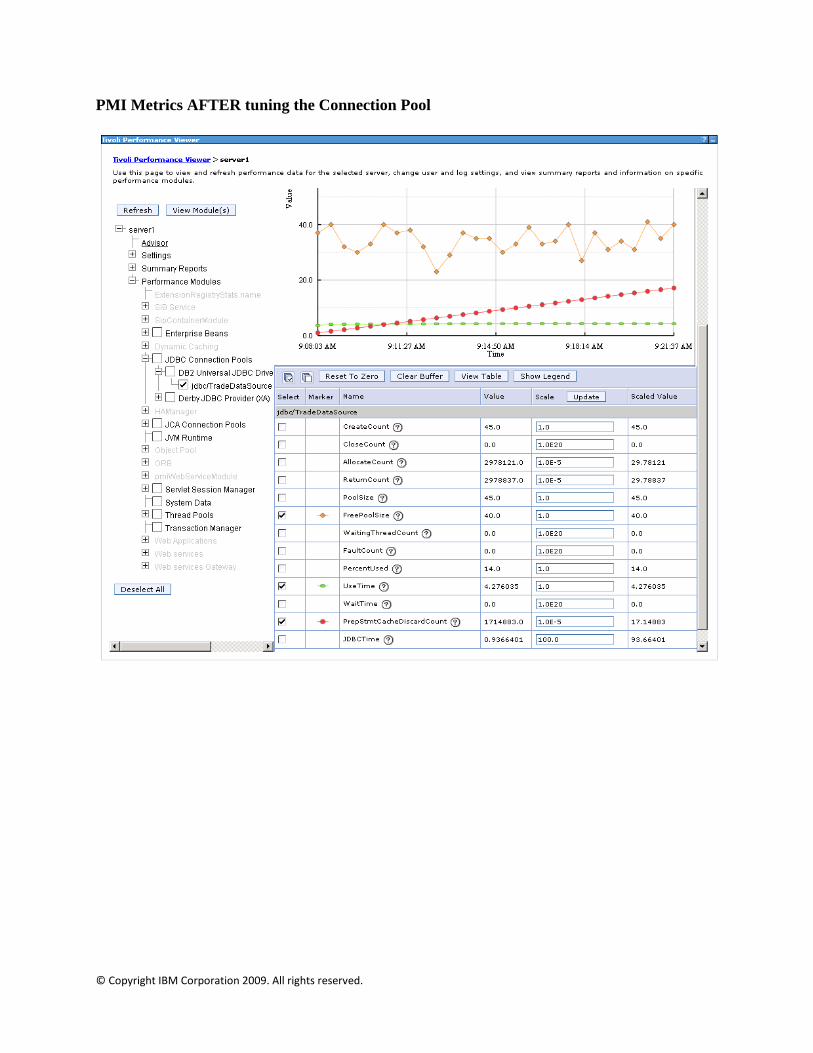
Below is the same chart after tuning the Connection Pool to a size of 10 Min / 70 Max. This
shows that there were plenty of free connections available and no threads were waiting for a
connection, which produces much faster response times.
© Copyright IBM Corporation 2009. All rights reserved.
PMI Metrics AFTER tuning the Connection Pool

© Copyright IBM Corporation 2009. All rights reserved.
Performance Benefit of tuned Connection Pool sizes
More Information
Tuning application servers
Data access tuning parameters
Why you want to use the performance advisors
Data Source Statement Cache size
The Data Source Statement cache size specifies the number of prepared JDBC statements that
can be cached per connection. The WebSphere Application Server data source optimizes the
processing of prepared statements and callable statements by caching those statements that are
not being used in an active connection. If your application utilizes many statements like
DayTrader, then increasing this parameter can improve performance. The Statement Cache size
can be configured at Resources > JDBC > Data sources > data_source > WebSphere
Application Server data source properties.
The Data Source Statement cache size can be tuned using a few different methods. One
technique is to review the application code (or an SQL trace gathered from the database or
database driver) for all unique prepared statements, and ensure the cache size is larger than that
value. The other option is to iteratively increase the cache size and run the application under
peak steady state load until the PMI metrics report no more cache discards. Below is the same
PMI chart of the Connection Pool, this time with the Data Source Statement Cache size increased
from the default size (10), to 60. The metric PrepStmtCacheDiscardCount (red) is the number of
statements that are discarded because the cache is full. Looking back at the previous chart before
100%121%
176%
113%
146%
261%
0%
10%
20%
30%
40%
50%
60%
0%
50%
100%
150%
200%
250%
300%
EJB Session Direct Direct
% Im
pro
vem
en
t
Re
lati
ve T
hro
ugh
pu
t
DayTrader runtime mode
1 Min / 10 Max
10 Min / 70 Max
% Improvement
© Copyright IBM Corporation 2009. All rights reserved.
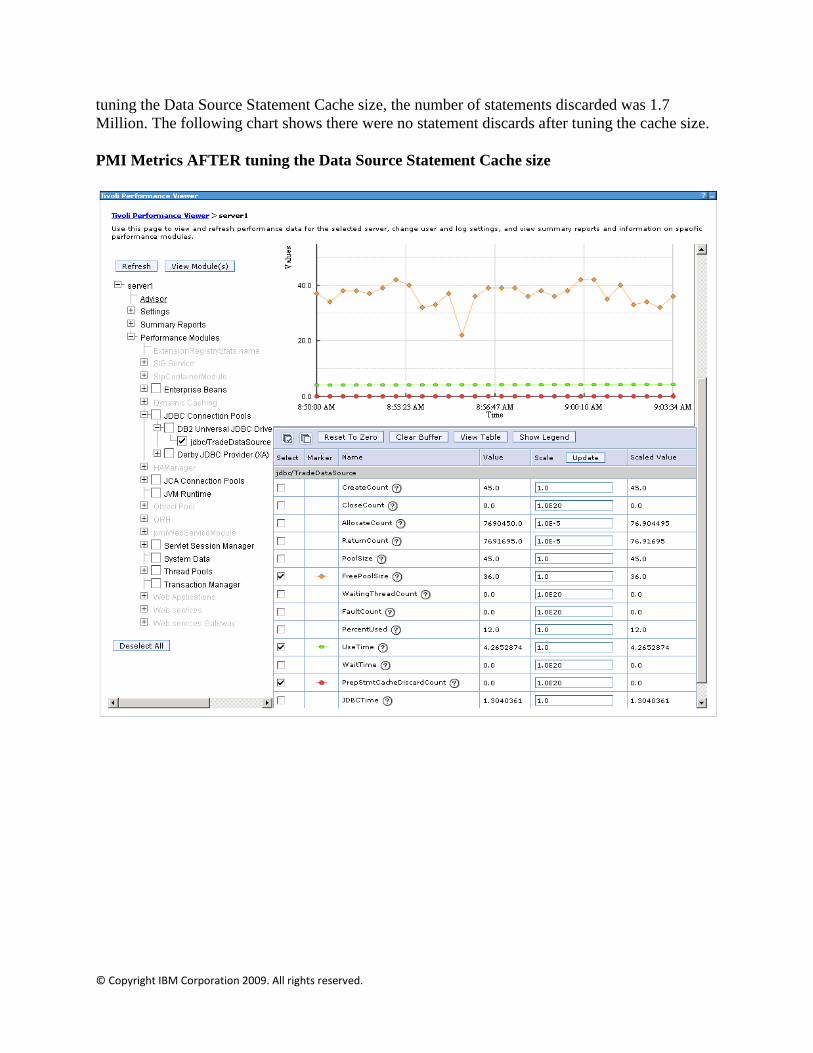
tuning the Data Source Statement Cache size, the number of statements discarded was 1.7
Million. The following chart shows there were no statement discards after tuning the cache size.
PMI Metrics AFTER tuning the Data Source Statement Cache size

© Copyright IBM Corporation 2009. All rights reserved.
Performance Benefit of increased Data Source Statement Cache size
More Information
Data access tuning parameters
ORB Pass by reference
The Object Request Broker (ORB) Pass by reference option determines if pass by reference or
pass by value semantics should be used when handling parameter objects involved in an EJB
request. This option can be found in the Administrative Console at Servers > Application
Servers > server_name > Object Request Broker (ORB). By default this option is disabled and
a copy of each parameter object is made and passed to the invoked EJB method. This is
considerably more expensive than passing a simple reference to the existing parameter object. To
summarize, the ORB Pass by reference option basically treats the invoked EJB method as a local
call (even for EJBs with remote interfaces) and avoids the requisite object copy. If remote
interfaces are not absolutely necessary, a slightly simpler alternative which does not require
tuning is to use EJBs with local interfaces. However, by using local instead of remote interfaces,
you lose the benefits commonly associated with remote interfaces, location transparency in
distributed environments and workload management capabilities.
This option will only provide a benefit when the EJB client (i.e. servlet) and invoked EJB are
located within the same classloader. This requirement means that both the EJB client and EJB
must be deployed in the same EAR file and running on the same application server instance. If
the EJB client and EJB modules are mapped to different application server instances (often
referred to as split-tier), the EJBs must be invoked remotely using pass by value semantics.
100%
129%
231%
104%
132%
237%
0.0%
0.5%
1.0%
1.5%
2.0%
2.5%
3.0%
3.5%
4.0%
4.5%
0%
50%
100%
150%
200%
250%
EJB Session Direct Direct
% Im
pro
vem
en
t
Re
lati
ve T
hro
ugh
pu
t
DayTrader runtime mode
Cache Size = 10
Cache Size = 60
% Improvement

© Copyright IBM Corporation 2009. All rights reserved.
Since the DayTrader application contains both the WEB and EJB modules in the same EAR and
both are deployed to the same application server instance, the ORB Pass by reference option can
be used to realize a performance gain. As indicated by the measurements below, this option is
extremely beneficial for DayTrader where all requests from the servlets are passed to the
Stateless Session Beans over a remote interface, except in Direct mode where the EJB Container
is bypassed in lieu of direct JDBC and manual transactions.
Performance Benefit of ORB Pass by reference
More Information
Object Request Broker tuning guidelines
Advanced Tuning Options
Servlet Caching
WebSphere Application Server’s DynaCache provides a general in-memory caching service for
objects and page fragments generated by the server. The DistributedMap and
DistributedObjectCache interfaces can be used within an application to cache and share Java
objects by storing references to these objects in the cache for later use. Servlet caching, on the
other hand, allows Servlet and JSP response fragments to be stored and managed by a
customizable set of caching rules.
In the DayTrader application, a Market Summary is displayed on every access of a user's Home
page. This contains a list of the top five gaining and losing stocks, as well as the current stock
100%
127%
156%
203%
53%
54%
55%
56%
57%
58%
59%
60%
61%
0%
50%
100%
150%
200%
250%
EJB Session Direct
% Im
pro
vem
en
t
Re
lati
ve T
hro
ugh
pu
t
DayTrader runtime mode
ORB Pass by Reference disabled
ORB Pass by Reference enabled
% Improvement
© Copyright IBM Corporation 2009. All rights reserved.
index and trading volume. This requires the execution of several database lookups and therefore
significantly delays the loading of the user's Home page. With Servlet Caching, the
marketSummary.jsp can be cached, virtually eliminating these expensive database queries to
improve the response time for the user Home page. The refresh interval for the cached object can
be configured, and in the example below is set to 60 seconds. Dynacache could also be used to
cache other servlet/JSP fragments and data within DayTrader. This example demonstrates the
improvement one can achieve through caching to avoid complex server operations.
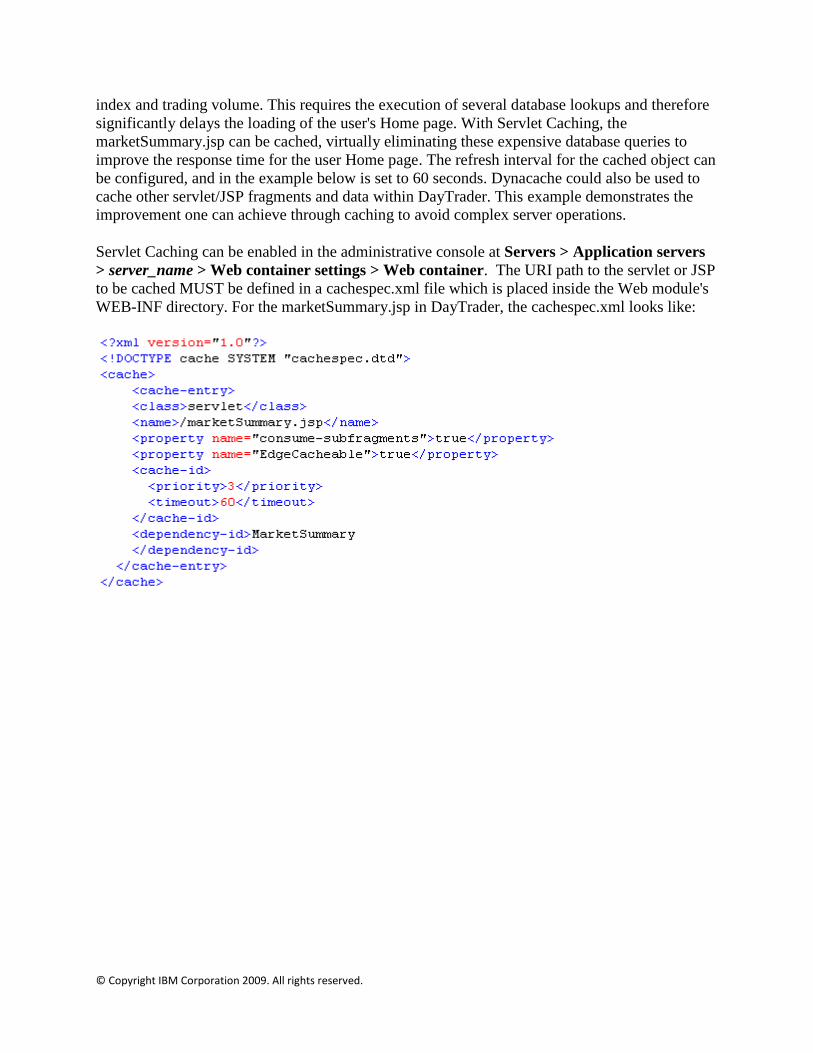
Servlet Caching can be enabled in the administrative console at Servers > Application servers
> server_name > Web container settings > Web container. The URI path to the servlet or JSP
to be cached MUST be defined in a cachespec.xml file which is placed inside the Web module's
WEB-INF directory. For the marketSummary.jsp in DayTrader, the cachespec.xml looks like:

© Copyright IBM Corporation 2009. All rights reserved.
Performance Benefit of Servlet Caching
More Information
Task overview: Using the dynamic cache service to improve performance
Configuring cacheable objects with the cachespec.xml file
HTTP Transport Persistent Connections
Persistent Connections specifies that an outgoing HTTP response should use a persistent (keep-
alive) connection instead of a connection that closes after one request or response exchange
occurs. In many cases, a performance boost can be achieved by increasing the maximum number
of persistent requests that are allowed on a single HTTP connection. SSL connections can see a
significant performance gain by enabling unlimited persistent requests per connection because
SSL connections incur the costly overhead of exchanging keys and negotiating protocols to
complete the SSL handshake process. Maximizing the amount of requests that can be handled
per connection minimizes the impact of this overhead. Also, high throughput applications with
fast response times can realize a performance gain by keeping the connections open instead of
building up and closing the connection on each request. When this property is set to 0 (zero), the
connection stays open as long as the application server is running. However, if security is a
concern careful consideration should be placed on this setting as this parameter can help prevent
denial of service attacks when a client tries to hold on to a keep-alive connection.
HTTP Transport Persistent Connections settings can be set in the Administrative Console at
Servers > Application servers > server_name > Ports. Then, click on View associated
transports for the port associated with the HTTP transport channel whose settings you want to
change.
100%
130%146%
129%
182%
241%
0%
10%
20%
30%
40%
50%
60%
70%
0%
50%
100%
150%
200%
250%
300%
EJB Session Direct Direct
% Im
pro
vem
en
t
Re
lati
ve T
hro
ugh
pu
t
DayTrader runtime mode
Servlet Caching disabled
Servlet Caching enabled
% Improvement
© Copyright IBM Corporation 2009. All rights reserved.
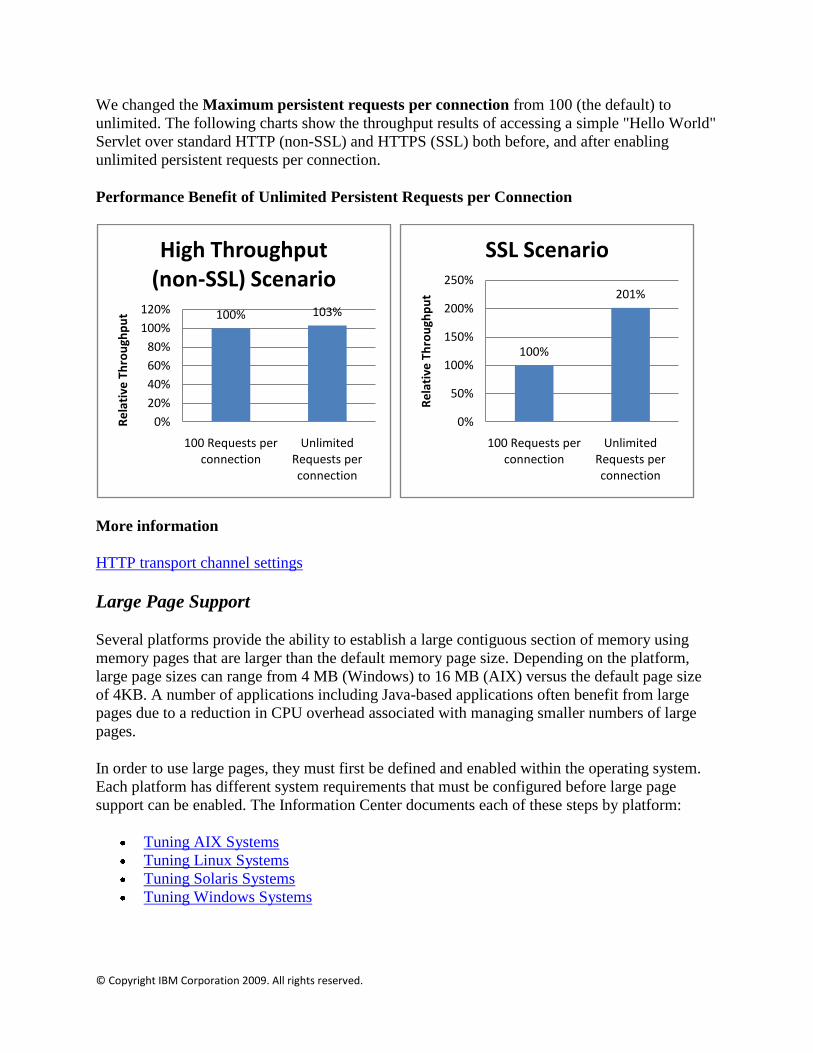
We changed the Maximum persistent requests per connection from 100 (the default) to
unlimited. The following charts show the throughput results of accessing a simple "Hello World"
Servlet over standard HTTP (non-SSL) and HTTPS (SSL) both before, and after enabling
unlimited persistent requests per connection.
Performance Benefit of Unlimited Persistent Requests per Connection
More information
HTTP transport channel settings
Large Page Support
Several platforms provide the ability to establish a large contiguous section of memory using
memory pages that are larger than the default memory page size. Depending on the platform,
large page sizes can range from 4 MB (Windows) to 16 MB (AIX) versus the default page size
of 4KB. A number of applications including Java-based applications often benefit from large
pages due to a reduction in CPU overhead associated with managing smaller numbers of large
pages.
In order to use large pages, they must first be defined and enabled within the operating system.
Each platform has different system requirements that must be configured before large page
support can be enabled. The Information Center documents each of these steps by platform:
Tuning AIX Systems
Tuning Linux Systems
Tuning Solaris Systems
Tuning Windows Systems
100% 103%
0%
20%
40%
60%
80%
100%
120%
100 Requests per connection
Unlimited Requests per connection
Re
lati
ve T
hro
ugh
pu
t
High Throughput (non-SSL) Scenario
100%
201%
0%
50%
100%
150%
200%
250%
100 Requests per connection
Unlimited Requests per connection
Re
lati
ve T
hro
ugh
pu
t
SSL Scenario
© Copyright IBM Corporation 2009. All rights reserved.
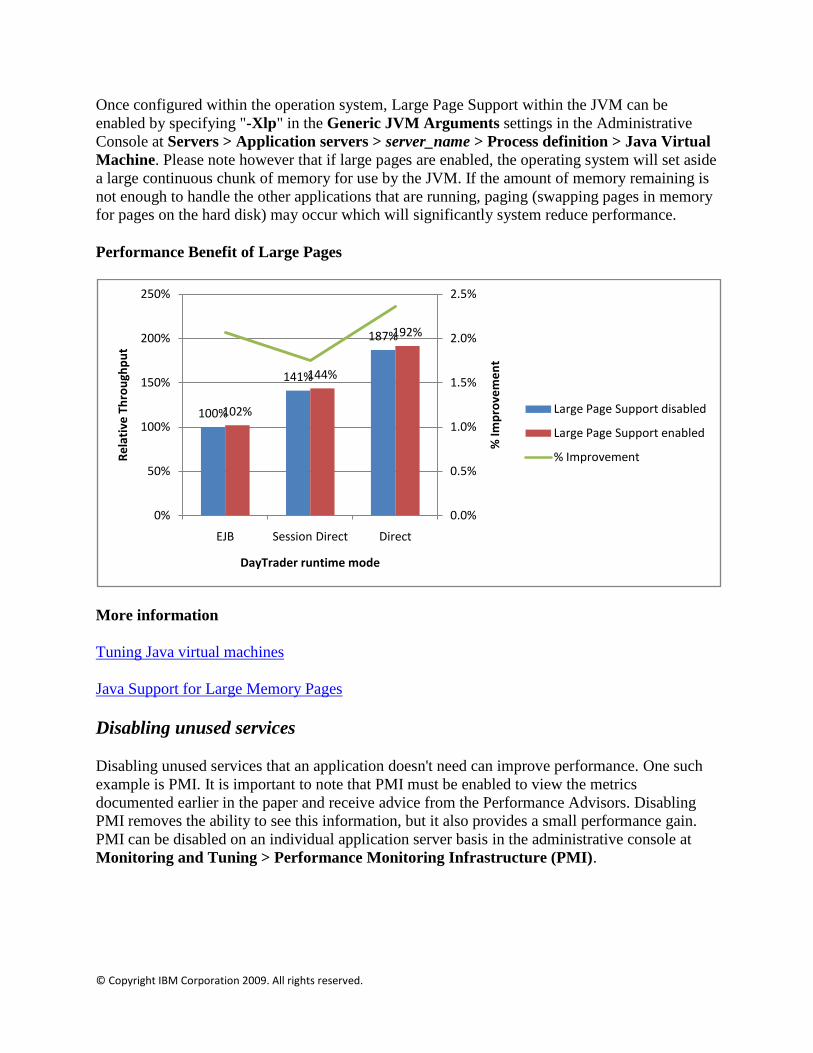
Once configured within the operation system, Large Page Support within the JVM can be
enabled by specifying "-Xlp" in the Generic JVM Arguments settings in the Administrative
Console at Servers > Application servers > server_name > Process definition > Java Virtual
Machine. Please note however that if large pages are enabled, the operating system will set aside
a large continuous chunk of memory for use by the JVM. If the amount of memory remaining is
not enough to handle the other applications that are running, paging (swapping pages in memory
for pages on the hard disk) may occur which will significantly system reduce performance.
Performance Benefit of Large Pages
More information
Tuning Java virtual machines
Java Support for Large Memory Pages
Disabling unused services
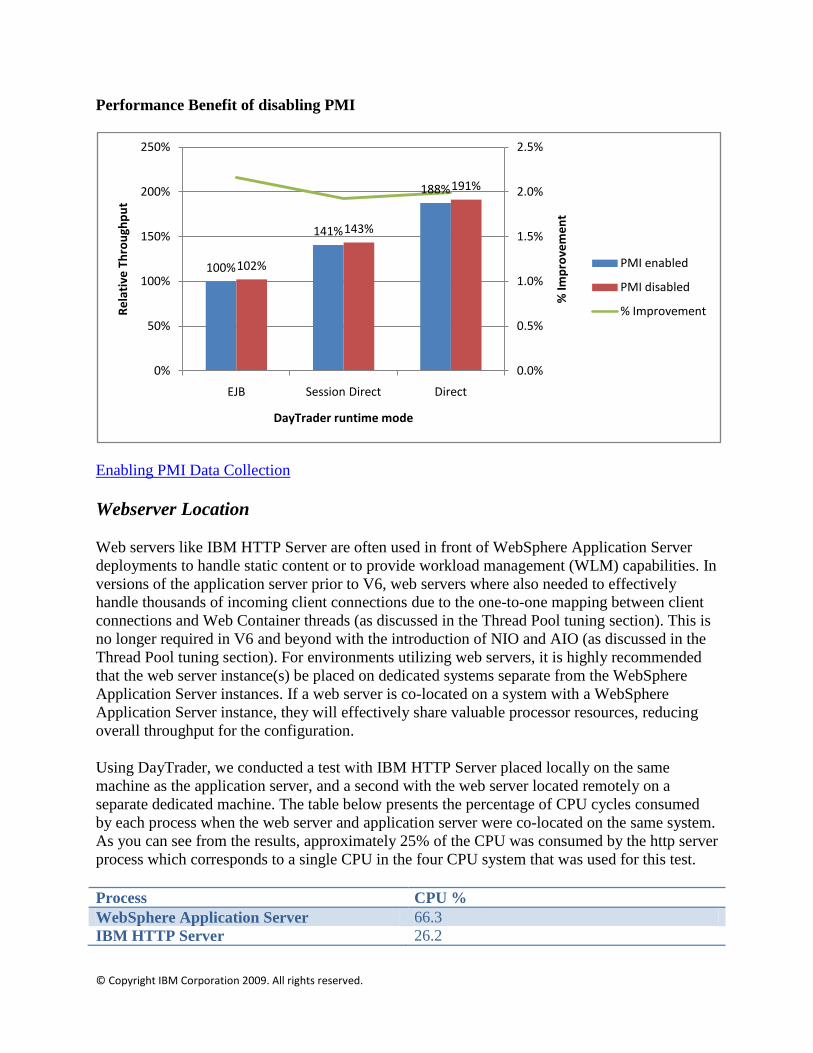
Disabling unused services that an application doesn't need can improve performance. One such
example is PMI. It is important to note that PMI must be enabled to view the metrics
documented earlier in the paper and receive advice from the Performance Advisors. Disabling
PMI removes the ability to see this information, but it also provides a small performance gain.
PMI can be disabled on an individual application server basis in the administrative console at
Monitoring and Tuning > Performance Monitoring Infrastructure (PMI).
100%
141%
187%
102%
144%
192%
0.0%
0.5%
1.0%
1.5%
2.0%
2.5%
0%
50%
100%
150%
200%
250%
EJB Session Direct Direct
% Im
pro
vem
en
t
Re
lati
ve T
hro
ugh
pu
t
DayTrader runtime mode
Large Page Support disabled
Large Page Support enabled
% Improvement
© Copyright IBM Corporation 2009. All rights reserved.
Performance Benefit of disabling PMI
Enabling PMI Data Collection
Webserver Location
Web servers like IBM HTTP Server are often used in front of WebSphere Application Server
deployments to handle static content or to provide workload management (WLM) capabilities. In
versions of the application server prior to V6, web servers where also needed to effectively
handle thousands of incoming client connections due to the one-to-one mapping between client
connections and Web Container threads (as discussed in the Thread Pool tuning section). This is
no longer required in V6 and beyond with the introduction of NIO and AIO (as discussed in the
Thread Pool tuning section). For environments utilizing web servers, it is highly recommended
that the web server instance(s) be placed on dedicated systems separate from the WebSphere
Application Server instances. If a web server is co-located on a system with a WebSphere
Application Server instance, they will effectively share valuable processor resources, reducing
overall throughput for the configuration.
Using DayTrader, we conducted a test with IBM HTTP Server placed locally on the same
machine as the application server, and a second with the web server located remotely on a
separate dedicated machine. The table below presents the percentage of CPU cycles consumed
by each process when the web server and application server were co-located on the same system.
As you can see from the results, approximately 25% of the CPU was consumed by the http server
process which corresponds to a single CPU in the four CPU system that was used for this test.
Process CPU %
WebSphere Application Server 66.3
IBM HTTP Server 26.2
100%
141%
188%
102%
143%
191%
0.0%
0.5%
1.0%
1.5%
2.0%
2.5%
0%
50%
100%
150%
200%
250%
EJB Session Direct Direct
% Im
pro
vem
en
t
Re
lati
ve T
hro
ugh
pu
t
DayTrader runtime mode
PMI enabled
PMI disabled
% Improvement
© Copyright IBM Corporation 2009. All rights reserved.
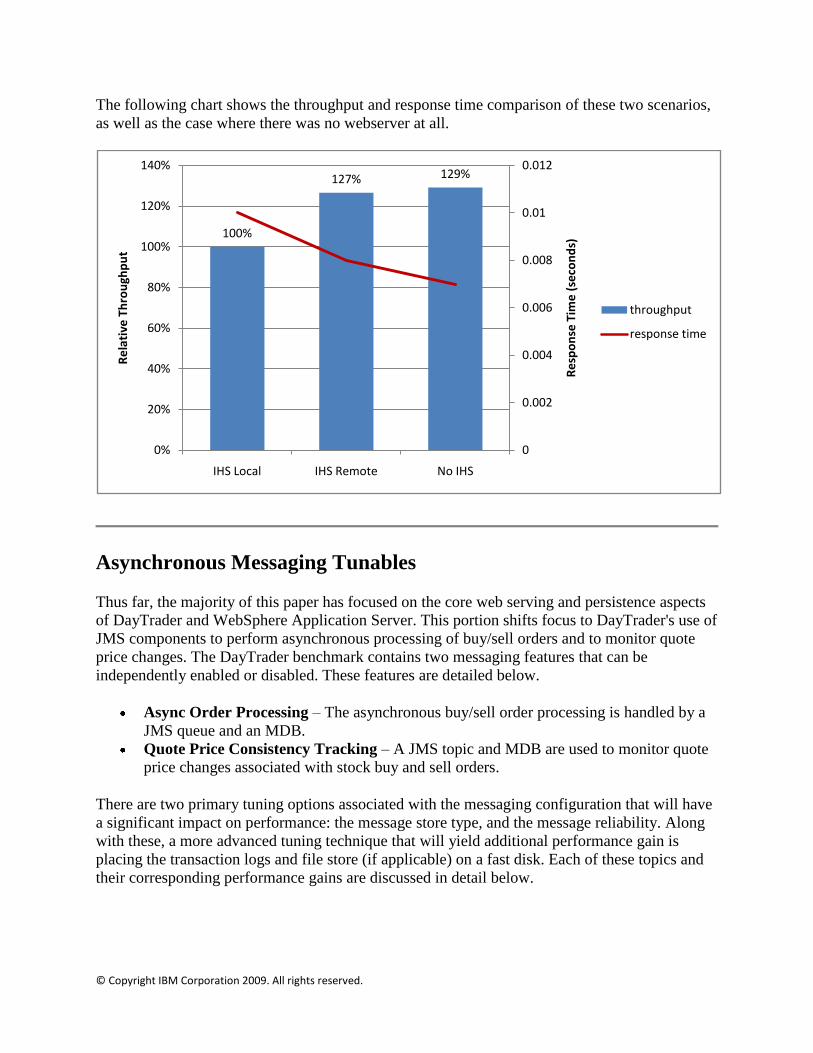
The following chart shows the throughput and response time comparison of these two scenarios,
as well as the case where there was no webserver at all.
Asynchronous Messaging Tunables
Thus far, the majority of this paper has focused on the core web serving and persistence aspects
of DayTrader and WebSphere Application Server. This portion shifts focus to DayTrader's use of
JMS components to perform asynchronous processing of buy/sell orders and to monitor quote
price changes. The DayTrader benchmark contains two messaging features that can be
independently enabled or disabled. These features are detailed below.
Async Order Processing – The asynchronous buy/sell order processing is handled by a
JMS queue and an MDB.
Quote Price Consistency Tracking – A JMS topic and MDB are used to monitor quote
price changes associated with stock buy and sell orders.
There are two primary tuning options associated with the messaging configuration that will have
a significant impact on performance: the message store type, and the message reliability. Along
with these, a more advanced tuning technique that will yield additional performance gain is
placing the transaction logs and file store (if applicable) on a fast disk. Each of these topics and
their corresponding performance gains are discussed in detail below.
100%
127% 129%
0
0.002
0.004
0.006
0.008
0.01
0.012
0%
20%
40%
60%
80%
100%
120%
140%
IHS Local IHS Remote No IHS
Re
spo
nse
Tim
e (
seco
nd
s)
Re
lati
ve T
hro
ugh
pu
t
throughput
response time
© Copyright IBM Corporation 2009. All rights reserved.
Message Store type
The WebSphere Application Server Internal Messaging Provider maintains the concept of a
messaging engine "data store". The data store serves as the persistent repository for messages
handled by the engine. When a messaging engine is created in a single-server environment, a
file-based store is created to use as the default data store. Please note that in v6.0.x, the default
datastore was provided by a local, in-process Derby database. The file and Derby based data
stores are convenient for in single-server scenarios, but do not provide the highest level of
performance, scalability, manageability, and high availability. To meet these requirements, a
remote database data store can be used. These three options are discussed in more detail below.
Local Derby database data store – With this option, a local, in-process Derby database
is used store the operational information and messages associated with the Messaging
Engine. Although convenient for development purposes, this configuration used valuable
cycles and memory within the application server to manage the stored messages.
File-based data store (default) – If the message engine is configured to use a file-based
data store, operating information and messages are persisted to the file system instead of
a database. This performs faster than the local Derby database and when a fast disk such
as a redundant array of independent disks (RAID) is used, can perform just as fast as a
remote database. The test results shown below did not use a RAID device for the file-
based data store and do not reflect this additional improvement.
Remote database data store – In this configuration, a database residing on a remote
system is configured to act as the message engine data store. This frees up cycles for the
application server JVM process that were previously used to manage the Derby database
or file based stores, allowing for a more performant, production level database server
(such as DB2® Enterprise Server or Oracle® Database) to be used. One technical
advantage of using a database for the data store is that some J2EE applications can share
JDBC connections to benefit from one-phase commit optimization. For more information
refer to Sharing connections to benefit from one-phase commit optimization. File store
does not support this optimization.
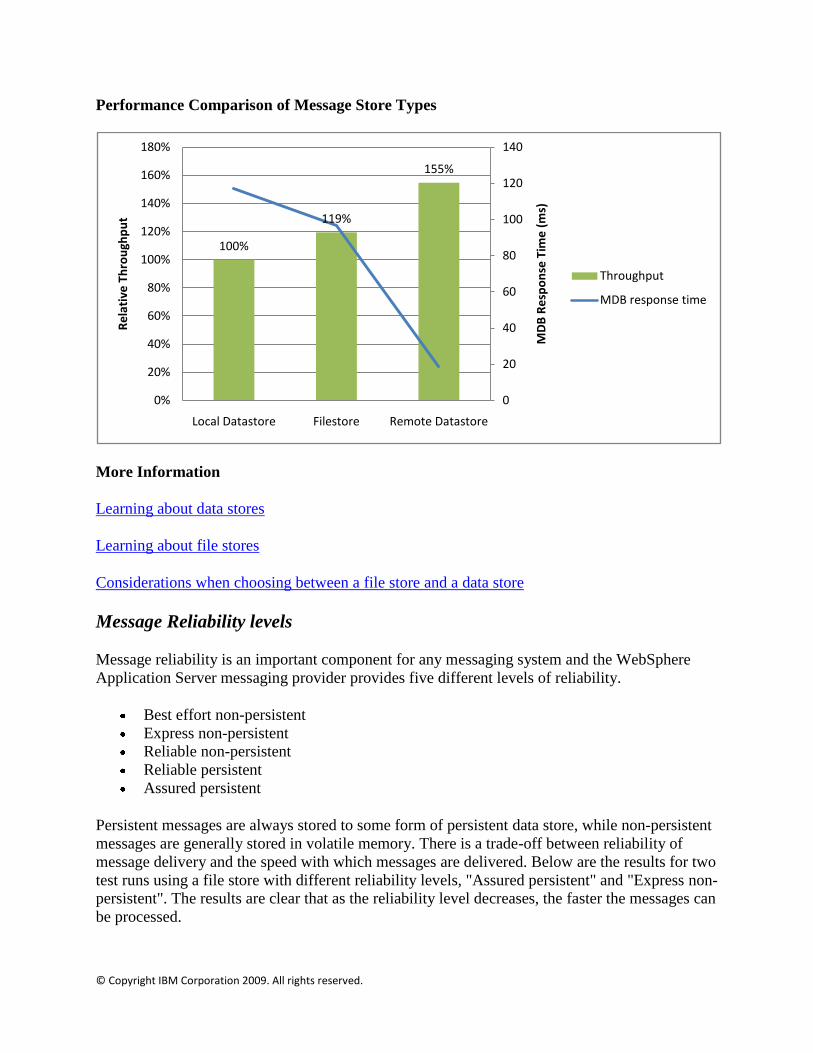
DayTrader was run in EJB asynchronous mode with the three different message store types: a
local default derby data store, a file-based data store (file store), and a remote database data
store. During these runs, the trace specification
"org.apache.geronimo.samples.daytrader.util.Log=all" was enabled to capture the time to receive
messages for the TradeBrokerMDB. When measuring asynchronous messaging performance, it
is always important to base the measurements on the MDB response times which are
asynchronous, and not the actual page response times which are synchronous. The results below
show that a remote database data store yields the best performance, as it provides the fastest
MDB response time and highest throughput.
© Copyright IBM Corporation 2009. All rights reserved.
Performance Comparison of Message Store Types
More Information
Learning about data stores
Learning about file stores
Considerations when choosing between a file store and a data store
Message Reliability levels
Message reliability is an important component for any messaging system and the WebSphere
Application Server messaging provider provides five different levels of reliability.
Best effort non-persistent
Express non-persistent
Reliable non-persistent
Reliable persistent
Assured persistent
Persistent messages are always stored to some form of persistent data store, while non-persistent
messages are generally stored in volatile memory. There is a trade-off between reliability of
message delivery and the speed with which messages are delivered. Below are the results for two
test runs using a file store with different reliability levels, "Assured persistent" and "Express non-
persistent". The results are clear that as the reliability level decreases, the faster the messages can
be processed.
100%
119%
155%
0
20
40
60
80
100
120
140
0%
20%
40%
60%
80%
100%
120%
140%
160%
180%
Local Datastore Filestore Remote Datastore
MD
B R
esp
on
se T
ime
(m
s)
Re
lati
ve T
hro
ugh
pu
t
Throughput
MDB response time

© Copyright IBM Corporation 2009. All rights reserved.
Performance Comparison of Message Reliability Levels
More Information
Message reliability levels
Moving Transaction Logs & File store to a fast disk
Since disk I/O operations are costly, storing log files on fast disks such as a RAID can greatly
improve performance. In most RAID configurations, the task of writing data to the physical
media is shared across the multiple drives. This technique yields more concurrent access to
storage for persisting transaction information, and faster access to that data from the logs.
The Transaction log directory can be set in the Administrative Console at Servers >
Application Servers > server_name > Container Services > Transaction Service.
The File store log directory can be specified during the creation of a SIBus Member using the -
logDirectory option in the AdminTask addSIBusMember command or via the Administration
Console SIBus Member creation panels.
Below are the results for two test runs: one with the transaction logs and file store stored locally
on the hard drive, and the other with them stored on a RAMDisk (which essentially treats a
section of memory as a hard disk for faster reads/writes). For these runs a reliability level of
"Express non-persistent" was used. The results show that the response times and throughput are
slightly faster when the logs are stored on a fast disk.
100%
129%
0
20
40
60
80
100
120
0%
20%
40%
60%
80%
100%
120%
140%
Persistent Non-persistent
MD
B R
esp
on
se T
ime
(m
s)
Re
lati
ve T
hro
ugh
pu
t
Throughput
MDB response time

© Copyright IBM Corporation 2009. All rights reserved.
Performance Benefit of using a Fast Disk
More Information
Transaction service settings
Adding a new member to a service integration bus using the wsadmin tool
Summary
Summary and Overall Performance Improvement
WebSphere Application Server has been designed to host an ever growing range of applications
each with their own unique set of features, requirements, and services. With this flexibility
comes the reality that no two applications will use the application server in exactly the same way
and a single set of tuning parameters will rarely provide the best performance for two different
applications.
Even though DayTrader may not resemble your application, the methodology for figuring out
what to tune and how to go about tuning it are the same. The key is to identify and focus in on
the major server components and resources used by your application based on the application
architecture. In general, a large number of applications will realize some improvement from
tuning in three core areas, the JVM, thread pools, and connection pools. Other tunables may
yield just as much bang for the buck as these three; however, these will typically be tied to a
specific WebSphere Application Server feature used by the application.
100%104%
0
2
4
6
8
10
12
14
16
18
20
0%
20%
40%
60%
80%
100%
120%
Hard disk RAMDisk
MD
B R
esp
on
se T
ime
(m
s)
Re
lati
ve T
hro
ugh
pu
t
Throughput
MDB response time

© Copyright IBM Corporation 2009. All rights reserved.
In the previous sections, we discussed this core set of tunables in addition to a number of other
options that benefit the DayTrader application. For each of the options, we identified where to
find the tunable, provided recommendations and/or discussion of the trade-offs, and provided
pointers to any related tools. The following chart shows the overall performance improvement
for each DayTrader runtime mode after these tuning options were applied:
JVM Heap size
Thread Pools and Connection Pool sizes
Data source Statement Cache size
ORB Pass by Reference
Servlet Caching
Unlimited Persistent HTTP Connections
Large Page Support
Disabling PMI
As you can clearly see from the table, the described tuning yielded 169% improvement for EJB
mode, 207% improvement for Session Direct mode, and 171% improvement for Direct mode.
These are fairly sizable improvements and similar improvements can be realized in other
applications; however, it's important to keep in mind that "mileage will vary" based on the
factors discussed in this paper and a number that are beyond this paper's scope. Hopefully, the
information and tools discussed in this whitepaper have provided some key insights that make
the task of tuning the server for your specific application less daunting.
100%123%
186%200%
261%293%
269%
378%
505%
0%
50%
100%
150%
200%
250%
0%
100%
200%
300%
400%
500%
600%
EJB Session Direct Direct
% Im
pro
vem
en
t
Re
lati
ve T
hro
ugh
pu
t
DayTrader runtime mode
Default AppServer
Basic Tuning
Advanced Tuning
% Improvement
© Copyright IBM Corporation 2009. All rights reserved.
© Copyright IBM Corporation 2009. All Rights Reserved
The information contained in this publication is provided for informational purposes only. While efforts were made to verify the completeness and accuracy of the information contained in this publication, it is provided AS IS without warranty of any kind, express or implied. In addition, this information is based on IBM’s current product plans and strategy, which are subject to change by IBM without notice. IBM shall not be responsible for any damages arising out of the use of, or otherwise related to, this publication or any other materials. Nothing contained in this publication is intended to, nor shall have the effect of, creating any warranties or representations from IBM or its suppliers or licensors, or altering the terms
and conditions of the applicable license agreement governing the use of IBM software.
References in this publication to IBM products, programs, or services do not imply that they will be available in all countries in which IBM operates. Product release dates and/or capabilities referenced in this presentation may change at any time at IBM’s sole discretion based on market opportunities or other factors, and are not intended to be a commitment to future product or feature availability in any way. Nothing contained in these materials is intended to, nor shall have the effect of, stating or implying that any activities undertaken by you will result in any specific sales, revenue growth, savings or other results.
Performance is based on measurements and projections using standard IBM benchmarks in a controlled environment. The actual throughput or performance that any user will experience will vary depending upon many factors, including considerations such as the amount of multiprogramming in the user's job stream, the I/O configuration, the storage configuration, and the workload processed. Therefore, no assurance can be given that an individual user will achieve results similar to those stated here.
IBM, the IBM logo, DB2, and WebSphere are trademarks of International Business Machines Corporation in the United States, other countries or both.
Java and all Java-based trademarks and logos are trademarks of Sun Microsystems, Inc. in the United States, other countries or both.
Windows is a trademark of Microsoft Corporation in the United States, other countries, or both.
Linux is a registered trademark of Linus Torvalds in the United States, other countries, or both.
Oracle is a registered trademark of Oracle Corporation and/or its affiliates.
Other company, product and service names may be trademarks or service marks of others.