


Languages
Pages
Legal


Master Plan Support Project
June 2015 | Volumes 1-3
FINAL REPORT SUBMISSION TOPRINCE GEORGE’S COUNTY PUBLIC SCHOOLS

PREFACE
EXECUTIVE SUMMARY
BACKGROUND / PURPOSE
METHODOLOGY AND FINDINGS
SYNTHESIS AND RECOMMENDATIONS
1.4.1 WFCI Scoring Methodology and Summary Findings1.4.2 Educational Adequacy Methodology and Summary Findings1.4.3 Utilization Methodology and Summary Findings1.4.4 Project Defi nitions and Costs - Methodology
1.11.21.31.4
1.5
Table of Contents
Volume No. 1
PLANNING AREA REVIEW GUIDE
MAPS
PLANNING AREA REVIEWS
APPENDICES
2.0
3.1
2.1
3.2
Table of Contents
Volume No. 2
Volume No. 3

NO. 1VOLUME
PRINCE GEORGE’S COUNTY PUBLIC SCHOOLSMASTER PLAN SUPPORT PROJECT REPORT

PREFACE
EXECUTIVE SUMMARY
BACKGROUND / PURPOSE
METHODOLOGY AND FINDINGS
SYNTHESIS AND RECOMMENDATIONS
1.4.1 WFCI Scoring Methodology and Summary Findings1.4.2 Educational Adequacy Methodology and Summary Findings1.4.3 Utilization Methodology and Summary Findings1.4.4 Project Defi nitions and Costs - Methodology
1.11.21.31.4
1.5
Table of Contents
Volume No. 1

SECTION 1.1 - PREFACE
J U N E 2 0 1 5
1 . 1 . 1
PREFACE
1.1

PRINCE GEORGE’S COUNTY PUBLIC SCHOOLS MASTER PLAN SUPPORT PROJECT
B R A I L S F O R D & D U N L A V E Y I N S P I R E . E M P O W E R . A D V A N C E . 1 . 1 . 4
PREFACE
In October 2014 Prince George’s County Public Schools (PGCPS) engaged Brailsford & Dunlavey, Inc.
(B&D) along with Perkins Eastman Architects (PEA) and other subconsultants (together, the project team)
to provide comprehensive planning services in support of its ongoing facility master planning efforts. This
project, referred to as the Master Plan Support Project (MPSP), included assessments of school utilization
and educational adequacy, the development of metrics to weight existing facility condition data, and the
creation of a comprehensive analytical model that integrates the three aforementioned factors to generate
capital improvement project (CIP) and modernization project sequencing recommendations.
In response to requirements from the state of Maryland, the project team provided a draft utilization report
in December 2014, the results of which are updated and finalized herein. In addition, this final report
includes recommendations related to capital projects, budgeting, sequencing, boundary changes, school
closures, and other master planning actions. These recommendations do not represent the plans or
proposals of the chief executive officer (CEO) of PGCPS, but rather recommendations that the project team
is making based on the results of its work.
This MPSP Final report is comprise of three volumes. Volume One contains the comprehensive final report
and recommendations, Volume Two the detailed work plans for forty planning areas, and Volume Three
consists of the maps and appendices.
B&D would like to thank the following PGCPS individuals who provided insight and comments throughout
the process:
Sarah Woodhead, Director of Capital Programs
Rupert McCave, CIP Officer - Department of Capital Programs
Elizabeth Chaisson, Facilities Planner - Department of Capital Programs
Johndel Jones-Brown, Director of Pupil Accounting & School Boundaries
Rhianna McCarter, Department of Pupil Accounting & School Boundaries
Sameano Porchea, Office of Pupil Accouting & School Boundaries
Deanna Newman, independent planning consultant to PGCPS - Public Pathways, LLC
The core project team that completed this project included Brailsford & Dunlavey, Perkins Eastman
Architects and Applied Management Engineering. The team was comprised of the following individuals:
Jay Brinson, Regional Vice President, Brailsford & Dunlavey
Chris Dunlavey, President, Brailsford & Dunlavey
Douglas Kincaid, President, AME
Erika Lehman, Senior Associate, Perkins Eastman Architects

SECTION 1.1 - PREFACE
J U N E 2 0 1 5
1 . 1 . 3
Sean O’Donnell, Principal, Perkins Eastman Architects
Beth Penfield, Senior Project Manager, Brailsford & Dunlavey
Tyler Specht, Project Analyst, Brailsford & Dunlavey
Additional subconsultants who supported the project were:
Peter Forella, Project Manager, Forella Group – cost estimating
Peter Furst, Planner, Urbanomics – GIS mapping
Tina Lund, Principal, Urbanomics - GIS mapping
William Richardson, Program Manager, Educational Systems Planning – technology
consulting
As with any master planning process, data and knowledge is limited and assumptions are made as to
probable future conditions. For the MPSP this includes but not limited to the physical condition of buildings,
building current and desired future functional use, applicable local, state, and federal guidelines and
standards, and projected enrollment figures. As such:
1. The analyses, recommendations, observations, and conclusions contained in this study
represent the professional opinions of the B&D project team with such opinions based
on:
a. Original research conducted using primary, secondary, and tertiary sources
b. Information provided by Client, and
c. The project team’s professional experience
2. This study has been prepared for Client’s internal decision making purposes only and is valid
only for the sole and specific purpose stated herein as of the date of this report; it may not be
used for any other purpose or by any other party for any purpose.
3. This study is intended to be used in whole and not in parts. Separation of any part from the
whole may skew information or interpretation and is, therefore, not allowed.
4. The project team relied extensively on information provided by Client. B&D accepted this
information as accurate and performed no independent verification to confirm validity.
Examples include but are not limited to:
a. In many cases engineering judgment was used to determine what deficiencies might be
impacted by project work implemented since the 2012 Parson’s FCI Report based upon
project scope descriptions provided by PGCPS and the accuracy of those adjustments

PRINCE GEORGE’S COUNTY PUBLIC SCHOOLS MASTER PLAN SUPPORT PROJECT
B R A I L S F O R D & D U N L A V E Y I N S P I R E . E M P O W E R . A D V A N C E . 1 . 1 . 4
are professional opinions based solely upon the facility condition data provided by
PGCPS.
b. The calculation of facility utilization relied upon existing floor plans provided by PGCPS.
These floor plans were assumed to be scaleable and proportionally accurate.
5. The project team performed its work using industry and public information that is deemed
reliable, but whose accuracy cannot be guaranteed. B&D makes no recommendation and
provides no warranty as to such information’s accuracy or completeness. Examples include
but are not limited to:
a. Educational Adequacy assessments were conducted based upon visual observations
and resulted in general characterizations made by project staff utilizing the common
survey tool developed specifically for this project. These observations do not reflect
detailed engineering analysis, testing, or inspections.
6. B&D makes no assurance and provides no guarantee that results identified in this study will
be achieved. Economic and market conditions, management action or inaction, and
implementation timing, as well as other important circumstances, often do not occur as
planned and such deviations can be material.
7. The success of the project, including achieving any financial goals presented herein, will
depend in large part on the operator’s competencies and performance, which B&D has no
control over. The project team has assumed that the operating management team will be
highly competent.
8. The project team expresses no opinion on legal or financial matters or any other specialized
knowledge beyond the specific analyses conducted for this report.
9. B&D’s obligations to Client for this study are solely corporate and no B&D owner, officer,
director, employee, agent, contractor, or controlling person shall be subject to any personal
liability whatsoever to any person nor will any such claim be asserted by or on behalf of any
other party or person relying on this report.

SECTION 1.2 – EXECUTIVE SUMMARY
J U N E 2 0 1 5 1 . 2 . 1
EXECUTIVESUMMARY
Overview
Project Background
Methodology and Findings
Synthesis and Recommendations
Next Steps
1.2

PRINCE GEORGE’S COUNTY PUBLIC SCHOOLS MASTER PLAN SUPPORT PROJECT
B R A I L S F O R D & D U N L A V E Y I N S P I R E . E M P O W E R . A D V A N C E .1 . 2 . 2
OVERVIEW
The Master Plan Support Project (MPSP) was established to provide Prince George’s County PublicSchools (PGCPS) with the documentation and recommendations needed to update the FY2016Educational Facilities Master Plan (EFMP) with a comprehensive long-range plan for addressing itsextensive backlog of school facility needs. To do this, PGCPS engaged Brailsford and Dunlavey, Inc. (B&D)along with Perkins Eastman Architects (PEA) and other subconsultants (together, the project team). TheMPSP project team enhanced existing facility condition data by creating a weighted facility condition index(WFCI) to prioritize specific building system deficiencies and collected facility functionality data related toeducational adequacy and school utilization rates. Ultimately, the MPSP final report synthesizes theprioritized school construction and renovation projects, school condition and functionality data, and PGCPS’mission-based goals and objectives into an objective, comprehensive, and achievable plan.
Synthesizing the massive quantity of information collected for this project required the project team to applya unique strategy that organized the school district into 40 distinct planning areas. This approach allowedthe team to address local facility needs while concurrently developing a prioritized program implementationsequence that addressed the overall needs of the district’s large and diverse residents. The plan identifiesand addresses several significant issues, including:
Significant overutilization of schools in the northern portions of the county, particularly at the middleand high school levels;
Significant underutilization of schools in the central and southern portions of the county, particularlyat the elementary school levels; and
Widespread facility condition and functionality concerns, especially in middle and elementaryschools in the central and southern portions of the county.
Upon completing its analyses, the project team recommends the initiation of a comprehensive 20-year,$8.5 billion modernization program that includes renovating or replacing 132 existing schools, building eightnew schools, adjusting multiple school boundaries, and closing or consolidating 29 schools. Therecommended program balances school utilization, addresses all facility condition issues, minimizes schooldistrict operating costs, and provides PGCPS with facilities that will support student achievement for manyyears to come.
The recommendations outlined in the plan will more more than triple PGCPS’ current annual capitalexpenditures. Maintaining the status quo will force PGCPS to defer some required work for years or makesignificant reductions in scope, which only delays the inevitable need, assures that repairs will be moreexpensive, and causes the untenable abandonment of its mission-based principles. PGCPS and the countyhave many difficult decisions to make and much is unknown about public willingness to embrace such anaggressive course of action. However, the level of need in the county has reached a critical point and it isclear to the project team that PGCPS should begin working immediately on next steps to implement theMPSP recommendations.

SECTION 1.2 – EXECUTIVE SUMMARY
J U N E 2 0 1 5 1 . 2 . 3
PROJECT BACKGROUND
Maintaining an inventory of more than 200 facilities over almost 500 square miles of land in neighborhoodsthat include urban core areas, new suburban developments, and older rural communities is a significantchallenge for Prince George’s County Public Schools (PGCPS). With the majority of buildings being over40-years old and not modernized to the latest standards, PGCPS must allocate the majority of its limitedannual capital project funding to projects that address deficiencies in aging facilities. This approach forcesPGCPS to be reactive to critical issues, which are often unpredictable, and prevents the school district fromimplementing a proactive approach that focuses on creating schools for the future.
Best practices in school maintenance support the comprehensive modernization of school buildings every35-40 years. Although consistent, routine, and regular maintenance of building systems can extend abuilding’s life span, most major systems reach the end of their useful lives and fail or become inefficientafter 30 to 35 years. Additionally, changes in teaching styles and content, new technologies, and, for manyschools, multiple unrelated additions, require redesign and upgrading of the teaching and learning spaces.Modernizing to ‘like new’ standards requires replacing all major systems, rightsizing and equipping allclassrooms and core spaces, installing state-of–the-art technology, and improving site conditions.
The PGCPS Department of Capital Programs creates, and updates annually, an Educational FacilitiesMaster Plan (EFMP), which is the planning tool used to establish program needs and priorities. The EFMPserves as the basis for prioritizing projects in the Capital Improvement Program (CIP). Each year thePGCPS Capital Programs staff submits the EFMP, an annual CIP, and a six-year CIP to be reviewed andapproved by the local board of education.
The facility evaluations and associated analysis conducted by the project team for the MPSP provided theobjective data needed to determine individual project needs while PGCPS goals and initiatives providedthe foundation for the development of comprehensive of planning strategies. Application of the planningstrategies allowed the project team to develop a comprehensive set of recommendations designed to bestalign future school facilities with PGCPS’ mission. PGCPS must take these recommendations anddetermine how best to integrate them into its long-term capital planning program.

PRINCE GEORGE’S COUNTY PUBLIC SCHOOLS MASTER PLAN SUPPORT PROJECT
B R A I L S F O R D & D U N L A V E Y I N S P I R E . E M P O W E R . A D V A N C E .1 . 2 . 4
METHODOLOGY AND FINDINGS
FACILITY CONDITIONS
In 2012, a Parsons Engineering report stated that the total cost of repairs for PGCPS’ outstanding building
deficiencies was $2.13 billion. The Parson’s assessment reported these repair needs in the form of a
Facility Condition Index (FCI) based upon the following formula:
PGCPS recognized that the FCI quantifies deficiencies by the cost to replace or correct them without
considering that some deficiencies are more difficult to correct or have a greater impact on the school’s
learning environment. To correct for this concern, PGCPS requested that the project team use the Parson’s
data to develop and vet a weighted FCI (WFCI) that considers health and safety issues, the degree to which
corrections are readily achievable in isolation (i.e. not in modernization or replacement), and other important
factors.
Weighting Methodology
The project team analyzed attributes of the FCI data collected by Parsons to determine how they could beused in the WFCI process. It was determined that two attributes from the data, deficiency category andpriority were reflective of criticality and appropriate for weighting the FCI. Rating characteristics were alsodeveloped by analyzing the impact on learning and the difficulty of repair/replacement of specific buildingelements based on their Uniformat Code1. Using a scale of one-10, ratings were assigned to eachUniformat code category based upon its specific characteristics related to the four attribute categories:
Deficiency Category Priority Impact on Learning Difficulty of Repair/Replacement
The difficulty of repair attribute was weighted the highest because of the extensive disruption to schooloperations caused by correcting the associated deficiencies. The impact on learning attribute was alsostrongly weighted because of the contribution to educational outcome. The other two attributes wereweighted much lower because there is not a normal distribution of the data associated with these attributes,since roughly 90 percent of the FCI data is clustered into two subcategories.
1 The code, developed by the American Society for Testing and Materials (ASTM), is a standard for classification of buildingelements and related site work, and provides a hierarchy of organizing data in a building at various levels of detail.
Current Cost of RepairsReplacement ValueFCI =

SECTION 1.2 – EXECUTIVE SUMMARY
J U N E 2 0 1 5 1 . 2 . 5
All schools’ WFCI scores were ranked from one to 159, with one having the highest score of all schools
and 159 having the lowest. Instead of ranking or prioritizing the distribution of all schools one-by-one or on
a scale of one to 100, the entire portfolio of schools was prioritized into 25 separate groupings to align the
results with the priority scores developed for educational adequacy. The final WFCI priority scores range
from one to 25 with lower scores being indicative of worse facility conditions.
Summary of Findings
The weighting methodology described above produced the following conclusions:
1. Weighting the 2012 FCI data had a significant impact on the relative ranking of schools based on
facility conditions, causing 92% of schools to move at least one spot in the rankings and 17% to
move 10 or more places. These moves indicate that the weighting process was effective in
differentiating schools based on their unique system deficiency profiles.
2. On average, regional schools have the highest WFCI scores, followed closely by schools in the
Southern and Central Regions. Northern schools, on average, have the lowest WFCI scores.
3. All regional schools, regardless of type, in addition to middle schools in the Southern and Central
Regions, have the highest average WFCI scores, indicating higher overall levels of facility condition
needs.
4. Concentrations of deficiencies in high priority systems are linked to higher WFCI scores and several
school types have concentrations of deficiencies in systems that are difficult to repair. These
FIGURE 1.2.1: Average WFCI scores by region and school type
PRINCE GEORGE’S COUNTY PUBLIC SCHOOLS MASTER PLAN SUPPORT PROJECT
B R A I L S F O R D & D U N L A V E Y I N S P I R E . E M P O W E R . A D V A N C E .1 . 2 . 6
findings have significant implications on the types of projects that must be undertaken to correct
the problems.
EDUCATIONAL ADEQUACY
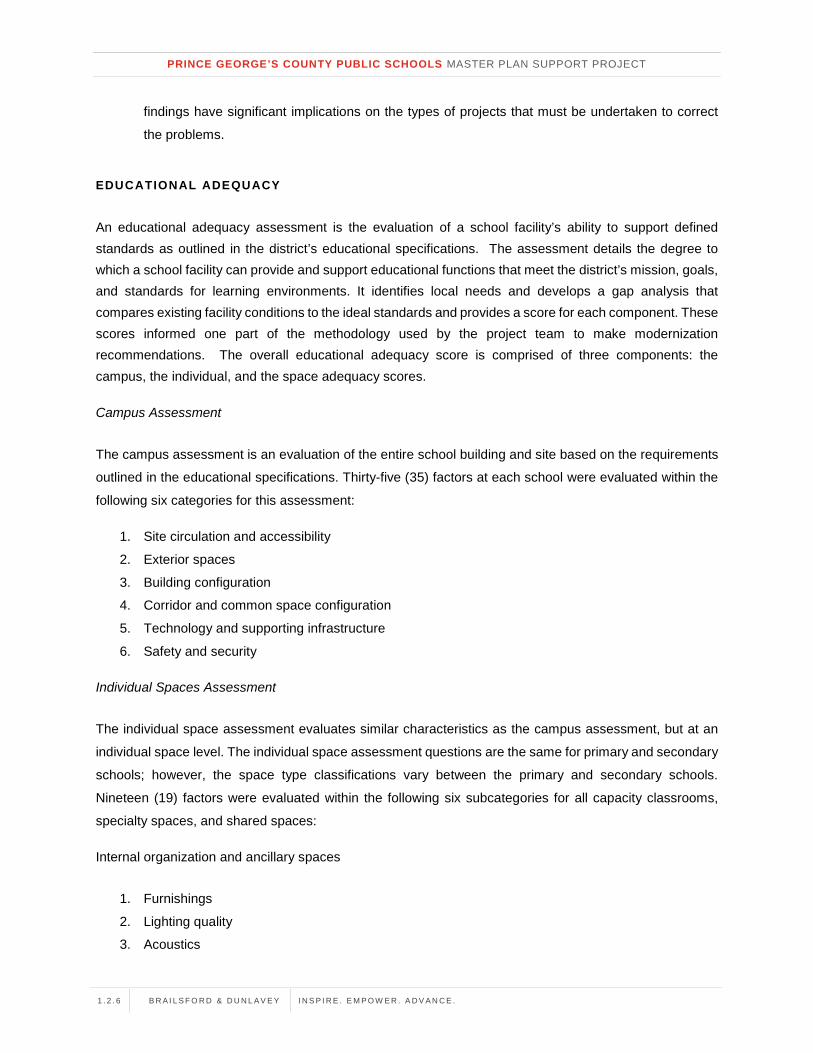
An educational adequacy assessment is the evaluation of a school facility’s ability to support definedstandards as outlined in the district’s educational specifications. The assessment details the degree towhich a school facility can provide and support educational functions that meet the district’s mission, goals,and standards for learning environments. It identifies local needs and develops a gap analysis thatcompares existing facility conditions to the ideal standards and provides a score for each component. Thesescores informed one part of the methodology used by the project team to make modernizationrecommendations. The overall educational adequacy score is comprised of three components: thecampus, the individual, and the space adequacy scores.
Campus Assessment
The campus assessment is an evaluation of the entire school building and site based on the requirements
outlined in the educational specifications. Thirty-five (35) factors at each school were evaluated within the
following six categories for this assessment:
1. Site circulation and accessibility
2. Exterior spaces
3. Building configuration
4. Corridor and common space configuration
5. Technology and supporting infrastructure
6. Safety and security
Individual Spaces Assessment
The individual space assessment evaluates similar characteristics as the campus assessment, but at an
individual space level. The individual space assessment questions are the same for primary and secondary
schools; however, the space type classifications vary between the primary and secondary schools.
Nineteen (19) factors were evaluated within the following six subcategories for all capacity classrooms,
specialty spaces, and shared spaces:
Internal organization and ancillary spaces
1. Furnishings
2. Lighting quality
3. Acoustics

SECTION 1.2 – EXECUTIVE SUMMARY
J U N E 2 0 1 5 1 . 2 . 7
FIGURE 1.2.4: Leveling Factor
4. Air quality
5. Room technology and supporting infrastructure
Space Adequacy
The space adequacy assessment compares the number of learning spaces and total square footage of
such spaces to the requirements set in the district’s education specifications (Ed Specs), and is expressed
as a percentage of space compliant out of the total space required. Space adequacy is measured in three
categories: capacity-driving spaces, specialty spaces, and shared spaces. Space adequacy illustrates if a
school has too many or too few classrooms, and indicates if those spaces are too small or large.
Scoring and Prioritization
Campus and individual space assessments evaluate the compliance of existing spaces to the educational
specifications. The adequacy score is calculated as a percent compliant out of a total possible score by
subsection. The following figures indicate the rating categories applied to the scores from each
assessment:
An additional step was taken to establish a prioritization of the subcomponents. For example, a deficiencyin lighting quality may have greater importance than a deficiency in air quality. To establish priority scoresfor each of the three educational adequacy components, the project team applied a leveling factor to therating categories (excellent to deficient). Five leveling factors were developed in close consultation withPGCPS leadership to ensure the priorities were closely aligned with the district’s goals and objectives.Priority scores between one and 25 were developed for each assessment subcategory by combining theleveling factor with the rating category shown below:
Excellent 89.5 100%Satisfactory 69.5 89.49%Borderline 45.5 69.49%
Poor 29.5 49.49%Deficient 0 29.49%
Campus and Individual Space Assessment Ratings
Rating Range A Range B Color Key
FIGURE 1.2.2: Campus and Individual SpaceAssessment Rating Scale
Excellent 100 100%+Satisfactory 90 99.90%Borderline 80 89.90%
Poor 60 79.90%Deficient 0 59.90%
Space Aadequacy Rating
Rating Range A Range B Color Key
FIGURE 1.2.3: Space Adequacy Rating Scale

PRINCE GEORGE’S COUNTY PUBLIC SCHOOLS MASTER PLAN SUPPORT PROJECT
B R A I L S F O R D & D U N L A V E Y I N S P I R E . E M P O W E R . A D V A N C E .1 . 2 . 8
The priority score for each educational adequacy component (campus assessment, individual spaces, and
space adequacy) is simply an average of its respective subcomponent priority scores. Similarly, the overall
educational adequacy priority score is simply an average of the priority scores for each of the three main
components.
Summary of Findings
The educational adequacy methodology described above produced the following conclusions:
1. Based on the established rating scale, the range of priority scores indicates that PGCPS schools,on average, have borderline educational adequacy with widely varied results at the componentlevel from school to school.
2. Campus assessment priority scores revealed that site circulation and accessibility scores weremost frequently the lowest, with several school types averaging poor or nearly poor, particularly inSouthern Region schools. Building configuration scores were also very low, with poor ratingsconcentrated in secondary schools across the county.
3. Individual space priority scores revealed that schools districtwide tend to have issues withfurnishings, technology, and classroom air quality.
4. Of the three educational adequacy component scores, space adequacy had the widest range ofresults and frequently had a more significant impact on overall educational adequacy scores at theindividual school level than did the other two components.
SCHOOL UTILIZATION
Methodology
The project team started its work in October 2014 by gathering floor plans and school capacity and
enrollment data for all buildings. The team reviewed existing State-rated Capacity (SRC) data tables and
used floor plans provided by the district or, where floor plans were not available, acquired egress plans to
use as a template. As a part of the existing data review, the team established whether a school was based
on a prototype and also classified it by type (elementary, middle, high, pre-K-8 or regional).
Over the course of five weeks, the project team surveyed 193 schools, evaluated the current use of each,
and identified room names, numbers, teacher’s names, and other pertinent data. The team checked the
existing conditions against the existing floor plans and noted where there were significant discrepancies.
The updated information was uploaded into Building Information Modeling (BIM) software so the team could

SECTION 1.2 – EXECUTIVE SUMMARY
J U N E 2 0 1 5 1 . 2 . 9
document each specific area within every building and assign room labels and other functional attributes
for analytical purposes.
The project team built an Excel model where the BIM information, enrollment projection data, and State of
Maryland school capacity calculation requirements2 were entered. Formulas to account for allowable
capacity adjustments were developed to address the appropriate allocation of specialty classrooms and
resource spaces. Once completed, the model created revised school capacities (SRCs) and updated
utilization rates for each school.
Summary of Findings
The school utilization methodology described above produced the following conclusions:
1. Utilization rates are highest in the Northern Region, followed by the Central and then SouthernRegions.
2. Utilization is in most critical condition in Northern Region middle schools and regional EarlyChildhood Centers (ECCs) with projected average utilization rates of 132% and 147%,respectively.
3. All school types are overutilized in the Northern Region and projected to be underutilized in theSouthern Region.
4. In the Central Region, elementary schools are underutilized, while middle and high schools areprojected to be within the targeted range.
5. Regional specialized education centers and alternative schools are all projected to be belowtargeted utilization rates while regional specialty program schools are projected to be within thetargeted range.
6. Analysis of established State Rated Capacities (SRC) for each school resulted in minimal change(less than 5%) across all school types and regions.
2 The State Interagency on School Construction’s (IAC) Appendix 102A was used as a guideline forcalculating SRC.

PRINCE GEORGE’S COUNTY PUBLIC SCHOOLS MASTER PLAN SUPPORT PROJECT
B R A I L S F O R D & D U N L A V E Y I N S P I R E . E M P O W E R . A D V A N C E .1 . 2 . 10
PROJECT DEFINITIONS AND COST ESTIMATING
The project team utilized the facility condition, educational adequacy, and school utilization data to define
the baseline project needs at each facility and organize schools into project groupings based on similar
characteristics.
Upon analyzing the type of work needed across the district, the project team developed four major project
definition categories and applied the appropriate one to each school based on its needs. The project team
was careful to align the scopes within these categories with existing standards used by the state of Maryland
to establish funding eligibility. Summaries of the four baseline project types are:
Full Renovation or Replacement:
This project type includes a comprehensive upgrade to, or replacement of, all building systems,equipment, and furnishings in addition to comprehensive site work improvements and all workrequired to address ADA and building code compliance. In order to complete the extent of workrequired, PGCPS may elect to renovate the building in place or replace it with a new facility3.
Limited Renovation:
This project type includes any school that requires the replacement of five or more building systemsand minor reconfigurations to only a small portion of the building. In many cases limited renovationsinvolve extensive work but are distinguished from a full renovation because the majority of interiorwalls remain in original locations and improvements to exterior building systems such as roof,window, and exterior walls are not required.
System Replacement:
This project type includes any school that requires the replacement of one or more systems butdoes not meet the criteria for a limited renovation. As noted in the educational adequacy findings,fixed furnishings and equipment were consistently the biggest problem across all school types and,therefore, all system replacement projects include upgrades to classroom fittings (casework,marker boards, tack boards, etc.), AV, and technology.
Other:
3 A comprehensive feasibility study should be undertaken by PGCPS prior to initiating work to determine the mosteffective solution.

SECTION 1.2 – EXECUTIVE SUMMARY
J U N E 2 0 1 5 1 . 2 . 11
This category is for projects that do not fit into one of the other three project types. In most cases,
newer schools in need of an addition rather than a renovation are in this category, as are buildings
slated for demolition.
A professional estimator then developed detailed cost estimates for all projects. Estimates included total
costs reflected in 2015 dollars. The estimator provided detailed cost sheets for 107 schools, which were
used to determine project costs for the remaining schools and for any subsequent changes to the baseline
project types.
The baseline projects were developed to quantify the work needed at each school to bring it into alignment
with the board-approved educational specifications, address identified facility condition deficiencies, and
provide adequate space to accommodate FY2020 projected enrollment. The baseline projects were
developed without consideration of the impact of a single project on its neighboring schools or the affect
that other master planning actions, such as boundary changes, may have on the school’s project needs.
That next step is discussed in the following section.
SYNTHESIS AND RECOMMENDATIONS
In collaboration with PGCPS, the project team synthesized facility condition, educational adequacy, andutilization findings into a comprehensive school facility modernization program designed to support andadvance the school district’s educational mission. The planning process began with the detailed review ofexisting district goals, standards, and guidelines. The project team’s understanding of this information wasthen refined through strategic visioning and engagement sessions with PGCPS representatives,stakeholders, and community members.
The result of these meetings was the creation of mission-based principles and logistical considerations thatwere used to guide the development of specific planning strategies. These strategies were generated todevelop comprehensive capital project recommendations and master planning actions that are groundedin site-based data and are aligned with the long-term strategic goals and vision of PGCPS.
PGCPS GOALS, STANDAR DS, AND GUIDELINES
The foundation of the MPSP planning strategies is existing PGCPS goals, standards, and guidelinescovering topics such as school size considerations, academic requirements, and other facility-relatedconsiderations such as school utilization standards. This information provides the basis for the review andanalysis of facility needs and formulation of project recommendations and planning strategies. These goals,standards, and guidelines are described in formalized documents that were refined and clarified for theproject team through strategic visioning and engagement sessions with PGCPS stakeholders. Followingis a summary of the documents and processes utilized to clarify the goals and standards.

PRINCE GEORGE’S COUNTY PUBLIC SCHOOLS MASTER PLAN SUPPORT PROJECT
B R A I L S F O R D & D U N L A V E Y I N S P I R E . E M P O W E R . A D V A N C E .1 . 2 . 12
FY2015 Educational Facilities Master Plan (EFMP): This document was developed to prioritize
projects for the 2016-2021 (six-year) Capital Improvement Plan. The plan calls for PGCPS to
commit to a strategic vision for creating a more efficient and effective system for consolidating,
closing, modernizing, renovating, constructing, and maintaining facilities. Core components of the
EFMP include developing more effective and efficient school sizes, recommended grade
configuration changes, and school utilization policies.
Educational Programming Initiatives: PGCPS has established goals related to secondary school
reform, special education inclusion, and other neighborhood and regional specialty programs. Most
of the reform initiatives are accounted for in the board-approved educational specifications that
were used for the educational adequacy assessments. For the others, PGCPS provided the MPSP
team with supporting documentation to aid in the planning process.
Strategic Visioning Session: The project team facilitated a strategic visioning session with PGCPS
leadership that covered topics related to educational adequacy, space priorities, community needs,
equity of investments, and school district operations.
Community Engagement Sessions: The project team held three community meetings to explain
the purpose of the MPSP and present findings based upon initial assessments. Meeting
participants were engaged in roundtable discussions and encouraged to provide feedback related
to the MPSP.
Planning Workshops: The project team and PGCPS representatives engaged in four planning
workshops to review findings, consider potential project impacts, evaluate alternative scenarios,
and clarify planning strategies in proactive and iterative ways.
PLANNING PRINCIPLES AND STRATEGIES
PGCPS goals, standards, and guidelines provided the project team with direct guidance on how facilityneeds should be evaluated based upon size, capacity and utilization, grade configurations, programofferings, adequacy of spaces, and square footage needs. Planning strategies developed for the MPSPwere derived from two key components: a set of mission-based principles and a list of logisticalconsiderations. The mission-based principles serve as guidelines for implementation of the district’s long-term vision and are one of the critical outcomes from the planning workshops. The logistical considerationswere used to inform the team’s methodology for reviewing site-based needs and formulating projectrecommendations and priorities that meet the district’s immediate and long-term goals.
SECTION 1.2 – EXECUTIVE SUMMARY
J U N E 2 0 1 5 1 . 2 . 13
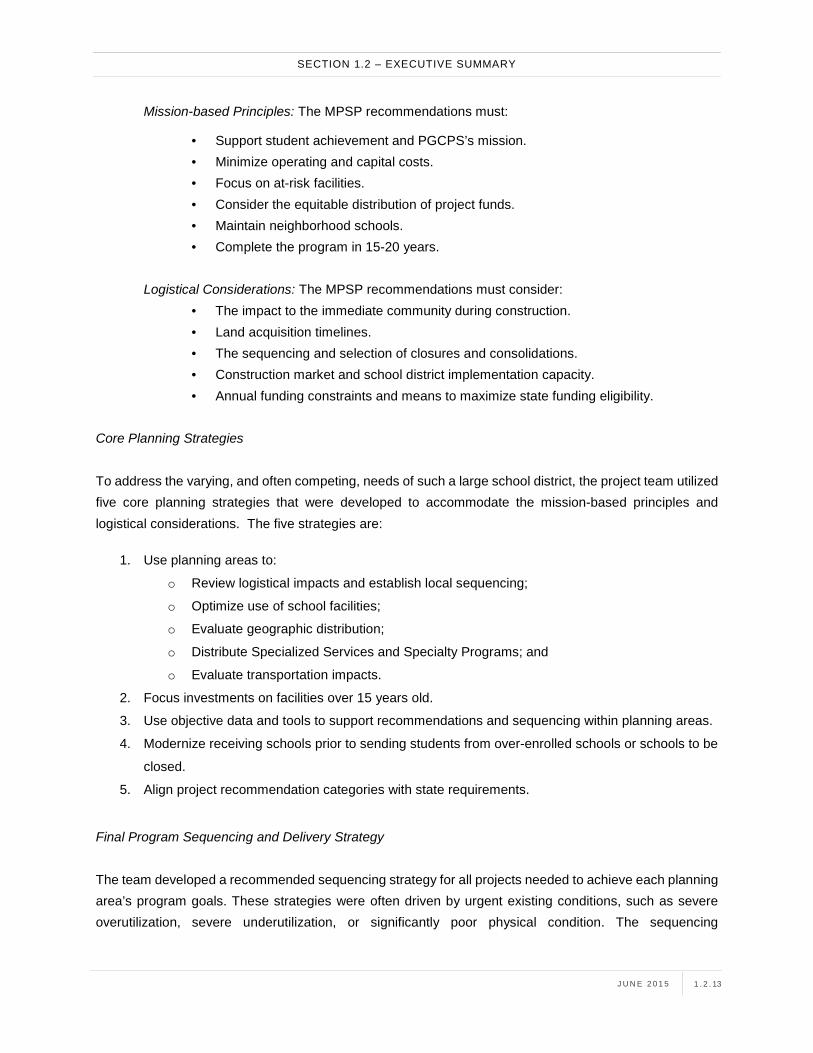
Mission-based Principles: The MPSP recommendations must:
Support student achievement and PGCPS’s mission. Minimize operating and capital costs. Focus on at-risk facilities. Consider the equitable distribution of project funds. Maintain neighborhood schools. Complete the program in 15-20 years.
Logistical Considerations: The MPSP recommendations must consider: The impact to the immediate community during construction. Land acquisition timelines. The sequencing and selection of closures and consolidations. Construction market and school district implementation capacity. Annual funding constraints and means to maximize state funding eligibility.
Core Planning Strategies
To address the varying, and often competing, needs of such a large school district, the project team utilizedfive core planning strategies that were developed to accommodate the mission-based principles andlogistical considerations. The five strategies are:
1. Use planning areas to:
o Review logistical impacts and establish local sequencing;
o Optimize use of school facilities;
o Evaluate geographic distribution;
o Distribute Specialized Services and Specialty Programs; and
o Evaluate transportation impacts.
2. Focus investments on facilities over 15 years old.
3. Use objective data and tools to support recommendations and sequencing within planning areas.
4. Modernize receiving schools prior to sending students from over-enrolled schools or schools to be
closed.
5. Align project recommendation categories with state requirements.
Final Program Sequencing and Delivery Strategy
The team developed a recommended sequencing strategy for all projects needed to achieve each planningarea’s program goals. These strategies were often driven by urgent existing conditions, such as severeoverutilization, severe underutilization, or significantly poor physical condition. The sequencing

PRINCE GEORGE’S COUNTY PUBLIC SCHOOLS MASTER PLAN SUPPORT PROJECT
B R A I L S F O R D & D U N L A V E Y I N S P I R E . E M P O W E R . A D V A N C E .1 . 2 . 14
recommendations and the logic that supports them are described in the planning area reports in VolumeTwo of this document. Once the planning area sequencing schedules were completed, the team thendeveloped an overall prioritization strategy that organized planning areas into the following priority groups:
Priority 1: Areas with critical systems failures.
Priority 2: Areas that are critically utilized.
Priority 3: Areas with one or more severely overutilized schools where construction is the required
solution.
Priority 4: Areas with one or more severely overutilized schools where master planning action could
be an alternative to a capital investment.
Priority 5: Areas with overall critical WFCI scores.
Priority 6: Areas with one or more schools with a severe WFCI score.
Priority 7: Balance of planning areas.
AGGREGATE RESULTS AND RECOMMENDATIONS
After applying the planning and prioritization strategies, the project team developed a detailed 20-year, $8.5billion modernization program that addresses all deferred capital improvements and ensures all schoolsare educationally appropriate per the latest standards and guidelines. The recommended modernizationprogram includes 140 capital projects sequenced over twenty fiscal years starting in 2017 and requires onaverage $425 million annually over the life of the program. This program will provide an optimized portfoliowith balanced utilization rates achieved via multiple boundary realignments and specific school closurerecommendations.
The $8.5 billion program costs are comprised of $5.5 billion in direct project costs, $2.3 billion in escalationcosts, and $700 million in other program costs. The distribution of the 140 projects by project type, alongwith their associated costs in 2015 dollars is provided in Figure 1.2.5 below. As shown, over 80% of the

SECTION 1.2 – EXECUTIVE SUMMARY
J U N E 2 0 1 5 1 . 2 . 15
projects are full or limited renovations, but the program also recommends the construction of eight newschools and the closure of 29 existing facilities.
The capital program recommendations are broken down into three CIP cycles as show in Figure 1.2.6below. The majority of overutilization issues are addressed by the end of cycle one and all but two of the40 planning areas have at least one project started by 2024.
The distribution of projects across the Northern, Central and Southern Regions is detailed in Figure 1.2.7below. The larger quantity of projects in the Northern Region is necessitated by the significant
Full Renovation or Replacement $3.4 billion 77
Limited Renovation $1.2 billion 39
System Replacement $178 million 11
Other $82 million 5
New School $583 million 8
Total: $5.5 billion 140*Costs do not include annual escalation**Categories include costs for additions where recommended
Program Recommendations
Category of Project** Project Costs* Project Counts
Duration
Cycle Fiscal Years Started CompletedValue ofProjectsStarted*
Ave. TotalCost per
FY
Total CostsOccuring**
Cycle 1(year 1 - year 6) 2017 - 2022 45 27 $2.1 billion $307 million $2 billion
Cycle 2(year 7 - year 12) 2023 - 2028 64 56 $2.3 billion $470 million $3.1 billion
Cycle 3(year 13 - year 20) 2029 - 2036 31 58 $1.1 billion $392 million $3.4 billion
140 141 $5.5 billion $8.5 billion*Reflects the total value of projects started within this cycle according to their 2015 un-escalated project costs.**Costs reflect project costs per fiscal year, escalated accordingly, as well as recommended other program costs.
Projects Program Costs
FIGURE 1.2.5: Modernization Program Project Categories and Distribution
FIGURE 1.2.6 Program Information by CIP Cycle

PRINCE GEORGE’S COUNTY PUBLIC SCHOOLS MASTER PLAN SUPPORT PROJECT
B R A I L S F O R D & D U N L A V E Y I N S P I R E . E M P O W E R . A D V A N C E .1 . 2 . 16
overutilization issues that require the implementation of construction projects. The greater quantity ofunderutilized schools in the Central and Southern Regions allowed the project team to frequentlyrecommend alternatives to construction such as boundary adjustments or closures.
PROGRAM OUTCOMES
Program Outcomes
The outcomes of this modernization program align with the strategic goals and mission of PGCPS by
correcting all deferred capital improvements and ensuring all schools are educationally appropriate per the
latest standards. The modernization program will optimize the district’s portfolio by balancing utilization
rates while minimizing operating costs, maintaining neighborhood schools, and improving access to
specialty academic and special needs programs for students.
The MPSP puts forward aggressive recommendations that more than triple the current annual capital
expenditures. The plan acknowledges that maintaining the status quo does not align with the achievement
of the principles PGCPS described throughout this project. The maintenance of current funding levels will
force PGCPS to defer some required work for years, which only ensures that repairs will be more expensive,
or reduce scopes significantly, which will cause untenable compromises of mission-based principles.
In the end, the 20-year, $8.5 billion program is the most logical option to overcome utilization challenges,
address facility condition issues, minimize school district operating costs, and provide long-term support for
student achievement. The plan achieves all of the objectives as quickly and economical as practical.
PGCPS and the county have many difficult decisions to make and much is unknown about public
North 20 $1 billion 22 $876 million 15 $495 million 57 $2.4 billionCentral 12 $659 million 15 $514 million 7 $223 million 34 $1.4 billionSouth 6 $275 million 16 $638 million 7 $246 million 29 $1.2 billionRegional 7 $186 million 11 $304 million 2 $52 million 20 $0.5 billionTotal: 45 $2.1 billion 64 $2.3 billion 31 $1.0 billion 140 $5.5 B
Elementary 20 $564 million 40 $1 billion 20 $367 million 80 $1.9 billionMiddle 14 $932 million 5 $278 million 5 $261 million 24 $1.5 billionHigh 4 $444 million 8 $718 million 4 $337 million 16 $1.5 billionRegional 7 $186 million 11 $300 million 2 $52 million 20 $0.5 billionTotal: 45 $2.1 billion 64 $2.3 billion 31 $1.0 billion 140 $5.5 B*Reflects the total value of projects started within this cycle according to their 2015 un-escalated project costs.
Count Value* Count Value*
Cycle 1(2017 - 2022)
Cycle 2(2023 - 2028)
Cycle 3(2029 - 2036) Program Total
Region Count Value* Count Value*
Value* Count Value*School Type Count Value* Count Value* Count
FIGURE 1.2.7: Cycle 1, 2, 3 Program Information Distributed by Region and School Type

SECTION 1.2 – EXECUTIVE SUMMARY
J U N E 2 0 1 5 1 . 2 . 17
willingness to embrace such an aggressive course of action. However, the level of need in the county has
reached a critical point and it is clear to the project team that PGCPS should begin working immediately on
next steps to implement the MPSP recommendations.
NEXT STEPS
Achievement of the goals identified for this project will require not only approval and advancement of theoverall plan and recommendations herein, but development of next steps to ensure that therecommendations are pursued pragmatically and with mitigation of the many potential risks involved. Theseven initiatives outlined below, while possibly not comprehensive, should guide PGCPS as it continueswith the Master Plan Support Project.
1. Public Dissemination and Engagement: Present and explain the plan to the district’s residents;incorporate their feedback.
2. Comprehensive Boundary Study: Conduct a detailed study of MPSP recommendations forbalancing school utilization to validate and finalize an implementation strategy.
3. Implementation Plan: Refine the plans for project definition, planning, and implementation withinthe program.
4. Capital Plan: Refine the budgeting tools and assumptions necessary to fund capital expendituresfrom a viable financing structure.
5. Individual Project Feasibility Studies: Conduct individualized project planning with detailedconsideration of site- and school-specific needs, design opportunities, and budget parameters.
6. School Closure(s) Process: Apply the defined public process for consideration and approval ofschool closures to those schools recommended for closure in the plan.
7. Plan Updates and Refinement: Regularly update and refine the plan as feedback, new planninginformation and strategic direction from PGCPS is received.

SECTION 1.3 – BACKGROUND AND PURPOSE
J U N E 2 0 1 5 1 . 3 . 1
BACKGROUND ANDPURPOSE
Introduction
State Planning Requirements
Recent Facility Planning History
MPSP: Purpose, Goals, and Scope
1.3

PRINCE GEORGE’S COUNTY PUBLIC SCHOOLS MASTER PLAN SUPPORT PROJECT
B R A I L S F O R D & D U N L A V E Y I N S P I R E . E M P O W E R . A D V A N C E .1 . 3 . 2
BACKGROUND AND PURPOSEINTRODUCTION
Maintaining an inventory of more than 200 facilities over almost 500 square miles of land in neighborhoodsthat include urban core areas, new suburban developments, and older rural communities is a significantchallenge for Prince George’s County Public Schools (PGCPS). With the majority of buildings being over40-years old and not modernized to the latest standards, PGCPS must allocate the majority of its limitedannual capital project funding into projects that address deficiencies in aging facilities. This forces PGCPSto be reactive to critical issues which are often unpredictable and prevents the school district fromimplementing a proactive approach that focuses on creating schools for the future.
Best practices in school maintenance support the comprehensive modernization of school buildings every35-40 years. Although consistent, routine, and regular maintenance of building systems can extend abuilding’s life span, most major systems reach the end of their useful lives and fail or become inefficientafter 30 to 35 years. Additionally, changes in teaching styles and content, new technologies, and, for manyschools, multiple unrelated additions, require redesign and upgrading of the teaching and learning spaces.Modernizing to ‘like new’ standards requires replacing all major systems, rightsizing and equipping allclassrooms and core spaces, installing state-of–the-art technology, and improving site conditions.
STATE PLANNING REQUIREMENTS
As a part of the State of Maryland’s Public School Construction Program, the Interagency Committee onSchool Construction (IAC), reviews projects and allocates state funding to support public schoolconstruction in local districts. As a part of this larger program, PGCPS and other local school districtsannually submit required planning documents to the Maryland Department of Planning (MDP) and the IAC.
The PGCPS Department of Capital Programs creates, and updates annually, an Educational FacilitiesMaster Plan (EFMP), which is the planning tool used to establish program needs and priorities. The EFMPserves as the basis for prioritizing projects in the Capital Improvement Program (CIP). Each year thePGCPS Capital Programs staff submits the EFMP, an annual CIP, and a six-year CIP to be reviewed andapproved by the local school board.
In the fall, the CIP is then submitted to the state IAC. After review and discussion with representatives fromeach school district, the IAC staff recommends action on each project listed in the annual CapitalImprovement Program request to the Interagency Committee. In December, the committee holds a specialhearing to allow the school districts to appeal the IAC staff recommendations. The committee, afterreviewing the staff recommendations and the information presented at the hearing, forwards itsrecommendations to the Board of Public Works. The Board of Public Works holds a public hearing in

SECTION 1.3 – BACKGROUND AND PURPOSE
J U N E 2 0 1 5 1 . 3 . 3
January for school districts to appeal the recommendations of the Interagency Committee. Changes to theCapital Improvement Program, as recommended by the committee, are generally approved by the Boardof Public Works in January. The board generally reconvenes to respond to appeals in April, after the statelegislature has approved the capital budget and the level of state funding for the following fiscal year, torespond to appeals.
A compelling case for the need to modernize academic facilities is critical to moving forward with thePGCPS academic strategic plan. The Master Plan Support Project and other planning efforts to date serveto support these planning efforts.
RECENT FACILITY PLANNING HISTORY
PARSONS’ REPORT
In 2008, Parsons 3D/International (Parsons) conducted a General Facility Condition Assessment on alldistrict schools. The purpose of this assessment was to help PGCPS define capital renewal and deferredmaintenance funding requirements and this work involved gathering information such as make, model, andinstallation dates of various building systems such as foundation, structural, roofing, and heating,ventilation, and air condition (HVAC). The Parsons’ report and associated data was updated in 2012 andat that time, identified over $2 billion in facility repairs at existing schools for these major building systems.With a current average annual funding of $130 million, this $2 billion backlog of capital renewal and deferredmaintenance projects would not be cleared for over 20 years. Additionally, the project costs addressed inthe Parsons report do not address facility overutilization and mission and function based upgrades orexpansions.
EDUCATIONAL SPECIFIC ATIONS
In 2014, PGCPS began the development of local educational specifications (Ed Specs) for both primaryand secondary schools. The Ed Specs serve as the school facility standards and they were designed toreflect space standards, spatial requirements, design philosophy, and to serve as the link between theeducational program and school facilities. In February 2015, the Ed Specs were formally approved,allowing them to be used as benchmarks for the evaluation of existing facilities as well as informing futureproject plans.
MASTER PLAN SUPPORT P ROJECT
In 2014 it was determined that a Master Plan Support Project (MPSP) would be beneficial to assist thePGCPS’s Capital Programs staff in reviewing needs and prioritizing projects with the goal of establishing astrategic vision that creates an efficient and effective modernization program to address condition as well

PRINCE GEORGE’S COUNTY PUBLIC SCHOOLS MASTER PLAN SUPPORT PROJECT
B R A I L S F O R D & D U N L A V E Y I N S P I R E . E M P O W E R . A D V A N C E .1 . 3 . 4
as mission and function. The project team was engaged to provide services related to existing data reviewand synthesis, new data collection and analysis, and the prioritization and sequencing of projectrecommendations that include selective consolidations or closures, modernizations, minor renovations oradditions, and high quality maintenance to ensure exceptional learning environments for the district’schildren. As a result, the MPSP presented here recommends a comprehensive modernization programbased upon objective criteria and addressing PGCPS goals and objectives to for proactively improve itsschools to new standards. The MPSP is to be used by PGCPS to inform future state required formalcapital improvement plans and other local and state level planning documents.
MPSP: GOALS, PURPOSE, AND SCOPE
The Master Plan Support Project was established as a major planning study to evaluate existing data,collect new data on current conditions, and synthesize this information into recommendations for thedevelopment of a comprehensive program based on objective criteria.
PURPOSE AND GOALS
Overall, this data driven and goal oriented approach for the MPSP seeks to understand how PGCPS’sexisting facilities currently perform and what improvements need to be made across the school districtrelative to mission, condition, and function.
Mission
To inform what data is collected and how it is analyzed and synthesized, it is important to understand thestrategic goals and objectives of the school district. In other words, understanding PGCPS’s targeted newreality ensures data collected appropriately measure the gaps to achieving these goals and objectives. Thefoundation for this is the board of education’s safe and supportive schools goal and the PGCPS Departmentof Capital Programs’ mission to:
Deliver educationally-appropriate and correctly-sized facilities that preserve fiscalinvestments
Provide sustainable, safe, and healthy environments conducive to teaching and learning Support major academic initiatives conducive to high student achievement:
o Expand language immersion programso Expand pre-kindergarteno Implement career academieso Integrate special education services
The MPSP carefully integrated these goals and objectives into all assessments and considered themthroughout the synthesis and recommendation development process. The project team worked

SECTION 1.3 – BACKGROUND AND PURPOSE
J U N E 2 0 1 5 1 . 3 . 5
collaboratively with PGCPS staff and leadership as well as engaged with the community to ensure furtherunderstanding of these goals and objectives. Ultimately, a set of mission-based principles, logisticalconsiderations, and planning strategies were developed and applied to inform the project sequencing andprogram recommendations. MPSP will also be used to make decisions on school closures, boundarychanges, and other important planning recommendations.
Condition
Facility conditions are a significant factor in analyzing the capital program needs and addressing the overallgoal of safe and healthy environments conducive to teaching and learning. As such, they help inform whatsolutions are needed to bring existing systems to modernized, “like new” conditions. To support this factor,the project team reviewed and analyzed existing facility data from the 2012 Parsons Facility Report for thepurposes of developing a Weighted Facility Condition Index (WFCI) and informing projectrecommendations and program priorities.
Function
In addition to deteriorating conditions, over time buildings begin to no longer meet functional standards dueto changes in teaching styles and content, new technologies, and design standards. Thus, understandinghow facilities support their intended functions is also a critical consideration when analyzing capital programneeds. To support this factor, buildings were evaluated for educational adequacy, capacity, and utilization.
Educational adequacy evaluates buildings based on their ability to meet PGCPS educational programneeds. The project team performed educational adequacy assessments on schools built before 1999 andassessed room quantities, sizes and characteristics were evaluated against approved program specificstandards. Utilization specifically looks at existing space use and calculating State-Rated Capacity (SRC)and comparing to projected enrollments.
SCOPE SUMMARY
The facility evaluations and associated analysis provided the objective data needed to determine individualproject needs while PGCPS goals and initiatives provided the foundation for the development ofcomprehensive of planning strategies. Ultimately, the MPSP final report provides a process for prioritizingschool construction and renovation projects based upon the synthesis of the school condition andfunctionality data collected with the mission-based objectives enunciated by PGCPS and its stakeholders.

SECTION 1.4 – METHODOLOGY AND FINDINGS
J U N E 2 0 1 5 1 . 4 . 1
METHODOLOGY AND FINDINGS
Introduction
1.4.1: Weighted Facility Condition Index Methodology and Findings
o Methodology
o Findings
1.4.2: Educational Adequacy Methodology and Findings
o Methodology
o Findings
1.4.3: Utilization
o Methodology
o Findings
1.4.4: Project Definitions and Costs Methodology
1.4

PRINCE GEORGE’S COUNTY PUBLIC SCHOOLS MASTER PLAN SUPPORT PROJECT
B R A I L S F O R D & D U N L A V E Y I N S P I R E . E M P O W E R . A D V A N C E .
1 . 4 . 2
INTRODUCTION
The project team was charged with the synthesis of existing data as well as collecting new data for the
purposes of developing options and provide input to the establishment of priorities for the improvement of
PGCPS school facilities. Overall, this data-driven and goal oriented approach seeks to understand how
PGCPS’s existing facilities currently perform and what improvements need to be made across the school
district relative to mission, condition, and function.
With these factors driving the approach, PGCPS school facilities were assessed specifically for these
categories of need and the associated data helped inform the development of project recommendation and
comprehensive program based on objective criteria. This section provides a detailed review of the project
team’s approach for this data collection process, review, and assessment. Specifically, it reviews the
methodology and findings for the Weighted Facility Condition Index, Educational Adequacy, and Utilization
components of the MPSP.
DATA ORGANIZATION
To understand broader, countywide trends the project team consistently reviewed data by two
characterizations: region and school type. These characterizations of data are repeated throughout the
report and often are used as a basis of comparison.
REGION
The project team divided the county into three regions based on the established geographic planning areas
from the June 2014 Educational Facilities Master Plan (EFMP). These designations are loosely geographic
in nature and are referred to as the Northern Region, Central Region, and Southern Region.
SCHOOL TYPE
The inventory of school facilities includes neighborhood and regional schools. Enrollment at neighborhood
schools is based upon established boundaries. The project team characterized these schools further into
elementary, middle, and high schools. Regional schools have specific enrollment criteria that draw from
larger county geographical regions, and these schools are grouped separately from neighborhood schools.
For the purposes of this report, the project team generally did not further distinguish regional schools by
grade level. Regional schools are often denoted with an asterisk (*) within data tables.

SECTION 1.4 – METHODOLOGY AND FINDINGS
J U N E 2 0 1 5 1 . 4 . 3
METHODOLOGY
BACKGROUND
PGCPS completed a condition assessment of schools in 2001. The condition assessment data was
captured in Parsons’ proprietary software system, eCOMET. In 2012, Parsons performed an update of the
data in eCOMET. These updates incorporate the results of PGCPS projects funded or completed between
2001 and 2013 that would have remedied some of the facility deficiencies identified in the system from the
2001 effort. The Parsons assessment calculated a Facility Condition Index (FCI) as:
Current Cost of Repairs Replacement Value
The revised 2012 Parsons report calculated the total cost of PGCPS repairs at approximately $2.13 billion
and a replacement value at approximately $4.29 billion, for a system-wide average FCI of .50 – which is
more commonly reported as an FCI of 50.
PGCPS recognizes that the FCI quantifies deficiencies by the cost to replace or correct them without
considering some deficiencies are more difficult to correct, or have a greater impact on the school’s learning
environment. Therefore, PGCPS requested that the MPSP project team use the Parsons data to develop
and vet a Weighted FCI (WFCI) to consider health and safety, the degree to which corrections are readily
achievable in isolation (i.e. not in modernization or replacement), and other factors to be determined through
this assignment.
NORMALIZING THE DATA TO 2015
Projected facility system renewals identified in eCOMET for 2013-2015 were not originally included as
deficiencies exported by PGCPS to the project team and, therefore, did not impact reported FCI scores. It
was determined that these projected system renewals should be added to the export as deficiencies in
order to update the reported FCI scores to a baseline of 2015. It was also determined that any deficiencies
in the eCOMET export remediated by projects completed or funded in 2014-2015 were to be removed prior
to updating the FCI calculation.
PGCPS provided information on county- and state-funded projects for 2014-2015 that corrected some of
the existing deficiencies in eCOMET. The project team and PGCPS jointly reviewed these projects and
FCI =
S E C T I O N 1 . 4 . 1 W E I G H T E D F A C I L I T Y C O N D I T I O N S I N D E X

PRINCE GEORGE’S COUNTY PUBLIC SCHOOLS MASTER PLAN SUPPORT PROJECT
B R A I L S F O R D & D U N L A V E Y I N S P I R E . E M P O W E R . A D V A N C E .
1 . 4 . 4
made adjustments to existing deficiencies remedied by the project scope. In many cases, engineering
judgment was used to determine what deficiencies might be impacted by the scope of work provided, and
the accuracy of those adjustments are professional opinions based on the available information. The final
set of data used by the project team is more reflective of the current conditions than the 2012 eCOMET
data without any updates. The following are process notes that describe actions taken based on the project
data provided.
Additions to Deficiencies - Renewals Projected for 2013-2015
Using the report writing function in eCOMET, all the system renewal projections for 2013 -2015
were exported and added to the deficiency list for the associated building in the deficiency export.
Therefore, those renewals will increase the FCI for the associated buildings.
Budget Adjustment versus Complete System Replacement
If a project specifically stated the scope was a complete system replacement, the total dollar
amount in eCOMET for that system deficiency was deducted without regard to the project amount.
If a project did not specifically state it was replacing the complete system but the project dollar
amount was greater than the eCOMET, the full amount of the eCOMET deficiency was deducted.
If the project did not specifically state it was replacing the complete system but the project dollar
amount was significantly lower than the eCOMET deficiency amount, then only the project amount
for that deficiency was deducted. Completed systemic replacements will reduce the FCI for the
associated building.
Pod Conversions and Renovations
The project descriptions for pod conversions and renovations provided, for the most part, the
square footage of the impacted area and the building(s) associated with the work. The percentage
of the building impacted by the project was calculated by using the square footage of the project
and the associated square footage of the building. Deficiency amounts were reduced strictly based
on the percentage of square footage being renovated. Taking into consideration that the spaces
being modified were typically classrooms, the project team selected the deficiencies in the
Uniformat Codes that were likely impacted by the work. A reduction of each deficiency selected
was made based on the percentage of the project to the building (ex: 10,000 sq. ft. renovation of
100,000 sq. ft. building = 10%). These deficiency deductions did not necessarily reflect the project
budget however, completed projects will reduce the FCI for the associated building.

SECTION 1.4 – METHODOLOGY AND FINDINGS
J U N E 2 0 1 5 1 . 4 . 5
Projects with No Corresponding eComet Deficiency (Based on Uniformat Code)
There were instances where a project scope covered replacement of a system or systems but there
were no eCOMET exported deficiencies or system renewals before 2016 associated with the
project scope. Adjustments were not made to reflect those project scopes; therefore, no impact on
the 2015 FCI was identified.
No Specific Assets in eCOMET.
The Uniformat Codes provide a standard for categorizing components/systems of a constructed
asset. A building does not include all the assets on a campus. For example, a tennis court contains
some systems that are similar to a building, such as lighting, plumbing, fencing and pavements.
Recreational assets were not specifically addressed in eCOMET, so any of the 2014-2015 projects
associated with those types of assets were not addressed because those projects do not impact
the building’s FCI.
WEIGHTING METHODOLOGY
OVERVIEW
In parallel with the normalization of the eCOMET data to 2015, the project team analyzed attributes1
assigned to deficiencies in eCOMET to determine how they could be used in the WFCI process. It was
determined that two attributes from eCOMET data were reflective of criticality and appropriate for weighting
the FCI. These attributes are the deficiency category and the priority. It was also determined that additional
rating characteristics could be developed by analyzing their impact on learning and the difficulty of
repair/replacement of specific building elements based on their Uniformat Code. Using a scale of one-10,
ratings were assigned to priority, deficiency category, and Unifomat Codes/Assemblies (reflective of impact
on learning and difficulty of repair/replacement). These ratings were applied to the deficiency costs in
eCOMET, then normalized the data by weighting priority, deficiency category, impact on learning, and
difficulty of repair/replacement to calculate a WFCI.
eCOMET ATTRIBUTES
The project team began by reviewing output reports in PDF format from eCOMET that were provided by
PGCPS. The initial review identified three attributes that are assigned to each deficiency in eCOMET that
had the potential for use in the algorithm for the weighted FCI. These were deficiency category, distress,
1 The data attributes included in eComet were assigned by Parsons as part of the 2012 FCI update. Details are available in Parsons’ report at http://www1.pgcps.org/WorkArea/DownloadAsset.aspx?id=173390

PRINCE GEORGE’S COUNTY PUBLIC SCHOOLS MASTER PLAN SUPPORT PROJECT
B R A I L S F O R D & D U N L A V E Y I N S P I R E . E M P O W E R . A D V A N C E .
1 . 4 . 6
and priority. PGCPS provided direct access to eCOMET which enabled our team to export all deficiencies
in the system for PGCPS and perform some analysis. In reviewing the three attributes, the percent of the
total deficiency cost for each attribute was calculated as shown in the following figures:
Based on a review of these attributes and how they were used in the eCOMET data structure, it was
determined that the priority and distress attributes were synchronized, and separating them as criteria did
not provide any additional data clarification. Therefore, deficiency category and priority were the two
eCOMET attributes considered in weighting each of the deficiencies. The definition of the priority categories
is evident based on the descriptions provided in the figure above. The definitions of the deficiency
categories from eCOMET are:
ADA/Accessibility - System does not meet current accessibility Americans with Disabilities Act
(ADA) standards or does not provide adequate accessibility into, out of, or within a facility.
Appearance - System condition does not meet aesthetic expectations, quality of appearance, and
maintenance best practices.
ADA/Accessibility 1.74
Appearance 0.30
Building Integrity 0.67
Capital Renewal 6.17
Compliance 0.45
Critical Repair 0.00
Differed Maintenance 89.16
Environmental 1.05
Functional Adequacy 0.35
Renovation/Renewal 0.11
Deficiency Categories Percent
1. Critical/Immediate Need 0.16
2. Potentially Critical-12 months 0.05
3. Necessary - 2-5 years 96.88
4. Rocommended - 3-10 years 1.02
5. Does Not Meet Current Code/Standards 1.89
Priority Percent
FIGURE 1.4.1.1: Deficiency Categories, eComet
Beyond Useful Life 98.09
Damaged 0.01
Failing 0.04
Inadequate 1.85
Missing 0.00
Distress Percent
FIGURE 1.4.1.3: Priority Categories, eComet
FIGURE 1.4.1.2: Distress Categories, eComet

SECTION 1.4 – METHODOLOGY AND FINDINGS
J U N E 2 0 1 5 1 . 4 . 7
Building Integrity - System does not meet standards for building structure or envelope integrity.
Capital Renewal – Future renewal requirements for building systems as they reach the end of their
expected useful life. (The category of deferred maintenance is more commonly used.)
Compliance - System does not meet building or life safety code standards.
Critical Repair – System is non-functional and impacts overall building function or may impact
human safety.
Deferred Maintenance – System to be replaced because it is damaged, broken, inadequate,
beyond its service life, or needs remediation.
Environmental - System or component has issue regarding asbestos-containing building materials
(ACBM), indoor air quality (IAQ), chlorofluorocarbons (CFCs), poly-chlorinated biphenyls (PCBs),
lead-based paint, air quality, and/or water quality.
Functional Adequacy - System does not function as required for acoustics, lighting, temperature
control, and/or space/educational adequacy.
Renovation/Renewal – Projected system replacement updated to reflect renovation.
UNIFORMAT CODE WEIGHTING
The Uniformat II Code, which is the American Society for Testing and Materials (ASTM) standard for
classification of building elements and related site work, provides a hierarchy of organizing data in a building
at various levels of detail. The project team evaluated two other attributes assigned to each deficiency; the
Uniformat Code and the assembly name assigned in eCOMET. In eCOMET, deficiency information is
further defined by the assembly name that identifies the material or other information on the system or
component being replaced. The project team exported this information and identified all Uniformat Codes
and descriptions used in the eCOMET data at the deficiency level. This is provided in column A of Appendix
3.2.1.
Ratings were developed to reflect the difficulty of repair or replacement for each Uniformat Code or
assembly, as shown in column B of Appendix 3.2.1. An additional rating was also assigned to each
assembly reflecting the daily impact that the system/element of the building has on the education outcome,
which is referenced as Impact on Learning in column C. Using a scale of high / medium high / average/
medium low / low, ratings were assigned to impact on learning and difficulty of repair based on industry
studies, consultation with PGCPS educational and facilities representatives, and the project team’s
engineering experience. The following provides excerpted entries from Appendix 3.2.1:

PRINCE GEORGE’S COUNTY PUBLIC SCHOOLS MASTER PLAN SUPPORT PROJECT
B R A I L S F O R D & D U N L A V E Y I N S P I R E . E M P O W E R . A D V A N C E .
1 . 4 . 8
The rating for impact on learning was selected based on a planned repair or replacement and did not
consider an unscheduled failure because almost all complete failures would have a negative impact on the
learning environment. The rating is reflective of the consolidated opinions of members of the Facilities
Advisory Committee (FAC), based on two review meetings and a questionnaire provided to the group.
Appendix 3.2.2 provides the detailed questionnaire results from members of the FAC.
DEVELOPING THE WFCI
Applying the numerical value to the associated rating for each of the four attributes is the key component
to development of the WFCI. The ten deficiency categories made a rating scale of one-10 a logical method
of assigning ratings to each of the four attributes. Assigning the ratings for the 10 deficiency categories
required a review of the eCOMET data and the definitions of the categories used by the team that developed
FIGURE 1.4.1.4: Difficulty to Repair Rating

SECTION 1.4 – METHODOLOGY AND FINDINGS
J U N E 2 0 1 5 1 . 4 . 9
the eCOMET database. Because nearly 90 percent of the data is deferred maintenance, it was assigned
a rating of six, while critical repair, building integrity, environmental, and compliance were given higher
ratings. Appearance, capital renewal, and renovation/renewal rated at the lower end of the scale. The
deficiency category ratings are shown in Figure 1.4.1.5 below.
Assigning the numerical value for the priority attribute was evident by the descriptions provided; however,
the project team adjusted the rating for ‘Does Not Meet Current Code/Standards’ to be higher than
‘Recommended-3-10 Years’ based on a review of the data that identified that a majority of code/standard
deficiencies were related to ADA compliance. The impact on learning ratings were straightforward,
weighting high impact as a 10 and low impact a two. Difficulty of repair/replacement was rated as high as
10 and as low as two to reflect the disruptions anticipated in performing the work on the operation of the
school. The ratings for these three attributes are shown below in figures 1.4.1.6-8
Appearance 1
Capital Renewal 2
Renovation/Renewal 3
ADA/Accessibility 4
Functional Adequacy 5
Differed Maintenance 6
Environmental 7
Compliance 8
Building Integrity 9
Critical Repair 10
Deficiency Categories Rating
FIGURE 1.4.1.5: Deficiency Categories
Rating Scale
High 10
Medium High 8
Average 6
Medium Low 4
Low 2
Impact to Learning Rating
1. Critical/Immediate Need 10
2. Potentially Critical-12 months 8
3. Necessary - 2-5 years 6
4. Rocommended - 3-10 years 4
5. Does Not Meet Current Code/Standards 2
Priority Rating
FIGURE1.4.1.6: Impact to Learning Rating Scale
FIGURE 1.4.1.7: Difficulty of Repair/Replacement Rating Scale
High 10
Medium High 8
Average 6
Medium Low 4
Low 2
Difficulty of Repair/Replacement Rating
FIGURE 1.4.1.8: Priority Rating Scale

PRINCE GEORGE’S COUNTY PUBLIC SCHOOLS MASTER PLAN SUPPORT PROJECT
B R A I L S F O R D & D U N L A V E Y I N S P I R E . E M P O W E R . A D V A N C E .
1 . 4 . 10
The deficiency costs associated with the Uniformat systems in each of these attribute categories
was multiplied by the above rating values and summed for each building, then divided by 10 times
the total replacement value of the building to normalize the data. The figures below demonstrate
the process for a typical school building:
eCOMET Def Costs
Def Costs X Rating
eCOMET Def Costs
Def Costs X Rating
Total
Replacement Value of Building from 2012 eCOMET Data $13,857,756
FCI Adjusted = (Total Def Costs x Rating)/Replacement Value x 10) 0.22
$3,235,782 $6,388,568 $29,906,524
$539,297 $912,653 $8,073,448
Reno/Renew
10 6 7 5 3
$1,054,164 $6,723,571 $10,794,238 $1,710,201
RatingCritical Rpr Def Mant Environment Func Adq
1 9 2 8
$263,541 $747,063 $5,397,119 $213,775
FCI Adjusted for eCOMET Deficiency Category
Rating
Deficiency Category
ADA Appearance Bldg Intgr Cap Ren Compliance
4
5
4
$263,541
$1,054,164
Replacement Value of Building from 2012 eCOMET Data $13,857,756
FCI Adjusted = (Total Def Costs x Rating)/Replacement Value x 10) 0.35
Def Costs X Rating $46,859,444 $47,913,608
eCOMET Def Costs $7,809,907 $8,073,448
3 4
10 8 6 2
FCI Adjusted for eCOMET Priority
Rating
Priority
Total
1 2
High Med High Average Med Low Low
10 8 6 4 2
eCOMET Def Costs $1,105,024 $1,520,909 $1,761,499 $3,118,511 $567,505 $8,073,448
Def Costs X Rating $11,050,240 $12,167,274 $10,568,994 $12,474,045 $1,135,010 $47,395,563
$13,857,756
0.34
Replacement Value of Building from 2012 eCOMET Data
FCI Adjusted = (Total Def Costs x Rating)/Replacement Value x 10)
FCI Adjusted for Impact on Learning
Rating
Impact on Learning
Total
FIGURE 1.4.1.9: Deficiency category attribute weighting
FIGURE 1.4.1.10: Priority category attribute weighting
FIGURE 1.4.1.11: Impact on Learning category attribute weighting
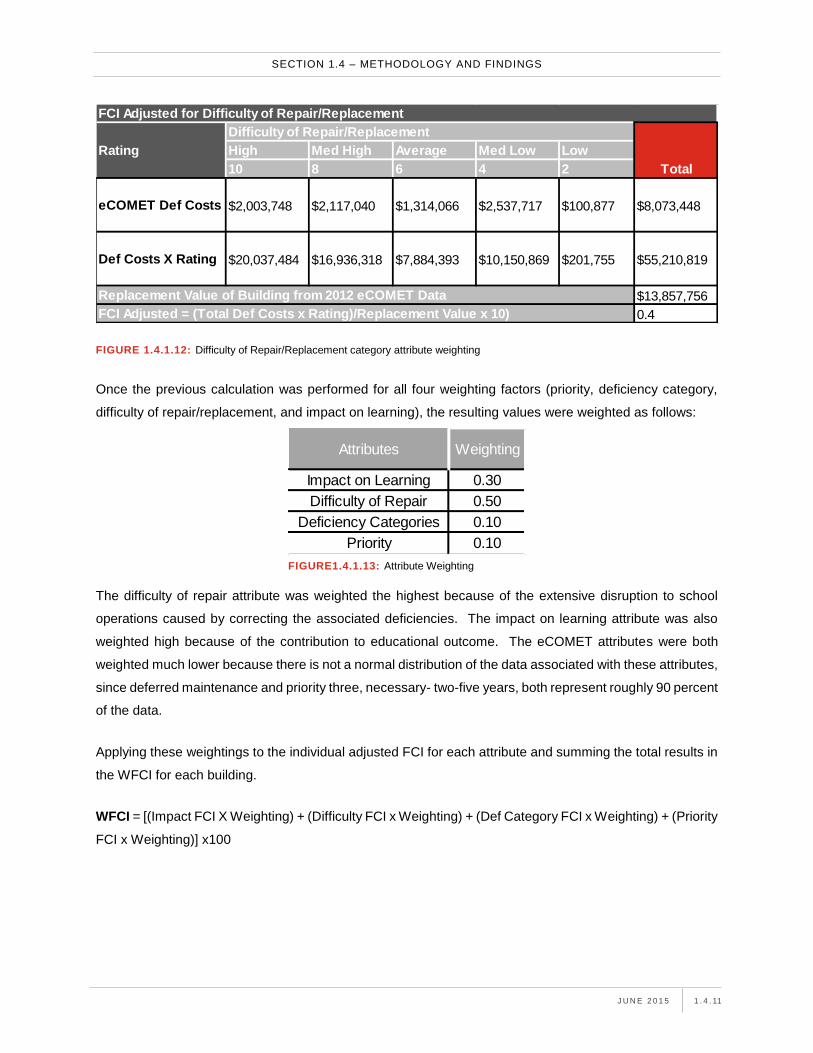
SECTION 1.4 – METHODOLOGY AND FINDINGS
J U N E 2 0 1 5 1 . 4 . 11
Once the previous calculation was performed for all four weighting factors (priority, deficiency category,
difficulty of repair/replacement, and impact on learning), the resulting values were weighted as follows:
The difficulty of repair attribute was weighted the highest because of the extensive disruption to school
operations caused by correcting the associated deficiencies. The impact on learning attribute was also
weighted high because of the contribution to educational outcome. The eCOMET attributes were both
weighted much lower because there is not a normal distribution of the data associated with these attributes,
since deferred maintenance and priority three, necessary- two-five years, both represent roughly 90 percent
of the data.
Applying these weightings to the individual adjusted FCI for each attribute and summing the total results in
the WFCI for each building.
WFCI = [(Impact FCI X Weighting) + (Difficulty FCI x Weighting) + (Def Category FCI x Weighting) + (Priority
FCI x Weighting)] x100
High Med High Average Med Low Low
10 8 6 4 2
eCOMET Def Costs $2,003,748 $2,117,040 $1,314,066 $2,537,717 $100,877 $8,073,448
Def Costs X Rating $20,037,484 $16,936,318 $7,884,393 $10,150,869 $201,755 $55,210,819
$13,857,756
0.4
Replacement Value of Building from 2012 eCOMET Data
FCI Adjusted = (Total Def Costs x Rating)/Replacement Value x 10)
FCI Adjusted for Difficulty of Repair/Replacement
Rating
Difficulty of Repair/Replacement
Total
Impact on Learning 0.30
Difficulty of Repair 0.50
Deficiency Categories 0.10
Priority 0.10
Attributes Weighting
FIGURE1.4.1.13: Attribute Weighting
FIGURE 1.4.1.12: Difficulty of Repair/Replacement category attribute weighting

PRINCE GEORGE’S COUNTY PUBLIC SCHOOLS MASTER PLAN SUPPORT PROJECT
B R A I L S F O R D & D U N L A V E Y I N S P I R E . E M P O W E R . A D V A N C E .
1 . 4 . 12
APPLICATION OF THE WFCI
The weighting formula was applied to 159 schools for which FCI data was made available. Generally, the
data was available for all schools constructed prior to 1999 and a complete list is provided in Appendix
3.2.3. As will be discussed in the subsequent section, weighting of the four attribute categories allowed the
project team to evaluate the impact the process had on the relative level of need at each school and to
further define and label building systems for the purpose of establishing project needs at each school.
WFCI PRIORITIZATION
After weighting the FCI scores, the schools were sorted by their WFCI scores and ranked from one-159,
with one having the highest WFCI score of all the schools and 159 having the lowest. Instead of ranking or
prioritizing the distribution of 160 schools one by one, or on a scale of one-100, the portfolio of schools was
prioritized in 25 separate groupings in order to align the results with the priority scores developed for
educational adequacy.
In order to normalize the distribution of the entire portfolio of WFCI scores evenly and in a statistically
significant manner, a scale of 0-53 was used because the lowest WFCI score for any school was 0.27 while
the highest was 52.94. Choosing this method divided the 159 schools into 25 groupings with the
expectations of each having an average of six-seven schools. However, to distribute the portfolio
quantitatively, the inverse function of a normal continuous probability distribution was used. Simply put,
each school’s WFCI score was compared to the WFCI scores of the entire portfolio, the portfolio mean, and
the portfolio standard deviation using a unique probability calculation for each of the 25 groupings.
Statistically speaking, this inverse function returned the appropriate WFCI score such that, with a specific
unique probability, a normal random variable using portfolio mean and portfolio standard deviation takes
on a value less than, or equal to, the specific WFCI score calculated using that probability. Using this syntax,
we first applied probabilities to each grouping and distributed the probabilities of each grouping according
to a bell-shaped curve, with the total area under the curve equal to one.
0.3 0.34 0.102
0.5 0.40 0.200
0.1 0.22 0.022
0.1 0.35 0.035
Total 0.0359
WFCI 36
58
Impact on Learning
Difficulty of Repair
Deficiency Categories
Priority
eCOMET FCI
Attributes Weighting Adjusted FCI Weighted
FIGURE 1.4.1.14: Example WFCI Calculation

SECTION 1.4 – METHODOLOGY AND FINDINGS
J U N E 2 0 1 5 1 . 4 . 13
To complete this exercise, the schools were placed into groupings by dividing the total area under the curve
(of 1.0) by 25, which created a new grouping every .04 or approximately every 2.12 increase or decrease
in WFCI score from 0.27 – 52.94 or (53/25). Once the 25 ranges were calculated, all 159 schools’ WFCI
scores were distributed into the grouping with the appropriate WFCI score range. The resulting placement
established the WFCI priority score for each school. The figure below shows the WFCI priority scores
associated with the WFCI score range groupings.
32.55-33.58 14
31.48-32.54 15
30.40-31.47 16
29.26-30.39 17
29.07-29.25 18
26.79-28.06 19
25.39-26.78 20
23.81-25.38 21
21.93-23.80 22
19.55-21.92 23
15.97-19.54 24
0.27-15.96 25
WFCI Score
Range
WFCI Priority
Score
52.25-52.94 1
48.67-52.24 2
46.29-48.66 3
44.41-46.28 4
42.83-44.40 5
41.43-42.82 6
40.15-41.42 7
38.96-40.14 8
37.82-38.95 9
36.74-37.81 10
35.67-36.73 11
34.63-35.66 12
33.59-34.62 13
WFCI Score
Range
WFCI Priority
Score
FIGURE1.4.1.15: WFCI priority scores based on associated WFCI score range groupings

PRINCE GEORGE’S COUNTY PUBLIC SCHOOLS MASTER PLAN SUPPORT PROJECT
B R A I L S F O R D & D U N L A V E Y I N S P I R E . E M P O W E R . A D V A N C E .
1 . 4 . 14
SUMMARY OF FINDINGS
PGCPS engaged the project team to apply a weighting factor to the 2012 Parson’s facility condition index
(FCI) scores for the purpose of better differentiating known systemic deficiencies and to then apply the
results into a rubric for the prioritization of future capital projects. The process used to weight the existing
facility condition data resulted in a weighted facility condition index (WFCI) score and a WFCI priority score
for each school. The WFCI score provides PGCPS with the ability to rank all schools from 1-159 based
strictly on an evaluation of the WFCI results. The WFCI priority score places the schools into a normalized
distribution of 25 groupings, allowing PGCPS to combine WFCI priority results with the educational
adequacy priority results (discussed in the subsequent section).
The data collected from PGCPS and that subsequently developed by the project team allows for a
comprehensive analysis of the WFCI scoring. This analysis will focus first on the impact and efficacy of the
WFCI methodology and, second, on the actual results county-wide and on a school-by-school basis.
WEIGHTING IMPACT AND EFFICACY Appendix 3.3.1 at the end of this report provides a comparison of the facility condition rankings for the 159
schools included in this analysis. Figures 1.4.1.16 and 1.4.1.7 below include a list of the 10 worst FCI and
WFCI scores, respectively. In both cases, Cherokee Lane Elementary School is listed as the school with
the worst overall score and eight of the 10 worst schools, based on FCI, remained in the top 10, based
upon WFCI.
As shown in the figures below, there is an even stronger correlation among the best scores with both the
FCI and WFCI having the same 10 schools listed and only one minor position change.
SCHOOL NAME Region2015 B&D
WFCI2015 Rank
Cherokee Lane ES North 47.99 1
Longfields ES Central 47.43 2
Robert Goddard
Montessori ES Regional 47.19 3
Clinton Grove ES South 47.17 4
*Margaret Brent Regional 46.62 5
Woodmore ES Central 45.99 6
Rose Valley ES South 45.87 7
*James E Duckworth
Regional Regional 45.83 8
Fort Washington
Forest ES South 45.63 9
Lamont ES North 45.6 10
SCHOOL NAME Region2012
Parsons FCI2012 Rank
Cherokee Lane ES North 73.2 1
*Margaret Brent Regional 72.4 2
Woodmore ES Central 71.8 3
Rose Valley ES South 71.8 4
*James E. Duckworth
Regional Regional 71.7 5
Clinton Grove ES South 70.8 6
Thomas Clagget ES Central 70.7 7
William Beanes ES South 70.5 8
Longfields ES Central 70.5 9
John Hanson
Montessori Regional 69.64 10
FIGURE 1.4.1.16: 10 highest Parsons FCI schools
FIGURE1.4.1.17: 10 highest B&D WFCI schools

SECTION 1.4 – METHODOLOGY AND FINDINGS
J U N E 2 0 1 5 1 . 4 . 15
When viewed comprehensively, weighting of the FCI appears to have had little impact on the average
ranking of schools when organized by school type and region. As shown in the chart below, the vast
majority of school types across all regions only showed an incremental change in the average rankings.
Only high schools in the Central Region showed a significant drop with an average decrease in rank of just
over five places.
However, averaging the results associated with changes in rank is misleading because the total value of
system deficiencies does not change, which means that for every positive change in system rank there
must be a balancing negative change. Data from our assessment proves this to be the case, as the sum
total of positive and negative rank changes across all schools balances out to zero2. In fact, 77 schools
had a negative rank change (rank lowered from 2012 FCI to 2015 WFCI) and 66 schools had a positive
2 Total positive rank changes totaled 428 and total negative rank changes total -428, as shown in Appendix 3.2.3.
SCHOOL NAME Region2012
Parson’s FCI2012 Rank
Oxon Hill HS South 0.43 159
Adelphi ES North 8.05 158
Carmody Hills Central 10.2 157
Laurel ES North 12.74 156
Doswell E. Brooks
ES Central 13.97 155
Berwyn Heights ES North 15.02 154
Bradbury Heights ES Central 19.42 153
Carole Highlands ES North 22.48 152
Greenbelt MS North 25.05 151
Dodge Park ES Central 26.73 150
SCHOOL NAME Region2015 B&D
WFCI2015 Rank
Oxon Hill HS South 0.3 159
Adelphi ES North 4.9 158
Carmody Hills Central 6.4 157
Laurel ES North 8.6 156
Doswell E. Brooks
ES Central 9 155
Berwyn Heights ES North 9.5 154
Bradbury Heights ES Central 10.9 153
Carole Highlands ES North 14 152
Dodge Park ES Central 16.7 151
Greenbelt MS North 16.9 150
FIGURE 1.4.1.19: 10 lowest B&D WFCI schools
FIGURE 1.4.1.18: 10 lowest Parsons FCI schools
FIGURE 1.4.1.20: Average change in ranking

PRINCE GEORGE’S COUNTY PUBLIC SCHOOLS MASTER PLAN SUPPORT PROJECT
B R A I L S F O R D & D U N L A V E Y I N S P I R E . E M P O W E R . A D V A N C E .
1 . 4 . 16
rank change. Therefore, it is more important to look at the quantity of rank changes taking place and
evaluate which schools, or school types, had the most significant changes.
The data show that nearly 91% of the 159 schools to which the WFCI was applied moved at least one
ranking position. Of greater significance is the fact that over 45% of schools moved five or more places in
the rankings and just under 20% moved 10 or more places. Furthermore, application of the weighting
algorithm to the FCI scores impacted all school types in all regions. As shown in figure 1.4.1.21 below,
there were schools that made significant moves upward or downward in the rankings across all school
types and in all regions of the county, with the most significant negative moves in Central Region middle
schools and the most significant positive moves predominantly in elementary schools across the district.
This means that application of the weighting factors to the existing FCI data was effective in causing broad
re-prioritization of the schools, regardless of type or region.
WFCI RESULTS
An evaluation of WFCI scores by region shows that, on average, regional schools have the most significant
facility-condition-related concerns, followed by schools located in the Southern and Central Regions.
Northern Region schools have the lowest average WFCI scores, meaning that facility condition concerns
are less prevalent there than in the other regions. To further underscore the previously-discussed impact
of weighting the FCI, figure 1.4.1.22 shows that a WFCI places greater emphasis on Southern Region
schools than did the FCI, indicating that schools in this region have a greater concentration of building
deficiencies in systems with the prioritized attributes3 than do schools in the other regions.
3 From the previous section Impact on Learning, Difficulty to Repair, Deficiency Category, and Priority.
FIGURE 1.4.1.21: Ranking change movement summary

SECTION 1.4 – METHODOLOGY AND FINDINGS
J U N E 2 0 1 5 1 . 4 . 17
A closer examination of the WFCI scores shows that regional schools, regardless of type, and Southern
Region middle schools have the highest WFCI scores. Central Region middle schools and elementary
schools in the Southern Region represent the next highest grouping of average WFCI scores. Middle
schools in the Northern Region, on the other hand, have by far the lowest average WFCI scores in the
county, and elementary and high schools in the north also average among the lowest WFCI scores.
Although these results are only averages, and individual WFCI scores vary widely, it is important to
recognize that regional schools are on average in worse condition than other school types and that the
Southern Region has a higher concentration of schools with high priority facility condition needs than do
the Central or Northern Regions of the county.
FIGURE 1.4.1.22: Average FCI and WFCI scores by region (all school types)
FIGURE 1.4.1.23: Average WFCI scores by region and school type

PRINCE GEORGE’S COUNTY PUBLIC SCHOOLS MASTER PLAN SUPPORT PROJECT
B R A I L S F O R D & D U N L A V E Y I N S P I R E . E M P O W E R . A D V A N C E .
1 . 4 . 18
As discussed previously, the WFCI scores for all schools were distributed into 25 statistically-balanced
groupings in order to establish a WFCI priority score for the purpose of combining the WFCI results with
the educational adequacy results. As shown below, the WFCI priority scores are strongly correlated,
although inversely4, to the WFCI scores. Regional schools and middle schools in the Southern and Central
Regions have the lowest priority scores while Northern Region schools along with Southern Region high
schools have the highest WFCI priority scores.
For the purpose of better understanding what is driving the higher WFCI scores at certain schools, the
project team also evaluated the percentage of building deficiencies concentrated in systems with high
ratings in the difficulty of repair and impact on learning attributes. As summarized in the figure below, the
team labeled building systems with difficulty of repair and impact on learning ratings greater than six (6) as
the highest priority. Systems with a difficulty of repair rating greater than six (6) but an impact on learning
rating equal to, or less than, six (6) were labeled as difficult to repair/replace. Systems with a difficulty of
repair less than six (6) and an impact on learning greater than six (6) were labeled as impact on learning.
4 Lower WFCI priority scores indicate worse building conditions. A priority of one is a lower score and represents worse facility
conditions than a priority of 25.
FIGURE 1.4.1.24: WFCI scores and WFCI priority scores by region and school type

SECTION 1.4 – METHODOLOGY AND FINDINGS
J U N E 2 0 1 5 1 . 4 . 19
The project team was careful to ensure there were no systems overlapping groups. All systems that did not
fit into these categories were labeled as Other.
As expected, schools with the greatest concentration of deficiencies in the highest priority, difficulty of
repair, and impact on learning categories also had the highest WFCI scores. Middle schools in the Southern
Region, which are already noted as having the highest WFCI scores, have by far the greatest concentration
of deficiencies in the highest priority systems in addition to having the highest concentration of deficiencies
in systems with high impact on learning and difficulty to repair ratings. Similarly, northern schools, which
have the lowest WFCI scores, have the lowest concentration of deficiencies in the highest priority systems.
Other important considerations identified in the figure below include:
Despite low overall average WFCI scores, high schools in the south have a high concentration of
their deficiencies in systems that are labeled difficult to repair. This could have significant
implications on final project recommendations for schools in this region (discussed in a later
section).
The high WFCI scores in Central Region middle schools appear to be driven predominantly by a
high concentration of deficiencies in systems that have an impact on the learning environment. It
is probable that these schools will have correlated educational adequacy problems.
>6 >6 >=6 >=6
>6 <=6 >=6 >=6
<6 >6 >=6 >=6
Group Name
Highest Priority
Difficulty Repair/Replacement
Impact on Learning
Other/Rest Other/Rest
System Grouping HP
System Grouping DRR
System Grouping IMP
System Grouping OTH
GroupsDifficulty
of Repair
Impact on
LearningDeficiency Priority
FIGURE1.4.1.25: Building System Rating Priority
FIGURE 1.4.1.26: Ranking change summary

PRINCE GEORGE’S COUNTY PUBLIC SCHOOLS MASTER PLAN SUPPORT PROJECT
B R A I L S F O R D & D U N L A V E Y I N S P I R E . E M P O W E R . A D V A N C E .
1 . 4 . 20
SUMMARY OF FINDINGS
1. Weighting of the 2012 FCI data had a significant impact on the relative ranking of schools based
on facility conditions, causing 92% of schools to move at least one spot in the rankings and 17% to
move 10 or more places. This indicates that the weighting process was effective in differentiating
schools based on their unique system deficiency profiles.
2. On average, regional schools have the highest WFCI scores, followed closely by schools in the
Southern and Central Regions. Northern Schools, on average, have the lowest WFCI scores.
3. All regional schools, regardless of type, in addition to middle schools in the Southern and Central
Regions, have the highest average WFCI score, indicating a higher overall level of facility condition
needs.
4. Concentrations of deficiencies in high priority systems are linked to higher WFCI scores and several
school types have concentrations of deficiencies in systems that are difficult to repair. This has
significant implications on the types of projects that must be undertaken to correct the problems.

SECTION 1.4 – METHODOLOGY AND FINDINGS
J U N E 2 0 1 5 1 . 4 . 21
METHODOLOGY
INTRODUCTION
An educational adequacy assessment is the evaluation of a school facility’s ability to support defined
standards as outlined in the district’s educational specifications. The assessment details the degree to
which a school facility can provide and support educational functions that meet the district’s mission, goals,
and standards for learning environments. It identifies local needs and develops a gap analysis that
compares existing facility conditions to the ideal standards and provides a score for each component. These
scores inform one part of the methodology used by the project team to make modernization
recommendations.
The overall educational adequacy score is comprised of three components: the campus, the individual, and
the space adequacy scores. The following information provides a summary of the methodology used to
formulate the educational adequacy score. The methodology includes data collection, building
assessments, prioritization of data, generation of educational adequacy scorecards, and creation of project
write-ups based on the scorecards. An overall analysis of the results is included at the end of this section.
EDUCATIONAL SPECIFICATIONS
In February 2015 the district approved educational specifications (Ed Specs) for both primary and
secondary schools. As stated by the district, Ed Specs are designed to “clearly describe the various learning
activities to be housed in the school, their spatial requirements, appropriate locations within the building or
the site, and any special requirements that a designer or a facility planner would need to consider.” The
district also states the specifications should “serve as the link between the educational program and school
facilities.”
The project team used the Ed Specs, along with PGCPS administrative support, to develop a customized
educational adequacy survey for primary and secondary schools, which included campus and individual
space assessments. Schools were evaluated against the appropriate survey based on school type. Certain
schools, such as Pre-K-8 or those housing regional specialty programs, do not fall into a specific category,
so they were assessed using a combination of both surveys.
S E C T I O N 1 . 4 . 2 E D U C A T I O N A L A D E Q U A C Y

PRINCE GEORGE’S COUNTY PUBLIC SCHOOLS MASTER PLAN SUPPORT PROJECT
B R A I L S F O R D & D U N L A V E Y I N S P I R E . E M P O W E R . A D V A N C E .
1 . 4 . 22
DATA COLLECTION AND SCORECARD GENERATION
Over the course of nine weeks, six survey teams performed campus and individual space assessments at
163 schools, collecting nearly 627,000 data points that drive the educational adequacy scoring. During each
site tour and individual space assessment, teams would spend a few minutes asking principals and
teachers about interior air quality and heating and air conditioning systems performance. They typically
asked if there was any other pertinent information they wanted to share. This information allowed teams to
gather additional data not apparent by initial observation.
Each team observed environmental context clues while touring, such as windows open during the winter
because the unit heaters were overheating the space or posters, paint, and papers peeling off walls
because of recurring humidity issues. Typically, teams would speak with administrative staff to discuss site
circulation and other features not readily obvious when walking the school.
The project team used QuickTap Survey software to collect data during the site walks. The survey was pre-
loaded onto iPads, which were then issued to the assessment teams. The survey software allowed the
assessor to choose one of the following three responses for each survey question:
Yes: The space fully meets the
requirements of the Ed Specs.
Some: The space meets some of the
requirements of the Ed Specs.
No: The space does not meet the
requirements of the Ed Specs.
The assessor performed the individual space
assessment, detailed below, for each learning space.
To maximize the functionality of the tool, some survey
questions did not apply to all learning spaces. If they
did not, the assessor left these questions blank. Blank
answers did not influence the educational adequacy
final result.
All data were uploaded to a single server and used to
generate a school-specific educational adequacy
priority scorecard. The scorecard was calculated by
rating each campus and individual space
subcomponent as excellent, satisfactory, borderline,
poor, or deficient. An example scorecard is shown in
Figure 1.4.2.1. FIGURE 1.4.2.1: Educational Adequacy Scorecard

SECTION 1.4 – METHODOLOGIES AND FINDINGS
J U N E 2 0 1 5 1 . 4 . 23
SCHOOL-SPECIFIC REPORTS
Using the scorecard data, the team wrote a brief report that documented the results. The reports focused
specifically on any subcomponent earning a rating of deficient, poor, or borderline. Under each rating, the
assessor described negative attributes of that subcomponent only in order to focus solely on areas of
concern. Each of the 163 schools assessed by the project team was documented in this manner.
The write-ups were created to document critical information that could only be observed in person. Many
assessors reported similar findings; therefore, to provide consistency across all reports, the project team
developed common phrases to describe similar observations. All write-ups are included with the planning
area reviews in Volume Two of this report.
CAMPUS AND INDIVIDUAL SPACE ASSESSMENTS
As mentioned in the introduction, the educational adequacy score is comprised of three components: the
individual, campus, and space adequacy priority scores. All ratings are based solely on the district-approved
survey questions. The full survey is located in Appendix 3.2.5.
CAMPUS ASSESSMENTS
The campus assessment is an evaluation of the entire school building and site based on the requirements
outlined in the educational specifications. There are six subcategories for this assessment:
1. Site circulation and accessibility: Assesses vehicular and pedestrian accessibility of the building
and site. This includes evaluating areas of the building that were inaccessible for a person with a
physical disability and whether bus and passenger vehicles have separate and dedicated loading
and unloading zones.
2. Exterior spaces: Evaluates the outdoor playfields and equipment. It assesses if the school is
equipped with age-appropriate equipment and adequately-sized fields, as defined in the Ed
Specs.
3. Building configuration: Evaluates if the building’s organization is appropriate and effective
compared to the clearly defined space adjacencies and proximity relationships from the Ed
Specs. This section also assesses if spaces intended for community use can be physically
isolated from the rest of the building to prevent unauthorized after-hours access.
4. Corridor and common space configuration: Reviews corridor spaces throughout the building and
evaluates if they have the proper equipment, fixtures, lighting, and informal learning space.

PRINCE GEORGE’S COUNTY PUBLIC SCHOOLS MASTER PLAN SUPPORT PROJECT
B R A I L S F O R D & D U N L A V E Y I N S P I R E . E M P O W E R . A D V A N C E .
1 . 4 . 24
5. Technology and supporting infrastructure: Evaluates each school’s technological infrastructure.
The project team received this data from the information technology department of Prince
George’s County Public Schools.
6. Safety and security: Evaluates the physical equipment and technology installed at the school. The
team reviewed for exterior light fixtures, exterior cameras, an easily-identifiable main entrance,
secure exterior doors with appropriate locking hardware, blinds on exterior windows, interior
lockable classroom doors, and a phone-intercom system in all instructional and support areas.
INDIVIDUAL SPACE ASSESSMENTS
The individual space assessment evaluates some similar characteristics as the campus assessment, but
at an individual space level. The individual space assessment questions are the same for primary and
secondary schools; however, the space type classifications vary between the primary and secondary
schools.
Secondary schools have wider varieties of capacity-driving spaces, such as band, science, and fitness
rooms. At the primary level, the capacity-driving spaces are grade level classrooms and self-contained
special needs spaces. The project team defines capacity-driving spaces the same way the State Board of
Education does for purposes of calculating State-rated Capacity. Specialty spaces only exist in primary
schools. Specialty spaces in a primary school include the gymnasium, music art, and the like. Shared
spaces in all schools are comprised of spaces such as the larger assembly areas, computer labs, and
resource rooms.
The six subcategories for the individual space assessment include:
1. Internal organization and ancillary spaces: Evaluates the basic physical infrastructure and size of
each space, along with the presence of required ancillary spaces or adjacencies. Typical
infrastructure evaluated included the presence of sinks and bathrooms in the primary rooms
2. Furnishings: Evaluates basic fixed and loose furnishings required for each space. Types of fixed
furnishings include cubbies, cabinets, tack or marker boards, and shelving.
3. Lighting quality: Evaluates a space’s natural and artificial lighting qualities. The presence of
windows with exterior views and levels of lighting control are noted.
4. Acoustics: Evaluates how well the space mitigates internal and external noise. Window air
conditioning units, unit ventilators, HVAC systems, or lighting systems can all be sources of
internal noise. An external noise assessment typically evaluates how well the space is insulated
from noise from adjacent spaces

SECTION 1.4 – METHODOLOGIES AND FINDINGS
J U N E 2 0 1 5 1 . 4 . 25
5. Air quality: Evaluates if the room temperature is comfortable and controllable, if there are
adequate amounts of fresh air, and if there are any noticeable humidity or moisture issues.
6. Room technology and supporting infrastructure: Evaluates the presence of an interactive
whiteboard, audio-visual equipment, and sufficient power and data outlets to support the space’s
program requirements.
The project team conducted the individual space and campus assessments described above to determine
educational adequacy compliance. Comprehensive inspections or facility audits performed by qualified
professionals in numerous disciplines may be required to understand fully the physical condition of any
school.
CALCULATING SPACE ASSESSMENT ADEQUACY SCORES
Campus and individual space assessments evaluate the compliance of existing spaces to the educational
specifications. The adequacy score is calculated as a percent compliant out of a total possible score by
subsection. Each question has a possible score of one, three, or five points. These scores relate,
respectively, to “No,” “Some,” and “Yes” responses made by the assessor. As mentioned in the previous
section, blank answers do not affect the assessment scores. The assessment populates both a score per
classroom and a score per subcomponent.
Example 1: Fixed Furnishings Category
In the example shown in Figure 1.4.2.2, three questions apply to classroom 207. With a
maximum five-point score, the total possible score for this classroom is 15 (3 x 5 = 15).
The same is true for classroom 208.
Yes - 5 Yes - 5 Yes - 5 15 15
Yes - 5 No -1 Some - 3 15 9
Some - 3 Yes - 5 Blank 10 8
TOTAL 40 32
80%
Fixed Furnishing
Educational Adequacy Score:
208
209
Total
Earned
207
Classroom
Marker boards and
tackable wall surfaces
are provided as required.
Fixed furniture and equipment such as
cubbies, base/wall cabinets, itinerant
stations, and other specialty equipment
is provided as required.
Loose furnishings provided
support the programmatic
requirements identified within
the Ed Specs.
Total
Possible
FIGURE 1.4.2.2: Example Assessment Scores

PRINCE GEORGE’S COUNTY PUBLIC SCHOOLS MASTER PLAN SUPPORT PROJECT
B R A I L S F O R D & D U N L A V E Y I N S P I R E . E M P O W E R . A D V A N C E .
1 . 4 . 26
Question three does not apply to classroom
209; therefore, the maximum possible points
is ten (2 x 5 = 10).
The total points possible are 40 (15 + 15 + 10
= 40).
The total points earned are 32. The resulting
score is 80% (32 / 40 = 80%).
Adequacy scores range from 0% to 100%, with 0% being
the worst, meaning the space is not compliant with any of
the educational specifications requirements. Figure 1.4.2.3
explains the five ratings based on the adequacy scores
earned.
SPACE ADEQUACY ASSESSMENT
The space adequacy assessment compares the number of learning spaces and total square footage of
those learning spaces to the requirements set in the Ed Specs. This score is calculated as the percentage
of space compliant out of the total space required. Space adequacy is measured in three categories:
capacity-driving spaces, specialty spaces, and shared spaces. Space adequacy illustrates if a school has
too many or too few classrooms, and indicates if those spaces are too small or large.
The following examples depict an elementary school with too few capacity-driving spaces and a lack of total
square footage to support its program requirements. This example displays a space adequacy score of
71%, meaning that only 71% of the required space exists in the building’s current configuration.
Room Type
Capacity-Driving Qty Total SF Qty Total SF Qty Total SF
Pre-Kindergarten 3 3525 5 4686 -2 -1161
Kindergarten 4 4700 6 5572 -2 -872
1st Grade 4 3800 6 5078 -2 -1278
2nd Grade 4 3800 3 2211 1 1589
3rd Grade 4 3800 4 2934 0 866
4th Grade 4 3600 3 2383 1 1217
5th Grad 4 3600 0 0 4 3600
Special Education - Self Contained 3 2700 0 0 3 2700
Generic Classroom 3 2700 0 0 3 2700
Subtotal 33 32,225 27 22,864 6 9,361
Existing Spaces Difference
Percent of Ideal
71%
Required Spaces
Excellent 89.5 100%
Satisfactory 69.5 89.49%
Borderline 45.5 69.49%
Poor 29.5 49.49%
Deficient 0 29.49%
Campus and Individual Space Assessment Ratings
Rating Range A Range B Color Key
FIGURE 1.4.2.3: Campus and Individual Space
Assessment Rating Scale
FIGURE 1.4.2.4: Example Space Adequacy Calculation

SECTION 1.4 – METHODOLOGIES AND FINDINGS
J U N E 2 0 1 5 1 . 4 . 27
A space adequacy score can be greater than 100%, which indicates a school has excess space. A score
of 0% is the worst, meaning the space is not compliant with any of the Ed Specs. Figure 1.4.2.5 delineates
the five ranges of scores.
PRIORITY SCORING
Although the educational adequacy component scores do provide a direct assessment of a facility’s
compliance with the Ed Specs, they do not establish an effective means by which to prioritize one
component or, for that matter, any of its subcomponents. An additional step was taken to establish a
prioritization of the subcomponents - that is, to determine, for example, if a deficiency in lighting quality is
of greater importance than, say, a deficiency in air quality. To establish priority scores for each of the three
educational adequacy components, the project team applied a level factor to the previously-established
ratings categories (excellent to deficient). The following five level factors were developed in close
consultation with PGCPS leadership to ensure the priorities were closely aligned with the district’s goals
and objectives. The priority levels decrease in importance, with level one being the most important and
level five the least.
Level 1: All items or elements that affect life safety and/or in need of critical repair
Level 2: All items or elements that affect building capacity and utilization
Level 3: All items or elements that are essential to the learning environment
Level 4: All items or elements that enhance but are not essential to the learning environment
Level 5: All other items or elements not included in levels 1 -4
The project team, again in close consultation with PGCPS leadership, then applied the levels to each of the
educational adequacy subcomponents as follows:
Excellent 100 100%+
Satisfactory 90 99.90%
Borderline 80 89.90%
Poor 60 79.90%
Deficient 0 59.90%
Space Aadequacy Rating
Rating Range A Range B Color Key
FIGURE 1.4.2.5: Space Adequacy Rating Scale

PRINCE GEORGE’S COUNTY PUBLIC SCHOOLS MASTER PLAN SUPPORT PROJECT
B R A I L S F O R D & D U N L A V E Y I N S P I R E . E M P O W E R . A D V A N C E .
1 . 4 . 28
The final step in establishing the priority score for each of the subcomponents is to combine the level factor
with the rating category. Priority scores can range between one and 25, with one indicating the highest level
of urgency and 25 the lowest. The scoring is explained visually in Figure 1.4.2.9, below. If, for example, a
subcomponent receives a rating of deficient and is a priority level four, the priority score for that component
is four. However, a subcomponent with a rating of satisfactory and a priority level of four would receive a
priority score of 19.
The priority score for each educational adequacy component (campus assessment, individual spaces, and
space adequacy) is simply an average of its respective subcomponent priority scores. Similarly, the overall
educational adequacy priority score is simply an average of the priority scores for each of the three main
components.
Sub-category Level
Site Circulation and Accessibility 1
Exterior Spaces 2
Building Configuration 2
Corridor and Common Space Configuration 4
Technology and Supporting Infrastructure 2
Safety and Security 1
Component 1: Campus Assessment
Capacity-Driving Spaces Specialty Spaces Support and Admin Spaces Shared Spaces
Level Level Level Level
Internal organization and ancillary spaces 3 5 -2 -2
Furnishings 4 6 -2 -2
Lighting quality* 4 6 -2 -2
Acoustics* 4 3 1 1
Air Quality* 4 4 0 0
Room technology and supporting infrastructure 4 3 1 1
Component 2: Individual Space Assessment
Sub-category
FIGURE 1.4.2.6: Campus Assessment Priority Levels
FIGURE 1.4.2.7: Individual Spaces Assessment Priority Levels
Sub-category Level
Capacity-Driving Spaces 1
Specialty Spaces 2
Shared Spaces 2
Support and Admin Spaces 4
Component 3: Space Adequacy
FIGURE 1.4.2.8: Spaces Adequacy Priority Levels
FIGURE 1.4.2.9: Level Factor

SECTION 1.4 – METHODOLOGIES AND FINDINGS
J U N E 2 0 1 5 1 . 4 . 29
SUMMARY OF FINDINGS
This section provides a summary of results from the educational adequacy assessment. The primary metric
available for analysis is the overall educational priority, which is composed of three separate comprehensive
scores: campus priority, individual space priority, and space adequacy priority. All three scores are
calculated based on existing facility conditions, and space adequacy results are formulated based on school
year 2020 projected student enrollments.
The summary results are presented by school type and region. School types include grade configuration
distinction (i.e., ES, MS, or HS) and geographic region. All Pre-K through eight schools are included in the
elementary results. All regional schools are shown as an independent group. These schools draw students
from around the county, thus their scores should not be averaged into the region where they reside.
RESULTS
EDUCATIONAL ADEQUACY PRIORITY BY TYPE AND REGION
Figure 1.4.2.10 illustrates that the range of average educational adequacy priority scores for most school
types is 14 – 15, with regional high schools being the notable outlier with an average priority score of 11.
Based on the established rating scale, this range of priority scores indicates that PGCPS schools, on
average, have borderline educational adequacy. The concentration of average scores around a center
point is statistically predictable when working with such a massive collection of data, and the borderline
rating indicates that there are numerous individual stories to be told. The project team witnessed many
schools with several very strong features and only one or two deficiencies, and many with the reverse
FIGURE 1.4.2.10: Average Educational Adequacy Priority Scores

PRINCE GEORGE’S COUNTY PUBLIC SCHOOLS MASTER PLAN SUPPORT PROJECT
B R A I L S F O R D & D U N L A V E Y I N S P I R E . E M P O W E R . A D V A N C E .
1 . 4 . 30
FIGURE 1.4.2.12: Average Educational Adequacy and Component Priority Scores
condition. The priority scores for individual schools ranged from 10 to 19 which supports observations in
the field.
Schools receiving the 10 lowest and highest educational adequacy priority scores are included in the figures
below and a complete list of all scores is included as Appendix 3.2.6.
The variation at the school level makes it important to understand how scoring among the regions and
school types differs for each of the three educational adequacy components. Figure 1.4.2.12 provides an
overview of the average educational adequacy component scores and shows how different the composition
of the average educational adequacy priority scores can be.
FIGURE 1.4.2.11: School with the 10 Lowest and Highest Priority Scores
School NameEA Priority
ScoreSchool Name
EA Priority
Score
*Annapolis Road Academy Alternative HS 10 *H Winship Wheatley ECC 19
*Tall Oaks Vocational HS 10 Andrew Jackson Academy 19
William Paca ES 10 Benjamin D. Foulois Academy 18
*Croom HS at RICA 11 Benjamin Tasker MS 18
Beacon Heights ES 11 Eleanor Roosevelt HS 18
Glenn Dale ES 11 Gwynn Park MS 18
John H. Bayne ES 11 Kenmoor MS 18
Kettering MS 11 Patuxent ES 18
Nicholas Orem MS 11 Robert Frost ES 18
Phyllis E. Wiliams ES 11 Robert Goddard Montessori ES 18
Samuel Chase ES 11 Scotchtown Hills ES 18
10 Highest EA Priority Scores10 Lowest EA Priority Scores

SECTION 1.4 – METHODOLOGIES AND FINDINGS
J U N E 2 0 1 5 1 . 4 . 31
Central Region elementary schools, for example, have an overall priority score of 15 and component scores
that are all in the 14 – 16 range. Middle schools in the Southern Region, on the other hand, also have an
overall priority score of 15 but have component scores ranging from 12 to 18. Figure 1.4.2.12 also shows
that regional high schools generally have the lowest overall educational adequacy scores, driven primarily
by deficient space adequacy scores. The data also reveal that, on average, Northern Region elementary
and middle schools have the lowest space adequacy priority scores and that Southern Region schools,
particularly at the secondary level, have the highest space adequacy scores. These findings are likely
correlated to school utilization rates which are discussed in a separate section.
Aside from the noticeable variation in average space adequacy scores, averages among the other
educational adequacy components are generally clustered around the 15-16 range, which indicates a need
to more closely evaluate the scores that comprise the campus-wide assessment and individual space
assessment priority scores.
CAMPUS ASSESSMENT PRIORITY SCORES
The initial review of campus assessment priority scores indicates that average scores range from 12 to 16
across the district. The variation of average scores within a region is not significant enough to identify the
greatest needs. The same is true when assessing by school type.
Since the averages of campus assessment priority scores are so closely clustered, it is beneficial to go
deeper into the data and look at the component scores to see a more detailed picture of a school’s
conditions. The data summarized in Figure 1.4.2.14 highlights the scores for particular components of the
evaluation by region and school type.
FIGURE 1.4.2.13: Average Campus Assessment Priority Scores
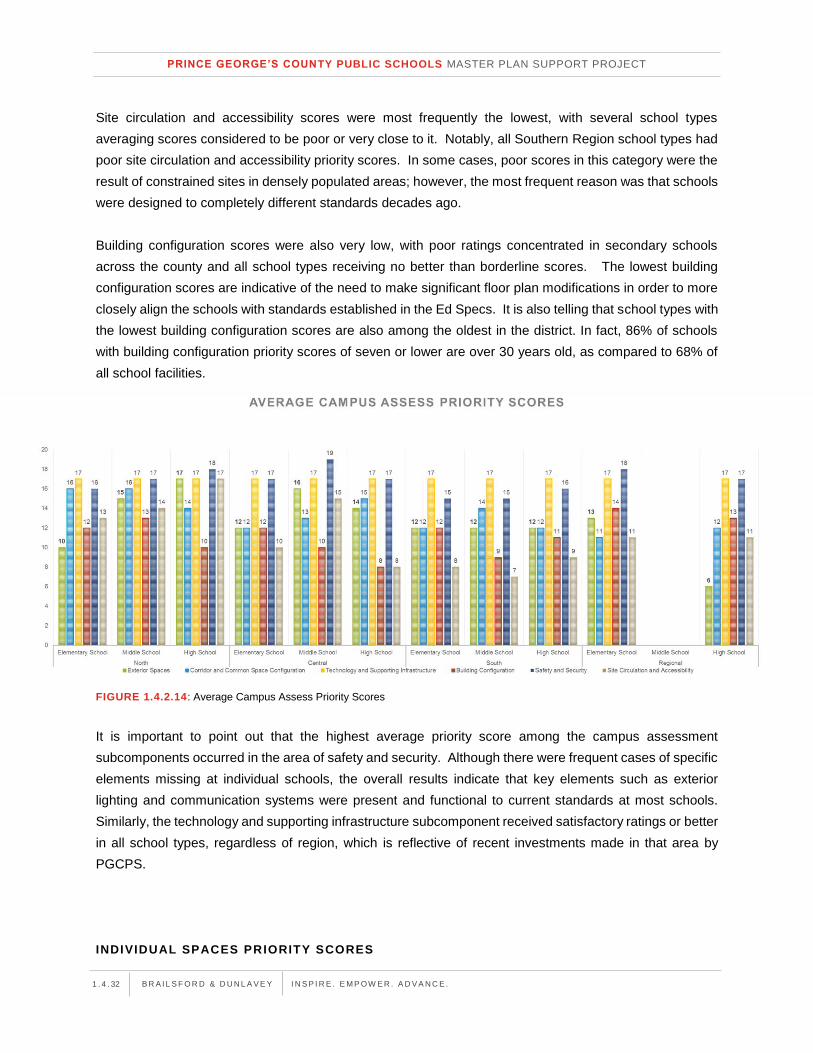
PRINCE GEORGE’S COUNTY PUBLIC SCHOOLS MASTER PLAN SUPPORT PROJECT
B R A I L S F O R D & D U N L A V E Y I N S P I R E . E M P O W E R . A D V A N C E .
1 . 4 . 32
Site circulation and accessibility scores were most frequently the lowest, with several school types
averaging scores considered to be poor or very close to it. Notably, all Southern Region school types had
poor site circulation and accessibility priority scores. In some cases, poor scores in this category were the
result of constrained sites in densely populated areas; however, the most frequent reason was that schools
were designed to completely different standards decades ago.
Building configuration scores were also very low, with poor ratings concentrated in secondary schools
across the county and all school types receiving no better than borderline scores. The lowest building
configuration scores are indicative of the need to make significant floor plan modifications in order to more
closely align the schools with standards established in the Ed Specs. It is also telling that school types with
the lowest building configuration scores are also among the oldest in the district. In fact, 86% of schools
with building configuration priority scores of seven or lower are over 30 years old, as compared to 68% of
all school facilities.
It is important to point out that the highest average priority score among the campus assessment
subcomponents occurred in the area of safety and security. Although there were frequent cases of specific
elements missing at individual schools, the overall results indicate that key elements such as exterior
lighting and communication systems were present and functional to current standards at most schools.
Similarly, the technology and supporting infrastructure subcomponent received satisfactory ratings or better
in all school types, regardless of region, which is reflective of recent investments made in that area by
PGCPS.
INDIVIDUAL SPACES PRIORITY SCORES
FIGURE 1.4.2.14: Average Campus Assess Priority Scores

SECTION 1.4 – METHODOLOGIES AND FINDINGS
J U N E 2 0 1 5 1 . 4 . 33
The individual spaces priority score is an average of three sub-categories: capacity-driving scores,
specialty classroom scores, and shared spaces scores. There are six data points that make up each of
these three subcategories. This is the most individualized data input because each learning space in every
school received an assessment and score. When averaged, there is little variation in the individual spaces’
priority scores from one school type to another. However, an evaluation of the six specific evaluation points
that comprise the priority scores for the capacity-driving spaces reveals a wide variety of strengths and
deficiencies, dependent upon the school type and region.
The data show that fewer school types averaged poorer (or worse) educational adequacy scores for
elements evaluated in the classrooms than they did for elements evaluated within the campus assessment.
In fact, only two of the specific evaluation pointsclassroom furnishings and classroom technology and
supporting infrastructurereceived a poor average priority score in one of the school types. The poor
classroom furnishings scores occurred in several school types and, in fact, none of the school types
received a priority score in this area better than borderline. This indicates a widespread need for classroom
casework and storage upgrades across the district. Classroom technology received a poor rating in Central
Region middle schools and borderline scores in five of the other school types. Poor ratings in classroom
technology scores typically resulted from the lack of necessary instructional audio visual equipment and
the appropriate wiring to make the equipment convenient for teachers to use routinely.
It is also important to point out that although none of the school types averaged a poor air quality score, all
but one of the school types averaged a borderline rating. Field teams frequently noted significant air quality
issues related to temperature and/or humidity in multiple schools across the district. Regional schools are
FIGURE 1.4.2.15: Average Individual Space Assessment Subcomponent Priority Scores by Region and School Type (Capacity Rooms
Only)

PRINCE GEORGE’S COUNTY PUBLIC SCHOOLS MASTER PLAN SUPPORT PROJECT
B R A I L S F O R D & D U N L A V E Y I N S P I R E . E M P O W E R . A D V A N C E .
1 . 4 . 34
noted as having the lowest average air quality priority scores which indicates the likely need for significant
heating and cooling system improvements in these facilities. Importantly, this corresponds with the low
weighted facility condition index (WFCI) priority scores indicated at these school types in the previous
section.
The highest average individual space scores for capacity classrooms occurred consistently within the
categories of classroom acoustics and lighting quality. A very close third for the best scores occurred in
the category of internal classroom organization. The project team used these data points to identify
deficiencies and strengths on a per-school basis as a way of informing individualized project
recommendations.
SPACE ADEQUACY PRIORITY SCORES
The final input that composes the overall educational adequacy priority score is the space adequacy priority
score. Average space adequacy priority scores for the various school types and regions range from five to
20. The four regional high schools are prominent outliers with an average space adequacy priority score of
five. Notably, all are special program or alternative education high schools. Generally, elementary and
middle schools in the Northern Region have the worst average scores, while high and middle schools in
the Southern Region have the best. Northern Region middle schools are noted as having the worst space
adequacy priority schools among all neighborhood school types.
FIGURE 1.4.2.16: Average Space Adequacy Priority Scores by Region and School Type
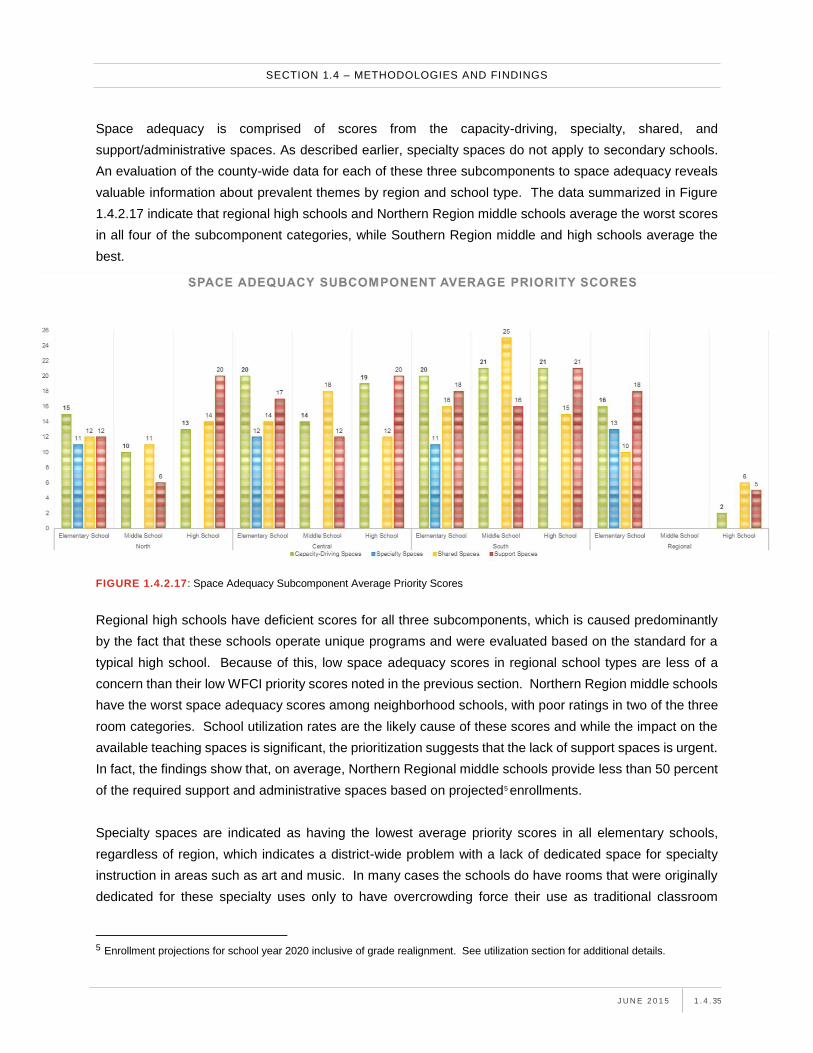
SECTION 1.4 – METHODOLOGIES AND FINDINGS
J U N E 2 0 1 5 1 . 4 . 35
Space adequacy is comprised of scores from the capacity-driving, specialty, shared, and
support/administrative spaces. As described earlier, specialty spaces do not apply to secondary schools.
An evaluation of the county-wide data for each of these three subcomponents to space adequacy reveals
valuable information about prevalent themes by region and school type. The data summarized in Figure
1.4.2.17 indicate that regional high schools and Northern Region middle schools average the worst scores
in all four of the subcomponent categories, while Southern Region middle and high schools average the
best.
Regional high schools have deficient scores for all three subcomponents, which is caused predominantly
by the fact that these schools operate unique programs and were evaluated based on the standard for a
typical high school. Because of this, low space adequacy scores in regional school types are less of a
concern than their low WFCI priority scores noted in the previous section. Northern Region middle schools
have the worst space adequacy scores among neighborhood schools, with poor ratings in two of the three
room categories. School utilization rates are the likely cause of these scores and while the impact on the
available teaching spaces is significant, the prioritization suggests that the lack of support spaces is urgent.
In fact, the findings show that, on average, Northern Regional middle schools provide less than 50 percent
of the required support and administrative spaces based on projected5 enrollments.
Specialty spaces are indicated as having the lowest average priority scores in all elementary schools,
regardless of region, which indicates a district-wide problem with a lack of dedicated space for specialty
instruction in areas such as art and music. In many cases the schools do have rooms that were originally
dedicated for these specialty uses only to have overcrowding force their use as traditional classroom
5 Enrollment projections for school year 2020 inclusive of grade realignment. See utilization section for additional details.
FIGURE 1.4.2.17: Space Adequacy Subcomponent Average Priority Scores

PRINCE GEORGE’S COUNTY PUBLIC SCHOOLS MASTER PLAN SUPPORT PROJECT
B R A I L S F O R D & D U N L A V E Y I N S P I R E . E M P O W E R . A D V A N C E .
1 . 4 . 36
spaces. This is likely to be the case in Northern Region elementary schools where the average score for
capacity (or classroom) spaces nears satisfactory but the other subcomponents average priority scores
near the poor range. On the other hand, many schools simply lack these important instructional spaces.
Study results indicate that approximately thirty percent of PGCPS elementary schools have one or fewer
dedicated specialty spaces, which is significantly less than the four spaces required by the Ed Specs for a
typical 500-student school.
Several school types had borderline shared space priority scores that hovered close to a poor rating.
Shared spaces include several rooms that are essential to the delivery of individualized instruction and
student collaboration (such as resource rooms) and the study findings reveal that only two school types
provide an average of 100% or greater of the required shared spaces. According to Figure 1.4.2.18, all
Northern Region schools, along with high schools in the Central Region, provide an average of no more
than about 80% of the shared spaces required in the Ed Specs. With overutilization an issue in many of
these schools, these spaces are often repurposed into capacity-driving spaces, which negatively affects
the learning environment of the students.
The detailed space adequacy information available for each school allowed the project team to identify the
required area needed to house the projected number of students for each school in the district based on
the Ed Specs standards. This directly translated into specific project recommendations on a school-by-
school basis, which is discussed in a subsequent section of this report.
FIGURE 1.4.2.18: Average Percent of Shared Spaces Provided Compared to Ed. Spec. Requirements

SECTION 1.4 – METHODOLOGIES AND FINDINGS
J U N E 2 0 1 5 1 . 4 . 37
SUMMARY OF FINDINGS
Based on the established rating scale, the range of priority scores indicates that PGCPS schools, on
average, have borderline educational adequacy with widely varied results from school to school, at the
component level. The individualized data collected for each school in the three educational adequacy
component categories (campus assessment, individual spaces, and space adequacy) revealed several
important trends and allowed for development-specific project recommendations.
Campus assessment priority scores revealed that site circulation and accessibility scores were most
frequently the lowest, with several school types averaging scores considered to be poor or very close to it,
particularly in Southern Region schools. Building configuration scores were also very low, with poor ratings
concentrated in secondary schools across the county.
Individual space priority scores revealed that districtwide, schools tend to have issues with furnishings,
technology, and air quality in the classrooms.
The poor classroom furnishings scores occurred in several school types and indicates a
widespread need for classroom casework and storage upgrades.
Classroom technology scores were poor in Central Region middle schools and borderline in several
other school types, typically resulting from the lack of necessary instructional audio-visual
equipment.
Air quality scores were borderline across the district with the lowest scores occurring in regional
schools, which also had the lowest WFCI priority scores. Field teams frequently noted significant
air quality issues related to temperature and/or humidity in multiple schools across the district.
Of the three educational adequacy component scores, space adequacy had the widest range of results and
frequently had a more significant impact on overall educational adequacy scores at the individual school
level than did the other two components.
Northern Region middle schools have the worst space adequacy scores among neighbhorhood
schools, with poor ratings in two of the three room categories evaluated.
Specialty spaces are indicated as having the lowest average priority scores in all elementary
schools, regardless of region, which indicates a problem districtwide with a lack of dedicated space
for specialty instruction in areas such as art and music.
Several school types had borderline shared space priority scores that hovered close to a poor
rating. Shared spaces include several rooms that are essential to the delivery of individualized
instruction and student collaboration (such as resource rooms) and the problem was most evident
in all Northern Region schools along with high schools in the Central Region.

PRINCE GEORGE’S COUNTY PUBLIC SCHOOLS MASTER PLAN SUPPORT PROJECT
B R A I L S F O R D & D U N L A V E Y I N S P I R E . E M P O W E R . A D V A N C E .
1 . 4 . 38
Because space adequacy results are derived based on projected enrollment figures, there is a
strong correlation between higher school utilization rates and lower scores.

SECTION 1.4 – METHODOLOGIES AND FINDINGS
J U N E 2 0 1 5 1 . 4 . 39
METHODOLOGY INTRODUCTION
A utilization analysis studies how efficiently facilities are used and how well they meet the space needs of
the school district. Understanding the existing utilization is a critical step in a comprehensive master
planning effort to understand the needs of each facility and the school district as a whole. The Educational
Facilities Master Plan provides the preferred range of utilization for schools to operate within. The goal of
studying the utilization is to understand the current use of each school in order to re-calculate its State-
rated capacity (SRC). This analysis was performed to set a new baseline SRC for each school. In addition,
the requirements of House Bill 1107, Chapter 147, Section 3, PGCPS required the submission of an interim
utilization study of the county’s schools. A draft Interim Utilization Report was submitted in December 2014,
and was updated in April 2015.
It is important to note that subsequent to the draft Interim Utilization Report, the projected enrollment
numbers were updated. After detailed reviews with Pupil Accounting and School Boundariesthe office
within PGCPS that is responsible for enrollment projectionsthe project team determined that for the
purpose of master planning efforts moving forward, it would use the updated 2020 enrollment projections
that were particularly focused on two changes to the projections.
The first change was related to the realignment of the sixth grade from elementary to middle school
enrollments. As the board of education had already approved a transition to a sixth–eighth grade middle
school model, the team determined that the planning efforts should address those changes in the projected
enrollments. In the report, you will often see this being referred to as “post-grade level realignment” figures.
Figure 1.4.3.1, shows the reduction in the number of elementary students and the increase in the number
of middle school students.
The second change was the use of full time equivalent (FTE) enrollments. The original figures used in the
Interim Utilization Report had enrollment projections based on total number of enrolled students or
headcount. In the revised projections two half-time students (for example, two half-day pre-K students) will
count as one FTE. This distinction is important in understanding utilization based on how a building is
occupied throughout the whole day.
S E C T I O N 1 . 4 . 3 U T I L I Z A T I O N M E T H O D O L O G Y A N D F I N D I N G S

PRINCE GEORGE’S COUNTY PUBLIC SCHOOLS MASTER PLAN SUPPORT PROJECT
B R A I L S F O R D & D U N L A V E Y I N S P I R E . E M P O W E R . A D V A N C E .
1 . 4 . 40
The SRC calculation does not change based on this updated data. It does, however, impact the utilization
rates so a change will be seen as this final report is compared to the interim report from April 2015.
As a part of the FY2015 Educational Facilities Master Plan, PGCPS established the following preferred
utilization guideline and objective:
“Guideline Five: Maintain an optimal student occupancy rate of between 80% - 95% of the SRC.”
This guideline addresses the need for PGCPS to become more efficient at using its large inventory of school
buildings. To support this guideline, the project team analyzed the utilization of the existing school buildings
and reported each one’s current SRC and utilization rates. The team collected and synthesized data for the
entire county so that an objective and fair analysis can be made.
In reviewing the data, the range of 80-95 percent is referred to as the targeted range and is considered an
optimal school utilization. A significantly over-utilized school would be one that has a utilization of over 120
percent, and a significantly under-utilized school would be one with a utilization of under 70 percent.
FIGURE 1.4.3.1: Projected Enrollment Comparison Chart

SECTION 1.4 – METHODOLOGIES AND FINDINGS
J U N E 2 0 1 5 1 . 4 . 41
The project team used three major steps to establish the SRC and then evaluated the SRC against the
projected enrollment to establish utilization rates.
DRAWINGS AND DATA COLLECTION
The project team started its work in October 2014 by gathering data on the previously-reported SRCs,
enrollment data, and floor plans for all buildings. The team reviewed the previous SRC data tables and
used floor plans provided by the district or, where floor plans were not available, acquired egress plans to
use as a template. As a part of the existing data review, the team established whether a school was based
on a prototype and then classified it by type (elementary, middle, high, pre-K-8, or regional).
One important component in calculating the capacity of the schools is to understand the area of each room.
In a majority of cases that information was not obtainable in the available plans. The team took the existing
AutoCAD or PDF plans provided by PGCPS and created a building information modeling (BIM) plan for
each school. These new plans associate data with specific rooms. Having entered this data into the BIM,
the team could then document specific areas and assign departments and other functional attributes to
them. This process not only benefited this study, but will also allow future updates to the data as the program
moves forward.
The project team noted that very few of the floor plans provided by the county were detailed, scaled, or
dimensioned drawings. Most were single-line PDF plans without any scale or dimension, so the survey
teams had to verify a few existing building dimensions in each school to establish the proper scale. In some
instances, the team used Google Maps and other similar tools to cross-check building sizes. This study’s
scope did not include, nor did the time allow for, full surveying of existing conditions. The project team
assumed that the floor plans provided were proportional, but a margin of error should be considered since
surveyors could not consistently correlate the field dimensions with the PGCPS plans.
FIELD SURVEYS
Over the course of five weeks, the project team surveyed 193 schools, evaluated the current use of each,
and identified room names, numbers, teacher’s names, and other pertinent data. The team checked the
existing conditions against the floor plans provided and noted where there were significant discrepancies.
Team surveyors also recorded data about mobile construction and relocatable classrooms. While
relocatable classrooms do not count toward a school’s SRC, tracking the number of them can be useful to
show patterns of over-utilization.
Many buildings contain shared spaces that are used by other programs outside of typical school functions.
In cases where these spaces were housed in rooms that were likely designed as part of the school building,

PRINCE GEORGE’S COUNTY PUBLIC SCHOOLS MASTER PLAN SUPPORT PROJECT
B R A I L S F O R D & D U N L A V E Y I N S P I R E . E M P O W E R . A D V A N C E .
1 . 4 . 42
the project team surveyed those uses and identified them in the school’s area summary. If a memorandum
of understanding exists for a program to occupy a specific portion of a school, that has been noted. In some
instances, the schools share their buildings with programs that are clearly purpose-built for the non-school
function. In such cases, the team confirmed that the function still existed, but did not evaluate those spaces.
STATE-RATED CAPACITY
The Maryland Public School Construction Program (PSCP) established an SRC formula for calculating the
capacity of public school buildings. The SRC is then used to determine:
The utilization rate, by comparing the enrollment or projected enrollment to the SRC.
If a school building is over-capacity (utilization/ enrollment exceeds the SRC).
If a school building is under-capacity (utilization/ enrollment is less than the SRC).
If an addition or a new school is justified, and/or
If there might be improved utilization in a geographic area within the school system through
boundary realignments, school consolidation, and/or closures.
The project team followed the Interagency Committee on School Construction’s (IAC’s) Appendix 102A to
determine the SRC of a facility. The number of classrooms is multiplied by the state-approved class size.
The chart below indicates the approved capacity by room type:
A room should be counted toward capacity if it is used by students 50% or more of the normal school day
and is at least 550 square feet in an elementary school and at least 500 square feet in a secondary school.
Rooms that meet these space requirements are considered classrooms. In both elementary and secondary
schools, a certain number of shared classrooms are used as resource rooms and are not counted toward
20
22
23
25
10 10
25 x 0.85
22 x 0.85
15 x 0.85
General or Specialized
Career Technology
Room Capacity Chart
Kindergarten
Grades 1-5
Grades 6 (in elementary)
Special Education
Alternative Programs
PreKindergarten/ Head Start
Elementary Secondary
Use Number of Students Number of Students
FIGURE 2.4.3.2: Room Capacity Chart

SECTION 1.4 – METHODOLOGIES AND FINDINGS
J U N E 2 0 1 5 1 . 4 . 43
capacity. For elementary schools, non-capacity resource rooms include shared specialty spaces such as
gym, art, music, computers, and special education pull-out, as well as classrooms for English as a second
language (ESL) instruction. In secondary schools, resource rooms include shared specialty spaces such
as special education pull-out, in-school suspension, and the like.
The SRC will fluctuate year to year depending on changes in programs and grade structure. The School
Utilization Report Table (Appendix 3.2.4) includes two capacity numbers. First is the official SRC. This is
the capacity that the State of Maryland approved for a given school as of May 2014. The second capacity
is the SRC that was calculated as a result of this study.
The columns in the report table are defined as follows:
STATE-RATED CAPACITY CLASSROOMS
Pre-K: Pre-Kindergarten classrooms. This count includes Head Start, EEEP, or other early
childhood programs
K: Kindergarten classrooms
Elem: Elementary school classrooms for grades 1-5
Grade Six: Grade six classrooms in elementary schools. (If a grade six classroom is in a pre
K-8 school or middle school, it will count as a secondary school classroom.)
Sec: Classrooms for students in grades 6-12
Sp Ed: Any self-contained special education room where students receive services outside of
the general education setting for more than 60% of the school day
Career Tech: Career technology education rooms
Alt: Any alternative, self-contained, approved program where students have been removed
from the general educational program with limited to no interaction with students in the
regular education programs for several weeks or months
Gym, Sec: Gymnasiums are counted as capacity drivers only at the secondary level.
NON-CAPACITY SPACES
Small Resource Spaces: Shared rooms that are 550 square feet or less in an elementary
school and 500 square feet or less in a secondary school. These rooms may be used by
small groups of students throughout the day and are not counted toward school capacity (for
example: speech)
Other Large Resource Classrooms/Teaching Spaces: In elementary schools, art, music,
gym, and elementary science labs. These rooms do not count toward capacity.
Relocatable/Temporary: Temporary exterior structures. These classrooms are not counted
toward school capacity, but are noted for information.

PRINCE GEORGE’S COUNTY PUBLIC SCHOOLS MASTER PLAN SUPPORT PROJECT
B R A I L S F O R D & D U N L A V E Y I N S P I R E . E M P O W E R . A D V A N C E .
1 . 4 . 44
ADJUSTMENTS
Depending on its size, the state’s regulations allow for each school to have a certain number of non-capacity
resource rooms. In order to equitably account for these spaces in all schools, the project team applied a
formula to each school to deduct from the quantity of capacity rooms6. This calculation allows for every
school to include an appropriate allocation of specialty classroom and resource spaces.
Elementary/ PK-8: This column counts the number of rooms deducted from elementary and
PK-8 schools.
Secondary (Middle/High): This column counts the number of rooms deducted from
secondary schools.
Following are the formulas used to calculate adjustments:
6 The total number of rooms indicated in the Elem and Sec columns of Appendix 3.2.4 are net of the deductions reported for that particular school.
1 1 2
1 2 2
0
If no separate gym deduct 1
full-sized room
If no separate gym deduct 1
full-sized room
If fewer than 3 small spaces
between 250-549 sq. ft.
deduct 1 full-sized room
If fewer than 4 small spaces
between 250-549 sq. ft.
deduct 1 full-sized room
If fewer than 5 small spaces
between 250-549 sq. ft.
deduct 1 full-sized room
3 5 6Maximum deduction of
rooms over 550 Sq. Ft.
Elementary and Pre-K thru 8 Schools
Music
PE
Resource rooms
Art
Qty. of full-sized rooms in building (over 550 Sq. ft.)
Name If 21 or fewer If 22-29 If 30 or more
FIGURE 1.4.3.3: Elementary School Adjustment Formulas
1 plus 2,000 sq. ft. either in
small spaces (under 500 sq.
ft.) or classrooms
2 plus 2,000 sq. ft. either in
small spaces (under 500 sq.
ft.) or classrooms
3 plus 2,500 sq. ft. either in
small spaces (under 500 sq.
ft.) or classrooms
3 plus 3,000 sq. ft. either in
small spaces (under 500 sq.
ft.) or classrooms
3 4 5 6
Resource rooms
Maximum deduction of
rooms over 550 Sq. Ft.
If 70-89
Middle and HighSchools
Qty. of full-sized rooms in building (over 500 Sq. ft.)
Name If 49 or fewer If 50-69 If 90 or more
FIGURE 1.4.3.4: Secondary Schools Adjustment Formulas

SECTION 1.4 – METHODOLOGIES AND FINDINGS
J U N E 2 0 1 5 1 . 4 . 45
CAPACITY CALCULATION S
Current enrollment September 30, 2014
Projected enrollment September 30, 2020
SRC (official): Number currently on record with the state for the building capacity
SRC (as studied): Proposed new SRC based on the current observed use and the
appropriate deductions
Current utilization (as studied): Current enrollment as compared to the as studied SRC
Project utilization (as studied): Projected enrollment as compared to the as studied SRC.

PRINCE GEORGE’S COUNTY PUBLIC SCHOOLS MASTER PLAN SUPPORT PROJECT
B R A I L S F O R D & D U N L A V E Y I N S P I R E . E M P O W E R . A D V A N C E .
1 . 4 . 46
SUMMARY OF FINDINGS
Following is a summary of the data contained in the utilization table in Appendix 3.2.4 of this report. Two
of the key metrics available for analysis are school utilization rates and availability of seats. Both metrics
are reported based on current and projected enrollments. For this report, six-year post-grade level
realignment projected enrollments (2020) are used based on data received on February 12, 2015. All
school utilization rates are calculated by dividing current and future (2020) enrollments by the updated SRC
figures. Availability of seats is calculated by subtracting current and projected enrollments (2020) from the
updated SRC calculations. The percentage change in SRC is shown graphically below.
An important note is that the enrollment projections changed between the draft report from December 2014
and the current, final data.
In all charts, the regional schools have been removed from the county-wide calculations. Regional schools
are those that have specific admission criteria so their enrollments are controlled at the district level. These
schools have been summarized as a group below the county-wide summary and are broken down by school
type.

SECTION 1.4 – METHODOLOGIES AND FINDINGS
J U N E 2 0 1 5 1 . 4 . 47
NEIGHBORHOOD SCHOOLS SUMMARY
SCHOOL UTILIZATION RATES
In both the current and projected utilization tables, the Central Region middle and high schools hover
around the targeted 80-95 percent utilization, while the elementary schools remain below the target. The
Southern Region’s current utilization for elementary schools is within the targeted range; however, middle
and high schools are below the targeted utilization. The projected utilization for the Southern Region is
consistently below the targeted range. The Northern Region s consistently well above the targeted range
for elementary, middle, and high schools and is projected to remain above the target.
When comparing current to projected utilization, a consistent rise in the middle schools can be seen. This
is due, in part, to the realignment of middle schools from seventh-eighth grade schools to sixth-eighth grade
schools across the county. This impacts elementary schools as well and a drop in their projected enrollment
is noted. The most significant impact appears to be for the middle schools located in the Northern Region
where a 26 percent increase in average utilization is projected.
FIGURE 1.4.3.5: Regional Average Utilization Rates by School Type

PRINCE GEORGE’S COUNTY PUBLIC SCHOOLS MASTER PLAN SUPPORT PROJECT
B R A I L S F O R D & D U N L A V E Y I N S P I R E . E M P O W E R . A D V A N C E .
1 . 4 . 48
AVAILABILITY OF SEATS
Another way of looking at school utilization is by examining open seats. The chart below compares the
number of current and projected open seats by school type and planning region. Significant shortfalls in all
grade levels are projected in the Northern Region, which is consistent with the utilization statistics shown
above. The Northern Region is projected to have total shortfall of over 5,500 seats by 2020. There is an
overall increase in open seats projected in the Southern Region; however, the quantity of open seats in
middle schools will dip slightly due to grade level re-alignment. There is a small projected decrease in open
seats at the high school level in the Central Region, and a larger projected decrease in open seats in Central
region middle schools; again related to grade level realignment. The Central Region is projected to continue
to have a significant surplus of elementary school seats.
FIGURE 1.4.3.6: Current and Projected Open Seats by School Type by Region

SECTION 1.4 – METHODOLOGIES AND FINDINGS
J U N E 2 0 1 5 1 . 4 . 49
STATE-RATED CAPACITY CHANGES
As part of this utilization study, the project team re-evaluated the SRC on most schools within the facility
inventory. The current evaluation of SRC considers the current use of the space and accounts for the
accepted number of support spaces each school should contain. This study found a mix of increases and
decreases to the proposed SRC figures across the district, as shown in Figure 1.4.3.7. In several cases
where the SRC had a significant increase, the change is explained by the alignment of “as utilized” special
education rooms with the approved quantity. In some cases, the SRC changes are impacted by current
school construction/renovation and should be re-examined after construction is complete. A majority of the
changes in SRC can be attributed to the decision to take the allotted deductions for shared specialty
resource rooms. Across all regions at all school types, the percent change remained less than 5 percent.
FIGURE 1.4.3.7: Average Percent Change in SRC
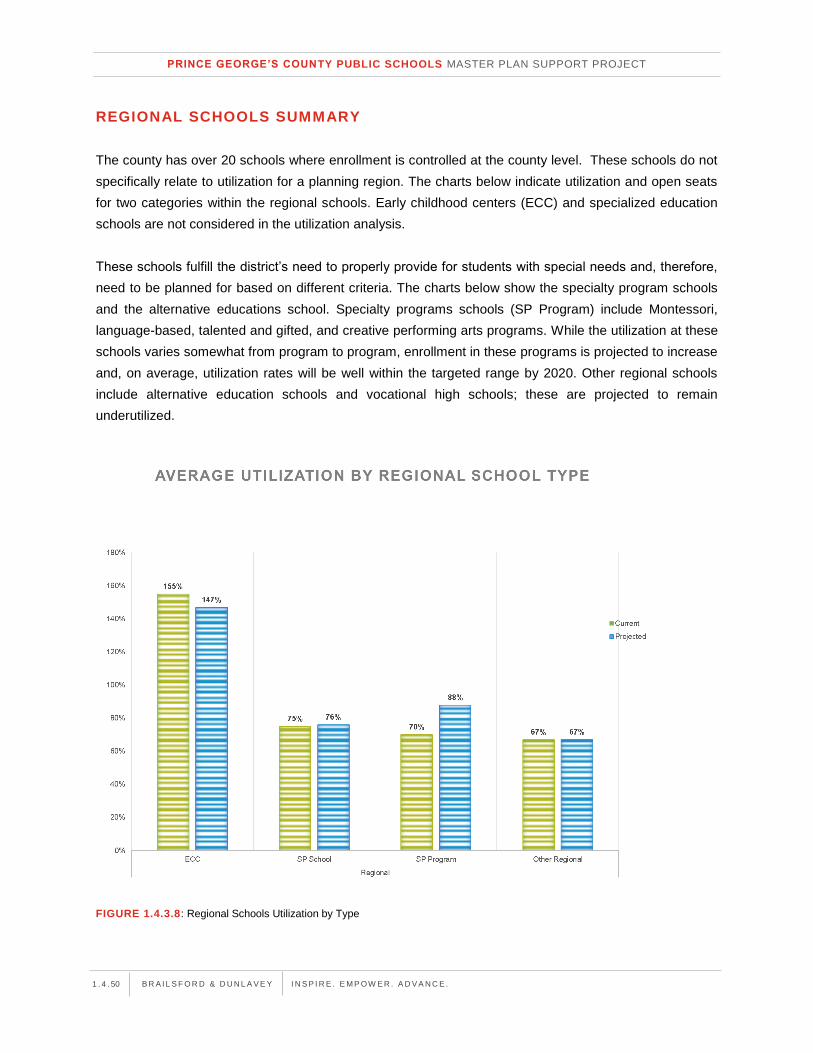
PRINCE GEORGE’S COUNTY PUBLIC SCHOOLS MASTER PLAN SUPPORT PROJECT
B R A I L S F O R D & D U N L A V E Y I N S P I R E . E M P O W E R . A D V A N C E .
1 . 4 . 50
REGIONAL SCHOOLS SUMMARY
The county has over 20 schools where enrollment is controlled at the county level. These schools do not
specifically relate to utilization for a planning region. The charts below indicate utilization and open seats
for two categories within the regional schools. Early childhood centers (ECC) and specialized education
schools are not considered in the utilization analysis.
These schools fulfill the district’s need to properly provide for students with special needs and, therefore,
need to be planned for based on different criteria. The charts below show the specialty program schools
and the alternative educations school. Specialty programs schools (SP Program) include Montessori,
language-based, talented and gifted, and creative performing arts programs. While the utilization at these
schools varies somewhat from program to program, enrollment in these programs is projected to increase
and, on average, utilization rates will be well within the targeted range by 2020. Other regional schools
include alternative education schools and vocational high schools; these are projected to remain
underutilized.
FIGURE 1.4.3.8: Regional Schools Utilization by Type

SECTION 1.4 – METHODOLOGIES AND FINDINGS
J U N E 2 0 1 5 1 . 4 . 51
When reviewing utilization across the district, the following observations were made:
Utilization rates are highest in the Northern Region, followed by the Central and then
Southern Regions.
Utilization is in most critical condition in the middle schools in the Northern Region with a
projected 132 percent utilization rate, and in regional ECCs with a utilization rate of 147
percent projected.
All school types are over-utilized in the Northern Region and projected to be underutilized in
the Southern Region.
In the Central Region, elementary schools are under-utilized, while middle and high schools
are projected to be within the targeted range.
FIGURE 1.4.3.9: Regional Schools Open Seats by Type

PRINCE GEORGE’S COUNTY PUBLIC SCHOOLS MASTER PLAN SUPPORT PROJECT
B R A I L S F O R D & D U N L A V E Y I N S P I R E . E M P O W E R . A D V A N C E .
1 . 4 . 52
Regional specialized education centers and alternative schools are all projected to be below
targeted utilization while regional specialty program schools are projected to be within the
targeted range.
Analysis of SRC resulted in minimal change (less than 5 percent) across all school types and
regions.
A series of maps were developed to give a graphic representation of the utilization analysis. Maps 3.1.1a
through 3.1.1c indicate the average utilization rate of each planning area and are color-coded with red being
over-utilized and blue being under-utilized. Looking at the whole county, one can see a concentration of
over-utilization in the Northern Region and under-utilization in the Southern Region. When reviewing the
three utilization maps, there is an excess of schools in the region where fewer people live (Southern Region)
and a need for additional capacity in the Northern Region where increasingly more people are living. This
basic observation feeds into the detailed analysis and master planning effort to determine exactly what is
needed and where it should be placed.

SECTION 1.4 – METHODOLOGIES AND FINDINGS
J U N E 2 0 1 5 1 . 4 . 53
PROJECT DEFINITIONS METHODOLOGY
OVERVIEW
Over the course of four weeks the project team evaluated facility conditions, educational adequacy,
utilization, and other existing data for 1607 schools in order to define the baseline project needs at each
facility. The detailed information available for each school allowed the project team to address the specific
needs at each school and organize the schools into project groupings based on similar characteristics.
Upon analyzing the type of work needed across the district, the project team developed four major project
definition categories and applied the appropriate one to each school based on its needs. The project team
was careful to align the scopes within these categories with existing standards used by the state of Maryland
to establish funding eligibility. Detailed cost estimates were then developed by a professional estimator for
the baseline projects to include total project costs for each school in 2015 dollars.
These baseline projects for each school were developed to convey the work needed at each school to bring
it into alignment with the board-approved educational specifications, address identified facility condition
deficiencies, and provide adequate space to accommodate the number of students projected to be enrolled
in 2020. The baseline projects were developed without consideration for the impact of a single project on
its neighboring schools or for the affect that other master planning actions, such as boundary changes, may
have on the school’s project needs. That step was taken during the next stage in the process and is
discussed in Section 1.5.
EVALUATION OF PROJECT NEEDS
The project team used detailed facility condition data made available by PGCPS from the assessments
performed by Parsons in addition to the educational adequacy and utilization data discussed in the previous
sections to develop detailed project requirements for each school.
7 The complete list of schools for which baseline project definitions were developed is included as Appendix 3.2.13, MPSP Assessment and Project Definition Checklist.
S E C T I O N 1 . 4 . 4 P R O J E C T D E F I N I T I O N S M E T H O D O L O G Y A N D
F I N D I N G S

PRINCE GEORGE’S COUNTY PUBLIC SCHOOLS MASTER PLAN SUPPORT PROJECT
B R A I L S F O R D & D U N L A V E Y I N S P I R E . E M P O W E R . A D V A N C E .
1 . 4 . 54
FACILITY CONDITION DATA
The FCI data provided by PGCPS includes tremendous detail on building deficiencies organized by specific
building systems. The project team organized the deficiencies at each school into 21 system types, primarily
based on the embedded Uniformat code information. However, in order to ensure consistency with state
definitions for systems and system types, the team combined a few of the Uniformat level two systems. A
summary list of the 21 systems is provided here in Figure 1.4.4.1, but a more detailed list of the systems
and the included Uniformat subsystems is provided in Appendix 3.2.1.
Ceilings Interior construction
Communication Interior finishes
Conveying Lighting and branch wiring
Electric service Plumbing
Equipment Roofing systems
Exterior doors Site paving and sidewalks
Exterior walls Site utilities
Fire protection Substructure
HVAC distribution, controls, and testing Superstructure
Interior fittings Windows
Summary Uniformat Systems
FIGURE 1.4.4.1: Summary of Uniformat Systems

SECTION 1.4 – METHODOLOGY AND FINDINGS
J U N E 2 0 1 5
1 . 4 . 55
Using the total value of the deficiencies provided by Parsons for each of the systems, the project team
determined if the extent of required work warranted a complete replacement. The project team established
the need to replace an entire system in one of two ways:
1. If the cost of the system deficiency exceed 66 percent of the typical replacement value8 for the
entire system.
2. If 66 percent or more of the system deficiency costs were in categories labeled as having an impact
on learning or difficult to repair9.
The project team developed a model to expedite the process of evaluating system replacement needs. A
sample worksheet from that model is available for review in Appendix 3.2.7. The quantity of building
systems that required full replacement established the building blocks for determining which type of project
was needed at the school.
EDUCATIONAL ADEQUACY AND UTILIZATION DATA
After evaluating the facility condition data the project team also reviewed the educational adequacy reports
and space adequacy worksheet created for each school.10 The educational adequacy reports, which are
provided for each school in Volume Two of this document, alerted the project team to the need for additional
work related to building reconfigurations, technology upgrades, fixed furnishings and equipment upgrades,
and site improvements, among other things. The educational adequacy reports also proved valuable in
assessing systems that were very close to exceeding the thresholds discussed above to see if there were
any noted field conditions that were likely the result of a failing system.
In addition to supplementing project requirements, the project team evaluated the school’s space adequacy
worksheets to assess if any additions were needed to accommodate the projected enrollment11. The space
adequacy worksheets, which are also provided for each school in Volume Two, provide detail on the size
and type of additions needed at each school. The recommended additional square footage included in the
worksheets is established by the space capacity models included in the board-approved educational
specifications and is designed to bring school utilization into the ideal ranges discussed in the utilization
section. It is important to note that the square footages included in the worksheets are net requirements
and that the project team applied a 1.3 gross-up factor to account for corridors and exterior walls when
calculating the final size of the addition.
8 Typical replacement value was established by school type via evaluation of FCI data for the entire portfolio. 9 Please refer to the WFCI methodology section for an explanation of impact on learning and difficulty to repair categories. 10 Please refer to the educational adequacy methodology section for an explanation of the reports and space adequacy. 11 School year 2020 enrollment projections provided by PGCPS.

PRINCE GEORGE’S COUNTY PUBLIC SCHOOLS MASTER PLAN SUPPORT PROJECT
B R A I L S F O R D & D U N L A V E Y I N S P I R E . E M P O W E R . A D V A N C E .
1 . 4 . 56
PROJECT DEFINITION CATEGORIES
Using the above information, each school was assigned one of four possible project types: full renovation
or replacement, limited renovation, system replacement, or other. If the need for an addition was
established then that descriptor was added to the baseline project type. As discussed above, the system
replacement recommendations derived from the facility condition data established the building block for
each project definition. Following is a description of the work included in each of the four project types:
Full Renovation or Replacement:
This project type includes a comprehensive upgrade to, or replacement of, all building systems, equipment,
and furnishings in addition to comprehensive site work improvements and all work required to address ADA
and building code compliance. In order to complete the extent of work required, PGCPS may elect to
renovate the building in place or replace it with a new facility12. To qualify for this category schools needed
to meet the following criteria:
1. Four out of six of the most difficult to repair systems in need of replacement. The following six building
systems were deemed as the most difficult to repair based on the standard established in the WFCI
section: electric service, fire protection, HVAC distribution, HVAC generating systems, lighting and
branch wiring, and plumbing.
2. Identified need for comprehensive reconfigurations or extensive additions to comply with educational
adequacy standards or to accommodate projected enrollments. Reconfiguration includes the
demolition and reconstruction of interior walls to accommodate changes to interior layouts. In most
cases the project team used its best judgment to evaluate the extent of required interior configuration
modifications based on a review of the floor plans, the educational adequacy reports, and the space
adequacy assessments. If a school were deemed to need an addition that was 50 percent or greater
of the current school square footage, and met the requirements of item one, it was also recommended
for full renovation.
Limited Renovation:
This project type includes any school that requires the replacement of five or more building systems and
minor reconfigurations to only a small portion of the building. In many cases limited renovations involve
extensive work but are distinguished from a full renovation because the majority of interior walls remain in
original locations and improvements to exterior building systems such as roof, window, and exterior walls
are not required. All limited renovation projects include upgrades to classroom fittings (casework, marker
boards, tack boards, etc.), AV, technology, and interior finishes. Limited renovations are assumed to occur
12 A comprehensive feasibility study should be undertaken by PGCPS prior to initiating work to determine the most effective solution.

SECTION 1.4 – METHODOLOGY AND FINDINGS
J U N E 2 0 1 5
1 . 4 . 57
within the existing building and, therefore, the extent of site work required is typically minimized to the items
identified in the educational adequacy reports (parking, site circulation, and/or play area upgrades).
System Replacement:
This project type includes any school that requires the replacement of one or more systems but does not
meet the criteria for a limited renovation. As noted in the educational adequacy findings, fixed furnishings
and equipment were consistently the biggest problem across all school types and, therefore, all system
replacement projects include upgrades to classroom fittings (casework, marker boards, tack boards, and
the like), AV, and technology.
Other:
This category is for smaller projects that did not fit into any of the above project types. In most cases, this
classification was assigned to newer schools that did not need a project but were in need of an addition.
Some buildings slated for demolition were also included in this group.
COST ESTIMATING
The project team used the services of Forella Group, LLC to develop detailed cost sheets for 107 schools
and took the results from those estimates to derive project costs for the remaining schools and for all
changes to baseline project types. A sample cost estimate for each project type is available for review in
Appendix 3.2.8.
Hard Costs:
These costs include all costs associated with physical construction of the building and any necessary site
improvements. The project team provided the estimator with a detailed description of the project needs for
each school including systems to be replaced, the size of any additions, and the extent of interior
reconfigurations needed. The project team and the cost estimator worked closely with PGCPS to establish
assumptions for typical construction specifications on major building systems and for site allowances in
order ensure consistency across the portfolio. The average hard costs per square foot derived from the
cost estimates for each of the three major project categories and additions are shown below in Figure
1.4.4.1.
FIGURE 1.4.4.2: Average Hard Costs per Square Foot (in 2015 dollars)
Full Renovation or Replacement $214
Limited Renovation $195
System Replacement $93
Other $278
Project Type:Avg. Cost per Square Foot
(in 2015 dollars)

PRINCE GEORGE’S COUNTY PUBLIC SCHOOLS MASTER PLAN SUPPORT PROJECT
B R A I L S F O R D & D U N L A V E Y I N S P I R E . E M P O W E R . A D V A N C E .
1 . 4 . 58
Soft Costs:
These costs include indirect costs necessary to implement the project, such as professional service fees
for design, engineering, and inspections. This category also includes items such as insurance costs,
permitting fees, and utility connection fees. The project team relied on the estimator’s professional
experience and data from recently completed projects in Prince George’s County to establish percentages
for these costs. Although each soft cost line item was calculated separately, the total amounts to an
additional 17.5 percent of the project hard costs.
Other Vendor and Owner Costs:
Items included in this category include furniture, audio visual equipment, IT equipment, owner operating
expenses, and logistics. Owner operating costs account for the impact of construction on normal school
operations which may include utility, staffing, or transportation cost increases. Logistical costs include an
allowance to cover moving expenses, project phasing and preparation of swing space13. As with the soft
costs, these items were calculated separately, but in aggregate they amount to an additional 11.5 percent
of the project hard and soft costs.
The final component included in the cost estimates is a 20 percent project contingency to account for the
risk associated with project budgeting that occurs at the master planning level. At the time of these
estimates detailed project scopes have not been developed and further evaluation of building and site
conditions is required to develop more accurate project budgets. As is discussed in Section Five, the project
team recommends that PGCPS conduct detailed feasibility studies to develop project scopes that will align
with master plan budgeting requirements and owner requirements. An allowance for escalation, which
accounts for risks associated with increasing construction costs over time, is not included in these project-
level estimates. Instead, escalation is accounted for at the program level and is discussed in Section 1.5.
As mentioned at the outset, the project definitions were initially established without consideration for the
impact of a single project on its neighboring schools or for the effect that other master planning actions,
such as boundary changes, may have on the school’s project needs. The following section describes the
planning process undertaken by the project team to organize the schools and use the data collected to
establish a sequence for implementation of the projects. Throughout that process dozens of revisions were
made to the initial project descriptions, primarily to account for proposed shifts in student enrollments to
balance school utilization across the portfolio. By using the cost averages established herein and the space
adequacy tables, the project team was able to quickly evaluate the cost impacts associated with multiple
planning scenarios at an individual school and recommend the best option for PGCPS.
13 Swing space is a term to describe the relocation of students to a temporary location during the construction period.
SECTION 1.5 - SYNTHESIS AND RECOMMENDATIONS
J U N E 2 0 1 5
1 . 5 . 1
SYNTHESIS AND RECOMMENDATIONS
PGCPS Goals, Standards, and Guidelines
Planning Principles and Strategies
Aggregate Results and Recommendations
1.5

PRINCE GEORGE’S COUNTY PUBLIC SCHOOLS MASTER PLAN SUPPORT PROJECT
B R A I L S F O R D & D U N L A V E Y I N S P I R E . E M P O W E R . A D V A N C E . 1 . 5 . 2
INTRODUCTION
In collaboration with PGCPS, the project team synthesized facility condition, educational adequacy, and
utilization findings to develop a comprehensive school facility modernization program designed to support
and advance the school district’s educational mission. The planning process began with the detailed review
of existing district goals, standards, and guidelines. The project team’s understanding of this information
was then refined through strategic visioning and engagement sessions with PGCPS representatives,
stakeholders, and community members.
The result of these meetings was the creation of mission-based principles and logistical considerations that
were used to guide the development of specific planning strategies. These strategies were generated for
the purpose of developing a comprehensive set of capital project recommendations and master planning
actions that are grounded in site-based data and are aligned with the long-term strategic goals and vision
of PGCPS. These recommendations include school specific projects and their associated capital costs as
well as school closures and consolidations, boundary changes, and other planning considerations.
Volume 4 will review detailed project-specific recommendations within individual planning area reports.

SECTION 1.5 - SYNTHESIS AND RECOMMENDATIONS
J U N E 2 0 1 5
1 . 5 . 3
PGCPS GOALS, STANDARDS, AND GUIDELINES
The foundation of the MPSP planning strategies is existing PGCPS goals, standards, and guidelines
covering topics such as school size considerations, academic requirements, and other facility-related
considerations such as school utilization standards. This information provides the basis for the review and
analysis of facility needs and formulation of project recommendations and planning strategies. These goals,
standards, and guidelines are described in formalized documents that were refined and clarified for the
project team through strategic visioning and engagement with PGCPS stakeholders.
The project team worked directly with a core group of PGCPS representatives to review progress and
provide comment on preliminary findings and results. These representatives included staff from Capital
Projects and Pupil Accounting and School Boundaries. Additionally, a Facility Advisory Committee of
PGCPS leadership was convened at critical intervals to review preliminary results and provide strategic
guidance and input to ensure program recommendations were made in alignment with existing goals and
initiatives.
This section explains the mission-based principles and logistical considerations that make up the planning
strategies the project team applied to arrive at the project recommendations. Specific explanations include:
FY2015 Educational Facilities Master Plan
Educational programming initiatives
Strategic visioning session
Community engagement sessions
Planning Workshops
THE FY2015 EDUCATIONAL FACILITIES MASTER PLAN
The FY2015 Educational Facilities Master Plan (EFMP) was developed by the district to prioritize projects
for the 2016-2021, six-year Capital Improvement Plan. The EFMP calls for the district to commit to a
strategic vision for creating a more efficient and effective system for consolidating, closing, modernizing,
renovating, constructing, and maintaining facilities. The Master Plan Support Project’s objective is to
expand upon this plan and as such, the project team reviewed the plan and utilized the district’s information
to develop the planning principles and strategies.
PRINCE GEORGE’S COUNTY PUBLIC SCHOOLS MASTER PLAN SUPPORT PROJECT
B R A I L S F O R D & D U N L A V E Y I N S P I R E . E M P O W E R . A D V A N C E . 1 . 5 . 4
Within the EFMP, the following goals, standards, and guidelines are outlined:
Effective and efficient school size
Grade reorganization patterns
School utilization / capacity policies
Educational programming initiatives
Staffing ratios and school-based budgeting
Nutrition, wellness, and physical education
Transportation policies and safe routes to school
Information technology policies
The following section provides a brief review of the key goals, standards, and guidelines used to develop
the planning principles, logistical considerations, and strategies for this report. Please refer to the full EFMP
document for full details. 1
Effective and Efficient School Size
The EFMP provides facility guidelines and objectives for desirable school size ranges by school type.
These ranges allow schools to maximize operating budgets and ensure that all students have access to
similar high quality programs while maintaining a learning environment that is safe, flexible, and student
centered. The size guidelines create a more consistent inventory of neighborhood school buildings, and
include the following:
Guideline 1: Renovate, build, or replace elementary schools to an optimal capacity of between
411 to 822 students. (Optimal capacity is three to six classrooms per grade in a kindergarten
through fifth grade school.)
Guideline 2: Renovate, build, or replace middle schools to a capacity of between 600 to 1200
students. (Optimal capacity is two or three strands of 375 students per strand in grades six through
eight, which equals 750 to 1,125 students.)
Guideline 3: Renovate, build, or replace high schools to a capacity of between 950 to 2600
students.
Objective: Reduce the number of elementary schools in the county with SRCs of 411 students or
fewer.
1 The FY2015 EFMP can be found on the Capital Programs’ website at http://www1.pgcps.org/cip/

SECTION 1.5 - SYNTHESIS AND RECOMMENDATIONS
J U N E 2 0 1 5
1 . 5 . 5
Grade Reorganization Patterns
The EFMP provides the preferred grade configuration for the organization of neighborhood schools. The
preferences are pre-K through fifth, pre-K through eighth, sixth through eighth, and ninth through twelfth.
As of the publishing of the EFMP, the majority of middle schools in the county are configured appropriately
with grades six to eight; however, most do not serve all of the sixth grade students within their geographic
feeder patterns since many elementary schools are also configured with grade six. The school board has
adopted an educational initiative to transition sixth grade students from elementary schools to middle
schools. This transition is occurring as space becomes available and is largely dependent on increasing
capacity in middle schools.
Guideline 4: Reorganize all neighborhood elementary schools for Grades pre-K/K through fifth.
Objective: Develop long-range plans to increase middle school capacity where needed to allow
for the full implementation of the preferred grade configurations.
School Utilization / Capacity Policies
The EFMP provides the preferred range of utilization for schools to operate within. Underutilization of
schools represents a challenge for the district since it places a burden on the operating budget to manage
more space than enrollment requires and prevents the district from receiving funding from the state for
capital projects. Underutilization is also a strain to program operations, as funding associated with
enrollment levels at a school may not reach thresholds to support specialty teachers. Overutilization also
represents a challenge by requiring portable classrooms and, in more extreme cases, burdening core
spaces such as dining, administrative, and bathroom facilities.
Guideline 5: Maintain an optimal student occupancy rate between 80 - 95 percent of the State-
rated Capacity (SRC).
Objective: Future planning efforts in the area will be determined following the outcome of the
Master Plan Support Project.
EDUCATIONAL PROGRAMMING INITIATIVES
The EFMP describes several PGCPS educational programming initiatives that affect facility needs and
utilization, such as secondary school reform and special education inclusion initiatives, as well as other
neighborhood and regional programs. These initiatives provide context for the master planning
recommendations. The following section describes each initiative briefly.

PRINCE GEORGE’S COUNTY PUBLIC SCHOOLS MASTER PLAN SUPPORT PROJECT
B R A I L S F O R D & D U N L A V E Y I N S P I R E . E M P O W E R . A D V A N C E . 1 . 5 . 6
The board-approved Education Specifications (Ed Specs)2 provide the ideal space program guidelines per
school type for future renovation and construction projects. Each specification was developed in support
of the EFMP’s stated initiatives and reflects the associated spaces needed for the academic programs;
therefore, the Educational Adequacy survey directly examined each building for gaps in its associated
spaces.
The project team’s understanding of the needs associated with these initiatives was also informed through
workshop discussions and other materials provided by PGCPS. This additional information expanded on
the needs of these initiatives, such as the Department of Special Education Program Specifications and
Specialty Programs report, which was presented to the Board of Education in March 2015. Materials for
both of these programs can be found in appendices 3.2.10 and 3.2.11.
SECONDARY SCHOOL REFORM
In 2010, an aggressive program was initiated to ensure that all students would be college- and/or career-
ready upon graduation and to offer courses and programs that have proven track records. To support this
program, high schools will need to modify existing classrooms and in some instances, provide additional
classrooms to support their intended career academies. These spaces are reflected in the educational
specifications and the educational adequacy assessments. The resulting project recommendations align
high schools with these future program requirements.
SPECIAL EDUCATION INCLUSION
PGCPS is committed to educating students with disabilities with their non-disabled peers in the least
restrictive environment possible; therefore, the following specific objectives are considered within the
master planning support project:
Maintain centrally located C. Elizabeth Reig Regional School as the only regional Special
Education Center for more severely disabled / medically fragile students.
Relocate the services provided at Margaret Brent Regional School, James E. Duckworth
Regional School, and Tanglewood Regional School to neighborhood schools according to grade
level.
Adjust the distribution of services provided in neighborhood schools to meet ideal classroom
count goals outlined in the “Department of Special Education Program Specifications” provided in
appendix 3.2.11.
2 The Educational Specification Prototypes can be found on the Capital Programs’ website at http://www1.pgcps.org/cip/

SECTION 1.5 - SYNTHESIS AND RECOMMENDATIONS
J U N E 2 0 1 5
1 . 5 . 7
OTHER NEIGHBORHOOD AND REGIONAL SPECIALTY PROGRAMS
There are two types of enhanced educational offerings beyond those described above:
(1) School-based (In-boundary): Whole schools programs that serve a neighborhood population where
every child within the school boundary participates. Examples are: International Baccalaureate (IB)
Primary and Middle Years, Arts Integration, STEM/STEAM, and some Language Immersion.
(2) Selection-based (System-wide): These programs are offered regionally to students from a larger
geographic area. They may be a whole school program or a program within a school (sometimes
referred to as co-located). Students must submit an application, audition, test, and/or take part in
a lottery. Examples include Montessori, International Baccalaureate (IB) Diploma Program, Career
Academies (High School), Talented and Gifted Centers, Creative and Performing Arts (CPA), and
Visual and Performing Arts (VPA).
For the purposes of this plan, the following specific objectives identified by district staff were considered
during the master plan support project due to their direct impact on space utilization and the need to identify
space:
Expansion of the Talented and Gifted (TAG) Center program to an additional elementary school
location.
Incorporation of two new International Secondary Schools for English Language Learners with
one located in the Northern Region near the Langley-Park area and the other co-located in Largo
High School in the Central Region.
Creation of a new Early Childhood Center in the Southern Region.
STRATEGIC VISIONING SESSION
Following the in-depth review of existing district goals, standards, and guidelines, the project team facilitated
a strategic visioning session with the Facility Advisory Committee. The purpose of the session was to
provide the team with a better understanding of how the district views its goals in terms of their strategic
value. The session did not modify the district’s mission or introduce new values and goals, but simply
expanded upon and provided a deeper understanding of existing vision, goals, and principles. Outcomes
of the discussion informed the assessment methodology and weighting of data as well as the development
of the planning principles and strategies.

PRINCE GEORGE’S COUNTY PUBLIC SCHOOLS MASTER PLAN SUPPORT PROJECT
B R A I L S F O R D & D U N L A V E Y I N S P I R E . E M P O W E R . A D V A N C E . 1 . 5 . 8
The visioning session covered the following topics:
Educational adequacy and priority of space
Community context and equity of investments
Organizational and operational paradigm
The following summaries briefly describe the outcomes of the discussion that helped guide the project
team’s formulation of the planning strategies:
Educational Adequacy and Priority of Space
o Comprehensively modernize PGCPS facilities that support learning.
o Emphasize facility designs that support flexible and collaborative spaces capable of
supporting robust district-wide program offerings and improving student control over
individualized learning processes.
o Improve architectural quality of school facilities due to its positive impact on student
learning and teacher and staff retention.
Community Context and Equity of Investments
o Consider the judicious use of public funds.
o Maximize investments to have the largest impact possible on the specific school selected
and the surrounding community.
o Enhance the accessibility to specialized and specialty programs and services.
o Balance the need to keep neighborhood schools with the need to reduce portfolio size.
Organizational and Operational Paradigm
o Investments should minimize operating costs thru thoughtful design.
o Make all schools as flexible as possible to support a variety of programs and community
needs.
o Tailor only those spaces with highly specific uses or programs.
o Incorporate professional planning spaces, collaborative learning areas, and
interchangeable classroom types to support a “floating” teacher model to make buildings
more efficient.
Overall, these desired outcomes support the mission of providing safe and effective schools that are
educationally appropriate and meet local, state, and national educational standards.

SECTION 1.5 - SYNTHESIS AND RECOMMENDATIONS
J U N E 2 0 1 5
1 . 5 . 9
COMMUNITY ENGAGEMENT SESSIONS
The project team engaged with the community to review preliminary assessment findings and seek input
on the planning efforts. The purpose of the community meetings was to introduce parents, stakeholders,
and county residents to the district’s MPSP and engage them in active conversation about its design. The
meetings yielded qualitative information for the project team by identifying sensitivities and concerns,
providing feedback, and uncovering issues regarding the MPSP.
With the assistance of PGCPS staff, the project team organized three community meetings in March 2015.
These meetings were intentionally spread across the county in the Northern, Central, and Southern regions.
The goal was to solicit broad feedback from a wide range of parents, stakeholders, and residents. The
three meetings were held at the following sites:
Central Region - Charles H. Flowers High School on Tuesday, March 10, 2015, from 6:00 p.m. to
8:00 p.m.
Southern Region - Oxon Hill High School on Wednesday, March 11, 2015, from 6:00 p.m. to 8:00
p.m.
Northern Region - Northwestern High School on Thursday, March 19, 2015, from 6:00 p.m. to
8:00 p.m.
PGCPS and the project team explained the purpose of the MPSP and how it is intended to evaluate ways
to prioritize school construction and renovation projects through assessing schools in three critical areas:
mission, condition, and function. The initial assessment findings at the time of the meetings were presented
to the community. See appendix 3.2.12 for the meeting materials and detailed summary.
Participants at each meeting were given opened-ended questions to respond to in roundtable groups. A
project team moderator led each group to help guide the conversations. The questions were developed in
coordination with PGCPS. The moderator also encouraged tangential issues to be discussed to help spark
dynamic conversation. Each community was actively and openly engaged. Generally, similar themes
emerged from the discussions at the three meetings. Participants stated they want to maximize parental,
stakeholder, and resident participation in the MPSP process and would like a community review board to
ensure their needs are addressed.
Participants also believe that PGCPS needs to build new, safer, and better facilities to prepare students for
success. They stated that new facilities should feature the latest amenities, technology, and learning labs.
Language immersion programs, STEM and STEAM programs, and an institution dedicated to performing
arts should also be priorities. Another theme focused on equity and feelings that future projects should be
equally distributed and not just localized in one region. Overall, an overarching theme expressed by a

PRINCE GEORGE’S COUNTY PUBLIC SCHOOLS MASTER PLAN SUPPORT PROJECT
B R A I L S F O R D & D U N L A V E Y I N S P I R E . E M P O W E R . A D V A N C E . 1 . 5 . 10
majority of all participants was that if PGCPS wants to become a world-class school system, it needs to
make the proper investments that reflect that commitment.
PLANNING WORKSHOPS
The project team engaged with PGCPS representatives in a series of four planning workshops for the
purposes of synthesizing the assessment data and findings with the goals and objectives into a set of
comprehensive master planning recommendations for all schools. These sessions allowed the project
team to develop master planning scenarios based upon objective data as well as a series of planning
principles and considerations. The workshops included representatives from the core work group and
Facilities Advisory Committee with representatives from Facilities, Pupil Accounting and School
Boundaries, Special Education, and Specialty Programs.
The workshops were intended to be iterative and deliberative as they built upon the internal knowledge of
the staff representatives as well as the planning expertise of the project team. The project team presented
further developed analysis and recommendations at each of the workshops and the discussions and review
of findings ultimately led to the mission-based principles, logistical considerations and planning strategies
described in detail in the following section.
The agenda topics were as follows:
Workshop No. 1:
Review of Vision, Objectives, and Goals
Review of Condition Data Analysis: Baseline Projects and Prioritization Review
Audience: Capital Programs and Pupil Accounting and School Boundaries staff
Workshop No. 2:
Utilization Analysis: Observations and Considerations and Potential Project Impacts
Program Implementation Strategies
Audience: Capital Programs and Pupil Accounting and School Boundaries Staff
Workshop No. 3:
Utilization Analysis (continued): Observations and Considerations and Potential Project Impacts
Academic Initiatives: Facility Needs and Objectives
Audience: Facility Advisory Committee w/ Academic and Special Education Representatives
Workshop No. 4:
Mission-based Principles and Logistical Considerations
Planning Strategies and Program Recommendations
Audience: PGCPS Leadership

SECTION 1.5 - SYNTHESIS AND RECOMMENDATIONS
J U N E 2 0 1 5
1 . 5 . 11
PLANNING PRINCIPLES AND STRATEGIES
The district’s goals, standards, and guidelines provided the project team with direct guidance on how facility
needs should be evaluated based upon size, capacity and utilization, grade configurations, program
offerings, adequacy of spaces, and square footage needs. Projects should be comprehensive and
meaningful, but considerate of operational needs. Keeping this in mind, the project team developed a set
of five strategies to guide the planning process.
The strategies were derived from two key components: a set of mission-based principles and a list of
logistical considerations. The mission-based principles serve as guidelines for implementation of the
district’s long-term vision and are one of the critical outcomes from the planning workshops. They are the
consolidation of the master planning guidelines, academic initiatives, and community input. Additionally,
the project team developed a list of logistical considerations to inform the team’s methodology for reviewing
site-based needs and formulating project recommendations and priorities that meet the district’s immediate
and long-term goals.
MISSION-BASED PRINCIPLES
Recommendations derived via the Master Plan Support Project must:
Support student achievement and PGCPS’s mission.
Minimize operating and capital costs.
Focus on at-risk facilities.
Consider the equitable distribution of project funds.
Maintain neighborhood schools.
Complete the program in 15-20 years.
“Support student achievement and PGCPS’s mission.”
Above all, project recommendations and priorities must support student achievement and PGCPS’s mission
to provide safe and effective schools that are educationally appropriate and meet local, state, and national
education standards. The project team used the board-approved educational specifications to evaluate
existing facility needs and develop project recommendations that represent the district’s vision of ideal,
modernized schools.

PRINCE GEORGE’S COUNTY PUBLIC SCHOOLS MASTER PLAN SUPPORT PROJECT
B R A I L S F O R D & D U N L A V E Y I N S P I R E . E M P O W E R . A D V A N C E . 1 . 5 . 12
“Minimize operating and capital costs.”
Project recommendations and priorities must focus on optimizing the portfolio and balancing underutilized
and overutilized spaces. Utilization rates are evaluated to determine if schools meet minimum school size
thresholds that support efficient use and effective operations. Specific planning recommendations may
involve boundary adjustments, such as sending students from schools that are overutilized to ones that are
underutilized. In cases of significant underutilization, this may mean closing a facility. Closures reduce the
size of the portfolio and the amount of square footage that needs to be maintained on an annual basis, as
well reduces the capital investments needed to address building deficiencies.
“Focus on at-risk facilities.”
Schools with physical conditions that put daily operations at risk need to be priorities within the master plan
recommendations. Examples of such facilities include those that require regular emergency work or
maintenance work that can no longer correct issues without major capital investment.
“Consider the equitable distribution of project funds.”
Project recommendations must be objective and data-driven. The detailed assessment data allows the
project team to recommended project types such as full renovation, limited renovation, or system
replacements based upon a detailed review of existing conditions and functional data. This approach
ensures the equitable and consistent development of appropriate project budgets while being sensitive to
the judicious use of funds. Additionally, the prioritization of projects is informed by evaluating a local area’s
need relative to the diverse set of needs across the district.
“Maintain neighborhood schools.”
When considering portfolio optimization actions, such as sending and receiving students, it is important to
maintain schools that are walkable and have coherent boundaries. Adjusting boundaries significantly at
schools where few students are transported would affect the cohesiveness of these communities and
programs, as well as increase transportation costs.
“Complete the program in 15-20 years.”
This mission-based principle is grounded in the desire for PGCPS to establish a stabilized routine of major
capital projects that replaces or updates a predictable percentage of facilities on an annual basis.
Additionally, by completing the program in 20 years, PGCPS will be able to focus on the 31 facilities not
included in this program3 which will need upgrade work by that time. Finally, there is a philosophical desire
3 See Appendix 3.2.13 for list of complete list of schools that do not have project recommendations as part of this assessment.

SECTION 1.5 - SYNTHESIS AND RECOMMENDATIONS
J U N E 2 0 1 5
1 . 5 . 13
to ensure that a student entering the school system starting in school year 2017 will attend at least one
modernized school before graduating from high school. This principle provides a goal for the project team
to use in balancing project design and construction schedules over time.
LOGISTICAL CONSIDERATIONS
In addition to the mission-based planning principles, numerous logistical considerations were developed to
ensure the comprehensive program can be implemented reasonably. The MPSP recommendations must
consider:
The impact to the immediate community during construction.
Land acquisition timelines.
The sequencing and selection of closures and consolidations.
Construction market and school district implementation capacity.
Annual funding constraints and means to maximize state funding eligibility.
“Impact to immediate community during construction.”
In order to minimize the impact to a local community during construction, a logistical consideration is that
no more than one major project should be under development at one time, unless extenuating
circumstances, such as severe overcrowding, dictate otherwise. This rationale is due to the disruption
construction activities can have on a community, as well as the need to plan for swing space, which is the
temporary housing of a school program while a facility is under construction. Two schools in proximity to
each other would likely compete for use of the same swing space.
“Land acquisition timelines.”
If a school project requires new land, its schedule and sequencing considerations must be sensitive to the
time required for site acquisition.
“Selection and sequencing of closures and consolidations.”
Closure and consolidation recommendations must be made carefully and substantiated with mission-based
planning principles and logistical considerations. The project team determined which underutilized schools
should be closed and how their students should be reassigned to other schools. To make these
determinations, the team reviewed school locations, accessibility needs, physical conditions, potential
transportation impacts, and other circumstances.

PRINCE GEORGE’S COUNTY PUBLIC SCHOOLS MASTER PLAN SUPPORT PROJECT
B R A I L S F O R D & D U N L A V E Y I N S P I R E . E M P O W E R . A D V A N C E . 1 . 5 . 14
“Construction market and school district implementation capacity.”
The district also needs to take into account the number of projects that can be reasonably supported by the
local construction market (e.g., design professionals, construction companies, skilled trade labor, etc.), as
well as its internal capacity to implement a large program (e.g., procurement, contracting, project
management, planning, accounting, and finance capabilities). This consideration relates to dollar volume
as well as the number of major projects occurring at once.
“Annual funding constraints and means to maximize state funding eligibility.”
In addition to balancing the construction market and internal implementation capacities, the district also
needs to consider how to maximize state funding eligibility. To ensure eligibility, the project team formulated
project recommendations and facility needs within categories that align with state definitions. Additionally,
projected project timelines align with the state review process. Annual funding constraints are unknown at
the time of this report; however, the project team modeled project sequencing to arrive at annual funding
levels that best address all of the mission-based principles and logistical considerations.
CORE PLANNING STRATEGIES
In order to address the varying, and often competing, needs of such a large school district, the project team
utilized five core planning strategies that were developed to accommodate the mission-based principles
and logistical considerations. The five strategies are:
1. Use planning areas to:
o Review logistical impacts and establish local sequencing;
o Optimize use of school facilities;
o Evaluate geographic distribution;
o Distribute Specialized Services and Specialty Programs; and
o Evaluate transportation impacts.
2. Focus investments on facilities over 15 years old.
3. Use objective data and tools to support recommendations and sequencing within planning areas.
4. Modernize receiving schools prior to sending students from over-enrolled schools or schools to be
closed.
5. Align project recommendation categories with state requirements.
SECTION 1.5 - SYNTHESIS AND RECOMMENDATIONS
J U N E 2 0 1 5
1 . 5 . 15
Strategy 1: Use of planning areas.
The project team organized the county into 40 planning areas to ensure that individual capital projects and
related master planning activities are implemented in coordination with nearby schools and to make certain
that the mission-based principles are applied equitably across the district. These planning areas represent
small groupings of schools of the same grade level by general geographic location. For elementary schools,
these groupings typically represent three to six schools that share common communities. Middle and high
schools are typically grouped by region (Northern, Central, Southern). Maps 3.1.2a through 3.2.2c show
all of the planning areas and the introduction to Volumes 2 and 4 both provide a list of all schools with their
corresponding planning area.
Organizing the schools in this manner allowed the project team to conduct a focused review of each facility
in terms of the mission-based principles and logistical considerations, and make project recommendations
that provide the most optimal solution for that planning area. A detailed review of local facility conditions
and needs, distribution of specialized services and specialty programs, logistical and transportation
impacts, sequencing requirements, and overall geographic distribution and portfolio optimization was
conducted to inform all recommendations. Each grouping of schools was reviewed in a disciplined and
deliberate manner by asking the following questions:
Which schools are projected to be severely4 over utilized? What is the optimal solution for such
schools (e.g., a capital investment like an addition, send students to adjacent school(s), or a
combination of both)?
Which schools are projected to be severely5 underutilized? What is the optimal solution for these
schools (e.g., downsize during renovation work, receive students, or close and consolidate
students)?
What is the ideal school size for the future population? What can the current building
accommodate?
What major spaces, such as a gymnasium or an auditorium, are currently missing and would
need added to accommodate enrollment or grade configuration changes?
What are the potential site constraints if increasing square footage is necessary to support the
projected enrollment?
4 For the purposes of this study, a severely overutilized school is defined as being greater than 120%. 5 For the purposes of this study, a severely underutilized school is defined as being less than 70%.

PRINCE GEORGE’S COUNTY PUBLIC SCHOOLS MASTER PLAN SUPPORT PROJECT
B R A I L S F O R D & D U N L A V E Y I N S P I R E . E M P O W E R . A D V A N C E . 1 . 5 . 16
Strategy 2: Focus investments on facilities over 15 years old.
Educational adequacy data and the application of the WFCI was only done for schools constructed prior to
1999 because newer schools were assumed to be in much better condition and more closely aligned with
current educational adequacy standards. Additionally, these schools are not immediately eligible for state
capital project funding and, therefore, capital projects are not recommended for them as part of the MPSP.
However, for many of these schools the project team did recommend master planning activities, including
the realignment of school boundaries.
Strategy 3: Use of objective data and tools support recommendations and sequencing within planning
areas.
The project team prioritized projects based on the critical needs, projected enrollments, existing conditions,
and logistical considerations within the planning areas. The team made extensive use of the WFCI and
educational adequacy priority scores, as well as the utilization and space adequacy data collected for each
school, to help determine the sequencing of capital projects within each planning area. These same data
points were also evaluated in aggregate to better understand the prevailing needs within each planning
area and to provide a means by which planning areas could be compared to one another. The results of
these analyses and the resulting implementation and sequencing strategies are detailed in the next section.
Strategy 4: Modernize receiving schools prior to sending students from over-enrolled schools or schools
to be closed.
When developing the sequencing of projects within a planning area, the project team was deliberate in its
efforts to ensure that students being asked to move to a new school would attend a school in better condition
than their current facility. This strategy is intended to drive a geographically-equitable distribution of capital
investments across the county and ensure that the start dates for major capital projects are also distributed
in an equitable manner.
Strategy 5: Align project recommendations categories with state requirements.
The project definitions methodology section of this report explained that the State of Maryland provides
guidelines for funding eligibility based upon specific project scope definitions. The project team developed
baseline project needs for all schools included in this study and established project types based upon the
state funding guidelines. As the project team evaluated each school within the context of its planning area,
the project types were frequently modified to accommodate the enrollment balancing strategies. In some
cases, the baseline project type was downgraded due to reduced future enrollment needs or, in other
situations, upgraded to allow for more students. In all cases, the revised project recommendations were
defined within the same project categories and based upon the definitions established within the baselines.

SECTION 1.5 - SYNTHESIS AND RECOMMENDATIONS
J U N E 2 0 1 5
1 . 5 . 17
FINAL PROGRAM SEQUENCING AND DELIVERY STRATEGY
The project team employed two levels of sequencing to inform the final program recommendation: internal
to each planning area and overall prioritization of the planning areas. Overall, the application of these
strategies allowed the project team to sequence projects over the course of the recommended program.
When delivered, the projects will provide optimal solutions to critical issues across the district.
INTERNAL PLANNING AREA SEQUENCING
The team developed a recommended sequencing strategy for all projects needed to achieve each planning
area’s program goals. These strategies were often driven by urgent existing conditions, such as severe
overutilization, severe underutilization, or significantly poor physical condition. Examples of some possible
sequencing scenarios are:
Severe overutilization of numerous schools in one planning area may lead to the
recommendation to build a new school. This new construction project may need to occur first to
rebalance enrollments across all schools in an area.
A significantly poor WFCI, underutilization, or a challenging site location may indicate that a
school is a candidate for closure. To redistribute students from a closing school, the district would
first need to construct additions at two nearby schools and revise boundaries.
The sequencing recommendations and the logic that supports them are described in the planning area
reports in the following section. Each internal sequencing recommendation is made relative to the
individual planning area and denoted in ascending order as by letters (“A”, “B”, “C”, “D”, or “E”).
PRIORITIZATION OF PL ANNING AREAS
Once the planning area sequencing schedules were completed, the team then developed an overall
prioritization strategy to address the district’s most critical projects first. The planning area priority levels
are as follows:
Priority 1: Areas with critical systems failures.
These planning areas include at-risk buildings which are identified as those with significant documented
maintenance issues that impact student learning and that are a significant drain on the annual maintenance
budget. These schools have conditions that put daily operations at risk and generally require regular
emergency work or maintenance work that can no longer correct issues without major capital investment.
Planning areas 34, 37, and 40 are in this prioritization category.

PRINCE GEORGE’S COUNTY PUBLIC SCHOOLS MASTER PLAN SUPPORT PROJECT
B R A I L S F O R D & D U N L A V E Y I N S P I R E . E M P O W E R . A D V A N C E . 1 . 5 . 18
Priority 2: Areas that are critically utilized.
These areas are where the projected utilization for all schools within the planning area averages 120
percent or greater. In these situations, the only solution is the construction of new schools and/or
substantial additions to existing schools. This priority grouping also includes projects already in the existing
CIP. Planning areas 3, 12, 15, 17, and 38 are in this category.
Priority 3: Areas with one or more severely over utilized schools where construction is the required solution.
This category includes planning areas with at least one individual school that is severely over utilized and
the only solution available to resolve the problem is a capital project rather than a master planning action
such as a boundary adjustment. Planning areas 2 and 36 are in this category.
Priority 4: Areas with one or more severely over utilized schools where master planning action could be an
alternative to a capital investment.
This category includes those planning areas with at least one severely over utilized school where a capital
investment is the recommended solution, but where a master planning action, such as a boundary
adjustment, could be an alternative. The project team distinguished this category from priority 3 since a
temporary and/or permanent solution to an individual school’s severe overutilization could be put in place
operationally. Planning areas 5, 7, 9, and 35 are in this category.
Priority 5: Areas with overall critical WFCI scores.
This category includes planning areas not covered by priorities one through four above where facility life
cycle analysis data indicate system replacement needs are imminent. Those planning areas with an overall
average WFCI priority score of seven or below are included in this category. This category, as well as the
next, occur after the priorities addressing utilization because if a building or system failure were to occur,
capacity exists within the planning area to provide a temporary or permanent solution by relocating students
to another facility. Planning Areas eight, 21, 29, and 32 are in this category.
Priority 6: Areas with one or more schools with a severe WFCI score.
This category includes the remaining planning areas with at least one school with a WFCI of 5 or below.
Ten planning areas are in this category: 10, 16, 18, 24, 25, 26, 27, 30, 31, and 33.

SECTION 1.5 - SYNTHESIS AND RECOMMENDATIONS
J U N E 2 0 1 5
1 . 5 . 19
Priority 7: Balance of planning areas.
All remaining planning areas that did not meet the criteria for priorities one through six are included in this
priority group. A common theme of these planning areas is that a master planning action to help balance
utilization and optimize the portfolio could occur prior to the investment of any capital dollars for physical
facility upgrades. While this grouping has the lowest priority level, there are still schools with significant
needs and the planning effort initiates, at least one project within every planning area in the first ten to
twelve years of the recommended modernization program. Thirteen Planning Areas are in this category:
One, four, six, 11, 13, 14, 19, 20, 22, 23, 28, 32, and 39.
This prioritization strategy organizes the planning areas by critical needs while addressing the required
sequencing of work to achieve a balanced planning area. Organizing the planning areas by critical need
addresses a goal of focusing on at-risk facilities and conditions while maintaining the sequential
relationships within each planning area. This approach minimizes operating and capital costs and
addresses the logistical considerations. By ensuring that all planning areas sequences start in the first half
of the capital program, there will be a natural and equitable distribution of projects and funds across the
school district.
The next section of this report provides the detailed results and comprehensive program recommendations
resulting from the application of the planning and prioritization strategies. Volume two includes individual
reports for each planning area, a summary of the key observations and considerations, a comprehensive
list of recommended implementation activities, and the associated capital investment recommendations for
each school in the district.

PRINCE GEORGE’S COUNTY PUBLIC SCHOOLS MASTER PLAN SUPPORT PROJECT
B R A I L S F O R D & D U N L A V E Y I N S P I R E . E M P O W E R . A D V A N C E . 1 . 5 . 20
AGGREGATE RESULTS AND RECOMMENDATIONS
PROGRAM OVERVIEW
Applying the planning and prioritization strategies, the project team developed a detailed 20-year, $8.5
billion modernization program that addresses all deferred capital improvements and ensures all schools
are educationally appropriate per the latest standards and guidelines. The recommended modernization
program includes 140 capital projects sequenced over twenty fiscal years starting in 2017 and requires on
average $425 million annually over the life of the program. This program will provide an optimized portfolio
with balanced utilization rates achieved via multiple boundary realignments and specific school closure
recommendations.
The $8.5 billion total program value is a function of the direct project costs for the 140 recommended capital
projects, annual escalation to these project costs, and incorporating other program level costs such as
capital labor and contingency. The following section provides an overview of these costs as well as overall
program outcomes and recommended detailed next steps.
Project Costs $5.5 billion
Project Escalation $2.3 billion
Program Costs $0.7 billion
Total: $8.5 billion
Category: Value
FIGURE 1.5.1: Modernization Program Cost Categories
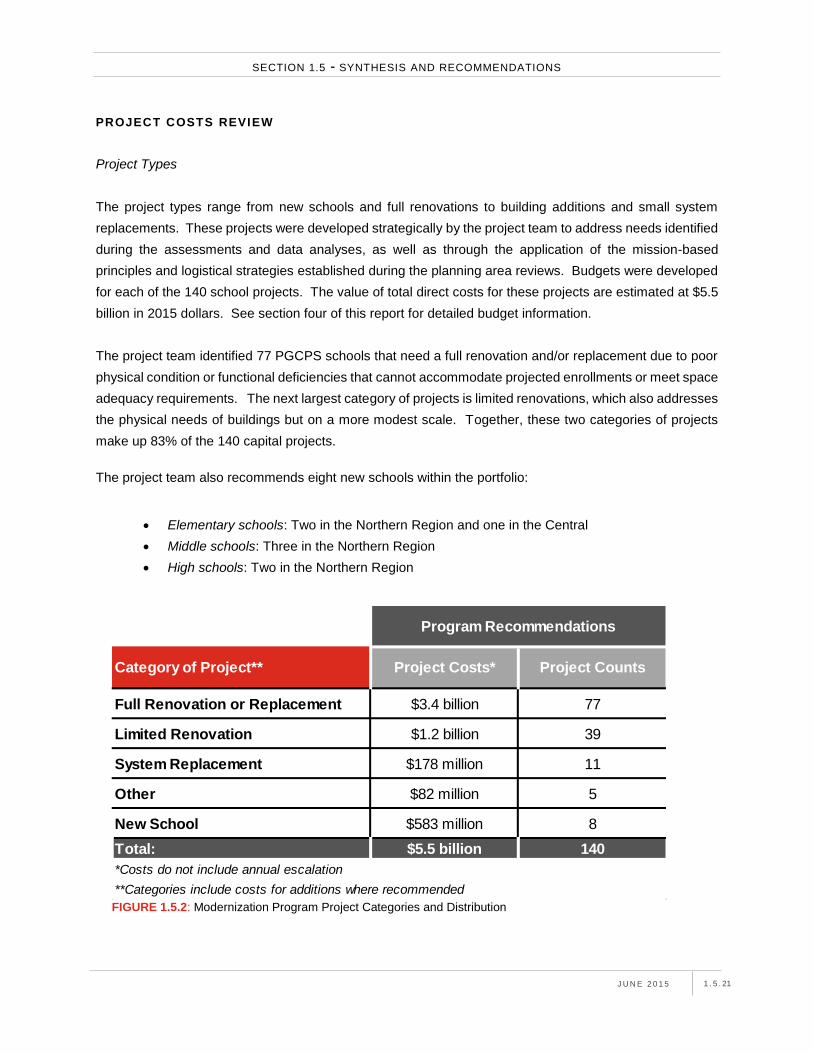
SECTION 1.5 - SYNTHESIS AND RECOMMENDATIONS
J U N E 2 0 1 5
1 . 5 . 21
PROJECT COSTS REVIEW
Project Types
The project types range from new schools and full renovations to building additions and small system
replacements. These projects were developed strategically by the project team to address needs identified
during the assessments and data analyses, as well as through the application of the mission-based
principles and logistical strategies established during the planning area reviews. Budgets were developed
for each of the 140 school projects. The value of total direct costs for these projects are estimated at $5.5
billion in 2015 dollars. See section four of this report for detailed budget information.
The project team identified 77 PGCPS schools that need a full renovation and/or replacement due to poor
physical condition or functional deficiencies that cannot accommodate projected enrollments or meet space
adequacy requirements. The next largest category of projects is limited renovations, which also addresses
the physical needs of buildings but on a more modest scale. Together, these two categories of projects
make up 83% of the 140 capital projects.
The project team also recommends eight new schools within the portfolio:
Elementary schools: Two in the Northern Region and one in the Central
Middle schools: Three in the Northern Region
High schools: Two in the Northern Region
Full Renovation or Replacement $3.4 billion 77
Limited Renovation $1.2 billion 39
System Replacement $178 million 11
Other $82 million 5
New School $583 million 8
Total: $5.5 billion 140
*Costs do not include annual escalation
**Categories include costs for additions where recommended
Program Recommendations
Category of Project** Project Costs* Project Counts
FIGURE 1.5.2: Modernization Program Project Categories and Distribution
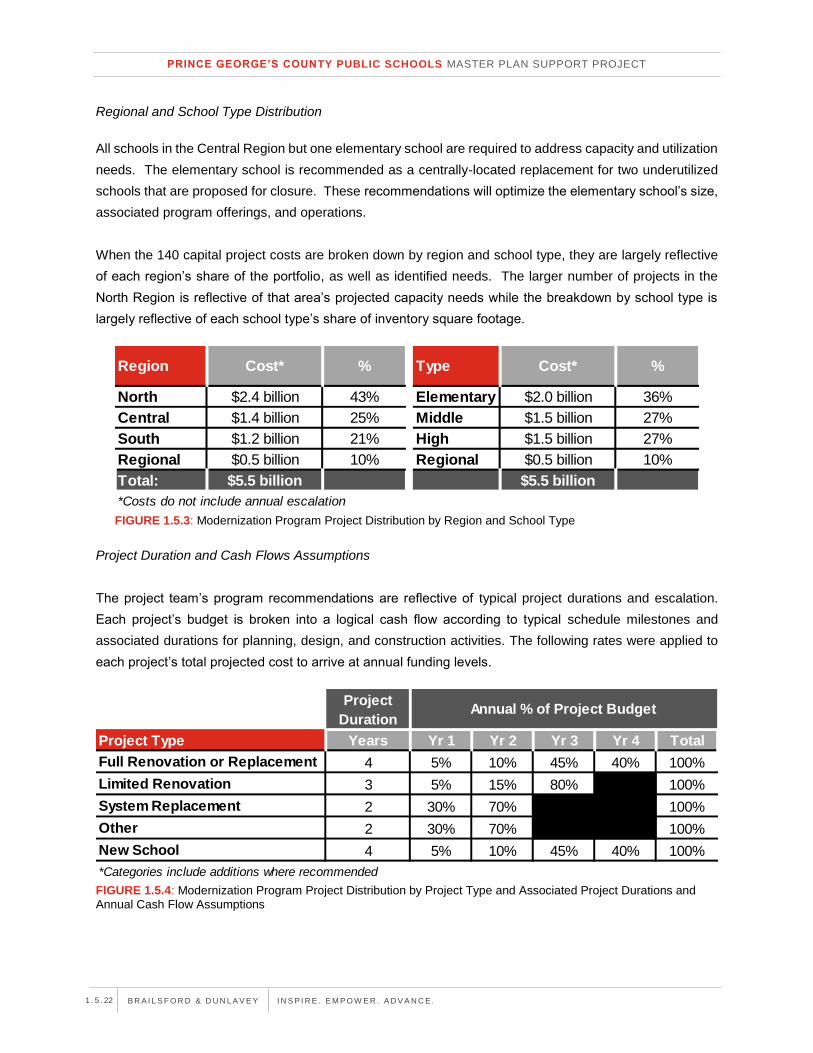
PRINCE GEORGE’S COUNTY PUBLIC SCHOOLS MASTER PLAN SUPPORT PROJECT
B R A I L S F O R D & D U N L A V E Y I N S P I R E . E M P O W E R . A D V A N C E . 1 . 5 . 22
Regional and School Type Distribution
All schools in the Central Region but one elementary school are required to address capacity and utilization
needs. The elementary school is recommended as a centrally-located replacement for two underutilized
schools that are proposed for closure. These recommendations will optimize the elementary school’s size,
associated program offerings, and operations.
When the 140 capital project costs are broken down by region and school type, they are largely reflective
of each region’s share of the portfolio, as well as identified needs. The larger number of projects in the
North Region is reflective of that area’s projected capacity needs while the breakdown by school type is
largely reflective of each school type’s share of inventory square footage.
Project Duration and Cash Flows Assumptions
The project team’s program recommendations are reflective of typical project durations and escalation.
Each project’s budget is broken into a logical cash flow according to typical schedule milestones and
associated durations for planning, design, and construction activities. The following rates were applied to
each project’s total projected cost to arrive at annual funding levels.
North $2.4 billion 43% Elementary $2.0 billion 36%
Central $1.4 billion 25% Middle $1.5 billion 27%
South $1.2 billion 21% High $1.5 billion 27%
Regional $0.5 billion 10% Regional $0.5 billion 10%
Total: $5.5 billion $5.5 billion
*Costs do not include annual escalation
Region %Cost*Type%Cost*
FIGURE 1.5.3: Modernization Program Project Distribution by Region and School Type
Project
Duration
Project Type Years Yr 1 Yr 2 Yr 3 Yr 4 Total
Full Renovation or Replacement 4 5% 10% 45% 40% 100%
Limited Renovation 3 5% 15% 80% 100%
System Replacement 2 30% 70% 100%
Other 2 30% 70% 100%
New School 4 5% 10% 45% 40% 100%
*Categories include additions where recommended
Annual % of Project Budget
FIGURE 1.5.4: Modernization Program Project Distribution by Project Type and Associated Project Durations and
Annual Cash Flow Assumptions

SECTION 1.5 - SYNTHESIS AND RECOMMENDATIONS
J U N E 2 0 1 5
1 . 5 . 23
Escalation Assumptions
Accounting for construction escalation is critical to the mitigation of future cost exposures due to changes
in market conditions, such as increases in construction materials or labor.
Escalation was applied by fiscal year to project costs originally estimated in 2015 dollars. The escalation
calculation factors:
Project start year and duration
Project costs by fiscal year
Annual escalation rate
Following the recommendation of the program’s cost estimator and its review of national and regional
industry trends, the project team used an annual 3.5% escalation rate. This rate was applied to the
individual fiscal year project costs according to the year they are projected to occur within.
For example at a baseline level, a $100 million full renovation project would have costs occurring in four
fiscal years: $5 million in year 1, $10 million in year 2, $45 million in year 3, and $40 million in year 4. If this
project started in 2020, annual escalation calculation of year 1 costs would consider five years of escalation
at a rate of 3.5 percent; annual escalation calculation of year 2 costs would consider six years of escalation
at a rate of 3.5 percent and so on.
When accounting for all 140 projects over the twenty-year program, there is approximately $2.3 billion in
anticipated escalation over the life of the program.
OTHER PROGRAM COSTS
The project team’s recommendations also include program contingencies not associated directly with
individual school projects, but are part of larger program needs or unforeseeable future needs. One such
contingency is capital labor, which includes the internal and/or external support staff needed to implement
the program. Depending on further assessment of required resource needs, this labor may include project
management, procurement, financial, and legal services needed for project management, accounting, and
controls.
Compliance expense is another category of contingency. This expense covers future facility changes that
may be required by governmental agencies, but are outside the scope of the individual projects. Mandates
may come from changes to local policy and/or state and federal regulations and may include projects such
as storm water management, sustainability, security, or accessibility upgrades.

PRINCE GEORGE’S COUNTY PUBLIC SCHOOLS MASTER PLAN SUPPORT PROJECT
B R A I L S F O R D & D U N L A V E Y I N S P I R E . E M P O W E R . A D V A N C E . 1 . 5 . 24
Lastly, the program contingency category includes funding for unforeseeable conditions or needs outside
of individual project construction contingencies. For example, a sudden population growth may require an
additional school to support capacity needs or a major academic program change.
Each of these program cost categories was calculated at 3% of total projects costs occurring each fiscal
year, when accounting for the sequencing of all 140 projects over the twenty-year program, this totals $700
million over the life of the program.
OTHER MASTER PLANNIN G ACTIONS
The modernization program includes recommendations for other master planning actions that do not involve
capital projects directly and, therefore, have no associated project costs included within the $5.5 billion in
direct project costs. These actions include boundary adjustments, such as receiving students at a school
built within the last fifteen years that does not currently require a major capital investment, or closures and
consolidations. A majority of schools are impacted by proposed boundary adjustments and the sending and
receiving of students. Those recommendations are described in detail in the planning area reports.
The project team identified twenty-nine (29) school facilities as candidates for closure and consolidation
with other existing programs to support optimization of the portfolio over the twenty-year program. The
closures support the balancing of utilization across the portfolio and, in particular, help consolidate small,
undersized elementary schools. Each closure recommendation will need to follow PGCPS policy and
further study and engagement.
These twenty-nine closures represent approximately $616 million in program savings over a 20-year period
by eliminating the need to invest in capital projects for those buildings. If these projects were included, un-
escalated project costs would total $6.1 billion. The following closures are recommended:
Elementary Schools: 2 North, 13 Central, 11 South
High Schools: 1 Central, 2 South
Please refer to the planning area reports in Volume 2 and Volume 4 for the detailed analyses supporting
these recommendations.

SECTION 1.5 - SYNTHESIS AND RECOMMENDATIONS
J U N E 2 0 1 5
1 . 5 . 25
PROGRAM IMPLEMENTATI ON TIMELINE
Implementation of the program is recommended to occur over a twenty-year period at an average
investment of $425 million a year. The project team modeled a detailed sequencing and funding plan over
this time period to confirm the ability to complete all 140 capital projects and comply with mission-based
principles and planning strategies. Projects were distributed across the twenty years according to the
planning area and program wide sequencing strategies described earlier in this section.
On average, this program timeline assumes 25 active projects in some stage of progress each fiscal year,
with a range of 10 to 37 active projects at any one time. Required funding levels to support these activities
vary over time, according to the stage of projects occurring each fiscal year and their relevant cash flow.
The program will begin slowly to allow for project ramp up, with required year 1 (2017) funding of $48.7
million.
CIP Cycles
The capital program recommendations are broken down into three CIP cycles. The first two cycles
represent typical six-year CIP durations while the third captures the final eight years of the program. These
three cycles help inform how the modernization program can be implemented and managed over time. It
is important to note that project durations may span two cycles. A project may start towards the end of a
cycle and complete in the beginning of the next cycle.
FIGURE 1.5.5: Program Information by CIP Cycle
Duration
Cycle Fiscal Years Started Completed
Value of
Projects
Started*
Ave. Total
Cost per
FY
Total Costs
Occuring**
Cycle 1
(year 1 - year 6)2017 - 2022 45 27 $2.1 billion $307 million $2 billion
Cycle 2
(year 7 - year 12)2023 - 2028 64 56 $2.3 billion $470 million $3.1 billion
Cycle 3
(year 13 - year 20)2029 - 2036 31 58 $1.1 billion $392 million $3.4 billion
140 141 $5.5 billion $8.5 billion
*Reflects the total value of projects started within this cycle according to their 2015 un-escalated project costs.
**Costs reflect project costs per fiscal year, escalated accordingly, as well as recommended other program costs.
Projects Program Costs

PRINCE GEORGE’S COUNTY PUBLIC SCHOOLS MASTER PLAN SUPPORT PROJECT
B R A I L S F O R D & D U N L A V E Y I N S P I R E . E M P O W E R . A D V A N C E . 1 . 5 . 26
Cycle 1
Based upon the project team’s analysis and understanding of critical needs, the program’s first cycle is
focused on alleviating capacity issues district wide, especially at the middle school level. During these first
six years, 45 projects valued at $2.1 billion in direct project costs will be started, which represents 39% of
the total program and an average of 23 active projects per fiscal year. During this cycle, all regions and
school types receive projects and half of the planning areas have at least one active project.
By the end of the first cycle in 2022, 26 of the 45 projects should be completed, with the balance being
completed in the first few years of the second cycle. The cycle 1 projects will cost $2 billion and require
average annual investments of $334 million to fund all direct, escalation, and program level costs. Only
planning areas 11 and 14 do not start projects by 2024. These areas only have two capital projects each,
which begin in years 2027 and 2028.
Cycle 2
Cycle 2 focuses on conditions and consolidations, in addition to the continued alleviation of overutilization.
During this second phase, 64 projects valued at a total of $2.3 billion in direct project costs are
recommended to be started, which is 41% of the total program. The average number of active projects
each year in this cycle increases to 34.
By 2028, 56 additional projects should be completed, bringing the total completed to 82, which is 75% of
the projects started during the first two cycles and 58% of the total capital projects. Total funding for this
cycle increases to $3.1 billion or $512 million annually, inclusive of all direct, escalation and program level
costs.
Cycle 2
Cycle 3 completes the program over its eight years. The final 31 projects will be stared in the first six years
of this cycle, with direct project costs valued at $1.1 billion or 20% of the total program budget. This cycle’s
average number of active projects each year decreases to 19, with the last six projects closing out in the
final two years, 2033 and 2034.

SECTION 1.5 - SYNTHESIS AND RECOMMENDATIONS
J U N E 2 0 1 5
1 . 5 . 27
The distribution of projects across the Northern, Central and Southern Regions is detailed in Figure 1.5.6.
The larger quantity of projects in the Northern Region is necessitated by the significant overutilization issues
which require the implementation of construction projects. The greater quantity of underutilized schools in
the Central and Southern regions allowed the project team to more frequently recommend alternatives to
construction such as boundary adjustments or closures.
North 20 $1 billion 22 $876 million 15 $495 million 57 $2.4 billion
Central 12 $659 million 15 $514 million 7 $223 million 34 $1.4 billion
South 6 $275 million 16 $638 million 7 $246 million 29 $1.2 billion
Regional 7 $186 million 11 $304 million 2 $52 million 20 $0.5 billion
Total: 45 $2.1 billion 64 $2.3 billion 31 $1.0 billion 140 $5.5 B
Elementary 20 $564 million 40 $1 billion 20 $367 million 80 $1.9 billion
Middle 14 $932 million 5 $278 million 5 $261 million 24 $1.5 billion
High 4 $444 million 8 $718 million 4 $337 million 16 $1.5 billion
Regional 7 $186 million 11 $300 million 2 $52 million 20 $0.5 billion
Total: 45 $2.1 billion 64 $2.3 billion 31 $1.0 billion 140 $5.5 B
*Reflects the total value of projects started within this cycle according to their 2015 un-escalated project costs.
Count Value* Count Value*
Cycle 1
(2017 - 2022)
Cycle 2
(2023 - 2028)
Cycle 3
(2029 - 2036)Program Total
Region Count Value* Count Value*
Value* Count Value* School Type Count Value* Count Value* Count
FIGURE 1.5.6: Cycle 1, 2, 3 Program Information Distributed by Region and School Type

PRINCE GEORGE’S COUNTY PUBLIC SCHOOLS MASTER PLAN SUPPORT PROJECT
B R A I L S F O R D & D U N L A V E Y I N S P I R E . E M P O W E R . A D V A N C E . 1 . 5 . 28
Cycle 1 (2017 – 2022) Detail
As outlined previously, cycle 1 (2017 – 2022) represents 45 active projects. The start year for these 45
projects are sequenced across the six fiscal years. The project duration, cash flow assumptions, and
escalation calculation are applied to each and annual project costs allocated accordingly across the
succeeding fiscal years. Twenty-six projects should be completed by 2022 and the remaining 19 projects
that begin in cycle 1 will be completed in cycle 2.
As previously mentioned, the project team recommends that program costs, such as capital labor,
compliance, and program contingency, be included to implement the modernization program on an annual
basis. When these costs are included, the total costs projected to occur through 2022 is $2 billion. The
19 ongoing projects will require $752 million within cycle 2 to complete all projects started within cycle 1.
FIGURE 1.5.7: Cycle 1 Program Detail
FY17 FY18 FY19 FY20 FY21 FY22 FY23 FY24 FY24
14 18 23 34 25 26 19 10 6
0 0 0 13 6 7 9 4 6
13
1
4
5
1
1
8
1
1
3
1
6
$44,633 $105,219 $471,244 $571,144 $312,049 $335,389 $267,800 $274,299 $148,535
$4,017 $9,470 $42,412 $51,403 $28,084 $30,185 $24,102 $24,687 $13,368
$48,650 $114,689 $513,656 $622,546 $340,133 $365,574 $291,902 $298,986 $161,903
*5-year duration includes additional project
($'s in $1,000)
$752,791
Sub-Total Other
Program Costs:
Annual Project
Costs w/ Escalation:
Total Annual Costs:
$2,005,249
(3) FY21 - FY24
(1) FY22 - FY24
(6) FY22 - FY25
No. of Projects:
Active:
Completed:
Per Project
Duration:
(13) FY17 - FY20
(1) FY17 - FY21*
(4) FY18 - FY21
(5) FY19 - FY22
(1) FY20 - FY21
(1) FY20 - FY22
(8) FY20 - FY23
(1) FY21 - FY22
(1) FY21 - 23
Cycle No. 1: Ongoing into Cycle 2

SECTION 1.5 - SYNTHESIS AND RECOMMENDATIONS
J U N E 2 0 1 5
1 . 5 . 29
As with any master planning process, assumptions are made regarding probable future conditions. In the
case of the MPSP, these assumptions pertain largely to the condition of buildings, their desired future
functional uses, applicable guidelines and standards, and projected enrollment. The project team’s
analyses were based upon reasonable assumptions, original research, information provided by PGCPS
and other reliable sources, reasonable analytical techniques, and professional judgment. Economic and
market conditions, enrollment changes, and implementation timing, as well as other important
circumstances, often do not occur as planned and such deviations can be material. To mitigate these
conditions, the project team recommends that PGCPS review the findings of this report during the annual
state required planning process.
PROGRAM OUTCOMES
The outcomes of this modernization program align with the strategic goals and mission of PGCPS by
correcting all deferred capital improvements and ensuring all schools are educationally appropriate per the
latest standards. The modernization program will provide an optimized portfolio with balanced utilization
rates that minimizes operating costs while maintaining neighborhood schools and improving access to
specialty academic programs and for special needs students.
PORTFOLIO OPTIMIZATION AND PROGRAM DISTRIBUTION
Implementation of the recommended modernization program will improve the capability of PGCPS to deliver
high-quality academic programs countywide. Project recommendations included within the program contain
strategies to distribute academic programs equitably throughout the district. In addition, planning areas
were used to evaluate the geographic distribution of specialized education services and specialty programs.
The distribution of specialty programs, such as language immersion and creative and performing arts,
supports student achievement by allowing a diversity of educational pedagogy to be accessible to students
across the county.
The ability to serve special needs students is a core part of the PGCPS mission. The project team, with
support from PGCPS staff, evaluated the distribution of specialized education services throughout the
district and recommend distributing such services to a greater number of schools. The core objective of
these shifts is to advance the goal of serving all students in the least restrictive environment. Appendix
3.2.9 describes the redistribution recommendations.
Based on the current facility portfolio size, the annual PGCPS maintenance and operations budget is
approximately $3.00 per square foot, which is well below the national average of $4.42 per square foot6.
The program recommends a reduction in overall portfolio square footage, which if PGCPS maintains the
6 According to a national survey issued in January 2009 as part of the 38th Annual Maintenance & Operations Cost Study for
Schools prepared by American School & University Magazine.

PRINCE GEORGE’S COUNTY PUBLIC SCHOOLS MASTER PLAN SUPPORT PROJECT
B R A I L S F O R D & D U N L A V E Y I N S P I R E . E M P O W E R . A D V A N C E . 1 . 5 . 30
same annual spending on maintenance and operations, will result in an increase to $3.62 square foot. This
increase will allow PGCPS to service its facilities better and reduce the future risks of deferred maintenance.
Once the 20-year program is completed, many old facilities will be replaced so PGCPS should be able to
normalize its building renewal and maintenance schedules.
One of the major driving factors in the analysis of PGCPS’ needs was building utilization rates.
Overutilization and underutilization both create negative impacts on the system. Underutilization creates
cost impacts by forcing PGCPS to continue maintaining and operating more facilities than are needed.
Overutilization creates cost impacts due to the extensive need for relocatable mobile educational units.
Negative impacts on students are seen in both situations. Program offerings are frequently reduced in
underutilized areas. Overutilization often creates unsuitable student to teacher ratios and conversion of
program spaces to educational uses.
This program recommends balancing portfolio utilization across the 20-year program period. As shown
below, once completed the program results in a 63-percent increase districtwide in ideally-utilized schools
and a 38-percent decrease in underutilized and overutilized schools. Furthermore, the program
recommendations resolve the critical overutilization concerns in the northern portion of the county and the
critical underutilization concerns in the central and southern portions of the county.
FIGURE 1.5.8: Districtwide Comparison of Current Utilization to Proposed Utilization at Program Completion

SECTION 1.5 - SYNTHESIS AND RECOMMENDATIONS
J U N E 2 0 1 5
1 . 5 . 31
PROJECT DISTRIBUTION
One goal of the proposed modernization program was creating an equitable distribution of projects
throughout the district. The final recommendations do not include an equal number of projects in each
region; however, the proposed project implementation and sequencing approach is equitable in that it
focuses on areas of critical need first and impacts planning areas in all regions evenly throughout all phases
of the program. The plan addresses population changes across the county by putting buildings where the
people are. Maps 3.1.3a through 3.1.3f show how projects are distributed throughout the region over the
20-year program. The maps show graphically the growth of fully modernized facilities and illustrate that it
is important to focus on the overall outcome of strong and supportive schools across the entire school
system over the particular dollar value associated with any one project.
FIGURE 1.5.9: Comparison of Current Utilization to Proposed Utilization at Program Completion by Region
PRINCE GEORGE’S COUNTY PUBLIC SCHOOLS MASTER PLAN SUPPORT PROJECT
B R A I L S F O R D & D U N L A V E Y I N S P I R E . E M P O W E R . A D V A N C E . 1 . 5 . 32
PROGRAM TIME / VALUE COMPARISONS
Escalation risk creates a sense of urgency since the longer the program takes to complete, the more it will
cost. The recommendations presented in this report propose a program construction budget that averages
$425 million per year with projected costs of $8.5 billion over 20 years. By contrast, using the current annual
funding model of $130 million per year, the estimated cost to complete the same list of projects inflates to
over $17 billion with an implementation timeline in excess of 65 years. Most major building systems (HVAC,
roofs, plumbing, electric, etc.) have life spans of 30-35 years, which effectively means that maintaining the
status quo in PGCPS will result in worsening conditions, rapidly increasing maintenance and operations
costs, and a continued inability to meet building deficiencies while keeping up with maintenance costs.
MISSION FOCUS: ALIGNMENT WITH PRINCIPLES
The Master Plan Support Project recommends a modernization program that is aligned with PGCPS’
principles as established by the Board of Education, CEO, and key administrators and staff. The MPSP
documents the district’s significant building condition concerns and describes the county’s desire to teach
its students in a sustainable portfolio of schools that supports educational reform initiatives.
The MPSP puts forward aggressive recommendations that more than triple annual capital expenditures.
The plan acknowledges that maintaining the status quo does not align with the achievement of the principles
PGCPS described throughout this project. The maintenance of current funding levels will force PGCPS to
defer some required work for years, which only delays the inevitable need and assures that repairs will be
more expensive, or requires significant reductions in scope that will cause the untenable abandonment of
mission-based principles.
In the end, the 20-year, $8.5 billion program is the most logical option to overcome utilization challenges,
address facility condition issues, minimize school district operating costs, and provide long-term support for
student achievement. The plan achieves all of the objectives as quickly and economical as practical.
PGCPS and the county have many difficult decisions to make and much is unknown about public
willingness to embrace such an aggressive course of action. However, the level of need in the county has
reached a critical point and it is clear to the authors of this report that PGCPS should begin working
immediately on next steps to implement the MPSP recommendations.

SECTION 1.5 - SYNTHESIS AND RECOMMENDATIONS
J U N E 2 0 1 5
1 . 5 . 33
NEXT STEPS AND IMPLEMENTATION RECOMMENDATIONS
Achievement of the goals identified for this project will require not only approval and advancement of the
overall plan and recommendations herein, but development of next steps to ensure that the
recommendations are pursued pragmatically and with mitigation of the many potential risks involved. The
seven initiatives outlined below, while possibly not comprehensive, should guide PGCPS as it continues
with the Master Plan Support Project.
1. Public Dissemination and Engagement: Present and explain the plan to the district’s residents;
incorporate their feedback.
2. Comprehensive Boundary Study: Conduct a detailed study of MPSP recommendations for
balancing school utilization to validate and finalize an implementation strategy.
3. Implementation Plan: Refine the forty area plans for project definition, sequencing, and
implementation within the program.
4. Capital Plan: Refine the budgeting tools and assumptions necessary to fund capital expenditures
from a viable financing structure.
5. Individual Project Feasibility Studies: Conduct individualized project planning with detailed
consideration of site- and school-specific needs, design opportunities, and budget parameters.
6. School Closure(s) Process: Apply the defined public process for consideration and approval of
school closures to those schools recommended for closure within the context of their individual
planning areas.
7. Plan Updates and Refinement: Annually update and refine the planning area recommendations
as feedback, new planning information, and strategic direction from PGCPS is received.
The specific tasks listed below to be undertaken within each category should be considered in detail;
however, overall outlines for each are provided below.
PUBLIC DISSEMINATION AND ENGAGEMENT
The MPSP recommendations are comprehensive, complex, and possibly controversial given their financial
and programmatic impacts; therefore, a comprehensive community engagement strategy that proactively
brings the recommendations to the district’s residents and provides them with a meaningful opportunity to
shape the final outcomes is crucial. This strategy should be developed within the context of a broader
permanent communications plan that is closely linked with critical next steps, such as the boundary study
and the educational specification and feasibility study for each individual school.

PRINCE GEORGE’S COUNTY PUBLIC SCHOOLS MASTER PLAN SUPPORT PROJECT
B R A I L S F O R D & D U N L A V E Y I N S P I R E . E M P O W E R . A D V A N C E . 1 . 5 . 34
COMPREHENSIVE BOUNDARY STUDY
The MPSP includes recommendations for the balancing of school utilization that will require dozens of
school feeder pattern / boundary adjustments. As discussed in this report, the recommendations took into
account multiple critical factors, including neighborhood proximity and transportation. However, a detailed
analysis of local population characteristics and the impact on enrollment assumptions must be undertaken
to ensure the viability of the MPSP recommendations. Recommendations from the boundary study will, of
course, require formal adoption by the Board of Education and, therefore, must carefully consider feedback
from the local community, parents, and school staffs.
IMPLEMENTATION PLAN
While this report endeavors to answer both the “what?” and “why?” of a major school modernization effort,
it has not attempted to answer the question of “how?”. While the Master Plan Support Project gives detailed
attention to the interrelated issues of mission, condition, and function (the “why?”) and results in a specific
set of recommendations for a sequence of projects to be implemented throughout the county over a period
of time (the “what?”), many project implementation and logistical issues remain unresolved. The project
team recommends that a plan be developed to consider and resolve these issues.
Areas for consideration should include:
(1) Program Goals: What performance requirements should be established for the program?
Project schedules and performance:
How ambitious should PGCPS be for quick delivery of the recommended modernization projects
What parameters are acceptable for the scheduling of completion and opening dates (mid-year
openings, August / September openings only)?
What parameters are acceptable for temporary or swing accommodations during
implementation?
What contract measures, incentives, or penalties is PGCPS prepared to consider for ensuring
achievement of schedule goals?
Project budgets and performance:
What budget parameters should PGCPS impose on the program as a whole or on its component
projects? (These parameters must be tied to the estimates included within the Master Plan
Support Project; however, they must provide greater detail on project budgets and distinguish
between project-specific and overall program costs.)

SECTION 1.5 - SYNTHESIS AND RECOMMENDATIONS
J U N E 2 0 1 5
1 . 5 . 35
Project quality and performance:
What minimum standards should be set for building system and component quality, life
expectancy, and sustainability? (These parameters must be tied to the estimating assumptions
included within the Master Plan Support Project; however, they must provide more specific
performance-based details for building design, systems, and materials.
Economic inclusion goals:
What local employment and certified business contracting goals should PGCPS establish for the
Program’s planning, design, and construction services?
(2) Project Delivery Method(s): Given the program’s goals identified above, what alternative means of
project delivery should be considered for each of the various types of school modernization projects?
Consideration should be given to the schedule, budget, and quality control implications of the following
delivery methods:
Traditional design-bid-build
CM at risk
Design-build
Modified (hybrid) design-build
Other
Consideration should also be given to bundling projects of similar types in larger groups to obtain better
pricing and improve procurement efficiency. For example, PGCPS’s purchasing power should increase by
procuring multiple system upgrades through a single contract.
(3) Logistics:
Athough the program recommendations include substantive consideration for logistical limitations, the
development of project-specific strategies and program-level policies to address them is critical to
successful implementation.
Careful consideration should be given to the following items:
Detailed swing space plans.
Where will students be housed during construction and what are the risks and benefits associated
with the various options? What are the budget and schedule implications of the various options?
What do parents, teachers, and staff think about the options?
Student transportation:

PRINCE GEORGE’S COUNTY PUBLIC SCHOOLS MASTER PLAN SUPPORT PROJECT
B R A I L S F O R D & D U N L A V E Y I N S P I R E . E M P O W E R . A D V A N C E . 1 . 5 . 36
What are the cost impacts associated with transporting students during construction phases and
are those costs borne by the capital project budgets? Did the final planning area
recommendations result in an overall reduction in transportation needs? Were there any specific
recommendations that were problematic from a transportation perspective?
Procurement Strategies:
Is the current procurement protocol used by PGCPS adequate to administer the volume of work
recommended in this plan? What new personnel and policies can be put in place to ensure
compliance without impacting the implementation schedule?
Staffing needs:
What is the best alternative for managing and guiding the implementation of a modernization
program? Does PGCPS have adequate staff to oversee all projects and ensure appropriate
program controls and reporting are put in place? Is outside consulting necessary, what is the
best use of operating resources, and what roles should remain with PGCPS?
CAPITAL PLAN
The capital spending plan included herein provides a valid framework for distributing funds over the program
years. This plan needs to be finalized and then refined as needed to reflect changing assumptions and
conditions. In particular, consideration must be given to:
(1) Implementation plan implications: How will the implementation plan’s project budgets, schedules,
overall program cost requirements, and other implications be reflected in the CIP?
(2) Bond / financing analysis: How will project funds distributed over the years optimize the financing
structure and conform to allowable uses under bond covenants?
INDIVIDUAL PROJECT FEASIBIL ITY STUDIES AND EDUCATIONAL SPECIFICATIONS
The State of Maryland has a prescribed process for project fund authorization that requires a detailed study
of project feasibility to finalize program requirements, vet alternative construction options, and validate
project budgeting; however, given the limitations of state funding and the scale of PGCPS’s recommended
program, it is likely the district will need an independent funding strategy. Regardless of the funding
mechanism utilized, the project team strongly recommends that PGCPS adopt a program implementation
plan that incorporates detailed feasibility studies. The recommended project budgets, schedules, and
implementation sequencing strategies included in this report for all full and limited renovations should be
validated and refined by such studies. Key components of a feasibility study should include:

SECTION 1.5 - SYNTHESIS AND RECOMMENDATIONS
J U N E 2 0 1 5
1 . 5 . 37
An assessment of existing building conditions
Conceptual floor plans, elevations, and site plans for at least two options that satisfy the
educational and community program requirements
Narratives of each alternative describing key building systems, sustainability strategies, and
project phasing and implementation considerations
Construction cost estimates for each alternative
A final recommendation that includes a building life-cycle cost analysis
Concurrent with the development of individual feasibility studies, PGCPS should also develop individualized
educational specifications for each project. The current board-approved educational specifications provide
generic guidelines based upon typical school types. The individual Ed Specs will clarify local educational
and community program requirements and be reflective of the opportunities and constraints specific to each
facility. The creation of local Ed Specs must be closely coordinated with a comprehensive community
outreach strategy and the timing of the project’s feasibility study. Ideally, the local Ed Specs will be
completed concurrent with the issuance of formal RFP’s to procure architecture and engineering firms to
provide feasibility studies.
SCHOOL CLOSURE(S) PR OCESS
The project team recommends some school closures over the course of the program; however, these
recommendations cannot, and are not intended to, supersede the existing process that PGCPS uses to
consider and rule on school closures. Any closure discussion must follow the established process. PGCPS
must update the master plan if closures occur.
PLAN UPDATES AND REFINEMENT
The MPSP recommendations reflect existing conditions and were developed using current information and
planning strategies. PGCPS must integrate the MPSP recommendations into their Educational Facilities
Master Plan (EFMP) and continue to update and amend the EFMP regularly as planning assumptions and
conditions change, particularly market-driven factors like population demographics, school enrollments, and
construction costs. The project team recommends that Prince George’s County Public Schools integrate
amendments, as necessary, to the planning area recommendations as part of its annual educational facility
master plan update process.
Top Related