


Languages
Pages
Legal

Visualizing Geo DataJason Sundram, Data Scientist, PayPal
@jsundram
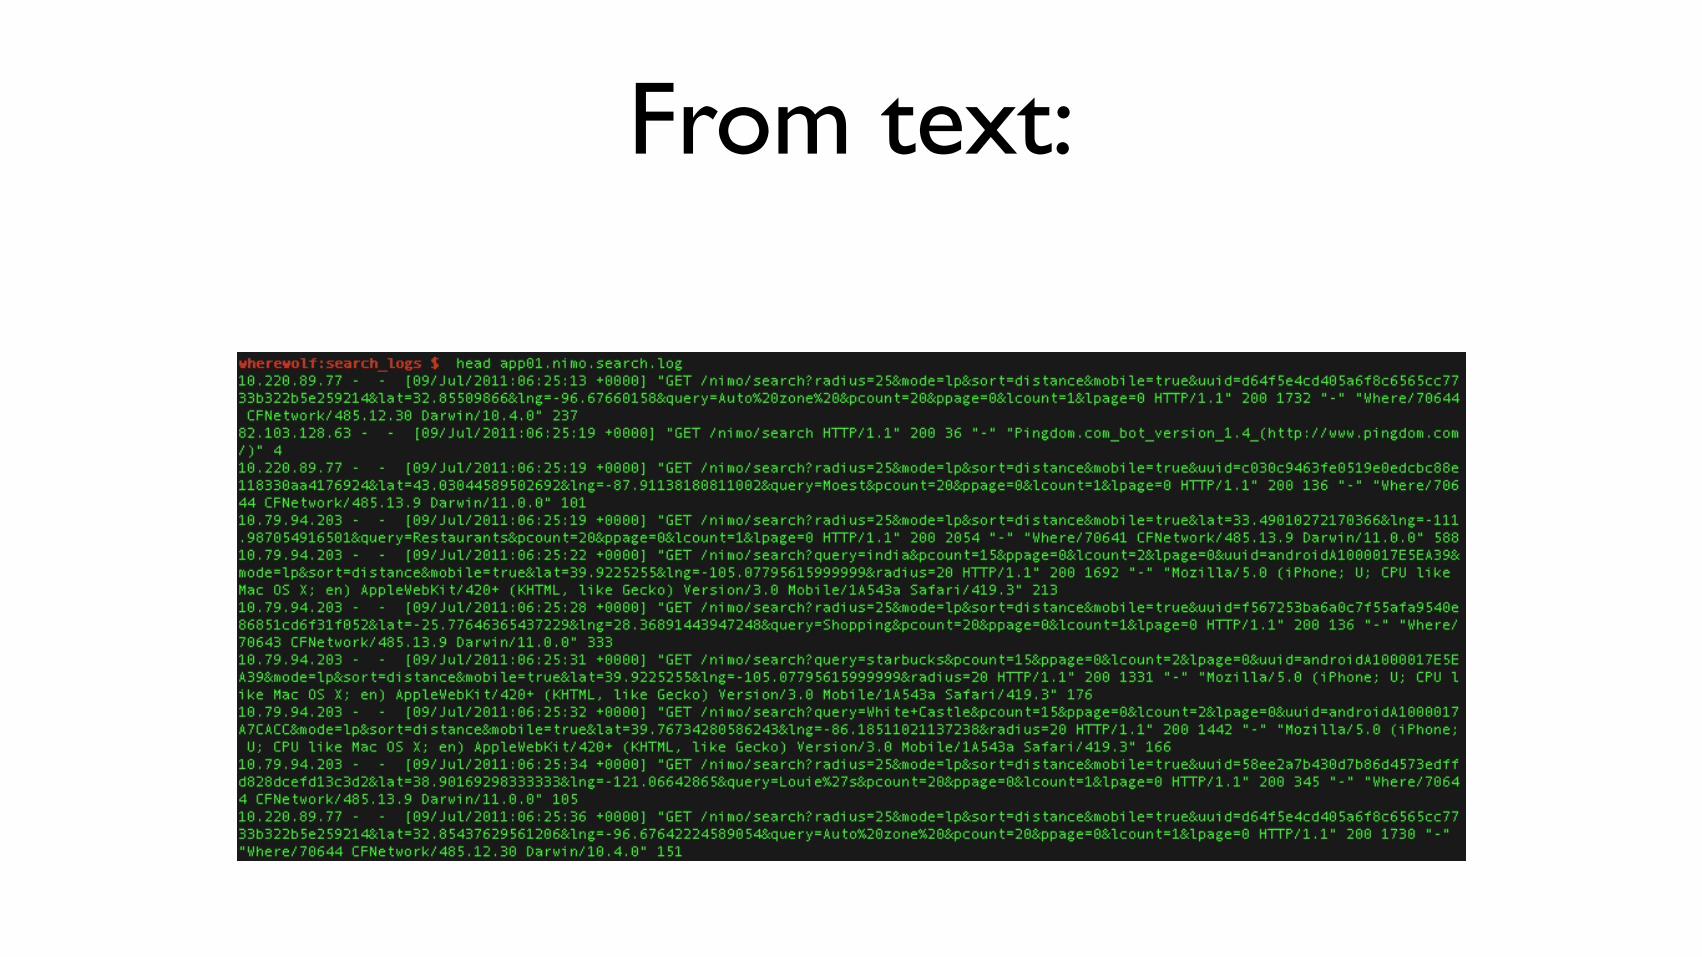
From text:
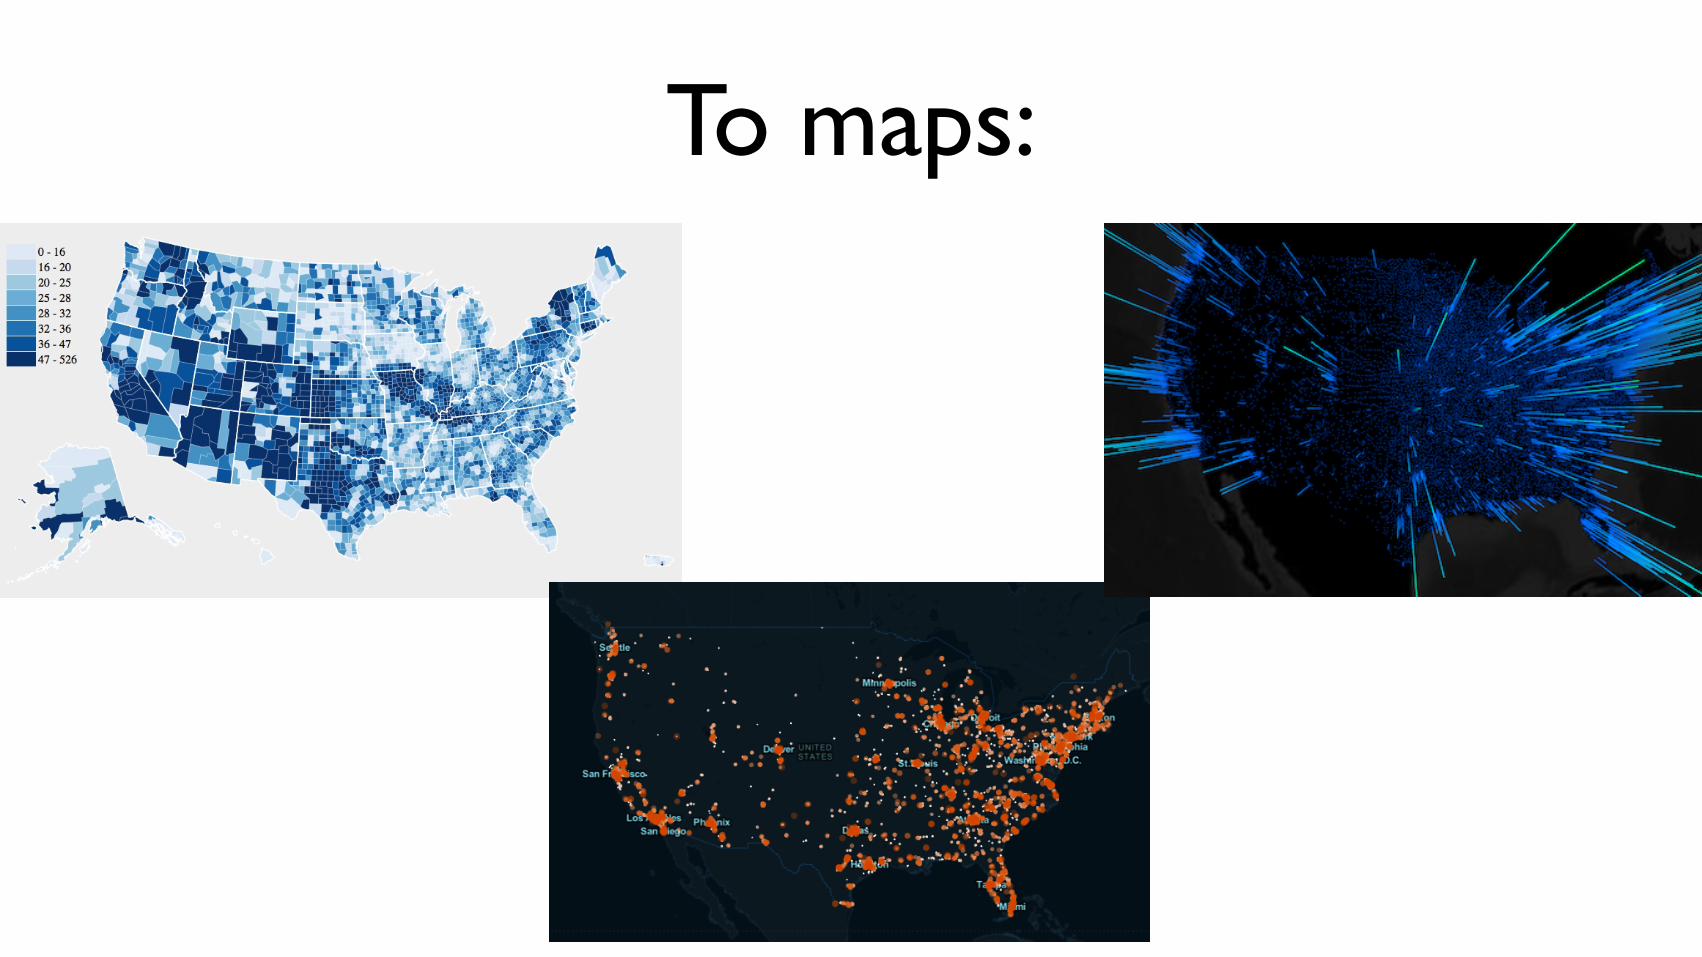
To maps:
Who Am I?
@jsundramrunningwithdata.com
• Math
• Music
• Data!
• Visualization
PayPal Data Science
• Acquired Where.com, local recommendation & ads
• PayPal has Petabytes
• Types of Data
• We’re hiring!
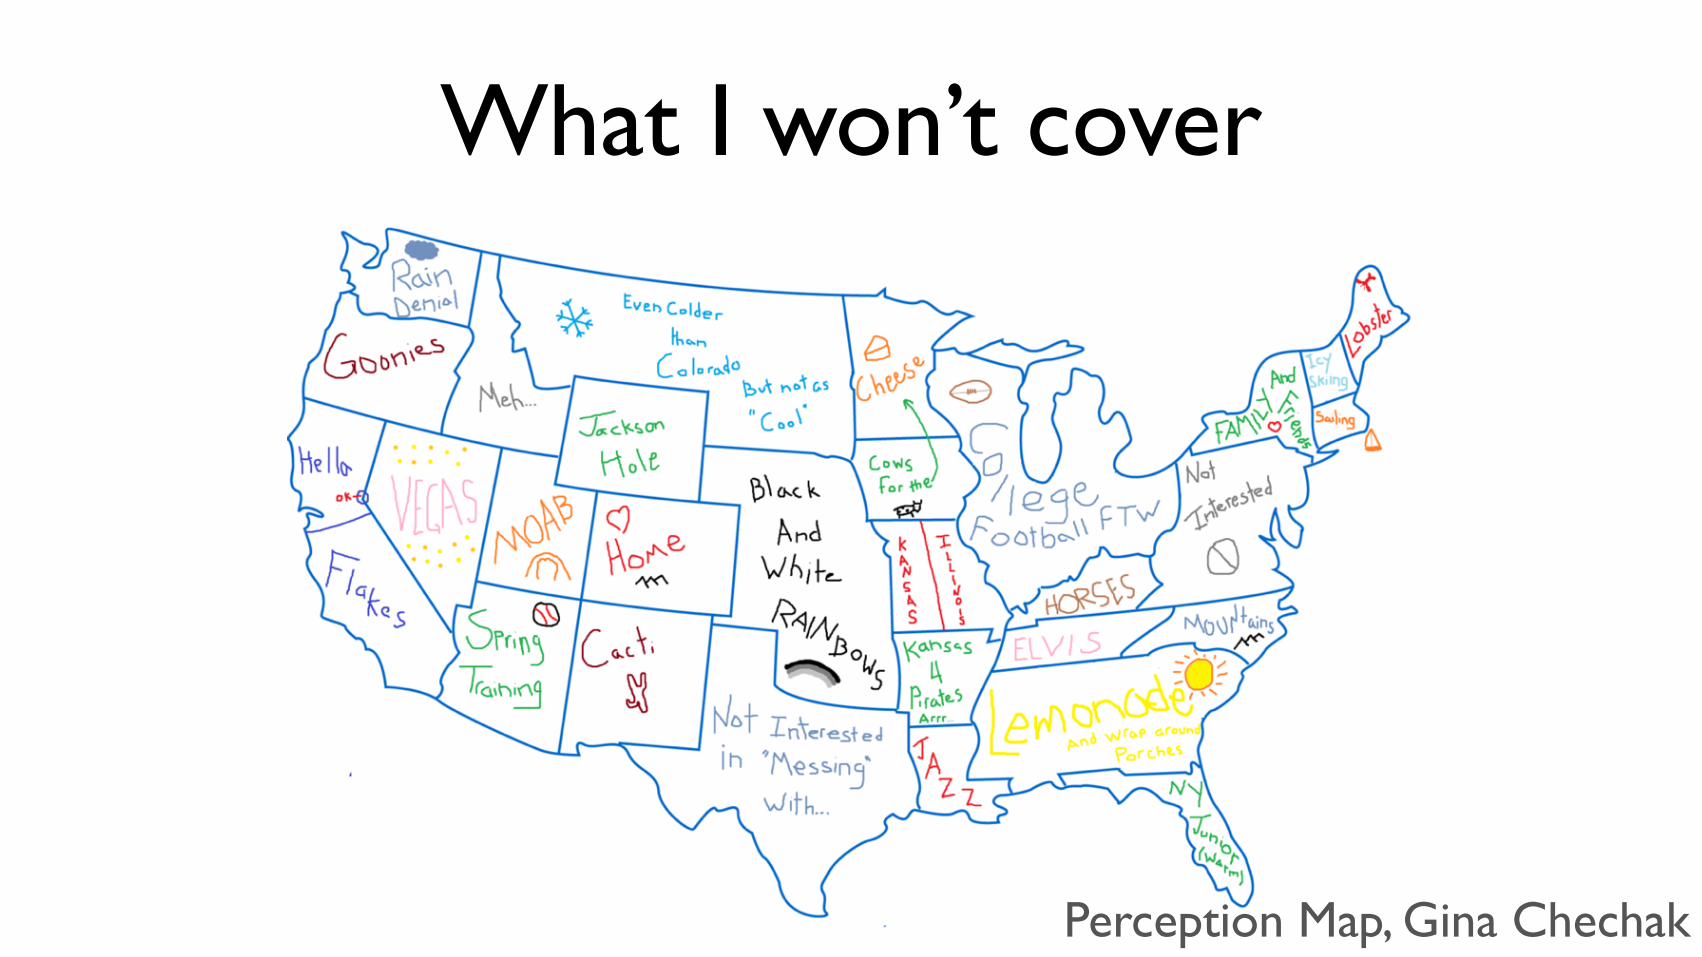
What I won’t cover
Perception Map, Gina Chechak

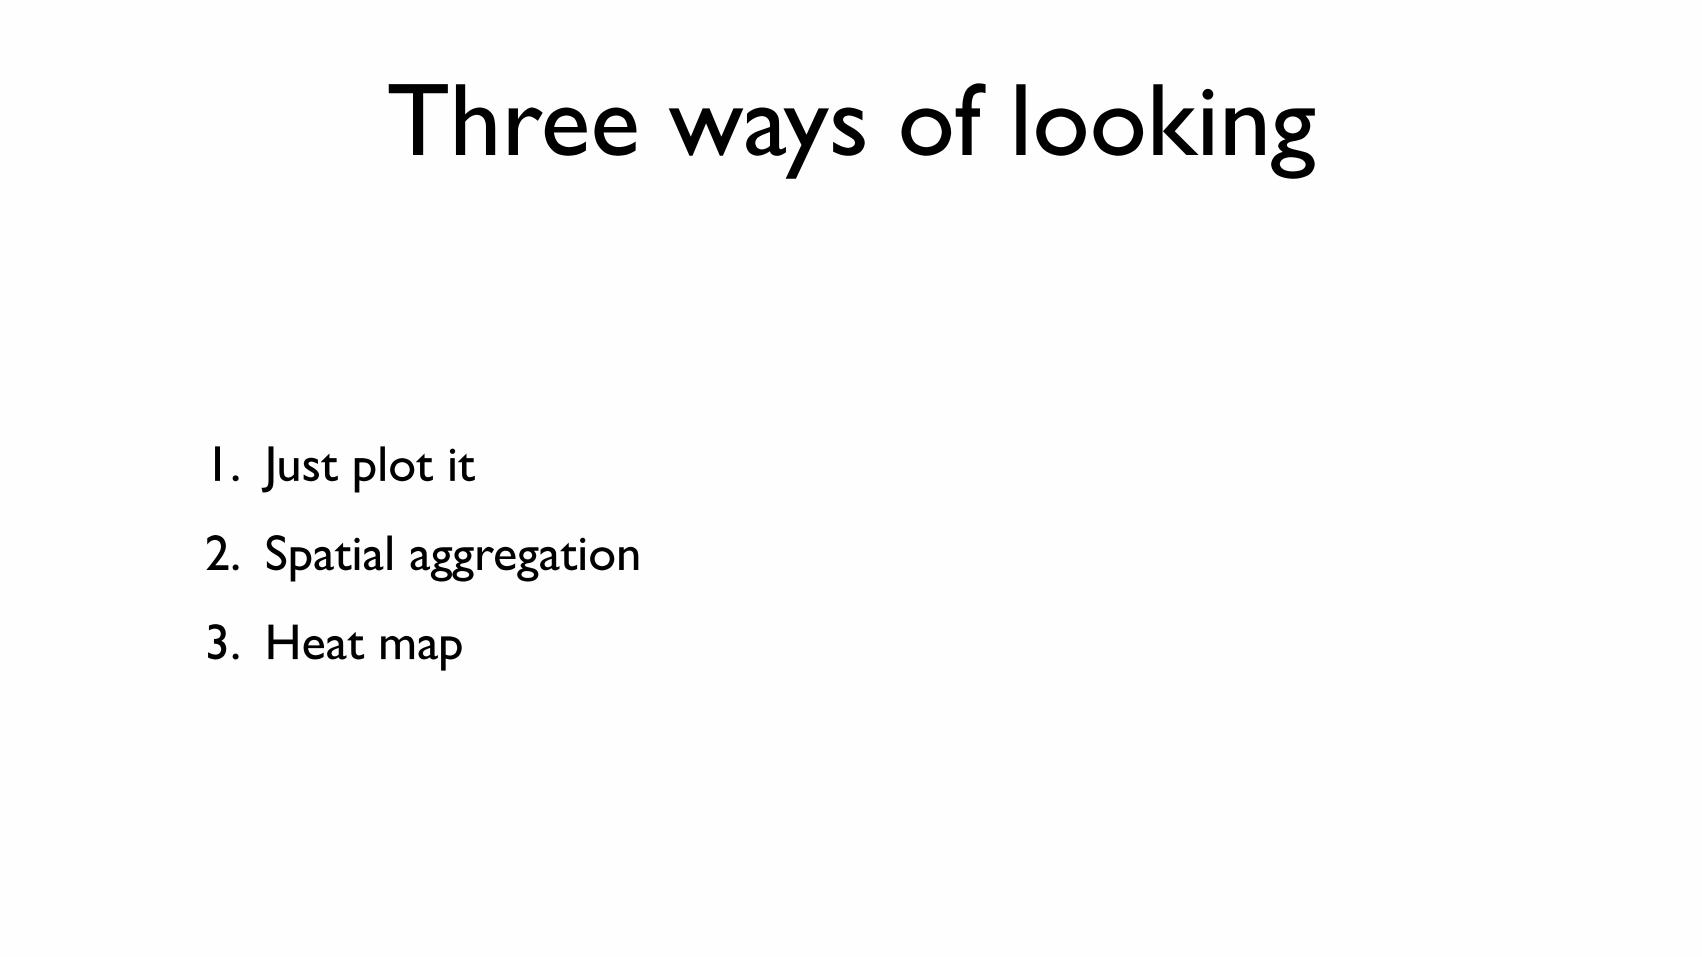
Three ways of looking
• Just plot it
• Spatial aggregation
• Heat map

Just Plot It
• Benefits:
• Easy
• Pretty
• Drawbacks:
• Reference points?
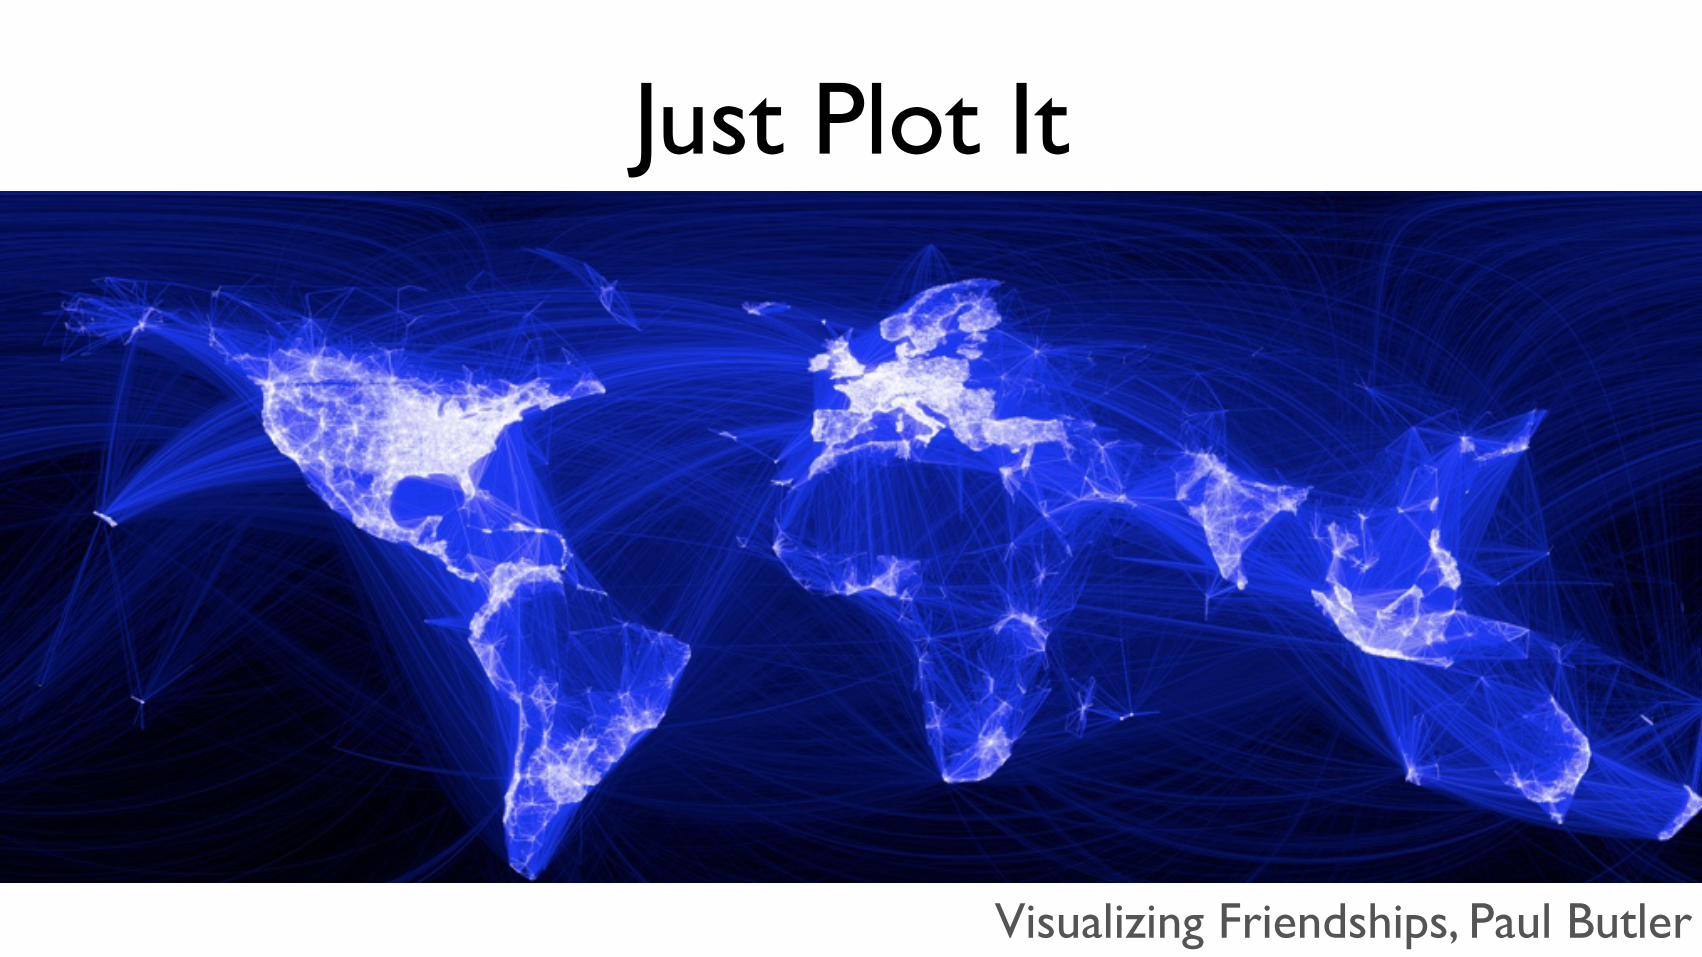
Just Plot It
Visualizing Friendships, Paul Butler
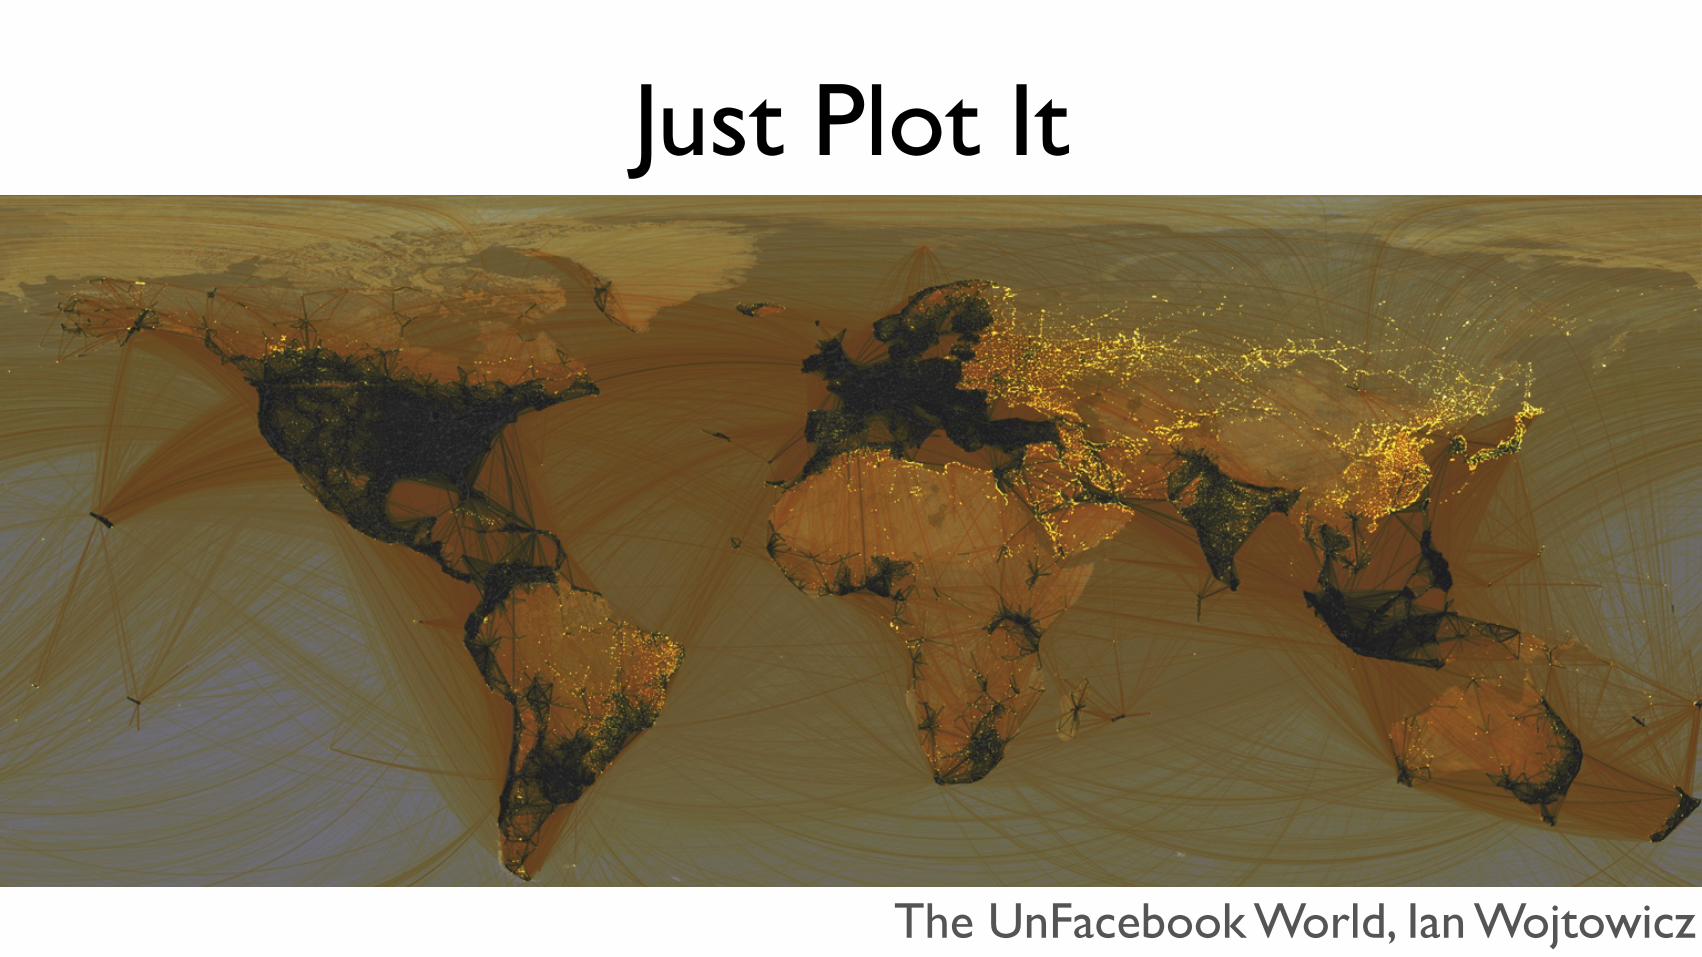
Just Plot It
The UnFacebook World, Ian Wojtowicz
Just Plot It
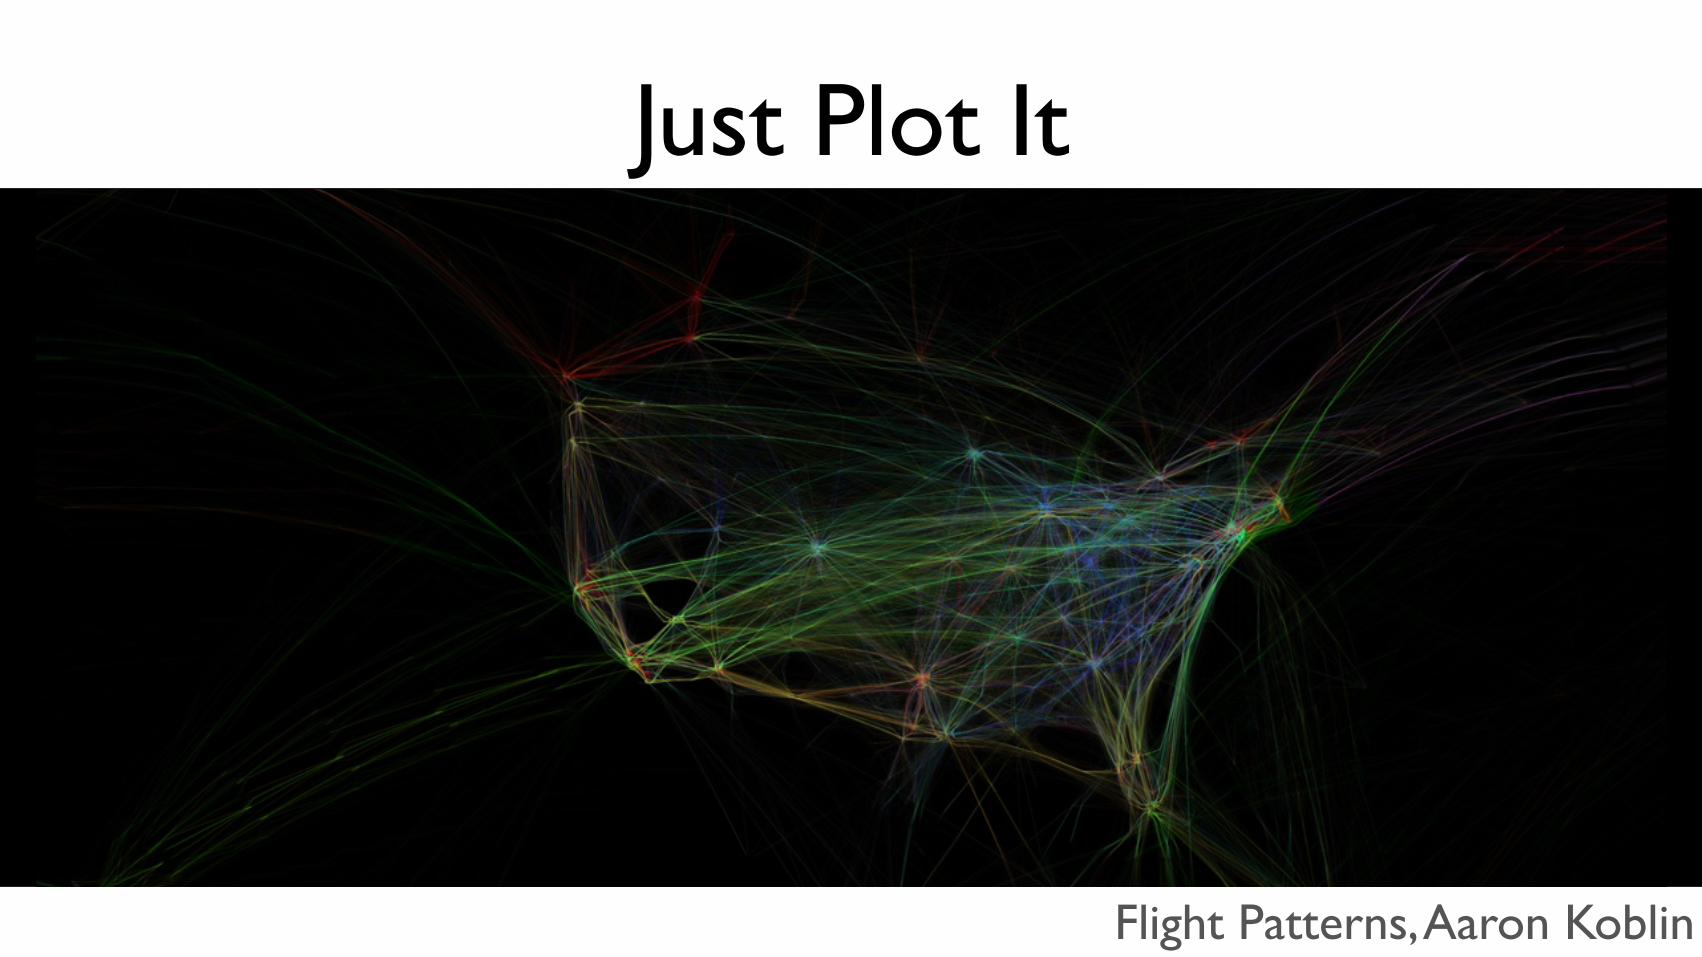
Flight Patterns, Aaron Koblin
Just Plot It
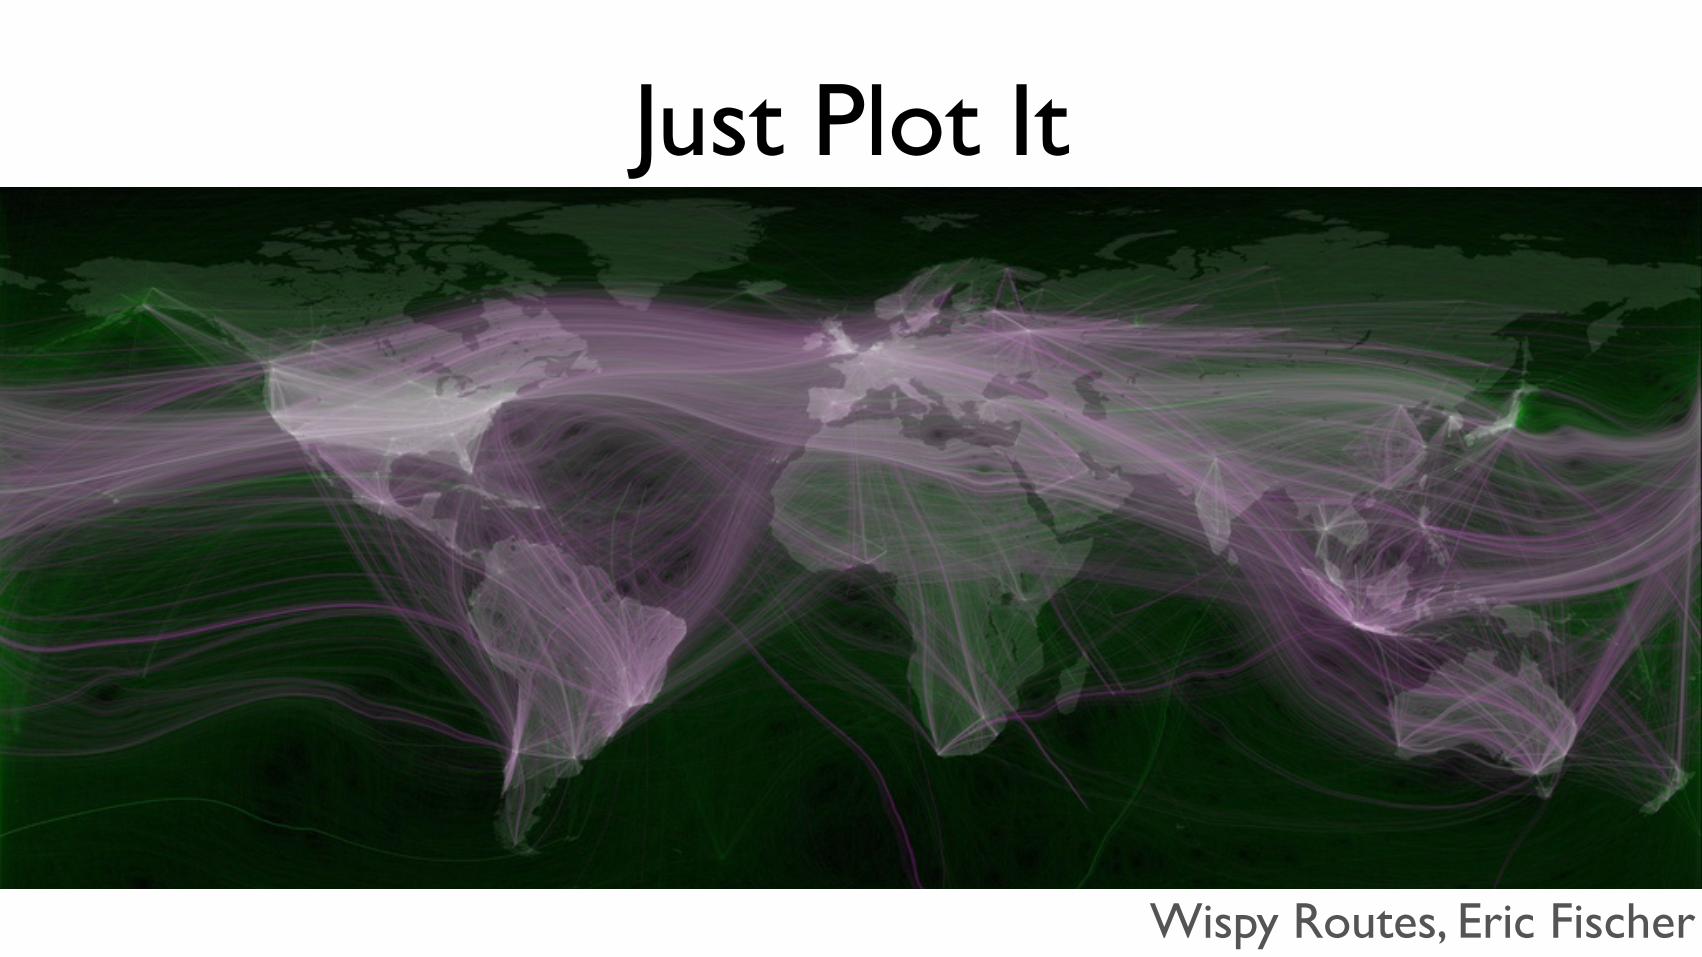
Wispy Routes, Eric Fischer
Just Plot It
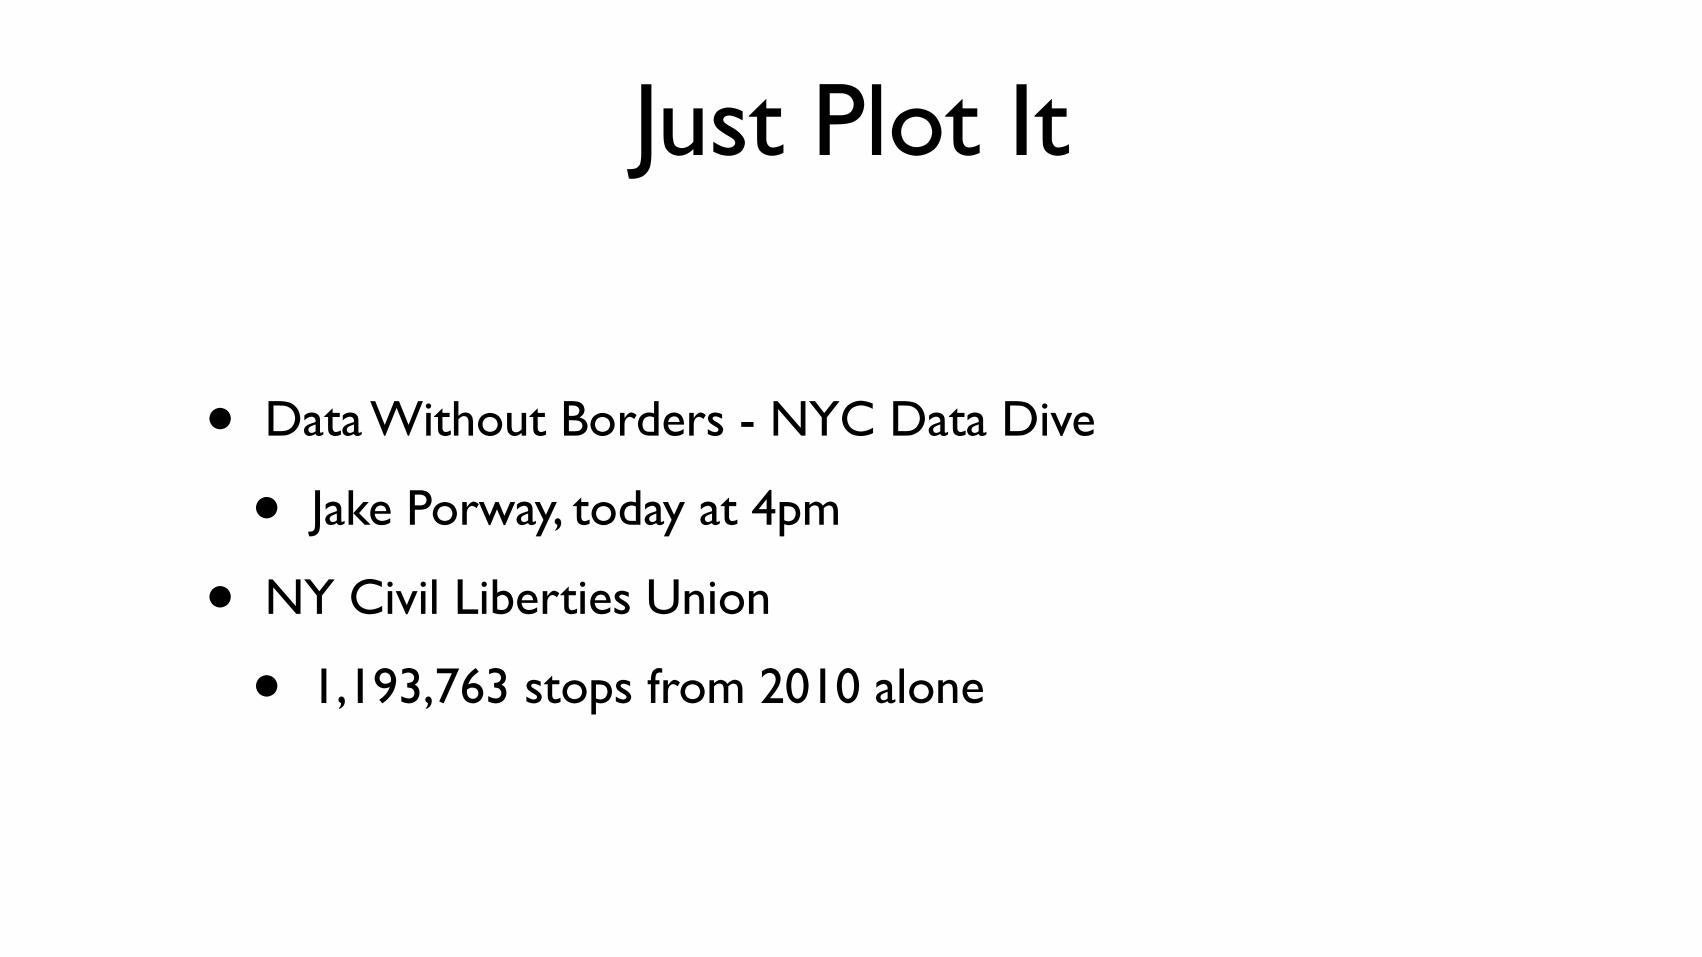
• Data Without Borders - NYC Data Dive
• Jake Porway, today at 4pm
• NY Civil Liberties Union
• 1,193,763 stops from 2010 alone
Just Plot It
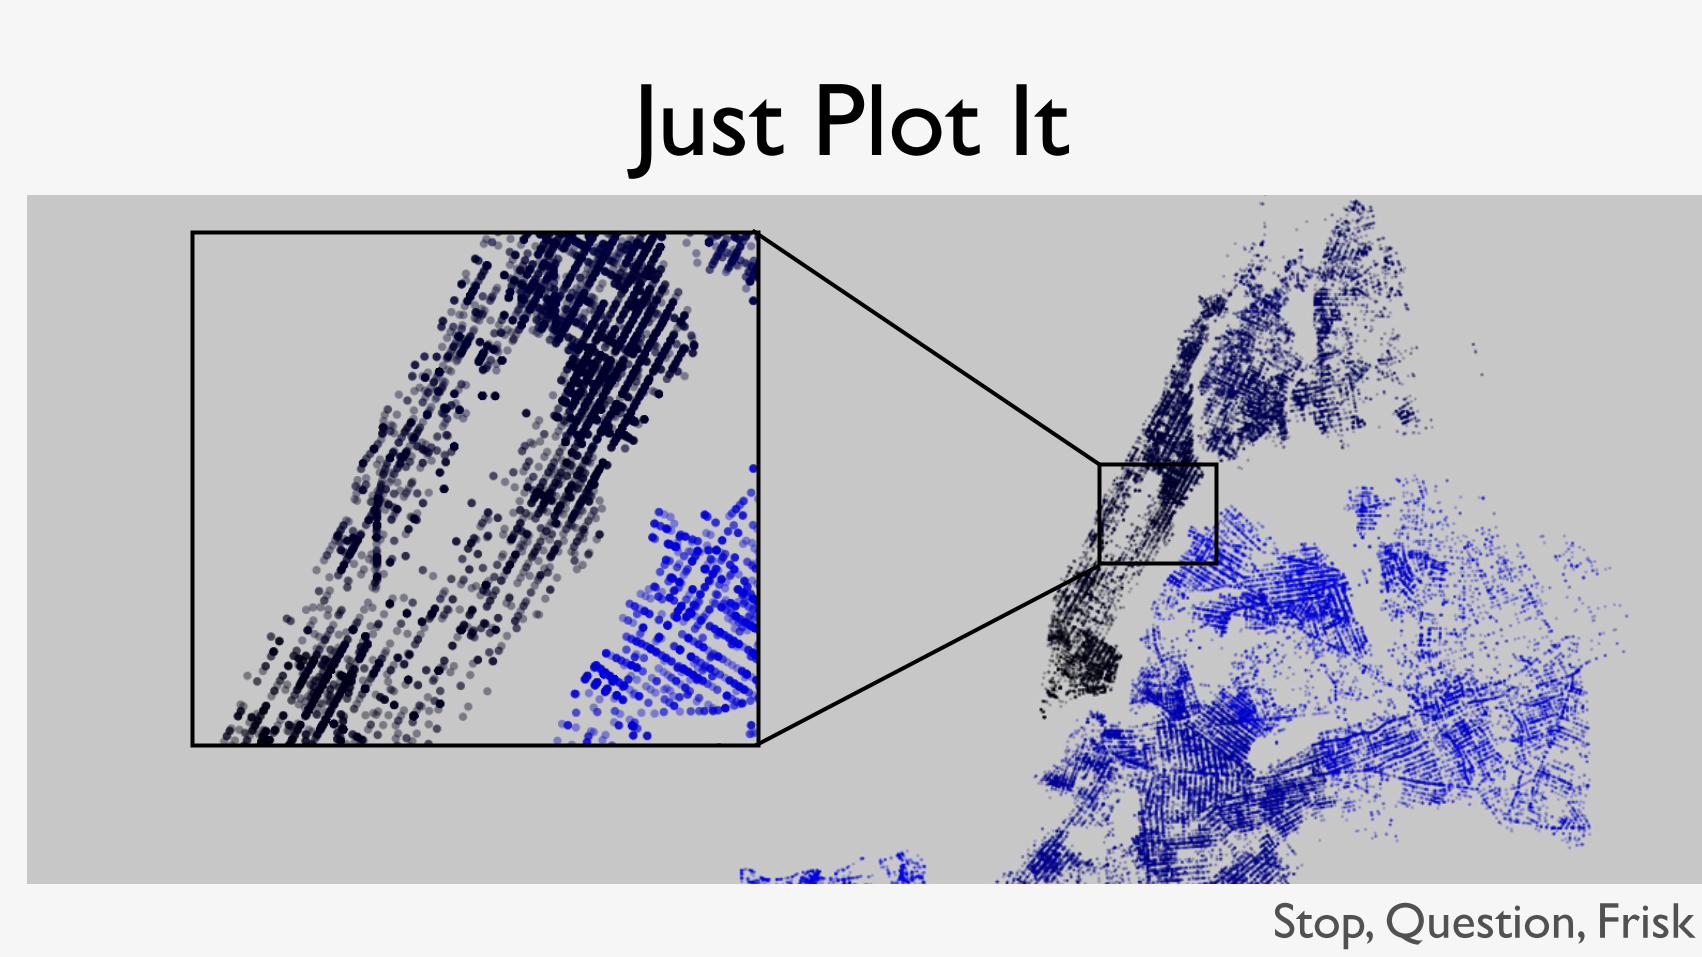
Stop, Question, Frisk
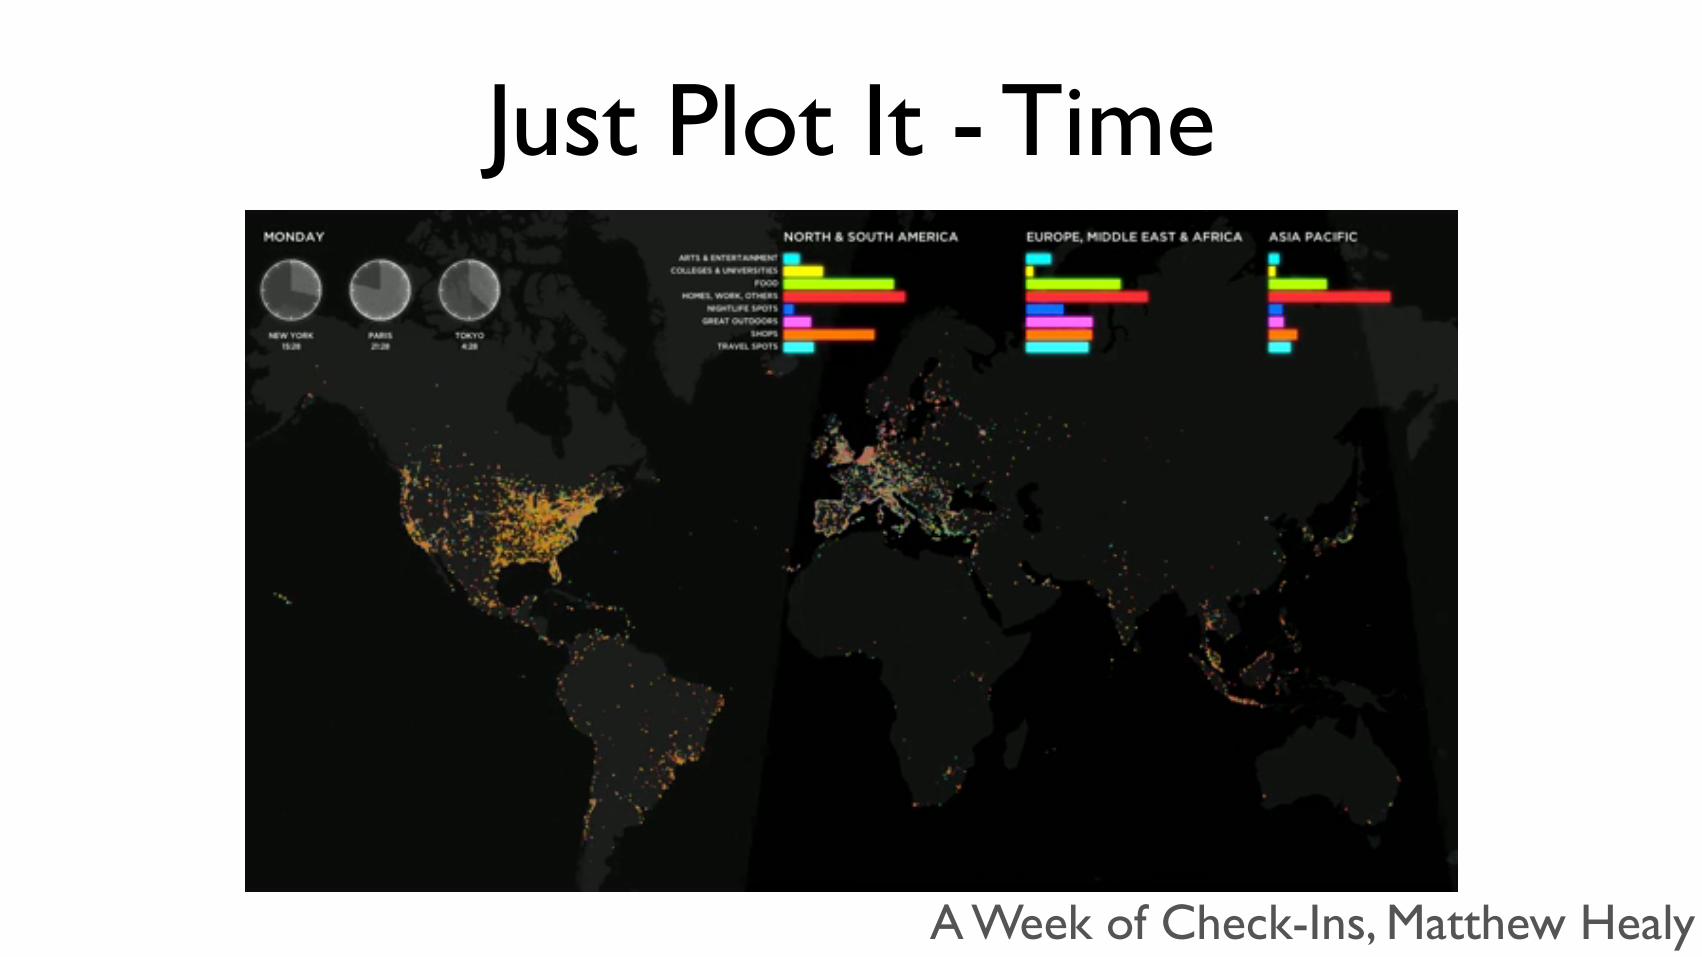
Just Plot It - Time
A Week of Check-Ins, Matthew Healy
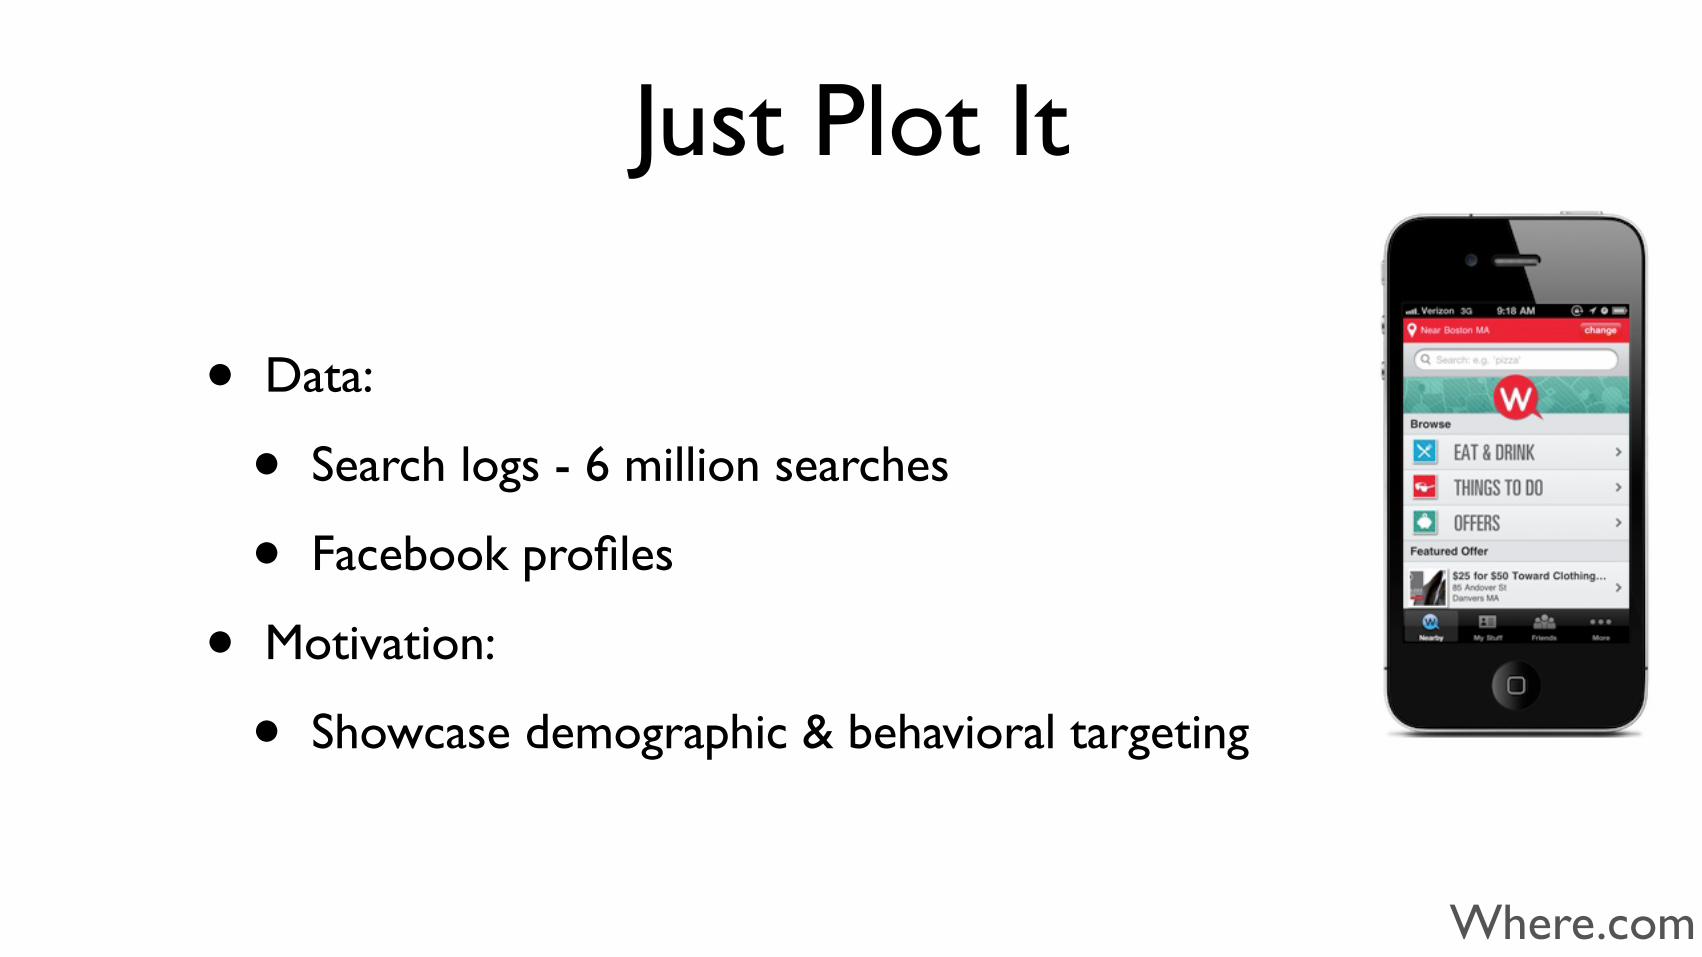
Just Plot It
• Data:
• Search logs - 6 million searches
• Facebook profiles
• Motivation:
• Showcase demographic & behavioral targeting
Where.com
• All-purpose drawing
• Java
• Easy to get started
• Addictive
Processing
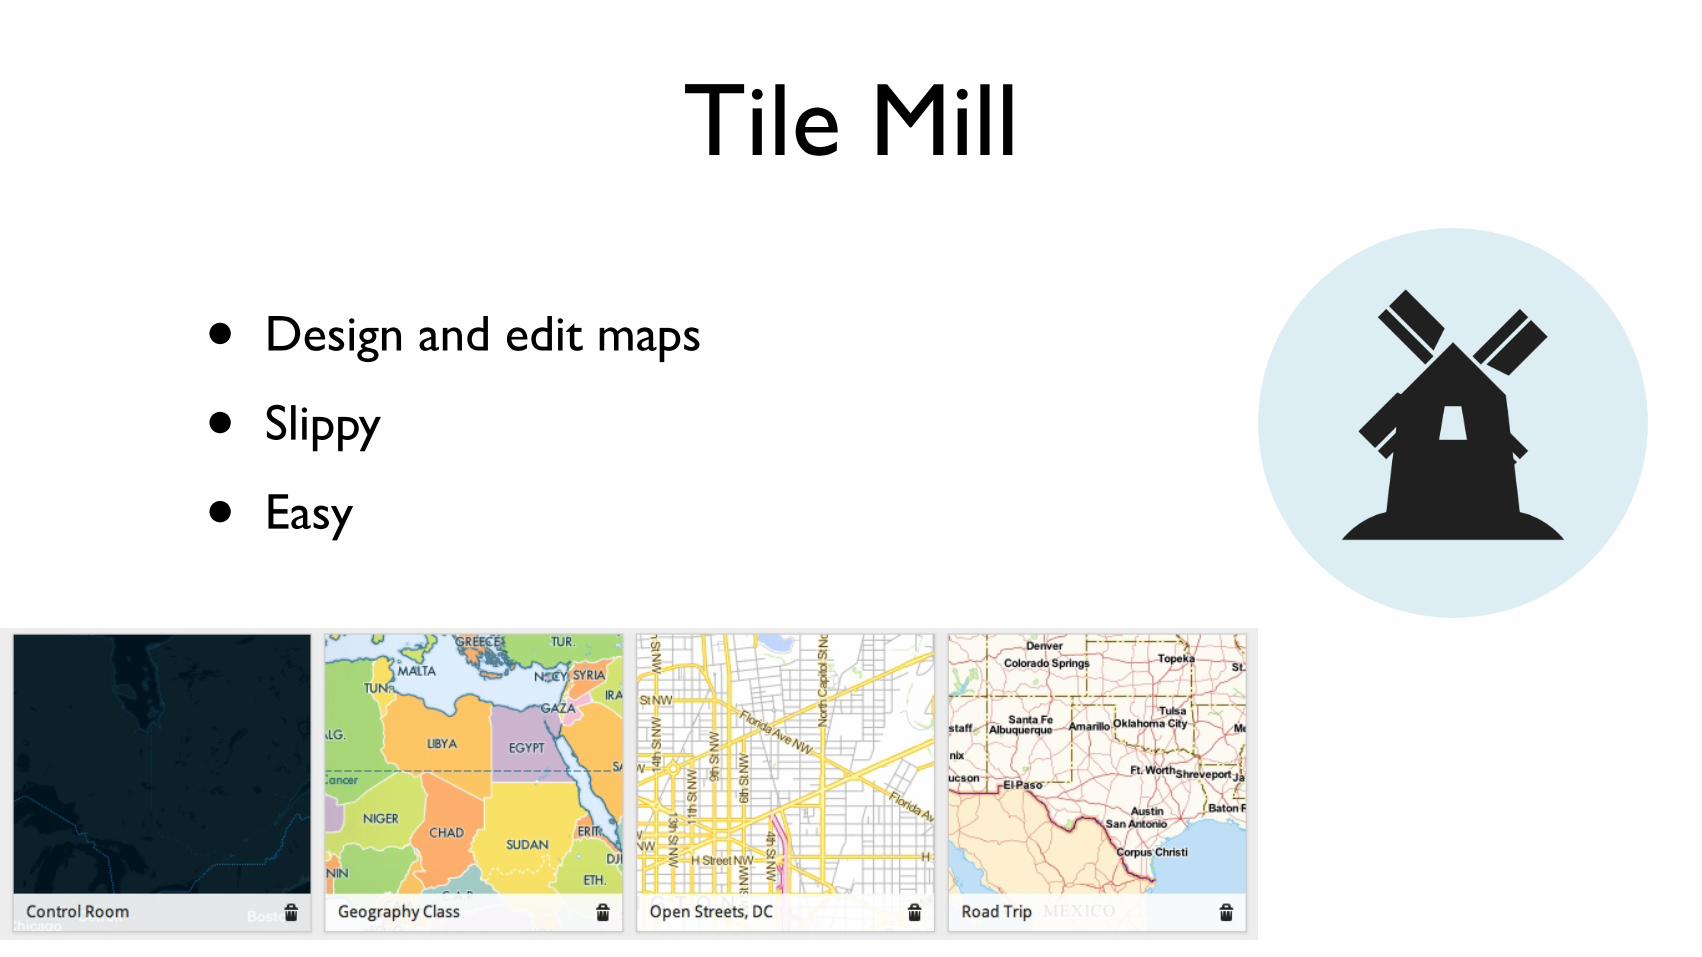
• Design and edit maps
• Slippy
• Easy
Tile Mill
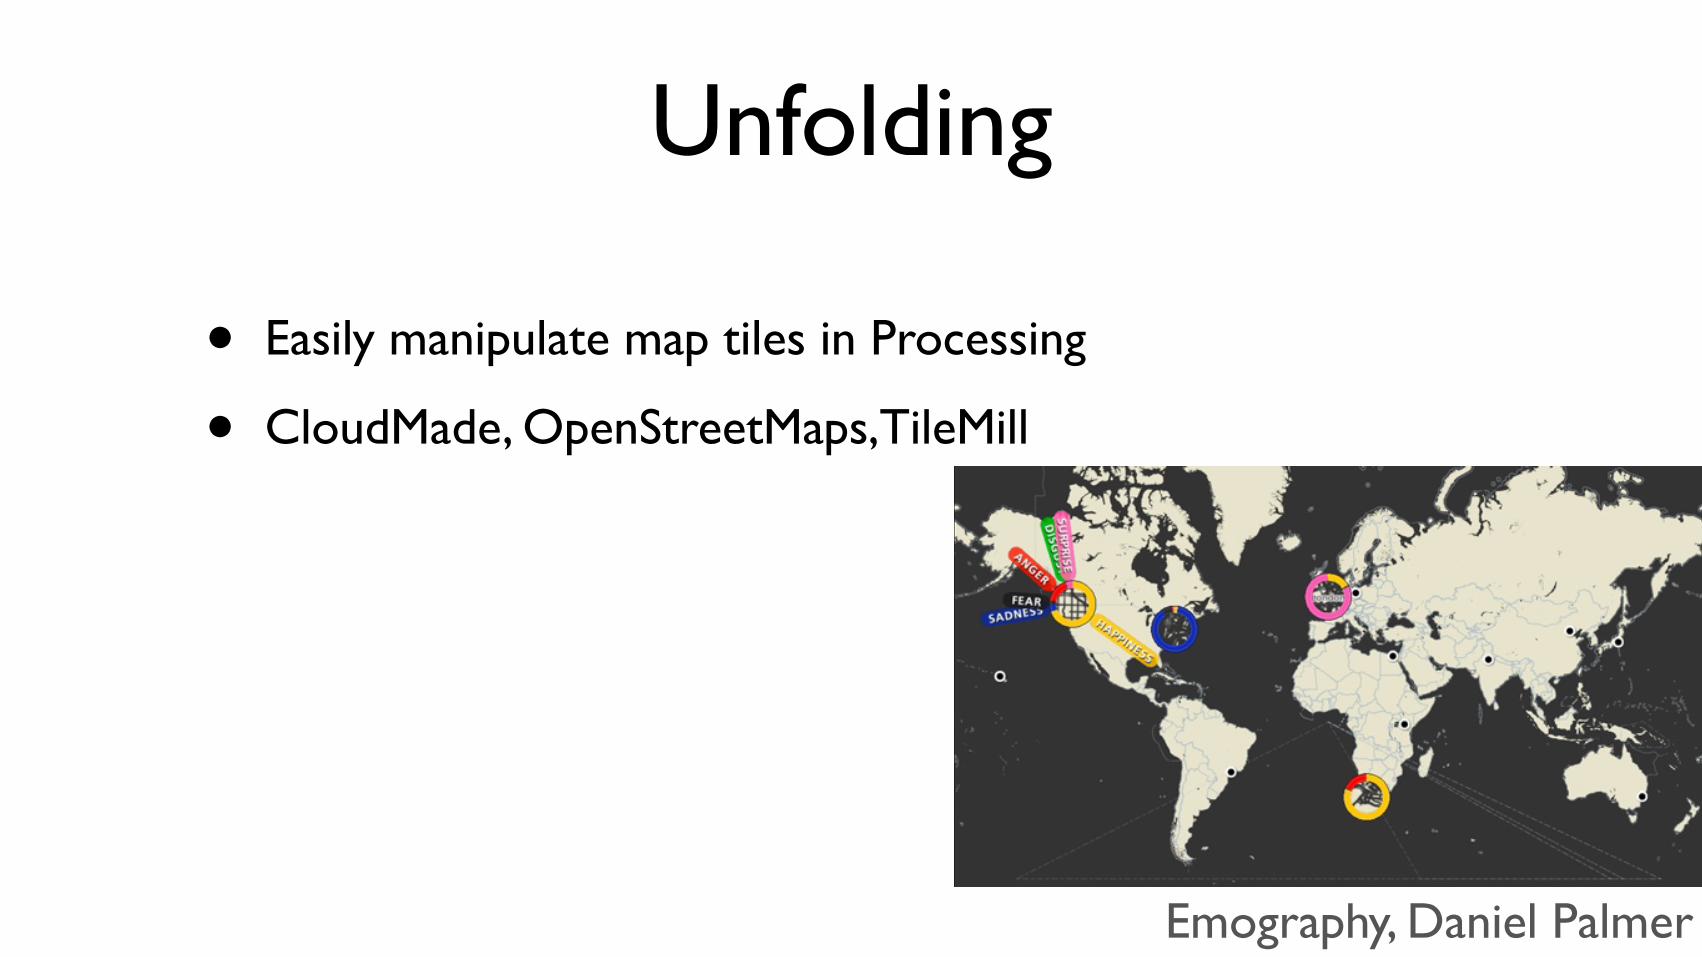
Unfolding
• Easily manipulate map tiles in Processing
• CloudMade, OpenStreetMaps,TileMill
Emography, Daniel Palmer
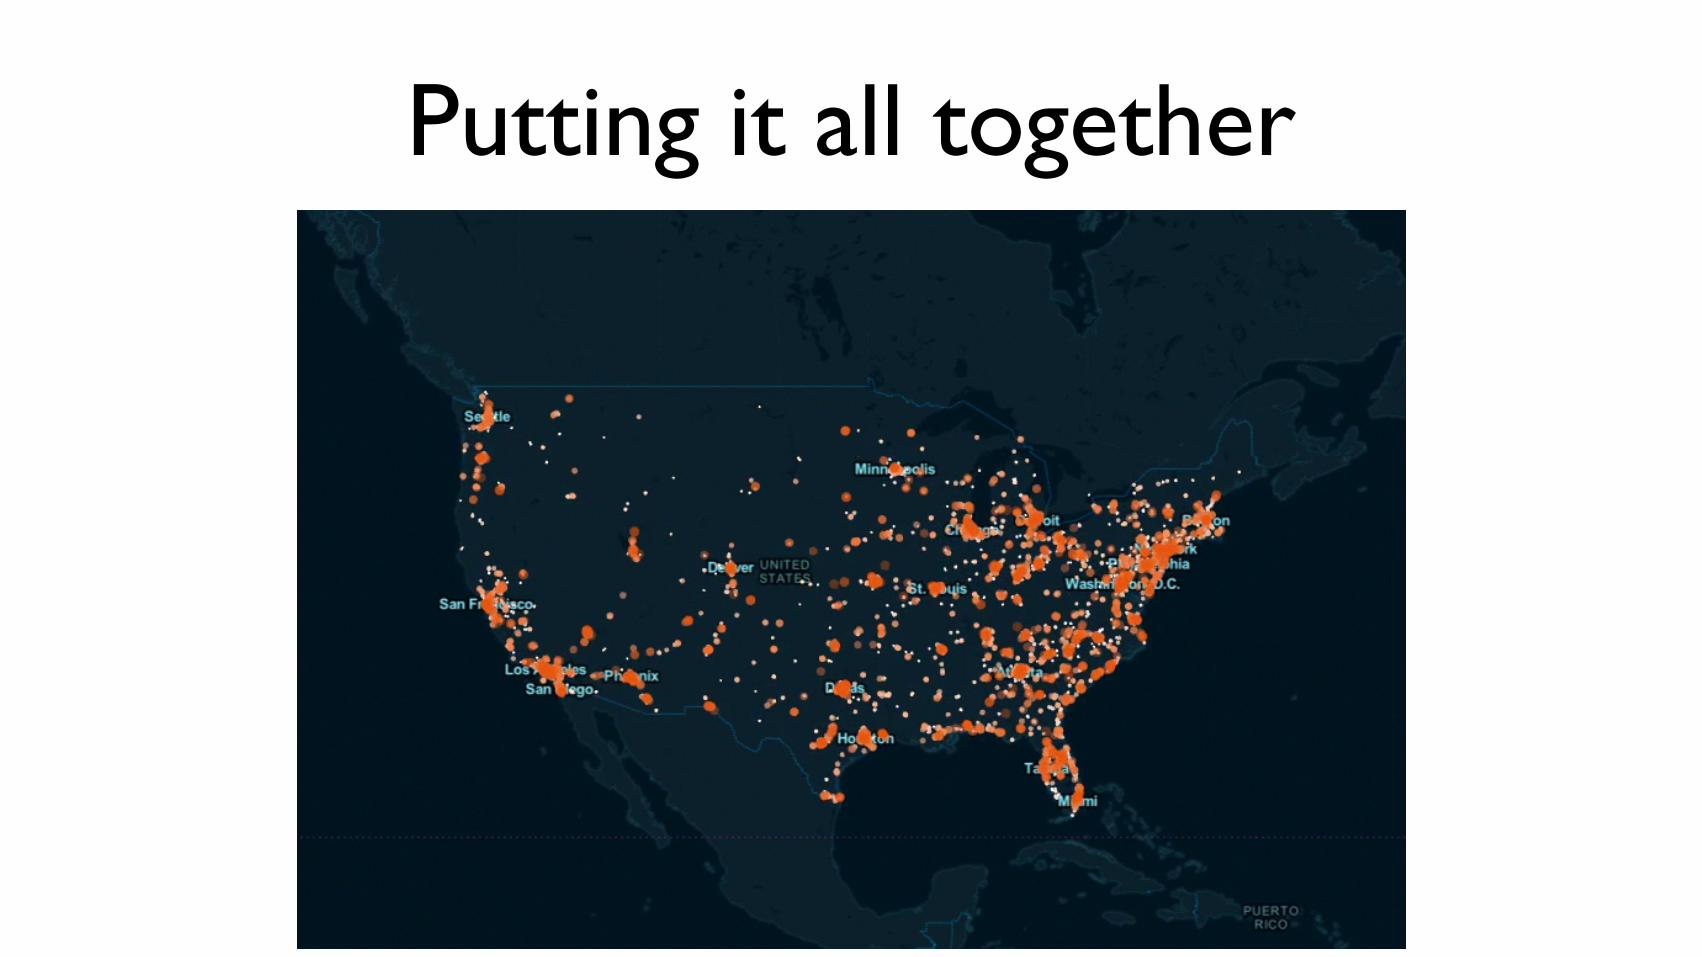
Putting it all together
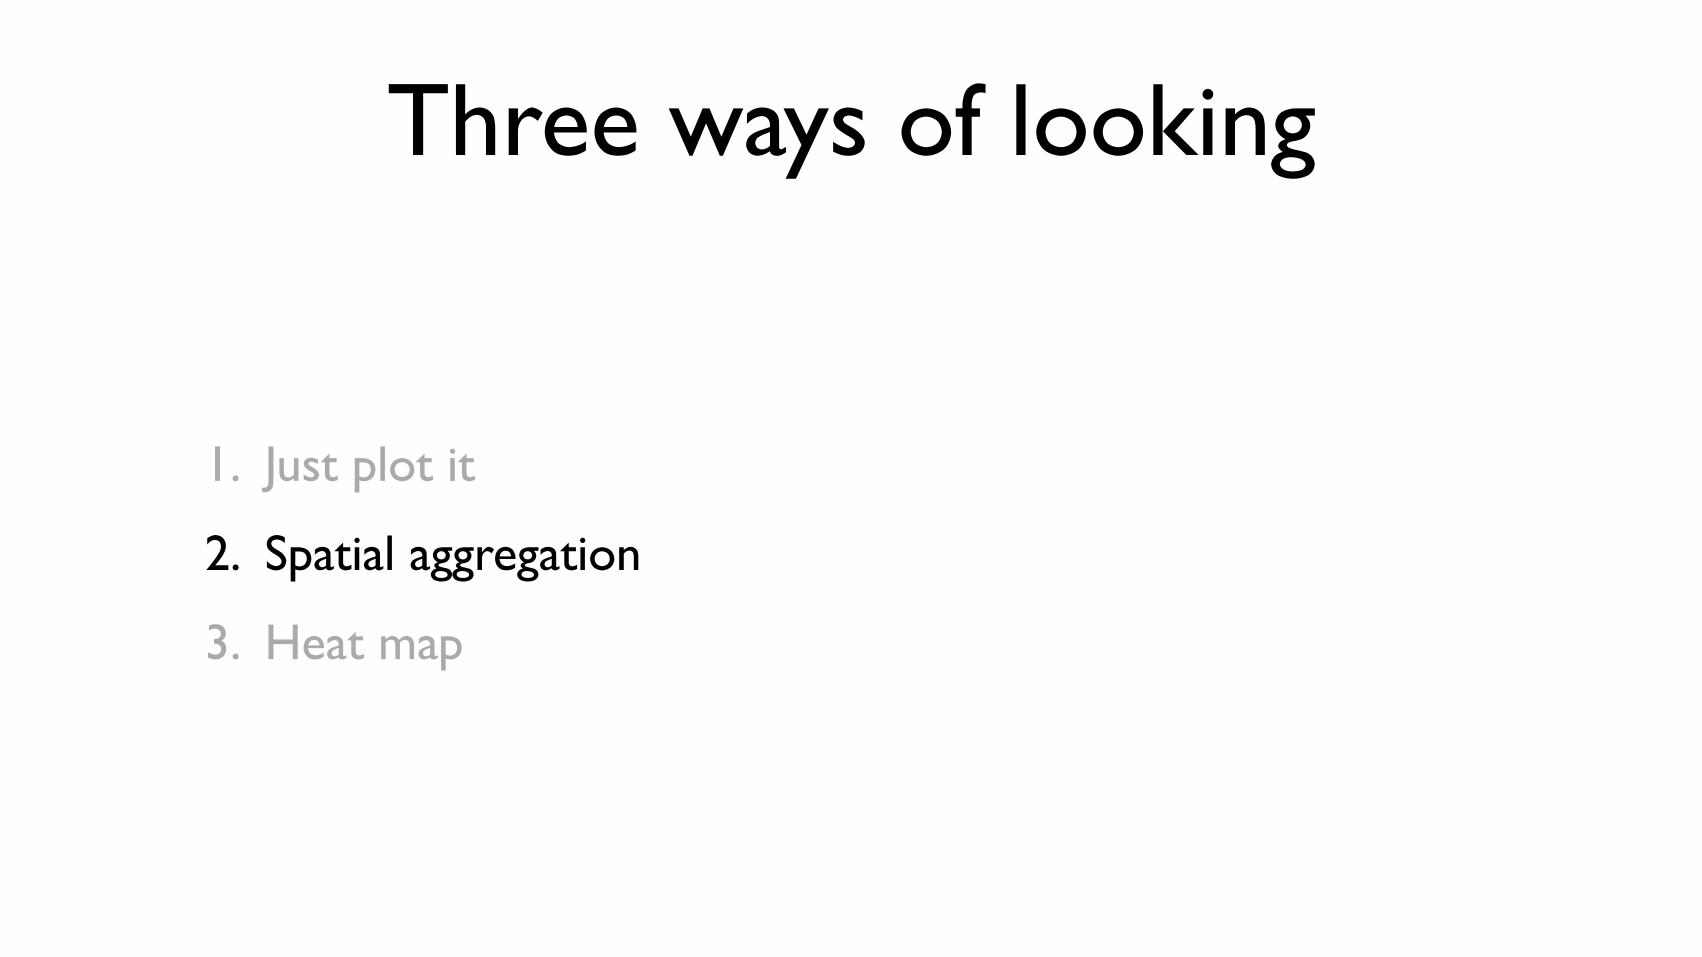
Three ways of looking
1. Just plot it
2. Spatial aggregation
3. Heat map
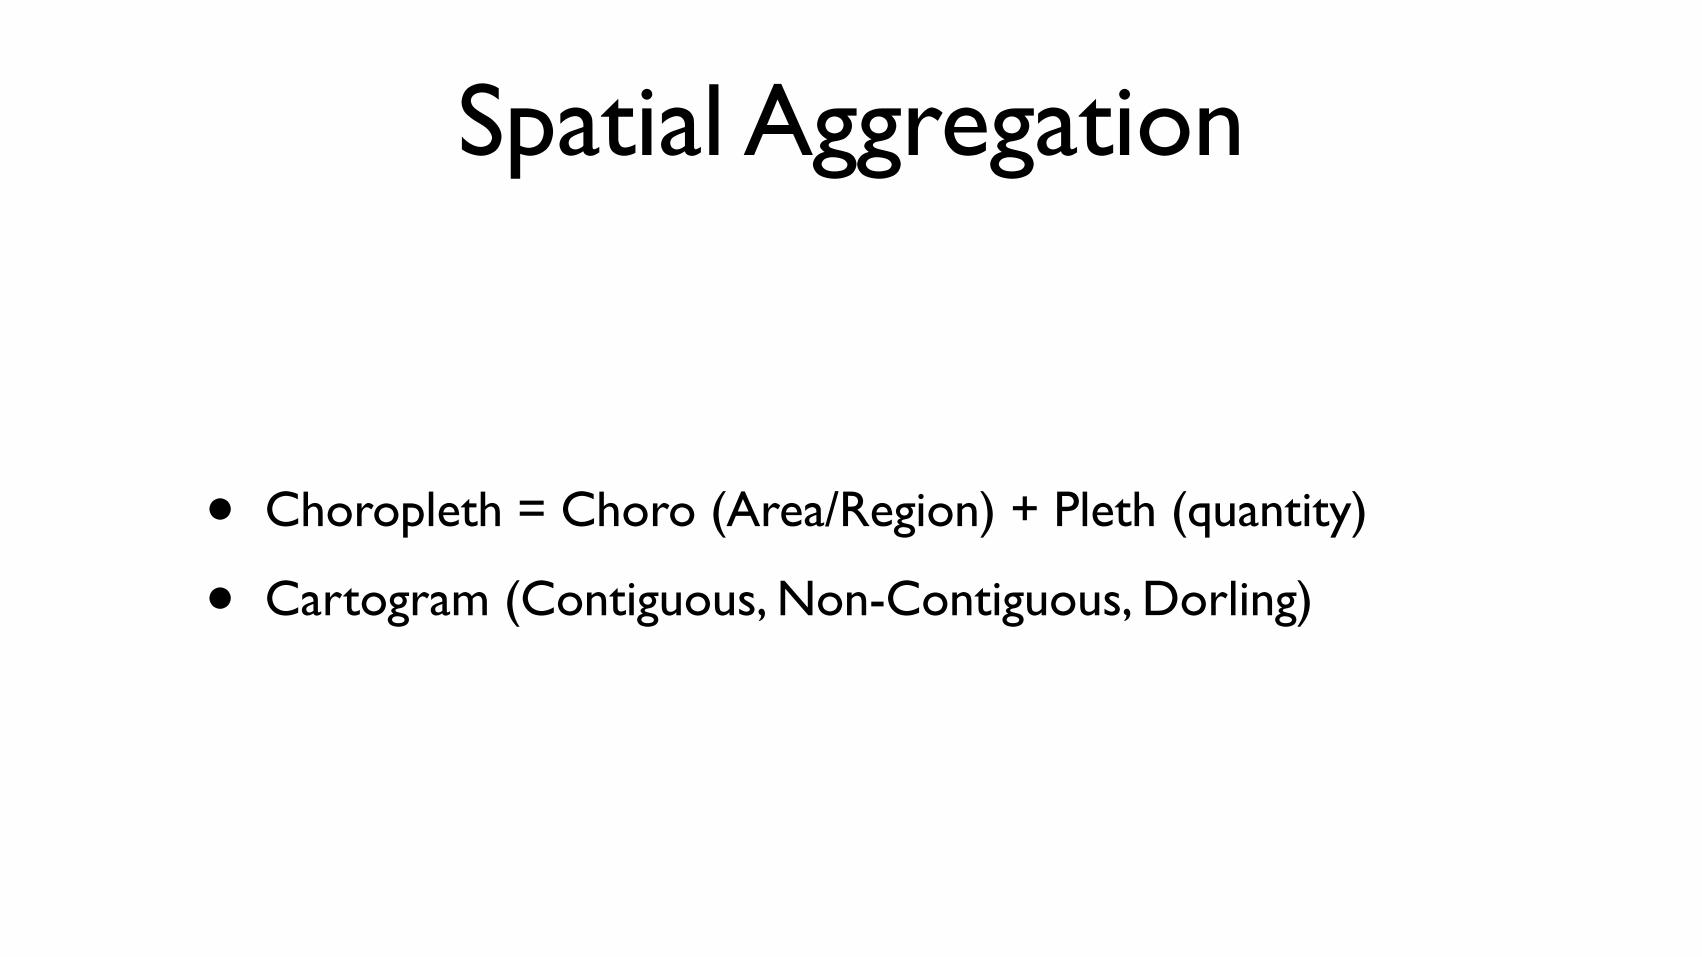
Spatial Aggregation
• Choropleth = Choro (Area/Region) + Pleth (quantity)
• Cartogram (Contiguous, Non-Contiguous, Dorling)
Spatial Aggregation
• Benefits:
• Easy to see simple patterns
• Drawbacks:
• Perceptual issues
• Sensitive to color/class choices
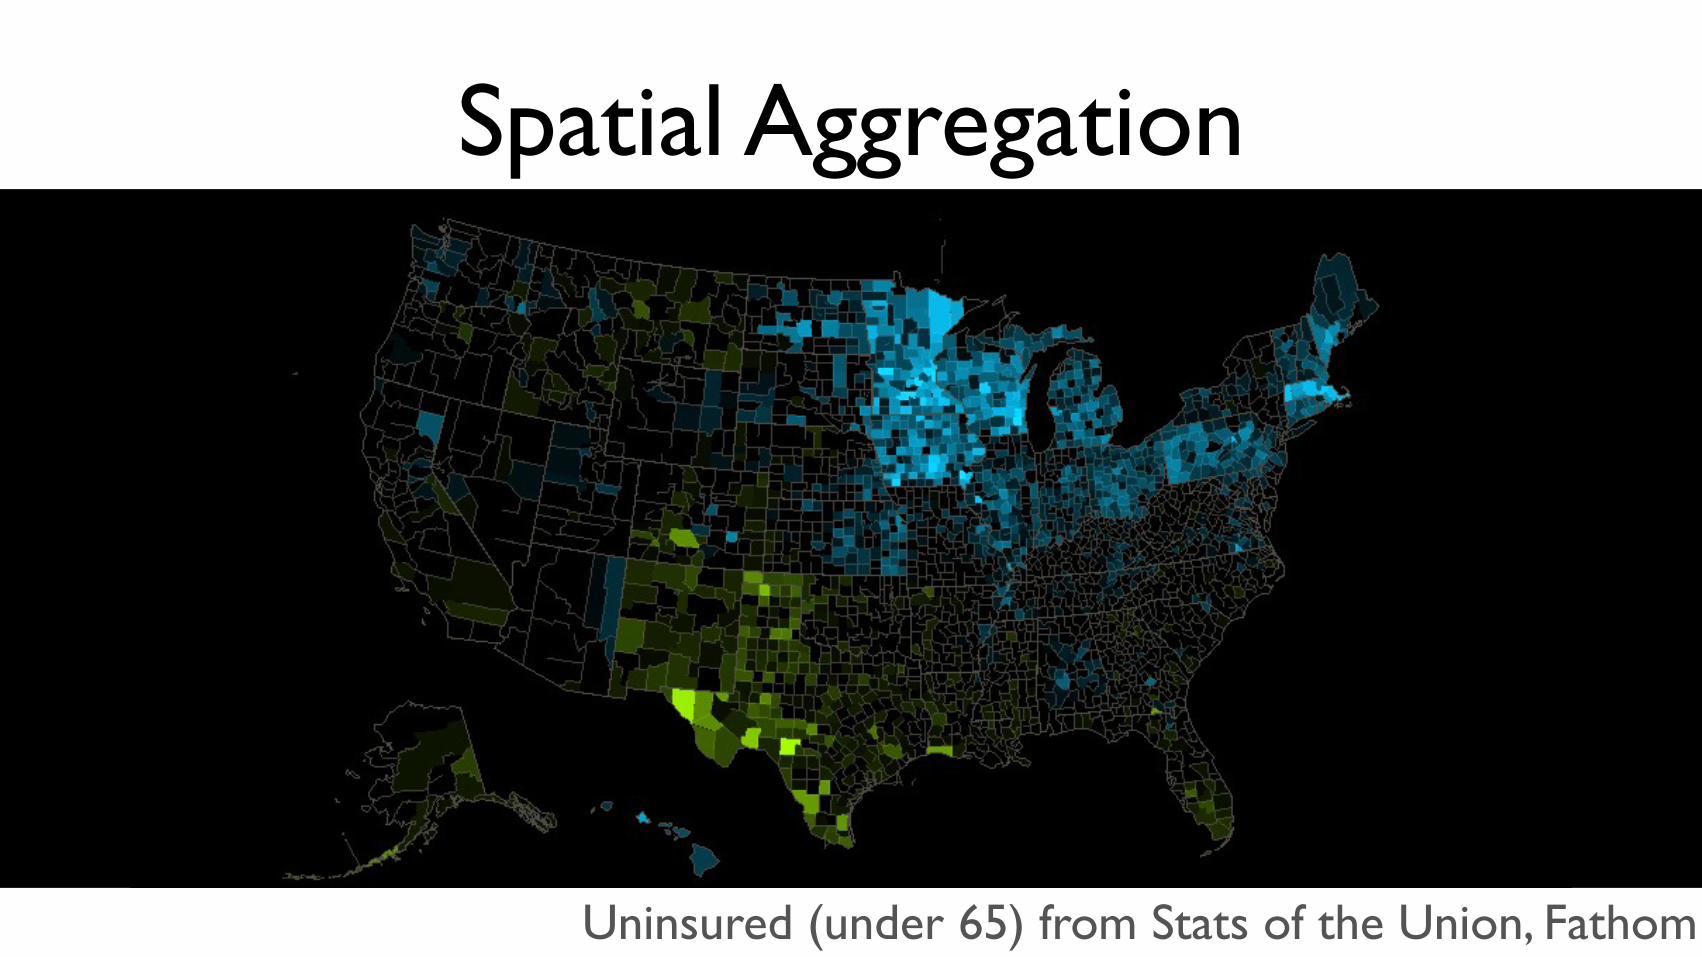
Spatial Aggregation
Uninsured (under 65) from Stats of the Union, Fathom
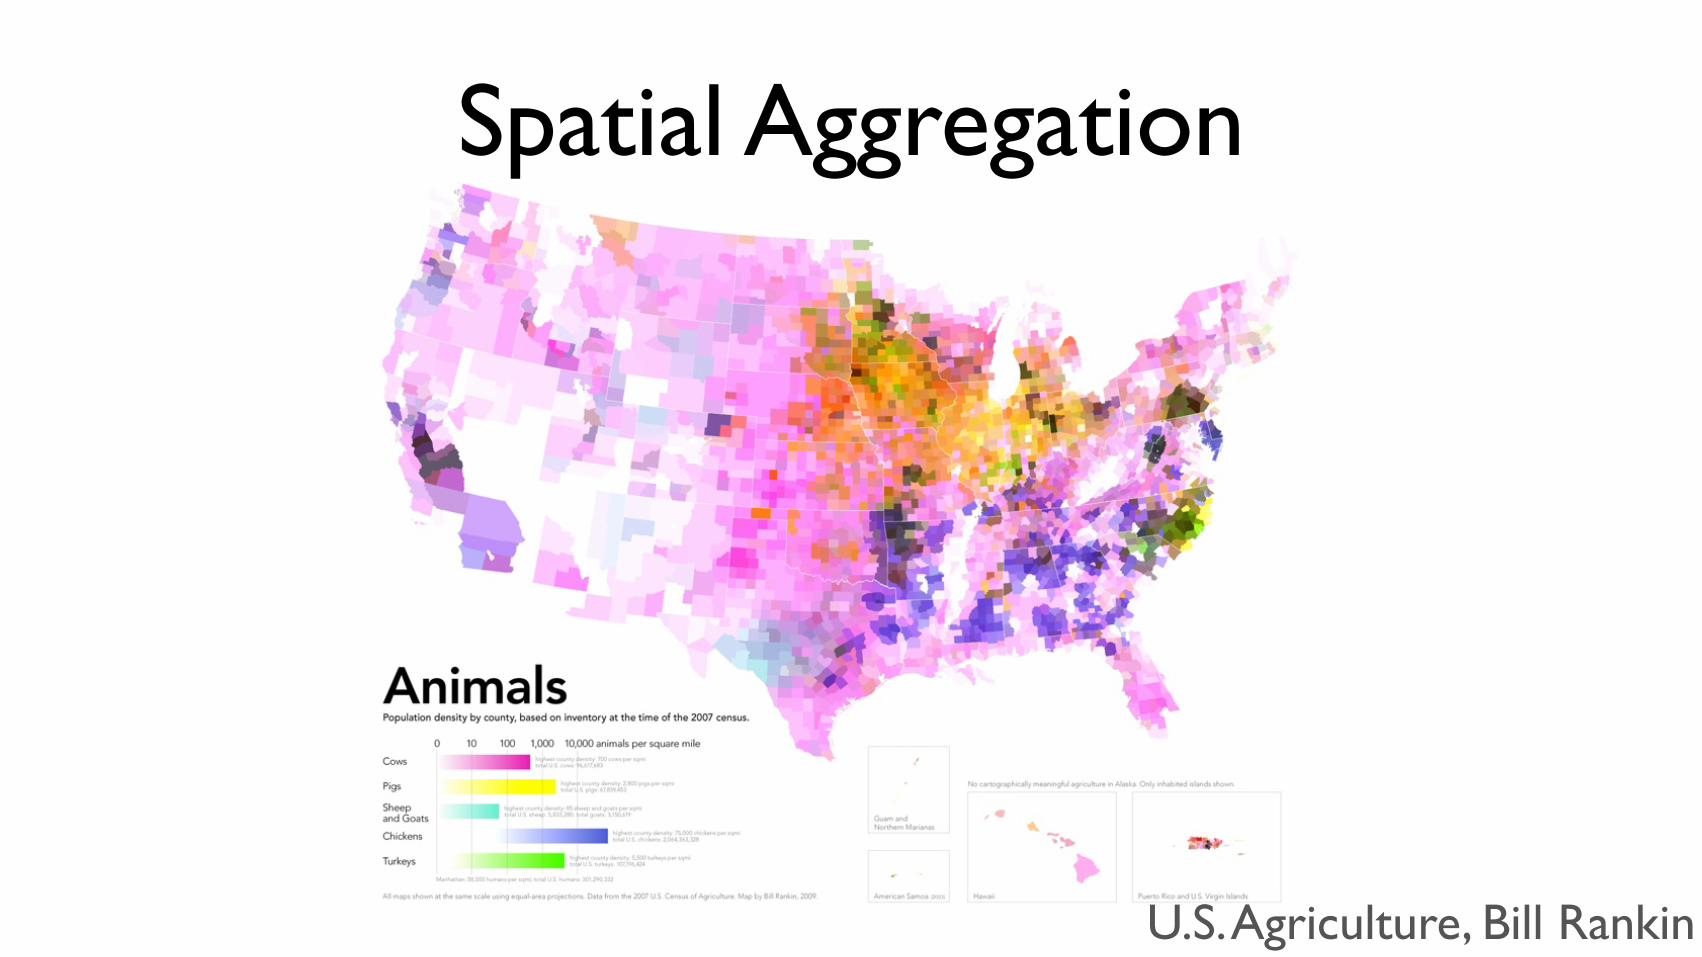
Spatial Aggregation
U.S. Agriculture, Bill Rankin
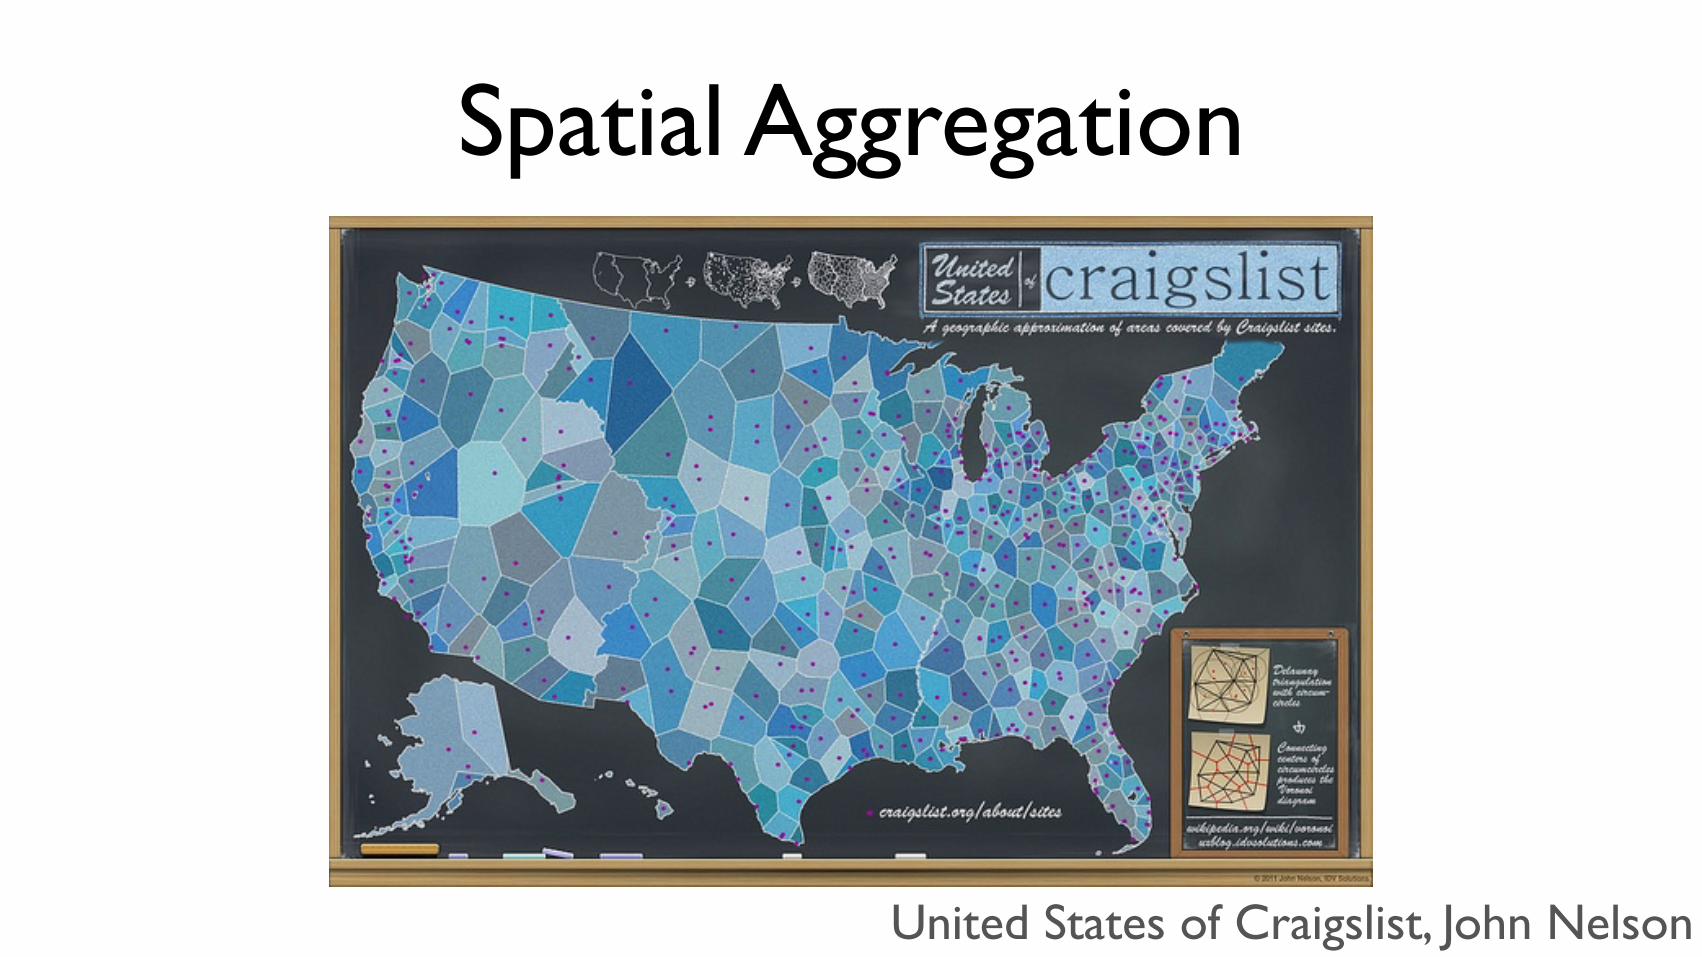
Spatial Aggregation
United States of Craigslist, John Nelson
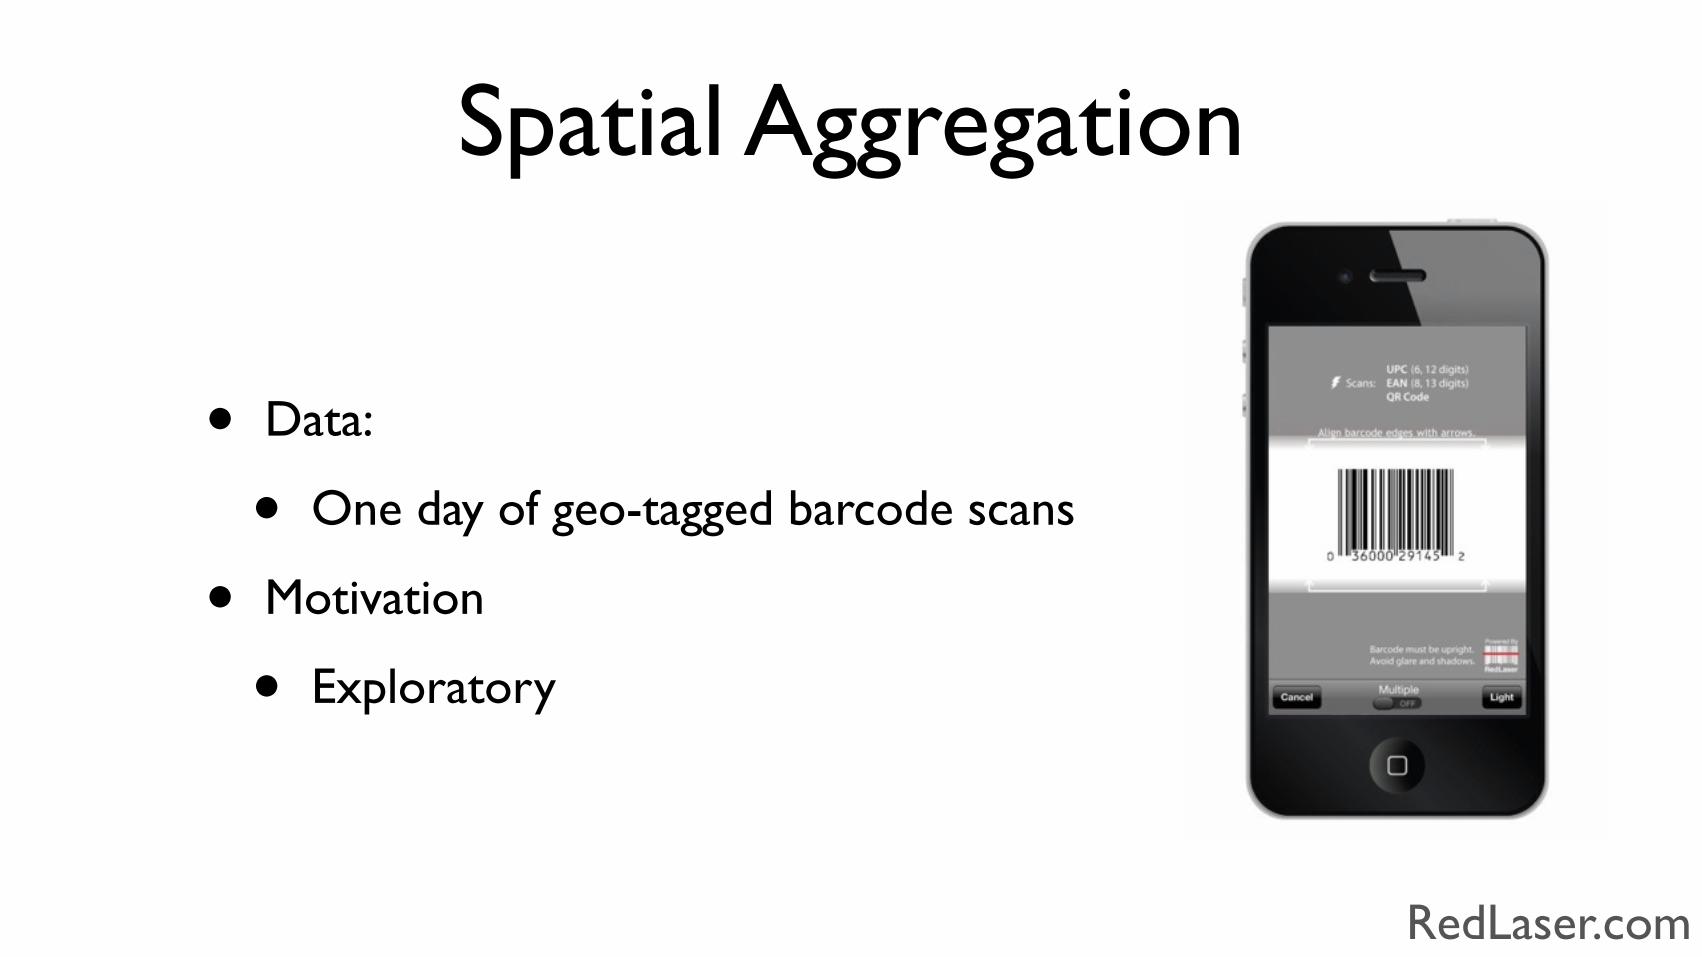
Spatial Aggregation
• Data:
• One day of geo-tagged barcode scans
• Motivation
• Exploratory
RedLaser.com
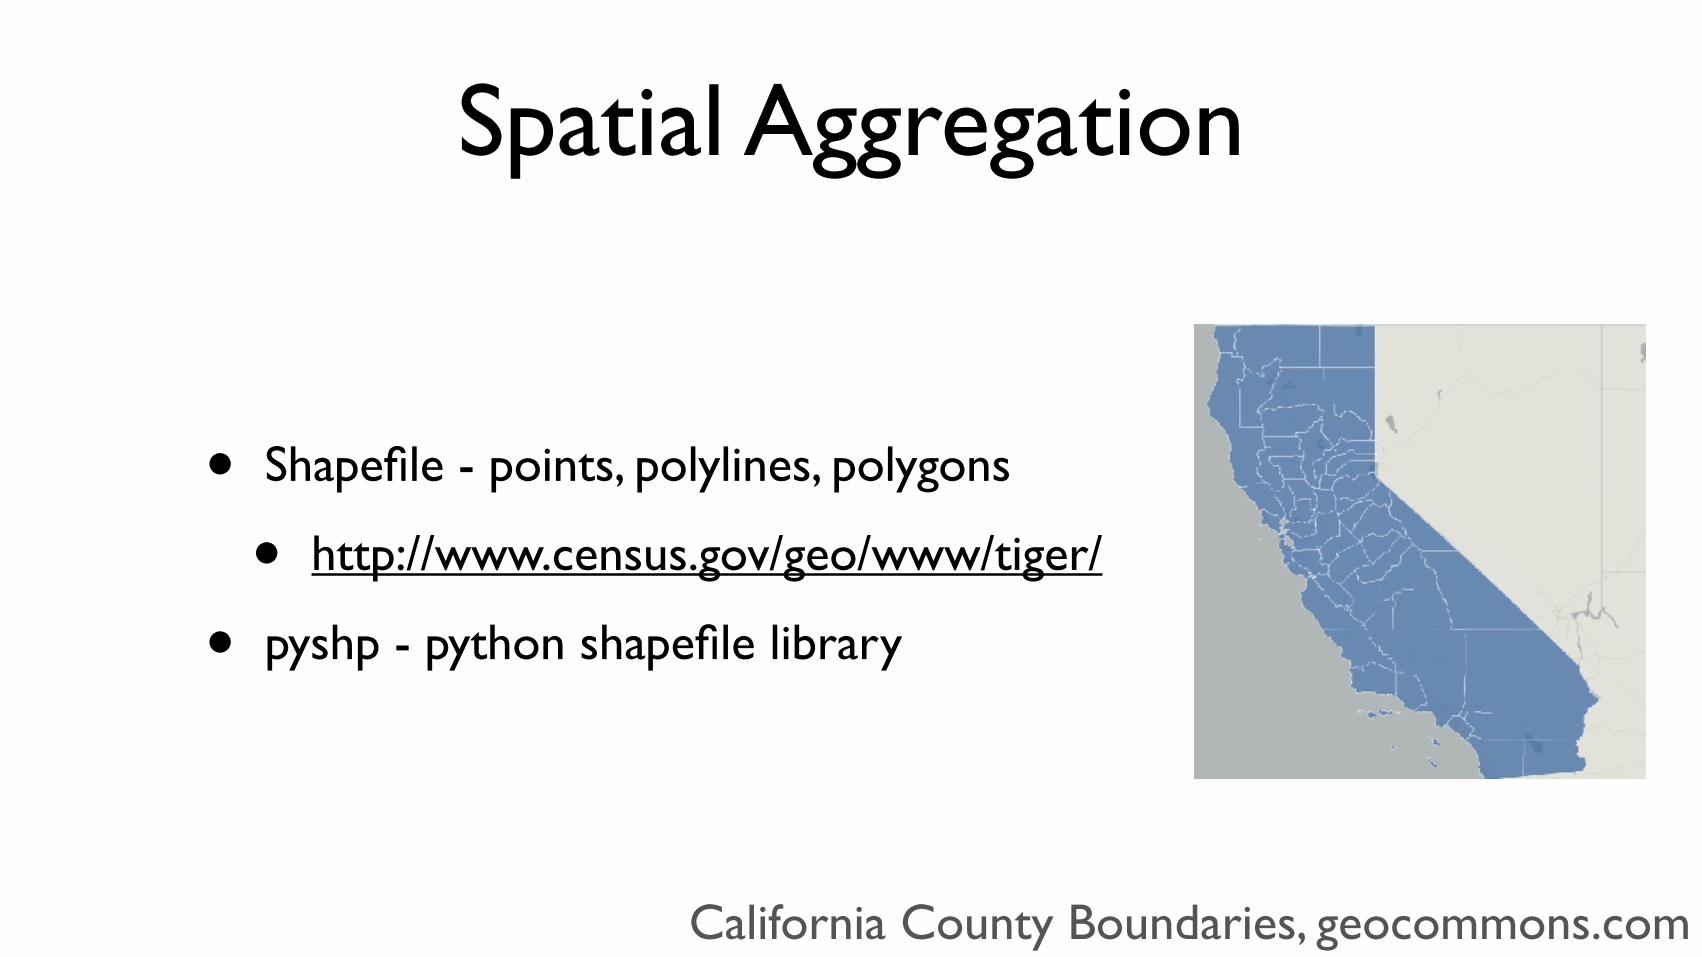
Spatial Aggregation
• Shapefile - points, polylines, polygons
• http://www.census.gov/geo/www/tiger/
• pyshp - python shapefile library
California County Boundaries, geocommons.com
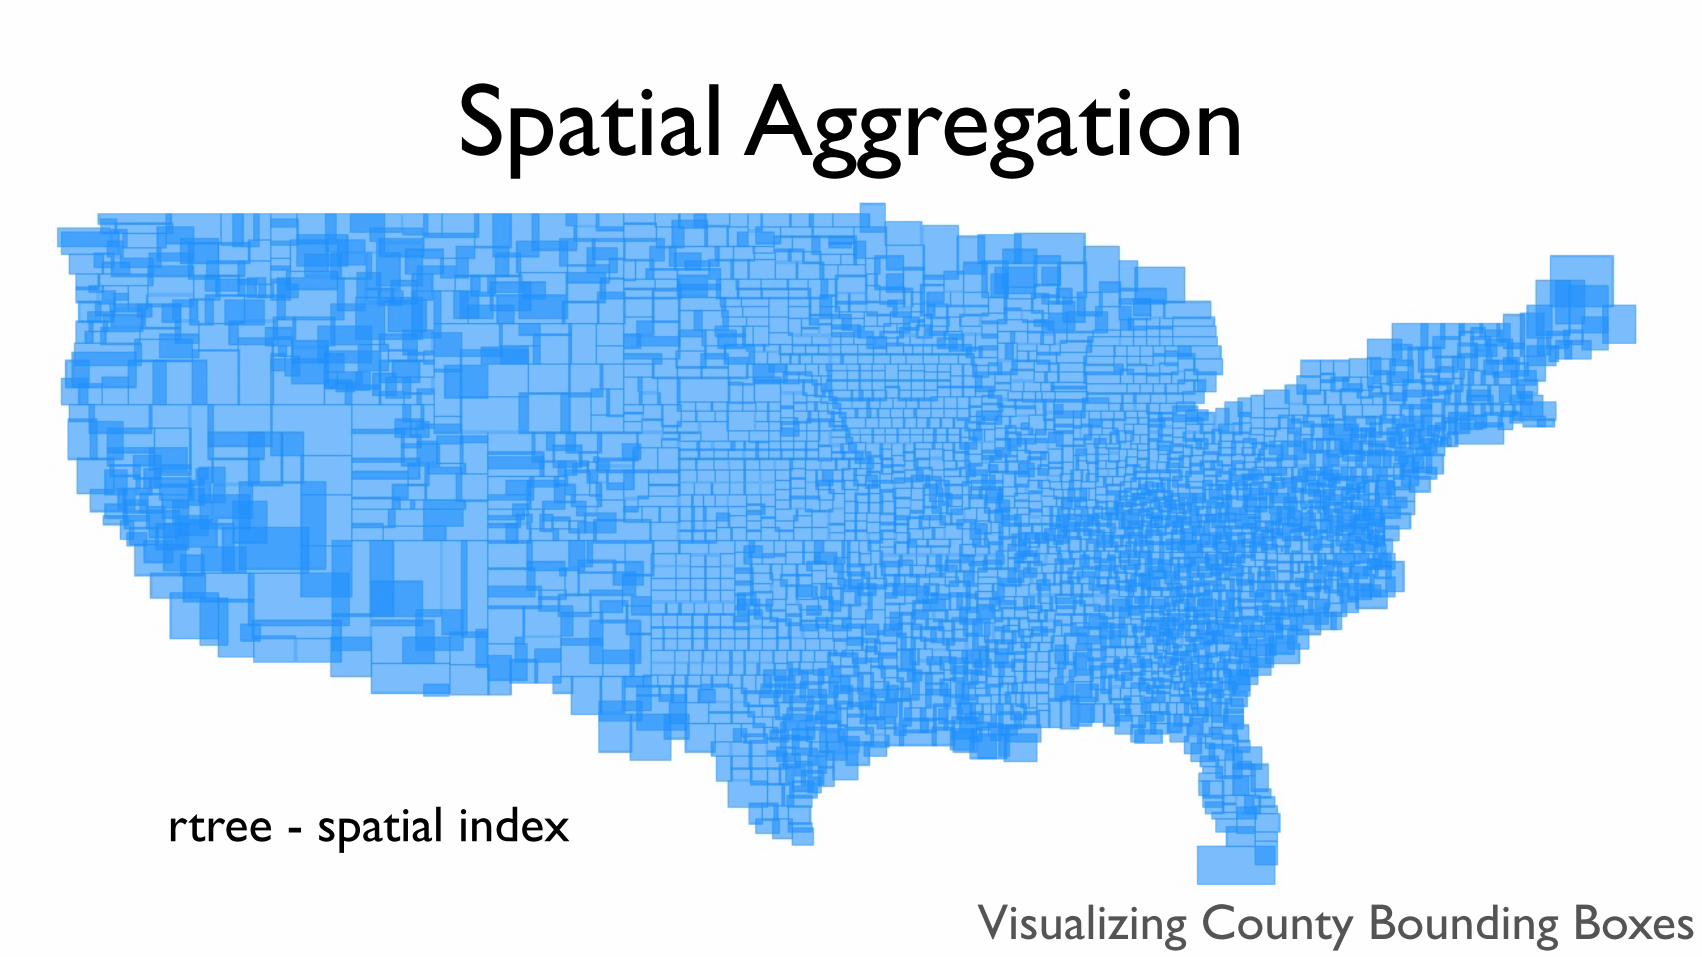
Spatial Aggregation
Visualizing County Bounding Boxes
rtree - spatial index
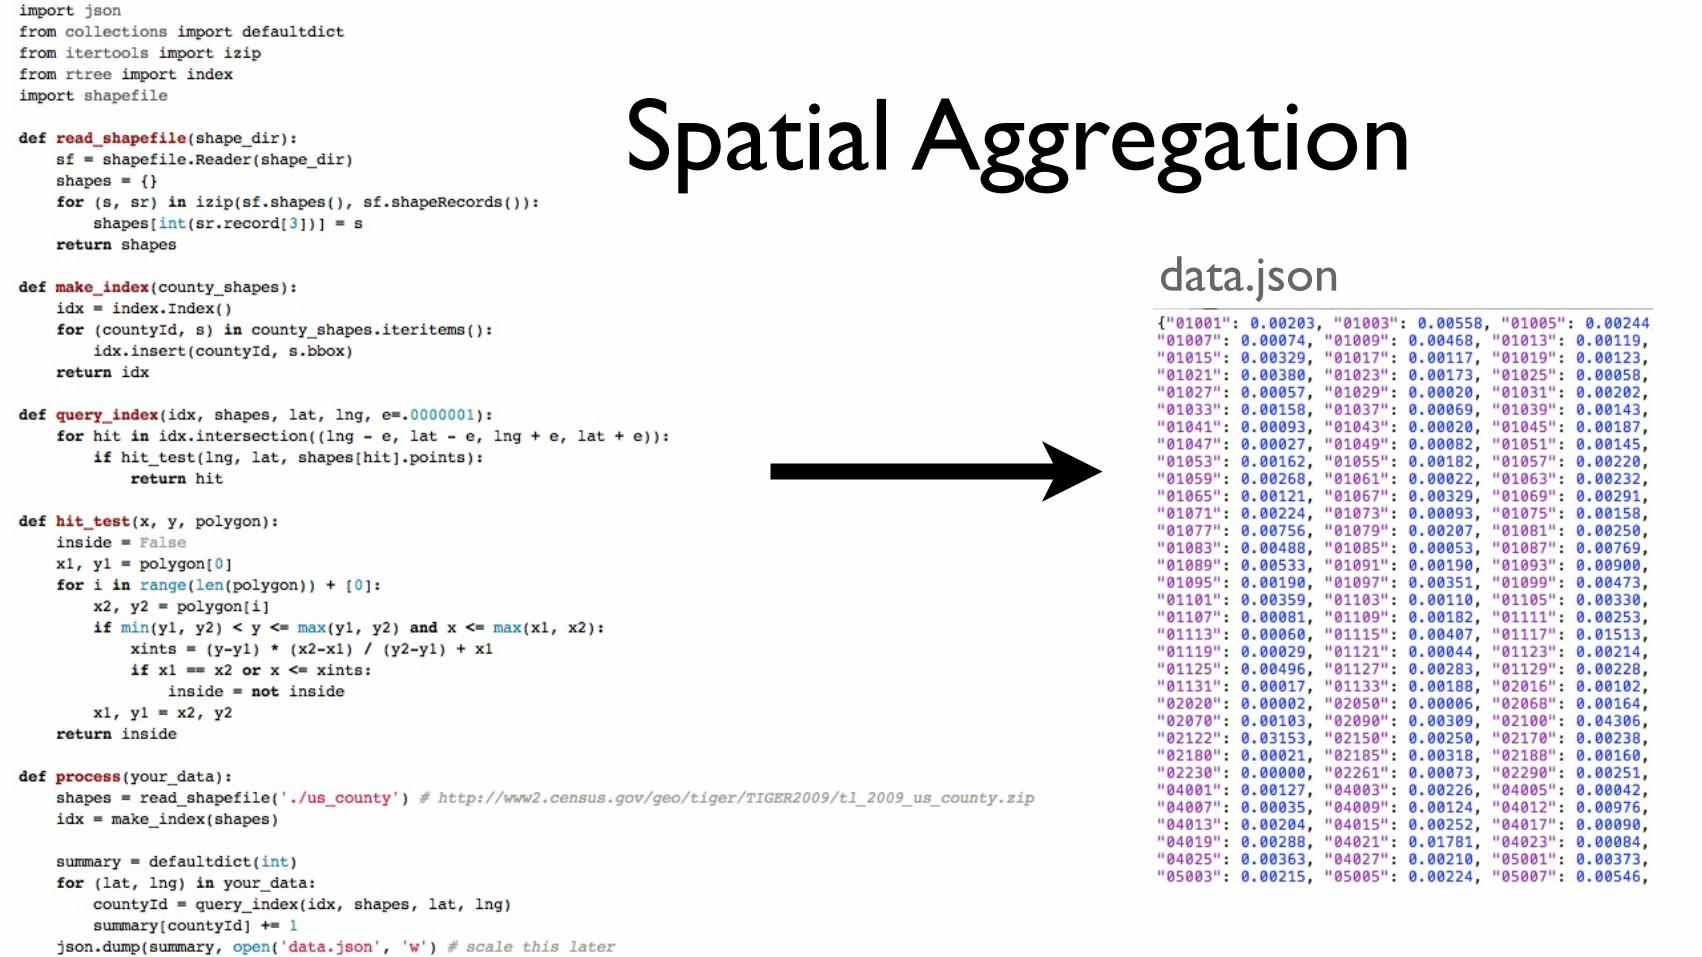
Spatial Aggregationdata.json
Spatial Aggregation
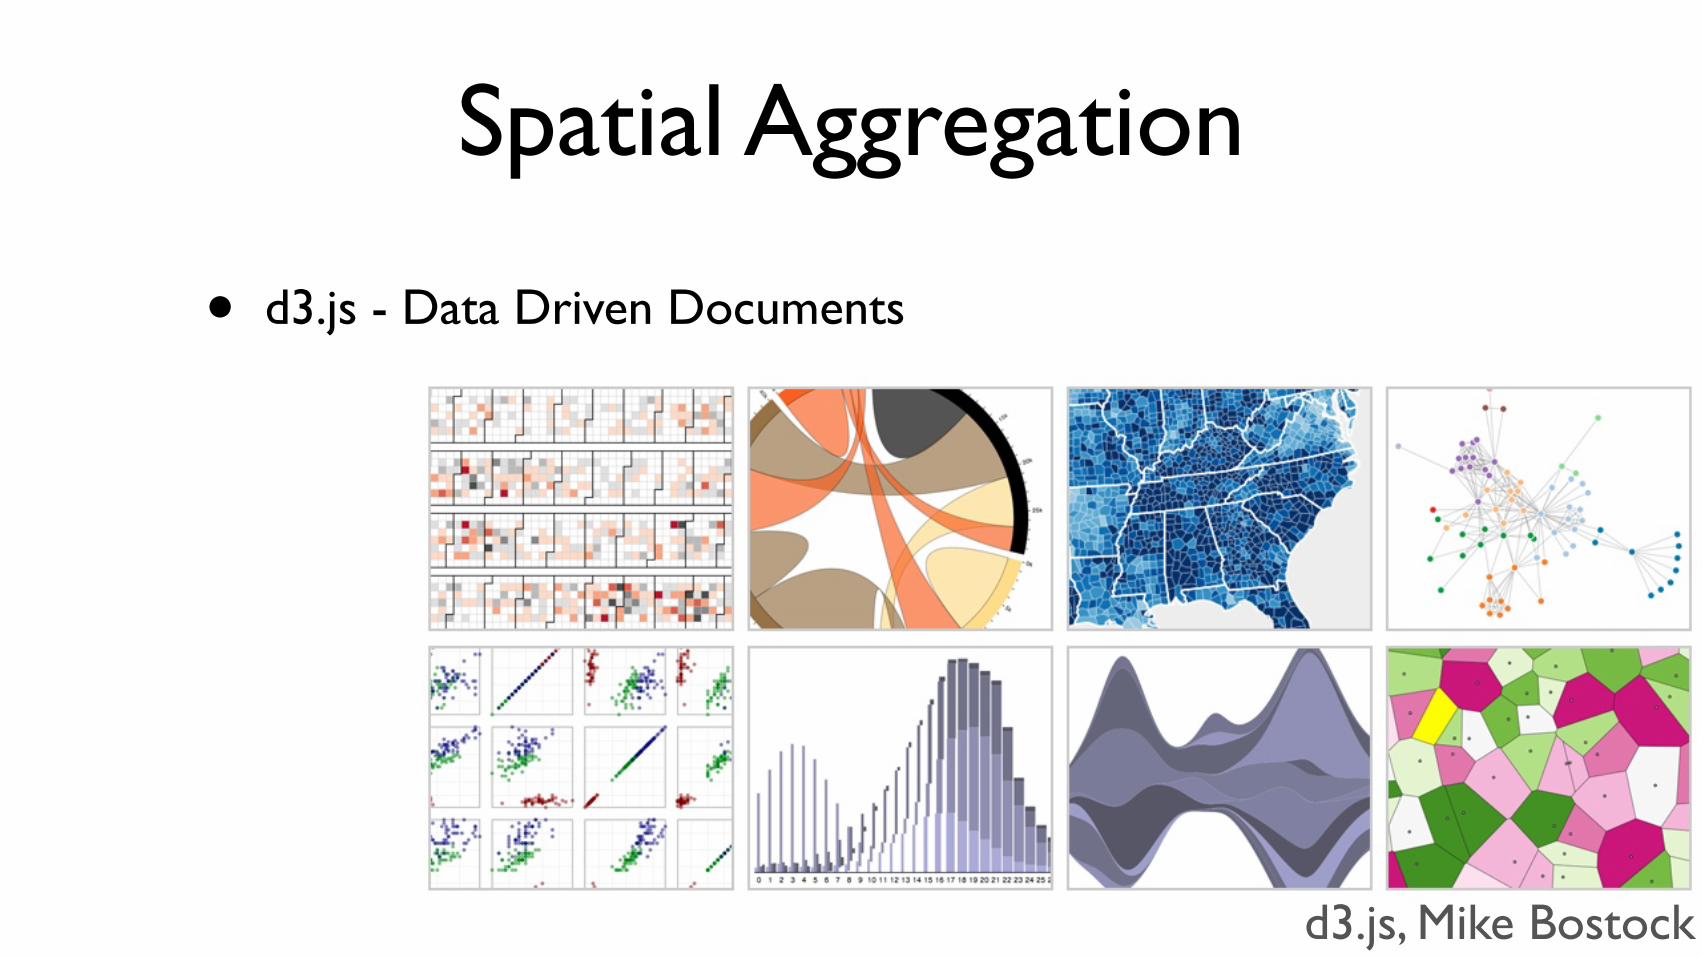
• d3.js - Data Driven Documents
d3.js, Mike Bostock
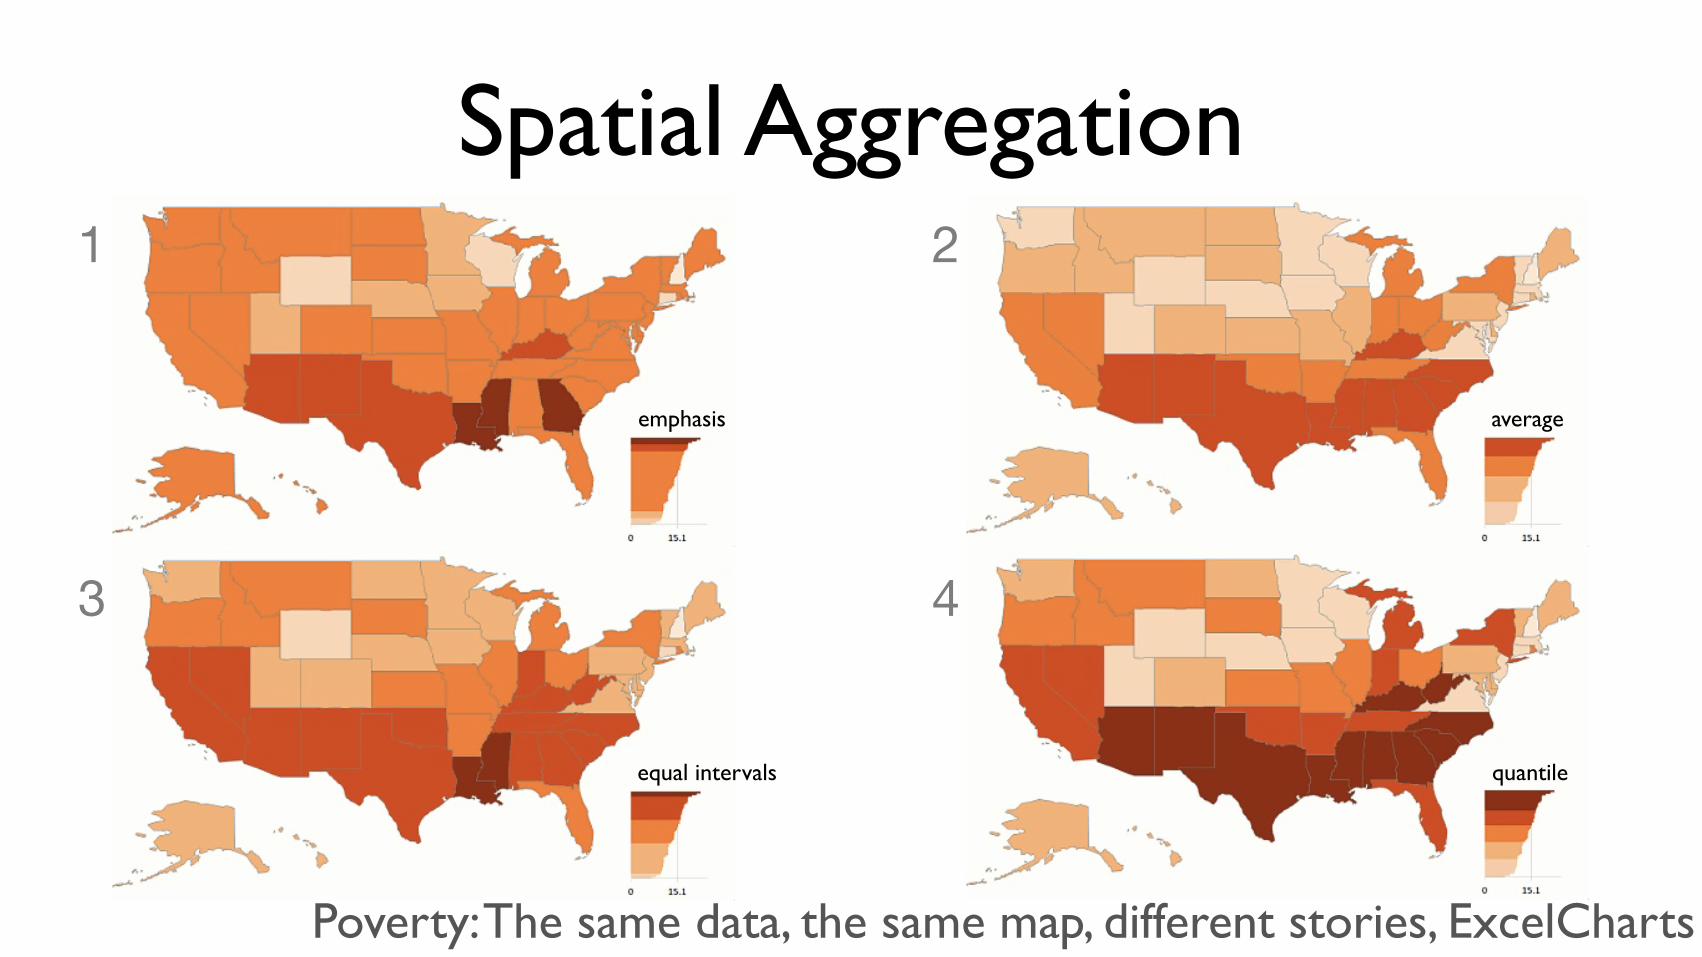
Spatial Aggregation
Poverty: The same data, the same map, different stories, ExcelCharts
emphasis
equal intervals quantile
average
1 2
3 4
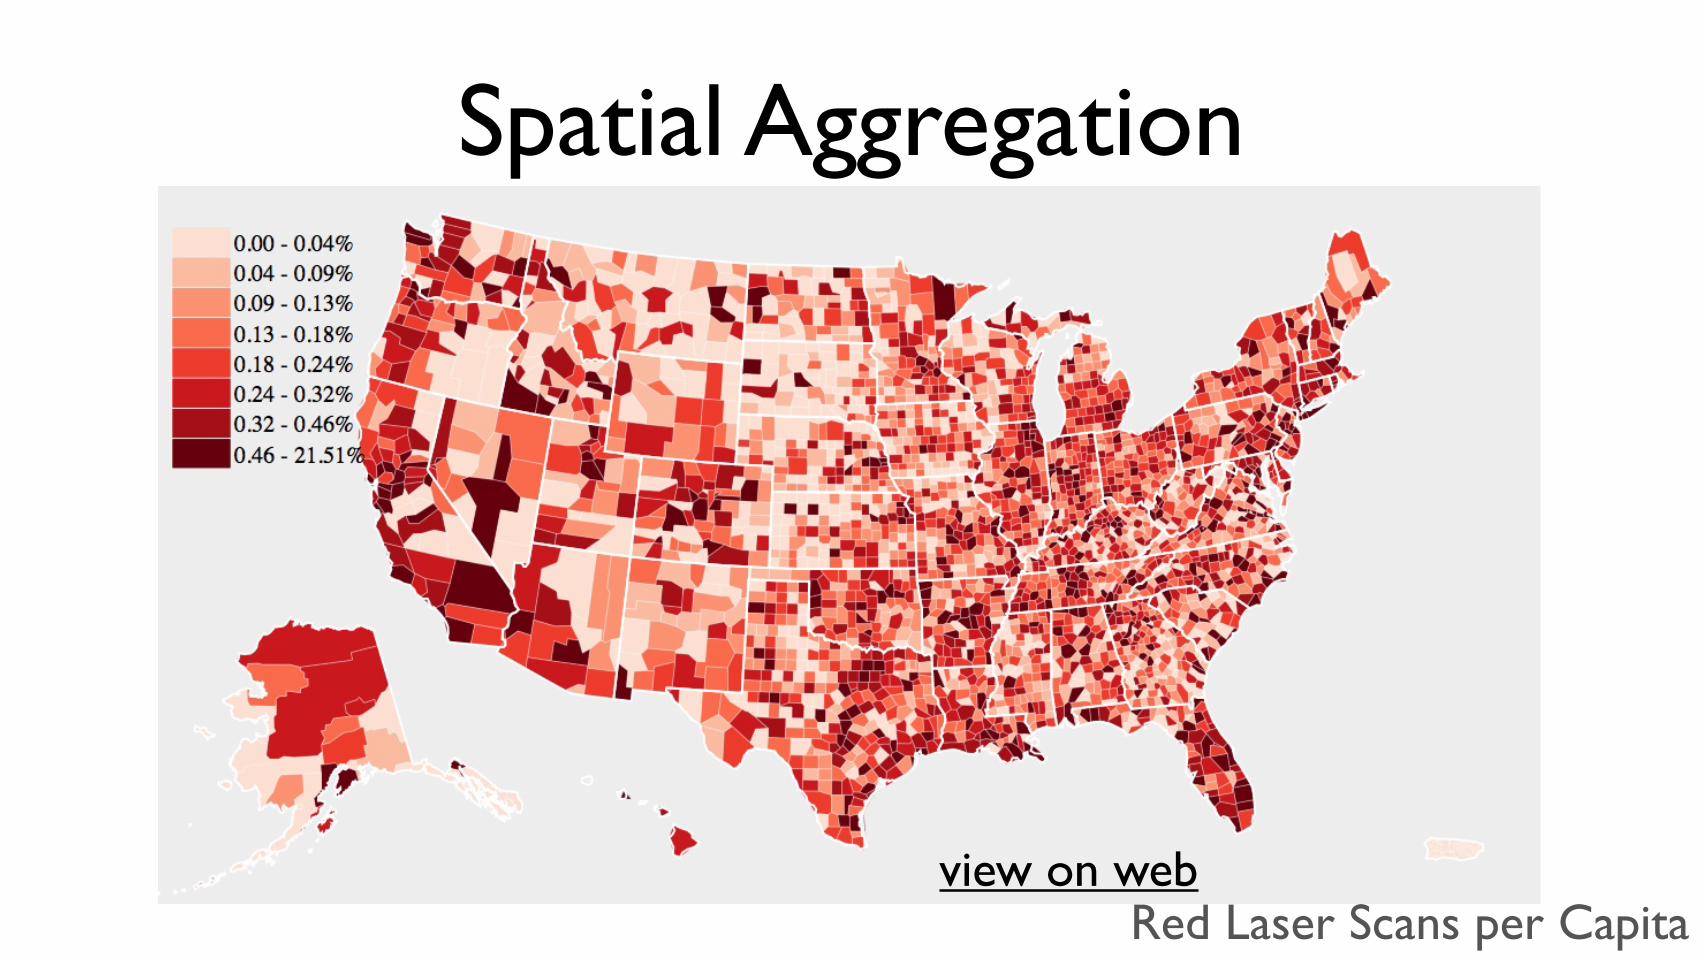
Spatial Aggregation
view on webRed Laser Scans per Capita
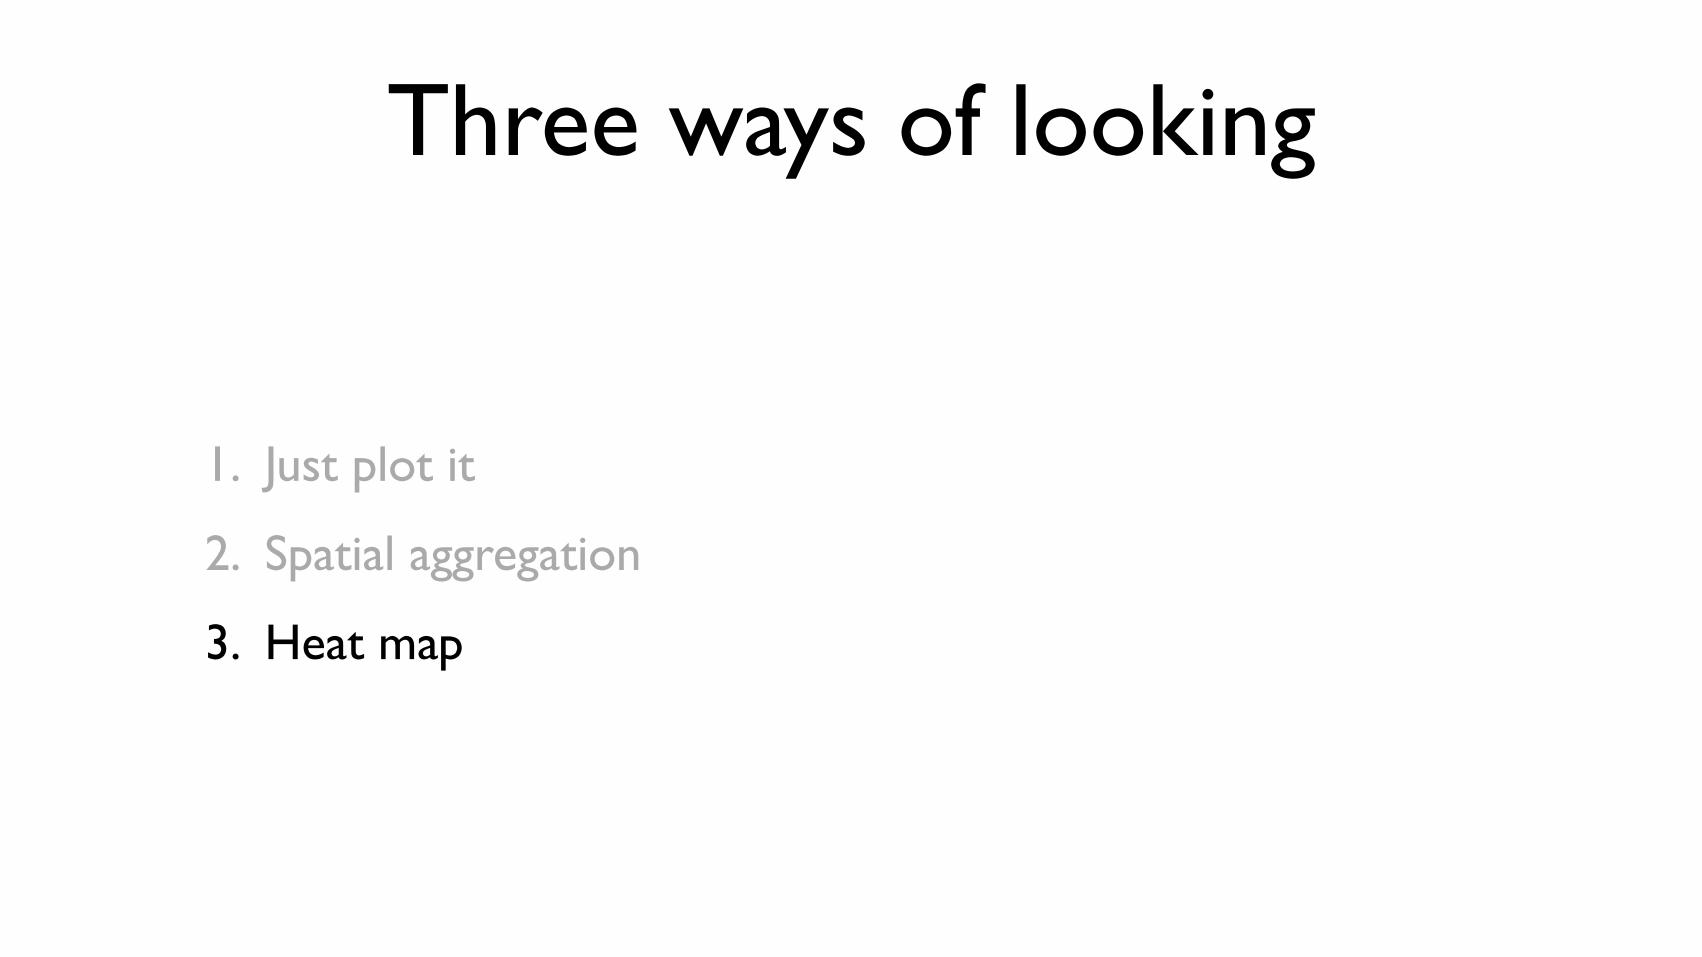
Three ways of looking
1. Just plot it
2. Spatial aggregation
3. Heat map
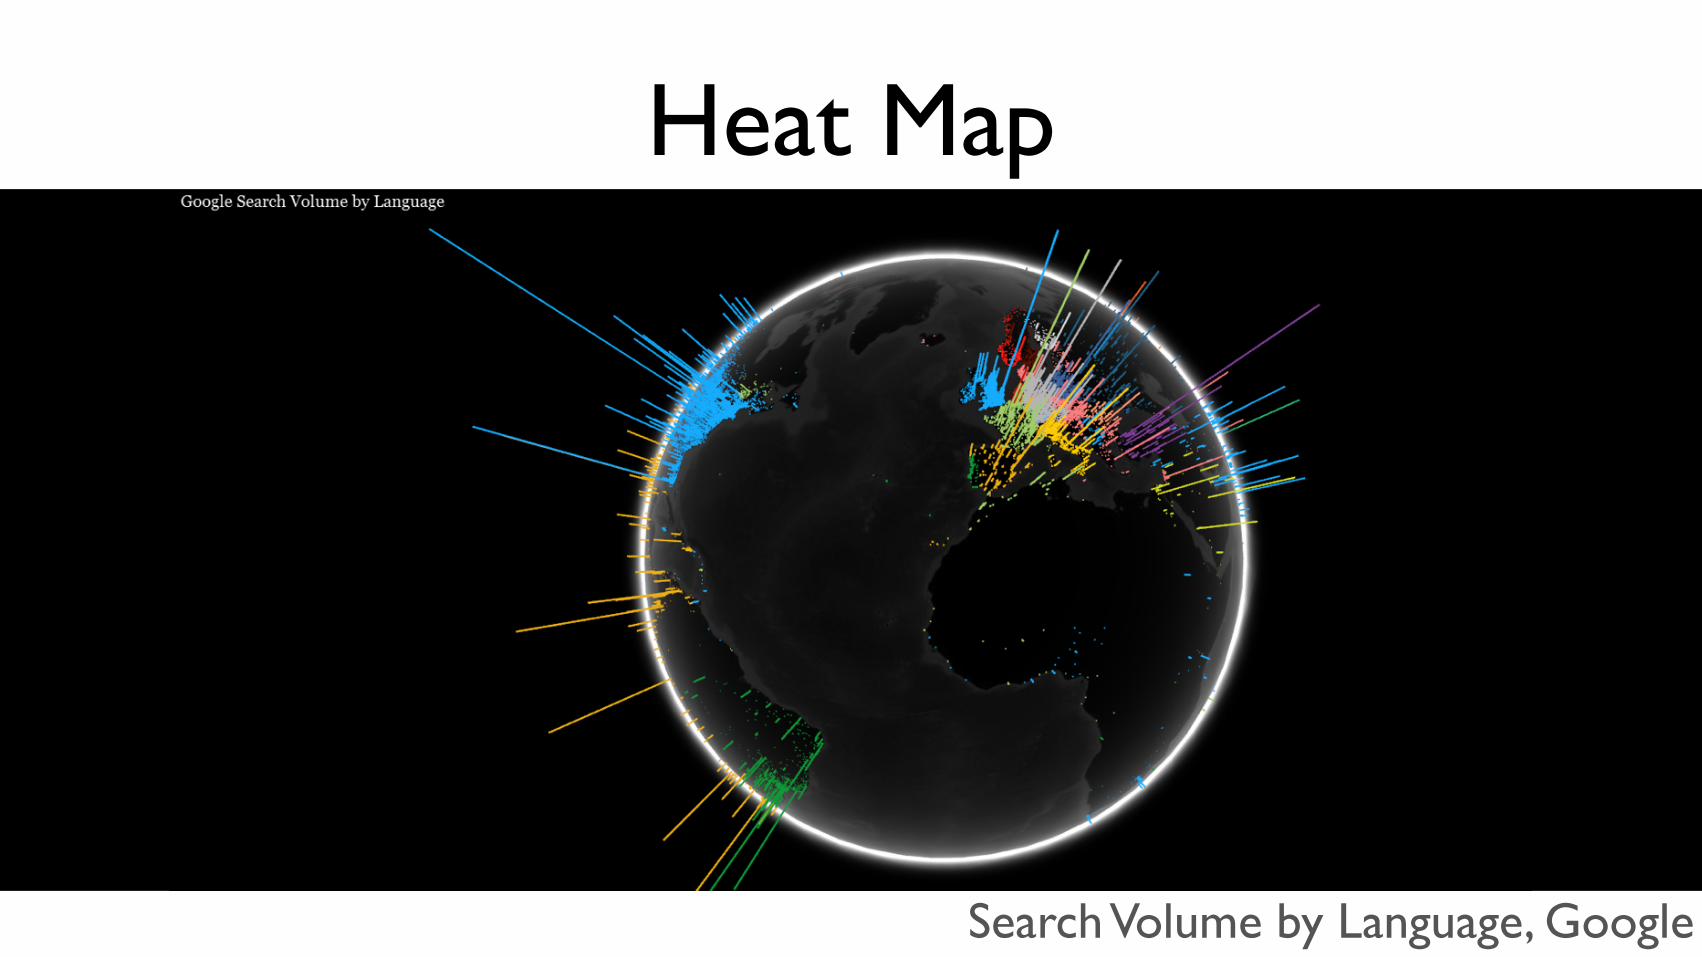
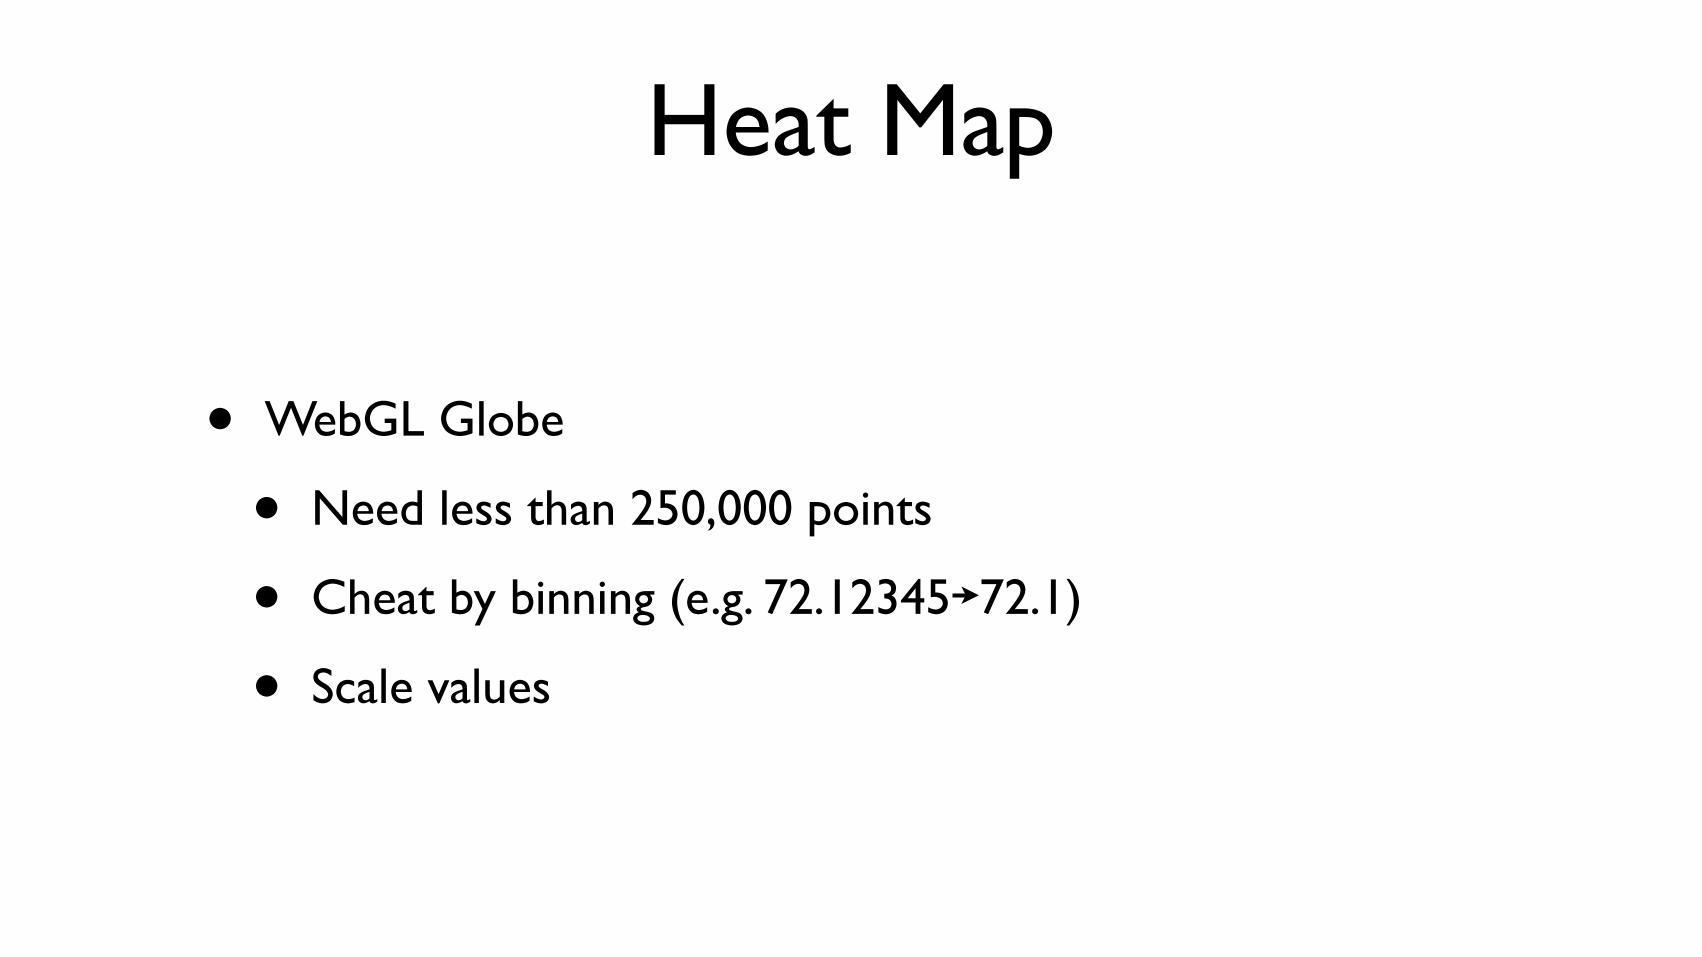
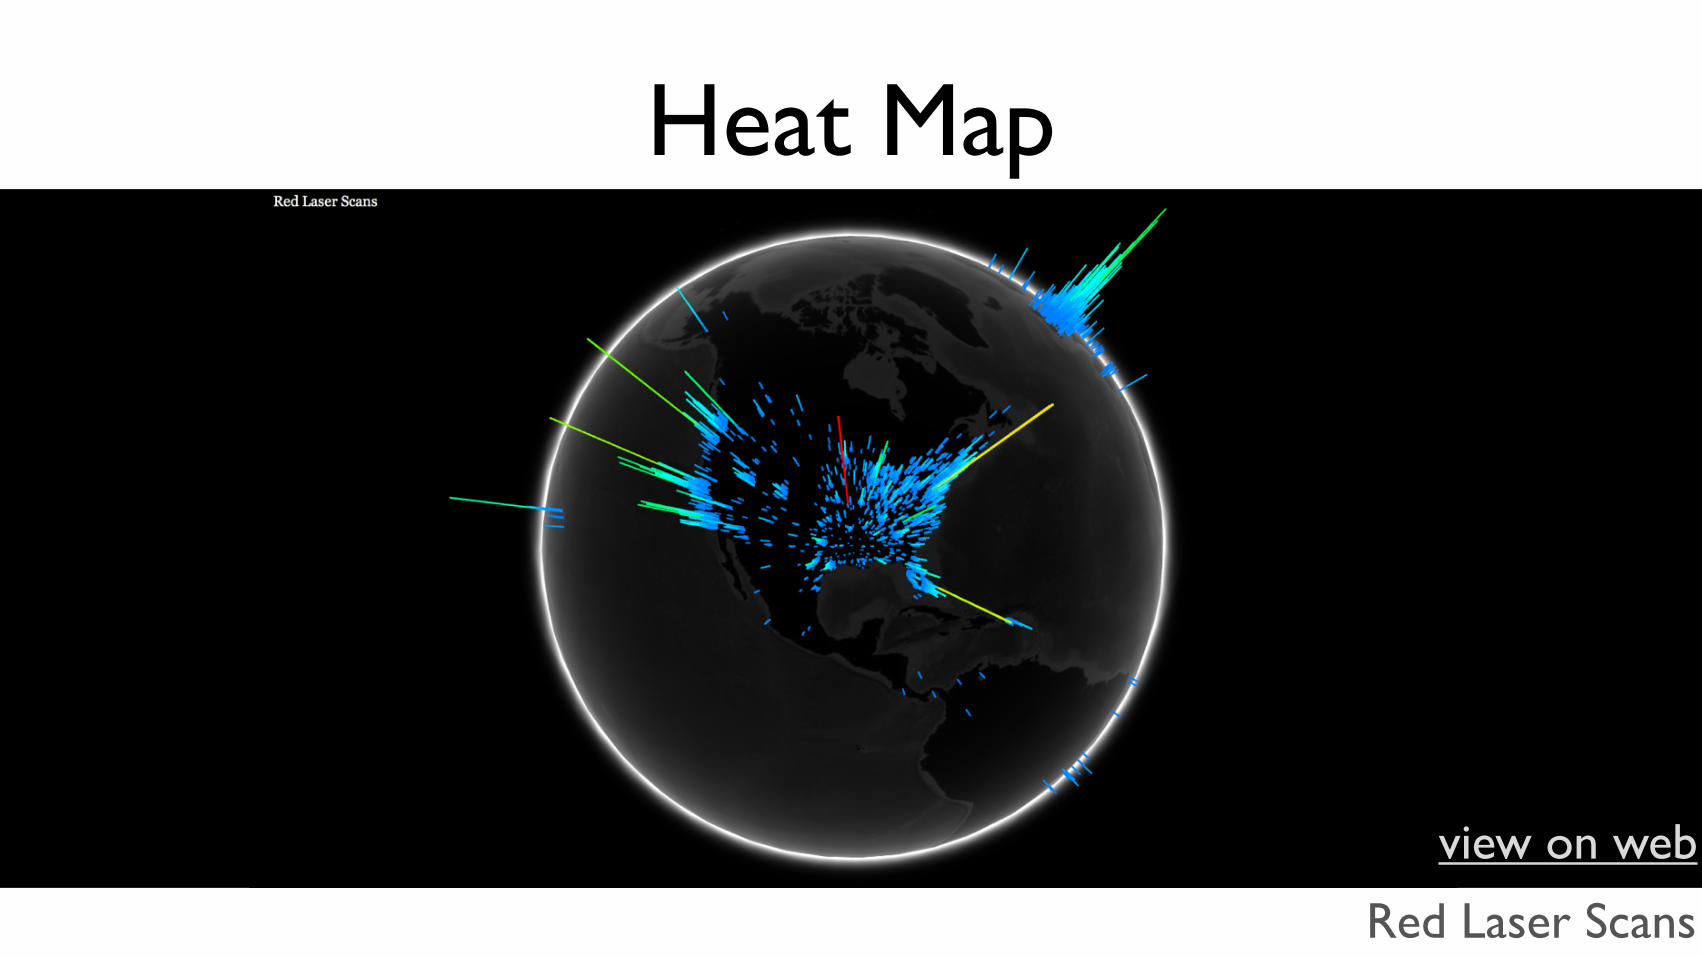
Heat Map
• Pros:
• Data decides where you look
• Better than “Just Plot It”?
• Cons:
• Not a lot of insight
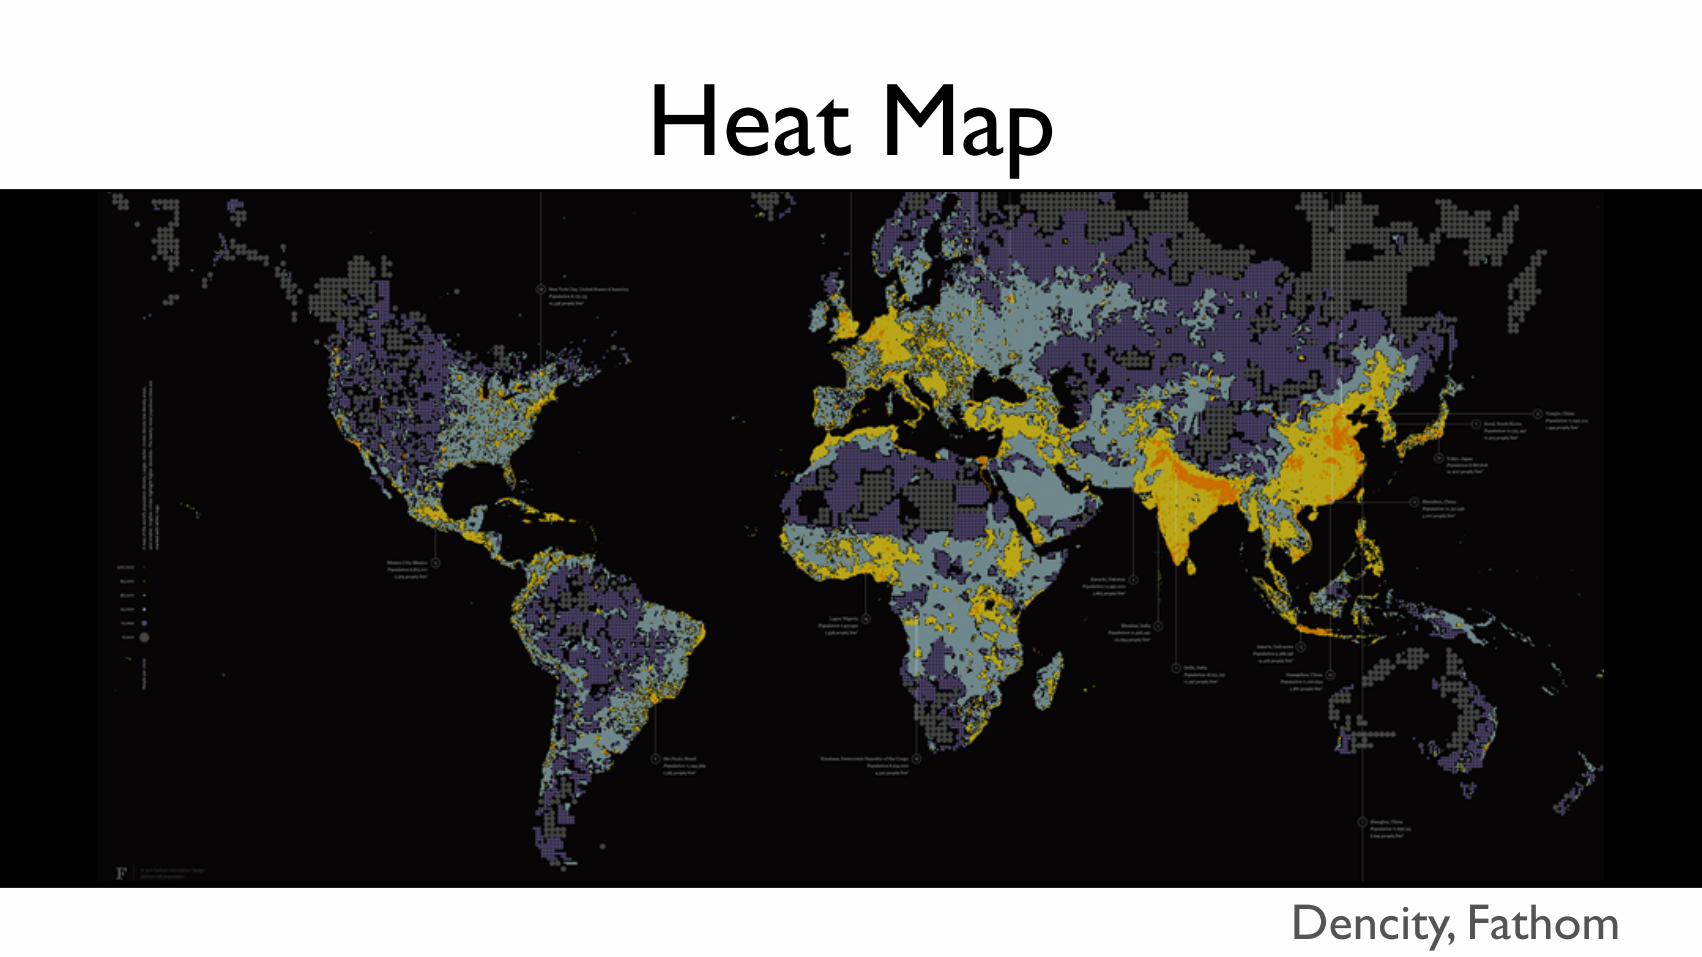
Heat Map
Dencity, Fathom
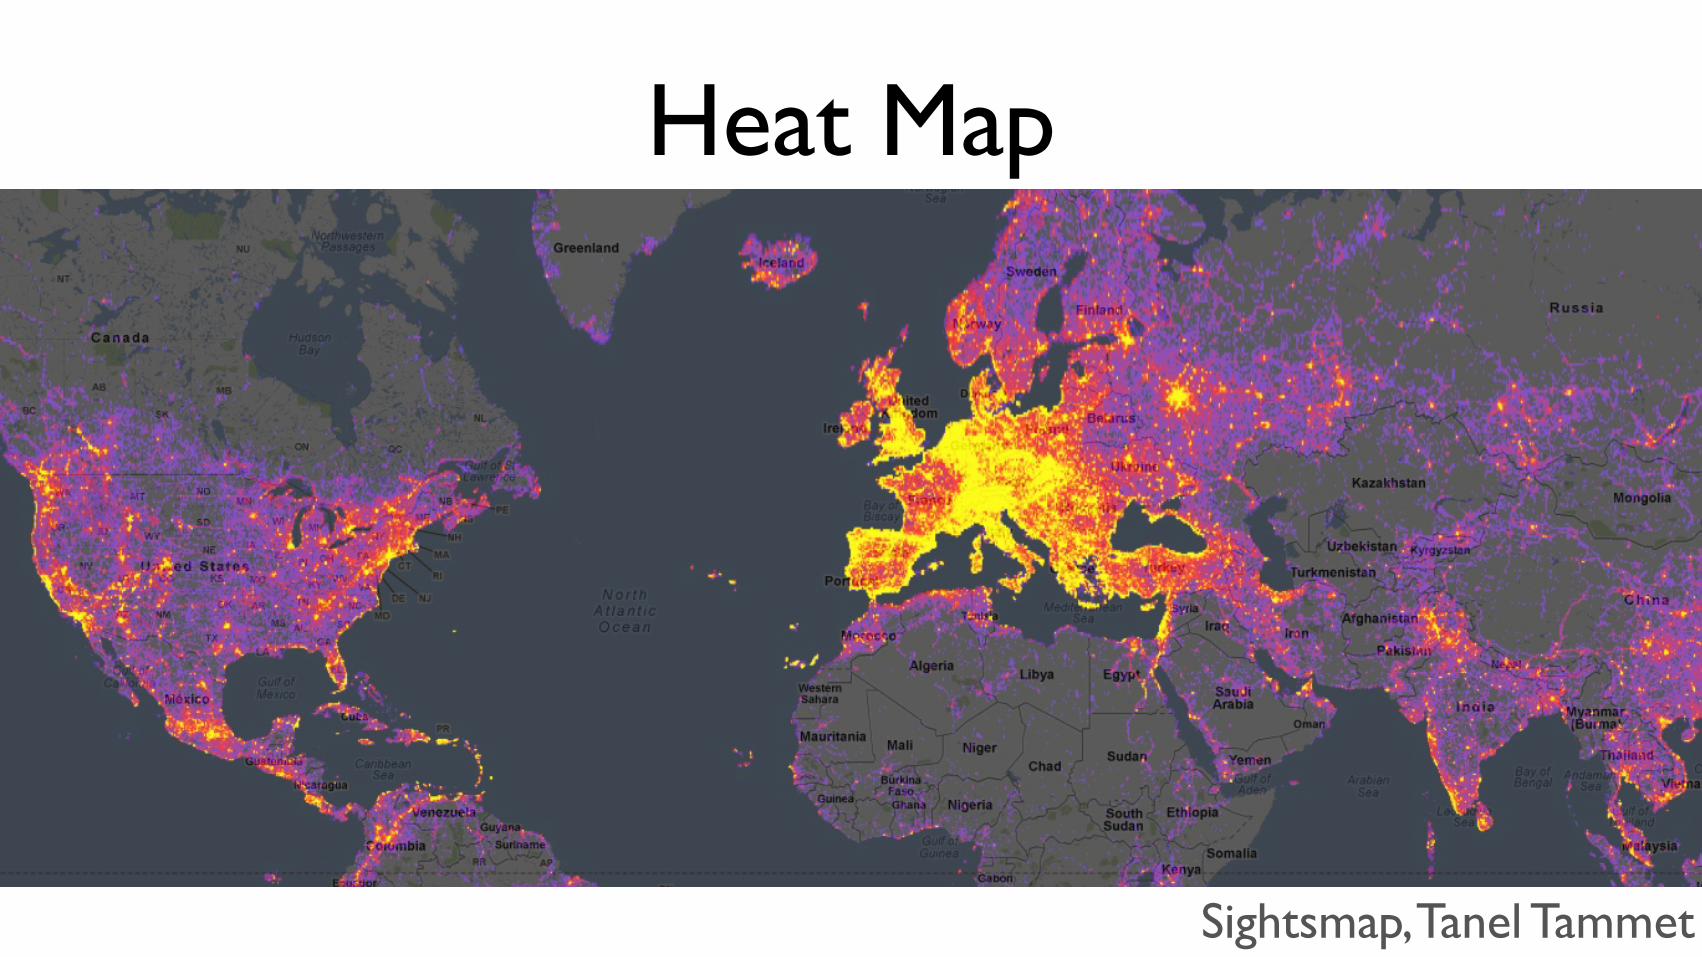
Heat Map
Sightsmap, Tanel Tammet
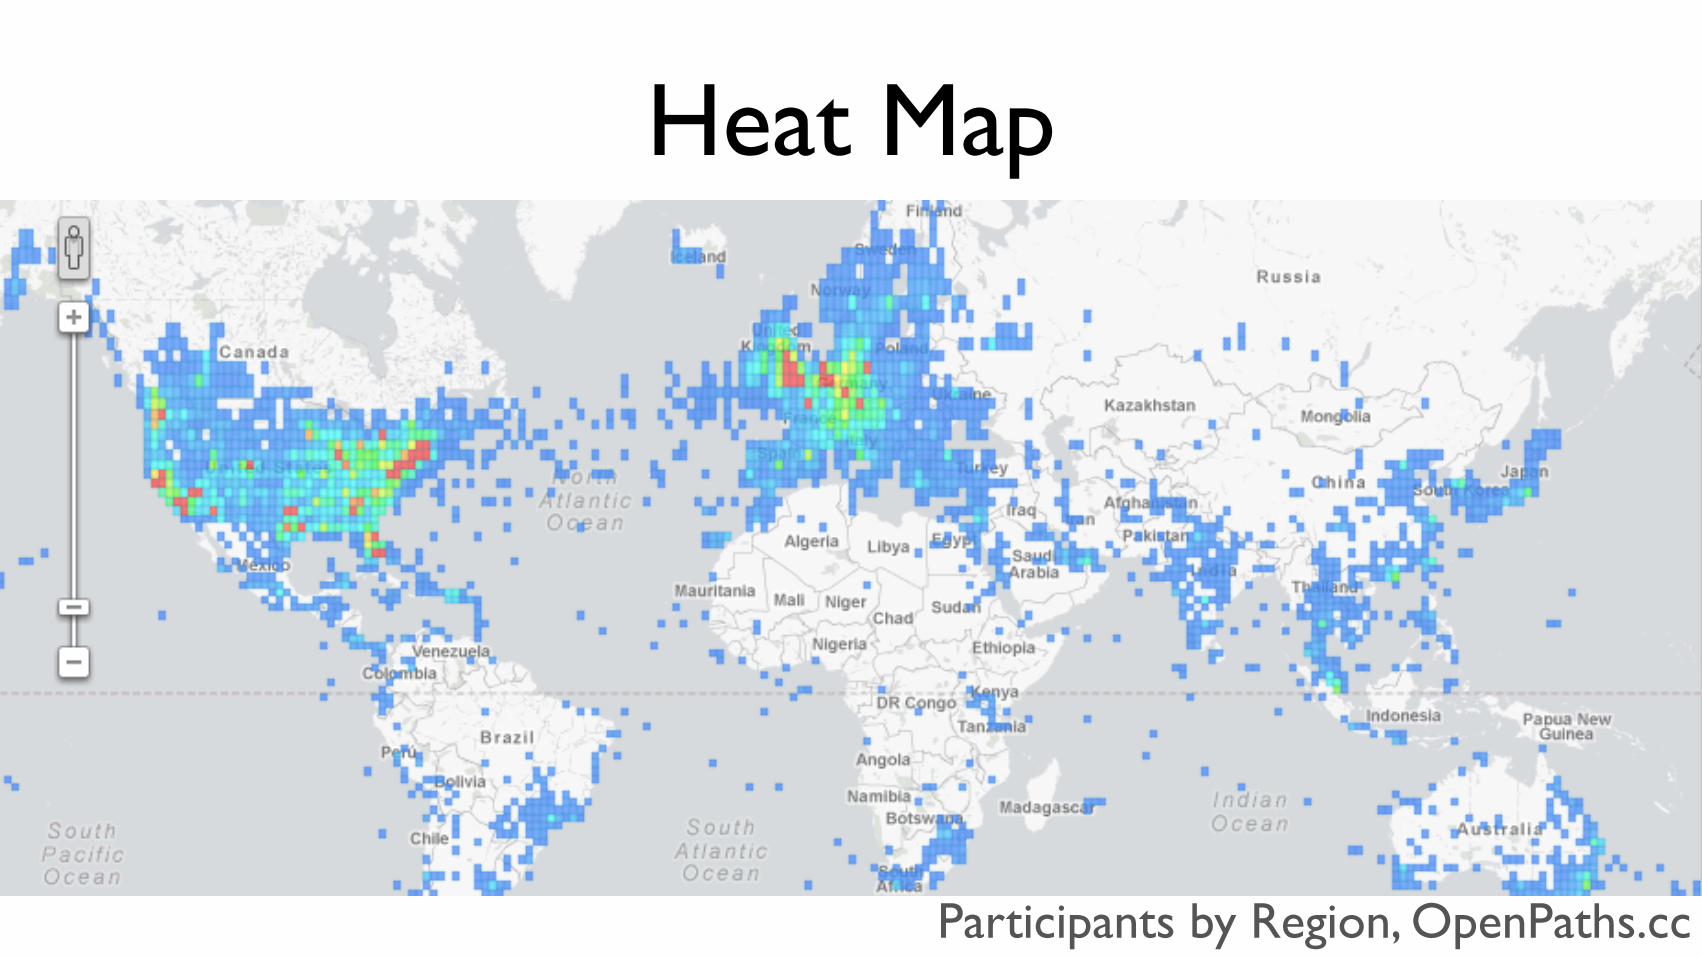
Heat Map
Participants by Region, OpenPaths.cc
Heat Map
Search Volume by Language, Google
Heat Map
• WebGL Globe
• Need less than 250,000 points
• Cheat by binning (e.g. 72.12345 72.1)
• Scale values
Heat Map
view on web
view on web
Red Laser Scans
Three ways of looking
1. Just plot it
2. Spatial aggregation
3. Heat map
Thank You
• Resources:
• http://viz.runningwithdata.com/vgd/
• http://bit.ly/strata_vgd
• @jsundram

Questions?
@jsundram
Top Related