


Languages
Pages
Legal


INFOVIS8803DV > SPRING 17
VISUAL PERCEPTION
& COGNITIVE PROCESSES
Prof. Rahul C. Basole
CS/MGT 8803-DV > January 30, 2017

INFOVIS8803DV > SPRING 17
How Are “Graphics” Used?
• Larkin & Simon (1987) investigated usefulness of graphical displays
• Graphical visualization could support more efficient task performance by:
– Allowing substitution of rapid perceptual inferences for difficult logical inferences
– Reducing search for information required for task completion
• DataVis is a useful tool for aiding comprehension, understanding and decision-making.
• This is not a surprise (we have been studying this all semester).
INFOVIS8803DV > SPRING 17
Learning Objectives
• Describe the visual processing pipeline
• Define pre-attentive processing
• Describe Gestalt principles and their application to visualization
• Learn about and use principles of color in visualization
• Ultimately, critique and apply perception principles to designs

INFOVIS8803DV > SPRING 17

INFOVIS8803DV > SPRING 17

INFOVIS8803DV > SPRING 17

INFOVIS8803DV > SPRING 17
DataVis Amplifies Cognition
What is the process by which a person looks at a graphic and makes some use of it? What is your process?

INFOVIS8803DV > SPRING 17
Process Model I
Navigation Process Model (by Robert Spence)
Spence 1999
• Content is the display on
screen
• User’s modeling of visual
image results in a
“cognitive map” or
“cognitive model”
• Interpretation (Aha!,
variables x and y are
related) leads to new
“cognitive map”. In turn,
generates idea for a new
browsing strategy
• Look at the display again
with that strategy (Iterative)

INFOVIS8803DV > SPRING 17
Process Model II
Knowledge Crystallization Model (by Card et al.)
Instantiate
schema
Search for
schema(representation)
Forage
for data
Problem-solve
Author,
decide
or act
TaskExtract results
Author report
Reason about schema
Facts
Comparisons
Patterns
Iterate as needed
Instantiate
Reorder
Cluster
Class
Average
Promote
Detect pattern
Abstract
Overview
Zoom
Filter
Details-on-demand
Browse
Search query
INFOVIS8803DV > SPRING 17
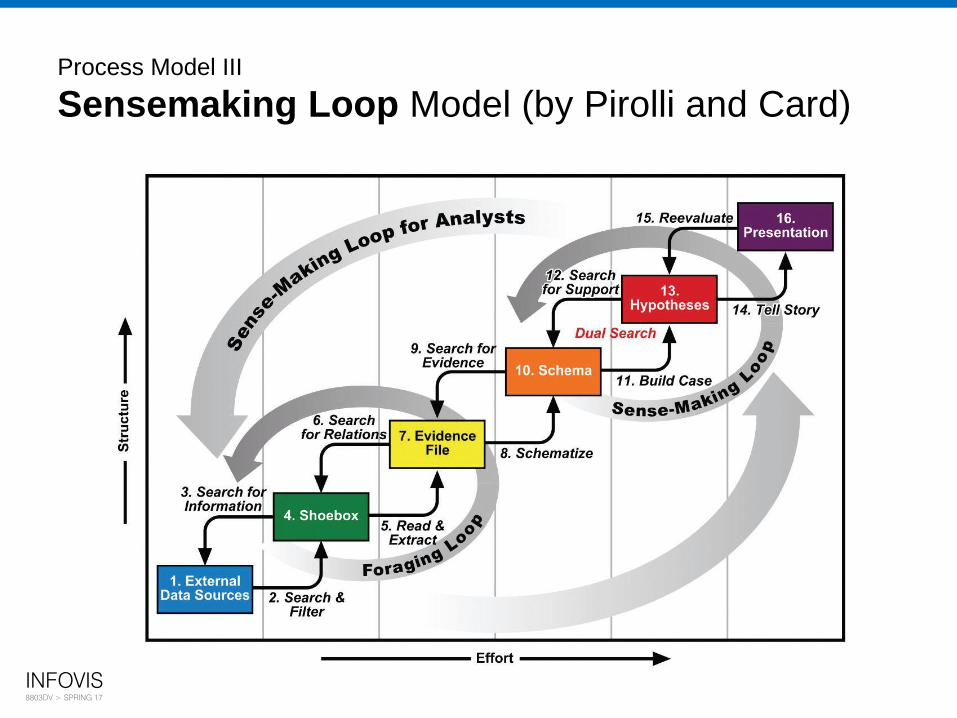
Process Model III
Sensemaking Loop Model (by Pirolli and Card)
INFOVIS8803DV > SPRING 17
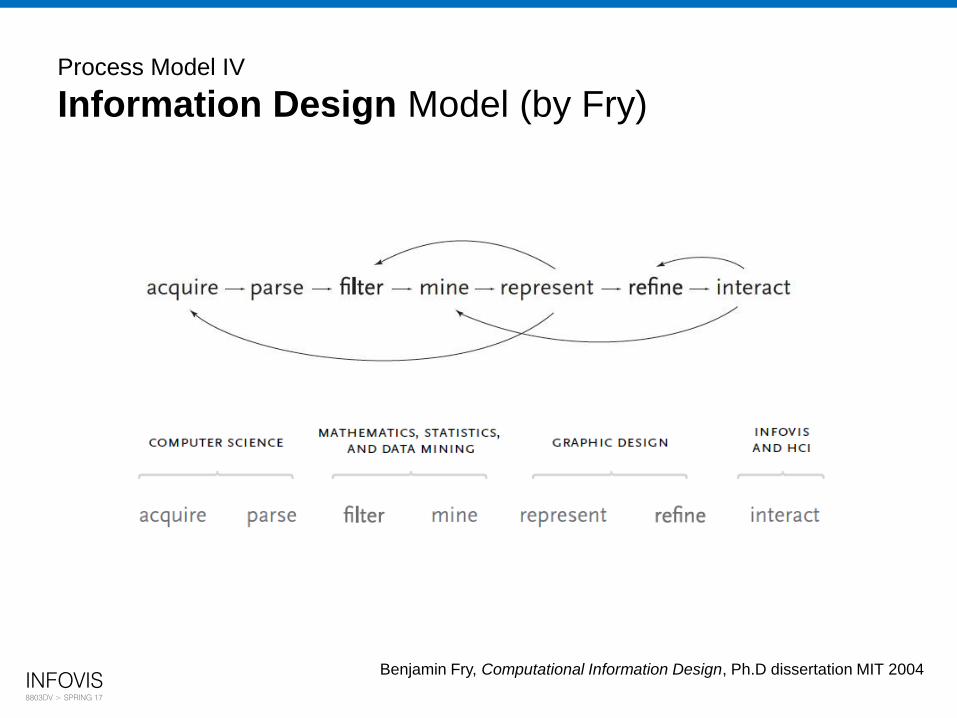
Process Model IV
Information Design Model (by Fry)
Benjamin Fry, Computational Information Design, Ph.D dissertation MIT 2004

INFOVIS8803DV > SPRING 17
Process Model V
Visualization Reference Model (by Card et al.)

INFOVIS8803DV > SPRING 17
Process Model VI
Visual Analysis Model (by Tableau)

INFOVIS8803DV > SPRING 17
So How Does Vis Amplify Cognition?
• Increases memory and processing resources available
• Reduces search for information
• Enhances the recognition of patterns
• Enables perceptual inference operations
• Uses perceptual attention mechanisms for monitoring
• Encodes info in a manipulable medium

INFOVIS8803DV > SPRING 17
Lots of Related Fields of Study
• Semiotics
– The study of symbols and how they convey meaning
– Classic book by J. Bertin (1983) The Semiology of Graphics
• Psychophysics
– Applying methods of physics to measuring human perceptual systems
• How fast must light flicker until we perceive it as constant?
• What change in brightness can we perceive?
• Cognitive psychology
– Understand how people think, and in our context, how it relates to perception

INFOVIS8803DV > SPRING 17
Perceptual Processing
• Seek to better understand visual perception and visual information
processing
– Multiple theories or models exist
– Need to understand physiology and cognitive psychology

INFOVIS8803DV > SPRING 17
One (Simple) Model
• Two stage process
– Parallel extraction of low-level properties of scene
– Sequential goal-directed processing
Ware 2000
Stage 1 Stage 2
Early, parallel
detection of
color, texture,
shape, spatial
attributes
Serial processing of
object identification (using
memory) and spatial layout,
action

INFOVIS8803DV > SPRING 17
Stage 1: Low-level, Parallel
• Neurons in eye & brain responsible for different kinds of information
– Orientation, color, texture, movement, etc.
• Arrays of neurons work in parallel
• Occurs “automatically”
• Rapid
• Information is transitory, briefly held in iconic store
• Bottom-up data-driven model of processing
• Often called “pre-attentive” processing

INFOVIS8803DV > SPRING 17
Stage 2: Sequential, Goal-Directed
• Splits into subsystems for object recognition and for interacting with
environment
• Increasing evidence supports independence of systems for symbolic
object manipulation and for locomotion & action
• First subsystem interfaces to verbal linguistic portion of brain,
second interfaces to motor systems that control muscle movements

INFOVIS8803DV > SPRING 17
Pre-attentive Processing
• How does human visual system analyze images?
– Some things seem to be done preattentively, without the need for
focused attention
– Generally less than 200-250 msecs (eye movements take 200 msecs)
– Seems to be done in parallel by low-level vision system

INFOVIS8803DV > SPRING 17
How Many 3’s?
1281768756138976546984506985604982826762
9809858458224509856458945098450980943585
9091030209905959595772564675050678904567
8845789809821677654876364908560912949686

INFOVIS8803DV > SPRING 17
How Many 3’s?
1281768756138976546984506985604982826762
9809858458224509856458945098450980943585
9091030209905959595772564675050678904567
8845789809821677654876364908560912949686

INFOVIS8803DV > SPRING 17
What Kinds of Tasks?
• Target detection
– Is something there?
• Boundary detection
– Can the elements be grouped?
• Counting
– How many elements of a certain type are present?

INFOVIS8803DV > SPRING 17
Example
• Determine if a red circle is present

INFOVIS8803DV > SPRING 17
Example
• Determine if a red circle is present

INFOVIS8803DV > SPRING 17
Example
• Determine if a red circle is present

INFOVIS8803DV > SPRING 17
Example
• Is there a boundary in the display?

INFOVIS8803DV > SPRING 17
Example
• Is there a boundary in the display?

INFOVIS8803DV > SPRING 17
Example
• Is there a boundary?

INFOVIS8803DV > SPRING 17
Example Applet
• Nice on-line tutorial and example applet
– http://www.csc.ncsu.edu/faculty/healey/PP/index.html
– Chris Healey, NC State
– Prior examples taken from site

INFOVIS8803DV > SPRING 17
3-D Figures
3-D visual reality has an influence
INFOVIS8803DV > SPRING 17
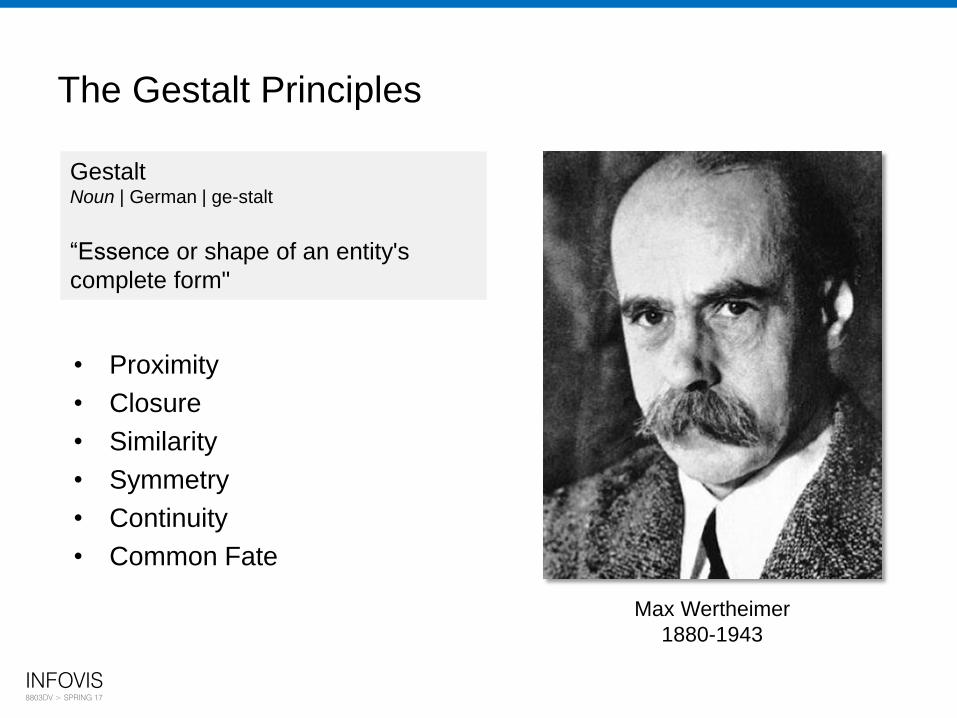
The Gestalt Principles
• Proximity
• Closure
• Similarity
• Symmetry
• Continuity
• Common Fate
Max Wertheimer
1880-1943
GestaltNoun | German | ge-stalt
“Essence or shape of an entity's
complete form"

INFOVIS8803DV > SPRING 17
Proximity
We group together “proximate” objects

INFOVIS8803DV > SPRING 17
Closure
We tend to ignore gaps and try to see collections of
objects as creating a larger, more complete object

INFOVIS8803DV > SPRING 17
Similarity
Items/objects that are similar tend to be grouped together

INFOVIS8803DV > SPRING 17
Symmetry
We group together objects
that are symmetrical one to another

INFOVIS8803DV > SPRING 17
Continuity
We separate (parse) overlapping objects to give them
a ‘smooth’ interpretation
a b c
(a) (b) (c)

INFOVIS8803DV > SPRING 17
Common Fate
• We group together objects
seen to be moving in the same
direction (having a ‘common
fate’
• Also applies to movement
toward perspective vanishing
point

INFOVIS8803DV > SPRING 17
Proximity Example
• Items close together appear to have a relationship
• Distance implies no relationship
Time:
Time:

INFOVIS8803DV > SPRING 17
Combining Gestalt Principles
• Several Principles can be combined
– Proximity reinforces similarity
– Proximity reinforces closure
– Proximity opposes closure
[ ] [ ]
][ ][ ]

INFOVIS8803DV > SPRING 17
Which Example Works Best?
http://xlcubedblog.wordpress.com/2008/05/09/applied-gestalt-laws-table-alignment/

INFOVIS8803DV > SPRING 17

INFOVIS8803DV > SPRING 17
Grouping
No visual structure Grouping created by
- Visual separation between clusters
- Proximity within clusters
Hierarchy created by
- Indentation (common fate)
Rotate X
Rotate Y
Rotate Z
Zoom In
Zoom Out
Rotate
X
Y
Z
Zoom
In
Out

INFOVIS8803DV > SPRING 17
Grouping
Even more visual structure
Grouping created by
Visual separation between clusters
Proximity within clusters
Boxes around each cluster
Hierarchy created by
Indentation (common fate)
Rotate
X
Y
Z
Zoom
In
Out
INFOVIS8803DV > SPRING 17
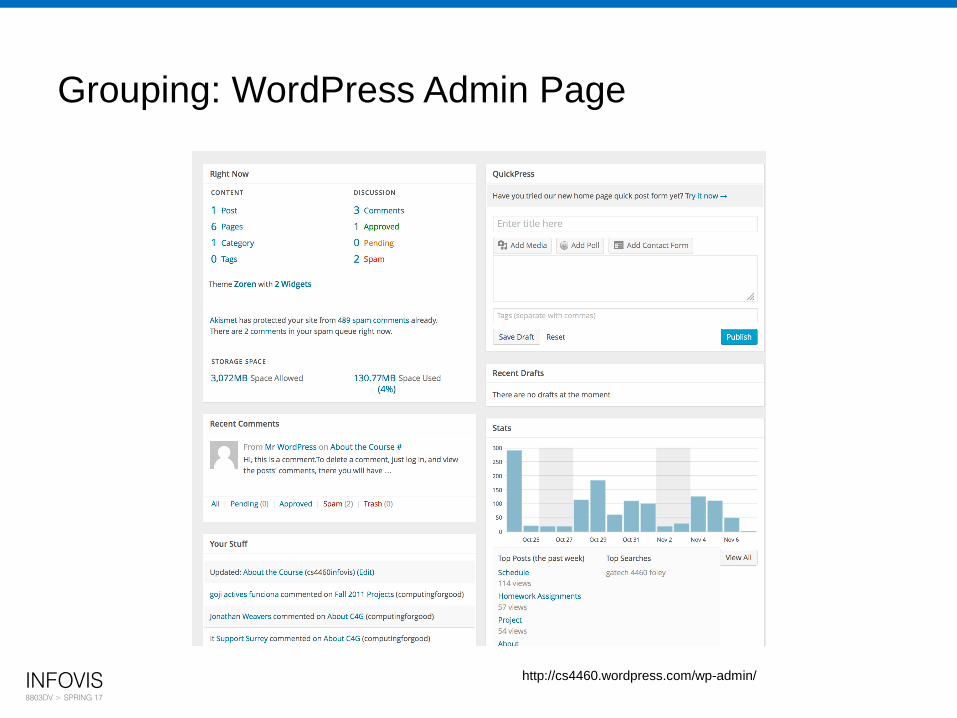
Grouping: WordPress Admin Page
http://cs4460.wordpress.com/wp-admin/

INFOVIS8803DV > SPRING 17
Proximity Example (InfoVis)
Placing labels next to trend lines groups labels with trends via proximity
Poorer Better

INFOVIS8803DV > SPRING 17
Grouping: Poor Dialogue Box Design
Align Objects
Left sides L/R Centers Right sides
Tops T/B Centers Bottoms

INFOVIS8803DV > SPRING 17
Grouping: Somewhat Better Dialogue Box Design
Align Objects
Left sides L/R Centers Right sides
Tops T/B Centers Bottoms

INFOVIS8803DV > SPRING 17
Grouping: Better Dialogue Box Design
Align Objects
Left sides L/R Centers Right sides
Tops T/B Centers Bottoms

INFOVIS8803DV > SPRING 17
Grouping: Much Better Dialogue Box
Align Objects
Left sides L/R Centers Right sides
Tops
T/B Centers
Bottoms

INFOVIS8803DV > SPRING 17
Grouping: Poor Dialogue Box
• Weak visual structure

INFOVIS8803DV > SPRING 17
Grouping: Improved Dialogue Box
• Strong visual structure

INFOVIS8803DV > SPRING 17
Poor Label Placement
Note: Horizontal Line Helps

INFOVIS8803DV > SPRING 17
Grouping: Gratuitous Proximity
What purpose does proximity serve?

INFOVIS8803DV > SPRING 17
Color Similarity Creates Groupings
0
100,000
200,000
300,000
400,000
500,000
600,000
700,000
0
100,000
200,000
300,000
400,000
500,000
600,000
700,000
Which is better? Why?

INFOVIS8803DV > SPRING 17
Gestalt: Proximity to Create Structure
Name
Addr1
Addr2
City
State
Phone
Fax
Name
Addr1
Addr2
City
State
Phone
Fax
Name
Addr1
Addr2
City
State
Phone
Fax

INFOVIS8803DV > SPRING 17
Gestalt: Application of Principles to Screen Format
PART NUMBER FILE: MISCELLANEOUS BRACKETS
PART: 0926431X LH BRONZE STUD BRACKET
GROUP: B BUDGET GROUP: 2413
CLASS: R SUB-ACCOUNT: 92
UNITS: DOZENS DEPRECIATION PERIOD 15
ACTION______ PRODUCT STATUS: NOT YET ALLOCATED
ADDITION DATE: 1 DEC 75 F. BRIGGS DES 9
LAST AMENDED: 14 MAY 75 R. SMITH PROC 11
DELETION DATE: NONE
MAIN SUPPLIER: J. BLOGGS & SON, ROTHERHAM
T. Stewart, Displays
and the Software
Interface, Applied
Ergonomics, 1976, pp.
137-146
BEFORE

INFOVIS8803DV > SPRING 17
Using Gestalt Principles is REALLY Important
Use visual structure to reinforce the
underlying logical structure

INFOVIS8803DV > SPRING 17
Typographical Hierarchy
This is a level 1 heading
This is a level 2 heading
This is a level 2 heading
This is a level 3 heading
This is a level 2 heading

INFOVIS8803DV > SPRING 17
Typographical Hierarchy plus Indentation
This is a level 1 heading
This is a level 2 heading
This is a level 2 heading
This is a level 3 heading
This is a level 2 head ing

INFOVIS8803DV > SPRING 17
Hierarchy

INFOVIS8803DV > SPRING 17
Principle: Grids
• Western world
– Start from top left
• Allows eye to parse display more easily

INFOVIS8803DV > SPRING 17
Grids
• (Hidden) horizontal and vertical lines to help locate window
components
• Align related things
• Group items logically

INFOVIS8803DV > SPRING 17
Grids: Examples

INFOVIS8803DV > SPRING 17
Grid Alignment
• Grid: the invisible, underlying structure of a site
• Grid: essential – you must use one

INFOVIS8803DV > SPRING 17
Grid Alignment
• Grids
– Help locate dialogue box components
– Align related things to group them together
– Avoid disconcerting irregularities

INFOVIS8803DV > SPRING 17
Grid Alignment
• Grids
– Help locate dialogue box components
– Align related things to group them together
– Avoid disconcerting irregularities

INFOVIS8803DV > SPRING 17
Grid Alignment
• Grids
– Help locate dialogue box components
– Align related things to group them together
– Avoid disconcerting irregularities like this

INFOVIS8803DV > SPRING 17
Grid Example

INFOVIS8803DV > SPRING 17
Bad Example
• No gridding
• Inconsistent use of
visual cues for grouping
• Inconsistent space
between label and data

INFOVIS8803DV > SPRING 17
Bad Example
• Hint: Yellow fields are labels
• So-so visual grouping
• So-so logical grouping

INFOVIS8803DV > SPRING 17
Imagine if this were not gridded!
http://danmeth.com/post/77471620/my-trilogy-
meter-1-in-a-series-of-pop-cultural

INFOVIS8803DV > SPRING 17
Ouch!

INFOVIS8803DV > SPRING 17
Use visual structure to reinforce the
underlying logical structure

INFOVIS8803DV > SPRING 17
Key Perceptual Properties
• Luminance
• Brightness
• Color
• Texture
• Shape

INFOVIS8803DV > SPRING 17
Luminance/Brightness
• Luminance
– Measured amount of light coming from some place
• Brightness
– Perceived amount of light coming from source
– Very different on screen versus paper

INFOVIS8803DV > SPRING 17
Color Models
• HVS model
– Hue - what people think of color
– Value - light/dark, ranges black<-->white
– Saturation - intensity, ranges hue<-->gray
white
black

INFOVIS8803DV > SPRING 17
How Not to Use Color
http://thedailyshow.cc.com/videos/w066sz/full-
color-coverage

INFOVIS8803DV > SPRING 17
Color Categories
• Are there certain
canonical* colors?
– Post & Greene ‘86
had people name
different colors on a
monitor
– Pictured are ones
with > 75%
commonality
• *well recognized

INFOVIS8803DV > SPRING 17
Using Mechanical Turk

INFOVIS8803DV > SPRING 17
Choosing Colors
http://www.b-eye-
network.com/newsletters/ben/2235

INFOVIS8803DV > SPRING 17
Linguistic Approach to Categorical Color
Assignment for Data Visualization
https://vimeo.com/136205858

INFOVIS8803DV > SPRING 17
Luminance
• Important for foreground-background colors to differ in brightness
Hello, here is some text. Can you read what it says?
Hello, here is some text. Can you read what it says?
Hello, here is some text. Can you read what it says?
Hello, here is some text. Can you read what it says?
Hello, here is some text. Can you read what it says?
Hello, here is some text. Can you read what it says?
Hello, here is some text. Can you read what it says?

INFOVIS8803DV > SPRING 17
Color for Categories
• Can different colors be used for categorical variables?
– Yes (with care)
– Ware’s suggestion: 12 colors
• red, green, yellow, blue, black, white, pink, cyan, gray, orange, brown, purple
From Ware ‘04

INFOVIS8803DV > SPRING 17
Color for Sequences
Can you order these (low hi)?

INFOVIS8803DV > SPRING 17
Advice! Don’t use the rainbow color scale for quantitative data

INFOVIS8803DV > SPRING 17
ColorBrewer 2.0
Help with selecting
colors for maps
http://colorbrewer2.org/

INFOVIS8803DV > SPRING 17
Tableau’s Default Color Palettes

INFOVIS8803DV > SPRING 17
Using Color: Some Advice
• Modesty! Less is more
• Use blue in large regions, not thin lines
• Use red and green in the center of the field of view (edges of retina not sensitive to these)
• Use black, white, yellow in periphery
• Use adjacent colors that vary in hue & value
• For large regions, don’t use highly saturated colors (pastels a good choice)
• Do not use adjacent colors that vary in amount of blue
• Don’t use high saturation, spectrally extreme colors together (causes after images)
• Use color for grouping and search
• Beware effects from adjacent color regions

INFOVIS8803DV > SPRING 17
Color Challenge
http://color.method.a
c/

INFOVIS8803DV > SPRING 17
Shapes + Symbols
• Can you develop a set of unique symbols that can be placed on a
display and be rapidly perceived and differentiated?
• Application for maps, military, etc.
• Want to look at different preattentive aspects

INFOVIS8803DV > SPRING 17
Recall Encodings
• When you want to
communicate one type of
variable, which visual
property should you use?

INFOVIS8803DV > SPRING 17
Great Book on Perception and Design
Information Visualization
Perception for Design2nd edition
Colin Ware
Morgan Kaufmann

INFOVIS8803DV > SPRING 17
PM2: Teams
• List your team members +emails
• Name your team.
• Provide one sentence description of your project topic.
• Include tag(s) of your topic [Business, Health, Sports, Social Media]
• Submit PM2 on T-Square.
Top Related