


Languages
Pages
Legal


Virtual overlay metrology for fault detection supported with integrated metrology and machine learning
Emil Schmitt-Weaver
Public
MATLAB Expo 2016 Benelux – June 28th
Slide 2 Public Slide 2
Slide 3 Public

Outline Slide 4
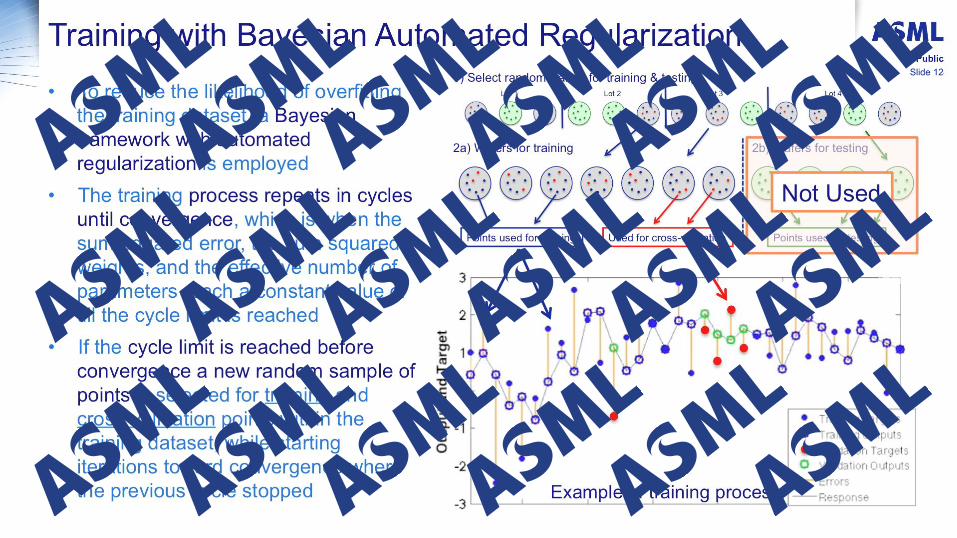
• Introduction • How the function works • Data separation into Training and Testing groups • Training with Bayesian Automated Regularization • Prediction Vs. Measured Overlay as regression plots • Precision of Trained Function as a vector map • Results • Conclusion
Public

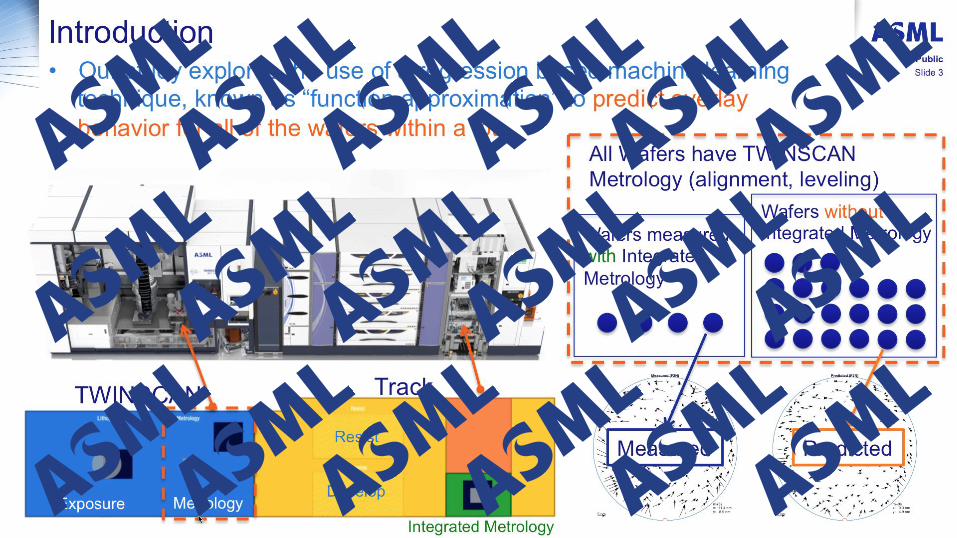
How the function works Slide 5
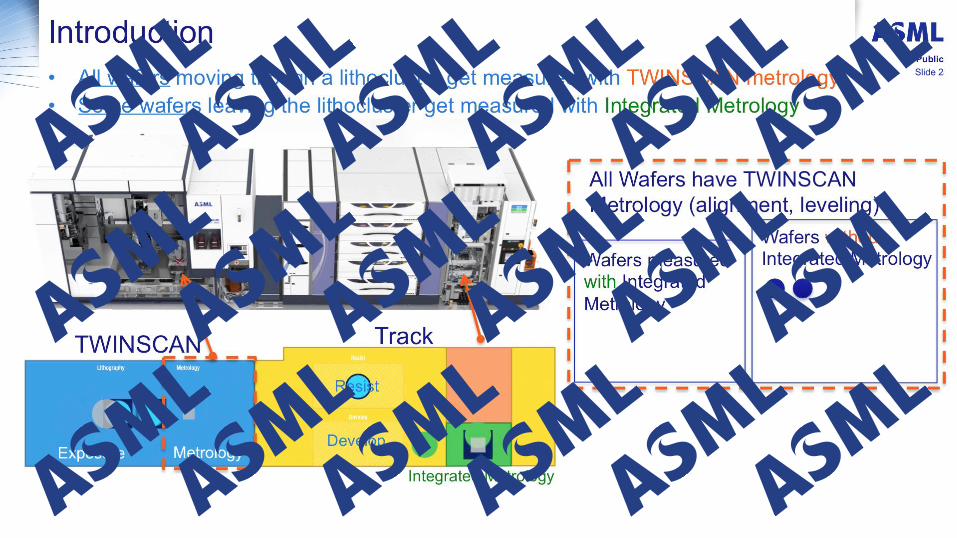
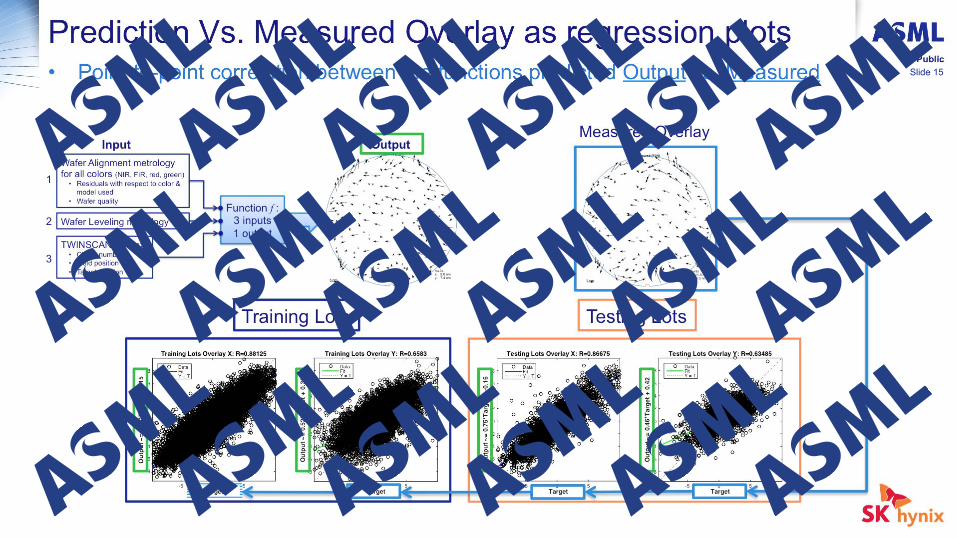
• Function input comes from TWINSCAN metrology & context;
Public
Wafer Alignment metrology for all colors (NIR, FIR, red, green)
• Residuals with respect to color & model used
• Wafer quality
Wafer Leveling metrology
TWINSCAN Context • Chuck number • Field position • Target position
Function f : 3 inputs 1 output
1
2
3
Input Output
5 nm
m+3sx: 9.0 nmy: 7.4 nm
Predicted (F2N)

Outline Slide 6
• Introduction • How the function works • Data separation into Training and Testing groups • Training with Bayesian Automated Regularization • Prediction Vs. Measured Overlay as regression plots • Precision of Trained Function as a vector map • Results • Conclusion
Public

Slide 7 Public Slide 7
Slide 8 Public Slide 8

Slide 9 Public Slide 9

Outline Slide 10
• Introduction • How the function works • Data separation into Training and Testing groups • Training with Bayesian Automated Regularization • Prediction Vs. Measured Overlay as regression plots • Precision of Trained Function as a vector map • Results • Conclusion
Public
Slide 11 Public
Slide 11
Slide 12 Public
Slide 12

Outline Slide 13
• Introduction • How the function works • Data separation into Training and Testing groups • Training with Bayesian Automated Regularization • Prediction Vs. Measured Overlay as regression plots • Precision of Trained Function as a vector map • Results • Conclusion
Public

Slide 14 Public
Slide 14
Slide 15 Public
Slide 15

Slide 16 Public
Slide 16

Slide 17 Public
Slide 17

Outline Slide 18
• Introduction • How the function works • Data separation into Training and Testing groups • Training with Bayesian Automated Regularization • Prediction Vs. Measured Overlay as regression plots • Precision of Trained Function as a vector map • Results • Conclusion
Public
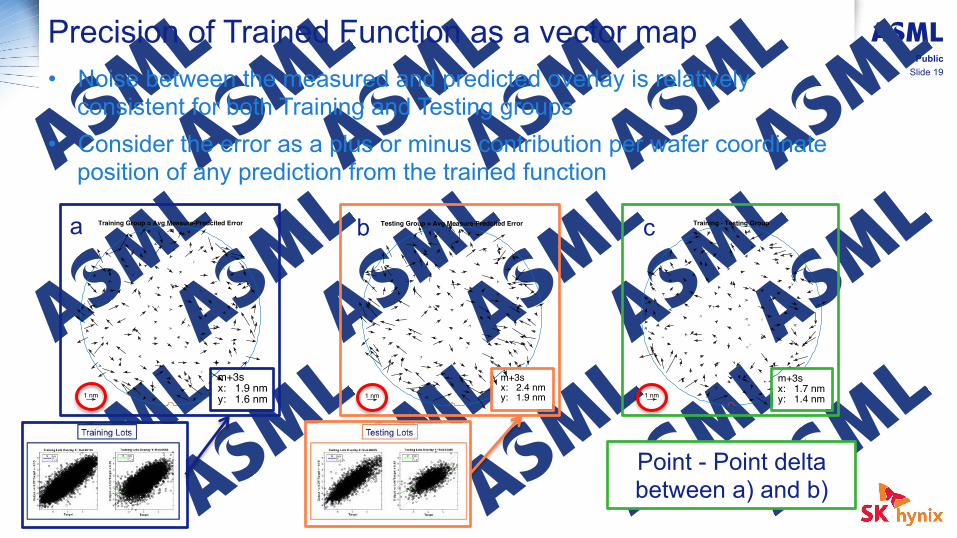
Precision of Trained Function as a vector map Slide 19 • Noise between the measured and predicted overlay is relatively
consistent for both Training and Testing groups • Consider the error as a plus or minus contribution per wafer coordinate
position of any prediction from the trained function
Public
1 nmm+3sx: 1.9 nmy: 1.6 nm
Training Group = Avg Measure-Predcited Error
1 nmm+3sx: 2.4 nmy: 1.9 nm
Testing Group = Avg Measure-Predcited Error
1 nmm+3sx: 1.7 nmy: 1.4 nm
Training - Testing Groupa b c
Point - Point delta between a) and b)
1 nmm+3sx: 1.9 nmy: 1.6 nm
Training Group = Avg Measure-Predcited Error
1 nmm+3sx: 2.4 nmy: 1.9 nm
Testing Group = Avg Measure-Predcited Error
1 nmm+3sx: 1.7 nmy: 1.4 nm
Training - Testing Group

Outline Slide 20
• Introduction • How the function works • Data separation into Training and Testing groups • Training with Bayesian Automated Regularization • Prediction Vs. Measured Overlay as regression plots • Precision of Trained Function as a vector map • Results • Conclusion
Public
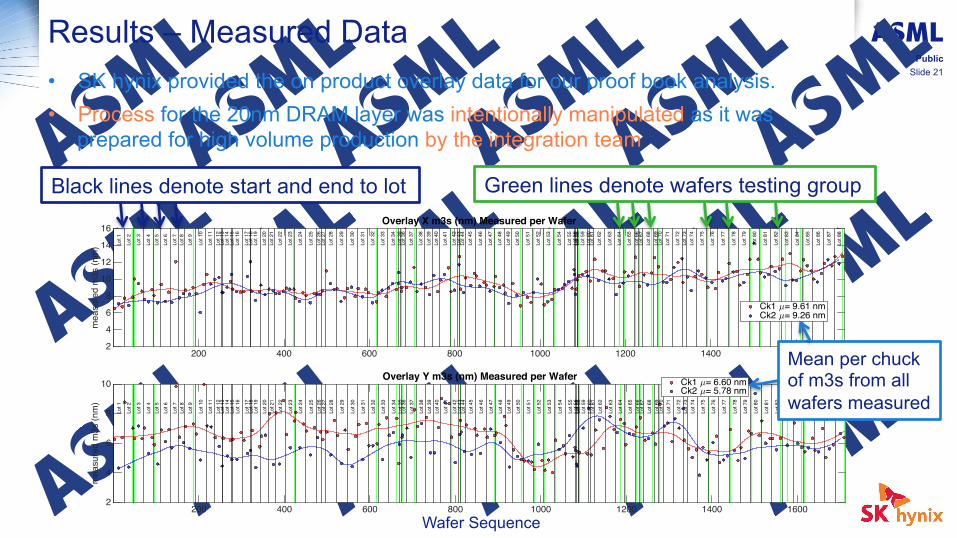
Results – Measured Data Slide 21 • SK hynix provided the on product overlay data for our proof book analysis.
• Process for the 20nm DRAM layer was intentionally manipulated as it was prepared for high volume production by the integration team
Public
200 400 600 800 1000 1200 1400 1600
mea
sure
d m
3s (n
m)
2
4
6
8
10
12
14
16
Lot 1
Lot 2
Lot 3
Lot 4
Lot 5
Lot 6
Lot 7
Lot 8
Lot 9
Lot 1
0
Lot 1
1Lo
t 12
Lot 1
3Lo
t 14
Lot 1
5Lo
t 16
Lot 1
7Lo
t 18
Lot 1
9Lo
t 20
Lot 2
1Lo
t 22
Lot 2
3
Lot 2
4
Lot 2
5Lo
t 26
Lot 2
7Lo
t 28
Lot 2
9
Lot 3
0
Lot 3
1
Lot 3
2
Lot 3
3
Lot 3
4Lo
t 35
Lot 3
6Lo
t 37
Lot 3
8Lo
t 39
Lot 4
0Lo
t 41
Lot 4
2Lo
t 43
Lot 4
4Lo
t 45
Lot 4
6
Lot 4
7
Lot 4
8Lo
t 49
Lot 5
0
Lot 5
1
Lot 5
2
Lot 5
3
Lot 5
4
Lot 5
5Lo
t 56
Lot 5
7Lo
t 58
Lot 5
9Lo
t 60
Lot 6
1Lo
t 62
Lot 6
3
Lot 6
4
Lot 6
5Lo
t 66
Lot 6
7Lo
t 68
Lot 6
9Lo
t 70
Lot 7
1
Lot 7
2Lo
t 73
Lot 7
4
Lot 7
5
Lot 7
6
Lot 7
7
Lot 7
8
Lot 7
9
Lot 8
0
Lot 8
1
Lot 8
2
Lot 8
3
Lot 8
4
Lot 8
5
Lot 8
6
Lot 8
7
Lot 8
8
Overlay X m3s (nm) Measured per Wafer
Ck1 7= 9.61 nmCk2 7= 9.26 nm
200 400 600 800 1000 1200 1400 1600
pred
icte
d m
3s (n
m)
6
8
10
12
14Overlay X m3s (nm) Prediction per Wafer
Testing Wafers R=0.86675
Wafer Sequance200 400 600 800 1000 1200 1400 1600
resi
dual
m3s
(nm
)
2
4
6
8
10
12
14
16Overlay X m3s (nm) Residual of Measured Wafers minus Prediction
Ck1 7= 4.49 nmCk2 7= 4.26 nm
200 400 600 800 1000 1200 1400 1600
mea
sure
d m
3s (n
m)
2
4
6
8
10
Lot 1
Lot 2
Lot 3
Lot 4
Lot 5
Lot 6
Lot 7
Lot 8
Lot 9
Lot 1
0
Lot 1
1Lo
t 12
Lot 1
3Lo
t 14
Lot 1
5Lo
t 16
Lot 1
7Lo
t 18
Lot 1
9Lo
t 20
Lot 2
1Lo
t 22
Lot 2
3
Lot 2
4
Lot 2
5Lo
t 26
Lot 2
7Lo
t 28
Lot 2
9
Lot 3
0
Lot 3
1
Lot 3
2
Lot 3
3
Lot 3
4Lo
t 35
Lot 3
6Lo
t 37
Lot 3
8Lo
t 39
Lot 4
0Lo
t 41
Lot 4
2Lo
t 43
Lot 4
4Lo
t 45
Lot 4
6
Lot 4
7
Lot 4
8Lo
t 49
Lot 5
0
Lot 5
1
Lot 5
2
Lot 5
3
Lot 5
4
Lot 5
5Lo
t 56
Lot 5
7Lo
t 58
Lot 5
9Lo
t 60
Lot 6
1Lo
t 62
Lot 6
3
Lot 6
4
Lot 6
5Lo
t 66
Lot 6
7Lo
t 68
Lot 6
9Lo
t 70
Lot 7
1
Lot 7
2Lo
t 73
Lot 7
4
Lot 7
5
Lot 7
6
Lot 7
7
Lot 7
8
Lot 7
9
Lot 8
0
Lot 8
1
Lot 8
2
Lot 8
3
Lot 8
4
Lot 8
5
Lot 8
6
Lot 8
7
Lot 8
8
Overlay Y m3s (nm) Measured per Wafer Ck1 7= 6.60 nmCk2 7= 5.78 nm
200 400 600 800 1000 1200 1400 1600
pred
icte
d m
3s (n
m)
2
4
6
8
10Overlay Y m3s (nm) Prediction per Wafer
Testing Wafers R=0.63485
Wafer Sequance200 400 600 800 1000 1200 1400 1600
resi
dual
m3s
(nm
)
2
4
6
8
10Overlay Y m3s (nm) Residual of Measured Wafers minus Prediction
Ck1 7= 4.36 nmCk2 7= 4.77 nm
Black lines denote start and end to lot Green lines denote wafers testing group
Wafer Sequence
Mean per chuck of m3s from all wafers measured
200 400 600 800 1000 1200 1400 1600
mea
sure
d m
3s (n
m)
2
4
6
8
10
12
14
16
Lot 1
Lot 2
Lot 3
Lot 4
Lot 5
Lot 6
Lot 7
Lot 8
Lot 9
Lot 1
0
Lot 1
1Lo
t 12
Lot 1
3Lo
t 14
Lot 1
5Lo
t 16
Lot 1
7Lo
t 18
Lot 1
9Lo
t 20
Lot 2
1Lo
t 22
Lot 2
3
Lot 2
4
Lot 2
5Lo
t 26
Lot 2
7Lo
t 28
Lot 2
9
Lot 3
0
Lot 3
1
Lot 3
2
Lot 3
3
Lot 3
4Lo
t 35
Lot 3
6Lo
t 37
Lot 3
8Lo
t 39
Lot 4
0Lo
t 41
Lot 4
2Lo
t 43
Lot 4
4Lo
t 45
Lot 4
6
Lot 4
7
Lot 4
8Lo
t 49
Lot 5
0
Lot 5
1
Lot 5
2
Lot 5
3
Lot 5
4
Lot 5
5Lo
t 56
Lot 5
7Lo
t 58
Lot 5
9Lo
t 60
Lot 6
1Lo
t 62
Lot 6
3
Lot 6
4
Lot 6
5Lo
t 66
Lot 6
7Lo
t 68
Lot 6
9Lo
t 70
Lot 7
1
Lot 7
2Lo
t 73
Lot 7
4
Lot 7
5
Lot 7
6
Lot 7
7
Lot 7
8
Lot 7
9
Lot 8
0
Lot 8
1
Lot 8
2
Lot 8
3
Lot 8
4
Lot 8
5
Lot 8
6
Lot 8
7
Lot 8
8
Overlay X m3s (nm) Measured per Wafer
Ck1 7= 9.61 nmCk2 7= 9.26 nm
200 400 600 800 1000 1200 1400 1600
pred
icte
d m
3s (n
m)
2
4
6
8
10
12
14
16Overlay X m3s (nm) Prediction per Wafer
Testing Wafers R=0.88059
Wafer Sequance200 400 600 800 1000 1200 1400 1600
resi
dual
m3s
(nm
)
2
4
6
8
10
12
14
16Overlay X m3s (nm) Residual of Measured Wafers minus Prediction
Ck1 7= 4.41 nmCk2 7= 4.15 nm
a
b
c
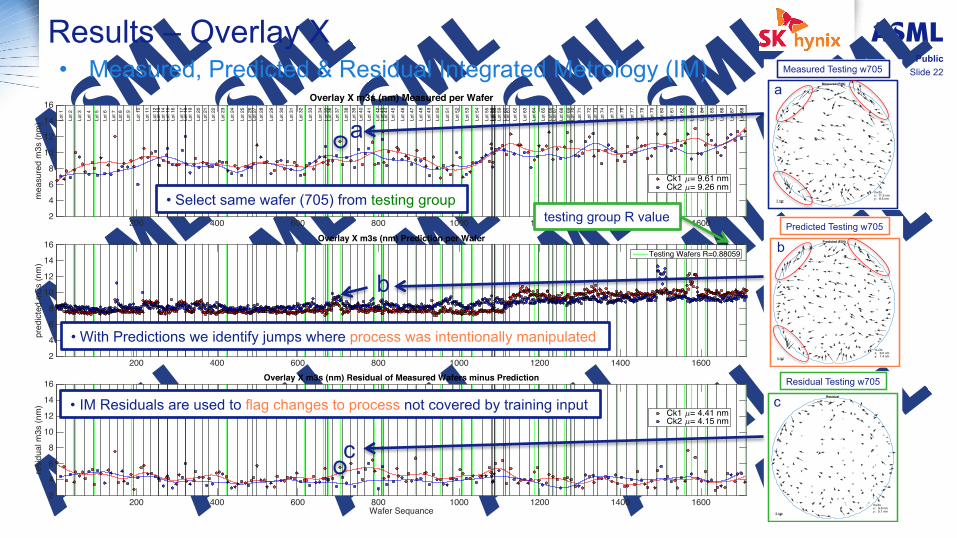
Results – Overlay X Slide 22
Public Measured Testing w705
a
5 nm
m+3sx: 11.3 nmy: 8.5 nm
Measured (F2N)
Predicted Testing w705
b
5 nm
m+3sx: 9.0 nmy: 7.4 nm
Predicted (F2N)
Residual Testing w705
c
5 nm
m+3sx: 6.6 nmy: 5.1 nm
Residual
• Measured, Predicted & Residual Integrated Metrology (IM)
testing group R value
• With Predictions we identify jumps where process was intentionally manipulated
• IM Residuals are used to flag changes to process not covered by training input
• Select same wafer (705) from testing group

Results – Overlay Y Slide 23
Public
200 400 600 800 1000 1200 1400 1600
mea
sure
d m
3s (n
m)
2
4
6
8
10
Lot 1
Lot 2
Lot 3
Lot 4
Lot 5
Lot 6
Lot 7
Lot 8
Lot 9
Lot 1
0
Lot 1
1Lo
t 12
Lot 1
3Lo
t 14
Lot 1
5Lo
t 16
Lot 1
7Lo
t 18
Lot 1
9Lo
t 20
Lot 2
1Lo
t 22
Lot 2
3
Lot 2
4
Lot 2
5Lo
t 26
Lot 2
7Lo
t 28
Lot 2
9
Lot 3
0
Lot 3
1
Lot 3
2
Lot 3
3
Lot 3
4Lo
t 35
Lot 3
6Lo
t 37
Lot 3
8Lo
t 39
Lot 4
0Lo
t 41
Lot 4
2Lo
t 43
Lot 4
4Lo
t 45
Lot 4
6
Lot 4
7
Lot 4
8Lo
t 49
Lot 5
0
Lot 5
1
Lot 5
2
Lot 5
3
Lot 5
4
Lot 5
5Lo
t 56
Lot 5
7Lo
t 58
Lot 5
9Lo
t 60
Lot 6
1Lo
t 62
Lot 6
3
Lot 6
4
Lot 6
5Lo
t 66
Lot 6
7Lo
t 68
Lot 6
9Lo
t 70
Lot 7
1
Lot 7
2Lo
t 73
Lot 7
4
Lot 7
5
Lot 7
6
Lot 7
7
Lot 7
8
Lot 7
9
Lot 8
0
Lot 8
1
Lot 8
2
Lot 8
3
Lot 8
4
Lot 8
5
Lot 8
6
Lot 8
7
Lot 8
8
Overlay Y m3s (nm) Measured per Wafer Ck1 7= 6.60 nmCk2 7= 5.78 nm
200 400 600 800 1000 1200 1400 1600
pred
icte
d m
3s (n
m)
2
4
6
8
10Overlay Y m3s (nm) Prediction per Wafer
Testing Wafers R=0.63485
Wafer Sequance200 400 600 800 1000 1200 1400 1600
resi
dual
m3s
(nm
)
2
4
6
8
10Overlay Y m3s (nm) Residual of Measured Wafers minus Prediction
Ck1 7= 4.36 nmCk2 7= 4.77 nm
d
e
f
5 nm
m+3sx: 11.4 nmy: 8.9 nm
Measured (F2N)
Measured Testing w1278
d
5 nm
m+3sx: 9.3 nmy: 4.9 nm
Predicted (F2N)
Predicted Testing w1278
e
5 nm
m+3sx: 4.4 nmy: 5.7 nm
Residual
Residual Testing w1278
f
• Measured, Predicted & Residual Integrated Metrology (IM)
testing group R value
• With Predictions we identify jumps where process was intentionally manipulated
• Residual are used to flag changes in process conditions
• Select same wafer (1278) from testing group

Outline Slide 24
• Introduction • How the function works • Data separation into Training and Testing groups • Training with Bayesian Automated Regularization • Prediction Vs. Measured Overlay as regression plots • Precision of Trained Function as a vector map • Results • Conclusion
Public
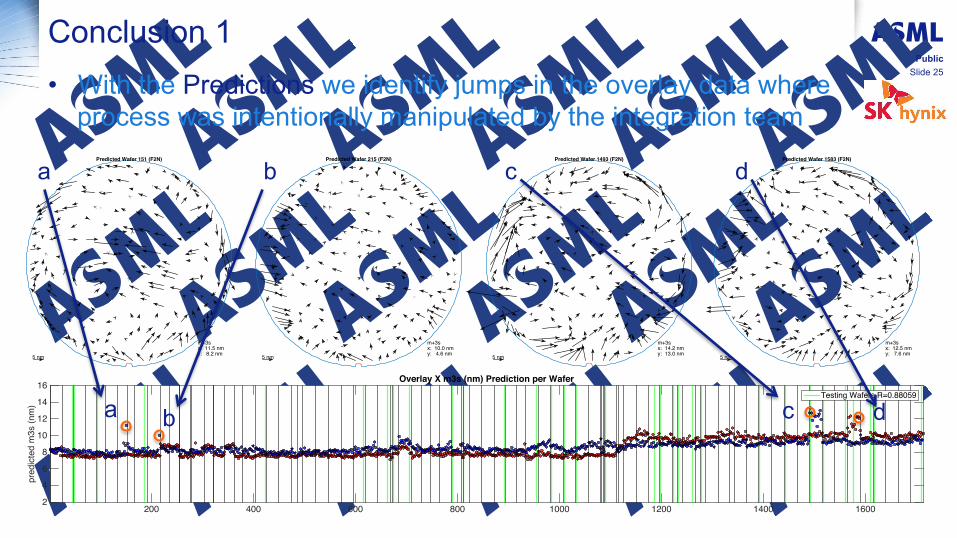
Conclusion 1 Slide 25
Public
• With the Predictions we identify jumps in the overlay data where process was intentionally manipulated by the integration team
200 400 600 800 1000 1200 1400 1600
mea
sure
d m
3s (n
m)
2
4
6
8
10
12
14
16
Lot 1
Lot 2
Lot 3
Lot 4
Lot 5
Lot 6
Lot 7
Lot 8
Lot 9
Lot 1
0
Lot 1
1
Lot 1
2Lo
t 13
Lot 1
4Lo
t 15
Lot 1
6
Lot 1
7Lo
t 18
Lot 1
9
Lot 2
0Lo
t 21
Lot 2
2
Lot 2
3
Lot 2
4
Lot 2
5
Lot 2
6Lo
t 27
Lot 2
8
Lot 2
9
Lot 3
0
Lot 3
1
Lot 3
2
Lot 3
3
Lot 3
4Lo
t 35
Lot 3
6
Lot 3
7
Lot 3
8
Lot 3
9Lo
t 40
Lot 4
1
Lot 4
2Lo
t 43
Lot 4
4
Lot 4
5
Lot 4
6
Lot 4
7
Lot 4
8
Lot 4
9
Lot 5
0
Lot 5
1
Lot 5
2
Lot 5
3
Lot 5
4
Lot 5
5Lo
t 56
Lot 5
7Lo
t 58
Lot 5
9Lo
t 60
Lot 6
1Lo
t 62
Lot 6
3
Lot 6
4
Lot 6
5Lo
t 66
Lot 6
7Lo
t 68
Lot 6
9Lo
t 70
Lot 7
1
Lot 7
2Lo
t 73
Lot 7
4
Lot 7
5
Lot 7
6
Lot 7
7
Lot 7
8
Lot 7
9
Lot 8
0
Lot 8
1
Lot 8
2
Lot 8
3
Lot 8
4
Lot 8
5
Lot 8
6
Lot 8
7
Lot 8
8
Overlay X m3s (nm) Measured per Wafer
Ck1 7= 9.61 nmCk2 7= 9.26 nm
200 400 600 800 1000 1200 1400 1600
pred
icte
d m
3s (n
m)
2
4
6
8
10
12
14
16Overlay X m3s (nm) Prediction per Wafer
Testing Wafers R=0.88059
Wafer Sequance200 400 600 800 1000 1200 1400 1600
resi
dual
m3s
(nm
)
2
4
6
8
10
12
14
16Overlay X m3s (nm) Residual of Measured Wafers minus Prediction
Ck1 7= 4.41 nmCk2 7= 4.15 nm
5 nm
m+3sx: 11.5 nmy: 8.2 nm
Predicted Wafer 151 (F2N)
5 nm
m+3sx: 10.0 nmy: 4.6 nm
Predicted Wafer 215 (F2N)
5 nm
m+3sx: 14.2 nmy: 13.0 nm
Predicted Wafer 1493 (F2N)
5 nm
m+3sx: 12.5 nmy: 7.6 nm
Predicted Wafer 1583 (F2N)
a b c d
a b c d

Conclusion 2 Slide 26
Public
• With Residuals we flag wafers from IM. • Something other then inputs we trained with is effecting the overlay signature • This can be used to remove a wafer from APC or to trigger an investigation
200 400 600 800 1000 1200 1400 1600
mea
sure
d m
3s (n
m)
2
4
6
8
10
12
14
16
Lot 1
Lot 2
Lot 3
Lot 4
Lot 5
Lot 6
Lot 7
Lot 8
Lot 9
Lot 1
0
Lot 1
1
Lot 1
2Lo
t 13
Lot 1
4Lo
t 15
Lot 1
6
Lot 1
7Lo
t 18
Lot 1
9
Lot 2
0Lo
t 21
Lot 2
2
Lot 2
3
Lot 2
4
Lot 2
5
Lot 2
6Lo
t 27
Lot 2
8
Lot 2
9
Lot 3
0
Lot 3
1
Lot 3
2
Lot 3
3
Lot 3
4Lo
t 35
Lot 3
6
Lot 3
7
Lot 3
8
Lot 3
9Lo
t 40
Lot 4
1
Lot 4
2Lo
t 43
Lot 4
4
Lot 4
5
Lot 4
6
Lot 4
7
Lot 4
8
Lot 4
9
Lot 5
0
Lot 5
1
Lot 5
2
Lot 5
3
Lot 5
4
Lot 5
5Lo
t 56
Lot 5
7Lo
t 58
Lot 5
9Lo
t 60
Lot 6
1Lo
t 62
Lot 6
3
Lot 6
4
Lot 6
5Lo
t 66
Lot 6
7Lo
t 68
Lot 6
9Lo
t 70
Lot 7
1
Lot 7
2Lo
t 73
Lot 7
4
Lot 7
5
Lot 7
6
Lot 7
7
Lot 7
8
Lot 7
9
Lot 8
0
Lot 8
1
Lot 8
2
Lot 8
3
Lot 8
4
Lot 8
5
Lot 8
6
Lot 8
7
Lot 8
8
Overlay X m3s (nm) Measured per Wafer
Ck1 7= 9.61 nmCk2 7= 9.26 nm
200 400 600 800 1000 1200 1400 1600
pred
icte
d m
3s (n
m)
2
4
6
8
10
12
14
16Overlay X m3s (nm) Prediction per Wafer
Testing Wafers R=0.88059
Wafer Sequance200 400 600 800 1000 1200 1400 1600
resi
dual
m3s
(nm
)
2
4
6
8
10
12
14
16Overlay X m3s (nm) Residual of Measured Wafers minus Prediction
Ck1 7= 4.41 nmCk2 7= 4.15 nm
5 nm
m+3sx: 7.5 nmy: 6.9 nm
Residual Wafer 146
5 nm
m+3sx: 7.7 nmy: 5.6 nm
Residual Wafer 811
5 nm
m+3sx: 8.4 nmy: 7.9 nm
Residual Wafer 1112
5 nm
m+3sx: 7.2 nmy: 6.8 nm
Residual Wafer 1567
a b c d
a b c d

Moving forward Slide 27
• Work on this subject is open to users with interest in exploring the application, both in production and development environments
• Topics of interest include exploring effect; • Fab context from outside the lithocluster has on the overlay
prediction • Increasing the number of parallel works and neurons has toward
improving the R value (correlation coefficient) between the predicted output and target values in the testing dataset
Public

Public
: The authors would like to thank ASML colleagues Jan Mulkens, Marcel Beems, Wolfgang Henke, Henry Megens, Peter ten Berge, Paul Luehrmann, Dick Verkleij, Frank van de Mast, Christophe Fouquet & coworkers in the Holistic Applications Development group for there assistance & feedback
: Hong-Goo Lee, Min-Suk Kim, Sang-Jun Han, Myoung-Soo Kim, Won-Taik Kwon & Sung-Ki Park
: Kevin Ryan, Thomas Theeuwes, Kyu-Tae Sun, Young-Wan Lim, Daan Slotboom, Michael Kubis & Jens Staecker
Top Related