


Languages
Pages
Legal


VIET NAM HUMAN DEVELOPMENT REPORT 2015 ON INCLUSIVE GROWTH
GROWTH THAT WORKS FOR ALL
Health Education Labor Productivity Social Protection Gender Equality Inclusive Growth Missing Middle Technological Readiness Innovation Medium Technology Emerging Lower Middle Class Health Education Labor Productivity Social Protection Gender Equality Inclusive Growth Missing Middle Technological Readiness Innovation Medium Technology Emerging Lower Middle Class Health Education Labor Productivity Social Protection Gender Equality Inclusive Growth Missing Middle Technological Readiness Innovation Medium Technology Emerging Lower Middle Class Health Education Labor Productivity Social Protection Gender Equality Inclusive Growth Missing Middle Technological Readiness Inclusive Growth Medium Technology Emerging Lower Middle Class Health Education Labor Productivity Social Protection Gender Equality Inclusive Growth Missing Middle Technological Readiness Innovation Medium Technology Emerging Lower Middle Class Health Education Labor Productivity Social Protection Gender Equality Inclusive Growth Missing Middle Technological Readiness Innovation Medium Technology Emerging Lower Middle Class Health Education Labor Productivity Social Protection Gender Equality Inclusive Growth Missing Middle Technological Readiness Innovation Medium Technology Emerging Lower Middle Class Health Education Labor Productivity Social Protection Gender Equality Inclusive Growth Missing Middle Technological Readiness Innovation Medium Technology Emerging Lower Emerging Lower Health Education Labor Productivity Social Protection Gender Equality Inclusive Growth Missing Middle Technological Readiness Innovation Medium Technology Emerging Lower Middle Class Health Education Labor Productivity Social Protection Gender Equality Inclusive Growth Missing Middle Technological Readiness Innovation Medium Technology Emerging Lower Middle Class Health Education Labor Productivity Social Protection Gender Equality Inclusive Growth Missing Middle Technological Readiness Innovation Medium Technology Emerging Lower Middle Class Health Education Labor Productivity Social Protection Gender Equality Inclusive Growth Missing Middle Technological Readiness Innovation Medium Technology Emerging Lower Middle Class Health Education Labor Productivity Social Protection Gender Equality
Health Education Labor Productivity Social Protection Gender Equality Inclusive Growth Missing Middle Technological Readiness Innovation Medium Technology Emerging Lower Middle Class Health Education Inclusive Growth Social Protection Gender Labor Productivity Missing Middle Technological Readiness Innovation Medium Technology Emerging Lower Middle Class Health Education Labor Productivity Social Protection Gender Equality Inclusive Growth Missing Middle Productivity Readiness Innovation Medium Technology Social Protection Middle Class Health Education Labor Education Social Protection Gender Equality Health Missing Middle Technological Readiness Inclusive Growth Medium Technology Emerging Lower Middle Class Health Education Labor Productivity Social Protection Gender Equality Inclusiv Gender Equality Missing Middle Technological Readiness Innovation Medium Technology
Health Education Labor Productivity Social Protection Gender Equality Inclusive Growth Missing Middle Technological Readiness Innovation Medium Technology Emerging Low Middle Class Health Education Labor Productivity Social Protection Gender Equality Inclusive Growth Missing Technological Readiness Innovation Medium Technology Emerging Lower Middle Class Health Education Labor Productivity Social Protection Gender Equality
Inclusive Growth Missing Middle Technological Readiness Innovation Medium Technology Emerging Lower Middle Class Health Education Labor Productivity Social Protection Gender Equality Inclusive Growth Missing Middle Technological Readiness Inclusive Growth Medium Gender Equality Middle Class Health Education Health Education Social Protection Gender Equality Inclusive Growth Missing Middle Technological Readiness Innovation Medium Technology Emerging Lower Middle Class Health Education Labor Productivity Social Protection Gender Equality Inclusive Growth Missing Middle Technological Readiness Innovation Medium Technology Emerging Lower Middle Class
Health Education Labor Productivity Social Protection Gender Equality Gender Equality Missing Middle Technological Readiness Innovation Medium Technology Emerging Lower Middle Class Health Education Labor
Productivity Social Inclusive Growth Gender Middle Technological Readiness Innovation Medium Techno Emerging Lower Middle Class Health Education Labor Produ Social Protection Gender Equality Inclusive Growth Missing Middle Technological Readiness Innovation Medium Technology Emerging Lower Middle Class Health Education Labor Productivity Social Protection Gender Equality Inclusive Growth Missing Middle Technological Readiness Inclusive Growth Medium Technology Emerging Lower Middle Class Health Education Labor Productivity Social Protection Gender Equality Inclusive Growth Missing Middle Technological Readiness Innovation Medium Technology Emerging Lower Middle Class Health Education Labor Productivity Social Protection Gender Equality Inclusive Growth Missing Middle
Health Education Labor Productivity Social Protection Gender Equality Inclusive Gr Missing Middle Technological Readiness Innovation Medium Technology Emerging Lower Middle Class Health Education Labor Productivity Social Protection Gender Equality Inclusive Growth Missing Middle Health Technological Innovation Medium Technology Emerging Lower Middle Health Education Labor Productivity
Social Protection Gender Equality Inclusive Growth Missing Middle Technological Readiness Innovation Medium Technology Emerging Lower Middle Class Health Education Labor Productivity Social Protection Gender Equality Inclusive Growth Missing Middle Technological Readiness Inclusive Growth Medium Technology Emerging Lower Middle Class Health Education Labor Productivity Social Protection Gender Equality Inclusive Growth Missing Middle Technological Readiness Innovation Medium Technology Emerging
Copyright © January 2016By the United Nations Development Programme (UNDP) and Viet Nam Academy of Social Sciences (VASS)
All rights reserved. No part of this publication may be reproduced, stored in a retrieval system or transmitted, in any form or by any means, electronic, mechanical, photocoping, recording or otherwise without prior permission.
Design: Phan Huong Giang/ UNDP Viet Nam
For a list of any errors or omissions found subsequent to printing, please visit the UNDP website at www.vn.undp.org or the VASS website at www.vass.gov.vn
GROWTH THAT WORKS FOR ALLVIET NAM HUMAN DEVELOPMENT REPORT 2015 ON INCLUSIVE GROWTH
VIET NAM HUMAN DEVELOPMENT REPORT 2015 ON INCLUSIVE GROWTH
GROWTH THAT WORKS FOR ALL
Health Education Labor Productivity Social Protection Gender Equality Inclusive Growth Missing Middle Technological Readiness Innovation Medium Technology Emerging Lower Middle Class Health Education Labor Productivity Social Protection Gender Equality Inclusive Growth Missing Middle Technological Readiness Innovation Medium Technology Emerging Lower Middle Class Health Education Labor Productivity Social Protection Gender Equality Inclusive Growth Missing Middle Technological Readiness Innovation Medium Technology Emerging Lower Middle Class Health Education Labor Productivity Social Protection Gender Equality Inclusive Growth Missing Middle Technological Readiness Inclusive Growth Medium Technology Emerging Lower Middle Class Health Education Labor Productivity Social Protection Gender Equality Inclusive Growth Missing Middle Technological Readiness Innovation Medium Technology Emerging Lower Middle Class Health Education Labor Productivity Social Protection Gender Equality Inclusive Growth Missing Middle Technological Readiness Innovation Medium Technology Emerging Lower Middle Class Health Education Labor Productivity Social Protection Gender Equality Inclusive Growth Missing Middle Technological Readiness Innovation Medium Technology Emerging Lower Middle Class Health Education Labor Productivity Social Protection Gender Equality Inclusive Growth Missing Middle Technological Readiness Innovation Medium Technology Emerging Lower Emerging Lower Health Education Labor Productivity Social Protection Gender Equality Inclusive Growth Missing Middle Technological Readiness Innovation Medium Technology Emerging Lower Middle Class Health Education Labor Productivity Social Protection Gender Equality Inclusive Growth Missing Middle Technological Readiness Innovation Medium Technology Emerging Lower Middle Class Health Education Labor Productivity Social Protection Gender Equality Inclusive Growth Missing Middle Technological Readiness Innovation Medium Technology Emerging Lower Middle Class Health Education Labor Productivity Social Protection Gender Equality Inclusive Growth Missing Middle Technological Readiness Innovation Medium Technology Emerging Lower Middle Class Health Education Labor Productivity Social Protection Gender Equality
Health Education Labor Productivity Social Protection Gender Equality Inclusive Growth Missing Middle Technological Readiness Innovation Medium Technology Emerging Lower Middle Class Health Education Inclusive Growth Social Protection Gender Labor Productivity Missing Middle Technological Readiness Innovation Medium Technology Emerging Lower Middle Class Health Education Labor Productivity Social Protection Gender Equality Inclusive Growth Missing Middle Productivity Readiness Innovation Medium Technology Social Protection Middle Class Health Education Labor Education Social Protection Gender Equality Health Missing Middle Technological Readiness Inclusive Growth Medium Technology Emerging Lower Middle Class Health Education Labor Productivity Social Protection Gender Equality Inclusiv Gender Equality Missing Middle Technological Readiness Innovation Medium Technology
Health Education Labor Productivity Social Protection Gender Equality Inclusive Growth Missing Middle Technological Readiness Innovation Medium Technology Emerging Low Middle Class Health Education Labor Productivity Social Protection Gender Equality Inclusive Growth Missing Technological Readiness Innovation Medium Technology Emerging Lower Middle Class Health Education Labor Productivity Social Protection Gender Equality
Inclusive Growth Missing Middle Technological Readiness Innovation Medium Technology Emerging Lower Middle Class Health Education Labor Productivity Social Protection Gender Equality Inclusive Growth Missing Middle Technological Readiness Inclusive Growth Medium Gender Equality Middle Class Health Education Health Education Social Protection Gender Equality Inclusive Growth Missing Middle Technological Readiness Innovation Medium Technology Emerging Lower Middle Class Health Education Labor Productivity Social Protection Gender Equality Inclusive Growth Missing Middle Technological Readiness Innovation Medium Technology Emerging Lower Middle Class
Health Education Labor Productivity Social Protection Gender Equality Gender Equality Missing Middle Technological Readiness Innovation Medium Technology Emerging Lower Middle Class Health Education Labor
Productivity Social Inclusive Growth Gender Middle Technological Readiness Innovation Medium Techno Emerging Lower Middle Class Health Education Labor Produ Social Protection Gender Equality Inclusive Growth Missing Middle Technological Readiness Innovation Medium Technology Emerging Lower Middle Class Health Education Labor Productivity Social Protection Gender Equality Inclusive Growth Missing Middle Technological Readiness Inclusive Growth Medium Technology Emerging Lower Middle Class Health Education Labor Productivity Social Protection Gender Equality Inclusive Growth Missing Middle Technological Readiness Innovation Medium Technology Emerging Lower Middle Class Health Education Labor Productivity Social Protection Gender Equality Inclusive Growth Missing Middle
Health Education Labor Productivity Social Protection Gender Equality Inclusive Gr Missing Middle Technological Readiness Innovation Medium Technology Emerging Lower Middle Class Health Education Labor Productivity Social Protection Gender Equality Inclusive Growth Missing Middle Health Technological Innovation Medium Technology Emerging Lower Middle Health Education Labor Productivity
Social Protection Gender Equality Inclusive Growth Missing Middle Technological Readiness Innovation Medium Technology Emerging Lower Middle Class Health Education Labor Productivity Social Protection Gender Equality Inclusive Growth Missing Middle Technological Readiness Inclusive Growth Medium Technology Emerging Lower Middle Class Health Education Labor Productivity Social Protection Gender Equality Inclusive Growth Missing Middle Technological Readiness Innovation Medium Technology Emerging
l VIET NAM HUMAN DEVELOPMENT REPORT 2015IV
The 2015 National Human Development Report “Growth that works for all” examines how a policy framework based on inclusive growth can offer a pathway to advance human development in Viet Nam - as it enters a new and challenging stage of its development.
Using the lens of human development, this report takes a people-centered approach, examining Vietnamese people’s inclusion in the country’s development process since the late 1980s. The report finds that in the early and mid Doi Moi years Viet Nam performed well on both human development and economic growth. Economic expansion was inclusive, with benefits widely distributed and opportunities shared. Yet in recent years, the report finds that Viet Nam’s strong performance has waned, and especially after the 2008 global financial crisis. Growth has fallen and disparities between regions, provinces and population groups have not been closed. While the past growth has brought significant social transformation, evident in the shrinking population shares of the poor and near poor, and the rapid expansion of the lower middle class, those in the middle are far from secure, and those still in poverty are harder to reach, particularly within remote ethnic minority communities.
This report finds that the Doi Moi reforms, such as phased liberalization, particularly of agriculture, and subsequent international integration, and taking into the country’s starting point, favoured labour-intensive activities. These changes ushered in new opportunities for the overwhelming majority of workers and were key to past success. Yet, at the same time, Viet Nam’s recent economic slowdown signals that these once powerful reforms – engines of growth – have now run out of steam.
The challenge for Middle Income Viet Nam is to transition from its current growth model which relies too heavily on cheap labour and the exploitation of natural resources, to one based on rapid productivity growth. Delivering this outcome in a rapidly changing global context requires clear policy actions to secure improved competitiveness, greater efficiency, more advanced skills, an R&D base and an innovation culture. The report examines how an inclusive growth strategy can achieve these outcomes equitably, advancing human development and providing opportunities for all. It does so by looking at three policy pillars which mark out an inclusive growth approach: boosting productive employment opportunities, securing high quality education and health care for all, and ensuring a high level of social protection coverage.
The report identifies the opportunities and challenges Viet Nam faces in making the most productive use of its rich human resources. In particular, it examines how labour productivity and the economy at large, can be transformed via four transitions: first, within agriculture to higher value-added activities; second, through workers moving out of agriculture to the non-agricultural informal sector; third, an economy-wide movement from informal to formal employment; and fourth by growing productivity within formal employment. Within these transitions, the report recognizes a serious risk of inequality – as wage skills premiums and rewards to owners of capital and ideas will inevitably rise. Spatial inequality is also likely to worsen. There is a danger that significant proportion of the population might be left behind, and it is vital that remaining poverty is tackled so it does not become entrenched. Yet this also underlines the importance of adopting of a consciously inclusive growth strategy – one which
Foreword
VIET NAM HUMAN DEVELOPMENT REPORT 2015 l V
opens up opportunities and seeks to maximize growth by harnessing the potentials of all within the economy.
Recognizing health and education as core components of human development and central to enhancing people’s capabilities that allow them to seize opportunities and become more productive, the report identifies several key challenges. These include disparities outside basic primary and lower secondary schooling, and biases in the supply of health care and limitations to Social Heath Insurance coverage. Crucially, it notes within education, that although pre-primary schooling, vocational training and higher education are fundamental to securing inclusive growth, these sectors are under-utilized alongside evidence of social exclusion. The report also raises efficiency questions for both education and health care. It finds that although Viet Nam spends large amounts of money - public and private - on both, development outcomes are under-achieved. The issue therefore is not the level of funds, but how they are spent, and is critical of recent management and resourcing reforms.
The report notes the importance of social protection in terms of fostering equity, efficiency and resilience, and provides a critical review of Viet Nam’s system. It highlights the very limited social assistance for the poorest, and the emergence of a ‘missing middle’ of the near-poor and the lower-middle-income group who are often employed in the informal sector, are not eligible for social assistance and yet also cannot access social insurance. The report finds that the system leaves the poorest and ‘missing middle’ highly vulnerable to shocks and unable to invest in their children’s education or engage in entrepreneurship. As a result, overall risk aversion is higher and economic productivity is weaker.
Looking forward, the Report recommends practical policy actions to deliver more productive employment, improved and more equitable education and health care, and wide coverage social protection. These reforms will help secure an inclusive growth trajectory, which is also fitted to Viet Nam’s changing economy and its future needs.
The policy framework outlined in this report is integral to kick-starting growth in Viet Nam and taking human development to new heights. Its recommendations are both important and timely. Viet Nam is formulating its new Socio-Economic Development Plan (2016-2020) and embarking on implementation of the 2030 Development Agenda – the Sustainable Development Goals, in which inclusive growth and poverty eradication are centre stage. This report’s findings and recommendations offer a valuable contribution to these processes.
We commend this report to policymakers, researchers, development actors and the people of Viet Nam, who wish to see human development advance, for growth work for all and leave no one behind in tomorrow’s Viet Nam.
Professor Nguyen Xuan ThangPresident Viet Nam Academy of Social Sciences
Pratibha MehtaUN Resident CoordinatorUNDP Resident Representative
l VIET NAM HUMAN DEVELOPMENT REPORT 2015VI
This National Human Development Report (NHDR) 2015 for Viet Nam is the result of the extensive collaboration between Viet Nam Academy of Social Sciences (VASS) and the United Nations Development Program (UNDP). Prof. Dr. Nguyen Xuan Thang (President of VASS), Ms. Pratibha Mehta, Ms. Louise Chamberlain and Mr. Bakhodir Burkhanov (UNDP) have provided overall direction, strategic guidance and support for conceptualization, preparation and finalization of the Report. Strong support was provided also by VASS seniors and academic staff and UNDP Policy Advisory Team throughout the research and writing of the report.
The writing team consists of Mr. Nguyen Thang (VASS), Mr. Nguyen Tien Phong, Ms. Michaela Prokop, Mr. Richard Colin Marshall and Ms. Pham Thi Lien Phuong (UNDP). Mr. Arkadii Toritsyn contributed as an external consultant in the initial draft of the NHDR. The report also draws significantly on a number of the technical background papers (TBPs) prepared by experts from a variety of fields and institutions.
Sincere thanks and acknowledgement are due to the members of NHDR Technical working group (TWG) and prominent experts who provided reviews and comments on the initial concepts, detailed outlines, drafts of TBPs and successive drafts of the report. These include: Mr. Truong Dinh Tuyen, Dr. Vo Tri Thanh, Dr. Nguyen Thi Lan Huong, Prof. Dr. Luong Dinh Hai, Prof. Dr. Dang Nguyen Anh, Prof. Dr. Bui Quang Tuan, Prof. Dr. Ho Si Quy, Prof. Dr. Bui Tat Thang.
Special mention is due to Mr. Nguyen Thanh Ha, Ms. Vu Thi Van Anh, Ms. Nguyen Thu Huong (VASS) and Ms. Nguyen Thi Hai Yen (UNDP) for their tireless facilitation and support throughout the process of preparing the report.
Thanks are also owed to the Viet Nam General Statistical Office, including Ms. Nguyen Thi Ngoc Van, Mr. Do Anh Kiem, Mr. Cao Van Hoach, Mr. Duong Manh Hung, Ms. Pham Thi Minh Hien and Ms. Lo Thi Duc, for their calculation and statistical notes of the Human Development Index (HDI), Gender Development Index (GDI) and Multi-dimensional Poverty Index (MPI). Specific acknowledgement is due to Mr. Nguyen Van Tien and Ms. Nguyen Bui Linh for their quality assurance of HDI/GDI/MPI data used in the report; Ms. Pham Thi Lien Phuong for various HDI and MPI analyses; Ms. La Hai Anh, Mr. Vu Hoang Dat, Ms. Tran Ngo Thi Minh Tam and Mr. Pham Minh Thai for the work done to prepare statistics used from successive years of the Viet Nam Household Living Standards Survey (VHLSS), population and enterprise censuses. Special thanks are also due to the technical supports affiliated by the Centre for Analysis and Forecasting, VASS throughout the report’s preparation.
Finally, sincere gratitude and appreciation are due to the authors and reviewers of the technical background papers that formed the basis for this report, and all people who supported the delivery of the NHDR 2015.
Acknowledgements
VIET NAM HUMAN DEVELOPMENT REPORT 2015 l VII
ADB Asian Development Bank
ASEAN Association of Southeast Asian Nations
CAF Center for Analysis and Forecast (of Viet Nam Academy of Social Sciences)
CIEM Central Institute of Economic Management
FDI Foreign Direct Investment
GDP Gross Domestic Product
GII Gender Inequality Index
GNI Gross National Income
GOVN Government of Viet Nam
GSO General Statistical Office
HCMC Ho Chi Minh City
HD Human Development
HDI Human Development Index
HDR Human Development Report
HI Health Insurance
HIV Human Immunodeficiency Virus
IHDI Inequality-adjusted Human Development Index
ILO International Labour Organization
ILSSA Institute of Labour Sciences and Social Affairs
IPSARD Institute of Policy and Strategy for Agriculture and Rural Development
IT Information Technology
MDGs Millennium Development Goals
MIC Middle Income Country
MOET Ministry of Education and Training
MOF Ministry of Finance
MOH Ministry of Health
MOLISA Ministry of Labour, Invalids and Social Affairs
MPI Multidimensional Poverty Index
MPSAR Master Plan for Social Assistance Reform
NA National Assembly
NHDR National Human Development Report
Acronyms

l VIET NAM HUMAN DEVELOPMENT REPORT 2015VIII
NTP National Targeted Program
NTPSPR National Targeted Program for Sustainable Poverty Reduction
OECD Organisation for Economic Co-operation and Development
PAPI Public Administration Performance index
PPP Purchasing Power Parity
SDGs Sustainable Development Goals
SHI Social Health Insurance
UI Unemployment Insurance
UN United Nations
UNDP United Nations Development Programme
UNICEF United Nations Children’s Fund
USD United States Dollar
VASS Viet Nam Academy of Social Sciences
VHLSS Viet Nam Household Living Standards Survey
VND Viet Nam Dong
VSS Viet Nam Social Security
WB The World Bank
WHO World Health Organization
WTO World Trade Organization
VIET NAM HUMAN DEVELOPMENT REPORT 2015 l IX
Foreword .................................................................................................................................................................. IV
Acknowledgements ............................................................................................................................................VI
Acronyms ................................................................................................................................................................VII
Executive summary .............................................................................................................................................. 1Introduction ............................................................................................................................................................ 6PART 1: Inclusive growth and human development ............................................................................ 8
Chapter 1.1: High aspirations call for an inclusive path ................................................................. 91.1.1. Why inclusiveness matters? ......................................................................................................12
1.1.2. A contribution to greater human development................................................................151.1.3. Measuring and defining inclusive growth ...........................................................................17
Chapter 1.2: Human development in Viet Nam today ...................................................................19
1.2.1. Once rapid, human development progress falters ...........................................................20
1.2.2. Few losses due to inequality .....................................................................................................28
1.2.3. Good progress towards gender equality but concerns remain ...................................29
1.2.4. The subnational picture: Inconsistent progress .................................................................30
1.2.5. Multidimensional poverty declines overall but major variations remain between groups, regions and provinces .........................................................................................39
PART 2: Achieving inclusive growth ..........................................................................................................44
Chapter 2.1: A record of strong performance ...................................................................................45
2.1.1. In just two decades, a long leap forward .............................................................................45
2.1.2. A middle class emerges ..............................................................................................................47
2.1.3. Reforms have driven inclusive growth ..................................................................................51
2.1.4. Growth slowed down from the late 2000s until the early 2010s ................................52
Chapter 2.2: Meeting the challenges of a changing world ..........................................................54
2.2.1. The global economy arrives at a ‘new normal’ ...................................................................54
2.2.2. Becoming more efficient and innovative .............................................................................55
Chapter 2.3: Enhanced opportunities through more productive employment .................59
2.3.1. Labour productivity growth has been fast-but not fast enough ................................59
2.3.2. Driving productivity growth: structural transformation ...............................................62
2.3.3. Productivity within sectors still falls short ...........................................................................69
Chapter 2.4: Enhanced capabilities through improved health care and education .........82
2.4.1. Remarkable past performance has begun to falter .........................................................82
2.4.2. How inclusive are education and health care? ..................................................................85
Table of contents
l VIET NAM HUMAN DEVELOPMENT REPORT 2015X
2.4.3 New service models may not deliver the best outcomes ...............................................95
Chapter 2.5: Greater resilience through expanding and strengthening social protection ............................................................................................................... 107
2.5.1. Multiple sources of vulnerability .......................................................................................... 108
2.5.2. Systemic barriers to full protection ..................................................................................... 112
2.5.3. Governance and social assistance service delivery challenges ................................ 123
PART 3: Achieving the promise of inclusive growth ....................................................................... 126
3.1: Promoting productive employment .......................................................................................... 127
1. Combat macroeconomic instability to ensure inclusive growth .................................... 127
2. Raise efficiency by accelerating domestic reforms in tandem with furtherinternational integration ............................................................................................................... 128
3. Increase technological readiness and nurture innovation ................................................ 132
3.2: Enhance education and health care as cornerstones of inclusive growth ................ 133
1. Moving beyond basics: expand life-long learning ............................................................... 133
2. Make health care more inclusive and efficient ...................................................................... 138
3.3: Towards a more comprehensive, inclusive and equitable social protection system .....140
1. Towards universal health insurance ........................................................................................... 140
2. Towards a fully funded social insurance system .................................................................... 141
3. Towards expanded social assistance (cash transfer) schemes .......................................... 143
Conclusions ......................................................................................................................................................... 146Notes and References .................................................................................................................................... 148Notes .............................................................................................................................................................. 149
References ............................................................................................................................................................. 155
Annexes .............................................................................................................................................................. 166
Annex 1: Technical note on calculation of the Human Development Indices and Statitistical Tables ................................................................................................................... 167
Annex 2: The Deviation from Fit method .................................................................................................. 189
Annex 3: The relationship between economic growth and inequality .......................................... 193
Annex 4: The importance of the medium-technology sector for inclusive growth .................. 194
Annex 5: Major child support and disability benefit cash transfer schemes in 2014 ................ 195
Annex 6: Programme for Meritorious People .......................................................................................... 197
Annex 7: Social protection expenditure data .......................................................................................... 199
Annex 8: Beneficiary selection mechanisms ............................................................................................ 201
Targeting efficacy of poverty targeted schemes ................................................................ 202
Targeting efficacy of category targeted schemes .............................................................. 204
Annex 9: Proposed social transfer schemes and simulation of impacts and cost- efficiency analysis ........................................................................................................................... 206
Proposed social transfer schemes ............................................................................................ 206
Simulations of impacts and cost-efficiency of proposed schemes .............................. 207
VIET NAM HUMAN DEVELOPMENT REPORT 2015 l XI
BOxES PAGE Box 1.1: Rooting development in the experiences of ordinary people 9
Box 1.2: Emerging economies make inclusion a priority 11
Box 1.3: Defining inclusive growth 11
Box 1.4: How do people see inclusive growth in Viet Nam? 12
Box 1.5: Making the connection: equal opportunities and equal outcomes 14
Box 1.6: Measuring the state of human development 19
Box 1.7: What drives rising HDI scores? 25
Box 1.8: Gauging provincial progress against expectations 37
Box 2.1: At the new stage of development, Viet Nam needs greater efficiency and more innovation to continue pushing forward its development 55
Box 2.2: To formalize or not: Size, sector and space all matter 67
Box 2.3: What determines labour productivity in firms? 71
Box 2.4: Foreign Direct Investment: Performance and impacts 73
Box 2.5: Cut flowers in Da Lat: Farmers and the state 78
Box 2.6: A model for contract farming 81
Box 2.7: Too many migrant children remain out of school 87
Box 2.8: Migrants are less likely to see a health professional 91
Box 2.9: Free health insurance helps vulnerable groups secure care 92
Box 2.10: Overcrowded central hospitals 94
Box 2.11: Socialization’s mixed record 96
Box 2.12: Weak regulations do little to balance large sub-national resource disparities 97
Box 2.13: Spending does not fully support capability development during the crucial early years of life 99
Box 2.14: Keeping up with extra study - for those who can afford it 102
Box 2.15: A family borrows funds to pay for a father’s illness, but a young girl still has to give up college 106
Box 2.16: How social protection is defined in this report 107
Box 2.17: The Programme for Meritorious People (Merits Programme) 118
Box 3.1: Mobilizing resources for social services in the Socioeconomic Development Plan 2016-2020 133
Box 3.2: Market or commercialization? 137
Box 3.3: In rural areas, China builds a pension system from contributions and subsidies 142
Figures, tables and boxes
l VIET NAM HUMAN DEVELOPMENT REPORT 2015XII
FIGURES PAGE
Figure 1.1: A framework for inclusive growth 15Figure 1.2: HDI increases have levelled off since the 2008 crisis 21Figure 1.3: Progress on education in Viet Nam has picked up, but not fast enough 23Figure 1.4: On health, Viet Nam outperforms many of its neighbours 23Figure 1.5: Viet Nam’s per capita income performance (adjusted for purchasing power)
now lags the regional average 24Figure 1.6: In human development terms Viet Nam’s GNI performance is better 25Figure 1.7: Gaps between regions narrowed - until 2008 32Figure 1.8: Gaps relative to the leading South East region have levelled off 32Figure 1.9: More developed provinces are more fit to perform 38Figure 1.10: Differences between multidimensional and income poverty varied widely
by region in 2012 41Figure 1.11: Multidimensional deprivations are linked, but not fully consistent
with income status and location plays a major role in determining the pattern of deprivation 42
Figure 1.12: Some medium and high HDI provinces also have concentrated multidimensional poverty 43
Figure 2.1: Inclusive growth has meant most Vietnamese have benefited from steadily rising incomes 46
Figure 2.2: While all parts of the population saw income grow, the middle experienced faster rates of growth 47
Figure 2.3: The lower-middle class grew rapidly from 2004-2012 48Figure 2.4: Pillars of national competitiveness 56Figure 2.5: Where is Viet Nam now in the development trajectory? 56Figure 2.6: The reallocation of workers across sectors has been the main spur
for productivity in Viet Nam compared to its neighbours, 2000-2010 61Figure 2.7: Work today is much less likely to be in agriculture 63Figure 2.8: Too many people are still caught in vulnerable employment,
which undercuts productivity 64Figure 2.9: Formal employment has grown, but progress has slowed 65Figure 2.10: Where exports are labour intensive, migrants take many of the jobs 68Figure 2.11: Labour productivity is concentrated in the higher-tech ends
of manufacturing and services 70Figure 2.12: After a growth spurt, higher productivity sub-sectors stabilized
in the mid-2000s 71Figure 2.13: Growth in agricultural productivity in Viet Nam has surpassed rates
in most Asian countries except those that are significantly more advanced 76Figure 2.14: The decline in cereal production reflects a move away
from low-value products 77Figure 2.15: Technology has fueled Viet Nam’s significant growth in cereal yields 80Figure 2.16: It has taken Viet Nam longer to boost higher mean years of schooling,
a handicap in transitioning to a modern economy 84Figure 2.17: Almost all children, regardless of income level, go to primary school 86

VIET NAM HUMAN DEVELOPMENT REPORT 2015 l XIII
Figure 2.18: Poor and middle-income children are less likely to obtain a secondary education 86
Figure 2.19: Upper income groups dominate both vocational and higher education, suggesting a troubling loss in human capital 89
Figure 2.20: Most people, whether poor or better off, have health care 91Figure 2.21: Private education expenditures play a significant role (As a share of GDP) 100Figure 2.22: Household costs are greater for higher levels of education,
which can reinforce exclusion 101Figure 2.23: Households still finance the majority of health-care costs 103Figure 2.24: In household budgets, the share spent on health care is highest
for middle-income groups 105Figure 2.25: Viet Nam is ageing at a rate unprecedented in history 108Figure 2.26: Disability affects women more than men, and increases with age 110Figure 2.27: Considerable shares of people move among income quintiles,
2010 and 2012 112Figure 2.28: Viet Nam’s social protection schemes leave some groups out 114Figure 2.29: Coverage of social insurance pensions is lower among those
with less education, 2011 115Figure 2.30: VSS transfers to people over 65 tend to go to those who are wealthier 116Figure 2.31: People who are near poor or middle-income have the lowest rates
of health insurance coverage 116Figure 2.32: A binary approach results in missing the middle 117Figure 2.33: Compared with other developing countries,
Viet Nam has one of the lowest social pensions 119Figure 2.34: Disability benefits in Viet Nam are also below the norm 119Figure 2.35: Child benefits fall short of those elsewhere 119Figure 2.36: The purchasing power of social assistance schemes
and contributory pensions has not kept up over time 120Figure 2.37: Expenditure on social protection is sizeable but imbalanced, 2010 prices 121Figure 2.38: State expenditures on major social protection schemes in 2013 121Figure 2.39: Among countries with social pensions, Viet Nam’s investment is low 122Figure 3.1: When investments in life capabilities occur earlier,
future prospects are better 135Figure 3.2: Tertiary enrolment rates need to improve 136Figure 3.3/3.4: Social assistance spending boosts GDP as much
as infrastructure - and makes an even more powerful contribution to household consumption 145
Figure A6.1: Comparison of the value of Merits Payments in Viet Nam with social pensions in developing countries 197
Figure A6.2: Targeting incidence of Merits Payments 198Figure A8.1: Targeting incidence of the Poor List, 2012 203Figure A8.2: Comparison of the Poor List and a theoretical proxy means test for Viet Nam,
assessed against coverage of households in deciles 204Figure A9.1: Coverage of households across wealth deciles by the proposed schemes
compared to current coverage of MOLISA’s social transfers 208

l VIET NAM HUMAN DEVELOPMENT REPORT 2015XIV
Figure A9.2: Contribution of different schemes to reductions in the national poverty rate and gap 208
Figure A9.3: Reductions in the poverty gap and poverty rates for individual schemes within target populations 209
Figure A9.4: Cost of reducing the national poverty rate by one percentage point: Comparison between the proposed schemes, current social transfers and current social insurance 210
TABLES PAGE
Table 1.1: Analytical indicators to gauge inclusion 18Table 1.2: Where does Viet Nam stand compared to other Asian countries? 22Table 1.3: Using a ‘Deviation from Fit’ method, Viet Nam has fallen behind
on both the HDI and the income index 27Table 1.4: Differences between Viet Nam’s income and HDI rankings have been closing 27Table 1.5: Inequality in Viet Nam remains relatively low 28Table 1.6: Vietnamese women are relatively healthy and educated,
and active in the labour force 30Table 1.7: How regions compared on human development in 2012 31Table 1.8: There are no significant gender disparities among regions 33Table 1.9: Almost no provinces now remain in lower human development categories 34Table 1.10: Areas with high HDI values tend to do well on income and
non-income rankings, 2012 36Table 1.11: Top and bottom performers on the HDI considering ‘deviation from fit’,
2004-2012 37Table 1.12: Consistent intensity of poverty suggests similar experiences
for people in poverty 40Table 2.1: Despite being better off, people in the lower-middle class lack economic
opportunities to resist shocks 49Table 2.2: Sub-index weights and income thresholds for stages of development 56Table 2.3: The growing complexity of development requires economies of scale 58Table 2.4: Viet Nam has the highest growth in labour productivity among
nine ASEAN countries 60Table 2.5: Agricultural productivity has grown more rapidly than in other sectors,
but value added is lower 60Table 2.6: Viet Nam has done well on the MDGs 83Table 2.7: Child survival and well-being still depends on where children live 93Table 2.8: Viet Nam spends heavily on education 98Table 2.9: But spending is heavily concentrated on primary and
lower secondary schooling 99Table 2.10: Poorer and rural people suffer higher rates
of impoverishment from catastrophic health expenditure 106Table 2.11: Weather-related disasters take the heaviest tolls on coastal areas 111Table 3.1: Education policy recommendations 137Table 3.2: Health-care policy recommendations 139Table 3.3: Basic design parameters and costs of proposed schemes 146

EXECUTUVE SUMMARY l 1
This National Human Development Report explores how a new economic model based on inclusive growth could sustain and advance human development in Viet Nam. Inclusive growth provides opportunities for all and leaves no one behind. It emphasizes rapid economic growth as well as equity in the distribution of benefits.
While poverty eradication is a primary goal, all income groups should have capacities and opportunities to improve their well-being. Particular attention needs to go to the large share of the population who have now left poverty, but remain vulnerable to suddenly falling back into it.
Based on analysis of human development performance and the inclusiveness of growth in recent years, the report recommends three priorities: more productive employment, improved and more equitable education and health care, and social protection fit for a changing economy.
Strong performance on human development has waned
Viet Nam has performed well on the three components of human development over the past 35 years - income, education and health - but less so recently. Initially under the Doi Moi reforms, human development faltered, particularly in terms of education. While progress accelerated from the late 1990s, a gap between Viet Nam and comparable countries has never fully closed. Life expectancy is high, but continued advancement has been limited, despite scope for improvement in reducing child mortality and safety fatalities. Income levels have risen, but levelled off after the 2008 global financial crisis.
Crucially, Viet Nam’s recent underperformance was pronounced for both human development and economic performance. Economic vibrancy is important for human development, but so too is balanced development that reaches all people. Traditionally Viet Nam ranked far higher on human development than it does on economic performance, yet this position declining. Viet Nam has recently become less effective at translating economic gains into the full human capabilities people need to realize their full potentials.
A longstanding pattern of human development levels converging across regions reversed in 2008, and has not restarted. All provinces are making progress, but some fare better than others. Rising stars include Hau Giang, Tien Giang, Binh Phuoc, Thai Nguyen and Phu Yen. Little progress is evident in Ha Nam, Nghe An, Phu Tho and Ha Tinh. Top performers remain as expected, but Ha Noi has now slipped behind Da Nang as well as Ho Chi Minh City and Ba Ria Vung Tau.
Measuring multidimensional poverty provides new insights on deprivation in Viet Nam, revealing serious challenges in regions not often thought of as poor as well as in rapidly growing urban areas. While multidimensional poverty is often associated with insufficient incomes, the fit is not a perfect one: the ‘income poor’ do not rank highest on all of the dimensions of the Multidimensional Poverty Index. Underpinning this, are mounting pressures faced by the near poor and lower-middle class. Many of them do not quality for social assistance programmes nor can they participate in social insurance, and cannot afford basic entitlements such as health insurance and the growing costs of schooling.
Executive summary
l VIET NAM HUMAN DEVELOPMENT REPORT 20152
Continued economic advancement depends on greater inclusion
Viet Nam’s economic slowdown deepened after the global financial crisis in 2008, but its roots can be traced to the years immediately before then, and its once powerful growth model has been running out of steam for some years. Re-energizing the economy and attaining higher human development will depend in large part on a transition to higher productivity across all population groups. This calls for greater efficiency, more advanced skills and innovation, among other elements.
This report finds that growth in Viet Nam has been inclusive, with widely distributed benefits and shared opportunities for the whole period from 2004 to 2012. But it was more inclusive in the first four years of this period. After 2008, the pattern was more equal, but growth was slower.
Distributional analysis for the full period also shows that all groups saw their incomes rise, but middle income groups benefited most, and this underpins the emergence of a Vietnamese middle class. The liberalization of agriculture as well as non-agricultural sectors, geographical factors and international integration favoured labour-intensive activities ushering in new opportunities for the overwhelming majority of workers.
Significant social transformation1 is evident in the shrinking population shares of the poor and near poor, and the rapid expansion of the lower middle class.2 Yet those in the middle are far from secure, and those still in poverty are harder to reach, particularly within remote ethnic minority communities.
Mostly still employed in the informal sector, the poor and the ‘new middle’ face constraints on productivity that curtail further advances in human development, and render them vulnerable to sudden shocks and reverses. Little headway has been made in expanding Viet Nam’s ‘global middle class’,3 and putting incomes on firmer foundations so that people would no longer have to worry about simply getting by.
Productive employment is the mainstay of inclusive growth
For Viet Nam to make the most of its current middle-income stage of development, but also to avoid being perpetually trapped there, it will need to make the most productive use of its rich human resources. At middle-income stage, the importance of skills grows rapidly, because it is no longer enough just to rely on low-skilled jobs that anyone can do.
Without widely shared improvements in human capacities, allowing all people to acquire new and more advanced skills, there is a risk of serious inequality developing, as those without skills are likely to be left behind as the economy advances. In tandem, the remaining pockets of absolute poverty (largely in remote areas and ethnic minority communities) need to be tackled urgently so that these do not become entrenched.
Viet Nam faces four transitions in moving to more efficient and productive growth. The first is within agriculture to achieve higher value-added. There has been progress here, but more is needed. Remaining challenges include small-scale production; farmers having a disproportionately small share of the profit within the value chain; hurdles in terms of limited technology, capital and skills; and risks that are not yet well managed.
The second transition is the movement of workers out of agriculture to other sectors. This has fueled most of Viet Nam’s productivity improvement so far, but it also implies that increasing labour
EXECUTUVE SUMMARY l 3
productivity within sectors remains a challenge. The third transition is formalization of labour and enterprises in the wider economy, where progress has been slow and even worsened after 2008.
The fourth transition is raising productivity and associated incomes within formal employment, which is largely driven by enhancing skills and take-up of technology, and nurturing entrepreneurship and innovation. Progress here has also been limited. The recent arrival of export-oriented multinational corporations offers huge opportunities, but capturing them in full will be challenging. A modern industrial policy that emphasizes effective public-private partnerships and enhanced skills is needed to forge stronger links between foreign direct investment and domestic production, especially among small and medium enterprises.
Health care and education matter for human development and greater productivity
Health and education are core components of human development, and central to livelihoods and the economy. Better educated and healthier workforces are equipped with capabilities that allow them to seize opportunities and become more productive.
Viet Nam performs well in both areas on aggregate measures such as the Millennium Development Goals, but with big issues to be addressed - related to quality, coverage and equity of provision. Outside of the basics - primary and lower secondary schooling, and basic access to health care and Social Heath Insurance coverage - serious disparities have emerged. Within education, pre-primary schooling, vocational training and higher education are fundamental for inclusive growth, yet there is evidence of social stratification and exclusion at these levels. Similar disparities can be seen in different income group’s abilities to manage catastrophic health expenditures, with the poorer groups faring badly. There are also major geographical variations in the supply and quality of education and health services.
Efficiency questions arise since Viet Nam is spending big money - public and private - on both sectors. The issue therefore is not the level of funds - which reached 6.6 percent of GDP on health and 7.8 percent of GDP on education in 2012, high by the standards of middle-income countries and the surrounding region - but how they are spent.
Government reforms in management and public funding have gathered momentum in recent years under the banner of socialization, and this has increased user charges and allowed decentralized management without effective checks. The blurring of public and private spheres has resulted in perverse incentives, including providers to promote unnecessary services. Greater costs placed pressures on people, especially poorer and lower-middle-income groups. Given the public goods features of health and education, there is an obvious case for state strong regulation, if not direct provision. Social protection is essential for equity, efficiency and resilience
Like education and health, social protection fosters the equity, efficiency and resilience of growth and development. It provides for the poorest, ensuring they do not fall beneath a minimum standard of living. It also offers middle-income groups, who may have attained only a tenuous level of income security, a hedge against vulnerability. Social protection enables families to invest in their futures, which provides a boost to the wider economy.
Viet Nam has a basic system of social protection covering many stages of the human life cycle. But it is strongly divided between relatively generous social insurance for those working in the formal sector and very limited social assistance for the poorest. A ‘missing middle’ encompasses the near-poor and the lower-middle-income group who are employed in the informal sector.

l VIET NAM HUMAN DEVELOPMENT REPORT 20154
They are not eligible for social assistance and cannot access social insurance. This leaves them highly vulnerable to reversals of well-being. It limits their abilities to take the kinds of calculated risks associated with, for instance, investing in education or chancing entrepreneurship. As a result, overall economic productivity is weaker.
Social assistance transfers are generally too low to make much of a difference, which is reflected in a number of negative outcomes, including widespread stunting among children in poor and low-income families. Government spending priorities reflect thinking that is out of sync with modern best practices. While Viet Nam’s public expenditure on social protection overall accounts for 2.8 percent of GDP in 2013, social assistance accounts for only around 0.4 percent of GDP.
Achieving the promise of inclusive growth
Viet Nam can be proud of its past successes. But now it needs a step change in social and economic policy to achieve more inclusive growth. Only then will it be able to take full advantage of the opportunities of its middle-income status, while avoiding being trapped there over the longer term.
In short, Viet Nam needs to break out of its current economic and human development impasse. Among its most important pathways are more productive employment, improved and more equitable education and health care, and social protection fit for a changing economy.
Achieving more productive employment depends on a variety of policy and institutional reforms. These need to maintain macroeconomic stability without compromising inclusiveness. More progressive fiscal policy would support this aim, and could prioritize introducing a property tax as well as phasing-out fossil fuel subsidies, complemented by appropriate measures to protect the poor.
Greater efficiency would come from accelerating domestic reforms in tandem with international integration. Key elements are effective public administration reform and aggressively combating corruption; restructuring public investment, state-owned enterprises and the banking sector; promoting private sector development and improving labour market efficiency.
Enhancing connectivity and technological readiness, and nurturing innovation will be crucial to higher productivity. Among other measures, this requires fostering labour productivity within sectors through skills enhancement, more emphasis on learning by doing, the transfer of medium-level technologies and the creation of a base for innovation.
Important supports for this process comprise accelerated but better managed urbanization and promoting industrial clustering; building better links between domestic and foreign enterprises; supporting small and medium enterprises, including via technology-linked start-ups that can gain a foothold in global value chains; furthering, via public sector investments, backbone infrastructure to support connectivity and technological readiness; and bolstering capacities for research and development. Reshaping the capital market to make it conducive to long-term financing and venture capital, and rechanneling investment to advance the dissemination of technology are also important.
In education Viet Nam must extend its strong but basic achievements. While sustaining fundamentals such as universal primary education, it should invest more in aspects vital to inclusive growth, notably, pre-primary schooling, vocational training and higher education. In health, greater equity between areas and peoples is needed. This requires re-focusing away
EXECUTUVE SUMMARY l 5
from expensive niche treatments to core health care provision. An evaluation of financing and management reforms in both health and education is required, accompanied by new thinking on regulation to ensure equity and efficiency.
Within social protection, a fundamental shift is urgently needed. This should aim at greater levels of coverage and adequacy to eradicate poverty and build resilience among the many people who remain vulnerable to poverty - both of which are vital to unshackling individual and economic productivity.
Incentives should boost participation in health insurance and careful policy measures facilitate expansion of social insurance, while a basic package of social assistance should cover the human life cycle, particularly birth and childhood, disability and old age. Greater coherence of the key pillars of social protection system would increase coverage and efficiency. While these measures will require additional resources and/or a reallocation of funds, financing should be viewed in terms of social protection as an effective public investment with high economic and social returns.
In closing, the policy framework outlined in this report is integral to an agenda that could boost Viet Nam’s human development to new heights. The country has high aspirations. Now is the time to act on these. Making growth inclusive will bring Viet Nam a long way towards joining the ranks of high-performing countries.

l VIET NAM HUMAN DEVELOPMENT REPORT 20156
Since Doi Moi was launched in the late 1980s, Viet Nam has made significant progress in its journey to prosperity and equitable human development. From a country torn by wars, and struggling with widespread poverty and a stagnating economy in the early 1980s, Viet Nam emerged with strong growth during its transition from central planning. In 2010, it became a low middle-income country, and has shown consistent improvement in its Human Development Index (HDI) score. With poverty falling from more than 58 percent in 1993 to around 10 percent in 2014, and remarkable achievements in education and health, Viet Nam was among the world’s best-performing countries on the Millennium Development Goals (MDGs) (Viet Nam’s MDG Reports 2013, 2014, 2015).
Yet middle-income Viet Nam is entering a new stage of development that ushers in new challenges. The global financial crisis of 2008 and its long aftermath, in particular, have exposed the vulnerabilities of its development progress and existing growth model.
In recent years, Viet Nam’s economic growth and progress in human development have both faltered. Informed by a number of research studies, serious discussions and debates have taken place to pinpoint underlying weaknesses. Major questions have been raised about the ability of the current growth model - despite the remarkable progress it unleashed - to deliver development over the longer term. The search for a new approach has drawn many contributions, with active engagement by the Government of Viet Nam.
Consensus has emerged that Viet Nam’s economy should move away from relying on cheap labour and exploiting natural resources, to one based on higher productivity and competitiveness. Improvements in resource allocation and use will be critical to spurring higher efficiency. Debates on key policy choices to achieve these objectives are still ongoing however.
This 2015 National Human Development Report seeks to contribute to dialogue on how the transition can move forward and which reform actions should be prioritized. It favours an inclusive growth path that promotes opportunities and active participation in the economy by all groups of people, and that achieves both accelerated growth and an equitable distribution of benefits. This is in keeping with current international discourse and development policy thinking, which increasingly emphasize equity, inclusion and resilience.
From 2012 onward, Viet Nam, along with other UN Member States, actively participated in global talks to formulate Agenda 2030. Agreed in September 2015 by the United Nations General
Introduction
“We recognize that people are at the centre of sustainable development and, in this regard, we strive for a world that is just, equitable and inclusive, and we commit to work together to promote sustained and inclusive growth, social development and environmental protection and thereby to benefit all.”
“The future we want” - Outcome Document of Rio+20
INTRODUCTION l 7
Assembly, and a record 154 Heads of State and Government, this Agenda commits to leaving no one behind, and makes equality a central principle. Among its 17 interlinked Sustainable Development Goals (SDGs), Goal 8 calls for “promot(ing) inclusive and sustainable economic growth, employment and decent work for all,” and specifies “inclusive and sustainable economic growth” as the pathway to end poverty and hunger, in its all dimensions.
This affirms the role of inclusive and sustainable economies in ensuring that all people achieve their potential, live in dignity, and enjoy prosperous and fulfilling lives. Beyond contributing to defining a new growth model for Viet Nam, this report also aims to provide insights on nationalizing and implementing the SDGs. With the theme of inclusive growth - where people are active agents who shape and create prosperity, and equitably share the benefits - the report intends to bring human and people-centered development perspectives to the forefront of policymakers’ attention. It explores how the growth process can expand opportunities and enhance the capabilities and resilience of all Vietnamese, enabling them to fulfill their aspirations, and for Viet Nam to surpass its low middle-income status.
The report has three parts. Part 1 covers the basics. The first chapter of Part 1 discusses key human development and inclusive growth concepts, and connections to people and equity. It identifies inclusive growth as a pathway to enhanced human development, and presents a framework for measuring inclusive growth. In the second chapter of Part 1, Viet Nam’s human development status and trends, as measured by the HDI and related indexes, are examined, alongside factors contributing to human development progress.
Part 2 provides the core analysis (following the framework set out in Part 1). It explores the extent to which growth has been inclusive in Viet Nam (Chapter 2.1) and the changing context of Viet Nam’s development (Chapter 2.2). It offers an in-depth analysis of three hallmark themes of an inclusive growth model. These include the degrees to which: first, productive employment opportunities have expanded (Chapter 2.3); second, education and health services have enhanced key human capabilities (Chapter 2.4); and third, the social protection system has improved people’s resilience (Chapter 2.5). Part 2 specifically examines bottlenecks to deeper inclusiveness in these three areas.
Part 3 concludes the report with recommended policy reforms, options and actions for achieving more inclusive growth, enhancing human development and tackling the challenges facing Viet Nam in its next stage of development.

l VIET NAM HUMAN DEVELOPMENT REPORT 20158
Health Education Labor Productivity Social Protection Gender Equality Inclusive Growth Missing Middle Technological Readiness Innovation Medium Technology Emerging Lower Middle Class Health Education Labor Productivity Social Protection Gender Equality Inclusive Growth Missing Middle Technological Readiness Innovation Medium Technology Emerging Lower Middle Class Health Education Labor Productivity Social Protection Gender Equality Inclusive Growth Missing Middle Technological Readiness Innovation Medium Technology Emerging Lower Middle Class Health Education Labor Productivity Social Protection Gender Equality Inclusive Growth Missing Middle Technological Readiness Inclusive Growth Medium Technology Emerging Lower Middle Class Health Education Labor Productivity Social Protection Gender Equality Inclusive Growth Missing Middle Technological Readiness Innovation Medium Technology Emerging Lower Middle Class Health Education Labor Productivity Social Protection Gender Equality Inclusive Growth Missing Middle Technological Readiness Innovation Medium Technology Emerging Lower Middle Class Health Education Labor Productivity Social Protection Gender Equality Inclusive Growth Missing Middle Technological Readiness Innovation Medium Technology Emerging Lower Middle Class Health Education Labor Productivity Social Protection Gender Equality Inclusive Growth Missing Middle Technological Readiness Innovation Medium Technology Emerging Lower Emerging Lower Health Education Labor Productivity Social Protection Gender Equality Inclusive Growth Missing Middle Technological Readiness Innovation Medium Technology Emerging Lower Middle Class Health Education Labor Productivity Social Protection Gender Equality Inclusive Growth Missing Middle Technological Readiness Innovation Medium Technology Emerging Lower Middle Class Health Education Labor Productivity Social Protection Gender Equality Inclusive Growth Missing Middle Technological Readiness Innovation Medium Technology Emerging Lower Middle Class Health Education Labor Productivity Social Protection Gender Equality Inclusive Growth Missing Middle Technological Readiness Innovation Medium Technology Emerging Lower Middle Class Health Education Labor Productivity Social Protection Gender Equality
Health Education Labor Productivity Social Protection Gender Equality Inclusive Growth Missing Middle Technological Readiness Innovation Medium Technology Emerging Lower Middle Class Health Education Inclusive Growth Social Protection Gender Labor Productivity Missing Middle Technological Readiness Innovation Medium Technology Emerging Lower Middle Class Health Education Labor Productivity Social Protection Gender Equality Inclusive Growth Missing Middle Productivity Readiness Innovation Medium Technology Social Protection Middle Class Health Education Labor Education Social Protection Gender Equality Health Missing Middle Technological Readiness Inclusive Growth Medium Technology Emerging Lower Middle Class Health Education Labor Productivity Social Protection Gender Equality Inclusiv Gender Equality Missing Middle Technological Readiness Innovation Medium Technology
Health Education Labor Productivity Social Protection Gender Equality Inclusive Growth Missing Middle Technological Readiness Innovation Medium Technology Emerging Low Middle Class Health Education Labor Productivity Social Protection Gender Equality Inclusive Growth Missing Technological Readiness Innovation Medium Technology Emerging Lower Middle Class Health Education Labor Productivity Social Protection Gender Equality
Inclusive Growth Missing Middle Technological Readiness Innovation Medium Technology Emerging Lower Middle Class Health Education Labor Productivity Social Protection Gender Equality Inclusive Growth Missing Middle Technological Readiness Inclusive Growth Medium Gender Equality Middle Class Health Education Health Education Social Protection Gender Equality Inclusive Growth Missing Middle Technological Readiness Innovation Medium Technology Emerging Lower Middle Class Health Education Labor Productivity Social Protection Gender Equality Inclusive Growth Missing Middle Technological Readiness Innovation Medium Technology Emerging Lower Middle Class
Health Education Labor Productivity Social Protection Gender Equality Gender Equality Missing Middle Technological Readiness Innovation Medium Technology Emerging Lower Middle Class Health Education Labor
Productivity Social Inclusive Growth Gender Middle Technological Readiness Innovation Medium Techno Emerging Lower Middle Class Health Education Labor Produ Social Protection Gender Equality Inclusive Growth Missing Middle Technological Readiness Innovation Medium Technology Emerging Lower Middle Class Health Education Labor Productivity Social Protection Gender Equality Inclusive Growth Missing Middle Technological Readiness Inclusive Growth Medium Technology Emerging Lower Middle Class Health Education Labor Productivity Social Protection Gender Equality Inclusive Growth Missing Middle Technological Readiness Innovation Medium Technology Emerging Lower Middle Class Health Education Labor Productivity Social Protection Gender Equality Inclusive Growth Missing Middle
Health Education Labor Productivity Social Protection Gender Equality Inclusive Gr Missing Middle Technological Readiness Innovation Medium Technology Emerging Lower Middle Class Health Education Labor Productivity Social Protection Gender Equality Inclusive Growth Missing Middle Health Technological Innovation Medium Technology Emerging Lower Middle Health Education Labor Productivity
Social Protection Gender Equality Inclusive Growth Missing Middle Technological Readiness Innovation Medium Technology Emerging Lower Middle Class Health Education Labor Productivity Social Protection Gender Equality Inclusive Growth Missing Middle Technological Readiness Inclusive Growth Medium Technology Emerging Lower Middle Class Health Education Labor Productivity Social Protection Gender Equality Inclusive Growth Missing Middle Technological Readiness Innovation Medium Technology Emerging
Inclusive growth and human development1

Inclusive Growth and Human Development l 9
Inclusive growth opens up opportunities for people to improve their well-being while leaving no one behind. It aims to eradicate poverty and lift all income groups, including those who may be better off, yet remain vulnerable to sudden shocks. Fundamentally, inclusive growth depends on people having productive employment, high quality and readily accessible education and health care, and social protection to uphold basic standards of living for all.
Where people at large can become more productive and capable, and have opportunities to use those capabilities, people can create better lives for themselves and their families. They also become the engine of a highly productive economy that performs flexibly and efficiently, with a competitive edge in a globalized world.
Development is defined by more than economic growth
“People are the real wealth of a nation. The
basic objective of development is to create an enabling environment for people to live long, healthy and creative lives.”
These were the opening lines of the first global Human Development Report in 1990. The idea that people are at the heart of development—not just as beneficiaries, but also as agents of change—was profoundly challenging to orthodox notions of development centred on economic growth. Focusing on the expansion of human capabilities and choices so that people can live full, creative lives with freedom and dignity, human development opened new ways assessing progress.
Human development evolved during the 1980s, underpinned by Amartya Sen’s groundbreaking work on welfare economics, in which he defined development in terms of expanding people’s abilities to exercise key choices (Box 1.1). The approach joined a long tradition of efforts to displace narrowly economic definitions of human progress, chiefly, growth in per capita incomes.
Chapter 1.1: High aspirations call for an inclusive path
Box 1.1: Rooting development in the experiences of ordinary people
First articulated in the 1980s, Amartya Sen’s human development approach provides a means of understanding and tracking economic and social progress that is rooted in the real-world experiences of ordinary people. Human development concerns itself with furthering individuals’ capacities (their ‘capabilities’) to access aspects of their lives (‘functionings’) that define well-being. These include: being able to attain a decent education, being in good health and having the economic wherewithal to secure family livelihoods. Rather than defining development in money terms, human development tracks those things that make life inherently valuable.
Since publication of the first global Human Development Report in 1990, the human development approach has come to define UNDP’s policy and programming, and has been influential in many countries and other development organizations. Over time, the concept has evolved to emphasize agency, equity and human rights, and to recognize the importance of political freedoms and the well-being of future generations.Source: United Nations Development Programme, 1990, Human Development Report 1990
Health Education Labor Productivity Social Protection Gender Equality Inclusive Growth Missing Middle Technological Readiness Innovation Medium Technology Emerging Lower Middle Class Health Education Labor Productivity Social Protection Gender Equality Inclusive Growth Missing Middle Technological Readiness Innovation Medium Technology Emerging Lower Middle Class Health Education Labor Productivity Social Protection Gender Equality Inclusive Growth Missing Middle Technological Readiness Innovation Medium Technology Emerging Lower Middle Class Health Education Labor Productivity Social Protection Gender Equality Inclusive Growth Missing Middle Technological Readiness Inclusive Growth Medium Technology Emerging Lower Middle Class Health Education Labor Productivity Social Protection Gender Equality Inclusive Growth Missing Middle Technological Readiness Innovation Medium Technology Emerging Lower Middle Class Health Education Labor Productivity Social Protection Gender Equality Inclusive Growth Missing Middle Technological Readiness Innovation Medium Technology Emerging Lower Middle Class Health Education Labor Productivity Social Protection Gender Equality Inclusive Growth Missing Middle Technological Readiness Innovation Medium Technology Emerging Lower Middle Class Health Education Labor Productivity Social Protection Gender Equality Inclusive Growth Missing Middle Technological Readiness Innovation Medium Technology Emerging Lower Emerging Lower Health Education Labor Productivity Social Protection Gender Equality Inclusive Growth Missing Middle Technological Readiness Innovation Medium Technology Emerging Lower Middle Class Health Education Labor Productivity Social Protection Gender Equality Inclusive Growth Missing Middle Technological Readiness Innovation Medium Technology Emerging Lower Middle Class Health Education Labor Productivity Social Protection Gender Equality Inclusive Growth Missing Middle Technological Readiness Innovation Medium Technology Emerging Lower Middle Class Health Education Labor Productivity Social Protection Gender Equality Inclusive Growth Missing Middle Technological Readiness Innovation Medium Technology Emerging Lower Middle Class Health Education Labor Productivity Social Protection Gender Equality
Health Education Labor Productivity Social Protection Gender Equality Inclusive Growth Missing Middle Technological Readiness Innovation Medium Technology Emerging Lower Middle Class Health Education Inclusive Growth Social Protection Gender Labor Productivity Missing Middle Technological Readiness Innovation Medium Technology Emerging Lower Middle Class Health Education Labor Productivity Social Protection Gender Equality Inclusive Growth Missing Middle Productivity Readiness Innovation Medium Technology Social Protection Middle Class Health Education Labor Education Social Protection Gender Equality Health Missing Middle Technological Readiness Inclusive Growth Medium Technology Emerging Lower Middle Class Health Education Labor Productivity Social Protection Gender Equality Inclusiv Gender Equality Missing Middle Technological Readiness Innovation Medium Technology
Health Education Labor Productivity Social Protection Gender Equality Inclusive Growth Missing Middle Technological Readiness Innovation Medium Technology Emerging Low Middle Class Health Education Labor Productivity Social Protection Gender Equality Inclusive Growth Missing Technological Readiness Innovation Medium Technology Emerging Lower Middle Class Health Education Labor Productivity Social Protection Gender Equality
Inclusive Growth Missing Middle Technological Readiness Innovation Medium Technology Emerging Lower Middle Class Health Education Labor Productivity Social Protection Gender Equality Inclusive Growth Missing Middle Technological Readiness Inclusive Growth Medium Gender Equality Middle Class Health Education Health Education Social Protection Gender Equality Inclusive Growth Missing Middle Technological Readiness Innovation Medium Technology Emerging Lower Middle Class Health Education Labor Productivity Social Protection Gender Equality Inclusive Growth Missing Middle Technological Readiness Innovation Medium Technology Emerging Lower Middle Class
Health Education Labor Productivity Social Protection Gender Equality Gender Equality Missing Middle Technological Readiness Innovation Medium Technology Emerging Lower Middle Class Health Education Labor
Productivity Social Inclusive Growth Gender Middle Technological Readiness Innovation Medium Techno Emerging Lower Middle Class Health Education Labor Produ Social Protection Gender Equality Inclusive Growth Missing Middle Technological Readiness Innovation Medium Technology Emerging Lower Middle Class Health Education Labor Productivity Social Protection Gender Equality Inclusive Growth Missing Middle Technological Readiness Inclusive Growth Medium Technology Emerging Lower Middle Class Health Education Labor Productivity Social Protection Gender Equality Inclusive Growth Missing Middle Technological Readiness Innovation Medium Technology Emerging Lower Middle Class Health Education Labor Productivity Social Protection Gender Equality Inclusive Growth Missing Middle
Health Education Labor Productivity Social Protection Gender Equality Inclusive Gr Missing Middle Technological Readiness Innovation Medium Technology Emerging Lower Middle Class Health Education Labor Productivity Social Protection Gender Equality Inclusive Growth Missing Middle Health Technological Innovation Medium Technology Emerging Lower Middle Health Education Labor Productivity
Social Protection Gender Equality Inclusive Growth Missing Middle Technological Readiness Innovation Medium Technology Emerging Lower Middle Class Health Education Labor Productivity Social Protection Gender Equality Inclusive Growth Missing Middle Technological Readiness Inclusive Growth Medium Technology Emerging Lower Middle Class Health Education Labor Productivity Social Protection Gender Equality Inclusive Growth Missing Middle Technological Readiness Innovation Medium Technology Emerging

l VIET NAM HUMAN DEVELOPMENT REPORT 201510
Human development identifies a wider and more sophisticated set of needs. It expresses well-being in terms of individuals having the freedom to make positive choices and realize their full potential. In the 1980s and early 1990s, human development’s policy relevance was amplified by the poor performance and adverse impacts of structural adjustment policies.
Inclusive growth moves centre stage
In recent years, the concept of inclusive growth has emerged. It moves beyond the limitations of its predecessor—pro-poor growth, which targets lower-income groups. While pro-poor growth has resulted in impressive rates of poverty reduction, particularly in Asia, its narrow focus failed to achieve ‘shared’ prosperity. In the era of globalization, growth patterns have favoured owners of capital and skilled workers, and this has tended to deepen inequalities. Those who used to be poor moved up the ladder, but mainly to a highly vulnerable middle-income group, which suffered heavily in the wake of the 2008 financial crisis.
Inclusive growth gained traction after the crisis, both in highlighting issues of economic justice and framing new growth strategies (see Boxes 1.2 and 1.3). It emphasizes that not only is the level of growth important, but also its “quality”. Inclusive growth calls for all population groups to have equal opportunities as well as the ability to translate those into meaningful outcomes—such as higher incomes and standards of living. In short, inclusive growth brings equality back to the policy agenda.
While pro-poor growth focused on improving the incomes of the poorest groups, inclusive growth views the poor and non-poor - alongside others - as full participants in the economy who create and shape economic growth, going beyond simply sharing its benefits. It thereby ‘investigates inclusiveness at the core of how growth is created, of investment, business and employment, and economic institutions and policies.’ (IDRC, 2013, p.1). It focuses not only on the poor or near
poor, but crucially on middle-income groups as well, viewing the reduction of inequalities as a policy objective in itself.
Human development and inclusive growth concepts largely evolved independently of each other, both put people at the centre of development. Both are concerned with the process and outcomes of economic growth in particular and development in general. The emphasis of inclusive growth on people as active agents in shaping and creating growth is similar to the concept of human agency in human development.
Like human development, inclusive growth goes beyond income to include non-monetary dimensions of well-being, such as lack of access to social services, gender-related disparities, and shortfalls linked to location, ethnicity or religious denomination, among other issues. Inclusive growth depends on inequality declining in all dimensions of human well-being, however. (Klasen, 2010). This report defines growth as inclusive when its rate is maximized, it promotes participation and benefit sharing, and it either maintains or improves equity in outcomes and opportunities.
From a human development perspective, growth needs to enhance people’s capabilities and expand their opportunities. Links between participation in economic activity, specifically through productive employment, and shared economic benefits are particularly important. A further consideration is the extent to which people participate in development decisions, public budget choices and oversight of public services.
At the same time, to achieve human development—the expansion of people’s freedoms to exercise choices to live long, healthy and creative lives, to advance other goals they have reason to value, and to engage in shaping development equitably and sustainably on a shared planet (ibid)—more than inclusive and sustainable growth is needed. At the core of human development is the personal freedom to choose, which requires political space and respect for human rights.
Inclusive Growth and Human Development l 11
Box 1.2: Emerging economies make inclusion a priority
Inclusion has long been part of the policy agenda in many industrialized countries, particularly those following a social market or welfare state approach. Recently, emerging economies have taken up the issue as a response to growing inequalities and perceptions of political risk (IDRC, p.2). The so-called ‘Arab Spring’ focused attention on inclusiveness, with a particular concern for youth unemployment.
While policy choices vary, inclusive growth is typically achieved by modifying economic activity to attain full employment and boost labour productivity, improving public services, and actively assisting those who are poor and vulnerable. The focus is on enabling rather than merely redistributing—offering a hand up rather than a hand out.
Examples of developing countries adopting inclusive growth policies include:
India’s 11th Five-Year Plan (2007-2012)—entitled “Inclusive Growth”—suggested concrete strategies to support “not just faster growth but…equality of opportunity for all.”
China aims to address disparities and achieve a ”harmonious society”.
Malaysia’s 2011-2015 Development Plan focuses on equitable economic participation with specific emphasis on improving livelihoods among the poorer 40 percent of households.
Thailand’s 2012-2016 Development Strategy is based on people-centered development, with a vision of equity, fairness and resilience.
Sources: IDRC 2013, ADB 2012b and OECD 2014c
Box 1.3: Defining inclusive growth
Definitions of inclusive growth vary, although certain commonalties stand out. These form the basis of the definition and measurement framework adopted in this report.
UNDP defines inclusive growth as both an outcome and a process. It ensures that everyone can participate in the growth process, both in terms of decision-making to organize the progression of growth, and in growth itself. It also makes sure that everyone equitably shares the benefits of growth and that all people are able to participate. Participation without benefit-sharing will make growth unjust. Sharing benefits without participation will lead to a welfare economy (UNDP International Policy Centre for Inclusive Growth).
The Asian Development Bank refers to inclusive growth as “raising the pace of growth and enlarging the size of the economy, while levelling the playing field for investment and increasing productive employment opportunities, as well as ensuring fair access to them. It allows every section of the society to participate in and contribute to the growth process equally, irrespective of their circumstances.” (ADB 2012b p.4).
The Organisation for Economic Co-operation and Development (OECD) defines inclusive growth in broad terms, encompassing not only fair distribution of income growth, but also shared progress in other non-income dimensions of well-being. As such, inclusive growth refers to the pace and distribution of economic growth (OECD 2014c, p. 49).
l VIET NAM HUMAN DEVELOPMENT REPORT 201512
1.1.1. Why inclusiveness matters?
Inclusiveness matters for social, economic and political reasons. Over the last 10 to 15 years, there has been a shift in thinking from viewing inequality as either mildly positive for growth or as an inevitable outcome, to seeing it as a drag on national economic performance. Policymakers increasingly talk about inclusive growth as central to economic development, (ibid) well beyond ethical justifications of equity and fairness.
The Global Thematic Consultations on the Post-2015 Development Agenda on Addressing Inequalities highlighted that:
”Inequalities are not just problems for the people whose lives are most directly affected – those most disadvantaged and excluded. They have deep consequences for everyone in society. Inequalities harm us all. Among these consequences are: reductions in the pace and sustainability of growth; diminishment of the productive potential of all who are harmed and excluded, and the loss of this potential to society; the worsening of existing fragilities and vulnerabilities, including to conflict and disasters; and the weakening of social cohesion and of security for all.” (UNICEF/UNWOMEN, 2013)
A diverse body of work on inequality’s negative social impacts supports this finding.
For the World Bank, inclusive growth is a necessary condition for poverty reduction and requires a long-term perspective. It should be broad-based, across sectors, and put economic diversification at the forefront. Growth should include a large part of the country’s labour force, where inclusiveness refers to equality of opportunity in access to markets and resources, and an unbiased regulatory environment for businesses and individuals. How growth is generated is critical for accelerating poverty reduction, and strategies must be tailored to country-specific circumstances. Since inclusive growth emphasizes productive employment rather than income redistribution, the focus is not only on employment growth, but also on productivity growth. Inclusive growth is typically fuelled by market-driven sources, with the government playing a facilitating role (World Bank, 2009).
Box 1.4: How do people see inclusive growth in Viet Nam?
More than 400 Vietnamese citizens in seven provinces were consulted in a small-scale survey. They stressed the importance of:
● Opportunities for better jobs and income (emphasizing better opportunities than what they already had) and thus better opportunities for social mobility (joining higher and more secure income groups).
● Better education (particularly access to quality education) as the foundation for children’s better job opportunities and thus life in the future (also the importance of social mobility).
● Social protection (especially formal social protection given the limited ability of informal safety nets to protect against bigger and more prolonged shocks) to enhance resilience to risks and prevent people from falling back into poverty and/or to sustain/further progress in their livelihoods.
Source: Small-Scale Survey on People’s Perceptions of Inclusive Growth, qualitative survey – background paper for NHDR (CAF, 2014) and 2010 Rapid Impact Assessment (CAF 2010).
Inclusive Growth and Human Development l 13
Examples range from Picket and Wilkinson’s (Picket et al, 2010) global best-selling book the Spirit Level, which traced a causal link between inequality and negative impacts as diverse as a lack of social trust to accelerating obesity, to detailed studies on the links between inequality and violent crime (Madden and Chiu, 1998), and between inequality and civil unrest (Madden and Dutta, 2014).
Inequality has negative consequences for poverty reduction in the short and long term. In the short run, skewed income distribution locks in poverty of opportunity, and blunts the impact of growth on the incomes of the poor. In the longer term, inherent instabilities associated with high inequality accentuate vulnerability, which is especially damaging for the poor. As Nobel Laureate Joseph Sitglitz makes clear (UNDP, 2014a, p. 14):
“Inequality causes instability, increasing the frequency of big swings in the economy. Extremes of inequality mean that larger fractions of the population are in poverty – with a lower ability to cope with shocks when they occur. Extremes of economic inequality inevitably lead to political inequality – with the result that governments are less likely to provide the systems of social protection that can protect those at the bottom from the consequences of large shocks. We need to think of inequality not just as a moral issue – which it is – but also as a fundamental economic concern, integral to thinking about human development, and especially relevant to any analysis of vulnerability.”
Restricted social mobility results when poor and middle-income groups are less able to invest in human capital, which can perpetuate poverty over generations. Intergenerational mobility is higher in countries with lower inequality. High income inequality means that people tend to be concentrated in bottom and top income groups. Policymakers tend also to focus on these two groups, neglecting the middle (the ‘missing middle’).
The middle class is critical for broad-based growth and stability. While Viet Nam has not experienced punishing levels of inequality,
there is a ‘missing middle’. This group largely comprises informal sector workers, whose incomes are not sufficient for their families to be resilient to shocks, who face difficulties in accessing decent jobs, health and education services and social protection, but are not considered poor, and hence do not qualify for social assistance and fee exemptions. This large and key group lacks the full range of opportunities to improve their lives.(UNDP, 2014b and ADB, 2012a).
There are two channels through which inequality reduces economic performance. First, inequality disrupts capital markets. It raises the cost and restricts the supply of capital. This leads to the poor allocation of funds, often favouring speculative over productive activities. The resulting limits on the expansion of productive capacity and entrepreneurship have pronounced and self-reinforcing effects on people in middle and lower income categories, weakening employment productive opportunities, stifling smaller enterprises and reducing investment in education.
Second, unequal societies tend to be politically dysfunctional and lack social cohesion as elites exercise power primarily for their own benefit. Where demands for redistribution emerge, the political process may favour short-term, populist policies (Nissanke and Thorbecke, 2006). Disputes are more frequent and intense, and instability is high. These societies tend to tax more and property rights are less secure - both of these factors discourage investment (Alesina and Rodrik, 1994). Formal institutions also tend to be less effective.
Some distinction has been made between constructive and destructive inequalities. Income differences, for instance, can be judged as equitable if they are driven by effort and people have similar opportunities, or not, if they are generated by barriers such as gender and ethnic discrimination that privilege some people over others (Nancy Birdsall, 2006). Below a certain threshold, ‘good inequality’ can encourage individual effort and competition. After the threshold, ‘bad inequality’ takes
l VIET NAM HUMAN DEVELOPMENT REPORT 201514
over, where the wealthy and powerful enjoy undue influence. This distorts policymaking, undermines democracy and growth, and may foment instability. For most developing countries, where markets and institutions are too weak to moderate extremes, inequality is likely to be mostly destructive.
Yet the notion of “positive inequality” has also been challenged (see Box 1.5). Overall, studies suggest that the impact of income inequalities is invariably negative and statistically significant. One found that a 1 percent increase in inequality lowers gross domestic product (GDP) by 0.6 to 1.1 percent (OECD 2014a, p. 77). High, persistent and long-term inequality diminishes returns to investment, and the accumulation of human, physical and social capital (Berg and Ostry, 2011).
Societies respond in diverse ways to different types of inequality. One study in
China has shown that higher levels of income inequality are perceived as acceptable as long as they are not associated with the abuse of power and corruption. (Whyte, 2010). In a recent qualitative study jointly conducted by the World Bank and Viet Nam’s Institute of Labour and Social Affairs on the Vietnamese people’s perceptions of inequality, respondents stressed that the acceptability of unequal outcomes depends more on how the inequality is generated than on the level of disparity. The majority of respondents thought that disparities between rich and poor were driven in part by positive factors, notably talent and hard work. They also raised concerns about ‘connections’, corruption, misuse of power and dishonest business practices as means for some people to get rich. (World Bank, 2014a; World Bank 2014b, p228). See annex 3 for more on the relationship between economic growth and inequality.
Box 1.5: Making the connection: equal opportunities and equal outcomes
Development policy debates have often advocated equal opportunities over equal outcomes. Creating equal opportunities for all, however, may lose track of the fact that people often lack capabilities to take advantage of opportunities. For a poor child in a remote village, free education, an important part of equal opportunities, may be meaningless if the way to school remains unsafe or if her/his family depends on her/his labour.
Growing evidence suggests that equal opportunities and outcomes are “two sides of the same coin” (UNDP, 2014b). Without equal opportunities, equal outcomes are unlikely, and vice versa. Although redistributive policies have often been criticized for stifling individual effort and innovation (cited necessary to drive competition and progress) more egalitarian countries tend to have higher, more sustainable rates of growth.
A focus primarily on equalizing opportunities may underestimate what is required to translate these into equitable outcomes in market economies. By contrast, emphasizing the underlying structural drivers of inequality can connect opportunities and outcomes, showing how these are the result of policy choices, such as investing in health care and education, as well as entrenched patterns of discrimination and social exclusion.
In September 2015, UN Member States formally adopted Agenda 2030 and the Sustainable Development Goals, which recognize that tackling inequalities is central to development. A stand-alone SDG on inequality represents an important milestone that could open the door to bolder policy commitments and actions, moving the development discourse beyond outcomes versus opportunities.
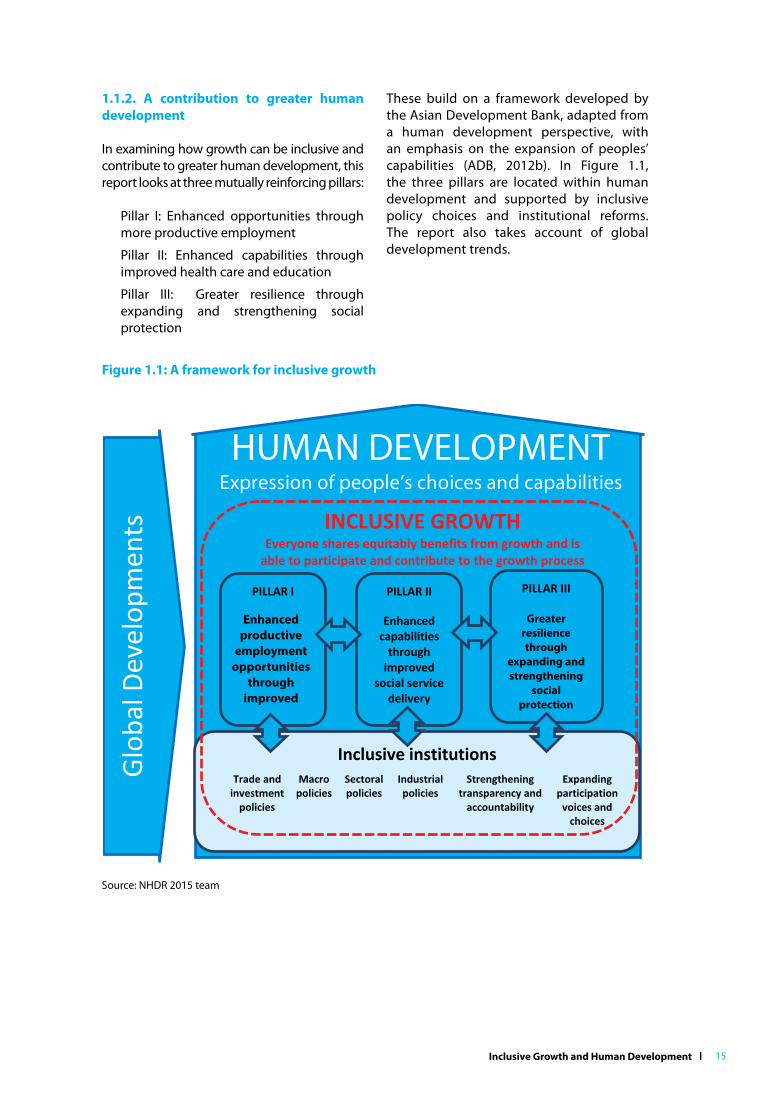
Inclusive Growth and Human Development l 15
1.1.2. A contribution to greater human development
In examining how growth can be inclusive and contribute to greater human development, this report looks at three mutually reinforcing pillars:
Pillar I: Enhanced opportunities through more productive employment
Pillar II: Enhanced capabilities through improved health care and education
Pillar III: Greater resilience through expanding and strengthening social protection
These build on a framework developed by the Asian Development Bank, adapted from a human development perspective, with an emphasis on the expansion of peoples’ capabilities (ADB, 2012b). In Figure 1.1, the three pillars are located within human development and supported by inclusive policy choices and institutional reforms. The report also takes account of global development trends.
Figure 1.1: A framework for inclusive growth
Source: NHDR 2015 team

l VIET NAM HUMAN DEVELOPMENT REPORT 201516
The report highlights the importance of economic and social sustainability to maintain the course of development and enhance the resilience of people and economies. A more in-depth discussion of environmental sustainability, critical to equity between generations is beyond the scope of this report, but is a likely subject of a later NHDR. Nevertheless, inclusive growth is likely to be greener and more environmentally sustainable, such as through efficient resource allocation and use, and the upgrading of technology.
Each of the three pillars is summarized here, and further elaborated in later chapters.
Pillar I: Enhanced opportunities through productive employment
Participation in economic growth, for the vast majority of people, means securing work. This is central to family livelihoods and a host of human capabilities, and defines the inclusive growth agenda, which depends largely on effectively harnessing labour. Full employment has been a key contributor to Viet Nam’s strong economic and human development performance.
Employment opportunities need to be available for all members of the population. It is also important for jobs, over time, to become more productive and provide higher income, and for less productive jobs to disappear (World Bank, 2013). Typically, higher productivity jobs are characterized by better working conditions, which in turn support higher productivity. ‘Decent work,’ under the definition of the International Labour Organization (ILO, 1999), has two reinforcing aspects: increased productivity and value added, and allowing men and women to participate in economic growth under conditions of freedom, equity, security and human dignity.
Four main transitions mark the shift to higher productivity and the structure of a modern economy: from lower to higher productivity agriculture, from agriculture to non-farm informal employment, from non-farm informal to formal employment, and
from lower to higher productivity formal employment. These occur in series and in parallel and at different speeds.
Making agricultural jobs more productive, such as through the introduction of new technology, and creating off-farm opportunities remain important challenges. The transition from informal to formal employment is among Viet Nam’s greatest challenges, given the large share of the labour force still in informal employment. This requires putting in place modern labour market standards without discouraging job creation and formalization. The development of the medium-technology sector is of particular importance, while recognizing that shifting towards manufacturing alone is no longer sufficient for higher productivity. Many countries have reached the limits of manufacturing sector growth and have started to move towards higher value services. See annex 4 for more details on the importance of the medium-technology sector for inclusive growth.
Pillar II: Enhanced capabilities through improved health care and education
Facilitating access and take-up of education and health are vital for inclusive growth. While good education, health and nutrition are important objectives in themselves, they also equip people for productive employment, which in turn drives economic and social progress, and human well-being.
Evidence shows that an extra year of schooling raises earning potential substantially, and that the earning premium reflects the higher productivity of workers. There is also strong evidence that education is more effective the earlier it starts (World Bank 2012b and OECD 2015). Adequate nutrition in early childhood improves productivity and incomes later in life, and boosts cognitive development (UNCTAD 2014), contributing to enhanced skills. Viet Nam has seen very strong progress in access to education and health, yet the quality of service delivery systems and the relevance of the education system in terms of market demands have failed to keep pace.
Inclusive Growth and Human Development l 17
Reforms in Viet Nam, notably the practice of socialization (transferring the costs of public services to users and communities) and autonomization (management decentralization) merit consideration. These are likely to have significant impacts on the efficiency and inclusiveness of health and education services. Positive impacts on resource mobilization need to be balanced against negative impacts on equity and inclusion.
Pillar III: Greater resilience through expanding and strengthening social protection
Expanding and strengthening social protection not only for the poor but also for the expanding ranks of the near poor and middle class is one of the main challenges for middle-income countries like Viet Nam. Advancing human development depends to a large extent on the effectiveness of broad measures to reduce vulnerability, and the level of preparedness and response when economic and environmental - or even family and personal - shocks occur.
Social protection helps make nations and people more productive, boosts human capital and unlocks latent potentials. It is a key input to inclusive growth, underpinning equality of opportunity and equitable development. It also contributes to longer term resilience.
Social protection boosts economic growth through three channels: helping households to manage risks and invest, especially the poor who often face severe risk constraints; stabilizing economies during downturns and transferring purchasing power to lagging areas, with multiplier effects; and fostering greater social cohesion. This report focuses primarily on social protection’s role in building productive capacities.
The 2014 global Human Development Report, Sustaining Human Progress: Reducing Vulnerabilities and Building Resilience, highlights the close link between reducing vulnerability and advancing human development. The report notes: “Real progress on human development… is not only a matter of enlarging people’s critical choices
and their ability to be educated, be healthy, have a reasonable standard of living and feel safe. It is also a matter of how secure these achievements are and whether conditions are sufficient for sustained human development” (UNDP 2014a).
1.1.3. Measuring and defining inclusive growth
The following chapters discuss the three pillars in reference to inclusive economic growth. Mindful of Viet Nam’s status as a middle-income country, and adopting a practical approach, the report defines growth as inclusive when:
- Growth is maximized across all income groups, all men and women, all social and ethnic groups, and all regions.- Citizens enjoy equality of opportunity and benefit from direct participation in the growth process, chiefly through high levels of employment and improved labour productivity. - The pattern of incomes is broadly equitable, protecting those at the bottom of income distribution, and the distribution of non-income dimensions of well-being (such as health and education) improves.
A quantitative framework for measuring inclusiveness is applied in Part 2 of this report. Since income growth can be inclusive in one way but non-inclusive in other ways, trends are measured through aggregate measures, as well as through those specific to each of the three pillars—employment, health care and education, and social protection.
This report assesses the aggregate level with a definition that emphasizes maximizing the level of growth while considering the extent of participation. Measuring progress in each of the pillars and the links between them allows for a better understanding of the drivers of inclusion.
Two analytical methods for measuring inclusiveness are used. The primary method is the inclusive growth framework offered by Anand et al (Anand et al, 2013), which uses an

l VIET NAM HUMAN DEVELOPMENT REPORT 201518
Table 1.1: Analytical indicators to gauge inclusion
Inclusive growth pillars Indicators
Promoting productive employment Employment/population ratio, unemployment rate, underemployment rate, rate of informal employment, rate of vulnerable employment; growth of GDP per worker at constant US$ 2005 purchasing power parity (PPP)
Enhancing capabilities through improved health care and education
Government expenditure on education as a percentage of total government expenditure; government expenditure on health as a percentage of total government expenditure; and gross enrolment rates at all levels of education (pre-school, primary, lower secondary, upper secondary and post-secondary)
Ensuring greater resilience through expanding and strengthening social protection
Coverage of the relevant population, level of benefits as a percentage of per capita GDP, government expenditure
Source: NHDR 2015 team
index comprising two components (i) change in average income and (ii) change in income distribution. The latter is scaled between 0 and 1, with 1 representing higher inclusiveness, when everyone in the society has the same share of total income. Drawing on welfare economics, this approach weights the incomes of the poor more strongly in welfare terms, and effectively allows for worsening inequality so long as higher levels of welfare growth compensate. The framework judges growth ‘inclusive’ if the absolute welfare level improves.
A second measure is the Growth Incidence Curve (provided in Ravallion and Chen, 2003), which plots the impact of growth at all levels of income. A more inclusive curve suggests an equitable change that favours a majority and those with lower incomes. This allows judgments to be made on the distributional impact of growth, noting that this report’s definition requires that growth is maximized across all income groups. Its pattern should not favour the rich over the poor.
Several analytical indicators gauge inclusion, as summarized in Table 1.1.

Inclusive Growth and Human Development l 19
Viet Nam’s human development has improved at national, regional and provincial levels, but in recent years, the pace of improvement has slowed. Compared to many other countries in the region, progress has not been as rapid and appears to have leveled off since the 2008 global financial crisis. Viet Nam’s early promise has given way to a form of ‘stunted development’ in the post-crisis period. There is some evidence that while its relative performance has slowed for both human development and income, improvements in human development have declined more, reversing the long-term pattern. This reflects faltering progress in health and education, in addition to income. Multidimensional poverty is a serious challenge even in some areas not usually considered poor. Many of those considered near poor or middle class in terms of income do not qualify for special assistance, yet cannot afford basic entitlements such as health insurance.
While human development gaps among regions have narrowed, convergence halted and even reversed in some cases immediately after the crisis. Although the position has now improved, overall convergence has slowed considerably. At the provincial level, although there are some star performers and a smaller group of laggards, all provinces have made progress and the majority are clustered around the country average.
A series of human development statistical tools can be used to examine the state of human development in Viet Nam. These include the Human Development Index (HDI), the Gender Development Index (GDI), the Inequality-adjusted HDI (IHDI), the Gender Inequality Index (GII) and the Multidimensional Poverty Index (MPI) (see Box 1.6). This chapter charts these over time, compares Viet Nam’s performance with other countries in the region and examines progress at the subnational level, linking throughout to the theme of inclusive growth.1
Box 1.6: Measuring the state of human development
The first global Human Development Report in 1990 introduced the HDI, based on Amartya Sen’s conception of measuring development in terms of the expansion of key capabilities, rather than economic aggregates. Over time, the human development concept has gone through many iterations and changes, while holding to core measures of development, inequality and poverty. The HDI is a composite index assessing long-term progress in three basic dimensions of human development:
• A long and healthy life, measured by life expectancy at birth;
• Knowledge, measured by expected years of schooling and mean years of schooling; and
• A decent standard of living, measured by the logarithmic transformation of gross national income (GNI) per capita in US$ PPP$.
The HDI measures progress from minimal (0) to maximal performance (1). The calculation is
Chapter 1.2: Human development in Viet Nam today

l VIET NAM HUMAN DEVELOPMENT REPORT 201520
1.2.1. Once rapid, human development progress falters
Viet Nam’s HDI has risen continuously over the past 24 years. In 2014, the country ranked 116th out of 188 countries; it is at the upper end of the medium human development category. Improvement has been uneven, however. Between 1980 and 1990, the HDI rose on average a weak 0.26 percent per year, then accelerated to 1.92 percent per year between 1990 and 2000, before slowing to 1.33 percent per year between 2000-2008 and further to 0.69 percent per year since 2008 (Figure 1.2). The rate of improvement was an annualized 1.07 percent between 1980 and 2014, lower than the medium human development average of 1.23 percent, and the East Asia-Pacific average
of 1.29 percent. Viet Nam’s slowing progress in the last decade pulled its formerly rapid human development advancements behind those of many other countries at similar level of development.
In 1980, Viet Nam’s HDI value was just above the East Asia-Pacific regional and the medium human development group averages. By 1990, Viet Nam was clearly lagging behind in the region, by 8.5 percent. The difference narrowed to 4.7 percent in 2008, but by 2014, had widened again to 10.2 percent. While this is partly a result of China’s exceptional performance—rising from an HDI value of 0.43 (below Viet Nam) in 1980 to 0.727 (just below the Republic of Korea and Malaysia) by 2014—it is also a result of the better performance of countries similar to Viet Nam. Notably, Indonesia and Thailand, which
based on a revised method introduced by the 2010 global Human Development Report. Due to data limitations, the new methodology is only calculated at the national level for this report, and employed in country level comparisons.
The HDI based on its original methodology has been calculated for 1999 to 2012 for the whole country, by geographic region and by province, to allow for subnational analysis. In the old methodology, the knowledge component is measured by the combined gross enrolment rate and adult literacy rate, and the standard of living component by GDP per capita.
The IHDI adjusts the HDI value for inequalities in the three basic dimensions of human development. It is only calculated globally.
The GII, which has replaced the GDI in the global Human Development Report, measures inequality in achievement between women and men in three dimensions:
• Reproductive health, measured by the maternal mortality ratio and adolescent birth rate;
• Empowerment, measured by the share of seats in parliament and the population with at least a secondary education; and
• Labour market participation.
For this report, again due to data limitations, the GII has only been calculated for the national level for 2010 and 2012. The (former) GDI serves as a surrogate measure for subnational calculations. Its standard of living component is derived from the ratio of female to male wages, female and male shares of the economically active population and GDP.
The MPI has two components: a headcount and an intensity measure of multidimensional poverty. It comprises three dimensions—health, education and living standards. Viet Nam has developed its own variant which we make use of within our analysis. This is based on five dimensions: education, health, housing, hygienic drinking water/sanitation and access to information.
Further details on each index can be found in the Annex 1. Source: UNDP 2014a.
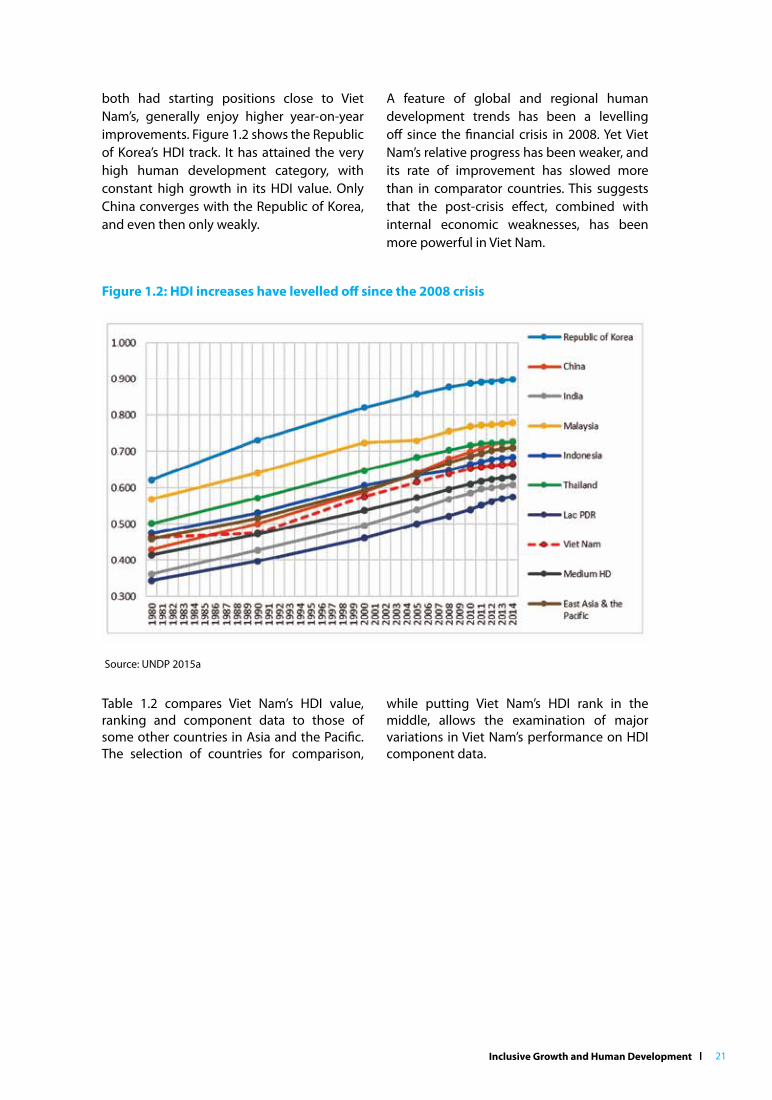
Inclusive Growth and Human Development l 21
Table 1.2 compares Viet Nam’s HDI value, ranking and component data to those of some other countries in Asia and the Pacific. The selection of countries for comparison,
while putting Viet Nam’s HDI rank in the middle, allows the examination of major variations in Viet Nam’s performance on HDI component data.
both had starting positions close to Viet Nam’s, generally enjoy higher year-on-year improvements. Figure 1.2 shows the Republic of Korea’s HDI track. It has attained the very high human development category, with constant high growth in its HDI value. Only China converges with the Republic of Korea, and even then only weakly.
A feature of global and regional human development trends has been a levelling off since the financial crisis in 2008. Yet Viet Nam’s relative progress has been weaker, and its rate of improvement has slowed more than in comparator countries. This suggests that the post-crisis effect, combined with internal economic weaknesses, has been more powerful in Viet Nam.
Figure 1.2: HDI increases have levelled off since the 2008 crisis
Source: UNDP 2015a

l VIET NAM HUMAN DEVELOPMENT REPORT 201522
Referring first to the education component of the HDI, expected years of schooling in Viet Nam are comparable to the average of the medium human development countries and countries selected for comparison, and increased from 8.6 years in 1990 to 11.9 years in 2014. Mean years of schooling in Viet Nam are similar to the average of East Asia and the Pacific, higher than in medium human development countries, and in the middle of the group of countries selected for comparison.2
As Figure 1.3 reveals, Viet Nam’s education value was close to Malaysia’s and slightly better than China’s and Indonesia’s in 1980. It declined during its initial transition from central planning until 1990, and although picking up again since then, Viet Nam has never been able to close the gap with comparator countries with a similar starting point, including China, Indonesia, Malaysia and Thailand.
Table 1.2 Where does Viet Nam stand compared to other Asian countries?
Country HDIcountry ranking
HDI Life expectancy at birth (years)
Mean years of schooling
Expected years of schooling
GNI per capita (2011 PPP $)
2014 2014 2014 2014 2014
China 90 0.727 75.8 7.5 13.1 12,547
India 130 0.609 68 5.4 11.7 5,497
Indonesia 110 0.684 68.9 7.6 13.0 9,788
Lao People’s Democratic Republic
141 0.575 66.2 5.0 10.6 4,680
Malaysia 62 0.779 74.7 10.0 12.7 22,762
Philippines 115 0.668 68.2 8.9 11.3 7,915
Republic of Korea 17 0.898 81.9 11.9 16.9 33,890
Thailand 93 0.726 74.4 7.3 13.5 13,323
Viet Nam 116 0.666 75.8 7.5 11.9 5,092
Medium human development
0.630 68.6 6.2 11.8 6,353
East Asia and the Pacific
0.710 74.0 7.5 12.7 11,449
World 0.711 71.5 7.9 12.2 14,301
Source: UNDP 2015a
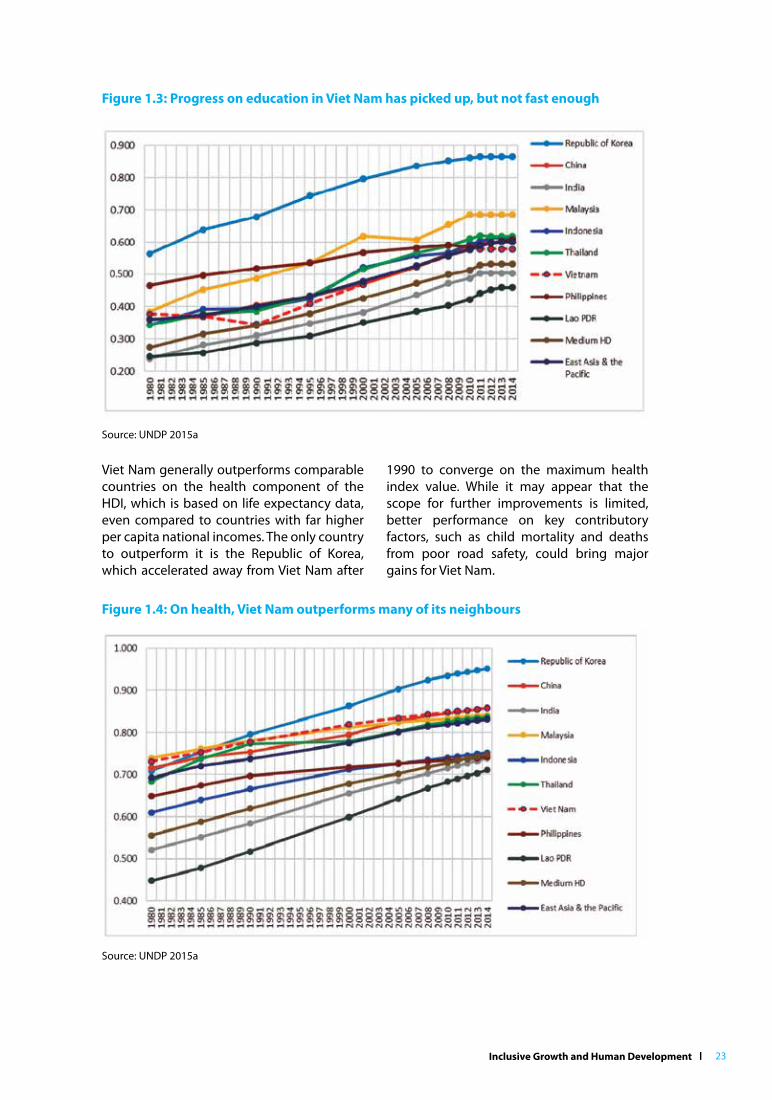
Inclusive Growth and Human Development l 23
Viet Nam generally outperforms comparable countries on the health component of the HDI, which is based on life expectancy data, even compared to countries with far higher per capita national incomes. The only country to outperform it is the Republic of Korea, which accelerated away from Viet Nam after
1990 to converge on the maximum health index value. While it may appear that the scope for further improvements is limited, better performance on key contributory factors, such as child mortality and deaths from poor road safety, could bring major gains for Viet Nam.
Figure 1.3: Progress on education in Viet Nam has picked up, but not fast enough
Source: UNDP 2015a
Figure 1.4: On health, Viet Nam outperforms many of its neighbours
Source: UNDP 2015a

l VIET NAM HUMAN DEVELOPMENT REPORT 201524
A more thorough analysis of education and health sector outcomes and a discussion of what has driven progress in these areas, as well as the relationship between education, income and productive employment growth, can be found in later chapters.
With regard to the income component of the HDI, Viet Nam’s annual per capita GNI grew on average by 6.4 percent between 1990 and 2000, faster than other countries in the region, except China; growth remained at 5.3 percent from 2000 to 2008. This solid progress contributed to Viet Nam becoming a lower middle-income country. But from 2008 onwards, growth has been below the
The impact of GNI per capita trends on HDI performance (illustrated in Figure 1.2 on HDI trends) is rather technical. The calculation of the GNI index for generating the HDI is made using a logarithmic transformation applied to GNI data within the formula—adopted to reflect the declining welfare value of income at higher levels of development (see Annex
1). The effect is to compress the results, particularly for higher income countries. Figure 1.6 charts the GNI index and clearly shows that Viet Nam’s has improved over time. Its performance gap against comparator countries is therefore reduced (also seen in Figure 1.6).
East Asia and the Pacific regional average at 4.3 percent versus 6.8 percent. Per capita GNI in Viet Nam remains generally lower than in the comparator group.
Among countries with a similar starting point, however, only China clearly outperforms Viet Nam. Starting at a lower level in 1980, China’s fast progress resulted in its GNI per capita (US $12,547 PPP) being more than double Viet Nam’s (US $5,092 PPP) in 2014. India matches Viet Nam’s post-1980 performance. Except for India and Lao People’s Democratic Republic, other countries within the comparator group have also seen a levelling off following the 2008 financial crisis (Figure 1.5).
Figure 1.5: Viet Nam’s per capita income performance (adjusted for purchasing power) now lags the regional average
Source: UNDP 2015a

Inclusive Growth and Human Development l 25
Box 1.7: What drives rising HDI scores?
In Viet Nam, improvements in education have contributed most to HDI growth in recent years, with an overall contribution of around 43.1 percent between 2000 and 2014. This is followed by income at 40.3 percent and life expectancy at 16.7 percent. The table below shows that this was almost opposite to the case in China, and somewhat out of synch with other countries. Income’s relative contribution to HDI should be higher, considering Viet Nam’s stage of development. The HDI uses a logarithmic transformation that accentuates income changes at lower levels of development and compresses them for more developed countries.
Education contributes most to human development in Viet NamNew method of HDI calculation
Life expectancy share, percentage
Education share, percentage
Income (GNI) share, percentage
Viet Nam 16.67 43.06 40.27
China 17.40 36.24 46.37
India 26.89 36.64 36.48
Republic of Korea 38.10 29.58 32.32
Japan 36.04 45.09 18.87
High human development group 22.29 40.30 37.41
Medium human development group 26.83 38.86 34.31
Source: UNDP 2015a and UNDP Viet Nam calculation
Figure 1.6: In human development terms Viet Nam’s GNI performance is better
Source: UNDP 2015a

l VIET NAM HUMAN DEVELOPMENT REPORT 201526
Performance falls short of potential
Comparing HDI progress is difficult, especially when there are only limited choices of comparators with similar starting points and/or conditions. The 2010 global Human Development Report introduced and applied a ‘deviation from fit’ approach, which adjusts results for variations in circumstances, most notably development levels. Greater ‘deviation from fit’ indicates performance above what might be expected for a country’s development level and vice versa (see Annex 2 for more details).
This National Human Development Report applies the ‘deviation from fit’ measure for HDI and GNI growth over three sub-periods since 1980. The selection of these periods was informed by major defining events—the Doi Moi reforms in the late 1980s, Viet Nam’s rapid expansion post-2000 and the global financial crisis in 2008. The report made use
of the full global sample of over 100 countries to calculate the expected values. Given the approximate nature of the analysis, however, the report presents the ‘deviation from fit’ as a ranking of 11 selected Asian comparator countries (Viet Nam plus 10). ‘Deviation from fit’ represents a performance level against what might be expected for a country’s development level.
The results are provided in Table 1.3, showing that Viet Nam overall performed exceptionally in the first period, and above expectation. Its position was still very strong (surpassed only by China and India) in the second period. In the third period, however, performance on both income and the HDI was lackluster; Viet Nam performed significantly below others on the HDI, and was only mid-level on income growth. Overall, its ranking relative to comparator countries generally declined for both the HDI and income ‘deviation from fit’ measures.
Life expectancy is already high, and, as expected, its contribution to HDI change is now relatively low. Life expectancy in Viet Nam has increased over the past decade from 68.2 to 75.8 years in 2014. This is partly a reflection of falling child mortality rates and increasing access to health care. The infant mortality rate fell from 44.4 per 1,000 live births in 1990 to 15.5 in 2011, and the under-five mortality rate from 58 per 1,000 live births in 1990 to 23.3 in 2011 (GOVN, 2015). Nevertheless, further improvements are possible, as data for the Republic of Korea (which leapfrogged Viet Nam in the mid-1980s) show, even on a high base.
Source: UNDP 2015a

Inclusive Growth and Human Development l 27
A comparison of Viet Nam’s ranking on HDI and GNI growth by the ‘deviation from fit’ measure implies that during the first period Viet Nam performed slightly better on education and life expectancy than countries with similar per capita income levels—alternatively, that it was better able to translate growth into well-being. Yet by the final post-2008 period, this position had reversed, with it performing better on growth than HDI relative to others.
This changing pattern is also reflected if we make more traditional comparisons
of differences in HDI and GNI rankings in successive Human Development Reports. Although Viet Nam still records higher HDI rankings over income, the differences in rankings have generally been narrowing (as shown by Table 1.4). This progressive shrinking suggests that Viet Nam’s rate of improvement in its non-income components has been less than improvement in its income component, although this trend has reversed in 2014. Given data problems and different methods used in HDI calculation, differences in HDI and GNI rankings require careful interpretation.
Table 1.3: Using a ‘Deviation from Fit’ method, Viet Nam has fallen behind on both the HDI and the income index
1990-2000 2000-2008 2008-2014
Ranking HDI Income HDI Income HDI Income
1 Viet Nam China China China Lao PDR China
2 China Viet Nam India India China India
3 Indonesia Korea Viet Nam Viet Nam Singapore Lao PDR
4 Singapore India Korea Lao PDR India Indonesia
5 Thailand Lao PDR Singapore Indonesia Indonesia Singapore
6 India Malaysia Thailand Korea Korea Viet Nam
7 Malaysia Thailand Lao PDR Malaysia Malaysia Korea
8 Lao PDR Singapore Indonesia Thailand Viet Nam Malaysia
9Republic of
Korea Philippines Malaysia Philippines Thailand Philippines
10 Philippines Indonesia Japan Singapore Japan Thailand
11 Japan Japan Philippines Japan Philippines Japan
Source: UNDP 2015a and UNDP Viet Nam calculation.
Table 1.4: Differences between Viet Nam’s income and HDI rankings have been closing
Years 2000 2001 2002 2003 2004 2005 2006 2007/08 2009 2010 2011 2012 2013 2014
Ranking difference
24 19 19 21 12 16 12 18 13 7 8 9 7 15
Sources: UNDP, Global Human Development Reports from 2000 to 2015.

l VIET NAM HUMAN DEVELOPMENT REPORT 201528
1.2.2. Few losses due to inequality
Many countries in East Asia and the Pacific have achieved remarkable economic growth and poverty reduction, but often accompanied by rising inequalities. On the basis of aggregate data, Viet Nam has managed to achieve relatively rapid progress in economic growth without significant increases in inequality. This is confirmed by data applying several standard inequality measures, including the IHDI (Table 1.5). Calculated for 2014, Viet Nam’s IHDI yields a value of 0.549—equivalent to a loss of 17.5 percent on the HDI due to inequality. While the loss due to inequality in life expectancy at birth is relatively low at 12.1 percent, the loss
due to inequalities in education and income are 18 percent and 22 percent, respectively. The difference between Viet Nam’s rank on the IHDI from its HDI rank is nine places, an improvement from 2013.
The pattern of a relatively low increase in inequality in Viet Nam is also seen in other standard measures in Table 1.5. These may present an incomplete account, however. Aggregate measures tend to mask subnational disparities, notably between rural and urban areas, and ethnic groups. Subsequent chapters in this report will provide a more nuanced picture and also examine the drivers of disparities in Viet Nam in greater detail.
Table 1.5. Inequality in Viet Nam remains relatively low
HDI IHDI Other income inequality measures
Country Value Overall loss (percentage)
Difference from HDI
rank
Quintile ratio
(2005-2013)
Palma ratio (2005-2013)
Gini coefficient
(2005-2013)
China 0.727 .. .. .. 10.1 2.1 37.0
India 0.609 0.435 28.6 1 5.0 1.4 33.6
Indonesia 0.684 0.559 18.2 6 5.7 1.5 38.1
Lao People’s Democratic Republic
0.575 0.428 25.6 7 5.8 1.6 36.2
Malaysia 0.779 .. .. .. 11.3 2.6 46.2
Philippines 0.668 0.547 18.1 7 8.4 2.2 43.0
Republic of Korea 0.898 0.751 16.4 -19 … … …
Thailand 0.726 0.576 20.6 1 6.9 1.8 39.4
Viet Nam 0.666 0.549 17.5 9 6.1 1.5 35.6
Medium human development
0.630 0.468 25.8 —
East Asia and the Pacific
0.710 0.572 19.4 —
World 0.711 0.548 22.8 —
Source: UNDP 2015a
Inclusive Growth and Human Development l 29
1.2.3. Good progress towards gender equality but concerns remain
On gender equality, as measured by the GII, Viet Nam also performs well. With a GII value of 0.308 (here a lower value reflects lower gender inequality), it ranked 60 out of 155 countries in 2014.3 Data for a group of comparator counties are provided in Table 1.6.
The GII components are based on a number of indicators, and the value derives from variations between the performance of men and women (for further details, see Annex 1). Viet Nam performs relatively well on the reproductive health component, with a better than average maternal mortality ratio and lower adolescent birth rates. On empowerment, 24.4 percent of parliamentary seats are held by women, higher than the
regional average of 18.7 percent, but lower than shares in Lao People’s Democratic Republic and the Philippines. In education, 59.4 percent of adult women have reached at least a secondary level compared to 71.2 percent of their male counterparts. Female participation in the labour market is high at 73 percent compared to 82.2 for men, while the regional average for women is 62.6 percent and for men 79.4 percent.
Similarly, national estimates for the old GDI, the GII’s predecessor, show no substantial gender disparities for both 2010 and 2012 data. The GDI measures differences between men and women on the HDI categories—life expectancy, education and income. Given data limitations, the GDI is used to analyse subnational variations later in this chapter.
Quintile ratio: ratio of the average income of the richest 20 percent of the population to the average income of the poorest 20 percent of the population.
Palma ratio: ratio of the richest 10 percent of the population’s share of GNI divided by the poorest 40 percent’s share. Palma (2011), who developed the Palma ratio, found that the middle class generally accounts for about half of GNI in a country with the other half split between the richest 10 percent and the poorest 40 percent, though their respective shares vary considerably across countries.
Gini coefficient: measure of deviation of the distribution of income among individuals or households within a country from a perfectly equal distribution. A value of 0 represents absolute equality, a value of 100 absolute inequality.

l VIET NAM HUMAN DEVELOPMENT REPORT 201530
While Viet Nam’s performance on gender equality and labour force participation compare relatively well, a more nuanced analysis shows that there are still many concerns. Women’s career paths are often interrupted due to care burdens, and few access advanced training or more senior level positions in the economy or government.
The national data over time are also less positive. Several sub-components of the GII have deteriorated between 2010 and 2012. The GII increased from 0.337 to 0.348, reflecting a higher loss in achievement due to gender inequality across its dimensions. Other global measures also suggest Viet Nam’s progress on gender equality has slowed compared to other countries. According to the Global Gender Gap Index of the World Economic Forum, Viet Nam ranked 42 out of 128 countries in 2007 but dropped to 76
out of 142 countries in 2014. Viet Nam scores well in some areas, ranking 41st in economic participation and opportunity, but 87th in political empowerment, 97th in educational attainment and 137th in health and survival. The very low health ranking is due to the striking differential in the female to male ratio at birth—0.89.
1.2.4. The subnational picture: Inconsistent progress
The following section examines subnational human development patterns and trends based on national data, so values for the human development indices are not consistent with national estimates provided above. Due to national data limitations, the report uses earlier specifications for the HDI as well as the GDI in place of the GII (see Annex 1 for further details).4
Table 1.6: Vietnamese women are relatively healthy and educated, and active in the labour force
Country GII Maternal mortality
ratio(deaths per 100,000 live
births)
Adolescent birth rate(births per
1,000 women aged 15-19)
Share of seats
in parliament(percentage
held by women)
Population with at least some secondary
education(percentage aged 25
and above)
Labour force participation rate(percentage aged
15 and above)
Value Rank Female Male Female Male
2014 2014 2013 2010/2015 2014 2005-2014 2005-2014 2013 2013
China 0.191 40 32 8.6 23.6 58.7 71.9 63.9 78.3
India 0.563 130 190 32.8 12.2 27.0 56.6 27.0 79.9
Indonesia 0.494 110 190 48.3 17.1 39.9 49.2 51.4 84.2
Lao People’s Democratic Republic
… … ... 65.0 25.0 22.9 37.0 76.3 79.1
Malaysia 0.209 42 29 5.7 14.2 65.1 71.3 44.4 75.5
Philippines 0.420 89 120 46.8 27.1 65.9 63.7 51.1 79.7
Republic of Korea
0.125 23 27 2.2 16.3 77.0 89.1 50.1 72.1
Thailand 0.380 76 26 41.0 6.1 35.7 40.8 64.3 80.7
Viet Nam 0.308 60 49 29.0 24.3 59.4 71.2 73.0 82.2
Medium human development
0.506 — 168 43.4 18.8 34.8 55.3 37.5 79.8
East Asia and the Pacific
0.328 — 72 21.2 18.7 54.7 66.3 62.6 79.4
World 0.449 — 210 47.4 21.8 54.5 65.4 50.3 76.7
Source: UNDP 2015a.

Inclusive Growth and Human Development l 31
Regional data reveals significant differences in performance
Among Viet Nam’s regions, the HDI value increased from 0.650 to 0.752 between 1999 and 2012, equivalent to an annual growth rate of 1.13 percent. This can be desegregated into two distinct periods—before and after the onset of the global financial crisis. Between 1999 and 2008, there was an average annual growth rate of 1.23 percent, falling to 0.90 percent after 2008.
In spite of advances in all regions, and some convergence, significant differences remain in outcomes and rates of change. As shown in Table 1.7, among the six regions, the Northern Midlands and Mountain region has the lowest HDI values at 0.679, followed by the Central Highlands at 0.704. The South East region has the highest value at 0.811.
Table 1.7: How regions compared on human development in 2012
HDI value Life expectancy
(years)
Adult literacy rate (percentage 15 years and
above)
Gross enrolment
rate (percentage)
GDP per capita
(PPP US$)
Whole country 0.752 73.05 94.50 63.43 3,979.3
Northern Midlands and Mountain 0.679 70.29 88.80 58.27 1,939.7
Red River Delta 0.770 74.27 97.50 72.50 3,593.5
North Central and Central Coastal 0.730 72.41 94.30 62.79 2,890.7
Central Highlands 0.704 69.40 92.10 59.80 2,853.8
South East 0.811 75.69 96.90 63.55 8,020.5
Mekong River Delta 0.746 74.39 93.10 59.29 3,572.9
Note: The gross enrolment rate is the percentage of students at all levels of education from primary to tertiary level (excluding anti-illiteracy classes, supplementary classes and short-term vocational training courses) out of the population group aged 6-24 years old.
Source: GSO, 2015.
Figure 1.7 shows human development dynamics by region between 1999 and 2012. The Southeast has remained the best performing region overall. The pattern and ranking among other regions has varied, with two changes in rank taking place—the Mekong River Delta region overtook the Northern Central and Central Coastal region, and the Central Highlands left the Northern Midlands and Mountain Areas behind despite having similar starting points in 1999.
Evidence of regional convergence exists for the whole period between 1999 and
2012. But this has varied - the gap between regions narrowed from 1999, yet this trend halted after 2008, with the poorest three regions actually showing some evidence of divergence. The Northern Central and Central Coastal and Mekong River Delta regions appear to demonstrate the most sustainable improvements in the HDI for the entire period. The Northern Midlands and Mountain Areas remains the most challenged region. Except from 2006 to 2008, its growth rate has not improved compared to others. This is puzzling, as normally regions with a lower starting point enjoy catch-up advantages.

l VIET NAM HUMAN DEVELOPMENT REPORT 201532
Figure 1.8: Gaps relative to the leading South East region have levelled off1.00 = equity
Source: GSO, 2015.
Another way to track the level of convergence or divergence is to chart gaps between the lead and other regions. As Figure 1.8 illustrates, the relative gaps between the South East region, with the highest HDI, and other regions gradually narrowed between 1999 and 2008, but widened from 2008,
before levelling off in recent years. While the HDI in the South East was 1.28 times higher than in the Northern Midlands and Mountain Areas and Central Highlands regions in 1999, the gap declined to 1.14 and 1.12 times, respectively, in 2008, but then rose again to 1.20 and 1.15, respectively, four years later.
Figure 1.7: Gaps between regions narrowed—until 2008
Source: GSO, 2015
A similar pattern is seen for GDP per capita. The Central Highlands and Northern Central and Central Coastal regions, with a lower starting point, made the greatest progress between 1999 and 2012, with an annual growth rate of 4.11 percent and 3.92 percent,
respectively. Yet the South East still grew strongly, and tops the list with a GDP per capita at US $8,021 PPP in 2012. The ratio to the nearest region, the Red River Delta, only fell from 2.57 to 2.23.

Inclusive Growth and Human Development l 33
Explaining Viet Nam’s regional dynamics is difficult. While geographically isolated regions often cannot grow as fast as core areas where economic activity and investment are clustered, lower-ranking regions often enjoy catch-up advantages offered by untapped resources and far lower cost bases. There seems to have been some ‘catching-up’ effect given the higher growth rate in the HDI and GDP per capita achieved by the four lesser
All provinces are making progress, but rates of change vary
At the provincial level, all provinces show human development improvements between 1999, the first year with a provincial HDI calculation, and 2012, but there variations (see Annex 1 for provincial data). As is illustrated in Table 1.9, we use an adjusted version of country categorization used in the global Human Development Report (see Table 1.9) to draw out changes in HDI status. In 1999 and 2004, only Ba Ria Vung Tau was in the very high HDI group. In 2012, Ho Chi Minh City and Da Nang joined this group, defined among countries globally as having an HDI value above 0.8. Both moved up from the high HDI group in 2004, defined as having values above 0.75 but below 0.8. By 2012, Viet Nam had 14 cities and provinces in this category.
Equally impressive is the increase in the number of cities and provinces in the medium high HDI group, with values below 0.75 but higher than 0.7. The number was only 4 in 1999 and 7 in 2004, but reached 33 in 2012. As the result of this remarkable progress, most of Viet Nam’s cities and provinces, 50 out of 63, by 2012 were in the medium high group and above—a remarkable increase from only 6 and 10 in 1999 and 2004, respectively.
The numbers of provinces in the low HDI category, with values less than 0.5; the medium low HDI group, with values higher than 0.5 but less than 0.6; and the medium HDI group, with values lower than 0.7 but higher than 0.6, declined substantially. While 53 were in these categories in 2004, only 13 were in 2012. With Ha Giang having left the lowest group in 2004 and Lai Chau in 2012, Viet Nam had no provinces remaining there. These provinces
developed regions, particularly during the period from 1999 to 2008.
To examine gender differences, Table 1.8 shows HDI and GDI progress by region in each of the component indicators in recent years. Clearly, at both national and regional levels, the HDI and GDI are equal, suggesting that there are no significant disparities in human development between the two genders.
Table 1.8: There are no significant gender disparities among regions
2010 2012
HDI GDI Difference % HDI GDI Difference %
Overall 0.740 0.740 0 0.752 0.753 +0.01
Northern Midlands and Mountain
0.668 0.669 +0.01 +1 0.679 0.679 0
Red River Delta 0.759 0.759 0 0.770 0.771 +0.001 +1
North Central and Central Coastal
0.719 0.719 0 0.730 0.730 0
Central Highlands 0.689 0.690 -0.01 +1 0.704 0.705 +0.001 +1
South East 0.800 0.800 0 0.811 0.811 0
Mekong River Delta 0.729 0.729 0 0.746 0.746 0
Source: GSO, 2015
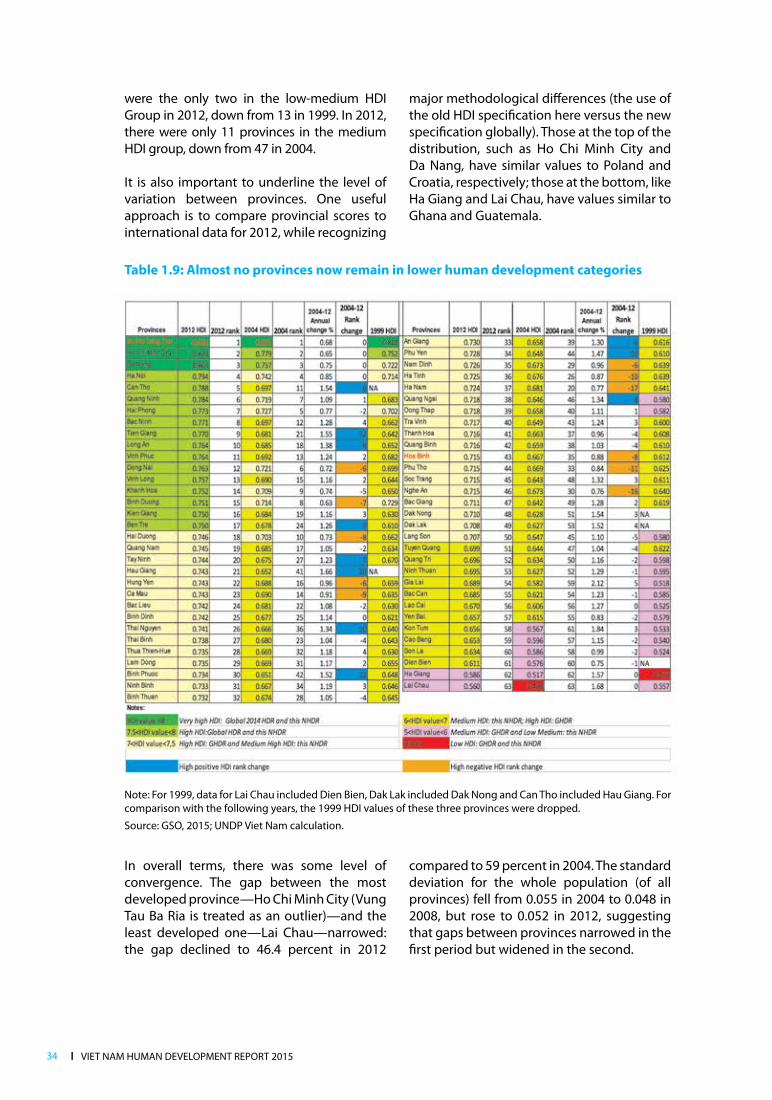
l VIET NAM HUMAN DEVELOPMENT REPORT 201534
were the only two in the low-medium HDI Group in 2012, down from 13 in 1999. In 2012, there were only 11 provinces in the medium HDI group, down from 47 in 2004.
It is also important to underline the level of variation between provinces. One useful approach is to compare provincial scores to international data for 2012, while recognizing
major methodological differences (the use of the old HDI specification here versus the new specification globally). Those at the top of the distribution, such as Ho Chi Minh City and Da Nang, have similar values to Poland and Croatia, respectively; those at the bottom, like Ha Giang and Lai Chau, have values similar to Ghana and Guatemala.
Table 1.9: Almost no provinces now remain in lower human development categories
Note: For 1999, data for Lai Chau included Dien Bien, Dak Lak included Dak Nong and Can Tho included Hau Giang. For comparison with the following years, the 1999 HDI values of these three provinces were dropped.
Source: GSO, 2015; UNDP Viet Nam calculation.
In overall terms, there was some level of convergence. The gap between the most developed province—Ho Chi Minh City (Vung Tau Ba Ria is treated as an outlier)—and the least developed one—Lai Chau—narrowed: the gap declined to 46.4 percent in 2012
compared to 59 percent in 2004. The standard deviation for the whole population (of all provinces) fell from 0.055 in 2004 to 0.048 in 2008, but rose to 0.052 in 2012, suggesting that gaps between provinces narrowed in the first period but widened in the second.
Inclusive Growth and Human Development l 35
While all provinces experienced improvement, their performance varied. Can Tho, Bac Ninh, Tien Giang, Long An, Vinh Phuc, Vinh Long, Kien Giang and Ben Tre showed outstanding performance. In 2012, they joined the medium high HDI group, while in 2004 they scored within the medium group. Tien Giang gained 12 ranks, followed by Long An at 8, Ben Tre at 7 and Can Tho at 6. Within the 2012 high HDI group, however, Binh Duong lost 7 ranks and Dong Nai 6 ranks by only achieving modest annual improvements in HDI values of 0.63 percent and 0.72 percent, respectively. Within the 2012 medium-high HDI group, Hau Giang set the record by gaining 20 ranks, with very high annual changes in HDI values of 1.66 percent between 2004 and 2012, followed by Binh Phuoc with a gain of 12 ranks, Thai Nguyen and Phu Yen at 10, Quang Ngai at 8, Tay Ninh at 7 and An Giang at 6. In this group, there were also decelerating provinces. Between 2004 and 2012, Ha Nam lost 17 ranks, followed by Nghe An with a loss of 16, Phu Tho a loss of 11, Ca Mau a loss of 9, Hoa Binh and Hai Duong a loss of 8 (noting that Hoa Binh’s income included that from hydropower and Hai Duong has remained in the medium-high HDI group since 2004), Ha Tinh a loss of 7, and Hung Yen and Nam Dinh a loss of 6.
In the medium and low-medium HDI groups, movements in rank were slightly downward, as the result of many other provinces moving into higher HDI groups. Only Gia Lai and Kon Tum gained, 5 and 3 ranks, respectively, between 2004 and 2012. The rest either retained their ranks or fell marginally. On the bright side, within these groups, Gia Lai had Viet Nam’s highest annual change in an HDI value of 2.12 percent. Kon Tum had the second highest at 1.84 percent. Ha Giang and Lai Chau, though remaining at the bottom of the table, had very impressive annual changes in HDI of 1.57 percent and 1.68 percent, respectively (Lai Chau had the third highest gain). This progress and the small gaps between their HDI values and the threshold of the medium HDI group indicate that these two provinces are catching up, and perhaps have already joined the medium HDI group.
In looking at what drives differences in provincial performance, at first glance, there is
a strong correlation between income and non-income indices, suggesting that both move together. Several trends can be discerned, however, by examining differences between provincial non-income and income rankings. A negative difference indicates that relative to other provinces, a particular province’s non-income index (its social performance) lags behind its income index; potentially stronger growth has not been translated into stronger social outcomes. A positive difference shows that the province’s income index lags behind its non-income index; suggesting either that growth has been weak or that social outcomes are exceptionally strong. Being close to zero means income and non-income indexes are relatively in balance (see Table 1.10).
The non-income index appears to lag behind the income index in the South West and Central Highlands provinces, but with some exceptions, implying that these provinces have weaker social outcomes than would be expected given their income scores. The income index lags in the Red River Delta and Northern Midlands provinces (except for Quang Ninh). This is in line with the findings of many other studies, including earlier National Human Development Reports, which have highlighted weaker economic growth and stronger social outcomes in these areas.
But the data also provide some surprises. In some provinces in the Mekong River Delta region, such as Tien Giang, Vinh Long, Dong Nai, Hau Giang, Ben Tre and Dong Thap, the non-income index ranking surpassed the income ranking. This shows a positive development in the region, which is often perceived as lagging behind on social indicators, such as for health and education. Non-income and income index rankings appear to be most ‘balanced’ in Ho Chi Minh City and Da Nang, two cities with the highest HDI values and ranking, suggesting balanced HDI progress. Among Ho Chi Minh City, Da Nang and Ha Noi, the three provinces with the highest HDI values, not including Ba Ria Vung Tau, Ho Chi Minh City performed better on income compared to Da Nang and Ha Noi, but performed less well in terms of non-income aspects.

l VIET NAM HUMAN DEVELOPMENT REPORT 201536
Balance in the income and non-income index rankings of Ha Giang and Lai Chau, two provinces with the lowest HDI values and rankings, as well as Son La, Dien Bien,
Yen Bai and other provinces mainly in the medium HDI group suggests that they faced difficulties in making greater progress in both income and non-income dimensions.
Table 1.10: Areas with high HDI values tend to do well on income and non-income rankings, 2012
Source: GSO, 2015, UNDP Viet Nam calculation
Differences in the non-income index values of provinces in Viet Nam are low, and can exaggerate real differences in values. Thus, differences between provinces’ income and non-income index rankings need to be interpreted with some caution.
Equally, all provinces have differing starting points, making their progress hard to compare. Changes in income and non-income components over time are unlikely to be linear, and localities have very different characteristics. These issues can be partly
addressed by using more sophisticated statistical techniques—such as the Deviation from Fit method we used above for country level comparisons. The results of applying these techniques to Viet Nam’s provinces are given in Box 1.8 below. But it is also important to note that these methods have their limitations.
Better understanding of human development drivers at the provincial level, including in terms of providing policy guidance, requires much more detailed province-level analysis.

Inclusive Growth and Human Development l 37
Box 1.8: Gauging provincial progress against expectations
Given the difficulties in discerning patterns of progress at the provincial level, more thoroughgoing techniques can help to provide additional insights. As with national level analysis, the ‘deviation from fit’ technique can gauge a province’s performance relative to its expected rate of improvement. This allows for different starting positions and uses the data of the full population to chart a province’s expected progress. The results of this entire analysis are provided in Annex 2; the top and bottom 15 performers appear in Table 1.11. This shows performance above the ‘expected’ growth rate (a positive value) or below the ‘expected’ growth rate (a negative value) in order to rank relative performance versus other provinces.
Five provinces in the Mekong River Delta and 4 out of 5 provinces in the Central Highlands are among the top 15 performers. Thai Nguyen in the Northern Uplands region and Bac Ninh and Vinh Phuc in the Red River Delta are also among the highest ranked. In contrast, the weakest performers include Binh Duong, Dong Nai, Hai Phong, Khanh Hoa (against ‘expected’ growth at their higher levels of development) and Cao Bang, Son La and Dien Bien (against ‘expected’ growth at their lower development levels) despite all provinces having experienced improvements in HDI values.
Table 1.11: Top and bottom performers on the HDI considering ‘deviation from fit’, 2004-2012
Top performers
‘Deviation from fit’ rank
Annual growth rank
Bottom performers
‘Deviation from fit’ rank
Annual growth rank
Can Tho 1 7 Thanh Hoa 49 45
Gia Lai 2 1 Cao Bang 50 32
Tien Giang 3 6 Hai Phong 51 54
Hau Giang 4 4 Ha Tinh 52 49
Long An 5 12 Hoa Binh* 53 48
Binh Phuoc 6 10 Dong Nai 54 60
Kon Tum 7 2 Phu Tho 55 51
Bac Ninh 8 19 Khanh Hoa 56 58
Phu Yen 9 11 Hai Duong 57 59
Dak Nong 10 8 Ha Nam 58 53
Dak Lak 11 9 Son La 59 43
Vinh Phuc 12 23 Nghe An 60 55
Thai Nguyen 13 13 Binh Duong 61 63
Ba Ria- Vung Tau* 14 61 Yen Bai 62 52
Ben Tre 15 21 Dien Bien 63 56
Note: provinces with * are outliers and should be interpreted with caution.Source: UNDP Viet Nam calculation based on GSO 2015.
But broadly, two common themes stand out. First, many provinces need to translate income gains into improved health and education performance. Second, policy makers need to draw connections between the three
components of human development, since these are mutually supportive. The maximization of HDI outcomes is best achieved by balanced development.
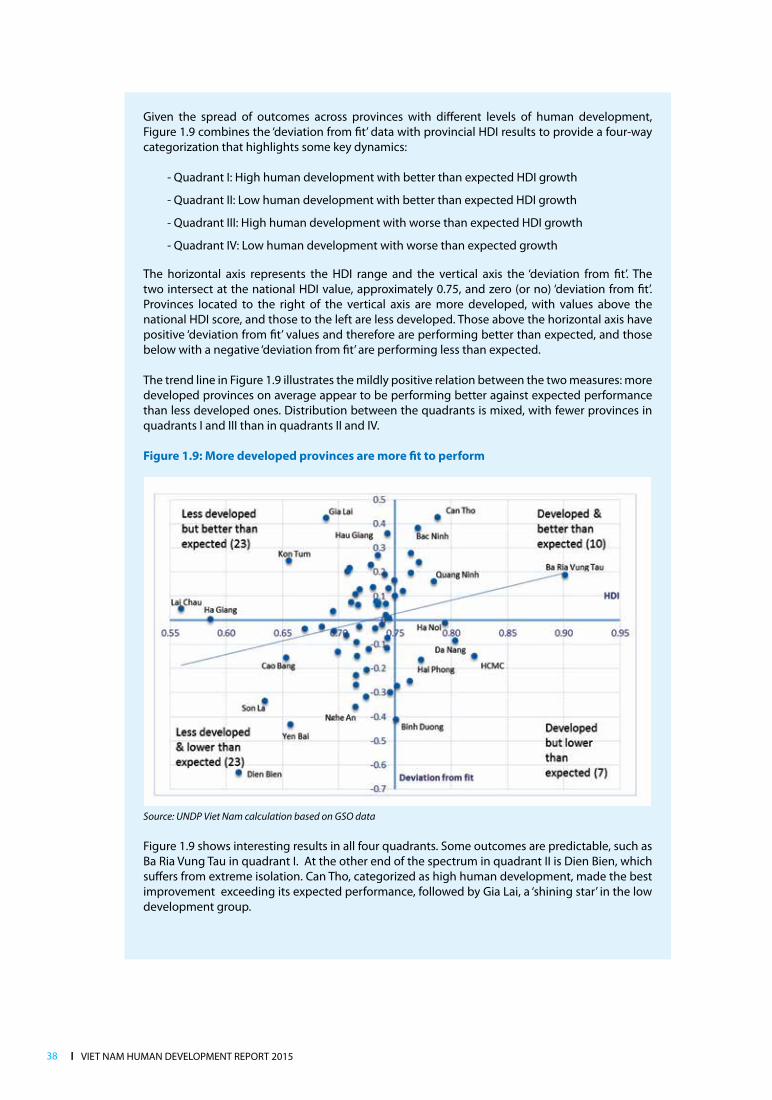
l VIET NAM HUMAN DEVELOPMENT REPORT 201538
Given the spread of outcomes across provinces with different levels of human development, Figure 1.9 combines the ‘deviation from fit’ data with provincial HDI results to provide a four-way categorization that highlights some key dynamics:
- Quadrant I: High human development with better than expected HDI growth
- Quadrant II: Low human development with better than expected HDI growth
- Quadrant III: High human development with worse than expected HDI growth
- Quadrant IV: Low human development with worse than expected growth
The horizontal axis represents the HDI range and the vertical axis the ‘deviation from fit’. The two intersect at the national HDI value, approximately 0.75, and zero (or no) ‘deviation from fit’. Provinces located to the right of the vertical axis are more developed, with values above the national HDI score, and those to the left are less developed. Those above the horizontal axis have positive ‘deviation from fit’ values and therefore are performing better than expected, and those below with a negative ‘deviation from fit’ are performing less than expected.
The trend line in Figure 1.9 illustrates the mildly positive relation between the two measures: more developed provinces on average appear to be performing better against expected performance than less developed ones. Distribution between the quadrants is mixed, with fewer provinces in quadrants I and III than in quadrants II and IV.
Figure 1.9: More developed provinces are more fit to perform
Source: UNDP Viet Nam calculation based on GSO data
Figure 1.9 shows interesting results in all four quadrants. Some outcomes are predictable, such as Ba Ria Vung Tau in quadrant I. At the other end of the spectrum in quadrant II is Dien Bien, which suffers from extreme isolation. Can Tho, categorized as high human development, made the best improvement exceeding its expected performance, followed by Gia Lai, a ‘shining star’ in the low development group.
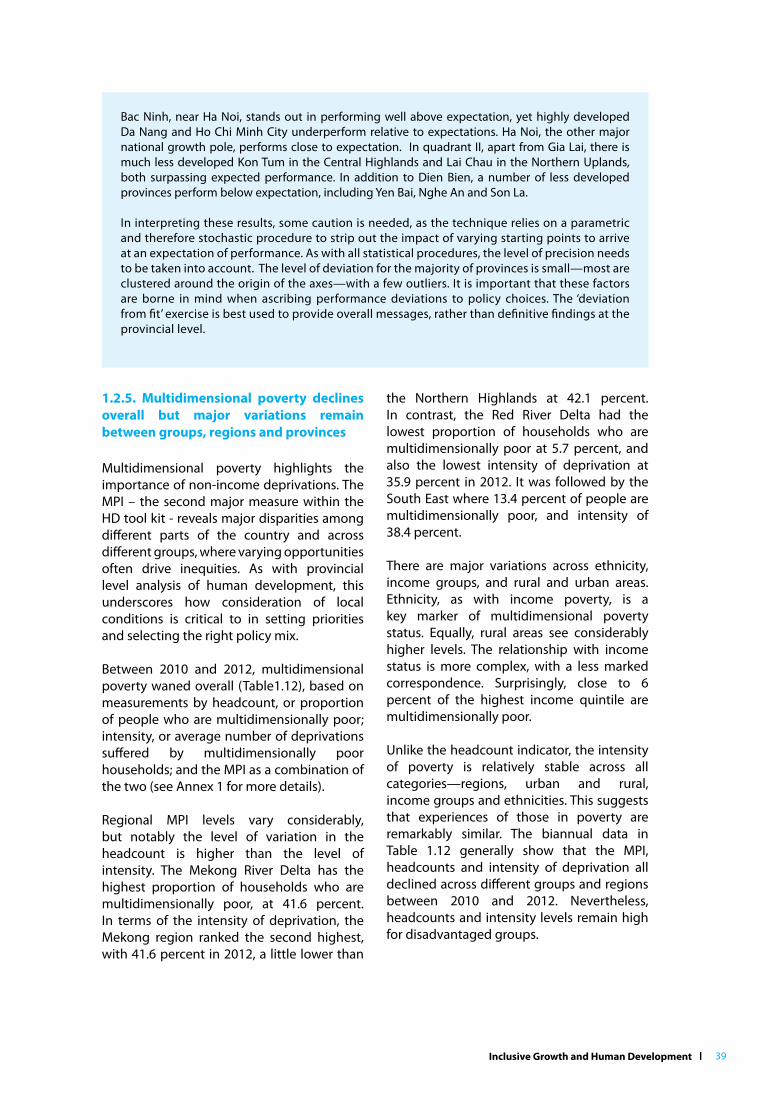
Inclusive Growth and Human Development l 39
1.2.5. Multidimensional poverty declines overall but major variations remain between groups, regions and provinces
Multidimensional poverty highlights the importance of non-income deprivations. The MPI – the second major measure within the HD tool kit - reveals major disparities among different parts of the country and across different groups, where varying opportunities often drive inequities. As with provincial level analysis of human development, this underscores how consideration of local conditions is critical to in setting priorities and selecting the right policy mix.
Between 2010 and 2012, multidimensional poverty waned overall (Table1.12), based on measurements by headcount, or proportion of people who are multidimensionally poor; intensity, or average number of deprivations suffered by multidimensionally poor households; and the MPI as a combination of the two (see Annex 1 for more details).
Regional MPI levels vary considerably, but notably the level of variation in the headcount is higher than the level of intensity. The Mekong River Delta has the highest proportion of households who are multidimensionally poor, at 41.6 percent. In terms of the intensity of deprivation, the Mekong region ranked the second highest, with 41.6 percent in 2012, a little lower than
the Northern Highlands at 42.1 percent. In contrast, the Red River Delta had the lowest proportion of households who are multidimensionally poor at 5.7 percent, and also the lowest intensity of deprivation at 35.9 percent in 2012. It was followed by the South East where 13.4 percent of people are multidimensionally poor, and intensity of 38.4 percent.
There are major variations across ethnicity, income groups, and rural and urban areas. Ethnicity, as with income poverty, is a key marker of multidimensional poverty status. Equally, rural areas see considerably higher levels. The relationship with income status is more complex, with a less marked correspondence. Surprisingly, close to 6 percent of the highest income quintile are multidimensionally poor.
Unlike the headcount indicator, the intensity of poverty is relatively stable across all categories—regions, urban and rural, income groups and ethnicities. This suggests that experiences of those in poverty are remarkably similar. The biannual data in Table 1.12 generally show that the MPI, headcounts and intensity of deprivation all declined across different groups and regions between 2010 and 2012. Nevertheless, headcounts and intensity levels remain high for disadvantaged groups.
Bac Ninh, near Ha Noi, stands out in performing well above expectation, yet highly developed Da Nang and Ho Chi Minh City underperform relative to expectations. Ha Noi, the other major national growth pole, performs close to expectation. In quadrant II, apart from Gia Lai, there is much less developed Kon Tum in the Central Highlands and Lai Chau in the Northern Uplands, both surpassing expected performance. In addition to Dien Bien, a number of less developed provinces perform below expectation, including Yen Bai, Nghe An and Son La.
In interpreting these results, some caution is needed, as the technique relies on a parametric and therefore stochastic procedure to strip out the impact of varying starting points to arrive at an expectation of performance. As with all statistical procedures, the level of precision needs to be taken into account. The level of deviation for the majority of provinces is small—most are clustered around the origin of the axes—with a few outliers. It is important that these factors are borne in mind when ascribing performance deviations to policy choices. The ‘deviation from fit’ exercise is best used to provide overall messages, rather than definitive findings at the provincial level.

l VIET NAM HUMAN DEVELOPMENT REPORT 201540
Table 1.12: Consistent intensity of poverty suggests similar experiences for people in poverty
2010 2012 National poverty
rate5 (2012) MPI Headcount Intensity of
deprivationMPI Headcount Intensity of
deprivation
H*A (H) (%) (A) (%) H*A (H) (%) (A) (%)
Whole country 0.1187 28.4 41.8 0.0864 21.3 40.6 11.1
By urban/rural
Urban 0.0527 13.3 39.7 0.0365 9.3 39.2 4.3
Rural 0.1477 35.1 42.1 0.1077 26.4 40.8 14.1
By region
Red River Delta 0.0394 10.7 36.8 0.0206 5.7 35.9 5.9
Northern Uplands 0.1638 38.6 42.5 0.1413 33.6 42.1 23.7
Central Coast 0.1029 25.1 40.9 0.0675 17.0 39.6 16.2
Central Highlands 0.1676 39.3 42.6 0.1306 31.8 41.1 17.7
South East 0.0778 19.8 39.3 0.0516 13.4 38.4 1.3
Mekong River Delta 0.2339 53.4 43.8 0.1730 41.6 41.6 10.1
By ethnicity
Ethnic minority 0.2579 58.3 44.3 0.2189 50.9 43.0 34.6
Kinh-Hoa 0.0965 23.7 40.8 0.0650 16.5 39.4 7.4
By income quintile
Quintile 1 0.2368 53.7 44.1 0.1938 45.6 42.5 59.1
Quintile 2 0.1634 38.9 42.0 0.1169 29.0 40.4 0.0
Quintile 3 0.1137 28.1 40.5 0.0728 18.6 39.2 0.0
Quintile 4 0.0691 17.8 38.8 0.0419 11.0 38.1 0.0
Quintile 5 0.0327 8.7 37.6 0.0213 5.8 36.9 0.0
Note: Assumes a cut-off threshold (k) of 0.33
Source: GSO 2015
1. The Government’s poverty lines for 2011 to 2015 have been updated for inflation and are VND 530,000 per capita per month for rural areas and VND 660,000 per capita per month for urban areas.

Inclusive Growth and Human Development l 41
Figure 1.10 shows major differences be-tween multidimensional and income pov-erty across regions, measured either by the national poverty line or the international US $2 PPP line. While having an income pover-ty headcount lower than that of the South East, the Red River Delta’s multidimensional
A key advantage of the approach used to calculate the MPI is the ability to disaggregate poverty across dimensions as well as groups. Figure 1.11 provides a decomposition across income groups and regions, showing the proportions of populations that are multidimensionally poor in different dimensions. This defines the character of poverty suffered by particular groups and regions.
Clear differences in regional income and multidimensional poverty rates reveal deprivations beyond income, often rooted in factors like geography, supply constraints and institutional barriers. Multidimensionally poor households in the Mekong River Delta were more likely to be deprived in aspects of education, health insurance, housing and sanitation that may be caused by the lack of social service supply. The Northern Uplands region has high levels of deprivation in most of these dimensions, plus its households are
poverty headcount is considerably lower. The multidimensional headcount in the Me-kong River Delta is much higher than in the Central Coast, Central Highlands and North-ern Uplands regions, but the latter all have higher rates of income poverty.
deprived in terms of access to information, perhaps due to geographical, linguistic and cultural barriers. In the Central Highlands, multidimensionally poor households are mostly deprived in education and sanitation.
By income quintile, unsurprisingly, the poorest quintile is the most deprived group in most indicators, and particularly so in education, quality of housing and sanitation. Yet multidimensionally poor households in the second and third quintiles are similarly deprived in health insurance, potentially reflecting the lack of provision for near poor and middle-income groups who often don’t work in the formal sector. Second quintile households are also highly deprived in sanitation, and to a lesser extent, in education. This suggests greater efforts are needed to expand health insurance coverage and educational participation, and these issues are discussed in Part 2 of this report.
Figure 1.10: Differences between multidimensional and income poverty varied widely by region in 2012
Source: GSO, 2015

l VIET NAM HUMAN DEVELOPMENT REPORT 201542
Results for provinces underline the commonality of multidimensional poverty and the provincial pattern of human development in Viet Nam. As Figure 1.12 indicates, there is a positive relationship between MPI headcount and intensity, depicted by the trend line, among provinces. Additionally, there is a correspondence with HDI status, reflected in the colour coding, with provinces with lower HDI ranks generally lower on the MPI.6
This is not a perfect relationship, however; local factors are important. While it is not unexpected that many provinces in the low HDI group have the highest MPI levels, a considerable number of provinces in the medium HDI group and even some high HDI provinces also score highly for multidimensional poverty. These provinces, notably Vinh Long and Can Tho, are found mainly in the Mekong River Delta, where households are deprived in many non-income aspects. Clearly, multidimensional poverty statistics, and the ability to disaggregate their components, offer a rich resource for examining local deprivations and challenges.
Figure 1.11: Multidimensional deprivations are linked, but not fully consistent with income status and location plays a major role in determining the pattern of deprivation
Percentage of multidimensionally poor households deprived in each indicator, 2012
Source: GSO, 2015.
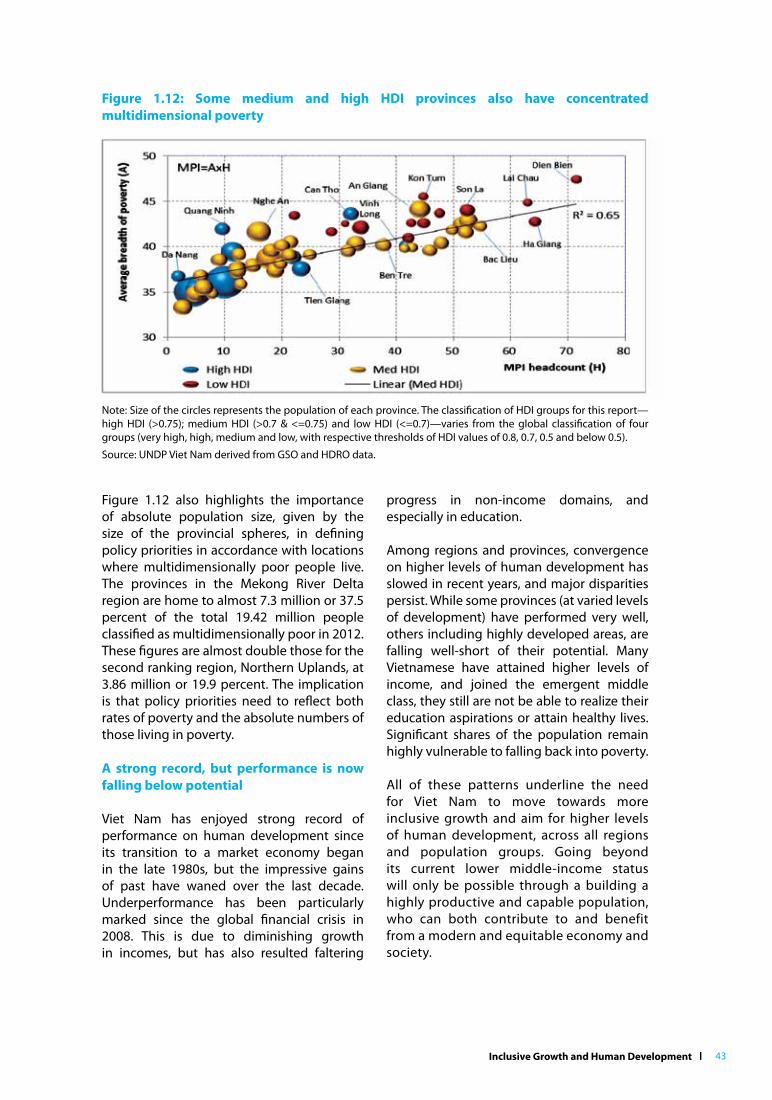
Inclusive Growth and Human Development l 43
Figure 1.12 also highlights the importance of absolute population size, given by the size of the provincial spheres, in defining policy priorities in accordance with locations where multidimensionally poor people live. The provinces in the Mekong River Delta region are home to almost 7.3 million or 37.5 percent of the total 19.42 million people classified as multidimensionally poor in 2012. These figures are almost double those for the second ranking region, Northern Uplands, at 3.86 million or 19.9 percent. The implication is that policy priorities need to reflect both rates of poverty and the absolute numbers of those living in poverty.
A strong record, but performance is now falling below potential
Viet Nam has enjoyed strong record of performance on human development since its transition to a market economy began in the late 1980s, but the impressive gains of past have waned over the last decade. Underperformance has been particularly marked since the global financial crisis in 2008. This is due to diminishing growth in incomes, but has also resulted faltering
progress in non-income domains, and especially in education.
Among regions and provinces, convergence on higher levels of human development has slowed in recent years, and major disparities persist. While some provinces (at varied levels of development) have performed very well, others including highly developed areas, are falling well-short of their potential. Many Vietnamese have attained higher levels of income, and joined the emergent middle class, they still are not be able to realize their education aspirations or attain healthy lives. Significant shares of the population remain highly vulnerable to falling back into poverty. All of these patterns underline the need for Viet Nam to move towards more inclusive growth and aim for higher levels of human development, across all regions and population groups. Going beyond its current lower middle-income status will only be possible through a building a highly productive and capable population, who can both contribute to and benefit from a modern and equitable economy and society.
Figure 1.12: Some medium and high HDI provinces also have concentrated multidimensional poverty
Note: Size of the circles represents the population of each province. The classification of HDI groups for this report— high HDI (>0.75); medium HDI (>0.7 & <=0.75) and low HDI (<=0.7)—varies from the global classification of four groups (very high, high, medium and low, with respective thresholds of HDI values of 0.8, 0.7, 0.5 and below 0.5).
Source: UNDP Viet Nam derived from GSO and HDRO data.

Emerging Lower Middle Class Heal
Gender Equality Inclusive Growth
Medium Technology Emerging LowSocial Protection Gender Equality Inclusiv
Inclusive Growth Medium Tech
Labor Productivity Social Protection Gend
Readiness Innovation Medium Tech
Labor Productivity Social Protec Technological Readiness Innovatio
Health Education Labor Pro
Growth Missing Middle Technolog
Lower Middle Class Health Educati
Inclusive Growth Missing Middle T
Emerging Lower Emerging Lower H
G d E lit M
Health Education Labor
Protection
Gender Equality Inclu Technological Readiness I
Emerging Lower Middle Class
Inclusive Growth
Labor Productivity Missing M
Innovation Medium Technology
Health Education Labor Produ
Gender Equality Inclusi
Productivity Readiness Inn
Social Protection Middle Cla
Education Social Protection
Health Missing Middle Tec Inclusive Growth Medium Te
Middle Class Health Ed
Labor Productivity Soc
Inclusiv Gender Equality Miss
Readiness Innovation
Health Education Labor Productivity S
Equality Inclusive Growth
Technological Readiness Innovation M
Emerging Low Middle Class Health Productivity Social Protection Gender Eq
Missing Technological Readiness Innovatio
Emerging Lower Middle Clas Labor Productivity Social Protectio
Inclusive Growth M
Technological Readiness Innovation
Emerging Lower Middle Class Health Productivity Social Protection Gender Equa
Middle Technological Readiness Inc
Gender Equality Middle Class Health
Health Education Social Protection Ge
Growth Missing Middle Technological Rea
Medium Technology Emerging Lower Middl
Labor Productivity Social Protection G
Health Education Labor Productivity Social Protection
Gender Equality Gender Equality Missing
Technological Readiness Innovation Medium Techn
Emerging Lower Middle Class Health Education La
Productivity Social Inclusive Growth Gend
Middle Technological Readiness Innovation M
Techno Emerging Lower Middle Class Health Educatio
Labor Produ Social Protection Gender Equality Inclusive G
Missing Middle Technological
Readiness Innovation Medium Technology Emerging Low
Middle Class Health Education Labor Productivity So
Protection Gender Equality Inclusive Growth Missin
Health Education Labor Productivity Social Protec
Gender Equality Inclusive Gr Missing Middle
Technological Readiness Innovation Medium Technolo
Emerging Lower Middle Class Health Education Labor
Productivity Social Protection Gender Equality
Inclusive Growth Missing Middle Health
Technological Innovation Medium Technology
Emerging Lower Middle Health Education Labor Productiv
Achieving inclusive growth2
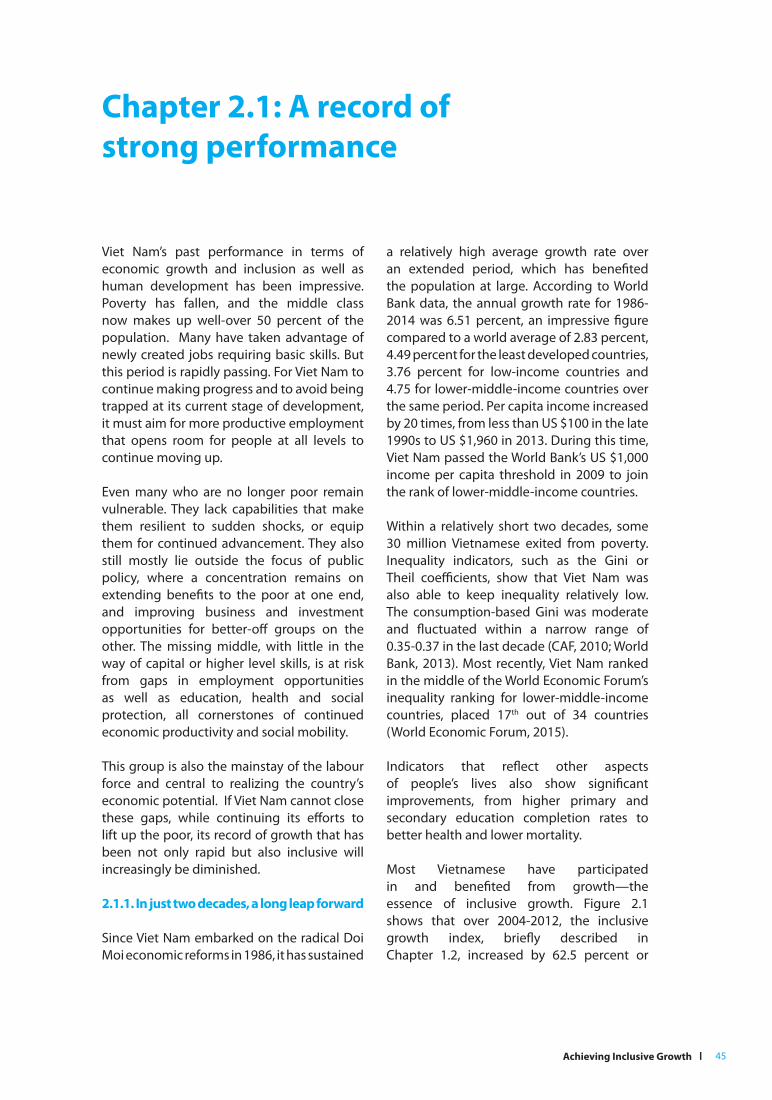
Achieving Inclusive Growth l 45
Viet Nam’s past performance in terms of
economic growth and inclusion as well as
human development has been impressive.
Poverty has fallen, and the middle class
now makes up well-over 50 percent of the
population. Many have taken advantage of
newly created jobs requiring basic skills. But
this period is rapidly passing. For Viet Nam to
continue making progress and to avoid being
trapped at its current stage of development,
it must aim for more productive employment
that opens room for people at all levels to
continue moving up.
Even many who are no longer poor remain
vulnerable. They lack capabilities that make
them resilient to sudden shocks, or equip
them for continued advancement. They also
still mostly lie outside the focus of public
policy, where a concentration remains on
extending benefits to the poor at one end,
and improving business and investment
opportunities for better-off groups on the
other. The missing middle, with little in the
way of capital or higher level skills, is at risk
from gaps in employment opportunities
as well as education, health and social
protection, all cornerstones of continued
economic productivity and social mobility.
This group is also the mainstay of the labour
force and central to realizing the country’s
economic potential. If Viet Nam cannot close
these gaps, while continuing its efforts to
lift up the poor, its record of growth that has
been not only rapid but also inclusive will
increasingly be diminished.
2.1.1. In just two decades, a long leap forward
Since Viet Nam embarked on the radical Doi
Moi economic reforms in 1986, it has sustained
a relatively high average growth rate over
an extended period, which has benefited
the population at large. According to World
Bank data, the annual growth rate for 1986-
2014 was 6.51 percent, an impressive figure
compared to a world average of 2.83 percent,
4.49 percent for the least developed countries,
3.76 percent for low-income countries and
4.75 for lower-middle-income countries over
the same period. Per capita income increased
by 20 times, from less than US $100 in the late
1990s to US $1,960 in 2013. During this time,
Viet Nam passed the World Bank’s US $1,000
income per capita threshold in 2009 to join
the rank of lower-middle-income countries.
Within a relatively short two decades, some
30 million Vietnamese exited from poverty.
Inequality indicators, such as the Gini or
Theil coefficients, show that Viet Nam was
also able to keep inequality relatively low.
The consumption-based Gini was moderate
and fluctuated within a narrow range of
0.35-0.37 in the last decade (CAF, 2010; World
Bank, 2013). Most recently, Viet Nam ranked
in the middle of the World Economic Forum’s
inequality ranking for lower-middle-income
countries, placed 17th out of 34 countries
(World Economic Forum, 2015).
Indicators that reflect other aspects
of people’s lives also show significant
improvements, from higher primary and
secondary education completion rates to
better health and lower mortality.
Most Vietnamese have participated
in and benefited from growth—the
essence of inclusive growth. Figure 2.1
shows that over 2004-2012, the inclusive
growth index, briefly described in
Chapter 1.2, increased by 62.5 percent or
Chapter 2.1: A record of strong performance
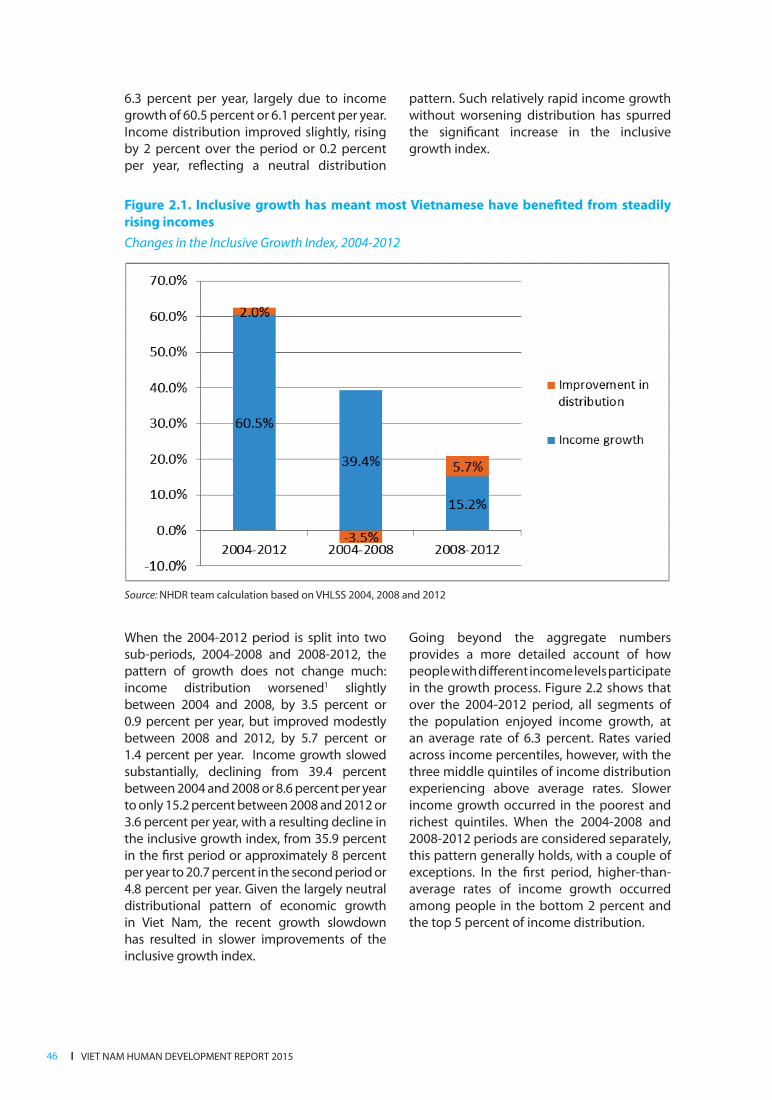
l VIET NAM HUMAN DEVELOPMENT REPORT 201546
Figure 2.1. Inclusive growth has meant most Vietnamese have benefited from steadily
rising incomes
Changes in the Inclusive Growth Index, 2004-2012
Source: NHDR team calculation based on VHLSS 2004, 2008 and 2012
6.3 percent per year, largely due to income growth of 60.5 percent or 6.1 percent per year. Income distribution improved slightly, rising by 2 percent over the period or 0.2 percent per year, reflecting a neutral distribution
pattern. Such relatively rapid income growth without worsening distribution has spurred the significant increase in the inclusive growth index.
When the 2004-2012 period is split into two
sub-periods, 2004-2008 and 2008-2012, the
pattern of growth does not change much:
income distribution worsened1 slightly between 2004 and 2008, by 3.5 percent or 0.9 percent per year, but improved modestly
between 2008 and 2012, by 5.7 percent or
1.4 percent per year. Income growth slowed substantially, declining from 39.4 percent between 2004 and 2008 or 8.6 percent per year
to only 15.2 percent between 2008 and 2012 or 3.6 percent per year, with a resulting decline in
the inclusive growth index, from 35.9 percent in the first period or approximately 8 percent
per year to 20.7 percent in the second period or
4.8 percent per year. Given the largely neutral distributional pattern of economic growth
in Viet Nam, the recent growth slowdown has resulted in slower improvements of the inclusive growth index.
Going beyond the aggregate numbers
provides a more detailed account of how
people with different income levels participate
in the growth process. Figure 2.2 shows that over the 2004-2012 period, all segments of the population enjoyed income growth, at
an average rate of 6.3 percent. Rates varied
across income percentiles, however, with the three middle quintiles of income distribution experiencing above average rates. Slower
income growth occurred in the poorest and richest quintiles. When the 2004-2008 and
2008-2012 periods are considered separately, this pattern generally holds, with a couple of
exceptions. In the first period, higher-than-average rates of income growth occurred
among people in the bottom 2 percent and the top 5 percent of income distribution.
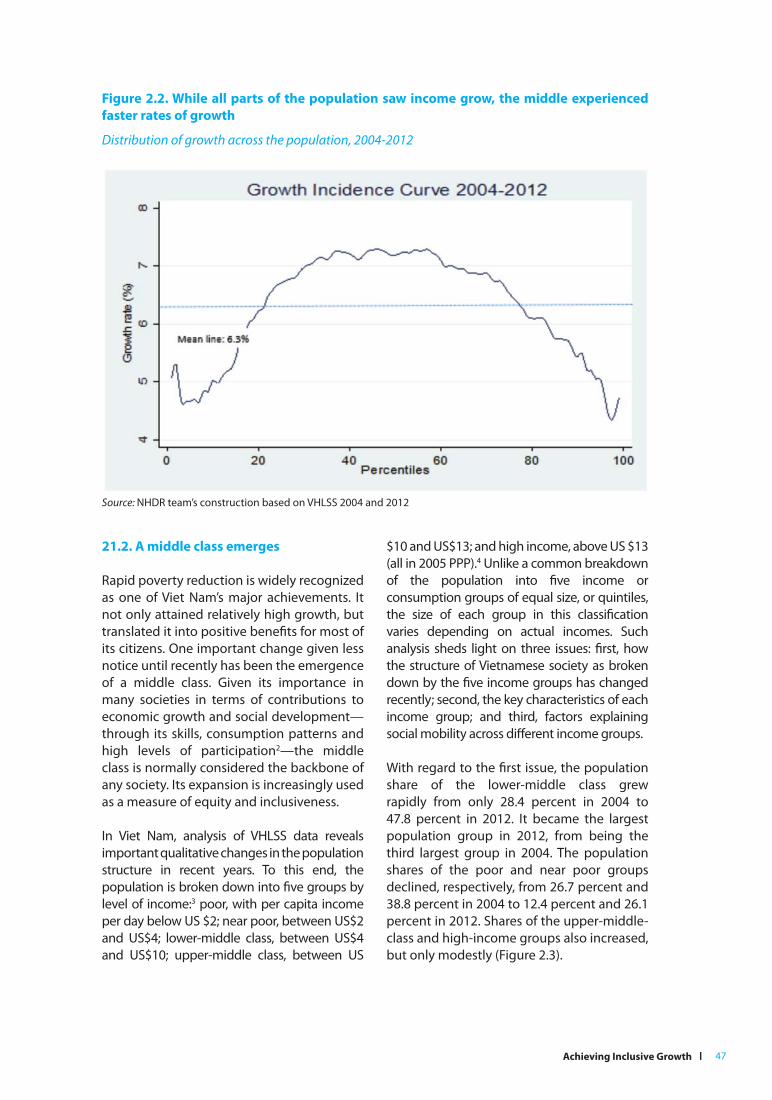
Achieving Inclusive Growth l 47
Figure 2.2. While all parts of the population saw income grow, the middle experienced
faster rates of growth
Distribution of growth across the population, 2004-2012
Source: NHDR team’s construction based on VHLSS 2004 and 2012
21.2. A middle class emerges
Rapid poverty reduction is widely recognized
as one of Viet Nam’s major achievements. It
not only attained relatively high growth, but
translated it into positive benefits for most of
its citizens. One important change given less
notice until recently has been the emergence
of a middle class. Given its importance in
many societies in terms of contributions to
economic growth and social development—
through its skills, consumption patterns and
high levels of participation2—the middle
class is normally considered the backbone of
any society. Its expansion is increasingly used
as a measure of equity and inclusiveness.
In Viet Nam, analysis of VHLSS data reveals
important qualitative changes in the population
structure in recent years. To this end, the
population is broken down into five groups by
level of income:3 poor, with per capita income
per day below US $2; near poor, between US$2
and US$4; lower-middle class, between US$4
and US$10; upper-middle class, between US
$10 and US$13; and high income, above US $13
(all in 2005 PPP).4 Unlike a common breakdown
of the population into five income or
consumption groups of equal size, or quintiles,
the size of each group in this classification
varies depending on actual incomes. Such
analysis sheds light on three issues: first, how
the structure of Vietnamese society as broken
down by the five income groups has changed
recently; second, the key characteristics of each
income group; and third, factors explaining
social mobility across different income groups.
With regard to the first issue, the population
share of the lower-middle class grew
rapidly from only 28.4 percent in 2004 to
47.8 percent in 2012. It became the largest
population group in 2012, from being the
third largest group in 2004. The population
shares of the poor and near poor groups
declined, respectively, from 26.7 percent and
38.8 percent in 2004 to 12.4 percent and 26.1
percent in 2012. Shares of the upper-middle-
class and high-income groups also increased,
but only modestly (Figure 2.3).
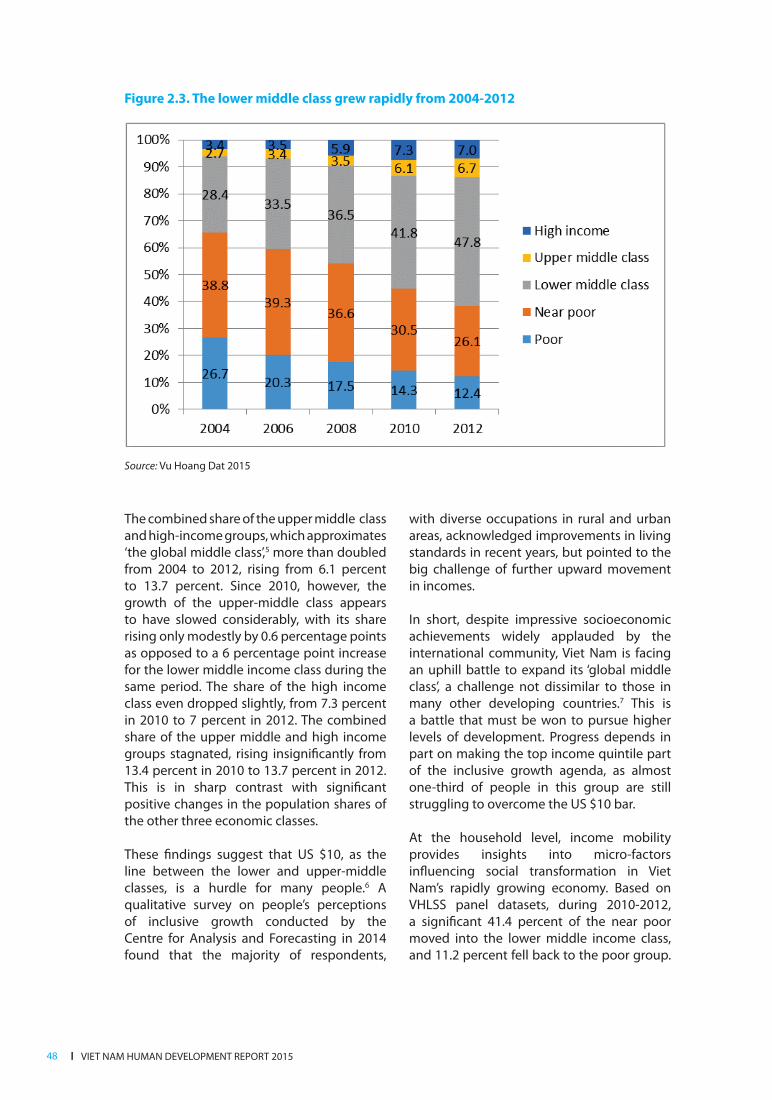
l VIET NAM HUMAN DEVELOPMENT REPORT 201548
Figure 2.3. The lower middle class grew rapidly from 2004-2012
Source: Vu Hoang Dat 2015
The combined share of the upper middle class
and high-income groups, which approximates
‘the global middle class’,5 more than doubled
from 2004 to 2012, rising from 6.1 percent
to 13.7 percent. Since 2010, however, the
growth of the upper-middle class appears
to have slowed considerably, with its share
rising only modestly by 0.6 percentage points
as opposed to a 6 percentage point increase
for the lower middle income class during the
same period. The share of the high income
class even dropped slightly, from 7.3 percent
in 2010 to 7 percent in 2012. The combined
share of the upper middle and high income
groups stagnated, rising insignificantly from
13.4 percent in 2010 to 13.7 percent in 2012.
This is in sharp contrast with significant
positive changes in the population shares of
the other three economic classes.
These findings suggest that US $10, as the
line between the lower and upper-middle
classes, is a hurdle for many people.6 A
qualitative survey on people’s perceptions
of inclusive growth conducted by the
Centre for Analysis and Forecasting in 2014
found that the majority of respondents,
with diverse occupations in rural and urban
areas, acknowledged improvements in living
standards in recent years, but pointed to the
big challenge of further upward movement
in incomes.
In short, despite impressive socioeconomic
achievements widely applauded by the
international community, Viet Nam is facing
an uphill battle to expand its ‘global middle
class’, a challenge not dissimilar to those in
many other developing countries.7 This is
a battle that must be won to pursue higher
levels of development. Progress depends in
part on making the top income quintile part
of the inclusive growth agenda, as almost
one-third of people in this group are still
struggling to overcome the US $10 bar.
At the household level, income mobility
provides insights into micro-factors
influencing social transformation in Viet
Nam’s rapidly growing economy. Based on
VHLSS panel datasets, during 2010-2012,
a significant 41.4 percent of the near poor
moved into the lower middle income class,
and 11.2 percent fell back to the poor group.

Achieving Inclusive Growth l 49
Upward movement for the lower middle class was more difficult than falling back into the near poor group: 8.6 percent successfully moved up as opposed to over 12.2 percent falling back to become the near poor.
Another important finding is that the emerging lower-middle class is closely linked to rural growth. Out of a 6 percentage point increase in the population share of this group between 2010 and 2012, the contribution from rural upward social mobility was 4.5 percentage points. This confirms income growth inclusiveness in rural areas. The emerging lower middle income class in rural areas may, due to the prevalence of agricultural and non-farm informal employment, contribute to the ‘middle’ that the current social protection system
‘misses’—a problem that will be discussed in
later chapters.
A detailed profile of the key features of
different income groups—broken down by
geographic regions, urban and rural areas, ethnicity, level of educational attainment, types of employment, income from work and access to the formal social protection system—provides additional insights (Table 2.1). This shows that the urban population accounts for only 29.6 percent of total population, but makes up 35.6 percent, 53.2 percent and 51.9 percent of the lower middle class, upper middle class and high income groups respectively. By region, the Red River Delta and the South East are considerably overrepresented in these three income groups, whereas the Mekong River Delta is overrepresented in the near poor group. Ethnic minorities are considerably overrepresented in the poor group, and in turn therefore, are they underrepresented in the upper middle class and high income
groups. Over 50 percent of poor and near
poor households have their highest income
earner with only primary schooling or lower.
Over 68 percent of highest income earner of
poor households work in agriculture.
Table 2.1. Despite being better off, people in the lower middle class lack economic
opportunities to resist shocks
All figures expressed
in percentagesPoor Near poor
Lower-middle
class
Upper-middle
classHigh income
All 12.4 26.1 47.8 6.7 7.0
Region 100 100 100 100 100
Red River Delta 9.1 16.9 26.8 34.8 29.7
North Uplands 37.0 15.1 9.1 6.1 5.8
North and Central Coast 26.4 27.9 20.6 11.8 15.6
Central Highlands 9.1 5.6 5.1 4.4 6.7
South East 2.6 9.6 19.7 26.4 27.8
Mekong River Delta 15.8 24.9 18.8 16.5 14.4
Urban/rural 100 100 100 100 100
Rural 92.7 82.9 64.5 46.8 48.1
Urban 7.3 17.1 35.6 53.2 51.9
Ethnicity 100 100 100 100 100
Kinh-Hoa 42.6 81.4 94.8 97.9 97.3

l VIET NAM HUMAN DEVELOPMENT REPORT 201550
There is a sharp difference between the
lower middle class on the one hand and the
upper middle class and high income groups
on the other hand in terms of educational
attainment of the household’s highest
income earner at the post-secondary level.
The rate was only 12.2 percent for the first
group as opposed to 32 and 36.3 percent,
respectively, for the last two groups. There
is a similar difference in terms of the share
Ethnic minorities 57.4 18.6 5.2 2.1 2.7
Education (*) 100 100 100 100 100
Unfinished primary
education 40.2 21.6 10.1 5.4 5.8
Primary 27.6 30.5 21.4 13.4 13.3
Lower secondary 24.3 30.3 26.5 20.0 16.0
Upper secondary 5.4 10.7 12.4 10.4 11.0
Short-term vocational
training 1.4 2.8 7.4 6.6 7.1
Long-term vocational
training 0.8 3.0 10.1 12.2 10.6
Junior college/university 0.2 1.1 12.2 32.0 36.3
Employment (**) 100 100 100 100 100
Agriculture 68.4 35.8 19.2 16.5 22.4
Non-farm self-
employment 7.8 16.1 23.9 29.7 28.8
Wage employment in
household businesses 18.1 31.1 18.3 5.0 2.1
Wage employment in
formal sector 3.8 15.2 36.7 45.4 40.2
Owner of private
businesses 0.0 0.1 0.1 0.7 4.7
Inactive 1.9 1.8 1.8 2.9 1.8
Household
characteristics
Number of members 4.9 4.6 4.4 4.1 4.0
Share of members who
have health insurance
and/or are entitled to
free health care services 83.8 60.8 60.0 67.8 69.5
Share of members over
15 years of age who
work and have social
insurance 0.8 4.7 22.0 37.4 37.8
Share of labour income
out of total income 86.2 84.9 84.1 82.1 82.4
Notes: (*) and (**): respectively educational level and type of employment of the highest income earner in
the household
Source: NHDR team calculated based on VHLSS 2012.

Achieving Inclusive Growth l 51
of people over age 15 covered by the formal
social security system, at 22 percent for
the first group compared to 37.4 percent
and 37.8 percent, respectively, for the last
two. Access to formal employment for the
household’s highest income earner ranged
from 36.7 percent for the first group to 45.4
and 40.2 percent, respectively. In short, the
lower middle class and the ‘global middle
class’ (as approximated by the combined
upper-middle class and high-income
groups) differs from one another not only
in terms of income level, but also in other
important characteristics that influence a
household’s capacity to generate income
and resist shocks.
A closer look at the determinants of social
mobility8 found that the completion of lower
secondary school is linked with the transition
out of poverty and near poor status, while
post-secondary education or being head of
a household business facilitates the upward
transition from the lower middle class to the
upper middle class. The head of household
working for others’ household businesses,
which is in part the non-farm informal sector,
or being part of an ethnic minority, is likely to
hinder an upward transition. Living in urban
areas is more likely to help the near poor
move up to the lower middle class, while
working in household businesses decreases
such a probability.
Being self-employed in the non-agricultural
sector increases the likelihood that a middle-
class person will fall back into the near poor
group. Waged workers in the formal sector
have a better chance of upward mobility
towards the lower middle class.
2.1.3. Reforms have driven inclusive growth
Behind Viet Nam’s inclusive and socially
transformative growth are 30 years of major
policy and institutional reforms that shifted
the economy from central planning and
towards market mechanisms, and sought
to integrate the country into the global
economy. These reforms can be summarized
as four processes of internal and external
economic liberalization.
First, the liberalization of prices and internal
trade began in the mid-1980s to tackle severe
supply shortages in most goods and services.
This helped to reduce price distortions and
the misallocation of resources. It allowed
a dismantling of barriers to internal trade
instituted by numerous provinces in response
to severe shortages of food and essential
goods, thus improving the spatial integration
of the domestic market.
Second, agricultural liberalization began in
1986 under the Fourth Party’s Congress with
a view to overcoming stagnant production,
identified then as a major bottleneck
to economic growth. A series of major
institutional reforms included Resolution No.
10, issued by the Politburo in 1988. It radically
changed the incentive system in rural areas
by recognizing, for the first time, that the
household was the basic production unit of
Viet Nam’s agrarian economy and granting it
considerable autonomy. The next milestone
was the 1993 Land Law, which guaranteed
households basic rights to transfer, exchange,
inherit, rent and mortgage their land,
and to extend a lease term to 20 years for
annual cropland and 50 years for perennial
cropland. Resolution 10 and the Land Law
and subsequent revisions together played a
crucial role in boosting agricultural growth,
thus enabling Viet Nam to quickly shift from
a country with persistent food deficits in
the 1980s to one of the world’s largest rice
exporters by the end of the 2000s.
Third, liberalization of the non-agricultural
sector accelerated in the 1990s with a view
to boosting the private sector. The most
important step forward was the Enterprise
Law of January 2000, which allowed citizens
to establish and operate private businesses
with limited intervention from government
officials. It simplified registration procedures
and eliminated a large number of business
licenses, thus considerably reducing
transaction costs and raising business
confidence. In parallel, reform of state-owned
enterprises took place and is ongoing, and
despite uneven progress, their number has
been reduced. Viet Nam has now undergone
profound structural transformation, with the

l VIET NAM HUMAN DEVELOPMENT REPORT 201552
agricultural share of employment declining
from nearly 80 percent of the total workforce
in the end of the 1980s to only 47 percent
in 2014.
Fourth, external liberalization gained steam
at all levels—unilateral, bilateral, regional
and multilateral. Beginning in the early 1990s,
tariffs were unilaterally reduced, numerous
quantitative restrictions on trade abolished
and regulations on participation in foreign
trade relaxed. Viet Nam actively engaged in
bilateral and regional trade agreements, such
as through membership in the Association
of Southeast Asian Nations (ASEAN) in 1995
and its associated Asian Free Trade Area, and
the US-Viet Nam Bilateral Trade Agreement in
2001. In 2007, Viet Nam became a full member
of the World Trade Organization (WTO), with
significant implications for development.
Major changes have taken place at borders,
such as reductions in import tariffs and
removal of non-tariff barriers to trade;
beyond borders, through greater access to
overseas markets and to the WTO’s dispute
settlement mechanism; and behind borders
through the opening of service sectors and
distribution systems, and changes in legal
and regulatory frameworks.
Implementation of trade agreements has
not only boosted exports and facilitated
restructuring in the domestic economy, but
also become a key driver of institutional
reforms, including legal and judicial
structures to become more consistent
with international practices. Viet Nam has
increasingly integrated into the global
economy, resulting in rising flows of external
trade and foreign investment associated with
technology and higher skilled labour. Exports
grew strongly, from as low as US $800 million
in 1986 to US $150 billion in 2014. Foreign
direct investment (FDI) rose from a modest
start of less than US $100 million by the end
of the 1980s to some US$ 237 billion between
1987 and 2014.
A number of key factors which cut across
the liberalization process explain Viet Nam’s
broad-based growth. Institutional reforms
implemented at critical times and coupled
with rising investment and consistent
improvements in hard and soft infrastructure
helped overcome major growth bottlenecks.
The relatively egalitarian initial distribution
of assets, particularly human capital in the
early years of Doi Moi, and subsequent
further investment and improvements in
social services and social protection helped
enhance people’s capabilities to take up
opportunities opened up by the reforms.
Advantageous geographical factors, such as
Viet Nam’s long coastline, also have played an
important role, making it easier to improve
internal and external connectivity, and to
enhance the flow of goods and the integration
of labour markets. Agricultural growth and
particularly the rapid expansion of labour
intensive manufacturing and services have
generated easily accessible employment for
a large number of low-skilled workers. These
provide important explanations for why
Viet Nam has been able to keep inequality
at a level commensurate with its level of
development.
2.1.4. Growth slowed down from the late
2000s until the early 2010s
Given that Viet Nam’s pattern of growth has
been largely neutral in its distribution, the
slowdown in improvements in the inclusive
growth index stems largely from declining
growth. This is partly explained by the
worsening external environment linked
to the 2008 global economic crisis, but
internal problems and weaknesses were
more significant.
Nationally, economic growth fell
dramatically, from an average of 6.72 percent
in 1986-2005 to 6.05 percent for 2006-2014.
Viet Nam’s superior performance compared
to low-income countries (the average
growth rates of which were 2.72 percent and
6.08 percent in the two periods, respectively)
was reversed. Superior growth performance
over the group of lower-middle-income
countries, which achieved average growth
rates of 4.17 percent in 1986-2014 and 6.01
percent in 2000-2012, respectively, has
almost disappeared.9
Achieving Inclusive Growth l 53
The recent growth slowdown originated from
rising macroeconomic instability in the late
2000s. This exacerbated inherent structural
weaknesses of the economy in critical areas,
such as institutions, infrastructure and human
resources. Admission to the WTO in 2007 was
an important step towards global integration
that opened tremendous opportunities for
the country’s development. But that time
was also associated with the final phase of
the overheated global economy, with global
imbalances identified as a main cause of the
2008 crisis. Huge capital flows moving around
the globe in search of lucrative investment
opportunities resulted in major asset bubbles,
most notably real estate bubbles in the
United States and some European countries.
Viet Nam was a favorite destination because
of the ‘exuberance’ of international investors,
including numerous hedge funds, which bet
on its bright prospects.
Foreign investment, direct and indirect,
surged in the second half of the 2000s. Huge
capital inflows resulted in excessive money in
circulation, and subsequently, inflated assets,
such as stocks, real estate, gold and foreign
currencies. There were a number of negative
consequences.
The first was a shift from savings to excessive
consumption, particularly among the
affluent. The savings and investment gap in
2001-2005 was only 1.83 percent of GDP, but
rose to 7.51 percent in 2008-2010, a major
source of macroeconomic instability. The
soaring number of private cars and luxury
goods and services from 2007 onward served
as evidence of changes in the consumption
behaviour of the elite, many of whom acquired
their wealth from the bubble economy.
Asset bubbles induced speculative behaviour
not only among investors, but also enterprises,
state and private alike, and the population at
large. This resulted in spiraling property prices.
Financial, human and material resources
were diverted to speculative pursuits
instead of going into the real economy to
raise productive capacity, and upgrade
technological capabilities and skills to improve
the country’s competitiveness. Even worse,
with the conversion of almost all rural banks
into urban ones, financial resources moved
away from the rural sector, to the detriment
of inclusive growth, which had been strongly
supported by a healthy rural economy.
With too much money circulating, commercial
banks eased lending standards and loosened
risk management. A considerable amount of
lending went to speculative activities. Among
largely inefficient state-owned enterprises,
weak corporate governance and a lack of
market discipline in the absence of a level
playing field with private enterprises became
major problems.
Public spending increased, from an average of
27 percent of GDP in 2001-2006 to 29 percent
of GDP in 2007-2010. But public investments
were thinly spread over an excessive number
of projects, resulting in long time lags for
construction and higher costs. Inefficiency
was exaggerated by poor regional and
urban planning, resulting in cost increases
and limited infrastructure connectivity.
Excessive money fueled corruption, even as
an overheated economy put further stress
on existing bottlenecks to growth, such as in
infrastructure, human capital and institutions
that were longstanding structural hindrances.
These economic weaknesses were not
promptly identified, leading to passive
policy responses to internal shocks that
were frequently inadequate. Short-term
responses to repeated economy-wide shocks
in the late 2000s distracted attention away
from bold policy and institutional reforms
critical for raising national competitiveness,
and sustaining rapid and inclusive growth.
External shocks exacerbated the situation as
the global economic crisis broke in late 2008.
Today, the major reforms implemented in the
early years of Doi Moi have run out of steam.
WTO accession has not been complemented
with sufficient internal reforms, making
the economy more vulnerable to external
shocks, and deepening inherent structural
weaknesses. With slowing growth and rising
macroeconomic instability, inclusive growth
has suffered.
l VIET NAM HUMAN DEVELOPMENT REPORT 201554
Chapter 2.2: Meeting the challenges of a changing world
As Viet Nam celebrates the 30th anniversary of Doi Moi, global and domestic contexts have changed considerably. New opportunities and challenges are emerging, with important implications for sustaining inclusive growth and furthering human development.
2.2.1. The global economy arrives at a ‘new normal’
Overall, the global economy is transitioning
to a ‘new normal’ trajectory, with a discernibly
lower growth rate compared to previous
decades. Over the short to medium term, the
global economy is likely to continue facing
numerous challenges, including stagnation
and deflation in the European Union and
Japan. The slowdown of major emerging
economies, particularly Brazil, China and
the Russian Federation, have resulted in
reduced world demand for raw materials,
fuel and natural resources, thus affecting
countries that export primary products. Many
of these nations also export agricultural
goods, and their weakened currencies have
brought down agricultural prices, making it
considerably harder for Vietnamese farmers to compete in global and domestic markets. New types of vulnerability have emerged in
an unstable global political environment,
with unconventional security threats and new waves of refugees becoming increasingly serious and unpredictable. Climate change
poses a major additional global concern.
Over the medium to long term, technology and innovation is likely to play and ever greater role in propelling the global economy. Technological breakthroughs in
ICT, energy and electronics, among other fields, have the potential to result in a more
efficient and smarter world. Developed countries pioneering new technology have
more rapidly recovered from the 2008 crisis, while those that heavily rely on natural resources are undergoing a painful process of restructuring. These changes impact income distribution at both the global and national levels. In a technology-driven world, skills-biased technologies will further widen gaps not only between advanced and developing
countries, but also between skilled and unskilled workers within countries. Increasing
returns to ideas and entrepreneuship will
deepen divides between people at the very
top levels of income distribution and the rest.
Another important trend in the world
economy is the intensification of international
integration, including through a matrix of
free trade agreements at various levels.
Technological progress and international
integration go hand in hand in a mutually
reinforcing manner: intensified R&D activities
require large markets to recoup huge fixed
costs, while further liberalization spurs R&D
investments to seize increasingly lucrative
opportunities from enlarging markets, and
allows further specialization in technology,
notably through growing global and regional production networks.
Of direct relevance to Viet Nam are a number
of emerging trends that could have diverse impacts on inclusive growth. The first is the rise of Asia in the global economy and the emergence of China as the second
largest economy in the world.10 The former
has resulted in a number of governments
employing a new strategy of rebalancing towards Asia, while the latter has induced numerous multinational corporations
to employ the so-called ‘China Plus One’
strategy. They have been relocating their factories from China to nearby locations to
avoid rapidly rising labour costs in China while
Achieving Inclusive Growth l 55
targeting its rapidly growing middle class. Given its location, Viet Nam is now a favorite destination of new waves of FDI, including by multinationals that lead global value chains. This opens many new opportunities to sustain rapid and inclusive growth, and for workers to upgrade their skills.
A second trend is linked to the automation and digitalization of manufacturing processes. Capital and skills-intensive technologies are fast developing that would permit the transfer of production back to advanced countries, bringing goods closer to the final market and centres of research and design (Yusuf 2014). If these technologies mature rapidly, Viet Nam’s advantage in terms of low-labour costs could erode considerably, thus affecting the growth of manufacturing, which is crucial for
less developed economies to catch up with
more advanced ones (Rodrik 2014). Viet Nam
should do its best to capture opportunities
available before manufacturing returns to
developed countries, particularly given the
additional challenge of a potential shift away
from Viet Nam to other developing countries.
A third set of changes are linked to the free
trade agreements that Viet Nam has signed,
notably the Trans-Pacific Partnership. It has
the potential to help Viet Nam enhance its
global integration and advance its domestic economic reforms. There are a number of
optimistic forecasts on net benefits, even statements that Viet Nam may see the largest gains given the small size of its economy compared to other trading partners. Provisions on state-owned enterprises and industrial relations, however, may pose considerable implications for short-run adjustments. Most importantly, lessons learned from WTO accession indicate that benefits will not be automatic. Bold domestic reforms will be critical to maximize benefits and minimize costs.
2.2.2. Becoming more efficient and innovative
Viet Nam is struggling with outstanding problems from the late 2000s and the resultant cycle of slower growth. New challenges have arisen in entering a qualitatively new
development phase, as highlighted in Box 2.1.
The quest for macroeconomic stability and
large-scale structural reforms continue to
occupy the economic agenda. High levels
of bad debt within the Banking sector and
rapidly rising public debt will remain features
of the economny for some time, and will
constrain the Government’s policy space for
making intended breakthoughs in critical areas such as infrastructure, human capital
and improved social protection. The latter
is becoming increasingly important given a
rapidly ageing population.
Box 2.1. At the new stage of development, Viet Nam needs greater efficiency and more innovation to continue pushing forward its development
The Global Competitiveness Report classifies economies into three groups defined by income per capita, and presents 12 pillars of national competitiveness (Figure 2.4). Although all 12 pillars
matter to a certain extent for all countries, the relative importance of each one depends on a country’s particular stage of development, as shown in Table 2.2.
Applying this approach to Viet Nam’s development shows an impressive trajectory. It is now in transition from stage one, where growth is driven by factors or inputs such as low-cost labour, to
stage two, where it is propelled by growing efficiency. In stage one, constraints have included a relatively high investment rate of over 30 percent of GDP, the depletion of natural resources and an ageing population, imposing binding constraints on the labour market and the social protection system. The current government policy direction of refocusing efforts to improve economic
efficiency should help facilitate the transition.

l VIET NAM HUMAN DEVELOPMENT REPORT 201556
Figure 2.4. Pillars of national competitiveness
Source: World Economic Forum 2014, “The Global Competitiveness Report 2014-2015”
Table 2.2. Sub-index weights and income thresholds for stages of development
Source: World Economic Forum 2014, “The Global Competitiveness Report 2014-2015”
Figure 2.5. Where is Viet Nam now in the development trajectory?
Source: World Economic Forum 2014 and NHDR team construction.

Achieving Inclusive Growth l 57
A current policy focus on unleashing more
efficient growth is absolutely necessary, but
will not be sufficient to take the Vietnamese
economy as far as the more advanced
countries in East Asia. Only technology
and innovation can fuel enough growth
to overcome the so-called ‘middle-income
trap’ (Figure 2.5). Although it is still too early
for Viet Nam to be concerned about this, it
should start nurturing innovation, because
it takes considerable time to create this new
engine of growth, even though other drivers
are likely to quickly run out of steam.
Viet Nam has fared poorly on rankings
of technology and innovation,11 but new
opportunities have emerged due to the
growing presence of high-tech multinational
corporations leading global value chains.
These can help Viet Nam to become a new
global production hub for selected high-
tech manufacturing products. To capture
these opportunities, including towards
upgrading technological capabilities and
skills, and increasing internal value addition,
thereby avoiding an ‘assembly trap’, Viet Nam
should put in place appropriate institutions
and policies that can help Vietnamese
firms, particularly start-ups, to overcome
binding constraints related to capital, risk
management and high-quality human
resources. Otherwise, despite Viet Nam’s
efforts to accelerate its global integration, its
firms will not be able to move up the global
value chain.
A new growth model grounded in innovation,
technology, skills and participation in
global value chains would entail continued
exploitation of the country’s comparative
advantages, in combination with an
accelerated shift to economies of scale
based on high levels of specialization. Such
a shifting focus will help Viet Nam take full
advantage of intensified integration while
achieving its potential to rapidly accelerate
its development.
This process may have unfavourable impacts
on equal income distribution, however.
Technological progress tends to generate
structural shifts in favour of the educated,
thus widening the income gap between
skilled and unskilled labour. The rural-urban
gap may deepen as cities are able to exploit
economies of scale. Furthermore, the lack
of financial inclusion prevents poor but
talented people from seizing opportunities
because of their inability to borrow and
invest (Gill and Kharas 2007). Unequal initial
distribution of capital may also exacerbate
inequality, as returns to capital may grow
faster than that to low-skilled labour. These
risks highlight the utmost importance of
putting in place policies and institutions
to support equity, notably in health and
education and social protection to ensure
that growth is inclusive and human
development has a broad base.
Experiences from East Asian countries that
have sustained rapid and equitable growth
over an extended period of time provide
important insights for Viet Nam’s transition to
a higher development stage, as highlighted
in Table 2.3. Their experiences point to the
importance of economies of scale manifested
in the rise of intra-industry trade, idea-
driven economies and city-based growth.
They also underscore the need to effectively
re-distribute associated economic rents,
particularly through strengthening rural-
urban links and product market ties, making
cities livable, undertaking aggressive efforts
to ensure universal access to social services,
implementing progressive taxation and
spending to reallocate rents, and addressing
corruption (ibid).
Viet Nam has long striven to follow fast-
growing economies; advanced East Asian
countries offer the best benchmark.
Geographic proximity, cultural similarities,
and growing economic connections and
integration into regional production
networks will promote the sharing and
learning of experiences. The Vietnamese
economy has recently emerged from a
difficult period similar to the one many
East Asian countries experienced towards
the end of the 1990s. Their subsequent
spectacular recovery was due in large part to
the absorption of knowledge and the more
rapid dissemination of ideas.
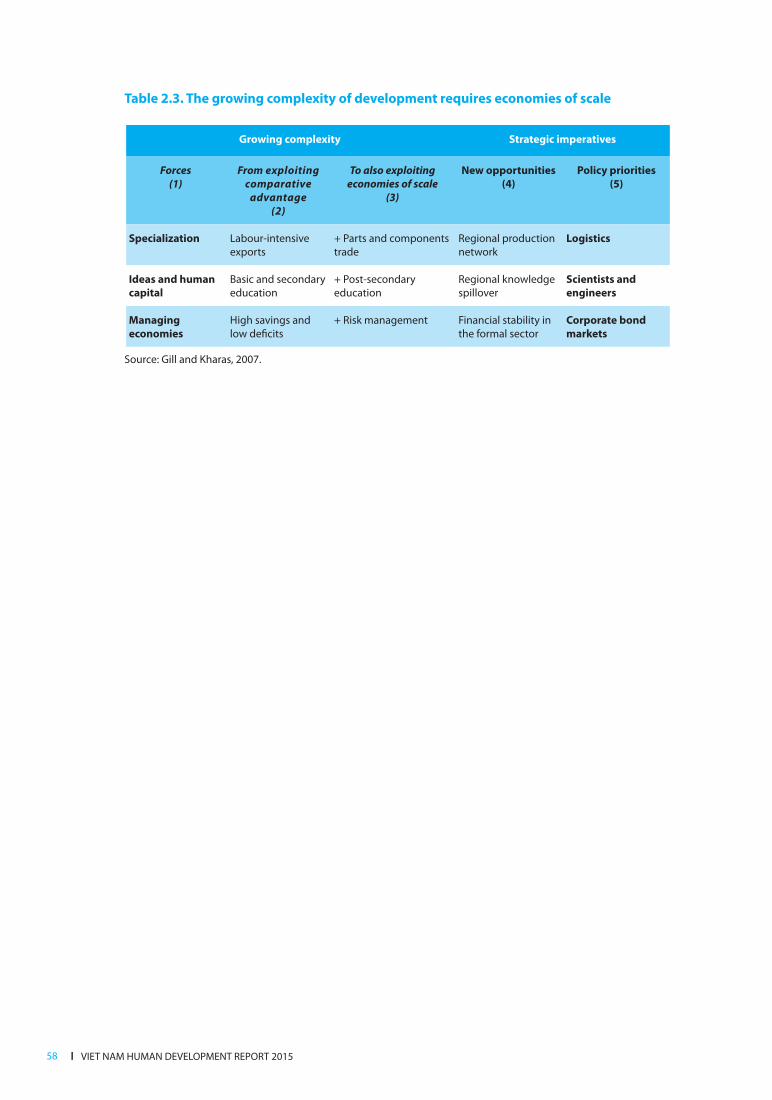
l VIET NAM HUMAN DEVELOPMENT REPORT 201558
Table 2.3. The growing complexity of development requires economies of scale
Growing complexity Strategic imperatives
Forces
(1)
From exploiting
comparative
advantage
(2)
To also exploiting
economies of scale
(3)
New opportunities
(4)
Policy priorities
(5)
Specialization Labour-intensive
exports
+ Parts and components
trade
Regional production
network
Logistics
Ideas and human
capital
Basic and secondary
education
+ Post-secondary
education
Regional knowledge
spillover
Scientists and
engineers
Managing
economies
High savings and
low deficits
+ Risk management Financial stability in
the formal sector
Corporate bond
markets
Source: Gill and Kharas, 2007.
Achieving Inclusive Growth l 59
For people of working age, employment is the main avenue to participate in and benefit from economic growth. Employment that is decent and productive contributes to inclusive growth that underpins human development.
Productive employment is critical both for individuals and families to improve their well-being, and for economies at large to grow and boost competitiveness. For Viet Nam, faced
with an ageing population12 and a declining
number of working-age people,13 higher
labour productivity is becoming increasingly
important to sustaining growth that is both
rapid and inclusive.
In recent years, productivity has accelerated,
but not enough compared to other countries.
It has been driven largely by the overall move
from agriculture to services and industry.
Within these sectors, however, Viet Nam
fares less well. Sectors need to become more
productive, through shifts from lower to
higher productivity activities. Investments
in higher level skills and appropriate
technology are urgent priorities, as is a more
rapid pace in the formalization of enterprises, since formally organized firms are more productive. FDI could play a larger role in
building productivity through stronger links
to domestic firms. Other important elements are specialization to secure places in global value chains as well as economies of scale.
Market-oriented reforms coupled with state investment in infrastructure have been
powerful forces behind Viet Nam’s impressive achievements in recent decades. These drivers are running out of steam, however. While Viet Nam should continue to strengthen economic fundamentals, the State should be more proactive in addressing market failures, helping overcome hurdles to acquiring and adopting productive technology and know-how. This depends on cultivating governance capabilities not only to meet the requirements
of a functioning State, but also those of a
proactive developmental State. It should be
well equipped to grasp the opportunities of
being a middle-income country, en route to
moving beyond that stage and avoiding the
middle-income trap.
2.3.1. Labour productivity growth has
been fast—but not fast enough
From 1994-2012, labour productivity in
Viet Nam grew by 4.44 percent per year on
average, the highest rate among the nine
ASEAN countries (Table 2.4).14 As a result, it has
narrowed labour productivity gaps relative to
its more advanced neighbours.15 But absolute
differences, except for Brunei and the Philippines, have widened. Compared with China and India, growth was considerably
slower (Nguyen Thang et al. 2014). If average
growth rates from 2007-2012 continue, Viet
Nam will likely catch up with the Philippines only in 2038, Indonesia in 2039 and Thailand in 2069, and never with China and India (Vu
Minh Khuong 2014).
Chapter 2.3: Enhanced opportunities through more productive employment

l VIET NAM HUMAN DEVELOPMENT REPORT 201560
Productivity growth can be achieved by
gains within sectors, and/or by reallocation
of employment from lower productivity
to higher productivity sectors through
structural change. A decomposition exercise16
reveals that of the 54 percent increase in
labour productivity between 2000 and
2010, 58 percent was explained by structural
changes and 42 percent by improvements
within sectors.17
From 2000-2012, productivity increased in
all three major sectors—agriculture, industry
and services—although at different rates.
Table 2.5 shows that value added per worker
in agriculture is considerably lower than
in industry and services, but agricultural
productivity experienced fast growth, more
than doubling from US $1,026 to US $2,179
(2005 PPP). Labour productivity in industry
and services increased at lower rates of 18
percent and 22 percent, respectively.
An OECD study for the same period found
that greater labour productivity meant higher
wages in all sectors. In particular, the large
increase in agricultural productivity went
hand-in-hand with a sizeable rise in earnings,
highlighting the importance of productivity
growth to rapid and inclusive growth.
Table 2.4. Viet Nam has the highest growth in labour productivity among nine ASEAN countries
Output per employed person, US$ 2005 PPP
Source: ILO’s Key Indicators of the Labour Market (KILM).
Table 2.5. Agricultural productivity has grown more rapidly than in other sectors, but value added is lower
2000-2012, US$ 2005 PPP
Source: Calculation by Nguyen Thang et al 2014 based on data of ILO KILM and WDI.
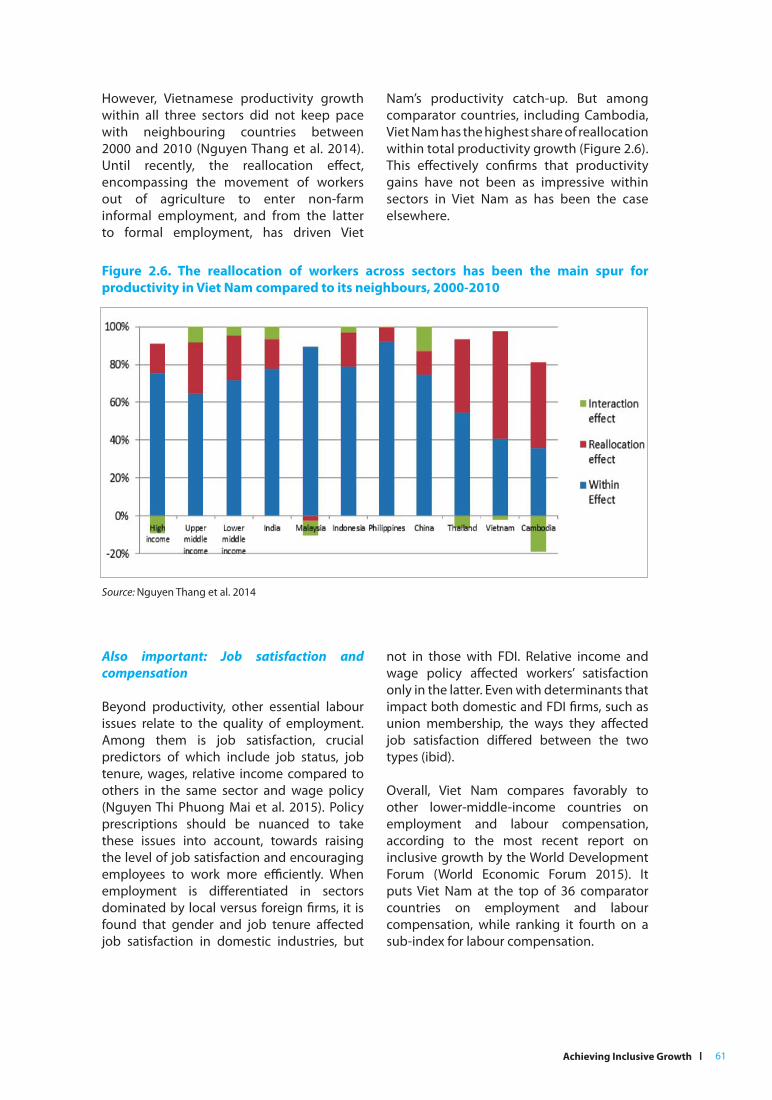
Achieving Inclusive Growth l 61
However, Vietnamese productivity growth within all three sectors did not keep pace with neighbouring countries between 2000 and 2010 (Nguyen Thang et al. 2014). Until recently, the reallocation effect, encompassing the movement of workers out of agriculture to enter non-farm informal employment, and from the latter to formal employment, has driven Viet
Figure 2.6. The reallocation of workers across sectors has been the main spur for productivity in Viet Nam compared to its neighbours, 2000-2010
Source: Nguyen Thang et al. 2014
Nam’s productivity catch-up. But among comparator countries, including Cambodia, Viet Nam has the highest share of reallocation within total productivity growth (Figure 2.6). This effectively confirms that productivity gains have not been as impressive within sectors in Viet Nam as has been the case elsewhere.
Also important: Job satisfaction and
compensation
Beyond productivity, other essential labour
issues relate to the quality of employment.
Among them is job satisfaction, crucial predictors of which include job status, job tenure, wages, relative income compared to
others in the same sector and wage policy (Nguyen Thi Phuong Mai et al. 2015). Policy
prescriptions should be nuanced to take these issues into account, towards raising
the level of job satisfaction and encouraging
employees to work more efficiently. When employment is differentiated in sectors
dominated by local versus foreign firms, it is found that gender and job tenure affected job satisfaction in domestic industries, but
not in those with FDI. Relative income and
wage policy affected workers’ satisfaction only in the latter. Even with determinants that impact both domestic and FDI firms, such as
union membership, the ways they affected
job satisfaction differed between the two types (ibid).
Overall, Viet Nam compares favorably to other lower-middle-income countries on
employment and labour compensation, according to the most recent report on inclusive growth by the World Development
Forum (World Economic Forum 2015). It
puts Viet Nam at the top of 36 comparator countries on employment and labour compensation, while ranking it fourth on a sub-index for labour compensation.

l VIET NAM HUMAN DEVELOPMENT REPORT 201562
There are some concerns about gender wage gaps, with women’s average earnings estimated to be 20-23 percent lower than those of men in the 2000s (Nguyen Bich Thuy et al. 2014). The gap is attributed to differences in workers’ characteristics (level of educational attainment, experience etc.) and social prejudice, but there is no clear trend in terms of differentials in income growth. The growth rate in 2013 was higher for female workers than for male ones, at 14 percent and 12 percent, respectively, but the trend was reversed in 2014, at 8.2 percent and 8.5 percent, respectively.18
2.3.2. Driving productivity growth: structural transformation
Viet Nam’s bold economic reforms since Doi
Moi have propelled substantial structural
transformation in the economy and labour
market, notably from agriculture to industry
and services, and from informal to formal
employment. Higher productivity has been
one major result—the formal sector, for
instance, despite providing jobs for only
about a third of the workforce, contributed to
almost 70 percent of national GDP in the past 10 years.
Change is happening for reasons that range
from sustained economic growth to new
enterprise laws to shifting demographics, yet
it still falls short of Viet Nam’s potential. Too many people are still in vulnerable informal employment, for instance. Too many firms,
especially smaller ones, have yet to reap the
benefits of formalization, such as access to financial services to help them grow and become more efficient. More attention and
investment is needed in the institutions
that support structural transformation; in
human capabilities, particularly education, that continually deepen the process; and in systems such as social protection that sustain progress over time.
Moving off the farm
The share of agricultural employment, which tends to be associated with low productivity and low income, declined significantly, from nearly 80 percent in the early years of Doi Moi to 47 percent in 2012. Shares in industry and services rose from 9 percent to 21 percent, and 19 percent to 32 percent, respectively, from early 1990 to 2012 (Figure 2.7).
Qualitative research on inclusive growth conducted for this report documented numerous cases of successful movement
out of agriculture. Interviews revealed
that among coffee growers in the Central
Highlands, only households that managed
to diversify into processing and trading
could sustain incomes in the face of large
price fluctuations and high market risk. In
other survey sites in rural areas, there were
numerous channels of movement out of
agriculture, such as engaging in various
rural off-farm activities, or migrating for
non-farm informal employment in other
locations.
In the purely agrarian province of An Giang,
if working away from home was rare among
agricultural workers with some rice land 10
years ago, it has become considerably more
common today because of shrinking profits from rice production. Interviews with migrant workers revealed that despite poor working conditions, they managed to save and send
remittances to their families in their home
villages (CAF 2014).

Achieving Inclusive Growth l 63
Factors explaining the transformation of
the labour market include the low starting
point and highly agrarian nature of the
economy; demographic dividends as a
higher population share of young people
entered high-productivity sectors in a rapidly
growing economy; and reforms in agriculture
and for enterprises, along with integration
into the global economy. At the regional
level, fast movement out of agriculture is
linked to local economic growth and distance
to major seaports.19 Viet Nam’s favourable
geographical characteristics, including its
long coastline, have facilitated integrated
national markets for goods and labour, and
play an important role in inclusive growth.
From self to wage employment
Relatively rapid economic growth is also
associated with a decline in self-employment,
from over 70 percent in 2002 to over 60
percent in 2012, and a corresponding increase
in wage employment from 30 percent to
under 40 percent.20 Although the category of
self-employed workers is not homogenous,
including owners of household businesses
who fall into this group by choice, these
workers in general are more vulnerable than
those in wage employment. The rising share
of wage employment is commonly seen as a
sign of more productive employment.
Among workers, those with less education
are more likely to be self-employed than
those with higher levels of schooling,
possibly reflecting the fact that the majority
of self-employed people in Viet Nam are own-
account workers. They tend to remain as such
or switch into self-employment, particularly
in trade and service sectors (To Trung Thanh
et al. 2015).
Vulnerable employment, which includes
unpaid family workers and own-account
workers, is increasingly used to track the
level of unproductive employment. The
share of vulnerable employment dropped
substantially from 66 percent in 2007 to 61.7
percent in 2009, but rose slightly to 62.8
percent in 2010, and then stabilized around
this figure during the slowdown from 2011
to 2014 (Figure 2.8).21 The persistently high
rate of non-farm informal employment
Figure 2.7. Work today is much less likely to be in agriculture
Source: NHDR team calculation based on World Development Indicators.

l VIET NAM HUMAN DEVELOPMENT REPORT 201564
30.5 33.4 33.7 34.6 34.7 34.8 35.4
13.017.0 19.5 18.6 17.4 17.2 21.6
53.0 44.7 43.3 43.9 45.2 45.5 40.9
3.3 4.8 3.4 2.9 2.7 2.5 2.10.0
10.0
20.0
30.0
40.0
50.0
60.0
70.0
80.0
90.0
100.0
2007 2009 2010 2011 2012 2013 2014
Member ofcooperative
Wage worker
Unpaid familyworker
Own-accountworker
Employer
Vulnerableemployment
indicates that while the movement out of agriculture may be a route out of poverty for many people, as evidenced by decades of rapid poverty reduction, many workers
are still caught in the non-farm informal sector with low earnings, poor working conditions and no access to the formal social protection system.
Figure 2.8. Too many people are still caught in vulnerable employment, which undercuts productivity
Source: NHDR team calculation based on Labour Force Survey data.
Viet Nam’s informal sector is similar to that
in other developing countries (Cling et al.
2010), with characteristics directly relevant
to inclusive growth. The non-farm informal
sector exists on the fringes of the rest of the
economy, with little attention from the state.
Purchases from the non-farm informal sector
and sales to the formal sector are modest, and
there is no support from financial institutions,
resulting in capital shortages and associated
low investment rates. These barriers bar
workers from full participation and limit
benefits from the broader economic growth
process, even in good times.
In challenging times, the non-farm informal
sector acts as a buffer to absorb labour from the
shrinking formal sector, resulting in a further
squeeze on earnings and the worsening of
already precarious working conditions (CAF
2009 and 2011). More inclusive growth will
depend on reducing the non-farm informal
sector’s many disadvantages.
Qualitative research for this report
documented constraints on improvements
in earnings among informal workers. Migrant
workers who had found informal jobs in
cities did not expect to stay there longer
than 10-15 years because of the heavy
work and the difficulties of integration into
the local community. Declining demand
for outputs, rising costs of inputs and high
borrowing rates were cited by owners of
household businesses in craft villages as
major hindrances to expansion. In upland
areas, respondents reported that off-farm
opportunities have dried-up in the last five

Achieving Inclusive Growth l 65
to seven years. In urban and peri-urban areas, youth are often not satisfied with low-paid employment without prospects for skill upgrading and long-term careers. Many opt not to work, relying instead on their parents (CAF 2014).
A progressively more formal economy
An important indicator of productive employment is the share of formal employment, defined as involving those
The shift from non-farm informal to formal
employment has two parts: the choice of firms to become registered as formal businesses, and the shift of workers from agriculture and the non-farm informal sector to work in
formal firms. The first part often relates to a
simple cost-benefit analysis. If the benefits of
formalization are greater than the costs, firms will have incentives to move in that direction.
International experiences point to a number of factors that influence the behaviour of
firms in terms of formalization. Informality undercuts property rights, formal contract mechanisms, financial services (Levenson
and Maloney 1998; Rand and Torm 2012)
and international trade (Tenev et al. 2003). But remaining informal can offer benefits depending on the regulatory burden and
legal quality (Tenev et al. 2003 and Dabla-
Norris, Gradstein, and Inchauste 2005).
Factors influencing formalization include high tax burdens and/or costs of complying with regulatory requirements (Marcouiller and
Young 1995; Friedman et al. 2000; Azuma and
Grosman 2002; Giles and Tedds 2002; Straub 2005), entry costs (Auriol and Warlters 2005), labour costs (Friedman et al. 2000; Johnson, Kaufmann, and Shleifer 1997; Botero et al.
2004) and the level of financial development
(Straub 2005).
Economic growth and human capital
intersect with these issues to determine the
pace of formalization. Informality declines, though slowly, with economic growth and
development. Human capital matters (La Porta and Shleifer 2014) since more educated
working in registered institutions and covered by the formal social protection system, among other basic criteria.
Figure 2.9 shows that the share of formal employment rose from 28.2 percent in 2007 to 33.7 percent in 2014, with increases for both sexes. The change was not entirely one way, declining between 2011 and 2013, when the economy substantially slowed. This trend has closely mirrored growth in the Vietnamese economy.
Figure 2.9. Formal employment has grown, but progress has slowed
Source: NHDR team calculation based on GSO Labour Force Survey data.
l VIET NAM HUMAN DEVELOPMENT REPORT 201566
entrepreneurs can run productive businesses to capture opportunities presented by rapid growth, while those with a low level of human capital cannot. Rapid growth in formal enterprises is normally associated with larger numbers of new firms. Existing informal firms, by contrast, rarely become formal, resulting in a persistent dual economy.
In Viet Nam, the formal sector, despite providing jobs for only approximately a third of the total workforce, contributed to almost 70 percent of national GDP in the past 10 years. A number of factors have influenced formalization, including business size, income and working (McCaig and Pavcnik, 2013). The education level of entrepreneurs influences their behaviour when working under regulations. The number of years of
business operation apparently has no impact
on registration.
For small and vulnerable businesses, informal
status may result from the lack of alternative
options. Firms tend to be run by older
entrepreneurs, which may indicate that older
people prefer self-employment (Marcouiller
et al. 1997), but could also suggest that
older and less-educated people have trouble
finding wage employment (Cunningham and
Maloney 2001).
Firms moving from formal to informal status
are either weak businesses with no potential
to expand or those seeking to escape
government regulations.
Formal firms and those moving from informal to formal status are stronger and younger businesses that achieve the highest efficiencies. They are often run by the youngest entrepreneurs with high levels of education and technical skills. Many are modern enterprises with access to IT, and achieve high levels of efficiency that grant them more opportunities to grow. When firms in this group cite capital, labour and technical shortfalls as their greatest constraints, these could be seen as problems of success. The capital constraint also comes from government ignorance of SMEs however (Nguyen and Van den Berg 2014), and this problem should be addressed properly. Being formal is accompanied with regulation—52 percent of firms in this group state that they were inspected in 2011. But since these firms
became formal by choice, the benefits clearly
outweigh the costs.
With regard to how the quality of local
governance affects formalization;
improvements in institutions, particularly
in terms of property rights, make firms more
likely to choose the formal sector from the
start (Malesky and Taussig 2009). Macro-
level factors that influence formalization,
beyond rapid growth sustained over time,
include expanded manufacturing and
services, urbanization and ownership
structures (La Hai Anh and Nguyen Kim Thai
2015) (Box 2.2).

Achieving Inclusive Growth l 67
Another accelerant has been global
integration through rising exports and FDI.
Falling export costs expand employment in enterprises—employment in household
businesses has declined more in areas with industries that secured larger United States tariff cuts under the 2001 Viet Nam-US Bilateral Trade Agreement (McCaig and Pavcnik 2013). The magnitude is larger in
more internationally integrated provinces
and among younger workers. Looking
forward to the Trans-Pacific Partnership, a number of labour-intensive and export-oriented manufacturing sectors such as textiles, garments and footwear could grow
fast, accelerating the formalization process.
Formal employment’s association with urbanization and the large productivity boost
from economies of scale22 raise important
issues around the participation of workers
from peripheral provinces. There is, however, an equalizing force—migration, often the
major channel for workers from poorer provinces to secure formal employment in provinces with more intense business activities. Large shares of migrants work in four labour-intensive and export-oriented
manufacturing sectors—textiles and
garments, footwear, electronics and wood
processing. Shares of migrants surpass 40 percent in the first three and approximately 35 percent in the last (see Figure 2.10) (Pham Minh Thai and Vu Thi Van Ngoc 2015). Further expansion of these sectors could
provide more opportunities for productive employment, and in the process contribute to inclusive growth.
Box 2.2. To formalize or not: Size, sector and space all matter
Formalization varies by sector. Manufacturing and services dominate, contributing to nearly
80 percent of total formal employment, with the share growing over time. Manufacturing
has been the sector with the highest share of foreign investment, especially in high technology. For
services, the contribution of FDI to formal employment remains low, but is showing improvement.
There is a close relationship between formal employment and urban agglomeration, reflected
in the size of population, the density of enterprise distribution and the intensity of economic
activities. The rate of formalization is often higher in provinces with greater urbanization. In Viet
Nam, the majority of employment in manufacturing and services is concentrated around Hanoi and Ho Chi Minh City, but with some divergence. While manufacturing jobs are shifting from
these megacities to neighbouring areas (such as Binh Duong, Dong Nai and Long An near Ho
Chi Minh City, and Bac Ninh and Hai Duong near Hanoi), employment in services is increasingly
concentrated in these two large cities.
At the national level, manufacturing is more spatially concentrated than services. Against
expectations, in both sectors, the degree of spatial concentration gradually decreases over time
and more rapidly for the services sector. Within manufacturing, the degree of spatial concentration
is high for all high-tech sub-sectors, and particularly high for electronics, computers and optical products. On the other hand, despite their strong contribution to employment, textiles and food processing display lower levels of spatial concentration. In services, knowledge-intensive activities are often more spatially concentrated than those with less knowledge intensity.
Ownership and firm size also have an impact. In manufacturing, sub-sectors with higher shares of employment linked to foreign investment are often more spatially concentrated, as are sub-sectors in services with higher shares of employment from foreign enterprises or private firms with over 50 workers. Sub-sectors are more dispersed when the employment share of private firms with under 50 workers is higher.
Source: La Hai Anh and Nguyen Kim Thai 2015, based on 2012 Enterprise Census data
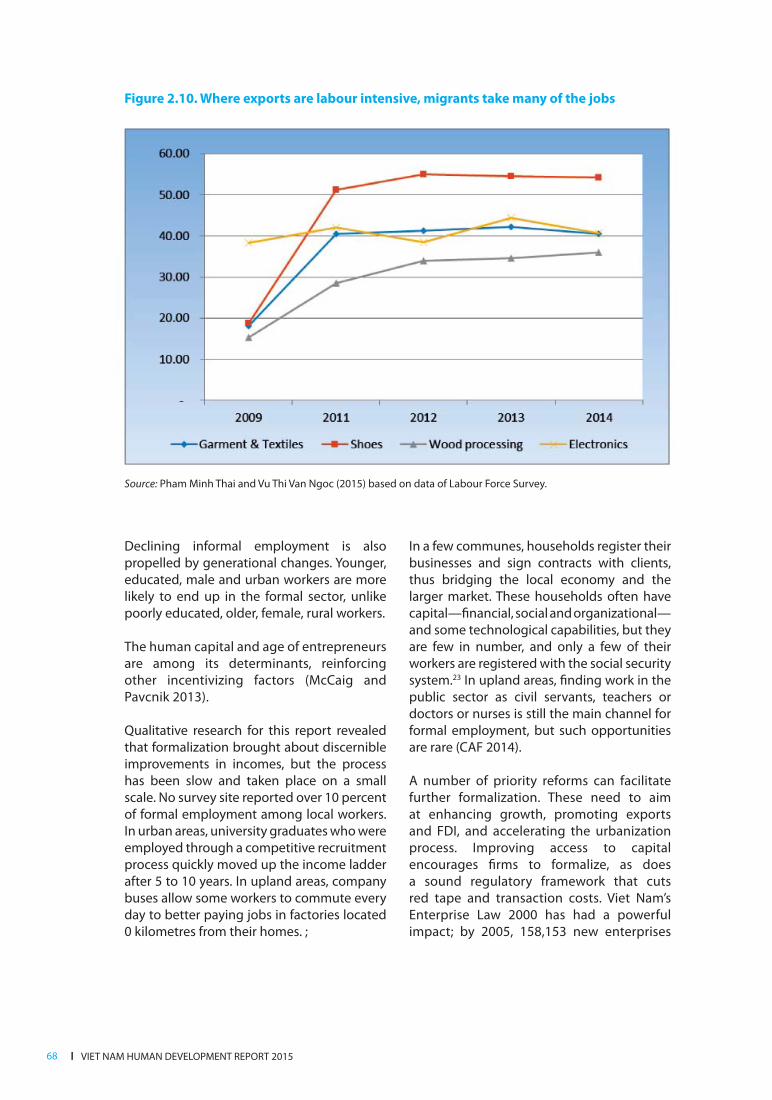
l VIET NAM HUMAN DEVELOPMENT REPORT 201568
Declining informal employment is also
propelled by generational changes. Younger,
educated, male and urban workers are more
likely to end up in the formal sector, unlike
poorly educated, older, female, rural workers.
The human capital and age of entrepreneurs
are among its determinants, reinforcing
other incentivizing factors (McCaig and Pavcnik 2013).
Qualitative research for this report revealed
that formalization brought about discernible improvements in incomes, but the process has been slow and taken place on a small
scale. No survey site reported over 10 percent
of formal employment among local workers. In urban areas, university graduates who were
employed through a competitive recruitment process quickly moved up the income ladder
after 5 to 10 years. In upland areas, company
buses allow some workers to commute every
day to better paying jobs in factories located 0 kilometres from their homes. ;
In a few communes, households register their
businesses and sign contracts with clients,
thus bridging the local economy and the
larger market. These households often have
capital—financial, social and organizational—
and some technological capabilities, but they
are few in number, and only a few of their
workers are registered with the social security
system.23 In upland areas, finding work in the public sector as civil servants, teachers or doctors or nurses is still the main channel for
formal employment, but such opportunities
are rare (CAF 2014).
A number of priority reforms can facilitate further formalization. These need to aim
at enhancing growth, promoting exports
and FDI, and accelerating the urbanization process. Improving access to capital encourages firms to formalize, as does
a sound regulatory framework that cuts
red tape and transaction costs. Viet Nam’s
Enterprise Law 2000 has had a powerful impact; by 2005, 158,153 new enterprises
Figure 2.10. Where exports are labour intensive, migrants take many of the jobs
Source: Pham Minh Thai and Vu Thi Van Ngoc (2015) based on data of Labour Force Survey.

Achieving Inclusive Growth l 69
had been registered, raising the total number to 203,115, and the average size of firms grew (Nguyen Dinh Tai 2006). At the sub-national level, transparency in local governance may encourage investment by formal private firms (McCulloch et al. 2013).
Policies and institutions that support human capital formation and enhance labour mobility also facilitate formalization. Viet Nam has advantageous geographical traits. Connectivity has significantly improved in recent decades through considerable investments in roads and other types of hard infrastructure. Viet Nam has also benefited from the relatively egalitarian distribution of human capital since Doi Moi, notably manifesting through high literacy rate. Both the State and parents have made
considerable investments in the education
of children, making them well-positioned to
take up formal employment.
For older workers, who may be poorly
educated and unlikely to shift to formal
employment, it is important to put in place
measures to ensure that they are not left
behind, and their children do not suffer
from inequality of opportunity. Accessible
and high quality social services and social
protection are critical.
2.3.3. Productivity within sectors still
falls short
While Viet Nam has done relatively well
in improving productivity through shifts
among different sectors, growth within sectors has lagged that in similar economies, including lower-middle-income countries. A higher level of growth will depend on greater productivity both in formal employment and in rural areas. Viet Nam needs to consider moving on both fronts in the hear future, as the effect particularly of labour moving out of low-productivity agriculture diminishes with the shrinking share of agricultural employment.
Making the most of formalization
Promoting the formalization of the economy in general and the labour market in particular is a necessary step, but far from sufficient to rapidly raise labour productivity. Within the formal sector, there is a high degree of
heterogeneity, and considerable variation in
productivity across and within sub-sectors
and across different firms. Productivity
growth in the formal sector typically occurs
through two channels: by reallocating labour
between sub-sectors and/or by raising
productivity in firms.
Encouraging highly productive sub-sectors
The OECD classifies formal sector firms
into four groups within manufacturing
and five groups within services (Figure
2.11). These are relatively homogeneous in
terms of productivity, which is consistent
with respective degrees of technological sophistication and/or knowledge intensity.

l VIET NAM HUMAN DEVELOPMENT REPORT 201570
Using this classification, shows some positive
trends with regard to structural change in
Viet Nam, but also demonstrates that these
have plateaued in recent years. Within formal
employment in manufacturing, there has been
an overall shift towards greater productivity.
Low-tech manufacturing contracted slightly,
while high-tech manufacturing expanded,
although its share is still small. Employment in medium high-tech manufacturing grew considerably in the mid-2000s and then
stabilized. Employment in medium low-tech
manufacturing shrank in the mid-2000s before also stabilizing.
As manufacturing is the most open sector
to international competition, these trends are presumably linked to various trade
agreements, notably, the Viet Nam-United
States FTA, which helped make the business
environment more conducive to domestic
and foreign investment, key to the expansion
of high-tech manufacturing. In the late
2000s, slowing institutional reforms and
rising macroeconomic instability appeared to
dampen these changes.
Within the service sector, similar patterns
are at work. The combined shares of the
three sub-sectors with higher productivity—
high-tech knowledge-intensive services, knowledge-intensive financial services and other knowledge-intensive services—
increased substantially in the mid-2000s and then stabilized.
Figure 2.11. Labour productivity is concentrated in the higher-tech ends of manufacturing
and services
Source: NHDR team calculation based on Enterprise Census 2012 data.
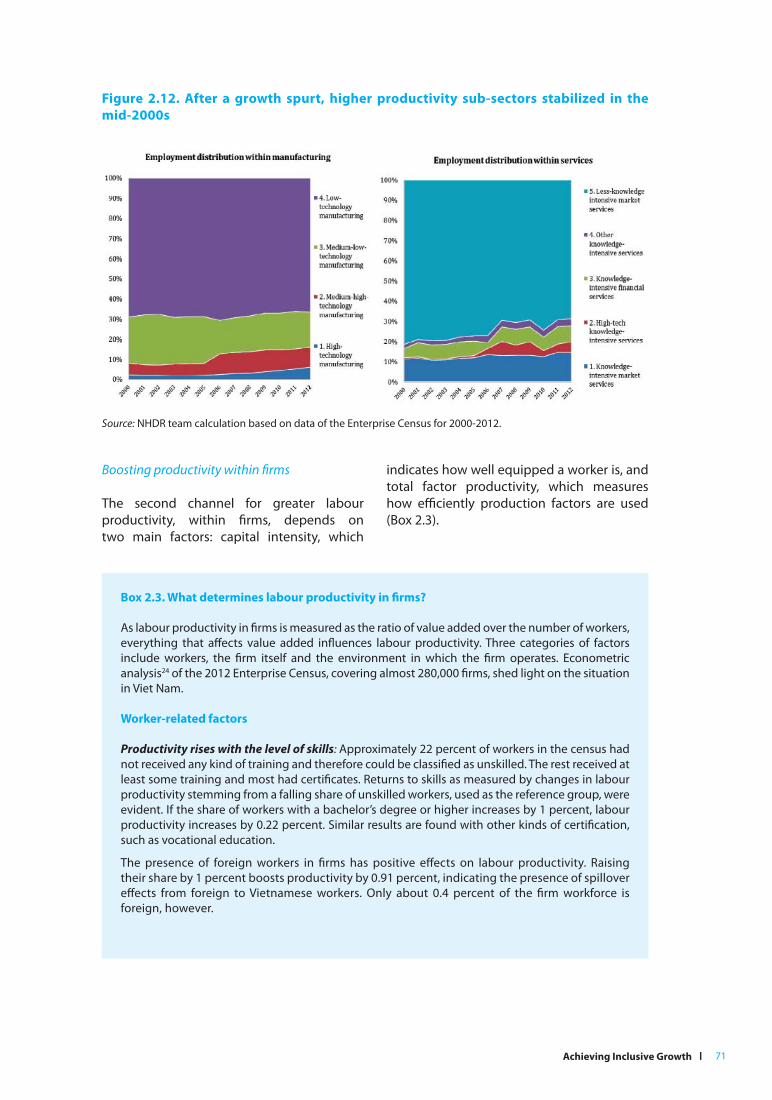
Achieving Inclusive Growth l 71
Boosting productivity within firms
The second channel for greater labour
productivity, within firms, depends on
two main factors: capital intensity, which
indicates how well equipped a worker is, and
total factor productivity, which measures
how efficiently production factors are used
(Box 2.3).
Figure 2.12. After a growth spurt, higher productivity sub-sectors stabilized in the mid-2000s
Source: NHDR team calculation based on data of the Enterprise Census for 2000-2012.
Box 2.3. What determines labour productivity in firms?
As labour productivity in firms is measured as the ratio of value added over the number of workers, everything that affects value added influences labour productivity. Three categories of factors include workers, the firm itself and the environment in which the firm operates. Econometric analysis24 of the 2012 Enterprise Census, covering almost 280,000 firms, shed light on the situation in Viet Nam.
Worker-related factors
Productivity rises with the level of skills: Approximately 22 percent of workers in the census had not received any kind of training and therefore could be classified as unskilled. The rest received at
least some training and most had certificates. Returns to skills as measured by changes in labour productivity stemming from a falling share of unskilled workers, used as the reference group, were
evident. If the share of workers with a bachelor’s degree or higher increases by 1 percent, labour
productivity increases by 0.22 percent. Similar results are found with other kinds of certification, such as vocational education.
The presence of foreign workers in firms has positive effects on labour productivity. Raising their share by 1 percent boosts productivity by 0.91 percent, indicating the presence of spillover
effects from foreign to Vietnamese workers. Only about 0.4 percent of the firm workforce is foreign, however.

l VIET NAM HUMAN DEVELOPMENT REPORT 201572
Firm-related factors
Capital deepening is important: Raising the ratio of capital over labour, which measures how well
workers are equipped, a 1 percent increase will increase labour productivity by 0.2 percent.
Firm size is important up to a turning point: The size premium, as measured by the productivity
gap between different firm sizes over micro-firms (with under five workers) as a reference group,
exhibits an inverted U-shape pattern. Firms with between 100 and 300 workers are the most
productive, by 50 percent more than the reference group, making firm size an important factor
of productivity. Presumably size facilitates the learning process among peers, as well as other
advantages associated with scale. The inverted U-shape also indicates a turning point in the size
premium, however, where costs, likely associated with limits on managerial capabilities, outweigh
the benefits of bigger size.
Firm’s managerial capabilities matter: In looking at the level of educational attainment of a firm’s
top manager, if the manager holds a master’s degree or higher, labour productivity increases by
0.17 percent on the base case, where the manager has only a junior college degree or lower. This
figure is quite small, at 0.03 percent, for managers with a university degree.
Participating in global market helps: Firms engaged in export and or import activities are 35
percent more productive than those that are not.
Engaging in innovation activities enhances productivity: If measured by having R&D in-house, the bonus is quite high, estimated at a 19.3 percent increase in productivity over firms that do not have any R&D. Despite this fact, only a tiny fraction of firms (0.2 percent of the total) engage in R&D.
Beyond workers and firms
Sector premiums: As classified by the OECD, medium-tech and high-tech manufacturing firms are more productive than low-tech firms by 0.11 percent and 0.09 percent, respectively.
Locational advantages: Being located in Ho Chi Minh City raises productivity by 14.7 percent over Hanoi, 16 percent over the South East (excluding Ho Chi Minh City) and 34.6 percent over the Red River Delta (excluding Hanoi). An increase in the urban share of the population in an area where a firm is located raises productivity by 0.14 percent.
Clustering: An increase in the spatial concentration of firms from the same sector raises firm productivity by 0.11 percent.
Source: Nguyen Thang et al. 2014.
Qualitative research for this report documented cases where workers in formal firms moved up the income ladder due to
accumulated experience, improved skills
and effort. Some started newly registered
firms, building on knowledge and experience acquired during years in formal wage
employment. These people are few in number, however. Most workers in industrial
parks seem to end up trapped in assembly
lines with meager incomes and little prospect of skill development. Numerous respondents
from among workers in formal firms said that after adjusting for the higher cost of living
in urban or peri-urban areas, their earnings are less than those of middle-income rural workers (CAF 2014).
With regard to a firm’s size, which can
be a determinant of labour productivity, undersized firms prevail in all sectors
classified under the OECD definition (Tran
Thi Bich and La Hai Anh 2015). One consistent barrier to expansion is the absence of a subcontracting system, which hinders
the participation of Vietnamese firms in global value chains and the achievement of economies of scale.
Achieving Inclusive Growth l 73
While numerous policies exist to support small and medium enterprises, similar to those in the Republic of Korea, implementation in Viet Nam is far from effective or responsive to industry demand. Policy coordination across various agencies responsible for industry, labour, and education and training is generally weak, which considerably constrains the growth of small and medium enterprises.
Exports also can determine labour productivity at the firm level. Businesses with relatively high productivity tend to ‘self-select’ into exports, particularly those producing in line with Viet Nam’s comparative advantage in labour-intensive products (Pham Thu Tra et al. 2015). Those that experienced a relatively large increase in export intensity have
achieved higher total factor productivity,
including through learning linked to the export process, and a relatively large increase in labour intensity, explaining why entry into the world market can spur inclusive growth.
Other important factors that help boost labour productivity include FDI, considered part of international integration. For a developing country at a low level of development such as Viet Nam, FDI can play an important role in upgrading technological capabilities and skills, and facilitating structural changes in general and the transition within formal employment in particular. Analysis of the impact and role of FDI from an inclusive growth perspective provides useful insights, suggesting it supports inclusivity to the extent that it contributes to GDP, creates more jobs and fosters a decent work environment
(Box 2.4).
Box 2.4. Foreign Direct Investment: Performance and impacts
Performance
Viet Nam has been reasonably successful in attracting FDI since it implemented the
Foreign Investment Law in 1987. According to the Ministry of Planning and Investment,
from 1987 to April 2014, total inflow commitments were approximately US $237 billion.
In 2012, foreign-invested enterprises contributed around 63 percent to export volume,
23.3 percent to investment structure, 18.1 percent to GDP, 43.3 percent to industrial
output and 29.6 percent to total budget revenues (excluding oil).
In terms of employment and wages, up to 2012, FDI projects in Viet Nam employed 2.6 million workers, accounting for 24 percent of total labour. These enterprises mainly invest in capital-intensive industries that employ skilled workers, which may explain higher
wages for technical and managerial positions. Workers are able to access advanced technology, associated with good work discipline and modern working methods. FDI also indirectly creates many jobs in the service sector, mainly in firms supplying raw materials and intermediate products to foreign-invested enterprises.
Impacts
FDI and technology and skills transfer: FDI contributes to enhanced production efficiency in domestic manufacturing enterprise through positive competition and
demonstration effects (Nguyen Dinh Chuc et al. 2008), but there is a need to reduce the technology gap and improve labour quality in domestic enterprises to maximize the benefits of strengthened links with FDI firms (Hoang Van Thanh and Pham Thien Hoang
2010, Nguyen Thi Tue Anh 2009). Furthermore, productivity impacts and spillovers of FDI vary considerably across the eight regions of Viet Nam, being strongly positive in the Red

l VIET NAM HUMAN DEVELOPMENT REPORT 201574
Setting the stage for greater productivity
With formalization, a number of factors are conducive to enhancing productivity within
sectors and firms, with greater international integration among them. Despite recent
criticisms related to tax evasion, transfer pricing, environmental pollution, etc., which
are valid, FDI has opened new opportunities. With the recent arrival of a number of
multinational corporations leading global value chains in high-tech manufacturing, helped by its advantageous location and
the continued efforts of the Government to accelerate integration, Viet Nam has
strong potential to become a manufacturing
powerhouse.
But if the current window of opportunities is
not used effectively, Viet Nam will not move as
River Delta, South Central Coast, South East and Mekong River Delta. They are largely absent in other regions, presumably because of weak backward links with domestic firms (Anwar and Nguyen 2013).
Changes in employment and productivity of local workers: the extent to which employment in foreign affiliates represents additional job creation partly depends on the mode of entry of foreign firms. Greenfield FDI generally has a stronger magnitude in terms of job creation than mergers and acquisitions. Employment is mostly in 100 percent foreign invested capital companies, while employment in joint ventures is minimal (Nguyen et al. 2003 and Jenkins 2006). Direct employment generated by FDI is not very significant, because most of the labour force is still in the agricultural and service sectors, where FDI has been minimal. FDI may increase productivity, which can generate more productive employment or an increase in wages (Meyer and Nguyen 2005, Jenkins 2006).
Wage spillovers: Wage levels in domestic firms are higher in sectors with more foreign firms, despite different labour market conditions and firm characteristics. Domestic firms with backward links to foreign firms benefit from productivity spillovers and therefore can pay higher wages, but the magnitude of the effect depends on the specific
characteristics of firms and industries. Training facilitates wage spillovers (Le Quoc Hoi
and Pomfret 2010).
Integration into the global production network: FDI benefits are greater where
foreign-invested enterprises create strong links with the local economy by transferring
technology and managerial skills, facilitating the participation of local firms in their value
chain and making local firms their suppliers. A study for this report, however, found that
very few Vietnamese firms can join in the global production network. The inclusiveness
of FDI is also unclear. A common characteristic of successful firms is that the founder
used to be an employee or manager of a foreign-invested enterprise. After gaining some
knowledge in technology and management skills and experience, he or she resigned to
open his or her own business in the same field as the FDI firm. Later, through his or her
own network, the firm becomes a supplier to or sub-contractor of FDI firms.
The number of such firms in Viet Nam is expected to rise, particularly when Samsung
or Nokia expand their production. Fully capitalizing on their potential requires efforts
by the Government to induce these multinational corporations to find more local supporting partners.
Source: Adapted from Nguyen Ngoc Anh et al. 2015.
Achieving Inclusive Growth l 75
far as it wants, particularly once wages rise to a
level that induces multinational corporations
to move to other parts of the world (and even
back to developed countries). Among other
priorities, as part of boosting productivity,
Viet Nam needs to strengthen links between
FDI and domestic firms, particularly those
that are small and medium sized.
In general, Viet Nam should do more than
solely rely on the market if it wants to
avoid ‘the assembly trap’, a low level form
of the middle-income trap. The State has
a very important role in addressing both
market failures and equity concerns that
can undercut momentum, as East Asian
countries have demonstrated (Gill and
Kharas 2007). Overcoming often huge
hurdles in adapting new technologies and
absorbing high risks related to innovation
can require state involvement.
An appropriate industrial policy should
bring the Government and the private
sector together to jointly identify problems,
opportunities and appropriate solutions for
encourage productivity in promising sub-
sectors and firms. It needs to remain linked
to country context and the important issue of
governance capability, and should be allowed
to evolve over time.
Industrial policy should follow three key
principles: First, it is more important to create
a climate of collaboration between the
Government and the private sector than to
simply provide financial incentives. Second,
industrial policy needs to rely on both carrot
and stick. Third, it needs to be carried out
in a transparent and accountable manner,
and be open to new entrants as well as
incumbents. While mistakes may happen, as
the economist, Dani Rodrik observes “(t)he
trick is for governments to recognize those
mistakes and withdraw support before they
become too costly…. A government that
makes no mistakes when promoting industry
is one that makes the bigger mistake of not
trying hard enough.” (Rodrik 2010)
Horizontal policies, which constitute a
softer version of industrial policy, aim to
reduce market failures for all business
sectors, but may not be sufficient. Successful
countries have more often had ‘vertical’ or
targeted policies that addressed failures
affecting particular sectors or technologies
(Khan 2015).
For Viet Nam, a proactive industrial policy
should include several key elements:
market-driven development under
globalization; a strong State that guides
and supports development even if all
productive activities are conducted by the
private sector; sufficient policy instruments
for latecomer industrialization; dynamic
capacity development; internalization of
skills and technology; effective public-private
partnership; and deep knowledge of industry
to enhance the quality of industrial policy
(Ohno 2009).
In the current context of decentralization
of public administration, better local
governance is strongly associated with FDI
(Malesky 2007), as is systematic legal reform,
proactive local leadership and available
labour training. In turn, FDI can influence the
quality of local governance, including through
empowering local leaders to push forward
reforms (Malesky 2008). While FDI inflows can
increase efficiency and accelerate growth in
some areas, however, they can also result in
a ‘two-speed’ country, with rising disparities
between provinces with higher degrees of
global integration and more proactive and
capable local governance on the one hand,
and the rest on the other hand. From the
central vantage point, the State can promote
better balance, such as by disseminating the
best practices of well-governed provinces to
all local authorities to inspire a healthy race
to the top, and facilitating labour mobility for
more equal access to quality employment.
Making agriculture more productive
Despite agriculture’s shrinking share of
GDP and employment, it continues to
play an important role in the Vietnamese
economy, providing jobs, food security and
foreign exchange earnings. Agricultural
GDP has grown at a steady pace, averaging

l VIET NAM HUMAN DEVELOPMENT REPORT 201576
approximately 3 percent per year since 1996. Trade performance has been even higher, with both exports and imports rising substantially, making the sector highly integrated into the global economy. The value of exports has consistently and by a large margin exceeded that of imports, resulting in a steadily expanding net agro-food trade balance over the last couple of decades (Cervantes-Godoy 2010).
Agriculture will continue to be at the heart of inclusive growth in Viet Nam for many years to come, as it provides livelihoods to millions of poor and low-income rural households. Raising labour productivity there is key to lifting rural incomes in general and incomes of the rural poor in particular.
Over the last three decades, Viet Nam did
relatively well in terms of labour productivity
growth in agriculture compared to other Asian countries (see Figure 2.13). Only more advanced Asian countries, such as China, Japan, Malaysia and the Republic of Korea, achieved higher rates. Growth of total factor productivity, a major component of labour productivity,25 also showed a positive trend, averaging approximately 3 percent per year during 1981-2006, a pace on par with the best performing agricultural economies in the world (Cervantes-Godoy 2010).
Productivity growth in agriculture stems from the reallocation of labour, land and other resources across agricultural sub-sectors, and productivity gains within sub-sectors. As agriculture has a high degree of variation in productivity—both in levels and rates of growth—the first element raises aggregate
productivity through shifting resources from
lower to higher productivity sub-sectors.
Figure 2.13. Growth in agricultural productivity in Viet Nam has surpassed rates in most
Asian countries except those that are significantly more advanced
Gross value-added per agricultural worker, in constant 2000 US dollars, annualized growth,
1980-2010
Source: Constructed from Table 2, Briones and Felipe (2013).
Liberalization has brought higher agricultural
value-added
Structural change within agriculture, from traditional to high value products, is evident.
Figure 2.14 shows that the share of cereals declined substantially, from 61.5 percent in
1970 to 43.1 percent in 2010, while shares
of fruits, vegetables and livestock rose. The
trend of a shrinking share of cereals has occurred across 16 countries in Asia (Briones and Felipe 2013),26 but only two countries experienced more rapid reductions during
the same period than Viet Nam: China and the Republic of Korea.

Achieving Inclusive Growth l 77
Structural change within agriculture was
well documented in the qualitative research
to support this report. Respondents shared
their own experiences of increasing shares
of pork production while reducing shares of
lower value corn cultivation. Some employed
a model of integrated corn growing and pig
raising, with incomes from the former used
for day-to-day expenditure while those from
the latter covered big spending. Growing
marketed vegetables or mushrooms was
mentioned as part of income diversification
by numerous respondents; some even supply
directly to supermarkets, while others have
set up links within supplier networks.
Many respondents reported that they
are unable expand their production and
associated incomes, however, because of
limits on their land or financial resources.
Market prices of outputs and inputs have
fluctuated in a wide range, squeezing their
profits. Production risks such as floods
and droughts, and animal deaths have
added other difficulties. Some respondents
even reported shrinkages in production
(CAF 2014).
Behind the considerable structural changes
within agriculture are several processes of
economic liberalization. Price liberalization
in the early years of Doi Moi and subsequent
external liberalization have induced the
reallocation of resources within agriculture
to better align with comparative advantages
in numerous agricultural products. Internal
liberalization has provided added incentives
for farmers to work to their full potential.
Improved infrastructure has helped farmers
better connect with consumers, fostered
a more integrated domestic market and
improved links with the global market.
Despite still being far from perfect,
these shifts have supported productive
employment, particularly for traditional
agricultural products.
For newer products, however, market
mechanisms and strengthened economic
fundamentals are, while absolutely necessary,
were not sufficient, given excessively high
hurdles in terms of technology, capital, skills,
risks, etc. In many cases, farmers alone cannot
overcome these, suggesting the need for
state intervention in some form. The case of
Figure 2.14. The decline in cereal production reflects a move away from low-value products
Source: Constructed from Table 5, Briones and Felipe (2013).

l VIET NAM HUMAN DEVELOPMENT REPORT 201578
growing cut flowers in Da Lat has recently demonstrated some potential benefits when the State works with donors and foreign investors to connect local growers with the global market place, including through essential infrastructure and strategic planning (Box 2.5). Effective public-private partnerships may be particularly important.
In the Luc Ngan district of Bac Giang province, the local authority has proactively supported lychee growers to meet high quality standards required for exporting to new markets in Australia and the United States, in addition to the traditional domestic market and that of China. Most recently, Hanoi Irradiation Center began upgrading its facilities as part of improving the preservation of lychee exports, particularly
to the market in the United States. Once
the upgrading process is finished in 2016,
growers in Luc Ngan will send their products
to the United States via Hanoi instead of Ho
Chi Minh City, and thereby can considerably cut trade costs.
Other examples include the recent launch of a project to develop the dairy sector, jointly implemented by the Ha Nam provincial authority and the Dutch Government. It aims to develop professional and sustainable household-based dairy farming, which is expected to contribute to food security, job creation and income generation for farmers, and reduce reliance on milk imports.
Elsewhere in the world, industrial policy with some targeted interventions has worked well in the agricultural sector. The case of Chile is notable, as it is often portrayed as a free-market paradise. But Chilean grapes broke into world markets thanks to publicly financed R&D, while the highly successful salmon industry is the creation of Fundación Chile, a quasi-public venture fund (Deaton 2013).
These experiences confirm that attempts
by numerous local authorities in Viet Nam
to accelerate agricultural growth through
technology and innovation is the right course
of action, and should be scaled up across the
country to accelerate structural change.
Box 2.5. Cut flowers in Da Lat: Farmers and the State
In Lam Dong, the area for flower cultivation doubled from 1,731 hectares in 2003 to nearly 4,000 hectares in 2014, when output reached about 14 billion bunches of flowers. Around 60 million bunches were exported for a turnover of US $25 million. Japan, the world’s third largest flower market, has become the main destination for Da Lat flowers. In 2014, the export value of flowers and seedlings to Japan was approximately US $22.4 million. The figure has more than doubled within five years, surpassing two other major exporting countries—Malaysia, up 43 percent, and
China, up 12 percent. Da Lat’s well-known flowers, including roses, lilies, orchids and daisies, also
end up in Europe and North America.
Growth bottlenecks
Despite its growth, concerns remain over the flower industry. Most of the production continues
to be sold in the domestic market, with only 5 percent exported, mostly by foreign or joint venture firms.
One of the biggest challenges is a shortage of skills, from breeding and farming to preserving and
distribution techniques. The lack of adequate infrastructure, such as for storage and transportation, add other difficulties. High production costs of some new flower varieties cultivated in Da Lat have
undercut competitiveness in the world market.
Small-scale production, mainly by individual households, makes it difficult to meet the high standards of big international buyers. Strong reliance on the domestic market, however, means
that when crops are bountiful, prices drop dramatically. When prices go up, there is a shortage of
flowers to sell.
Achieving Inclusive Growth l 79
The roles of the State, donors and FDI
To address some of these issues, the Japan International Cooperation Agency and the Lam Dong
local authority announced plans for building the Da Lat flower market and collection centre.
Technical support came from the Tokyo-based Ota flower market, which handles 2.451 million
cut stalks daily and hosts the largest flower auction in Tokyo. The Da Lat project is scheduled for completion in 2017, with an expected capacity of 200 million flower stalks a year.
Some 70 percent of Da Lat flowers are transported to Ho Chi Minh City for distribution. The flower
collection centre is expected to be linked with Binh Dien, one of the largest wholesale markets in
Ho Chi Minh City. Flowers will be subjected to post-harvest treatment and freezing storage before
and during transportation. The Binh Dien market will function as a distribution centre, receiving
orders for Da Lat flowers from smaller markets and sellers, and transferring these to the Da Lat side.
A very important feature of the market is that all payments will be public and transparent to flower
growers, which will help them set prices for their products. At present, most flower farmers have to
sell their products to brokers, very often at low prices.
The Japan International Cooperation Agency recommended that Lam Dong carry out the project
via public investment instead of calling for the participation of private investors, who may
manipulate market operations in their own interests, frequently at the expense of growers.
Lam Dong is also working with Dutch flower experts in providing technical assistance to gardeners and in the production of flowers for export. Da Lat Hasfarm is a case of a successful Dutch company operating in Viet Nam. Hasfarm is the first flower firm there to import new flower breeds from the Netherlands and other European countries, creating a rich gene base and introducing new high-
quality varieties every year. It is also among the few domestic companies capable of exporting high-quality flowers and flower breeds sourced from overseas with legal certificates of origin.
‘Export or die’
‘Export or die’ is the motto of the local authorities. Da Lat gardeners well understand that they need to strive to export flowers instead of depending largely on the domestic market. This will depend on introducing new technologies in cultivation and building supportive infrastructure, while providing technical guidance on a production model that meets increasingly sophisticated market demand. Lam Dong must enhance its flower quality and diversity if it wants to participate in the global flower supply chain.
The State can play an important role in setting a direction and mobilizing resources to develop necessary infrastructure, and provide incentives so that selected big players will develop a ‘Lam Dong flower’ brand to initially help Lam Dong flowers penetrate international markets. Opening
up representative offices in key markets could help exports.
If efforts by farmers, the Government, donors and foreign investors are successful, the growth
effects could be considerable. Participating farmers could move up the value chain and join the upper-middle class, the Government could receive additional budget revenues and the country could increase its exports. Open questions remain, however, with regard to the participation of farmers at large, particularly resource-poor ones; stringent requirements in terms of soil, water,
climate and skills; and limited backward linkages of these activities with other parts of the economy.
Source: NHDR team compiled from various sources.
Unleashing further momentum
As in non-agricultural sectors and the
economy at large, the reallocation of
resources within agriculture is necessary but
not sufficient for raising productivity. The
importance of reallocation in fact gradually
diminishes as the economy becomes more
mature and the structure of agriculture
becomes more stable. At that point,
productivity within sub-sectors and on farms
will drive productivity gains.

l VIET NAM HUMAN DEVELOPMENT REPORT 201580
Several factors have worked in favour of more productive agriculture in Viet Nam.27 Global integration, despite associated risks, has greatly benefited several primary sub-sectors with comparative advantages, such as from favourable natural endowments and low agricultural labour costs. An ageing population tends to increase the amount of land per agricultural worker, magnifying the effect of structural transformation.
Technology-driven productivity growth is likely to be the most important component of Viet Nam’s agricultural competiveness in the long term, but at the same time is the most challenging to achieve. For crops, yield growth is to a large extent attributed to technology and innovation. Available evidence suggests that Viet Nam has done
relatively well in terms of yield growth in
traditional crops. Figure 2.15 shows that,
from being an average country, Viet Nam
rose to third position in cereal yields in
2010, below only China and the Republic of Korea. This has been due to key market-oriented reforms, policies and institutions in support of global integration, and the development of infrastructure and human capital that created necessary conditions for technology adoption.
Agricultural R&D has also had a key role in productivity. In 1991, total R&D expenditures amounted to US $8.2 million (2005 PPP), an amount constituting less than one-third of one percent of agricultural GDP (Cervantes-Godoy and Dewbre 2010). This score placed Viet Nam well behind neighbouring China and Malaysia. By 2002, however, thanks to a nearly seven-fold increase in spending, the country had begun to narrow the gap. Over that same period, agricultural GDP rose
rapidly. Viet Nam still remains well behind
many countries in the share of agricultural
GDP spent on R&D, however, suggesting
scope for expansion.
Figure 2.15. Technology has fueled Viet Nam’s significant growth in cereal yields
Ton per hectare28
Source: Briones and Felipe 2013
Large enterprises play an increasingly
important role in raising agricultural
productivity, and introducing economies
of scale and technology critical for
competitiveness—all still mostly lacking on
the small-scale farms prevalent in Viet Nam.
A case in point is Vinamilk, which has long
been a big player in the sector. It recently
started to export, stepping into a challenging
but lucrative global market. Vinamilk has an
extensive and well-functioning system of
contract farming through which many farmers
can participate. TH True Milk has increased its
presence with imported technologies from
Israel, but follows a different model, with
most production within the firm.
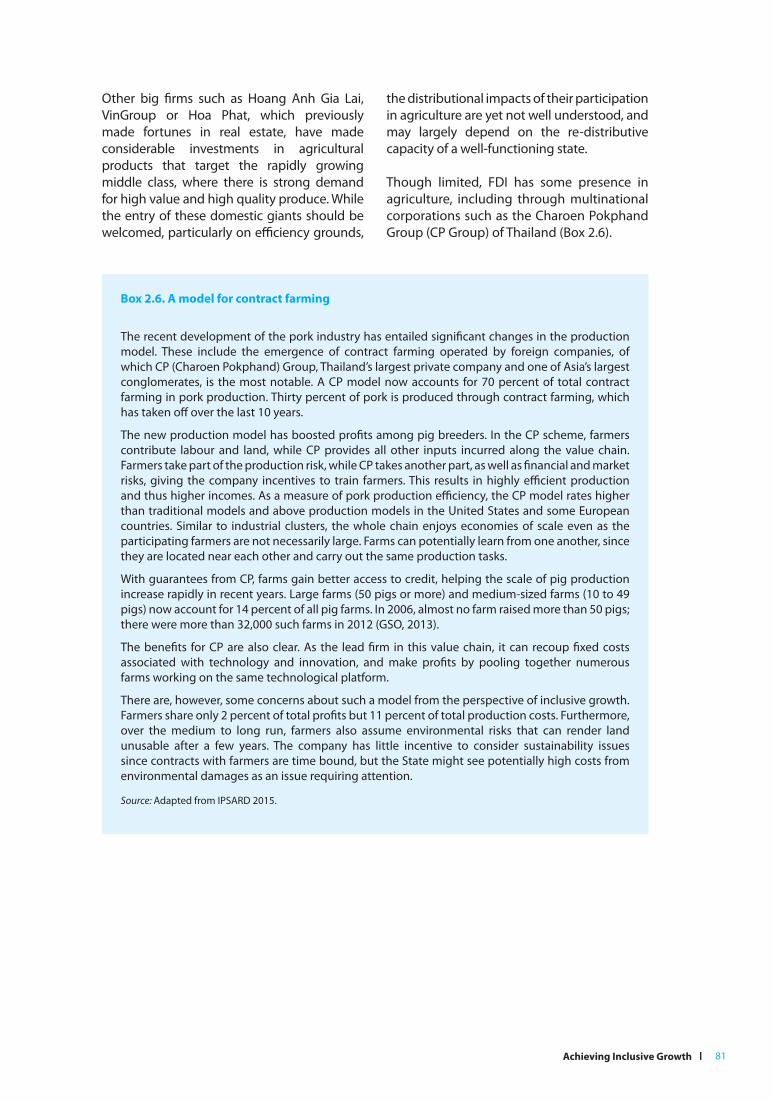
Achieving Inclusive Growth l 81
Other big firms such as Hoang Anh Gia Lai, VinGroup or Hoa Phat, which previously made fortunes in real estate, have made considerable investments in agricultural products that target the rapidly growing middle class, where there is strong demand for high value and high quality produce. While the entry of these domestic giants should be welcomed, particularly on efficiency grounds,
the distributional impacts of their participation in agriculture are yet not well understood, and may largely depend on the re-distributive capacity of a well-functioning state.
Though limited, FDI has some presence in agriculture, including through multinational corporations such as the Charoen Pokphand Group (CP Group) of Thailand (Box 2.6).
Box 2.6. A model for contract farming
The recent development of the pork industry has entailed significant changes in the production
model. These include the emergence of contract farming operated by foreign companies, of
which CP (Charoen Pokphand) Group, Thailand’s largest private company and one of Asia’s largest
conglomerates, is the most notable. A CP model now accounts for 70 percent of total contract
farming in pork production. Thirty percent of pork is produced through contract farming, which
has taken off over the last 10 years.
The new production model has boosted profits among pig breeders. In the CP scheme, farmers contribute labour and land, while CP provides all other inputs incurred along the value chain. Farmers take part of the production risk, while CP takes another part, as well as financial and market risks, giving the company incentives to train farmers. This results in highly efficient production and thus higher incomes. As a measure of pork production efficiency, the CP model rates higher than traditional models and above production models in the United States and some European countries. Similar to industrial clusters, the whole chain enjoys economies of scale even as the participating farmers are not necessarily large. Farms can potentially learn from one another, since they are located near each other and carry out the same production tasks.
With guarantees from CP, farms gain better access to credit, helping the scale of pig production increase rapidly in recent years. Large farms (50 pigs or more) and medium-sized farms (10 to 49 pigs) now account for 14 percent of all pig farms. In 2006, almost no farm raised more than 50 pigs; there were more than 32,000 such farms in 2012 (GSO, 2013).
The benefits for CP are also clear. As the lead firm in this value chain, it can recoup fixed costs associated with technology and innovation, and make profits by pooling together numerous farms working on the same technological platform.
There are, however, some concerns about such a model from the perspective of inclusive growth.
Farmers share only 2 percent of total profits but 11 percent of total production costs. Furthermore,
over the medium to long run, farmers also assume environmental risks that can render land
unusable after a few years. The company has little incentive to consider sustainability issues
since contracts with farmers are time bound, but the State might see potentially high costs from environmental damages as an issue requiring attention.
Source: Adapted from IPSARD 2015.
l VIET NAM HUMAN DEVELOPMENT REPORT 201582
Chapter 2.4: Enhanced capabilities through improved health care and education
Education and health care lie at the heart of human development and the expansion of key capabilities, and have contributed to greater and more inclusive growth in Viet Nam. They play important roles in raising productivity, promoting opportunities and social mobility, and enabling citizens to participate in the economy and share the
benefits of growth.
Viet Nam has seen a rapid expansion in
access to health and basic education.
Resources (public and private) flowing into
both sectors have grown substantially,
yet development outcomes have been
underwhelming. The shift from services
being funded and provided by the state to
a mix of state and private resourcing, has
led to potential inefficiencies and inequities.
Both health care and education have strong ‘public goods’ features and these
sectors are subject to major market failures.
Securing efficiency implies strong state regulation if not direct provision. Equally,
access to quality services has become increasingly contingent on households’
ability to pay.
As the country seeks a new growth model,
securing better education and health care are vital to boosting labour productivity and
distributing the benefits of higher growth. Since the early Doi Moi years, relatively good
provision, particularly in basic education, has facilitated a rapid shift out of low-productivity subsistence farming into higher
productivity jobs. As the previous Chapter
has underlined, taking the next steps to higher productivity will largely depend on building a highly skilled and healthy
workforce. Within education, there is a need to build on strong primary and secondary schooling and expand vocational and higher education, while also improving quality at all levels. Within the health sector, the task is to tackle geographical and group inequities, and biases towards niche and expensive hospital-based care. Ensuring affordability
and access is important within both sectors
- and some re-regulation and re-balancing
of the Government’s socialization reforms is
required to deliver these outcomes.
2.4.1. Remarkable past performance has
begun to falter
Over the past two decades, Viet Nam has
made impressive progress in expanding
access to education and health services.
Health outcomes are generally better than
in most countries with similar levels of
GDP per capita.29 Life expectancy, a key
component of the HDI, has improved from 67.6 to 75.9 years between 1980 and 2013.
Viet Nam’s performance on the health sub-
index of the HDI ranks it second among a group of comparator countries, with only the Republic of Korea performing better. MDG outcomes related to health are generally
positive, particularly on maternal mortality,
tuberculosis and malaria, and child mortality
(see Table 2.6).
Despite these remarkable achievements, improvements in health have stalled in recent years. Marked disparities remain. Life expectancy in the Central Highlands is more
than five years lower than in the South East, for example.

Achieving Inclusive Growth l 83
Table 2.6: Viet Nam has done well on the MDGs
Indicators Before 2000 2005 2010 2014 Outcome
MDG 2: Achieve Universal Primary Education Achieved
- Net primary enrolment rate87%
(1990)95%
97%
(2008-2009)98.96%
- Primary completion rate 85.6%88.5%
(2008-2009)
92.2%
(2012-2013)
- Net lower secondary enrolment rate 81%83.1%
(2008-2009)
87.24%
(2011-2012)
MDG 3: Promote Gender Equality and Empower Women Achieved
- Ratio of Female to Male primary
enrolment
91.2%
(1999-2000)91.9%
92.1%
(2008-2009)
91.3%
(2013)
- Ratio of Female to Male lower
secondary enrolment
88.5%
(1999-2000)92.3%
91.6%
(2008-2009)
94.3%
(2013)
MDG 4: Reduce Child Mortality Partly achieved
- Under-5 mortality rate58‰
(1999)27.3‰
25‰
(2009)22.4‰
- Under-1 mortality rate44.4‰
(1999)26‰
16‰
(2009)14.9‰
MDG 5: Improve Maternal Health Achieved
- Maternal mortality rate per 100,000
live births
233
(1999)80
69
(2009)60
- Percentage of births attended by
skilled medical staff
92.71%
(2006)
94.48%
(2009)
97.5%
(2009)
- Percentage of pregnant women with
at 3 check-ups during pregnancy84.3%
86.4%
(2008)89.6%
MDG 6: Combat HIV/AIDS, Malaria and Other Diseases Partly achieved
- HIV prevalence rate0.28%
(2011)
0.26%
(2014)
- HIV prevalence rate per 100,000 people
187(2009)
248
- Number of HIV-infected adults having
ARV (antiretroviral therapy)
7,182
(2006)
36,008
(2009)
78,438
(2013)
- Number of HIV-infected children
having ARV
428
(2006)
1,987
(2009)
4,204
(2013)
- Number of malaria-infected cases293,000
(2000)
60,867
(2009)27,868
- Number of malaria-infected deaths71
(2000)
27
(2009)6
Source: GOVN 2015
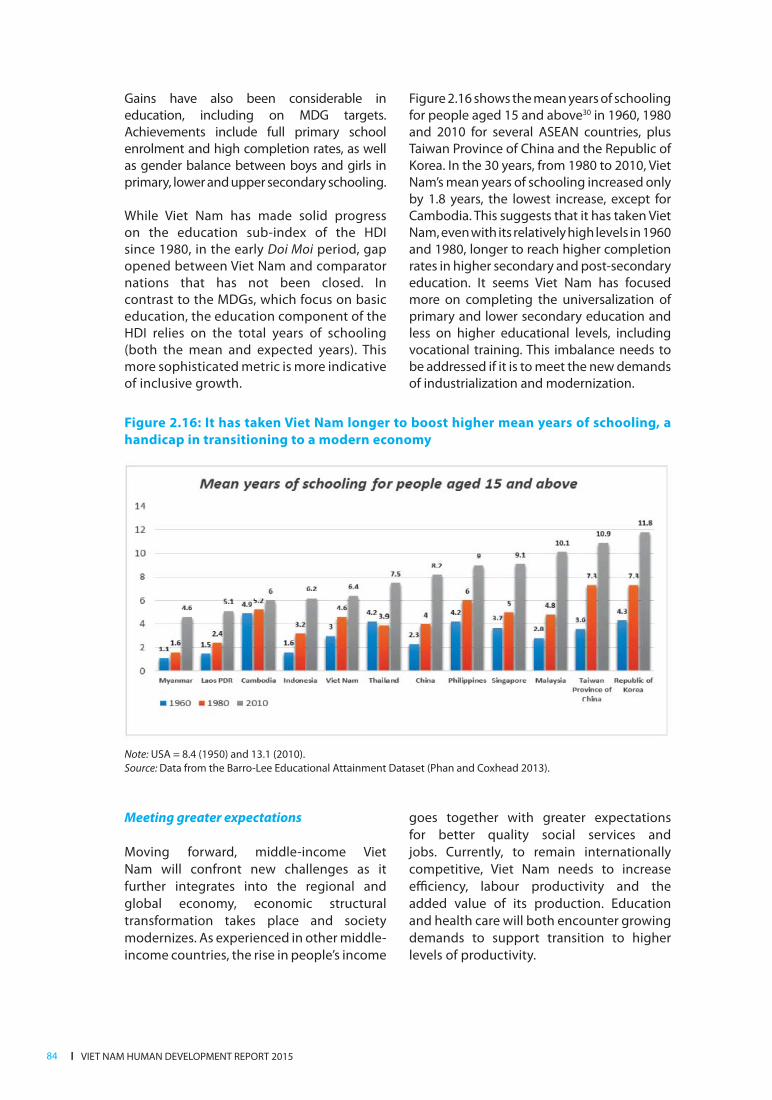
l VIET NAM HUMAN DEVELOPMENT REPORT 201584
Gains have also been considerable in education, including on MDG targets. Achievements include full primary school enrolment and high completion rates, as well as gender balance between boys and girls in primary, lower and upper secondary schooling.
While Viet Nam has made solid progress on the education sub-index of the HDI since 1980, in the early Doi Moi period, gap opened between Viet Nam and comparator nations that has not been closed. In contrast to the MDGs, which focus on basic education, the education component of the HDI relies on the total years of schooling (both the mean and expected years). This more sophisticated metric is more indicative of inclusive growth.
Meeting greater expectations
Moving forward, middle-income Viet
Nam will confront new challenges as it
further integrates into the regional and
global economy, economic structural
transformation takes place and society
modernizes. As experienced in other middle-
income countries, the rise in people’s income
goes together with greater expectations
for better quality social services and
jobs. Currently, to remain internationally
competitive, Viet Nam needs to increase
efficiency, labour productivity and the
added value of its production. Education
and health care will both encounter growing
demands to support transition to higher
levels of productivity.
Figure 2.16 shows the mean years of schooling for people aged 15 and above30 in 1960, 1980 and 2010 for several ASEAN countries, plus Taiwan Province of China and the Republic of Korea. In the 30 years, from 1980 to 2010, Viet Nam’s mean years of schooling increased only by 1.8 years, the lowest increase, except for Cambodia. This suggests that it has taken Viet Nam, even with its relatively high levels in 1960 and 1980, longer to reach higher completion rates in higher secondary and post-secondary education. It seems Viet Nam has focused more on completing the universalization of primary and lower secondary education and less on higher educational levels, including vocational training. This imbalance needs to be addressed if it is to meet the new demands of industrialization and modernization.
Figure 2.16: It has taken Viet Nam longer to boost higher mean years of schooling, a
handicap in transitioning to a modern economy
Note: USA = 8.4 (1950) and 13.1 (2010).
Source: Data from the Barro-Lee Educational Attainment Dataset (Phan and Coxhead 2013).

Achieving Inclusive Growth l 85
Key issues include the quality of education, and the extent to which it promotes the acquisition of new skills, responds to labour market conditions, and the focus shifts from basic to intermediate and more advanced schooling. Equally important is the extent to which health-care services support a healthy work force, reduces health risks, and ameliorates demographic changes, most notably an aging society.
In spite of strong past performance, early signs are less positive. Recent data suggest structural transformation is slowing, particularly in the formalization of the economy and the transition from low to medium and higher technology. In the World Economic Forum Competitiveness Report 2014-2015, an inadequately educated workforce ranked as
the third most problematic factor for doing
business in Viet Nam.31
While demands are increasing for higher
quality education and health care,
government capacity for raising revenue and
delivering these services seems to lag behind,
notwithstanding significant reforms in health
and education over the past two decades.
These entailed changes in resourcing
levels and models, combined with new
management and governance arrangements.
Past success offers no guarantees for
the future, however. Any new model for
furthering inclusive economic growth and
human development needs to take account
of new challenges and opportunities in these
key sectors.
2.4.2. How inclusive are education and health care?
“The absence of state capacity—that is, of the services and protections that people in rich countries take for granted—is one of the major causes of poverty and deprivation around the world.” Angus Deaton, the 2015 Nobel laureate in economics. (Deaton 2013)
Generally, there has been a rapid increase in the availability of education and health services. The quality of services has seen significant, but very uneven, improvements across different levels. While improvements in education have tended to focus on securing universal provision at the basic level while neglecting participation at pre-primary and post-secondary levels, within health care,
the systemic bias has been towards high-end,
city based hospital care.
Despite declining disparities in education,
poorer and middle-income groups still
miss out
Overall, while substantial inequities in
education remain, gaps in coverage and
use across regions, and between richer and
poorer population segments have narrowed.
Having achieved the MDG targets for primary
education, Viet Nam’s policy focus has now
shifted to securing a similar outcome for
lower secondary schooling. Figure 2.17
shows that enrolment rates in primary school
among different income quintiles have been
at or very close to 100 percent since 2008,
indicating a high level of inclusiveness.

l VIET NAM HUMAN DEVELOPMENT REPORT 201586
0.0
20.0
40.0
60.0
80.0
100.0
2004 2006 2008 2010 2012
Q1
Q2
Q3
Q4
Q50.0
20.0
40.0
60.0
80.0
100.0
2004 2006 2008 2010 2012
Figure 2.18 shows, however, that achievement of full enrolment in lower secondary
education is still challenging. In 2012, the
average enrolment rate was 90 percent, but
while the upper two income quintiles have
achieved close to 100 percent, the share
drops to 60 percent at the lowest income
quintile (based on GSO, VHLSS). There are
few signs that this gap is closing. Enrolment rates for middle-income groups, which were
previously high, have actually fallen since
2008. Similar trends occur in upper secondary
education. But here, among poor and near
poor groups, enrolment rates are around 50
percent and 40 percent, respectively.
Figure 2.17: Almost all children, regardless of income level, go to primary school
Primary enrolment rates by quintile, 2004-2012
Figure 2.18: Poor and middle-income children are less likely to obtain a secondary education
Lower (left) and upper secondary (right) enrolment rates, 2004-2012
Source: GSO, VHLSS (successive years).
Source: GSO, VHLSS, successive years.
The limited inclusion of lower income groups in secondary education intersects with other
disparities, such as among ethnic groups, especially at the upper secondary level.
Enrolment rates are above 65 percent among the majority Kinh and Hoa, but fall to as little as 13.7 percent for ethnic minorities.
Over the last decade, special efforts have been made to expand coverage of the
education system in areas that are remote and/or populated by ethnic minorities.
Among all schools newly established between 2002 and 2012, half were located in the Northern Uplands and Central Highlands,

Achieving Inclusive Growth l 87
the two poorest regions and home to the highest concentrations of ethnic minorities. Notably, these two regions combined accounted for only 23 percent of children of mandatory school age. The establishment of new schools and hiring of teachers resulted in reduced student to teacher ratios (OECD 2014a, p. 30-31). As of 2012, some 98 percent of communes had primary schools and over 91 percent lower-secondary schools (MOET
2013). Other measures include the use of bilingual education.
The results of these efforts have been mixed (Nguyen TC 2011). It has often proved difficult to retain teachers in remote areas and provide a curriculum that meets national standards. Among children aged 11-14, those from ethnic minority households are still twice
as likely not to be attending school (UNICEF
2013). The most commonly cited reasons for
this discrepancy include cultural values, costs
and income losses, language barriers and
distance. Tellingly, differences in test scores in mathematics at secondary level reflect a gap of about three years of schooling between the first and third income quintiles, and ethnic minorities and the Kinh/ Hoa majority (IRC, CAF, IPPM and CDES (unpublished), ‘Parental Spending for Education in Vietnam’).
Educational provision for migrant children in urban areas has also become an issue (see Box 2.7). Viet Nam’s household registration system has often served as a barrier for children of families who have moved to urban areas in search of work, undercutting the benefits of migration as a core economic process supporting higher overall labour productivity. Nevertheless Major city authorities, notably Ho Chi Minh City, have made strong efforts to accommodate migrant children in
schools, towards securing higher human
development, equity and productivity gains
(UNDP, Report “Urban Poverty Survey in Ho
Chi Minh City”, forthcoming).
Box 2.7 Too many migrant children remain out of school
Problems of access to education faced by migrants are driven by Viet Nam’s household registration system, which, though loosely implemented with respect to employment, often restricts use of basic services. While access may be gained, usually through informal side payments, most migrant households are poor, particularly newer migrants, and lack social or financial resources to manage this kind of transaction.
The Urban Poverty Survey for 2009 found that while 88 percent of children in poor urban resident households were enrolled in school, the rate was only 35 percent for poor migrant households (Cameron 2012, p. 30). The latter had lower education expenditures. Overall, only 64.6 percent of
migrant students attended public schools, compared to 82.1 percent among permanent residents
(UPS, 2010) suggesting general difficulties in accessing the public school system due to registration issues. This was confirmed in 2012, with only 82.7 percent of migrant children attending a public school compared to 95.7 percent of permanent residents (GSO, VHLSS 2012). As a result of these and other factors, children from migrant households tend to have lower educational attainment.
Not being able to afford school fees seems to be one reason why children of migrants miss out on school. Seven percent of migrant families cite ‘cannot afford school fees’ as the reason for
their children not attending school, compared to 2.1 percent of permanent residents. Household registration governs the availability of official support. Children from permanent resident families
were more likely to have reduced or no school fees than migrant children, at 27.4 percent versus
21.4 percent.
Source: UNDP, Report “Urban Poverty Survey in Ho Chi Minh City”, forthcoming
l VIET NAM HUMAN DEVELOPMENT REPORT 201588
In terms of completion of education levels,
gaps vary considerably between income
groups for both primary and secondary
schooling. In 2014, 73 percent of children
from the poorest quintile completed primary
school, compared to 95 percent for the top
income quintile. Only 46 percent in the
poorest quintile complete lower secondary
school at the corresponding completion
age, while the share rises to 77 percent in the
middle-income group and 89 percent in the
top quintile.
While Viet Nam has been right to focus on
securing universal completion of lower
secondary education, the data suggest it
is some way from achieving that ambition.
Wide income-related variations suggest that
this will not be realized without significant
efforts to expand access to quality education
for the poor, but crucially also, the lower-
middle classes. By 2020, there will be almost
a million new labour market entrants who
have not completed lower secondary
education, and an additional 1.3 million
entrants who have not completed upper
secondary education (Baulch, Vu, and
Nguyen 2012). Furthermore, an estimated 1
million children aged 5-14 have either never
attended school or have dropped out. More
than 1 in 10 children aged 11-14 are not in
school (UNICEF 2014).
Evidence from the Young Lives survey
suggests dropping out of school early is
relatively common before completion of lower
secondary school. Analysis of the reasons for
dropping out found that a child’s ability is the
key factor, but others factors include poor
economic status, parental education level and
ethnic minority status. According to parent
respondents, the primary reason is that
children lose interest in going to school, and
this response was constant across the income
status of families. Moreover, only one-fifth of
teenage school dropouts are doing paid and
unpaid jobs. Most spent more time sleeping
and on leisure activities because there are
few economic opportunities, or if there are,
it is not easy for them to access these. A
supportive family, in addition to the school
and community environment, are important
factors preventing children from dropping
out of school (Young Lives 2012a).
Despite Article 16 of the 2013 Constitution and
government emphasis, the universalization of
early childhood education is severely lagging.
Enrolment reached just 34.6 percent in 2012
(based on VHLSS 2012 data), suggesting
more than 65 percent of children miss crucial
opportunities for capability development.
Inequities also come into play, with the
highest and second highest income quintiles
having enrolment rates of 43-45 percent, and
the lowest quintile only 28 percent in 2012.
Enrolment rates for the middle quintiles,
at 30 percent and 36 percent, are closer to
those in the lowest quintile. There are also
marked differences between rural and urban
areas and regions, with attendance in the
Red River double that of the Mekong Delta
(UNICEF 2014). This highly skewed pattern
of provision and a lack of an integrated early
childhood development approach, among
other consequences, contributes to high
levels of intergenerational poverty.
The most striking social differentiation occurs
at the post-secondary school level. As Figure
2.19 shows, the top quintile enrolment rate
in higher education at close to 75 percent
in 2012 is almost 15 times higher than the
lowest quintile rate at just above 5 percent.
Within vocational education, while overall
participation is low, in itself a major issue,
the upper quintiles dominate with 10-15
percent, while the lowest has a rate of only
3 percent.
From an inclusive growth perspective, this
pattern is troubling, speaking both to a loss
of potential in terms of human capital as well
as deep-seated inequality. The importance
of upper levels of education in shaping
economic opportunities and social ascent,
the substance of inclusive growth, has
been repeatedly confirmed. Workers with
vocational training are more likely to find
employment and earn 32 percent more than
the average wage earners. Salaries for tertiary
level graduates are 173 percent higher
than for those with a vocational college
qualification (ADB 2014).

Achieving Inclusive Growth l 89
Education quality falls short of employers
requirements and parents expectations
The overall quality of education is a critical
issue. Progressive improvements are central to
the development of productive capabilities,
but have been hindered by systemic
challenges, such as outdated curricula and
poor alignment with labour market needs. In
many respects, Viet Nam’s education system
is failing to meet the needs of its transforming
society and economy.
Positively, Viet Nam performed strongly
on the mathematics, reading and science
components of the Programme for
International Student Assessment (PISA). It
ranked 12th in a mathematics and science test
of 15 year olds, ahead of Germany, France
and the United Kingdom (Coughlan 2015).
Yet both employer and parent surveys have
consistently raised concerns about the quality
and relevance of education, particularly at
the post-secondary level. Social stratification
linked to quality is apparent through the
emergence of a ‘two-tier’ education system.
Urban residents in particular have greater
access to high-quality public and private
schools, and often a better ability to pay fees
that may be required to access them.
Demographic changes—where the workforce
is still expanding, but more slowly, even
as the share of older people continues to
grow—provide other important rationales for
raising the productivity of workers. At some
stage, there will be fewer of them to support
a greater number of older dependents. Yet
employers already struggle to find skilled
workers, with certain sectors facing both
skills gaps and shortages. Workers often have
good literacy and numeracy skills,32 but lack
technical, cognitive and behavioral skills
(Bodewig et al. 2014). Qualitative research for
this report documented cases where workers
acquired technical skills while employed by
FDI firms, enabling them to successfully move
up the income ladder.
The development of vocational training and
technical skills is of particular importance to
address these issues. While the numbers of
training centres and students have increased
significantly, the relevance of vocational
training to market demands remains a
concern. Links between universities and
vocational schools, firms, workers and
students are often poor. Gaps persist in
terms of information and low capacity, and
inadequate incentives (ibid). Only a small
percentage of the employable workforce has
Figure 2.19: Upper income groups dominate both higher and vocational education,
suggesting a troubling loss in human capital
Higher education (left) and vocational education (right) enrolment rates by quintile
Source: GSO, VHLSS (successive years).

l VIET NAM HUMAN DEVELOPMENT REPORT 201590
vocational qualifications. As students from lower income households are less likely to have a secondary education, a prerequisite for entering into vocational training, this has an important equity dimension. Women are underrepresented in vocational training, particularly in rural areas.
Quality within higher education has also attracted critical attention, since knowledge and human capital are primary drivers of economic development and national competitiveness. The implications are stark: “sustainable economic development in highly competitive world markets requires direct engagement in the generation of knowledge” (David A. King 2004).
GOVN Resolution 14 (14/2005/NQ-CP)
acknowledges that Vietnamese higher
education does not fulfil “the demands of
industrialization and modernization of the
country, the needs of people to study, and the
demands of international integration.” (GOVN
2005). Moreover, the Ministry of Education
and Training’s Higher Education Reform
Agenda, 2006-2020 recognizes: “The biggest
weakness [in Vietnamese higher education],
causing much concern in society and
hindering industrialization-modernization
and international integration, is the inability
of the higher education system to meet the
human resource development requirements
of industrialization-modernization and
the demands of the people for education.”
(MOET 2005)
Surveys have found that as many as 50 percent of Vietnamese university graduates
are unable to find jobs in their area of specialization, evidence of the disconnect
between classrooms and market needs
(Chirot and Wilkinson 2010). Undergraduate science and technology teaching is weak in both pedagogy and content. According to
a 2006 study of undergraduate education
in physics and engineering conducted by the National Academies for the Viet Nam Education Foundation, teaching methodologies depend excessively on rote learning and testing, neglecting deep conceptual understanding and application to complex, real-world problems.33
Similarly, the Ministry of Education and Training engineering curriculum, which dominates students’ first two years of study, demands too many core courses, utilizes out-of-date content, and draws few connections between related fields, contrary to standards in modern engineering courses. Global science and technology teaching have become increasingly experiential, emphasizing collaborative workshops, hands-on learning, internships and faculty-
student interaction. This has placed
Vietnamese students at a disadvantage
versus their counterparts at universities in
developed and developing countries alike.
(Chirot and Wilkinson 2010)
Ready access to health care, but a missing
middle in health insurance
Around 80 percent of people in Viet Nam have
access to health care, a figure that is relatively
stable across all income groups (Figure 2.20).
By 2010, virtually all of Viet Nam’s more than
10,000 communes had a health station, while
all districts had at least one public hospital.
The proportion of commune health stations
with doctors increased from 67.7 percent
in 2009 to 78 percent in 2014. In 2013, 91.4 percent of children under one year of age were immunized (MOH 2014), although there is a disparity between majority and
ethnic population groups. While 82 percent
of children aged 12-23 months are fully immunized, the rate for Kinh children is 84.6 percent. The rate for ethnic minority children is significantly lower at 69.4 percent
(UNICEF 2014).
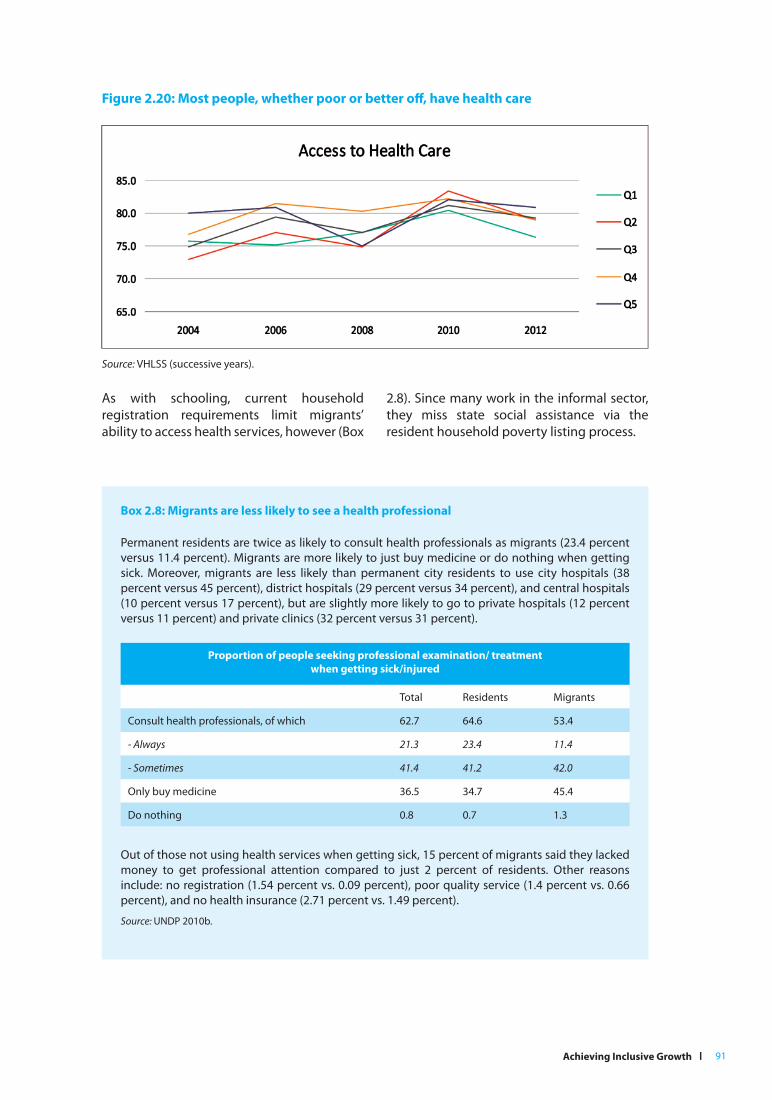
Achieving Inclusive Growth l 91
As with schooling, current household
registration requirements limit migrants’
ability to access health services, however (Box
2.8). Since many work in the informal sector,
they miss state social assistance via the
resident household poverty listing process.
Figure 2.20: Most people, whether poor or better off, have health care
Source: VHLSS (successive years).
Box 2.8: Migrants are less likely to see a health professional
Permanent residents are twice as likely to consult health professionals as migrants (23.4 percent versus 11.4 percent). Migrants are more likely to just buy medicine or do nothing when getting sick. Moreover, migrants are less likely than permanent city residents to use city hospitals (38 percent versus 45 percent), district hospitals (29 percent versus 34 percent), and central hospitals (10 percent versus 17 percent), but are slightly more likely to go to private hospitals (12 percent versus 11 percent) and private clinics (32 percent versus 31 percent).
Proportion of people seeking professional examination/ treatment
when getting sick/injured
Total Residents Migrants
Consult health professionals, of which 62.7 64.6 53.4
- Always 21.3 23.4 11.4
- Sometimes 41.4 41.2 42.0
Only buy medicine 36.5 34.7 45.4
Do nothing 0.8 0.7 1.3
Out of those not using health services when getting sick, 15 percent of migrants said they lacked
money to get professional attention compared to just 2 percent of residents. Other reasons include: no registration (1.54 percent vs. 0.09 percent), poor quality service (1.4 percent vs. 0.66 percent), and no health insurance (2.71 percent vs. 1.49 percent).
Source: UNDP 2010b.
l VIET NAM HUMAN DEVELOPMENT REPORT 201592
Government estimates of health insurance coverage, at 75 percent in 2015, suggest a high degree of inclusion (GOVN 2015). But deeper analysis by income group finds a significant ‘missing middle’. Coverage among middle-income groups, notably informal workers, appears to be lower than for other groups. In Ho Chi Minh City and Ha Noi, while coverage in 2012 was 68 percent among city residents, it was only 48 percent among migrants with no residence registration (UNDP 2012).
The Government’s decision to expand health insurance subsidies for the poor, near poor and other key groups, and establishment of the unified Health Insurance (HI) Fund was a major step forward and offers a mechanism for dealing with inequities. But co-payments,34
a plethora of out-of-pocket payments and the quality of public health-care services mean that access to quality health care is still likely to be contingent on the ability to pay. Recognizing this, the revised Law on Health Insurance effective from 1 January 2015 does not require co-payments from poor and ethnic minority groups, while co-payments from the near poor group have been reduced to 5 percent from 20 percent. Another reason that “people with voluntary health insurance or health insurance for the poor are less likely to use their health insurance when seeking inpatient care compared …is related to [their] lower contributions which translates into lower quality services or longer waiting times” (MoH 2013) (see Box 2.9).
Box 2.9: Free health insurance helps vulnerable groups secure care
Poor people, children under six, and ethnic minorities living in difficult and extremely difficult areas receive free health insurance under the current health insurance law.
According to the head of a medical station at a remote commune in Phu Yen, now that people are covered by insurance, the number of patients has doubled from 20 to 40 per day. It is also easier for families with children, as they don’t need to borrow money from relatives any time their children get sick.
Similarly, in Da Nang, poor people benefit from free health insurance as evidenced by increased access to health-care services, especially in local health stations. Yet some families use the public health stations mainly for universal vaccinations, and prefer private clinics for other out-patient services. A boy broke his hand but his mother took him to a private clinic. According to his mother, “It takes more time using insurance while the boy needs to study.” For other common illnesses, his mother would simply go to the pharmacy and buy medicines instead of going to
a health station.
Although free health care has proven to be very helpful for poor and ethnic minority families,
the quality gap in the provision of health service to holders of free insurance in different areas remains. The difference lies both in the calibre of staff and the availability of equipment and medicines. One interviewer reported that: “People do not trust the professional knowledge of the medical station’s nurses.” The health station in Phu Yen is only attended by nurses, no doctors,
and only one set of equipment is available to conduct basic medical check-ups. By contrast, the
urban site in Da Nang is relatively well equipped with an x-ray machine, an ultra-scan machine and seven staff members.
The lack of doctors at medical stations results in fewer types of medicines available. According
to the head of a medical station in Phu Yen, “Not all stations have doctors, and my station only
has nurses so we get a very small allocation of medicines. Sometimes, there are no medicines.” This might partly explain for the different quality of medicine provided for free at primary health
stations between urban and rural areas. In the Young Lives site in Phu Yen, drugs offered to patients cost VND 8,000 on average, while in Da Nang the same cost VND 30,000.

Achieving Inclusive Growth l 93
The quality of health care is better in some areas than others and shows big city biases
Viet Nam’s strong progress on the health-related MDGs (Table 2.6) is matched by comparatively sound performance on the
health component of the HDI, which relies on
life expectancy data. But major geographical
disparities mean that life expectancy ranged
from 75.7 years in the Southeast to 69.4 years
in the Central Highlands in 2012. Provincial
variations are higher still. According to the
Ministry of Health, there are “large disparities
in health status across regions, between
living standards groups as evidenced by
indicators such as infant mortality rate, child
malnutrition, etc.” (MOH 2010).
Although infant mortality has dropped in almost all disadvantaged regions, including the North West and the Central Highlands, these regions still lag behind the more advanced South East and the Red River Delta. For example, although the disparity between
the North West and South East has declined
from threefold in 2005 (33.9 percent and 10.6
percent, respectively) to about 2.5 times in
2008 (21 percent and 8 percent, respectively),
the difference remains large. Variations in
the wasting form of child malnutrition are
also apparent across regions. Despite great
improvements during 2005-2008, the Central
Highlands and North Western region have the
highest rates of child malnutrition (Table 2.7).
If people choose to go to public hospitals rather than commune health stations, they face higher
co-payments, yet better-off families still go to hospital because they deem them safer. “The hospital offers better and safer services; doctors are more qualified; nurses at the communal clinic
aren’t as good as the hospital staff,” said a Kinh caregiver in Phu Yen.
But one nurse explains that the difference lies mainly in equipment: “I think services at the hospital
and clinic are the same; however, there are insufficient medical devices at communal levels.
Patients believe that it’s better to go to hospitals, which makes them feel reassured. I understand if
they go there for major operations but for normal situations, services are the same.”
Sources: Young Lives (forthcoming); Young Lives qualitative survey round 3, 2011
Table 2.7: Child survival and well-being still depends on where children live
Region Infant mortality rate/1,000 live births Child malnutrition (percentage)
2005 2006 2007 2008 2005 2006 2007 2008
Red River Delta 11.5 11 10 11 21.3 20.1 19.4 18.1
North East 23.0 24 22 21 28.4 26.2 25.4 24.1
North West 33.9 30 29 21 30.4 28.4 27.1 25.9
North Central Coast 24.9 22 20 16 30.0 24.8 25.0 23.7
South Central Coast 18.2 18 17 16 25.9 23.8 20.5 19.2
Central Highlands 28.8 28 27 23 34.5 30.6 28.7 27.4
South East 10.6 8 10 8 18.9 19.8 18.4 17.3
Mekong Delta 14.7 11 11 11 23.6 22.9 20.7 19.3
Whole country 16.0 16.0 16.0 15 25.2 23.4 21.2 19.9
Source: Ministry of Health 2010
l VIET NAM HUMAN DEVELOPMENT REPORT 201594
Very significant imbalances remain in the supply of health care. Whereas 76 percent of communes nationally were served by a doctor in 2012, in the Mekong River Delta, 87.2 percent of commune health stations had a doctor, compared to only 66.4 percent in the Northern Uplands (MOH 2013). There are also significant imbalances in the distribution of health-care services and staff;
59 percent of medical doctors serve in urban areas, even as more than 70 percent of the population resides in rural areas. The number of physicians in the Southeast was 4.7 per 10,000 people, compared to the national average of 6.59 (ibid).
The Joint Annual Health Review 2013 shows that “despite positive results in terms of an increased number of health workers in
general, particularly for the grassroots health-
care level, in reality, the health sector still
faces many human resource development
challenges. The general shortage of human
resources, particularly of doctors at the
grassroots level and specialists in preventive
medicine, is still a major problem. A recent
study conducted in four provinces indicated
the number of health workers retiring or
moving away from district health facilities (district hospitals and health centers) was equal to about 50 percent of the total number of new recruits, while at the commune level departures were equivalent to about 30 percent of new recruits. Many district hospitals and health centres have not been able to recruit any doctors for many years while the migration of doctors to other localities continues.”
Despite efforts to increase the number of beds, hospital overcrowding has not been mitigated to any clear extent. The bed occupancy rate at all levels decreased from 100.5 percent
in 2011 to 99.4 percent in 2012, while at the central level the rate fell from 113.2 percent to 112.5 percent (MOH 2013). Overcrowding in tertiary hospitals, particularly in some
specialties such as oncology, pediatrics,
cardiology, gynecology, orthopedics and
endocrinology, remains widespread (ibid.)
(Box 2.10). This, together with 15-20 year
old medical devices, and weak systems for
quality control and management, among
other issues, have significant implications for
further improving health care.
Box 2.10: Overcrowded central hospitals
Many Vietnamese public hospitals constantly operate at full capacity, with four to five patients sharing one bed, but sometimes with the actual number of patients assigned to one bed amounting to over 10 patients. Typically, the bed is left to the most severe cases, while
people with minor conditions find some other place to lie down, most often on the floor in the corridors.
The phenomenon of bypassing lower level facilities is obvious. People seek cures in overloaded
central hospitals because of their quality and reputation, despite all the difficulties. This shows the
ineffective distribution of an overall system of medical staff, resources and technology. A study in 2008 (HSPI 2008) found bed occupancy rates of between 132 percent and 200 percent among central hospitals in 2007. The study noted that 48 percent of patients attending central hospitals were from other provinces, but only 18 percent were at the correct level of care. Over 50 percent
could be treated at lower levels. The research also pointed out the weak capacity of lower-level
hospitals (particularly district hospitals) to provide services, and the inability of these hospitals to attract patients. District hospitals provide about 70 percent of the total services that they are
supposed to offer.
Source: Health Strategy and Policy Institute (HSPI 2008).
Achieving Inclusive Growth l 95
2.4.3 New service models may not deliver the best outcomes
Changes in the mobilization of resources and service delivery models, crucially the advent of Viet Nam’s socialization model (Box 2.11), have a number of implications for state regulation and management in education and health. Among other measures, policy reforms have boosted the scope and level of user fees, making access to quality services contingent on the ability to pay. Intended to boost efficiency, this has had a perverse effect, encouraging unnecessary service provision and cost inflation. It has enabled largely monopolistic providers to extract income from service users and the Health Insurance Fund.
In tandem, segmented social support
systems, which offer state assistance only to
the poorest and favour formal sector workers,
have increased burdens on middle-income
groups. Key questions now centre on the
ability of the State to manage the reform
of financing and delivery mechanisms,
and to provide effective regulations to
maximize positive and minimize negative
consequences, towards securing the most
efficient and equitable outcomes (Box 2.12).
Both education and health have many
‘public goods’ features, offering large
socioeconomic benefits over and above the private ones. Education boosts skills and human capital. Good health care provides a fit and capable workforce, and enables individuals to fulfil their social roles more effectively. It limits the spread of epidemics and illnesses, saving huge costs for households and society at large.
Significant market failures also affect the provision of education and health-care services, such as gaps in access and efficiency. Private costs and benefits diverge significantly from their social costs and benefits. Within education, long payback periods and the limited abilities of students and parents to correctly value returns mean that education services are generally undervalued. In a completely free market, they would be
under-consumed, especially by lower income
groups. For health care, there is an inherent
difference between the abilities of patients
and providers to assess the value of various
treatments options, a basic information
asymmetry made worse by insurance-based
models of funding.
All of these elements justify states taking
an active role in funding and delivering
education and health care. Where they do not
directly provide these services, they highly
regulate them.

l VIET NAM HUMAN DEVELOPMENT REPORT 201596
Box 2.11: Socialization’s mixed record
Serious fiscal constraints of the late 1980s led public service delivery organizations and their staff
to raise resources via client charges and enterprise contributions. This process was formalized
in the early 1990s, when the Government began to promote ‘socialization’, encouraging public
agencies, households, and a variety of social organizations and associations to jointly mobilize
resources for services. Although sustained growth since then has supported major increases in
public spending on these sectors, socialization practices have become embedded, and in the face of recent budget retrenchment, are expanding in certain areas.
In most countries, ‘socialization’ refers to a process whereby individuals interact with and are
shaped by dominant ideas, values and behavioural norms, or to a process whereby the state and/
or public sector assume increasing and primary responsibility for productive or service activity. In
Viet Nam, ‘socialization’ refers to a process where institutional responsibility is shifted from the state
onto households and local communities. In formal statements, ‘socialization’ is couched in ways
that evoke ideals of social solidarity, mutual aid and collectivism. For policy makers and officials,
‘socialization’ provides a framework for understanding the idealized roles and responsibilities of the
state and ‘society’ in the provision and payment for services. Yet the term has been controversial,
and the impact of ‘socialization’ in terms of equity, efficiency and effectiveness of social service
delivery has been mixed.
While Viet Nam has increased public funding for health care and education, it has changed the resourcing, transitioning from services that are free, universal and wholly funded by the State to a mixed system of state and private funding and client charges. State relief targets the poor and some groups with special needs. Communist Party, government and National Assembly resolutions, policies and proceedings consistently emphasize universal access to services at a basic level based on this approach (see, for example Party Resolution 27/2014, the Education Law 2013, Central Party Resolution 6, Party Resolution 46, 2005; GOVN Resolution 05 Jan 2014).
Another dimension of ‘socialization’ is the delegation of operating autonomy to a mixed system of public and private service providers—schools and hospitals. They have greater discretion, notably in collecting and using user charges, and the possibility of improving their efficiency and responsiveness to local needs.
Socialization has caused many debates. On the positive side, the Government of Viet Nam has and continues to maintain policy commitments to universal provision of education and health care, as rights embedded in the 2013 Constitution. These commitments have been backed by
large public resource allocations. Viet Nam has secured universal basic primary education and has progressively expanded state support to the Social Health Insurance Fund to include a
series of groups at no or a highly subsidized cost. Socialization has helped in raising additional resources and contributed to improving staff pay and investments in quality upgrades. People
now have greater choice, particularly in urban areas, and in principle, this also creates a market
at the local level with rival providers boosting competition and incentivizing performance and
quality improvements.
On the other hand, socialization that involves public funding and users’ out-of-pocket-payments has implications for equity and efficiency. Rising formal and informal user fees have the potential
to impose proportionally higher burdens on lower-income households. Commercialization and
privatization, as some commentators call it, pose a potential for market failures, requiring at minimum, greater oversight, regulation and management by the State.
Source: NHDR team, from various sources.

Achieving Inclusive Growth l 97
Box 2.12: Weak regulations do little to balance large sub-national resource disparities
Local government is substantial in Viet Nam and is responsible for roughly half of all public
spending as well as around 80 percent of public spending on education and health (World Bank
2014c). A complex and opaque fiscal decentralization system, however, results in poorly matched
assignment, mobilization and sharing of revenues, impinging on equity and efficiency. Viet Nam’s
16 ‘surplus’ provinces and cities have large revenues streams, and although they transfer a majority
of these to the central Government, they retain a very high level of discretion, and are generally
able to provide better levels of service.
The remainder of Viet Nam’s provinces are dependent on transfers from the central level (Nguyen
and Shroeder 2010). Save for areas with special provisions, poor provinces face much more serious
service pressures and limited resources. Although meaningful analysis is difficult given restricted
data, based on 2005 data, wealthier provinces spent up to four times more on education than
poorer provinces (Nguyen HP 2012).
While large fiscal transfers for education are made from the centre to provinces with resource
deficits, these allocations are not performance-based. Expenditure norms set by the Ministry of
Education and negotiations between provinces and the Ministry of Finance bear little relation
(Clarke 2007). While present arrangements allocate resources to boost enrolment, there are no incentives to enrol more children in school (Nguyen Phuong 2014).
Arrangements governing revenue sharing within provinces vary considerably. While the State budget laws specify responsibilities with respect to different categories of revenue, there is in practice much variation over revenue sharing at the province, district and commune levels. These combined with differences in the size and composition of local economies drive huge variability in resourcing. As for wealthier provinces, districts with larger tax bases often have greater financial capacity and hence service flexibility. Clearly, decentralization in a weak regulatory environment exists alongside monopolistic forms of supply and weak equalization of funding across sub-national units and service areas.
A major impetus for increasing the autonomy of service providers has been a desire to overcome the inefficiencies of centrally managed, budget-financed provision in a way that stopped short of full privatization (Preker and Harding 2003). But officially granted managerial freedoms have also often simply codified informal charging practices. Ownership has been retained by the state and the supply of services has often remained monopolistic, with no corresponding increase in consumer choice. While greater oversight of charging and managerial practice has taken place, effectiveness has varied. Nevertheless, this does indicate potential for re-regulation where political
and administrative will exists.
Despite further formal regulatory measures such as Decree 85 on health finance, transparency
and accountability remain superficial. The regulatory roles of the State and of health insurance
authorities remain weak and underdeveloped. Despite some positive developments, most efforts
to date do not address root causes such as underlying perverse incentives, institutional weaknesses
and a lack of effective regulation.
Source: NHDR team, from various sources.
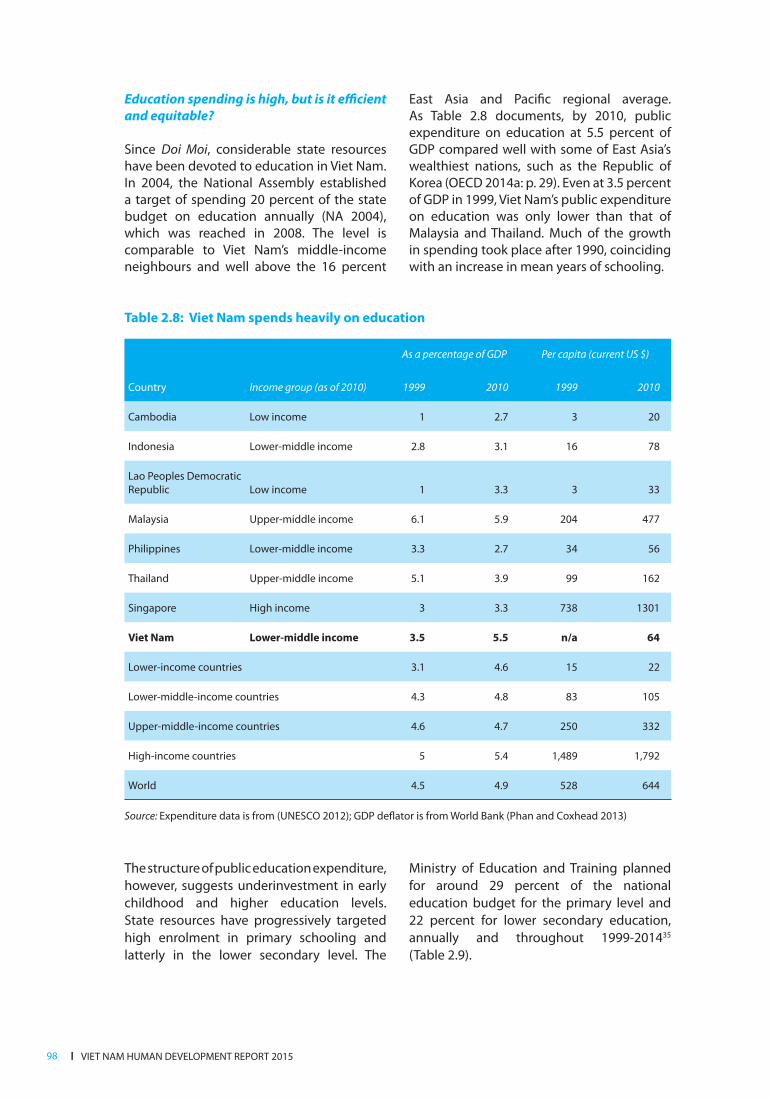
l VIET NAM HUMAN DEVELOPMENT REPORT 201598
The structure of public education expenditure,
however, suggests underinvestment in early
childhood and higher education levels.
State resources have progressively targeted
high enrolment in primary schooling and
latterly in the lower secondary level. The
Ministry of Education and Training planned
for around 29 percent of the national
education budget for the primary level and
22 percent for lower secondary education,
annually and throughout 1999-201435
(Table 2.9).
Table 2.8: Viet Nam spends heavily on education
As a percentage of GDP Per capita (current US $)
Country Income group (as of 2010) 1999 2010 1999 2010
Cambodia Low income 1 2.7 3 20
Indonesia Lower-middle income 2.8 3.1 16 78
Lao Peoples Democratic
Republic Low income 1 3.3 3 33
Malaysia Upper-middle income 6.1 5.9 204 477
Philippines Lower-middle income 3.3 2.7 34 56
Thailand Upper-middle income 5.1 3.9 99 162
Singapore High income 3 3.3 738 1301
Viet Nam Lower-middle income 3.5 5.5 n/a 64
Lower-income countries 3.1 4.6 15 22
Lower-middle-income countries 4.3 4.8 83 105
Upper-middle-income countries 4.6 4.7 250 332
High-income countries 5 5.4 1,489 1,792
World 4.5 4.9 528 644
Source: Expenditure data is from (UNESCO 2012); GDP deflator is from World Bank (Phan and Coxhead 2013)
Education spending is high, but is it efficient and equitable?
Since Doi Moi, considerable state resources have been devoted to education in Viet Nam. In 2004, the National Assembly established a target of spending 20 percent of the state budget on education annually (NA 2004), which was reached in 2008. The level is comparable to Viet Nam’s middle-income neighbours and well above the 16 percent
East Asia and Pacific regional average. As Table 2.8 documents, by 2010, public expenditure on education at 5.5 percent of GDP compared well with some of East Asia’s wealthiest nations, such as the Republic of Korea (OECD 2014a: p. 29). Even at 3.5 percent of GDP in 1999, Viet Nam’s public expenditure on education was only lower than that of Malaysia and Thailand. Much of the growth in spending took place after 1990, coinciding with an increase in mean years of schooling.
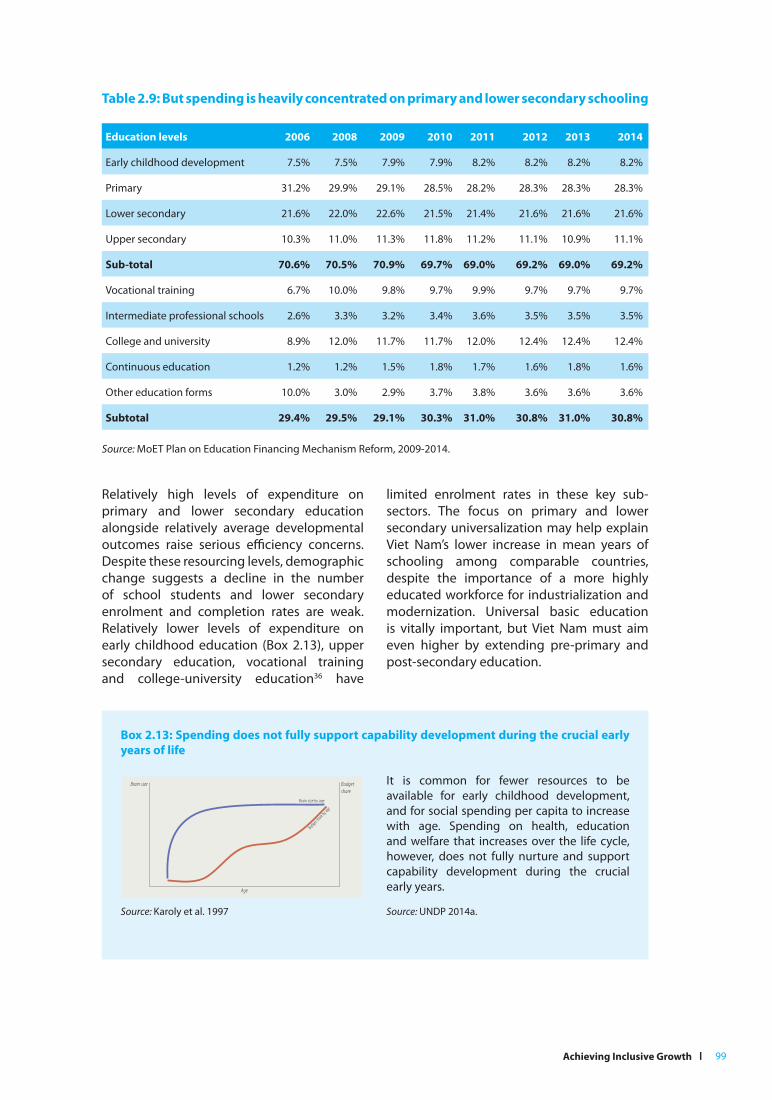
Achieving Inclusive Growth l 99
Relatively high levels of expenditure on
primary and lower secondary education
alongside relatively average developmental
outcomes raise serious efficiency concerns.
Despite these resourcing levels, demographic
change suggests a decline in the number
of school students and lower secondary
enrolment and completion rates are weak.
Relatively lower levels of expenditure on
early childhood education (Box 2.13), upper
secondary education, vocational training and college-university education36 have
limited enrolment rates in these key sub-
sectors. The focus on primary and lower
secondary universalization may help explain
Viet Nam’s lower increase in mean years of
schooling among comparable countries,
despite the importance of a more highly
educated workforce for industrialization and
modernization. Universal basic education
is vitally important, but Viet Nam must aim
even higher by extending pre-primary and
post-secondary education.
Table 2.9: But spending is heavily concentrated on primary and lower secondary schooling
Education levels 2006 2008 2009 2010 2011 2012 2013 2014
Early childhood development 7.5% 7.5% 7.9% 7.9% 8.2% 8.2% 8.2% 8.2%
Primary 31.2% 29.9% 29.1% 28.5% 28.2% 28.3% 28.3% 28.3%
Lower secondary 21.6% 22.0% 22.6% 21.5% 21.4% 21.6% 21.6% 21.6%
Upper secondary 10.3% 11.0% 11.3% 11.8% 11.2% 11.1% 10.9% 11.1%
Sub-total 70.6% 70.5% 70.9% 69.7% 69.0% 69.2% 69.0% 69.2%
Vocational training 6.7% 10.0% 9.8% 9.7% 9.9% 9.7% 9.7% 9.7%
Intermediate professional schools 2.6% 3.3% 3.2% 3.4% 3.6% 3.5% 3.5% 3.5%
College and university 8.9% 12.0% 11.7% 11.7% 12.0% 12.4% 12.4% 12.4%
Continuous education 1.2% 1.2% 1.5% 1.8% 1.7% 1.6% 1.8% 1.6%
Other education forms 10.0% 3.0% 2.9% 3.7% 3.8% 3.6% 3.6% 3.6%
Subtotal 29.4% 29.5% 29.1% 30.3% 31.0% 30.8% 31.0% 30.8%
Source: MoET Plan on Education Financing Mechanism Reform, 2009-2014.
Box 2.13: Spending does not fully support capability development during the crucial early years of life
It is common for fewer resources to be
available for early childhood development, and for social spending per capita to increase with age. Spending on health, education
and welfare that increases over the life cycle, however, does not fully nurture and support
capability development during the crucial
early years.
Source: Karoly et al. 1997 Source: UNDP 2014a.
Age
Brain size by age
Budget share
by age
Brain size Budget share
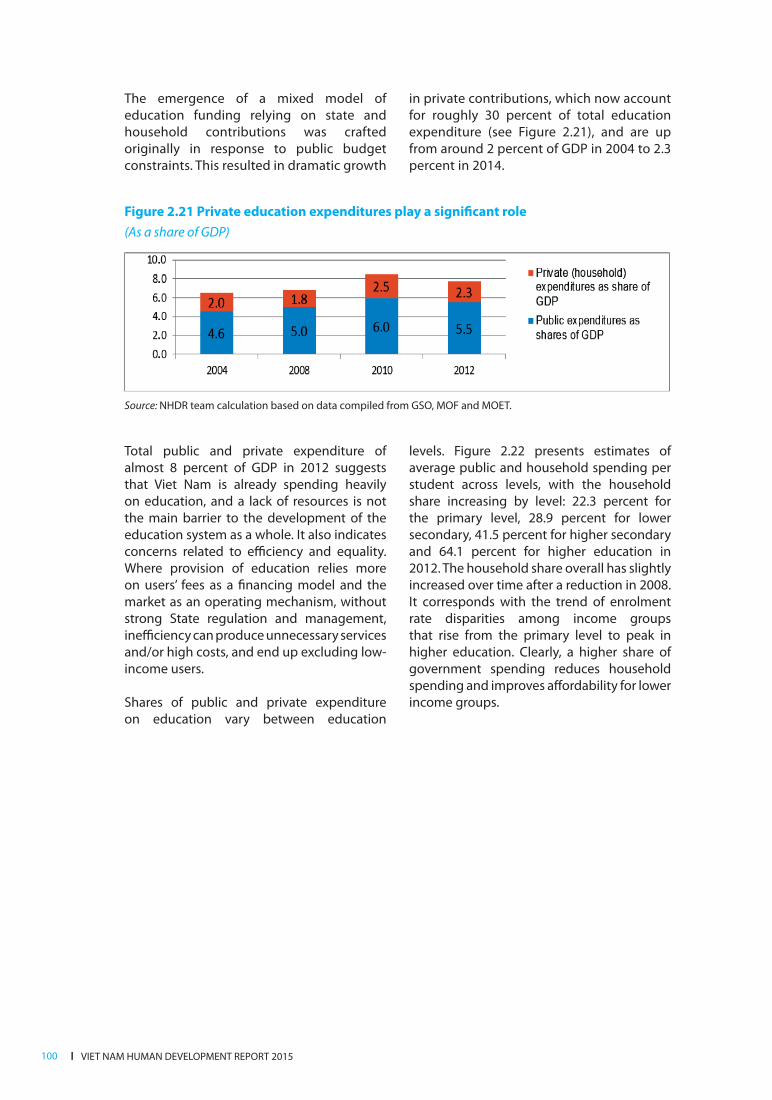
l VIET NAM HUMAN DEVELOPMENT REPORT 2015100
The emergence of a mixed model of education funding relying on state and household contributions was crafted originally in response to public budget constraints. This resulted in dramatic growth
in private contributions, which now account for roughly 30 percent of total education expenditure (see Figure 2.21), and are up from around 2 percent of GDP in 2004 to 2.3 percent in 2014.
Figure 2.21 Private education expenditures play a significant role
(As a share of GDP)
Source: NHDR team calculation based on data compiled from GSO, MOF and MOET.
Total public and private expenditure of
almost 8 percent of GDP in 2012 suggests
that Viet Nam is already spending heavily
on education, and a lack of resources is not
the main barrier to the development of the
education system as a whole. It also indicates
concerns related to efficiency and equality.
Where provision of education relies more
on users’ fees as a financing model and the
market as an operating mechanism, without
strong State regulation and management,
inefficiency can produce unnecessary services
and/or high costs, and end up excluding low-
income users.
Shares of public and private expenditure on education vary between education
levels. Figure 2.22 presents estimates of
average public and household spending per
student across levels, with the household
share increasing by level: 22.3 percent for
the primary level, 28.9 percent for lower
secondary, 41.5 percent for higher secondary
and 64.1 percent for higher education in
2012. The household share overall has slightly
increased over time after a reduction in 2008.
It corresponds with the trend of enrolment
rate disparities among income groups
that rise from the primary level to peak in
higher education. Clearly, a higher share of
government spending reduces household
spending and improves affordability for lower income groups.

Achieving Inclusive Growth l 101
Over time, private household contributions
have become institutionalized, even though
the original rationale for them has receded
with a loosening of fiscal constraints.
Education fee structures have become
more complex, and parents face an array of
formal and informal fees, which set children
from lower income groups at a distinct
disadvantage. The prevalence of informal
fees, the pressure to participate in extra
learning and an ‘overloaded curriculum’ in
primary and secondary schools—examples
of unnecessary services and high costs—have been widely reported and discussed in
Viet Nam.
Ancillary fees can place considerable strain
on all households. Parents must make a range of contributions for items ranging from daily drinking water to air-conditioning in cities. Households with children in lower and
upper secondary education are routinely
compelled to make substantial payments
at the beginning of the school year to
cover expenses for equipment upgrades,
uniforms, extracurricular activities and
other expenses.
The generally non-transparent use of such
payments, though varying among schools,
is a major source of inefficiency.37 On
occasion, such demands have resulted in
parents keeping their children home until
a compromise could be found.38 More than
30 percent of respondents in a national corruption survey said they have to make unofficial payments just to get a school
application and access education services
(World Bank 2012a). In another survey, about
30 percent of respondents with children in primary school mentioned that bribes are required for students to be taken better
care of, compared to 12 percent in 2012 (UNDP 2015b).
Figure 2.22 Household costs are greater for higher levels of education, which can reinforce exclusion
Source: NHDR team calculation based on data from GSO and MOET Plan on Education Financing Mechanism Reform.

l VIET NAM HUMAN DEVELOPMENT REPORT 2015102
Payments for further elective learning is
another dimension. Viet Nam’s short school
day and the reliance of teachers on additional
income has ensured that extra parent-funded
tutoring has become widespread, especially
within urban areas. Evidence suggests that
much of this additional teaching is sub-optimal (if not unnecessary) both for pupils
and the education system (Box 2.14).
Attempting to help poor and ethnic minority households deal with affordability problems, the Government provides deductions and
exemptions that have decreased education
expenditure for them (VHLSS, GSO). As
support targets only the poor, however, a heavy burden can still fall on middle-income families (Kidd et al, forthcoming). Even
the fee exemptions for the poor and other
disadvantaged groups are partly undermined
by the prevalence of informal fees and pressure to participate in extra learning.
While allocating relatively few public
resources to higher education, the Ministry
of Education and Training has a spending
structure strongly biased in favour of capital
investments, reflecting an overemphasis on
the hardware of education, such as buildings
and infrastructure, at the expense of the
software, including human capital. In the Asia-Pacific region, the average share of current
expenditures in total education spending is
86 percent, while 14 percent goes to capital investment. In Viet Nam in 2008, the ratio was 72 percent for current expenditures and 28
percent for capital investment (MOET 2009).
Enforcing discipline and transparency in
resource planning, use and management may be necessary and more important than raising
tuition rates. Further studies could be done to provide alternatives in achieving higher
efficiency, including in terms of expenditure patterns and the household share, allocations between education levels and extra studies in
primary and secondary education.
Box 2.14: Keeping up with extra study—for those who can afford it
Viet Nam’s curriculum covers only a half-day, with full-day schooling largely financed by parental
contributions. Extra study partially compensates for the short hours. It is particularly significant
at the lower and upper secondary levels, and most widespread in cities. In 2006, 50 percent of
pupils were enrolled in extra study (Dang Hai Anh 2013). The situation raises significant equity
issues. Transition years—from primary to lower secondary, and from lower to upper secondary—
are associated with increases in spending on extra classes geared toward exam preparation (World
Bank 2011). Qualitative evidence suggests households hope to maximize children’s academic
performance, meet teacher demands and conform to an established norm. Such practices are
drawing increasing scrutiny amid suggestions that the extra classes, frequently structured around
rote memorization, have little or no benefit for children’s cognitive skills, in addition to being a
drain on household time, resources and morale
Some poorer households resort to borrowing money at high interest rates to send their children
to private tutoring classes (ibid). While the extra study ‘system’ generates sought after income for
teachers, it introduces barriers for children from lower-income households. Shadow education
typically maintains and exacerbates social inequalities, and can create inefficiencies in education
systems. Particularly problematic is when teachers deliberately reduce the effort devoted to their
regular classes in order to reserve their energies for private tutoring (Bray and Lykins 2012).
The Government is aware of this issue and has taken action, including by restricting the delivery of extra study classes in teachers’ homes. Teachers must now register at licensed private study centres. These efforts have shown mixed results. The outcome is not much different in terms of the number of extra classes, and families have to pay more to cover the ‘management fees’ of the centres.
Source: Young Lives 2012b.
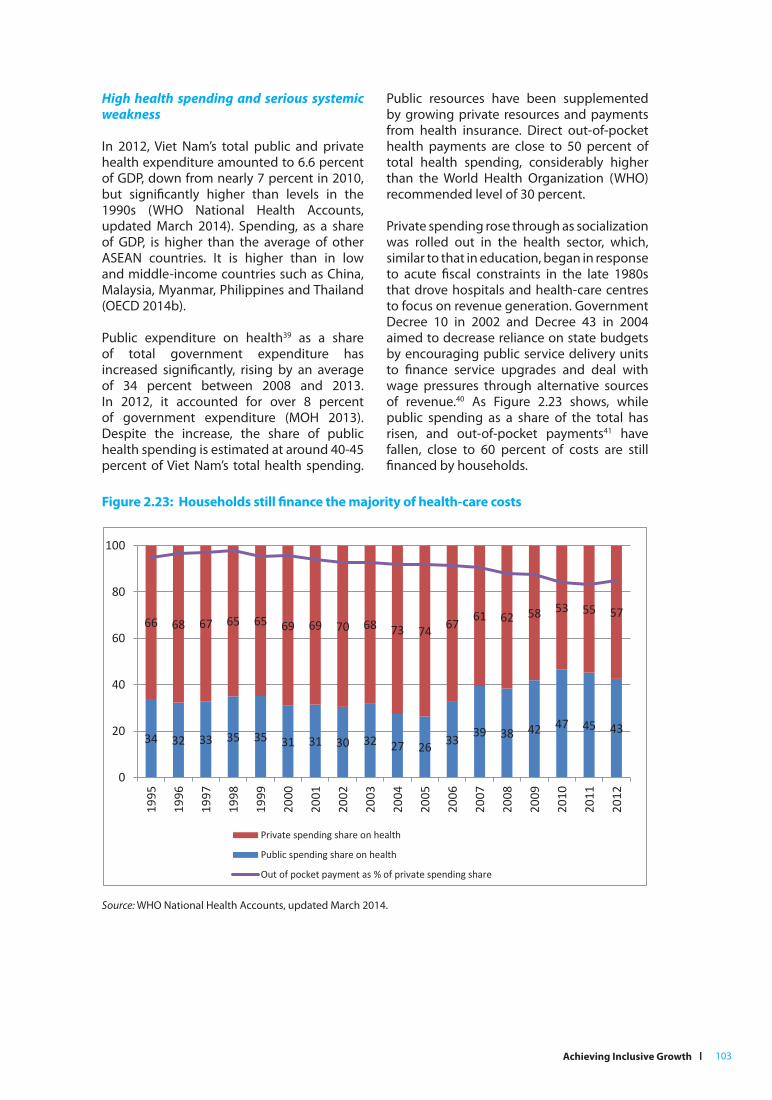
Achieving Inclusive Growth l 103
High health spending and serious systemic weakness
In 2012, Viet Nam’s total public and private health expenditure amounted to 6.6 percent of GDP, down from nearly 7 percent in 2010, but significantly higher than levels in the 1990s (WHO National Health Accounts, updated March 2014). Spending, as a share of GDP, is higher than the average of other ASEAN countries. It is higher than in low and middle-income countries such as China, Malaysia, Myanmar, Philippines and Thailand (OECD 2014b).
Public expenditure on health39 as a share of total government expenditure has increased significantly, rising by an average of 34 percent between 2008 and 2013. In 2012, it accounted for over 8 percent of government expenditure (MOH 2013). Despite the increase, the share of public health spending is estimated at around 40-45 percent of Viet Nam’s total health spending.
Public resources have been supplemented by growing private resources and payments from health insurance. Direct out-of-pocket health payments are close to 50 percent of total health spending, considerably higher than the World Health Organization (WHO) recommended level of 30 percent.
Private spending rose through as socialization was rolled out in the health sector, which, similar to that in education, began in response to acute fiscal constraints in the late 1980s that drove hospitals and health-care centres to focus on revenue generation. Government Decree 10 in 2002 and Decree 43 in 2004 aimed to decrease reliance on state budgets by encouraging public service delivery units to finance service upgrades and deal with wage pressures through alternative sources of revenue.40 As Figure 2.23 shows, while public spending as a share of the total has risen, and out-of-pocket payments41 have fallen, close to 60 percent of costs are still financed by households.
Figure 2.23: Households still finance the majority of health-care costs
Source: WHO National Health Accounts, updated March 2014.
34 32 33 35 35 31 31 30 32 27 26 33 39 38 42 47 45 43
66 68 67 65 65 69 69 70 68 73 74 67 61 62 58 53 55 57
0
20
40
60
80
100
1995
1996
1997
1998
1999
2000
2001
2002
2003
2004
2005
2006
2007
2008
2009
2010
2011
2012
Private spending share on health
Public spending share on health
Out of pocket payment as % of private spending share
l VIET NAM HUMAN DEVELOPMENT REPORT 2015104
Three positive outcomes of recent health-care
policies (Nguyen X. Thanh et al. 2014) include
significantly increased resources for health care
and decreased fiscal pressure; a reduction in
heavy workloads in public health-care facilities,
especially public hospitals;42 and improved
quality through more investments in modern
technologies, especially in diagnostics, and
competition among service providers. More
reliance on user fees and service provision
based on market mechanisms, given lagging
State regulation and management, have also
brought inefficiency and inequality concerns.
As with education, unnecessary services, high
costs and ineffective management of resources
have been some of the consequences.
Unlike in education, overall health
expenditure remains biased towards higher
level care. This in itself has distributional
impacts, given that higher level facilities
are often located in urban areas and serve
clients with more income. Fewer resources
for primary health care at community levels
and preventive health care may mean both
less access to affordable services and fewer
opportunities for effective care. This can lead
to bigger health problems requiring more
expensive care, with additional effects on
equitable access.
‘Induced’ demand by health-care providers
has been among the major negative
outcomes of socialization (ibid). This involves
recommending that patients undergo extra
diagnostic tests, as well as test repetition for
those referred to another health care facility
that does not want to accept previous test
results. Too many drugs are prescribed,
sometimes unnecessarily, which can be
costly and sometimes even harmful.43 Other
issues arise as hospitals tend to hospitalize
patients with conditions that do not require
inpatient care—unnecessary admissions may
be as high as 20 percent (MOH 2013). And
hospitals tend to keep inpatients, especially
those covered by health insurance, longer
than necessary (Sepehri et al.).
High and increasing costs pose a variety of
concerns. Drug prices in some instances are
higher than international reference prices
(MOH 2013). A survey in 2010 showed retail
prices are 12.1 times higher for innovator
brand drugs, and 1.4 times higher for the
lowest price generics. No measures have been
taken to make medicine and health service
prices transparent or control drug prices.
Lack of coordination between hospitals
in procuring drugs, limited enforcement
of policies for public tendering in drug
procurement as well as low compliance with
the list of essential drugs by service providers
are other factors.
These factors together with the introduction
and unwarranted use of high-tech medical
procedures have pushed up health costs.
In 2012, the cost of health treatment per
person was 1.8 million VND, an increase of
30 percent compared to 2010. Between 2005
and 2012, out-of-pocket payments more
than doubled in real terms, even though their
share of overall costs declined (OECD 2014a,
World Bank 2014b).44 These payments have
ensured that Viet Nam’s total health spending
as a share of GDP higher than would be
expected, given Viet Nam’s income level
(World Bank 2014b).
There has also been a blurring of public and
private spheres which has generated perverse
incentives. Without clear guidelines on
revenues collected by health-care providers,
funds are often funneled back into resource-
generating activities, rather than being used
to subsidize other hospital services. Poor
accountability for budgetary allocations
within hospitals may encourage a private ward
bias, for example, including diversion of public
subsidies to support high-cost and lucrative
services delivered in private wards, with the
paradoxical effect of services for the rich being
subsidized by others. Investment in high-tech
diagnostic equipment has become excessive
as providers compete to perform revenue-
producing tests. Finally, weak management
has allowed medical professionals to influence
practices in ways that benefit themselves
personally at the expense of revenue
generation for facilities (Sepheri 2014).
The picture is complex, however. Other
data raise questions about the impact on

Achieving Inclusive Growth l 105
affordability of greater user fees. Figure 2.24 suggests that the share of health-care expenses in household consumption expenditures has fallen over time across income groups, and gaps between lower and higher income groups were narrower in 2012 compared to 2010. This may be the result of increased public spending on health care
and expansion of social health insurance, or alternatively, differential growth in incomes between these groups. Nevertheless, the share of health care expense in household consumption expenditure of the two middle-income groups, while falling, remained at the highest levels.
Figure 2.24: In household budgets, the share spent on health care is highest for middle
income groups
Expenses in household consumption expenditure by income quintile, percentage
Source: GSO, VHLSS
Assessments of the impact of out-of-
pocket health expenditure on poverty show
that rising health-care costs has forced disadvantaged groups to borrow funds or reduce their food consumption to pay for medical care. Many thus fall into or deeper
into poverty. One recent study found that
poor households, compared to non-poor ones, had a four times higher risk of having to reduce food consumption and a five times
higher risk of having to borrow money to pay
for high inpatient and outpatient treatment
costs (MOH 2013) (Box 2.15). Another study (WHO and HMU, 2012) (Table 2.10) found that rates of impoverishment as the result of
catastrophic expenditure were higher among
households in rural areas. Households with
one person enrolled in health insurance had lower risks of impoverishment.

l VIET NAM HUMAN DEVELOPMENT REPORT 2015106
Table 2.10: Poorer and rural people suffer higher rates of impoverishment from catastrophic health expenditure
Households,
percentage
2002 2004 2006 2008 2010
Urban 0.7 1.2 0.9 1.1 0.8
Rural 4.3 5.2 4.0 4.5 3.3
1st quintile 4.6 6.2 5.1 7.5 5.4
2nd quintile 11.1 12.1 9.0 8.6 6.0
3rd quintile 1.0 2.2 1.0 1.5 0.7
4th quintile 0.4 0.2 0.3 0.1 0.4
5th quintile 0.1 0.0 0.2 0.0 0.1
Source: WHO and HMU 2012
Box 2.15: A family borrows funds to pay for a father’s illness, but a young girl still has to give
up college
Health-related expenditures are a significant burden for the majority of the poor and vulnerable. A household member suddenly falling ill may affect the lives of all the remaining members. Children may drop out of school because of insufficient resources, and the family may incur high levels of indebtedness to cover medical expenses.
Ngoc, a young 20-year-old girl, decided to give up college because of her family’s difficult economic condition and her father’s severe illness. She felt that even if she did finish school and became an archive clerk, it would be very difficult later on for her to find a job. She would need money to secure employment, putting an additional strain on family resources.
When her father fell ill, all family members had to put together money from various sources including extensive borrowing. They took a VND 50 million loan using their house as collateral, which was initially intended to buy a cow after the harvest season, yet the money was used to cover medical fees.
Source: Young Lives 2012b.
To address rising overall health expenditures
and falling access to care for those unable to pay, the Government expanded social health insurance with the aim of achieving 80
percent coverage by 2020 and full coverage in the medium term. In 2002, it introduced a
Health Care Fund for the Poor, and absorbed this within the mainstream social health
insurance system in 2009. The SHI fund,
managed by Viet Nam Social Security (VSS), has become the primary vehicle for pursuing
universal health coverage.
Insurance has played an increasingly significant role in the health-care system, with payments
amounting to an estimated 16 percent of health spending in 2012 (OECD, 2014b). High
coverage of health insurance, achieved for
reasons including state subsidies to many
disadvantaged groups, plays an important role in addressing barriers to equal access to health
services. Problems such as the unnecessary reference of patients to higher levels, a lack of
transparency and weak management can be more effectively addressed, including through
implementation of the new Health Insurance
Law. In the longer run, Viet Nam could build on these foundations and move towards a
‘single payer’ health-care system acknowledged as a global best practice approach. Until
then significant reforms and re-regulation are needed if the sector is to efficiently
deliver health outcomes and support more inclusive growth.
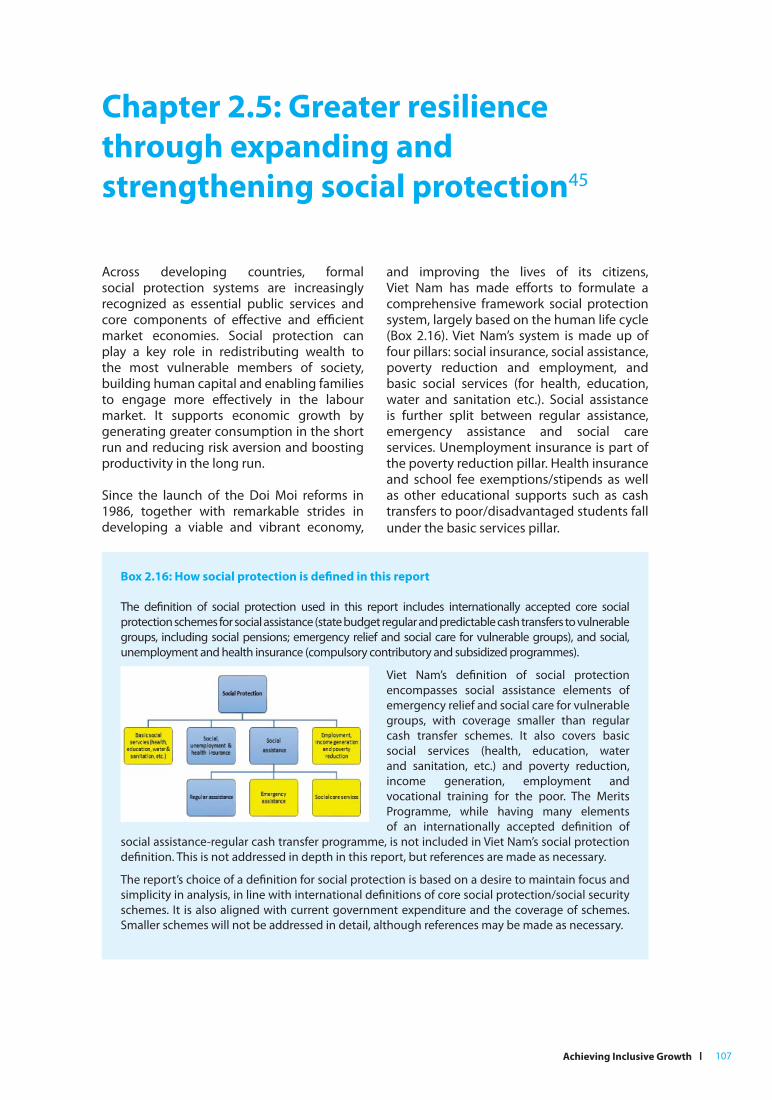
Achieving Inclusive Growth l 107
Across developing countries, formal social protection systems are increasingly recognized as essential public services and core components of effective and efficient market economies. Social protection can play a key role in redistributing wealth to the most vulnerable members of society, building human capital and enabling families to engage more effectively in the labour market. It supports economic growth by generating greater consumption in the short run and reducing risk aversion and boosting productivity in the long run.
Since the launch of the Doi Moi reforms in 1986, together with remarkable strides in developing a viable and vibrant economy,
and improving the lives of its citizens, Viet Nam has made efforts to formulate a comprehensive framework social protection system, largely based on the human life cycle (Box 2.16). Viet Nam’s system is made up of four pillars: social insurance, social assistance, poverty reduction and employment, and basic social services (for health, education, water and sanitation etc.). Social assistance is further split between regular assistance, emergency assistance and social care services. Unemployment insurance is part of the poverty reduction pillar. Health insurance and school fee exemptions/stipends as well as other educational supports such as cash transfers to poor/disadvantaged students fall
under the basic services pillar.
Chapter 2.5: Greater resilience through expanding and strengthening social protection45
Box 2.16: How social protection is defined in this report
The definition of social protection used in this report includes internationally accepted core social protection schemes for social assistance (state budget regular and predictable cash transfers to vulnerable groups, including social pensions; emergency relief and social care for vulnerable groups), and social, unemployment and health insurance (compulsory contributory and subsidized programmes).
Viet Nam’s definition of social protection encompasses social assistance elements of
emergency relief and social care for vulnerable
groups, with coverage smaller than regular cash transfer schemes. It also covers basic social services (health, education, water and sanitation, etc.) and poverty reduction,
income generation, employment and
vocational training for the poor. The Merits Programme, while having many elements of an internationally accepted definition of
social assistance-regular cash transfer programme, is not included in Viet Nam’s social protection
definition. This is not addressed in depth in this report, but references are made as necessary.
The report’s choice of a definition for social protection is based on a desire to maintain focus and simplicity in analysis, in line with international definitions of core social protection/social security
schemes. It is also aligned with current government expenditure and the coverage of schemes. Smaller schemes will not be addressed in detail, although references may be made as necessary.
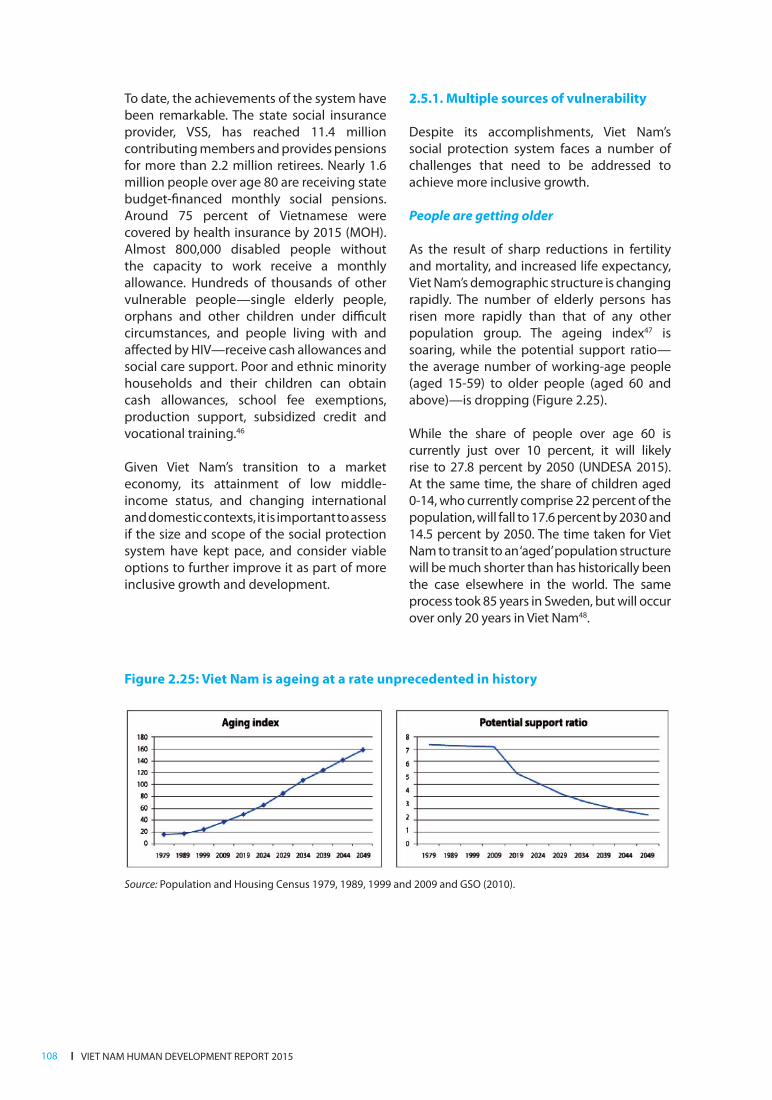
l VIET NAM HUMAN DEVELOPMENT REPORT 2015108
To date, the achievements of the system have been remarkable. The state social insurance provider, VSS, has reached 11.4 million contributing members and provides pensions for more than 2.2 million retirees. Nearly 1.6 million people over age 80 are receiving state budget-financed monthly social pensions. Around 75 percent of Vietnamese were covered by health insurance by 2015 (MOH). Almost 800,000 disabled people without the capacity to work receive a monthly allowance. Hundreds of thousands of other vulnerable people—single elderly people, orphans and other children under difficult circumstances, and people living with and affected by HIV—receive cash allowances and social care support. Poor and ethnic minority households and their children can obtain cash allowances, school fee exemptions,
production support, subsidized credit and
vocational training.46
Given Viet Nam’s transition to a market
economy, its attainment of low middle-
income status, and changing international
and domestic contexts, it is important to assess
if the size and scope of the social protection
system have kept pace, and consider viable
options to further improve it as part of more
inclusive growth and development.
2.5.1. Multiple sources of vulnerability
Despite its accomplishments, Viet Nam’s social protection system faces a number of challenges that need to be addressed to achieve more inclusive growth.
People are getting older
As the result of sharp reductions in fertility and mortality, and increased life expectancy, Viet Nam’s demographic structure is changing rapidly. The number of elderly persons has
risen more rapidly than that of any other population group. The ageing index47 is soaring, while the potential support ratio—the average number of working-age people (aged 15-59) to older people (aged 60 and above)—is dropping (Figure 2.25).
While the share of people over age 60 is
currently just over 10 percent, it will likely
rise to 27.8 percent by 2050 (UNDESA 2015).
At the same time, the share of children aged
0-14, who currently comprise 22 percent of the
population, will fall to 17.6 percent by 2030 and
14.5 percent by 2050. The time taken for Viet
Nam to transit to an ‘aged’ population structure
will be much shorter than has historically been
the case elsewhere in the world. The same
process took 85 years in Sweden, but will occur
over only 20 years in Viet Nam48.
Figure 2.25: Viet Nam is ageing at a rate unprecedented in history
Source: Population and Housing Census 1979, 1989, 1999 and 2009 and GSO (2010).

Achieving Inclusive Growth l 109
As a result of rural-urban migration, the number of elderly persons living in rural areas is 3.5 times higher than the number living in cities. The percentage of elderly people living with their children has declined, resulting in more residing with their spouse or alone, and an increasing number of ‘skip-generation’ households where grandparents are living with their grandchildren (UNFPA 2011). More elderly people are women, with the ratio of elderly women to 100 elderly men increasing from 131 for those aged 60-69 to 149 for ages 70-79 to 200 for 80 years and above (Giang, T.L. 2010).
As Viet Nam ages, a greater share of older people will depend on a shrinking work force, with a negative impact on economic growth unless labour productivity rises and more
people of working age can be engaged in
productive employment. Households with
elderly persons are more likely to be poor, and
ageing will also pose serious challenges in
providing social protection to meet growing
needs. Pressures on health services and
budgets may stem from non-communicable
diseases becoming the main sources of
morbidity and mortality.
Migration, urbanization and the withering
of informal social safety nets
As in other rapidly developing middle-
income countries, migration and associated
urbanization have been key drivers of
socioeconomic change in Viet Nam. These
phenomena underpin the existing growth
model, and play a major role in the distribution of incomes and opportunities. Since the early years of transition, large numbers have
migrated to Viet Nam’s cities from its rural and
agricultural areas. This has had a clear impact
on poverty and vulnerability, and hence the changing demands facing the social protection system. Rising city populations also
require coverage in key public services, most
notably, health and education. Viet Nam’s
household registration system, however, has hindered migrants and their families from accessing these basic entitlements and
contributed to informal work.
Migration has had a transformational effect on social structures, with Viet Nam evolving into a more fragmented, disparate society. Many working-age individuals and young households are many miles from their extended families and live in new urban communities.
Migrant workers and their households tend to participate less in, and therefore receive less assistance from, local organizations and networks than longer term residents. Remittances that migrant workers send home help their families in rural areas, but cannot sufficiently address many family and social care issues for children and the elderly, especially those related to more elderly people living in rural areas, residing with their spouse or alone, or living with their grandchildren in ‘skip-generation’ households (CAF2010).
When migrant workers lose jobs, extended
families and subsistence agriculture in rural
areas can serve as ‘safety nets’, but only for
a few months (UNDP 2010b and CAF 2010).
Without formal social protection, many
households suffer deprivation. Further,
as all of these trends continue, family and
traditional community bonds come under
stress. Informal support networks have
begun to wither away away, underscoring
the urgent importance of a modern social
protection system.
High shares of children live in poverty and
suffer undernutrition
Despite Viet Nam’s good record in tackling
poverty, around 50 percent of children continue to live in or are vulnerable to it. Among households with children aged 16
and under, the poverty rate in 2012 was 14.3
percent, significantly higher than the national
average of 11.8 percent (UNDP calculation based on GSO, VHLSS 2012).
Of particular concern is the high proportion of children who are undernourished.
This impacts negatively on cognitive development, ultimately limiting the ability to perform well at school, and to develop
productive and earning potential as adults. In

l VIET NAM HUMAN DEVELOPMENT REPORT 2015110
2011, 22 percent of children below five were stunted through undernutrition, with the proportion reaching 28.5 percent between 24 and 35 months (UNICEF 2011).
Stunting afflicted 26.8 percent of young children in rural areas, compared to 11.8 percent in urban areas. Among ethnic minority children, 40.9 percent were stunted compared to 19.6 percent among the majority Kinh. Over 40 percent of young children in the poorest income quintile were stunted.49 Even among those in the middle quintiles, stunting still affected 25 percent of children, indicating the impacts of insecure and insufficient incomes among those not regarded as ‘poor’.
These trends call for innovative interventions,
especially through social assistance, to support
families, particularly those with low incomes,
to invest more in their children’s nutrition,
and spend more time with their children to
stimulate their cognitive development, given that this is the foundation for development throughout their lives.
Disability, already significant, and may rise over time
A significant proportion of people in Viet Nam have a disability—around 7 percent of the population in 2006,50 with 3.4 percent having a severe disability. A much higher proportion of the population is affected by disability, however. Around 22 percent of households have a disabled member while 12.5 percent have someone with a severe disability. Disability affects women more than men, and varies by age. Figure 2.26 shows the proportion of people with disabilities and severe disabilities across each age group, with
prevalence beginning to increase around 45
years of age. By age 65, disability affects 30
percent of the population, a share rising to
around 70 percent by age 80.
Figure 2.26: Disability affects women more than men, and increases with age
Source: GSO, VHLSS 2006, Kidd and Abu-el-Haj forthcoming.
There is a clear relationship between poverty and disability. In 2006, the poverty headcount
of households with a disabled member was 20 percent higher than that of households
without one. Among those with severely
disabled members, the poverty rate is 30 percent higher.
Given an ageing population, along with a high number of traffic accidents, natural disasters
and work-related injuries, the proportion of people with disabilities is likely to increase
over time. This will place greater demands on families for care and support. It will require the
Government to expand investment in health
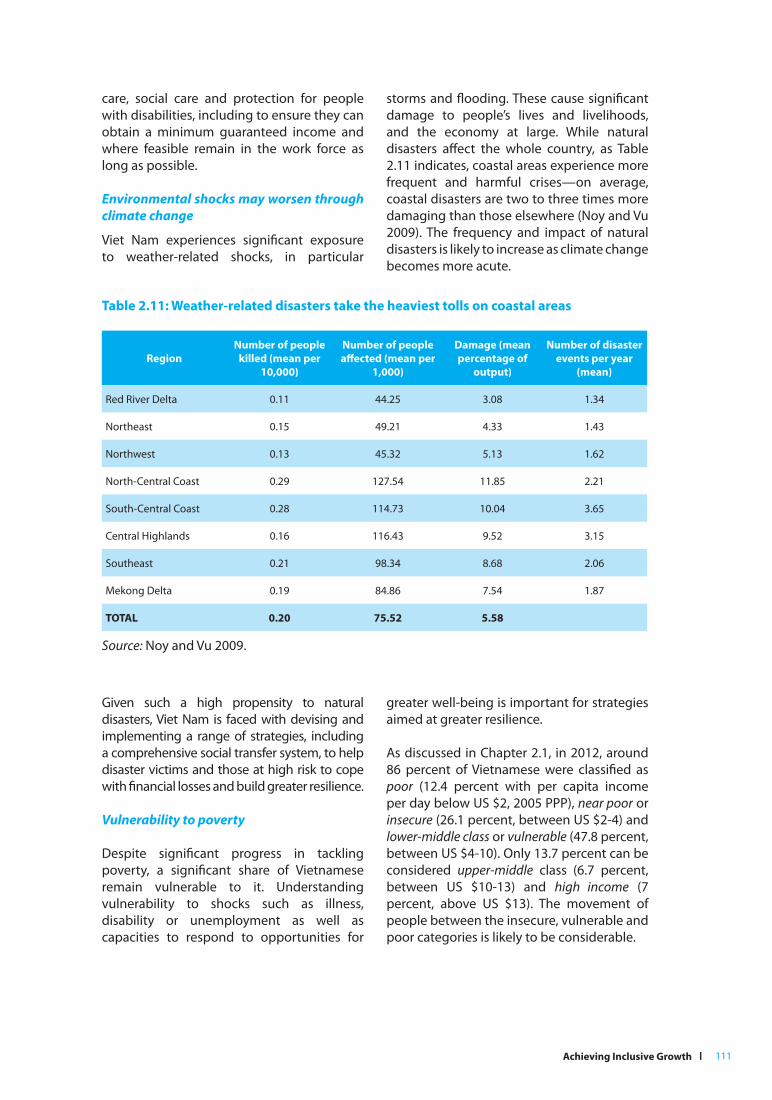
Achieving Inclusive Growth l 111
care, social care and protection for people with disabilities, including to ensure they can obtain a minimum guaranteed income and where feasible remain in the work force as long as possible.
Environmental shocks may worsen through climate change
Viet Nam experiences significant exposure to weather-related shocks, in particular
storms and flooding. These cause significant damage to people’s lives and livelihoods, and the economy at large. While natural disasters affect the whole country, as Table 2.11 indicates, coastal areas experience more frequent and harmful crises—on average, coastal disasters are two to three times more damaging than those elsewhere (Noy and Vu 2009). The frequency and impact of natural disasters is likely to increase as climate change becomes more acute.
Table 2.11: Weather-related disasters take the heaviest tolls on coastal areas
Region
Number of people
killed (mean per
10,000)
Number of people
affected (mean per
1,000)
Damage (mean
percentage of
output)
Number of disaster
events per year
(mean)
Red River Delta 0.11 44.25 3.08 1.34
Northeast 0.15 49.21 4.33 1.43
Northwest 0.13 45.32 5.13 1.62
North-Central Coast 0.29 127.54 11.85 2.21
South-Central Coast 0.28 114.73 10.04 3.65
Central Highlands 0.16 116.43 9.52 3.15
Southeast 0.21 98.34 8.68 2.06
Mekong Delta 0.19 84.86 7.54 1.87
TOTAL 0.20 75.52 5.58
Source: Noy and Vu 2009.
Given such a high propensity to natural
disasters, Viet Nam is faced with devising and implementing a range of strategies, including a comprehensive social transfer system, to help
disaster victims and those at high risk to cope
with financial losses and build greater resilience.
Vulnerability to poverty
Despite significant progress in tackling
poverty, a significant share of Vietnamese remain vulnerable to it. Understanding vulnerability to shocks such as illness,
disability or unemployment as well as
capacities to respond to opportunities for
greater well-being is important for strategies aimed at greater resilience.
As discussed in Chapter 2.1, in 2012, around
86 percent of Vietnamese were classified as
poor (12.4 percent with per capita income per day below US $2, 2005 PPP), near poor or insecure (26.1 percent, between US $2-4) and
lower-middle class or vulnerable (47.8 percent,
between US $4-10). Only 13.7 percent can be considered upper-middle class (6.7 percent,
between US $10-13) and high income (7 percent, above US $13). The movement of
people between the insecure, vulnerable and poor categories is likely to be considerable.

l VIET NAM HUMAN DEVELOPMENT REPORT 2015112
Figure 2.27 shows how household well-being
changed between 2010 and 2012. Around
35 percent of those in the poorest quintile in
2010 had moved into a more affluent quintile
by 2012, with a similar amount falling into
the poorest quintile. Among those living in
poverty in 2012, 24.3 percent had been in the
near poor quintile, 7.1 percent in the middle
quintile, 2.8 percent in the upper-middle
quintile and 1.1 percent in the richest quintile
in 2010.
While the livelihoods of people in the
lower-middle and near poor categories—
around 74 percent of the population in the
‘middle’—have improved, people there are
still vulnerable to shocks. Many, especially
families with children, elderly members
and/or members with disabilities, are still
struggling to meet current needs and save
for the future. Shocks and crises such as
illness, natural disasters and job losses
could, at any time, have a significant impact
on their incomes, potentially pushing them
into poverty.
This suggests the Viet Nam faces a significant
challenge in structuring a social protection
system that not only assists those living
in poverty to achieve minimum living
conditions, but also addresses the increasing
concerns and needs of the large group
of people in the middle of the income
distribution. To sustain and further its poverty
reduction progress, Viet Nam, like many other
middle-income countries, needs to develop
a social protection system that can both
eradicate poverty and prevent those in the
middle from falling back into poverty, while
also promoting their capacities to become
more secure. This would reduce risks, and
encourage households to make positive
investment choices. They would have better
abilities to contribute to and benefit from Viet
Nam’s economic transition, and to move up
the income ladder.
2.5.2. Systemic barriers to full protection
Several constraints currently keep Viet Nam’s
social protection system from fully addressing
changing socioeconomic challenges. These
relate to coverage limitations, transfer levels,
fiscal constraints and delivery issues.
Coverage remains limited
Old age pensions: Participation in Viet Nam’s
contributory social insurance scheme (VSS),
reached 11.4 million workers, barely 21.1
percent of the labour force, in 2014. Even
among formal sector workers, the primary
target of the programme, some 35 percent of
workers are not participating. In the informal
sector, the scheme reached only 191,000 or
0.51 percent of these workers in 2014 (ILSSA
2014). Given that 75 percent of workers
overall are in the informal sector, at the
Figure 2.27: Considerable shares of people move among income quintiles, 2010 and 2012
Source: Kidd and Abu-el-Haj, forthcoming.

Achieving Inclusive Growth l 113
current speed of formalization—2 percent
per year before 2011, minus 1 percent in 2011
and 2012—over the next 10 years, the VSS
will still only reach around 37 percent of the
labour force.
The number of VSS pension beneficiaries
increased from 1.74 million in 2009 to around
2.2 million in 2013, but comprised only 22.4
percent of people aged 60 years and above
in 2009. By 2014, the figure had fallen to 20.9
percent through rapid population ageing
(ILSSA 2014). Around 9.95 percent of people
over 50 receive a social insurance pension.
The proportion is highest among those
aged 60-79, at 14.4 percent. It declines to
7.5 percent among those over 80 and is 5.6
percent of those aged 50-59. The system is
strongly biased towards men, with around
12.1 percent receiving a social insurance
pension, compared to only 7.4 percent of
women. Coverage is very low among ethnic
minorities, at just above 2 percent (ILO and
UNFPA 2014). A sizeable proportion of VSS
pensioners are supported by the State as they
are former public sector workers who retired
before 1995.
Due to the very slow expansion of the VSS,
over the next 10 years, the share of VSS
pensioners among people aged 60 and
above will not increase much. It might even
decline slightly, due to population ageing,
and the progressive reduction in the number
of beneficiaries supported by the State.
While the expansion of the VSS formal
contributory pension scheme faces
difficulties, the number of elderly people
receiving cash transfers financed from the
state budget as a form of non-contributory
pension, especially among people who
have worked in the informal sector, has
been increasing fast. These social pensions
are provided to people aged 80 and above.
Around 1.56 million people, 70 percent
of those aged 80 and above, received
at least VND 180,000 monthly in 2014
(MOLISA 2015).51
Some provinces and cities, especially those
where local revenues meet local budget
requirements, have increased the level of
cash transfers and lowered age thresholds,
for example to VND 350,000 per month in Ha
Noi, and to 70 years of age in Ho Chi Minh City.
Despite these developments, social pension
coverage of people aged 65-79 is very low
(Kidd and Abu-el-Haj forthcoming).52
Health insurance coverage is relatively high,
reaching 75 percent of people in 2015. This
level of coverage has largely been achieved
by the implementation of compulsory health
insurance for formal workers, and notably
through a policy for the State provision of
free health insurance to the poor, children
under six, pensioners, meritorious people
(see box 2.17) and people receiving regular
social assistance, as well as subsidized
health insurance for students and near
poor households (Somanathan et al. 2014;
Tran Van Tien et al. 2011). Completing the
expansion of formal health insurance to
remaining population groups, including near
poor and lower-middle-income people and
even those who are middle income but work
in the informal sector, is seen, including by
the Ministry of Health, as very challenging.
Existing child support schemes have been
mainly designed to assist children from poor
households—for example, through school
fee exemptions, subsidies for early childhood
education, secondary school and boarding
school stipends, and lunch allowances
for ethnic minority students. They also
target children living in extremely difficult
circumstances, including those without
parental support, with disabilities and living
with HIV. Coverage of these schemes varies,
as shown in Annex 5, from a few thousand
children to around 60,000 for initiatives
aimed at children in extremely difficult
circumstances (under Decrees 67 and 13). The
school fee exemption/stipend for students
from poor/ethnic minority households and
other education support schemes reach
almost 5 million students.
Existing disability benefit schemes cover
only around 800,000 persons with extremely
severe and severe disabilities—people
defined as ‘without capacity to work’—and
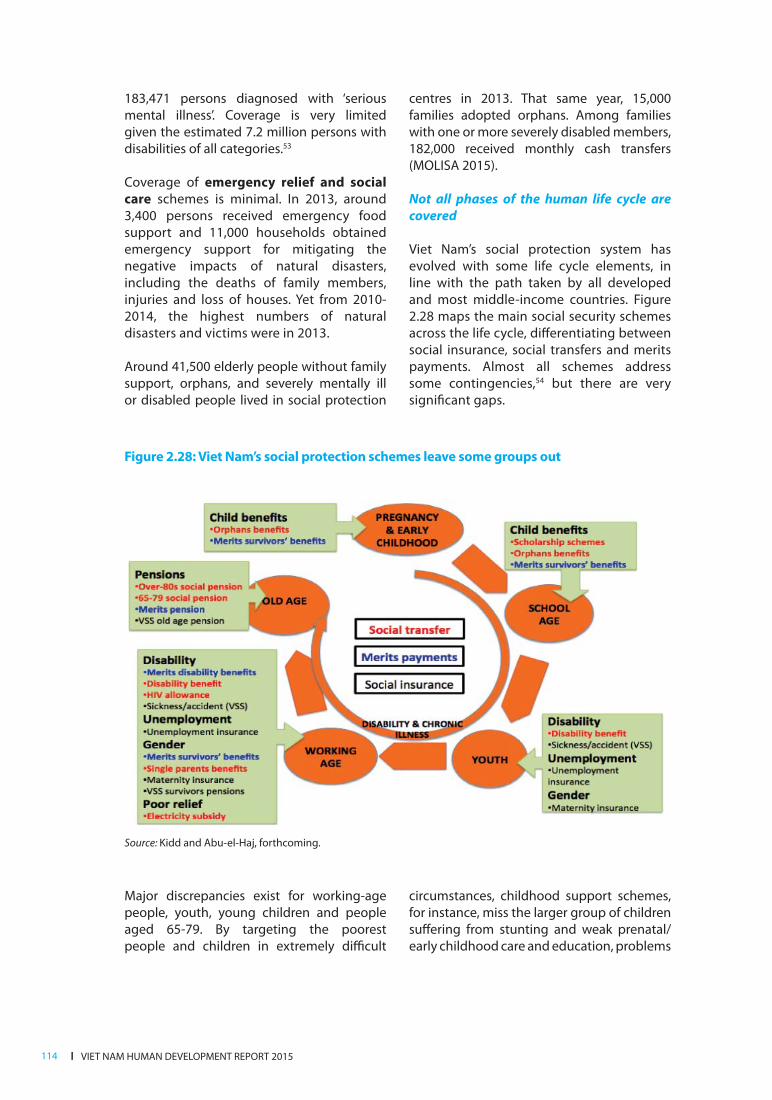
l VIET NAM HUMAN DEVELOPMENT REPORT 2015114
183,471 persons diagnosed with ‘serious mental illness’. Coverage is very limited given the estimated 7.2 million persons with disabilities of all categories.53
Coverage of emergency relief and social care schemes is minimal. In 2013, around 3,400 persons received emergency food support and 11,000 households obtained emergency support for mitigating the negative impacts of natural disasters, including the deaths of family members, injuries and loss of houses. Yet from 2010-2014, the highest numbers of natural disasters and victims were in 2013.
Around 41,500 elderly people without family support, orphans, and severely mentally ill or disabled people lived in social protection
centres in 2013. That same year, 15,000 families adopted orphans. Among families with one or more severely disabled members, 182,000 received monthly cash transfers (MOLISA 2015).
Not all phases of the human life cycle are covered
Viet Nam’s social protection system has evolved with some life cycle elements, in line with the path taken by all developed and most middle-income countries. Figure 2.28 maps the main social security schemes across the life cycle, differentiating between social insurance, social transfers and merits payments. Almost all schemes address some contingencies,54 but there are very significant gaps.
Figure 2.28: Viet Nam’s social protection schemes leave some groups out
Source: Kidd and Abu-el-Haj, forthcoming.
Major discrepancies exist for working-age people, youth, young children and people
aged 65-79. By targeting the poorest people and children in extremely difficult
circumstances, childhood support schemes, for instance, miss the larger group of children
suffering from stunting and weak prenatal/early childhood care and education, problems
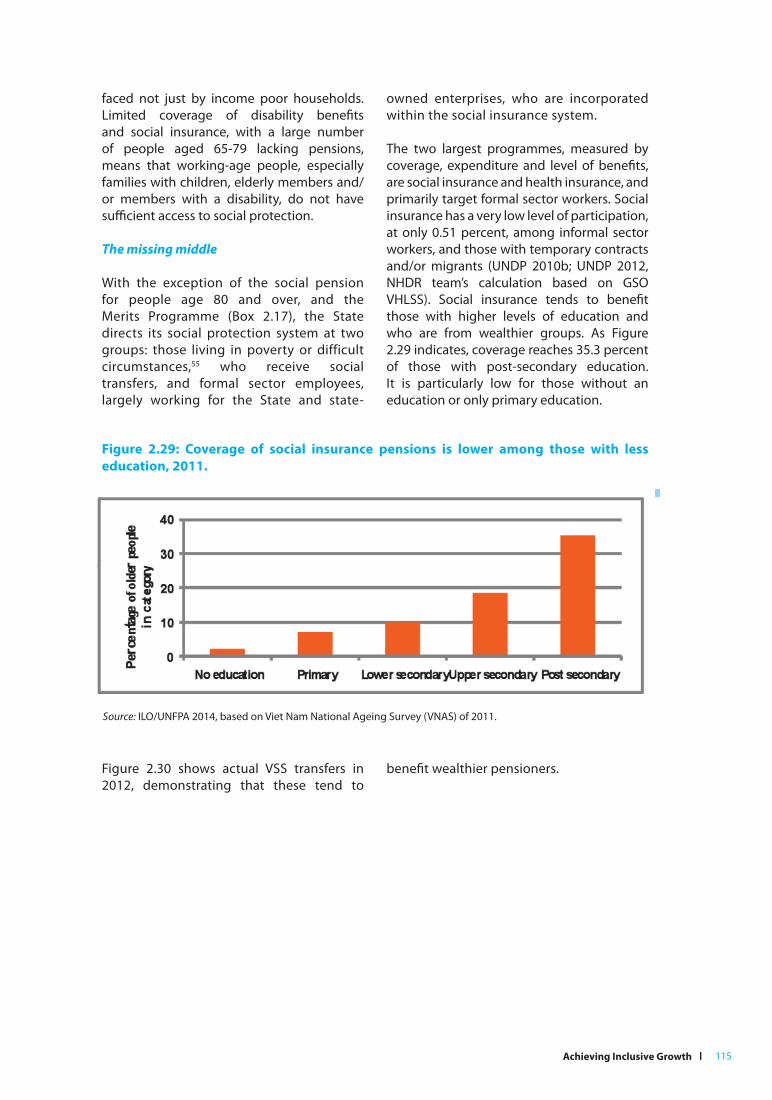
Achieving Inclusive Growth l 115
faced not just by income poor households. Limited coverage of disability benefits and social insurance, with a large number of people aged 65-79 lacking pensions, means that working-age people, especially families with children, elderly members and/or members with a disability, do not have sufficient access to social protection.
The missing middle
With the exception of the social pension for people age 80 and over, and the Merits Programme (Box 2.17), the State directs its social protection system at two groups: those living in poverty or difficult circumstances,55 who receive social transfers, and formal sector employees, largely working for the State and state-
owned enterprises, who are incorporated within the social insurance system.
The two largest programmes, measured by coverage, expenditure and level of benefits, are social insurance and health insurance, and primarily target formal sector workers. Social insurance has a very low level of participation, at only 0.51 percent, among informal sector workers, and those with temporary contracts and/or migrants (UNDP 2010b; UNDP 2012, NHDR team’s calculation based on GSO VHLSS). Social insurance tends to benefit those with higher levels of education and who are from wealthier groups. As Figure 2.29 indicates, coverage reaches 35.3 percent of those with post-secondary education. It is particularly low for those without an education or only primary education.
Figure 2.29: Coverage of social insurance pensions is lower among those with less
education, 2011.
Source: ILO/UNFPA 2014, based on Viet Nam National Ageing Survey (VNAS) of 2011.
Figure 2.30 shows actual VSS transfers in 2012, demonstrating that these tend to
benefit wealthier pensioners.

l VIET NAM HUMAN DEVELOPMENT REPORT 2015116
High health insurance coverage has been
achieved through different targeting
approaches. These have been: (i) categorical
(‘universal’ among some groups, cutting
across all income groups), such as for formal
sector workers or children under six; (ii) based
on poverty targeting: free health insurance
for the poor and people who receive regular
social assistance, and subsidies for the near
poor and some groups of farmers and/or (iii) a
mixture of both. A family approach was taken
under the recently passed Health Insurance
Law, where a subsidy is provided to other
family members who join the first member in
a health insurance scheme.
Health insurance still misses those who are in
the middle of income distribution, however—
typical of most countries in the region.56
Groups with the lowest enrolment rates
consist largely of the non-poor (near poor
and middle-income households) working in
the informal sector (Figure 2.31).
Figure 2.30: VSS transfers to people over 65 tend to go to those who are wealthier
By consumption decile
Figure 2.31 People who are near poor or middle-income have the lowest rates of health
insurance coverage
Source: Kidd and Abu-el-Haj, forthcoming.
Source: 2010 VHLSS.
0
220
40
660
80
1100Pe
rcen
tage
in d
eclil
e
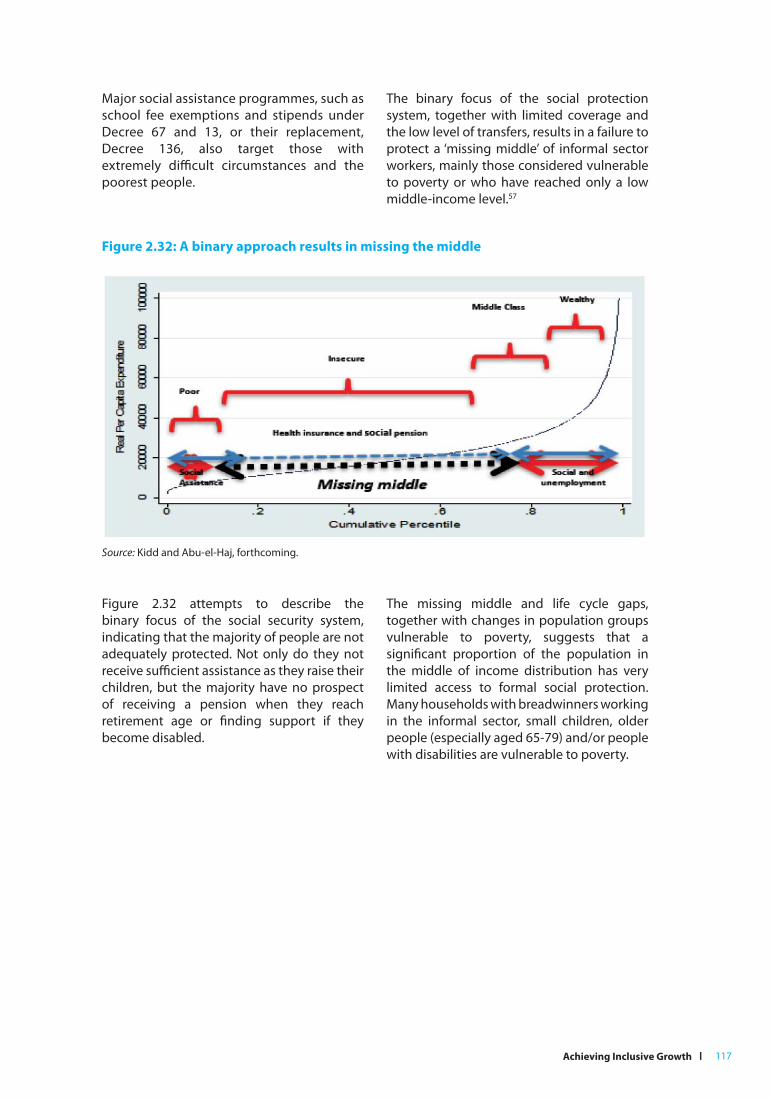
Achieving Inclusive Growth l 117
Major social assistance programmes, such as school fee exemptions and stipends under Decree 67 and 13, or their replacement, Decree 136, also target those with extremely difficult circumstances and the poorest people.
The binary focus of the social protection system, together with limited coverage and the low level of transfers, results in a failure to
protect a ‘missing middle’ of informal sector workers, mainly those considered vulnerable to poverty or who have reached only a low middle-income level.57
Figure 2.32: A binary approach results in missing the middle
Source: Kidd and Abu-el-Haj, forthcoming.
Figure 2.32 attempts to describe the
binary focus of the social security system,
indicating that the majority of people are not
adequately protected. Not only do they not
receive sufficient assistance as they raise their children, but the majority have no prospect
of receiving a pension when they reach
retirement age or finding support if they become disabled.
The missing middle and life cycle gaps,
together with changes in population groups
vulnerable to poverty, suggests that a
significant proportion of the population in
the middle of income distribution has very limited access to formal social protection.
Many households with breadwinners working
in the informal sector, small children, older people (especially aged 65-79) and/or people with disabilities are vulnerable to poverty.
l VIET NAM HUMAN DEVELOPMENT REPORT 2015118
Low value transfers mean low impact social assistance
The impact of social transfer schemes on
individual and family well-being depends,
to a large extent, on transfer value. Values
need to be high enough to achieve the
transfer objective, but not so high—in the
case of working-age families—to discourage
active engagement in the labour force.
Viet Nam’s social transfer system appears
to have very low rates compared to other
developing countries.
The base value58 of social assistance (regular
cash) transfers was VND 180,000 per month.
In 2015, it increased to VND 270,000 in line
with Decree 136. The actual value of transfers
received by some beneficiaries is higher, since the Government applies multipliers for some groups, such as those with ‘double’
disadvantages. These include old age and
disability, being affected by HIV/AIDS, caring for adopted orphans under age four, and having two or more severely disabled
members in a family (MOLISA/SPD report to NA’s Standing Committee, July 2015).
Some provinces—notably those that are net contributors to the central budget—pay
higher benefits and have more generous
eligibility criteria, effectively financing the increase out of provincial resources.
The base social assistance transfer value is low compared to the poverty line. In 2015,
VND 270,000 per month per person was 45 percent and 54 percent of the rural and urban
poverty lines accordingly, and equivalent to
21 percent and 24 percent of the minimum
living standard in urban and rural areas.59 It
was, therefore, insufficient for subsistence,
especially given that the majority of
recipients are either severely disabled and/or
80 years of age and above. In households of more than one person, it offers very little, and
does not enable particularly poor people to
escape poverty and vulnerable households to
mitigate the risk of poverty.
When the value of social transfers for the
elderly are compared to social insurance
pensions, they are also significantly lower. In 2013, the average monthly pension for a pre-1995 retiree was almost 18 times larger than
the base social allowance pension for people
over age 80.
Figure 2.33 compares the value of the
allowance for people over age 80, as a percentage of GDP per capita, with other
social pensions in developing countries. Viet Nam’s social pension is one of the lowest, equivalent to only 4.7 percent of
GDP per capita. The social pension value
in rich provinces is higher, but still low by
international standards.60
Box 2.17: The Programme for Meritorious People (Merits Programme)
The Programme for Meritorious People and victims of Agent Orange has always been a key policy
priority, as, for example, noted in Party Resolution 15 on Social Protection. While the programme is
managed by a special department of MOLISA, separately from other social protection programmes,
it has many features of a social assistance/cash transfer measure.
Payments are regular and predictable, and the programme follows a life cycle design, providing
benefits tailored to older people, people with disabilities, and their survivors, including widows and
children. The payment level is relatively high, in line with that in middle-income countries such as
Brazil and South Africa. The most interesting feature of the programme is that it is very progressive,
with 65 percent of recipients in the poorest 40 percent of the population. This compares very well
with many poverty-targeted schemes in developing countries. For more, See Annex 6.
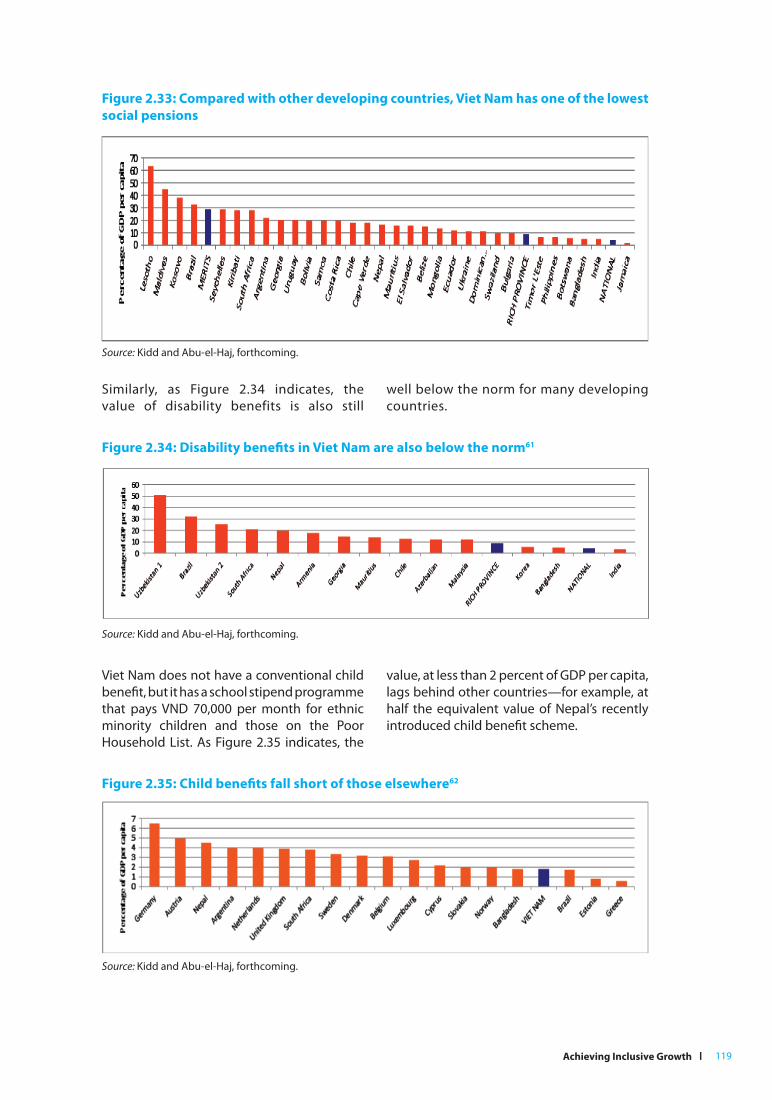
Achieving Inclusive Growth l 119
Viet Nam does not have a conventional child benefit, but it has a school stipend programme
that pays VND 70,000 per month for ethnic
minority children and those on the Poor Household List. As Figure 2.35 indicates, the
value, at less than 2 percent of GDP per capita, lags behind other countries—for example, at
half the equivalent value of Nepal’s recently
introduced child benefit scheme.
Figure 2.33: Compared with other developing countries, Viet Nam has one of the lowest
social pensions
Figure 2.34: Disability benefits in Viet Nam are also below the norm61
Figure 2.35: Child benefits fall short of those elsewhere62
Source: Kidd and Abu-el-Haj, forthcoming.
Source: Kidd and Abu-el-Haj, forthcoming.
Source: Kidd and Abu-el-Haj, forthcoming.
Similarly, as Figure 2.34 indicates, the value of disability benefits is also still
well below the norm for many developing countries.
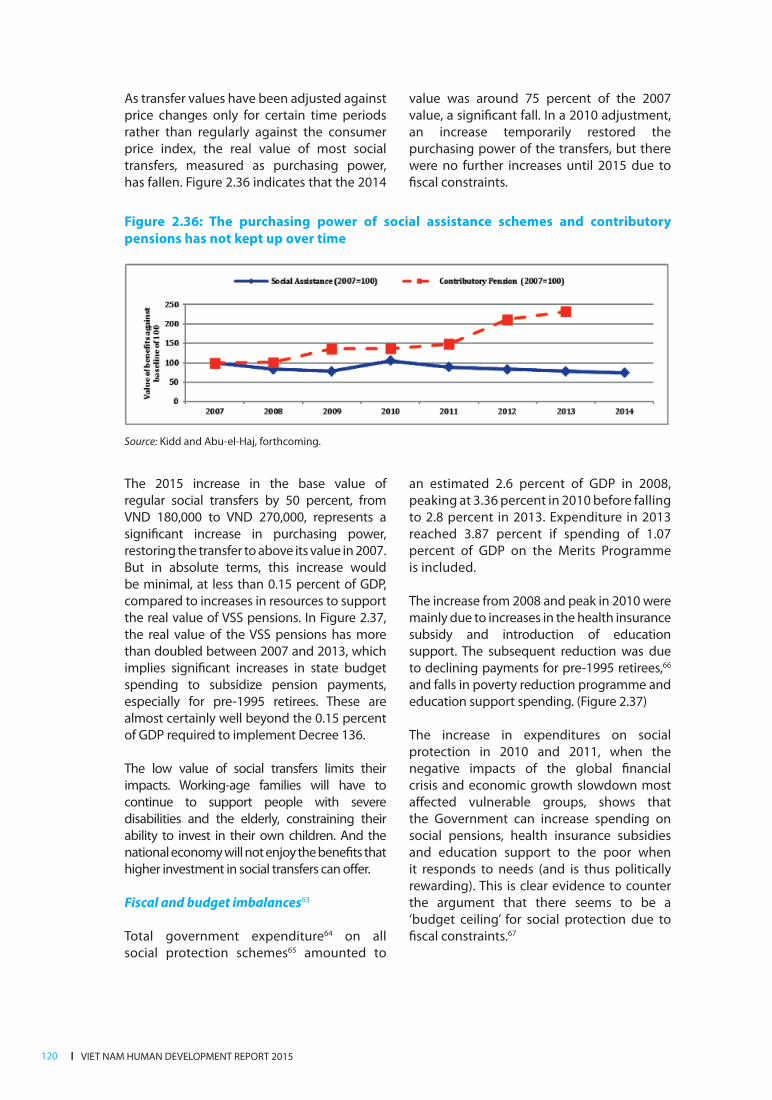
l VIET NAM HUMAN DEVELOPMENT REPORT 2015120
As transfer values have been adjusted against price changes only for certain time periods rather than regularly against the consumer price index, the real value of most social transfers, measured as purchasing power, has fallen. Figure 2.36 indicates that the 2014
value was around 75 percent of the 2007 value, a significant fall. In a 2010 adjustment, an increase temporarily restored the purchasing power of the transfers, but there were no further increases until 2015 due to fiscal constraints.
Figure 2.36: The purchasing power of social assistance schemes and contributory
pensions has not kept up over time
Source: Kidd and Abu-el-Haj, forthcoming.
The 2015 increase in the base value of
regular social transfers by 50 percent, from
VND 180,000 to VND 270,000, represents a
significant increase in purchasing power,
restoring the transfer to above its value in 2007.
But in absolute terms, this increase would
be minimal, at less than 0.15 percent of GDP,
compared to increases in resources to support
the real value of VSS pensions. In Figure 2.37,
the real value of the VSS pensions has more
than doubled between 2007 and 2013, which
implies significant increases in state budget spending to subsidize pension payments,
especially for pre-1995 retirees. These are
almost certainly well beyond the 0.15 percent
of GDP required to implement Decree 136.
The low value of social transfers limits their
impacts. Working-age families will have to continue to support people with severe
disabilities and the elderly, constraining their ability to invest in their own children. And the national economy will not enjoy the benefits that
higher investment in social transfers can offer.
Fiscal and budget imbalances63
Total government expenditure64 on all social protection schemes65 amounted to
an estimated 2.6 percent of GDP in 2008,
peaking at 3.36 percent in 2010 before falling
to 2.8 percent in 2013. Expenditure in 2013
reached 3.87 percent if spending of 1.07
percent of GDP on the Merits Programme
is included.
The increase from 2008 and peak in 2010 were
mainly due to increases in the health insurance
subsidy and introduction of education
support. The subsequent reduction was due
to declining payments for pre-1995 retirees,66
and falls in poverty reduction programme and education support spending. (Figure 2.37)
The increase in expenditures on social protection in 2010 and 2011, when the negative impacts of the global financial
crisis and economic growth slowdown most
affected vulnerable groups, shows that
the Government can increase spending on social pensions, health insurance subsidies and education support to the poor when it responds to needs (and is thus politically
rewarding). This is clear evidence to counter
the argument that there seems to be a ‘budget ceiling’ for social protection due to fiscal constraints.67

Achieving Inclusive Growth l 121
Figure 2.37: Expenditure on social protection is sizeable but imbalanced
2010 prices
Figure 2.38: State expenditures on major social protection schemes in 2013
Source: MOLISA 2015 and ILSSA’s data provided for MPSAR, UNDP Viet Nam calculation.
Source: MOLISA 2015 and ILSSA’s data provided for MPSAR, UNDP Viet Nam calculation.
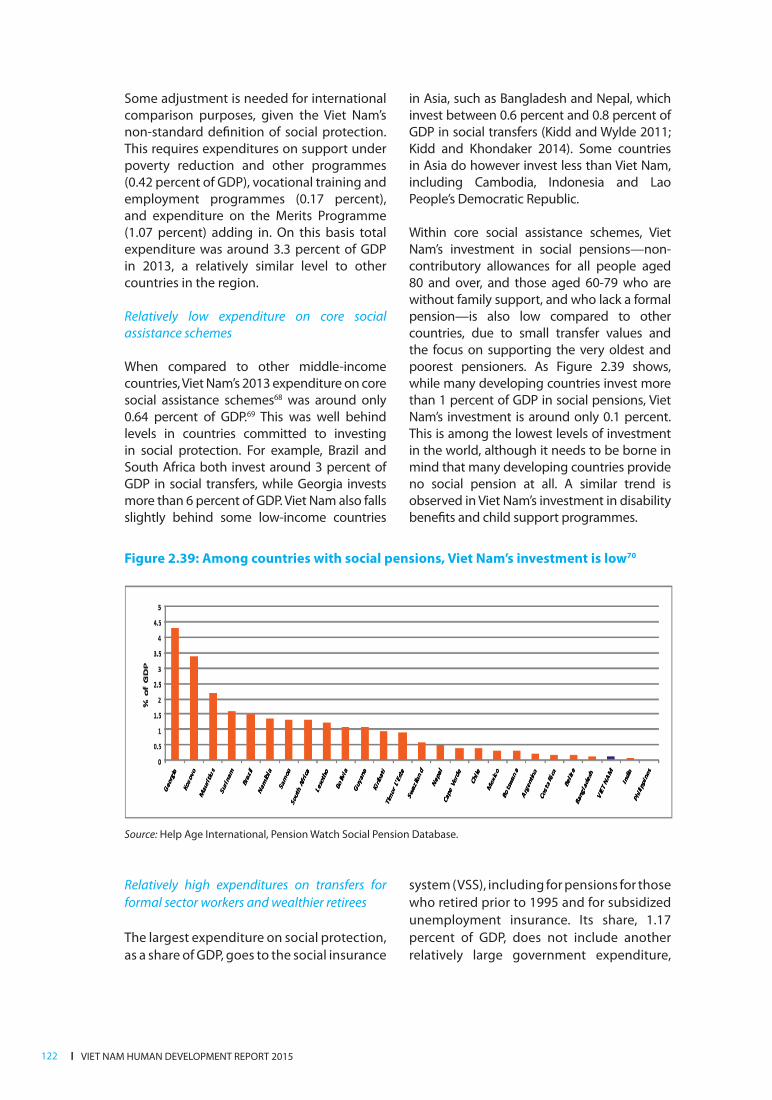
l VIET NAM HUMAN DEVELOPMENT REPORT 2015122
Some adjustment is needed for international comparison purposes, given the Viet Nam’s non-standard definition of social protection. This requires expenditures on support under poverty reduction and other programmes (0.42 percent of GDP), vocational training and employment programmes (0.17 percent), and expenditure on the Merits Programme (1.07 percent) adding in. On this basis total expenditure was around 3.3 percent of GDP in 2013, a relatively similar level to other countries in the region.
Relatively low expenditure on core social assistance schemes
When compared to other middle-income countries, Viet Nam’s 2013 expenditure on core social assistance schemes68 was around only
0.64 percent of GDP.69 This was well behind
levels in countries committed to investing
in social protection. For example, Brazil and
South Africa both invest around 3 percent of
GDP in social transfers, while Georgia invests more than 6 percent of GDP. Viet Nam also falls
slightly behind some low-income countries
in Asia, such as Bangladesh and Nepal, which invest between 0.6 percent and 0.8 percent of GDP in social transfers (Kidd and Wylde 2011; Kidd and Khondaker 2014). Some countries in Asia do however invest less than Viet Nam, including Cambodia, Indonesia and Lao People’s Democratic Republic.
Within core social assistance schemes, Viet Nam’s investment in social pensions—non-contributory allowances for all people aged 80 and over, and those aged 60-79 who are without family support, and who lack a formal pension—is also low compared to other countries, due to small transfer values and the focus on supporting the very oldest and poorest pensioners. As Figure 2.39 shows, while many developing countries invest more than 1 percent of GDP in social pensions, Viet
Nam’s investment is around only 0.1 percent.
This is among the lowest levels of investment
in the world, although it needs to be borne in
mind that many developing countries provide
no social pension at all. A similar trend is
observed in Viet Nam’s investment in disability
benefits and child support programmes.
Figure 2.39: Among countries with social pensions, Viet Nam’s investment is low70
Source: Help Age International, Pension Watch Social Pension Database.
Relatively high expenditures on transfers for
formal sector workers and wealthier retirees
The largest expenditure on social protection,
as a share of GDP, goes to the social insurance
system (VSS), including for pensions for those
who retired prior to 1995 and for subsidized
unemployment insurance. Its share, 1.17
percent of GDP, does not include another
relatively large government expenditure,

Achieving Inclusive Growth l 123
estimated at around 1 percent of GDP, for
contributions to VSS for state employees.
As the VSS scheme is still not fully funded,71
VSS pensions will continue being rather
generous compared to contributions from
employees in the Government and state-
owned enterprises, at least for the next
10 years.
The need to protect the real value of VSS
pensions, which have more than doubled
between 2007 and 2013, will imply
significant increases in budget allocations.
Government transfers to the VSS to finance
pre- and post-1995 retirement benefits and
ensure the system’s financial sustainability
will likely continue increasing for at least the
next 10 years, taking into account an ageing
population, increasing life expectancy, and
expected declining transfers for pre-1995
retirement benefits (Khondaker 2015).
Generous spending on targeted programmes
and fragmented poverty reduction initiatives
As per Viet Nam’s broad definition of social
protection, expenditures are included
for various targeted poverty reduction
programmes and policies. The largest
poverty reduction expenditure, more than
80 percent of spending on national poverty
reduction programmes, is on infrastructure
development in the poorest districts and
communes. The rest is on production
(livelihood) support and capacity building,
housing and land support, farming extension,
resettlement assistance and subsidized credit
to the poor. State expenditures for national
targeted poverty reduction plans and polices
(NTPSPR, 30a and 135P) in 2013 were an
estimated 0.42 percent of GDP.
Spending is also significant, at around 0.23
percent of GDP, on school fee exemptions
and stipends and other educational support
to students from poor households.72An
electricity subsidy for poor households
absorbs a further 0.02 percent of GDP.
Equally, support schemes under poverty
reduction programmes is small in terms
of transfer values, but the number of such
schemes is high.73 The low value of transfers
and the irregularity of some schemes make
administrative costs high while the impacts
remain rather low.
2.5.3. Governance and social assistance
service delivery challenges74
Fragmentation driven by functional overlaps
Policy makers have recognized the problems
of fragmentation, high transaction and
administrative costs, and low efficiency
of national targeted programmes and
poverty reduction policies in general, and
social assistance policies aimed at the poor
in particular. Some major decisions have
included Resolution 80 on the rationalization
of poverty reduction programmes and
policies. It resulted in many poverty reduction
policies, notably educational support and
the health insurance subsidy for the poor,
no longer being financed through national
targeted programmes. Instead, they are
financed through regular sectoral and local
budgets and plans, and therefore are more
‘regular’ and ‘accounted’ for in spending in
respective sectors. The number of national
targeted programmes will fall from 16 to 2 in
the coming five years.
Nevertheless, the number and fragmentation
of such policies remain high. At several policy
discussions on national poverty reduction
programmes and policies, and on social
assistance reform, participants have raised
the issue of overlap in functions among line
ministries and agencies as among the root
causes of fragmentation. Namely, besides
their ‘core’ functions, many ministries and
agencies have been involved in issuing and
managing social assistance policies for the
poor that in many countries are under the
responsibility of the welfare ministry.
Clearer and more detailed definition of social
protection pillars, especially the poverty
reduction pillar, with a system based on
international standards for classification
of expenditures as well as clearly assigned
functions across involved ministries and
agencies, would be helpful. Overcoming
institutional barriers and improving
l VIET NAM HUMAN DEVELOPMENT REPORT 2015124
cooperation among players towards developing consensus on a clear vision and framework/action plan for social assistance reform may take time, however.
Closer monitoring and regulation of provincial implementation of social assistance
Many centrally issued social assistance policies allow provinces to increase coverage and benefit levels if local fiscal space is available. On the one hand, this provides flexibility for these provinces to expand social assistance and thus contribute to national efforts to meet the changing needs of citizens while better reflecting local conditions. On the other hand, the goal of building a progressive and equitable social assistance system that fosters national cohesion and equity can only
be fully achieved if the central Government
steps in to progressively ‘level up’ benefits
and coverage in poorer provinces.
This should be sufficient to maintain the
balance between a floor of nationally
provided coverage and higher levels of social
assistance offered in richer provinces. At a very
minimum, in the short-term, the central level
should monitor variations in eligibility and
benefit levels, given that MOLISA currently
has no central record of these variations (Kidd
and Abu-el-Haj, forthcoming).
Improving institutional capacities
Service delivery of social assistance/cash
transfers still relies mainly on local DOLISA
staff making cash payments directly to beneficiaries, rather than using more modern mechanisms such as through banks, post offices, Internet and card payments, and/or via mobile phones, or through professional non-state service delivery institutions as in many other middle-income nations.
The use of professional institutions could not only help improve service delivery, but also aid in ensuring the segregation of duties and maintenance of checks and balances, freeing MOLISA and DOLISA staff to focus on their core functions of policy formulation and budgeting, monitoring and evaluation, beneficiary identification, and addressing complaints and grievances (ILSSA 2015).
Another issue is the weakness of monitoring
and evaluation and oversight. Regular reports
from local levels do not follow a standard
results-based M&E plan. Sharing information
among different players rarely occurs. Oversight
is not regular or systematic, and there is a lack
of independent evaluations (ibid).
Allowing greater mobility
Finally, social protection schemes,
especially social assistance policies, do
not sufficiently allow for the mobility of
beneficiaries. A more ‘portable’ system
allowing beneficiaries to register where
they work and live (rather than at residence
registrations) would improve human well-
being and economic outcomes.

Achieving Inclusive Growth l 125

l VIET NAM HUMAN DEVELOPMENT REPORT 2015126
Health Education Labor Productivity Social Protection Gender Equality Inclusive Growth Missing Middle Technological Readiness Innovation Medium Technology Emerging Lower Middle Class Health Education Labor Productivity Social Protection Gender Equality Inclusive Growth Missing Middle Technological Readiness Innovation Medium Technology Emerging Lower Middle Class Health Education Labor Productivity Social Protection Gender Equality Inclusive Growth Missing Middle Technological Readiness Innovation Medium Technology Emerging Lower Middle Class Health Education Labor Productivity Social Protection Gender Equality Inclusive Growth Missing Middle Technological Readiness Inclusive Growth Medium Technology Emerging Lower Middle Class Health Education Labor Productivity Social Protection Gender Equality Inclusive Growth Missing Middle Technological Readiness Innovation Medium Technology Emerging Lower Middle Class Health Education Labor Productivity Social Protection Gender Equality Inclusive Growth Missing Middle Technological Readiness Innovation Medium Technology Emerging Lower Middle Class Health Education Labor Productivity Social Protection Gender Equality Inclusive Growth Missing Middle Technological Readiness Innovation Medium Technology Emerging Lower Middle Class Health Education Labor Productivity Social Protection Gender Equality Inclusive Growth Missing Middle Technological Readiness Innovation Medium Technology Emerging Lower Emerging Lower Health Education Labor Productivity Social Protection Gender Equality Inclusive Growth Missing Middle Technological Readiness Innovation Medium Technology Emerging Lower Middle Class Health Education Labor Productivity Social Protection Gender Equality Inclusive Growth Missing Middle Technological Readiness Innovation Medium Technology Emerging Lower Middle Class Health Education Labor Productivity Social Protection Gender Equality Inclusive Growth Missing Middle Technological Readiness Innovation Medium Technology Emerging Lower Middle Class Health Education Labor Productivity Social Protection Gender Equality Inclusive Growth Missing Middle Technological Readiness Innovation Medium Technology Emerging Lower Middle Class Health Education Labor Productivity Social Protection Gender Equality
Health Education Labor Productivity Social Protection Gender Equality Inclusive Growth Missing Middle Technological Readiness Innovation Medium Technology Emerging Lower Middle Class Health Education Inclusive Growth Social Protection Gender Labor Productivity Missing Middle Technological Readiness Innovation Medium Technology Emerging Lower Middle Class Health Education Labor Productivity Social Protection Gender Equality Inclusive Growth Missing Middle Productivity Readiness Innovation Medium Technology Social Protection Middle Class Health Education Labor Education Social Protection Gender Equality Health Missing Middle Technological Readiness Inclusive Growth Medium Technology Emerging Lower Middle Class Health Education Labor Productivity Social Protection Gender Equality Inclusiv Gender Equality Missing Middle Technological Readiness Innovation Medium Technology
Health Education Labor Productivity Social Protection Gender Equality Inclusive Growth Missing Middle Technological Readiness Innovation Medium Technology Emerging Low Middle Class Health Education Labor Productivity Social Protection Gender Equality Inclusive Growth Missing Technological Readiness Innovation Medium Technology Emerging Lower Middle Class Health Education Labor Productivity Social Protection Gender Equality
Inclusive Growth Missing Middle Technological Readiness Innovation Medium Technology Emerging Lower Middle Class Health Education Labor Productivity Social Protection Gender Equality Inclusive Growth Missing Middle Technological Readiness Inclusive Growth Medium Gender Equality Middle Class Health Education Health Education Social Protection Gender Equality Inclusive Growth Missing Middle Technological Readiness Innovation Medium Technology Emerging Lower Middle Class Health Education Labor Productivity Social Protection Gender Equality Inclusive Growth Missing Middle Technological Readiness Innovation Medium Technology Emerging Lower Middle Class
Health Education Labor Productivity Social Protection Gender Equality Gender Equality Missing Middle Technological Readiness Innovation Medium Technology Emerging Lower Middle Class Health Education Labor
Productivity Social Inclusive Growth Gender Middle Technological Readiness Innovation Medium Techno Emerging Lower Middle Class Health Education Labor Produ Social Protection Gender Equality Inclusive Growth Missing Middle Technological Readiness Innovation Medium Technology Emerging Lower Middle Class Health Education Labor Productivity Social Protection Gender Equality Inclusive Growth Missing Middle Technological Readiness Inclusive Growth Medium Technology Emerging Lower Middle Class Health Education Labor Productivity Social Protection Gender Equality Inclusive Growth Missing Middle Technological Readiness Innovation Medium Technology Emerging Lower Middle Class Health Education Labor Productivity Social Protection Gender Equality Inclusive Growth Missing Middle
Health Education Labor Productivity Social Protection Gender Equality Inclusive Gr Missing Middle Technological Readiness Innovation Medium Technology Emerging Lower Middle Class Health Education Labor Productivity Social Protection Gender Equality Inclusive Growth Missing Middle Health Technological Innovation Medium Technology Emerging Lower Middle Health Education Labor Productivity
Social Protection Gender Equality Inclusive Growth Missing Middle Technological Readiness Innovation Medium Technology Emerging Lower Middle Class Health Education Labor Productivity Social Protection Gender Equality Inclusive Growth Missing Middle Technological Readiness Inclusive Growth Medium Technology Emerging Lower Middle Class Health Education Labor Productivity Social Protection Gender Equality Inclusive Growth Missing Middle Technological Readiness Innovation Medium Technology Emerging
3 Achievingthe promiseof inclusive growth
Achieving the promise of inclusive growth l 127
Viet Nam has secured impressive socioeconomic development achievements since Doi Moi was launched almost 30 years ago. However, in recent years both economic growth and the rate of improvement in human development have slowed considerably, and Viet Nam risks a form of stunted development. The impact of this impasse has been felt by Vietnamese people in their daily lives - opportunities for advancement have become more limited, livelihoods have become more precarious and vulnerable, and deep-seated disparities between areas and communities have emerged. Seemingly the drivers of the broadly-based growth set in motion by the Doi Moi reforms, which gave rise to large reductions in poverty and the emergence of middle class, now appear to have run out of steam.
From an inclusive growth perspective, efforts are now needed to correct numerous structural problems in the economy, and shortfalls in social services and social protection systems. Among the most important concerns is slow growth in overall productivity and a failure of the economy to transition from a growth model based on utilization cheap labour and natural resources to one based on innovation and greater efficiency. Key to this are weak linkages between different parts of the economy (agricultural households, the non-farm informal sector, the formal domestic sector and the foreign enterprise sector), and a series of systemic and institutional weaknesses. These have resulted in an economy that is operating below its potential and disjointedly at multiple speeds.
Recent impressive performance on exports lauded by the international community hides significant structural hindrances to economic and labour market development. Similarly, in health and education, high scores of Vietnamese students on the most recent PISA tests and high headline rates of health insurance coverage, mask deficits in the quality of services, inequities and management inefficiencies. The relatively sound level of overall social protection system spending also masks serious problems. Not least is the system’s failure to protect the
‘missing middle’ – a considerable part of the population is exposed to various risks, which in turn impedes their ability to move up the income ladder.
Looking forward, Viet Nam should address these and other challenges, aiming for higher and more equitable human development in line with its aspirations. The real promise of an inclusive growth approach is that by expanding the opportunities and life chances of the many, economic growth can both be maximized and made fair. This chapter proposes a broad policy framework to begin moving in this direction.
3.1: Promoting productive employment
Inclusive growth depends on people at all levels of an economy and society being able to find decent and productive employment. This makes full use of their capabilities, and provides opportunities for increased income and productivity across their working lives. Many of the policy measures to promote productive employment need to support an economy equipped to generate more as well as better jobs and livelihoods. Key elements are macroeconomic stability, higher efficiency, and enhanced technological readiness and innovation.
1. Combat macroeconomic instability to ensure inclusive growth
Macroeconomic instability in the form of high inflation and severe macro-imbalances, such as large trade and budget deficits in the late 2000s, has been a major cause of sluggish economic growth. But while stability is a necessary condition for development, it is not a sufficient one. Policy makers must in tandem actively foster inclusive growth via a series of other reforms.
At high levels of macroeconomic instability, systemic risk causes financial resources to flow into speculation, at the expense of productive and technological capabilities, and skill development. The resultant lower rates of growth often slow movement out

l VIET NAM HUMAN DEVELOPMENT REPORT 2015128
of agriculture, reduce the pace of business formalization and impede the structural transformation of the labour market in the form of the four transitions.1 Those who are poor bear the brunt of high inflation (Nguyen Viet Cuong 2009, Linh Vu Hoang and Paul Glewwe 2009). In short, macroeconomic instability undercuts inclusive growth and human development. Maintaining macroeconomic stability, as measured by low inflation, as well as manageable macro-imbalances in trade and budget deficits, and public and foreign debts is a prerequisite for sustaining rapid and equitable growth. Prudent and countercyclical fiscal policy can be a powerful instrument in this regard. In the context of rapidly rising public debt, which is approaching the approved ceiling of 65 percent of GDP and therefore considerably constraining fiscal space, the budget deficit should be brought down to a sustainable level. The challenge is how to achieve macroeconomic stability while also boosting inclusive growth, and without compromising social inclusion. This entails a degree of flexibility in approach, and a number of adjustments on both the spending and taxing sides over the medium to long term. Crucially, it also depends on reallocations within the budget to favour inclusive development.
Public expenditures should be more progressive to prevent inequality and support Viet Nam’s shift to a new growth model, including through investments in education, health and social protection services. The phasing out of fossil fuel subsidies, complemented by appropriate measures to protect the poor, would help lower budget deficits while increasing efficiency, equity and sustainability. It would induce firms and households to shift to energy-saving and environmentally friendly equipment and technologies, a necessary step towards a greener growth model. Furthermore, widespread energy subsidies tend to be regressive, with the rich as the heaviest energy users capturing the largest share. A phase-out has recently become more feasible given low inflation in general and low
fossil fuel prices in particular. Accelerating the process should be part of a shift towards a new growth model embracing efficiency and sustainability.
On the Government’s revenue side, an expanded tax base is needed, as such a property tax should be introduced to raise budget revenues and improve debt sustainability. This could help to achieve both efficiency, through inducing more efficient use of increasingly scarce urban land, and equity, through the collection of revenues mainly from urban land owners who disproportionately benefit from accelerated urban-based growth. There is still scope to increase special consumption taxes, such as on tobacco and liquor, and phase in an environmental tax. Both can be justified on efficiency and equity grounds.
With regard to monetary policy, measures2 include giving the State Bank of Viet Nam greater independence, avoiding the monetization of the budget deficit and an excessive money supply. Linked to monetary policy is exchange rate policy, for which a common policy prescription3 includes building up foreign reserves in good times and making exchange rates more flexible to help the economy better absorb external shocks, thereby giving monetary policy more room to maneuver in light of the ‘impossible trinity’. Another priority is to avoid an overvalued exchange rate because it shifts resources away from tradeable goods to those that are not tradeable. Exports are important for all transitions, including the formalization of the economy and the labour market. Overvalued exchange rates in particular hurt manufacturing, which otherwise is essential to industrialization and the upgrading of technological capabilities and worker skills, given its highly globalized nature.
2. Raise efficiency by accelerating domestic reforms in tandem with further international integration
Viet Nam faces a transition to growth driven by greater efficiency, entailing considerably
Achieving the promise of inclusive growth l 129
heavier reliance on policies and institutions. Key policy recommendations have been put forward in a number of studies and policy discussions, particularly the biannual economic forums organized by the Economic Committee of the National Assembly with the technical and financial support of UNDP.
2.1. Advance international integration
Viet Nam has consistently pursued external liberalization over the last three decades. Since joining the World Trade Organization in 2007, it has signed a number of trade agreements, most recently the Trans-Pacific Partnership. Overall, the impacts of external liberalization on economic growth in general and on structural transformation of the labour market in terms of the four transitions in particular have been positive. Yet internal reforms have been critical to maximizing potential benefits while minimizing costs associated with international integration.
Looking forward, while the Trans-Pacific Partnership and other new generation free-trade agreements are necessary, they are far from sufficient for Viet Nam to realize inclusive growth and higher human development. The implications of Viet Nam’s obligations under the Trans-Pacific Partnership chapters on state-owned enterprises, industrial relations, intellectual property rights, etc. are still to be understood. More importantly, better access to markets by partnership members and associated increased flows of trade and FDI will not guarantee that Viet Nam can move beyond the lower end of global value chains.
Transitions from lower to higher productivity activities within agriculture and within formal employment will not automatically occur, since they depend to a large extent on domestic reforms. Adjustment costs associated with restructuring certain agricultural sub-sectors with low international competitiveness, such as livestock, may be high. While the increasing presence of Vietnamese and foreign businesses in agriculture in general and livestock in particular promises to inject needed capital, technology and associated
economies of scale to make the sector more competitive, there is a real risk that existing small-scale farms will be driven out of the market. Their owners, particularly older farmers with low levels of human capital, may not be able to find alternative income-earning opportunities.
2.2. Accelerate domestic reforms
A number of domestic reforms should accompany external liberalization to facilitate a rapid and smooth transition to efficiency-driven growth.
Improve effectiveness of public administration reforms.
Common measures to establish a well-functioning market economy comprise strengthened property rights to promote long-term investment, effective implementation of public administration reforms to cut red tape and high transaction costs that disproportionately affect small and medium enterprises, and increased transparency. Viet Nam’s ongoing administrative reforms, which accelerated in 2014 with a view to reaching levels in the six more advanced ASEAN countries, tackle a number of important areas related to the business environment (CIEM 2014). Clearance times for exports and imports, tax payments, business registration and the ease and reliability of power connections are among the issues being scrutinized with indicators that can be monitored (World Bank 2014).
This signals the Government’s determination to boost national competitiveness. From the perspective of inclusive growth, such measures could contribute to the formalization of the economy in general and labour market in particular, as red tape raises costs of doing business, discouraging existing informal firms as well as new firms from pursuing registration. These efforts should be sustained and scaled up across the country, including to improve local governance and promote enterprise development in general, and formal small and medium enterprises in particular. The

l VIET NAM HUMAN DEVELOPMENT REPORT 2015130
latter play an increasingly important role in provinces outside the so-called ‘growth poles’ and to a certain extent counteract naturally unbalanced patterns of economic growth.
Corruption should be tackled aggressively, as it is widely considered to be the root of many serious problems in the economy and society. It remains a main barrier to enterprise development, a major cause of low efficiency in public investment and troubles in the banking system, and a real threat to social cohesion. Rooting out corruption requires both strong political commitment and effective implementation of existing anti-corruption measures. In particular, central and local transparency, and upward and downward accountability should be strengthened considerably. E-government should be expanded aggressively in all areas—the economy, social services and social protection—and appropriate support provided to the poor and those with low incomes so they have access to this powerful instrument, thus improving their participation in economic and social life.
Speed up structural reforms.
The Government has embarked on important structural reforms focusing on public investment, state-owned enterprises and the banking sector to shift towards increasingly efficient growth.
Restructuring and boosting the efficiency of state-owned enterprises: This sector generally acts as a drag on the economy, sapping considerable capital, credit, land, etc. As a consequence, the private sector, particularly small and medium enterprises, struggle with a lack of resources and end up undersized. In considering the way forward, views range from complete divestment to improved governance within state-owned enterprises. Regardless, overall inefficiency is beyond dispute, and action is overdue. A consensus policy prescription4 is to subject state-owned enterprises to competition, market discipline, hard budget constraints and greater transparency along the same lines as listed companies.
Over the longer term, there is a very strong case for the State to divest from productive activities where no market failures are present, and the private sector is able to work to its full potential, generating optimal outcomes in terms of both efficiency and equity. Divestment would allow the State to focus on its core functions of addressing market failures and equity concerns. Many areas of state-owned enterprise activity are de facto natural monopolies, however; and there remains a rationale for maintaining large corporations to build key productive capacities and enable technological diffusion. Where state-owned enterprises monopolize or still possess considerable market power because of missing markets or market failures, independent state regulators should be put in place to properly monitor and regulate them. In areas where technological spillovers exist alongside inadequate productive capacity, but the private sector is not yet ready to step in, only the best state-owned enterprises with proven track records for efficiency and equity should be tasked accelerate technological catch-up. The ‘carrot and stick’ principle should be strictly applied to rents generated by this process, as these may otherwise be abused, resulting in governance failures while market failures remain unaddressed.
Promoting private sector development: Successful reform of state-owned enterprises will release considerable resources and open business opportunities badly needed for developing the private sector as the main engine of employment growth. The issue of privileged ‘connected’ firms should be addressed as part of broader governance reform at both central and local levels, as otherwise a truly level playing field cannot emerge. Private firms without favourable connections cannot grow, which slows structural transformation of the economy and the labour market in terms of the four transitions.
Of direct relevance to inclusive growth is the development of small and medium enterprises and value chains. Government assistance to these businesses has been legally institutionalized in a number of places, such as China, India, Indonesia, Japan, Taiwan
Achieving the promise of inclusive growth l 131
Province of China, Thailand and the United States (Ministry of Planning and Investment 2015). The Republic of Korea passed a law in 1961, amended in 1975, to restrict big firms in business activities intentionally reserved for small and medium enterprises. Since 1975, big firms in outsourcing-intensive industries have been required to stop production of parts and components that had been outsourced (Mukoyama 1999). Such requirements effectively strengthen links between small and big firms, enabling the former to enjoy economies of scale thanks to greater specialization within big value chains. This type of production has grown spectacularly in the last decade, with ongoing international trade reforms and technological innovations. Yet Viet Nam has failed to fully realize the benefits of this global movement.
In Viet Nam, the Ministry of Planning and Investment and the Economic Committee of the National Assembly have been working on a draft law on small and medium enterprises with a view to providing more comprehensive support to them. While more time is needed to finalize the draft, and to evaluate its potential impact, the law is expected to favourably encourage non-farm and formal employment, reducing numerous binding constraints that labour-intensive small and medium enterprises currently face.
Restructuring the banking sector: Policy recommendations5 include accelerating resolution of non-performing loans, such as through appropriate changes in laws on enterprise, bankruptcy, land, etc. to facilitate the emergence of a well-functioning market to deal with bad debt; improved monitoring of commercial banks; more effective implementation of loan loss provisioning and measures to root out connected lending.
From an inclusive growth perspective, the banking sector should serve small and medium enterprises better. The Republic of Korea provides a good example. The Small and Medium-Size Industry Bank and Citizen National Bank were established in the early
1960s primarily to provide credit to these businesses. The Credit Guarantee Fund, created around the same time, guarantees non-collateralized loans taken by them, and encourages private commercial banks to provide credit. Private commercial banks were subsequently required to provide loans to small and medium enterprises at a rate of at least 30 percent of new credit, a target now raised to 35 percent. The Small and Medium-Size Industry Bank and Citizen National Bank provide at least 80 percent of their total credit to these businesses (Mukoyama 1999).
Restructuring public investments: A common policy prescription6 is to effectively implement the recently passed Law on Public Investment. In the context of shrinking fiscal space, private participation in infrastructure development has been identified as one of three breakthrough areas that Viet Nam should pursue through appropriate policies and legal frameworks. As it takes time for various forms of public-private partnerships to flourish, public investment needs to be prioritized to promote external and internal connectivity so that Viet Nam further integrates into the world economy, notably through participation in global value chains. To this end, regional and urban planning should be considerably strengthened, including so that the national interest is not over-ridden by local interests in the context of decentralization. Targeted investments should help rural provinces better exploit their comparative advantages, while promoting economies of scale and agglomeration through accelerated urbanization.
Improving labour market efficiency: The way the labour market functions exerts significant influence on both efficiency and equity. Migration is a key channel for workers from peripheral provinces to participate in economic growth, which tends to be concentrated in the country’s growth poles, and for employers to broaden their pool of labour. Both geographic and occupational labour mobility can help promote inclusive growth by raising efficiency and enhancing equity. This may depend on avoiding over- and underregulation of the labour market

l VIET NAM HUMAN DEVELOPMENT REPORT 2015132
(World Bank 2012b), making benefits of social programmes portable across different locations (World Bank 2003), and relaxing the Ho Khau system of residence registration to enable workers from peripheral provinces to better benefit from urbanization.
3. Increase technological readiness and nurture innovation
Accelerating urbanization: With slightly over 30 percent of people living in urban areas, there is considerable scope for Viet Nam to speed up urbanization with policy instruments at hand, notably effective urban planning and management, efficient public investment, and appropriate incentives to attract private sector participation in the development of hard and soft infrastructure. The key outcome should be the emergence of a modern system of highly connected urban centres, comprising livable big cities, which provide high-end services and R&D centres; medium cities, where industrial clusters are located; and small cities, where agribusiness can easily reach out to farmers in rural areas while being well connected with customers in different parts of the country. Well-networked cities of different sizes will help to raise technological readiness and nurture innovation, and importantly, aid in spreading the fruits of this process across the country.
Developing backbone infrastructure for connectivity and technological readiness: ICT, the Internet, communications, logistics, etc. play crucial roles in improving connectivity and spatial integration of national markets for goods and labour, and in enhancing technological readiness. These areas should be high priorities in Viet Nam’s strategic planning, and be supported by appropriate policies and institutions. Performance indicators should be closely monitored in a manner similar to what Viet Nam is doing now with indicators from the World Bank’s Doing Business report. Considerable efforts should go towards developing infrastructure supporting innovation and technology, such as testing centres, systems for product certification and branding, and so on.
Developing financing to promote technology and innovation: Long-term financing is crucial for technological adoption and diffusion, not to mention invention and innovation, as these activities are time-consuming. This implies developing a market for long-term finance, notably corporate bonds, as in East Asia. The ‘high-risk, high-return’ nature of technology development, adoption and innovation implies the need to set up institutions for the emergence and growth of venture capital. Actions to develop missing markets are warranted sooner rather than later, if Viet Nam is to avoid the middle-income trap.
Strengthening links between domestic firms and the technology-intensive foreign sector: These links are currently weak. Given the growing presence in Viet Nam of multinational corporations leading global production networks, it is important to promote activities with mid-level technology as a pathway for domestic firms to successfully penetrate into global value chains. This effectively means supporting the efforts of Vietnamese firms to establish component-producing industrial clusters that are intermediate in terms of capital intensity and technological sophistication. As these firms face excessively high hurdles in terms of risk, capital and skills availability, they need to be assisted with a mechanism with public-private partnerships, transparency and proper rent management at its core.
Two types of firms can potentially play an important role. The first group comprises technology-linked startups that attempt to develop technological or non-technological innovations, and therefore need to be nurtured and supported with appropriate policy and institutional frameworks. The second group consists of existing efficient firms with proven records in innovation and technology adoption, including high performing state-owned enterprises with certain advantages in size and technology. The role of the State here is to facilitate the emergence and development of so-called ecosystems for technology and innovation, in which the corporate sector works closely with technology universities and the State on feasible paths to develop mid-level technologies.

Achieving the promise of inclusive growth l 133
In agriculture, similar mechanisms should back farmers’ efforts to produce new varieties that meet growing requirements and heightened standards for food safety and greener growth as well as various customer requirements, and generate higher incomes.
3.2 Enhance education and health care as cornerstones of inclusive growth
Improving the quality and expanding the supply of health care and education are critical for inclusive growth and transitioning to a thriving, productive modern economy. As essential human capabilities, education and health, throughout the life cycle, lie at the heart of human development and the full realization of human potential.
The longstanding focus on the basic provision of education has been important, but now needs to expand. Early childhood, post-secondary and vocational education are all key to achieving greater productivity and keeping up with labour market demands. In health care, systemic reforms should aim for equitable access to quality care nationwide. This entails addressing rapidly rising costs and other considerable burdens on middle-income and poor families that have been exacerbated by ‘socialization’ reforms.
1. Moving beyond basics: expand life-long learning
A more modern, productive economy depends in large part on upgrading skills and deepening human capital, which can only be achieved through broadly accessible and high-quality education. Global and regional economic integration and an ageing society make it vital for Viet Nam to catch up with competitor countries and move beyond securing basic provision in primary and lower secondary schooling. While work is still needed to universalize these levels, attention now needs to be given to the early pre-primary years, vocational training and higher education. Expansion there will in the medium term, contribute to growth and productivity, and reduce exclusion, including through expanded opportunities for employment.
The importance of life-long learning is already recognized in various government policies and strategies. Viet Nam’s National Framework on Building a Learning Society aspires to provide every citizen with opportunities to access life-long learning, and links it with socioeconomic progress and the development of the knowledge economy. Party Resolutions 29 and 44 on Fundamental and Comprehensive Education Reform call for the rapid development of high-quality human resources. These and other inputs can be crafted into a suite of policies emphasizing expansion and overall improvements in quality.
Box 3.1 Mobilizing resources for social services in the Socio-economic Development Plan 2016-2020
The draft Socio-economic Development Plan places strong emphasis on mobilizing society’s resources for public services, restructuring providers to operate as public service-providing enterprises, and moving from a supply to a demand-driven model. Financing should directly support beneficiaries, rather than providers. The draft also calls for transparency and public disclosure of prices of essential services. As such, it marks a continuation and expansion of the ‘socialization’ of public service providers, including through piloting community-based management, leasing public infrastructure and assets for service delivery, and running public service providers as public utility businesses.
The expansion of socialization raises important equity and efficiency concerns, particularly in the absence of strong regulation. While the engagement of society and the private sector are increasingly important, the government should—as most other countries have done—continue to serve as a key provider of social services and govern the contributions of other actors. Its financing, oversight, regulatory and management roles need to ensure that these contributions do not come at the expense of the poor and vulnerable or the growing middle class—or, from another perspective, the entire society, as the result of inefficiency.

l VIET NAM HUMAN DEVELOPMENT REPORT 2015134
A key recommendation is that the rapid completion of universalization at the lower secondary level be followed by expansion of early childhood, post-secondary and vocational schooling, especially to lower income groups. This requires reprioritization of budgetary provisions, and legislative and institutional changes to facilitate private and independent service delivery, notably within vocational education to work closely with employers. Where resources are needed for tackling inequality, public monies should be directed to underserved populations, but this must include supporting middle-income groups as well as the most deprived, perhaps based on performance of the institutions in tackling inequities in their localities. In the longer run, Viet Nam should aspire to universal coverage for children of school age (6-18).
The move to user fees in schooling, notably outside primary and lower secondary education under socialization, has produced a number of unintended consequences. This requires urgent reconsideration, especially as the Government has suggested further expanding these reforms (see Box 3.1). While socialization has become deeply embedded within the system and mobilizes considerable resources, its current operation in the context of weak state regulation and management poses equity and efficiency concerns. Current practices, particularly for lower income families, have resulted in suboptimal consumption of services. The Government should take stock of the impact of school charges on poor and middle-income families, and consider the most efficient use of resources before expanding this approach.
Modelled on stronger regulation within primary education, provincial and central authorities should undertake greater
oversight, and make higher levels of transparency and accountability mandatory. Options might include mandated single fee arrangements or an agreed and published tariff for all non-core services.
Build strong foundations through early childhood development
Early childhood development provides the foundation for reducing disparities and boosting inclusive development. Quoting the global 2014 Human Development Report: “Events in early life affect the development of the brain’s circuitry, the dynamic gene-environment interactions and the programming of the body’s immune, neurological and endocrine systems. This has implications for subsequent trajectories of human development.” (UNDP 2014b). Competencies—cognitive, social, emotional and linguistic—are shaped in early childhood, and contribute to the formation of lifelong capabilities. At the aggregate level, these are in time reflected in the quality of a nation’s human capital. As Figure 3.1 shows, when investments in capabilities occur early in life, future prospects are better. Later interventions can help individuals recover, but usually only partially and at much higher costs.
Poverty and vulnerability disrupt early development. Many poor children enter school unready to learn (ibid). Viet Nam could adopt an integrated early childhood development strategy, offering both access to affordable early childhood education and support via the social protection system, and beginning with a focus on vulnerable populations. Among other issues, this would require improved cross-sectoral coordination among line ministries and decision makers.

Achieving the promise of inclusive growth l 135
Access to preschool education should generally be made more inclusive, as the Government has already recognized in rolling out universal preschooling for five-year-olds. This is a positive development, but if Viet Nam is to maximize the impact, these plans need to be more ambitious. A key issue remains the underparticipation of lower income groups and ethnic minorities. Expansion based on universal provision might begin by focusing on disadvantaged areas where enrolment is low and dropout rates are high. Righting imbalanced supply of pre-schooling between rural and urban areas is another important early step.
Invest in post-secondary education to close skills shortages
Skills shortages and gaps in the labour force are already reportedly affecting Viet Nam’s
ability to absorb new foreign investment, and therefore limit the country’s prospects for expanding productive employment. This may become a serious bottleneck to maximizing opportunities from the recently concluded Trans-Pacific Partnership negotiations. The situation is particularly difficult for young labour market entrants who face difficulties acquiring the right skills. While shortages and mismatches are a sign of a dynamic economy, a real concern is whether or not the education and training system can adjust quickly enough to evolving demands for technical skills. While tertiary gross enrolment rates have expanded rapidly in recent years, along with the construction of many new universities and colleges, they remain, as seen in Figure 3.2, significantly lower than in other ASEAN countries, suggesting that supply will need to increase dramatically.
Figure 3.1: When investments in life capabilities occur earlier, future prospects are better
Source: UNDP 2014b
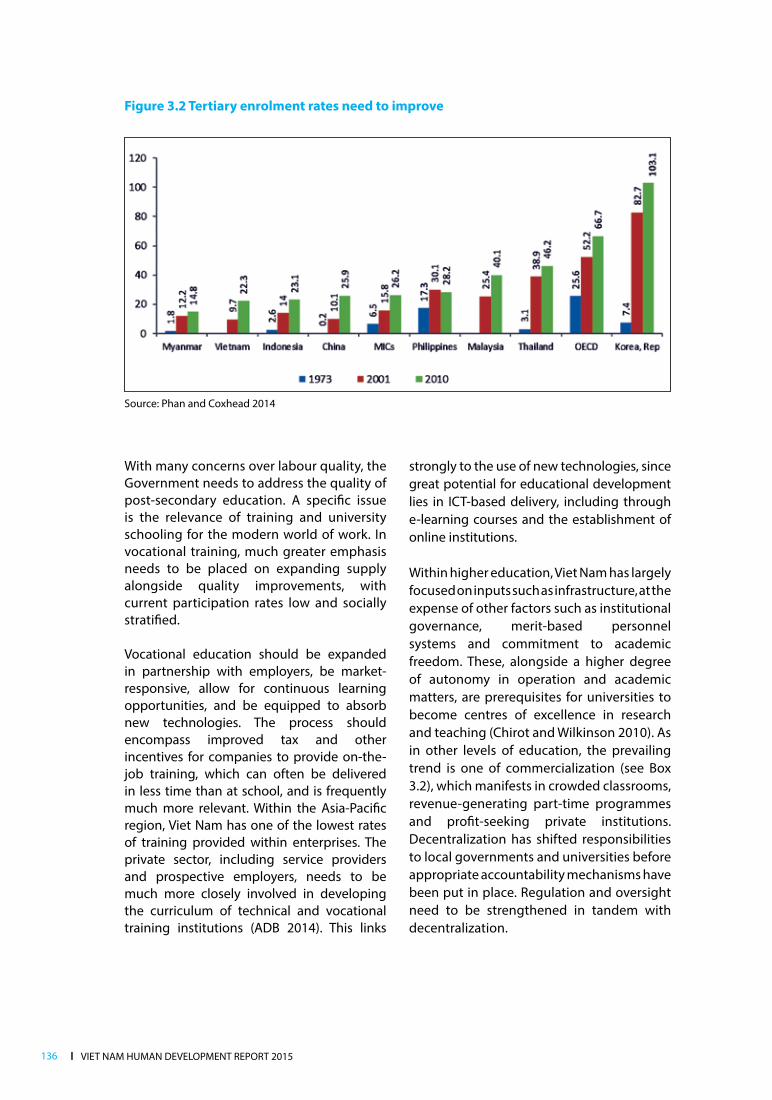
l VIET NAM HUMAN DEVELOPMENT REPORT 2015136
Figure 3.2 Tertiary enrolment rates need to improve
With many concerns over labour quality, the Government needs to address the quality of post-secondary education. A specific issue is the relevance of training and university schooling for the modern world of work. In vocational training, much greater emphasis needs to be placed on expanding supply alongside quality improvements, with current participation rates low and socially stratified. Vocational education should be expanded in partnership with employers, be market-responsive, allow for continuous learning opportunities, and be equipped to absorb new technologies. The process should encompass improved tax and other incentives for companies to provide on-the-job training, which can often be delivered in less time than at school, and is frequently much more relevant. Within the Asia-Pacific region, Viet Nam has one of the lowest rates of training provided within enterprises. The private sector, including service providers and prospective employers, needs to be much more closely involved in developing the curriculum of technical and vocational training institutions (ADB 2014). This links
strongly to the use of new technologies, since great potential for educational development lies in ICT-based delivery, including through e-learning courses and the establishment of online institutions.
Within higher education, Viet Nam has largely focused on inputs such as infrastructure, at the expense of other factors such as institutional governance, merit-based personnel systems and commitment to academic freedom. These, alongside a higher degree of autonomy in operation and academic matters, are prerequisites for universities to become centres of excellence in research and teaching (Chirot and Wilkinson 2010). As in other levels of education, the prevailing trend is one of commercialization (see Box 3.2), which manifests in crowded classrooms, revenue-generating part-time programmes and profit-seeking private institutions. Decentralization has shifted responsibilities to local governments and universities before appropriate accountability mechanisms have been put in place. Regulation and oversight need to be strengthened in tandem with decentralization.
Source: Phan and Coxhead 2014

Achieving the promise of inclusive growth l 137
Box 3.2: Market or commercialization?
It is important to distinguish between a market in education and the commercialization of education. A well-functioning market with healthy competition among institutions for students and financing is important for modernizing particularly the higher education system—within a framework of standards. Modernizing university governance for a mass education system requires acknowledging the role of the market, and setting up appropriate regulatory structures for it to function.
Commercialization, on the other hand, implies the buying and selling of training and degrees with a profit motive. In Viet Nam, the market regulatory framework is still in its earliest stages of development, while commercialization is the predominant trend in both the public and private education sectors. In many cases, what the government has referred to as ‘socialization’ is often synonymous with commercialization (ibid).
Detailed recommendations for education are summarized in Table 3.1, supplementing the discussion above.
Table 3.1: Education policy recommendations
Sub-sector/topic Policies
Early childhood development
Early childhood development for 0-3 year olds
• More systematically promote breastfeeding and child stimulation through parallel family-based interventions in hospitals after birth, in local health stations, in communities and through communication campaigns
• Provide a child benefit scheme
Preschool for 3-5 year olds • Progressively universalize access to full-day preschooling• Introduce a modern child-centred curriculum• Upgrade the teaching workforce• Strengthen quality standards, monitoring and enforcement
Building a cognitive and behavioural foundation in general education
More schooling for all • Increase transition rates into secondary education, in particular upper secondary through fee waivers and direct cash support for less well-off students (as informal payments remain considerable)
• Expand formal full-day schooling and more varied curriculum to reduce need and incentives for extra classes
Better quality schooling for all
• Modernize the curriculum, teaching methods and student assessments, with a stronger focus on critical thinking, problem-solving and behavioural skills
• Improve professional development opportunities and incentives for teachers
Building and updating technical skills in post-secondary education and training
Better information and coordination between education and training facilities and employers
• Initiate and incentivize formal and informal skills coordination and partnership forums at national, provincial and local levels between firms and education and training providers
• Use graduate tracer surveys• Address information barriers in rural and remote areas• Better disseminate available labour market information
Adequate capacity • Invest in faculty/teacher training• Ensure sufficient leadership and management capacity to exercise autonomy at
the institutional level and retain graduates in academia• Provide scholarships
Governance and management
• Recalibrate user charging, including expansion of subsidies• Allow for greater oversight and re-regulation• Develop codes of conduct for transparency and accountability

l VIET NAM HUMAN DEVELOPMENT REPORT 2015138
2. Make health care more inclusive and efficient
Viet Nam’s health care system faces enormous challenges going forward, with shifting disease patterns and an ageing population. About a third of Vietnamese are currently affected by a chronic non-communicable disease, a share which is set to rise in the future. The health care system, particularly at lower levels, such as commune health centres, is ill-equipped to deal with these changes, resulting in heavier burdens for hospitals and other higher level facilities. Urbanization is likely to increase the pressures, while rising health expenditures, driven by factors including new technologies and treatments, underscore an urgent need to review resourcing levels and funding arrangements.
There are currently a number of gaps in the inclusiveness of health care. The system is heavily focused on higher level care in urban areas. Middle income families struggle with higher cost burdens, and financial strains have increased through providers offering costly and unnecessary services. Government efforts to expand the Social Health Insurance Fund offer scope for dealing with many of these issues, aimed at a medium-term target of universal coverage. Without further exemptions and/or subsidies, however, it is highly unlikely that those in the informal sector will be motivated to participate. Migrant informal sector workers are further discouraged by limitations on the portability of health coverage.
Encourage broader coverage
Dealing with these issues could start through offering additional support to encourage greater voluntary participation, including expanded exemptions for the near poor and students. Regulatory efforts are needed to ensure already mandated groups, namely, uncovered formal sector workers, meet their contributions. Residency rules should be reformed, allowing more portable coverage and facilitating the coverage of migrants and their families. The Government should also ensure that co-payment levels are affordable,
especially for lower income groups not necessarily defined as ‘poor’. The Social Health Insurance Fund’s ability to ensure that health-care institutions do not levy excessive additional and non-supported costs should be fully leveraged.
The Government has shown strong determination to improve the inclusiveness of health care—as evidenced by the level of funding for exemptions and subsidies, health insurance coverage reaching 75 percent in 2015 and the new Health Insurance Law. Strong efforts are now needed to implement the law’s provisions in dealing with problems related to provider payments, lack of transparency, weak management of health insurance payments, unregulated referrals of patients to higher levels, and so forth. Strengthening health system governance, including through greater transparency and accountability in Social Health Insurance Fund management, would foster greater public trust and help break a cycle of low trust, limited participation, inadequate financial resources and poor quality.
We make further specific recommendations below (within the social protection section) on securing 100% health insurance coverage levels in tackling the difficulties faced by the missing middle.
Address financing and governance concerns
The way health-care services are financed and governed raises serious efficiency concerns. These include induced unnecessary services, with an overemphasis on high-end services and an overuse of expensive medical technologies. Other issues comprise an underemphasis on prevention and primary health care, rapid price inflation in a context of high out-of-pocket payments, a blurring of public and private activities, and an emergence of a two-tiered system of care. Oversight and regulation are weak, with many overlapping and confusing roles across different departments and levels, as are licensing and accreditation mechanisms. Institutional performance is not strictly monitored and evaluated, and there is
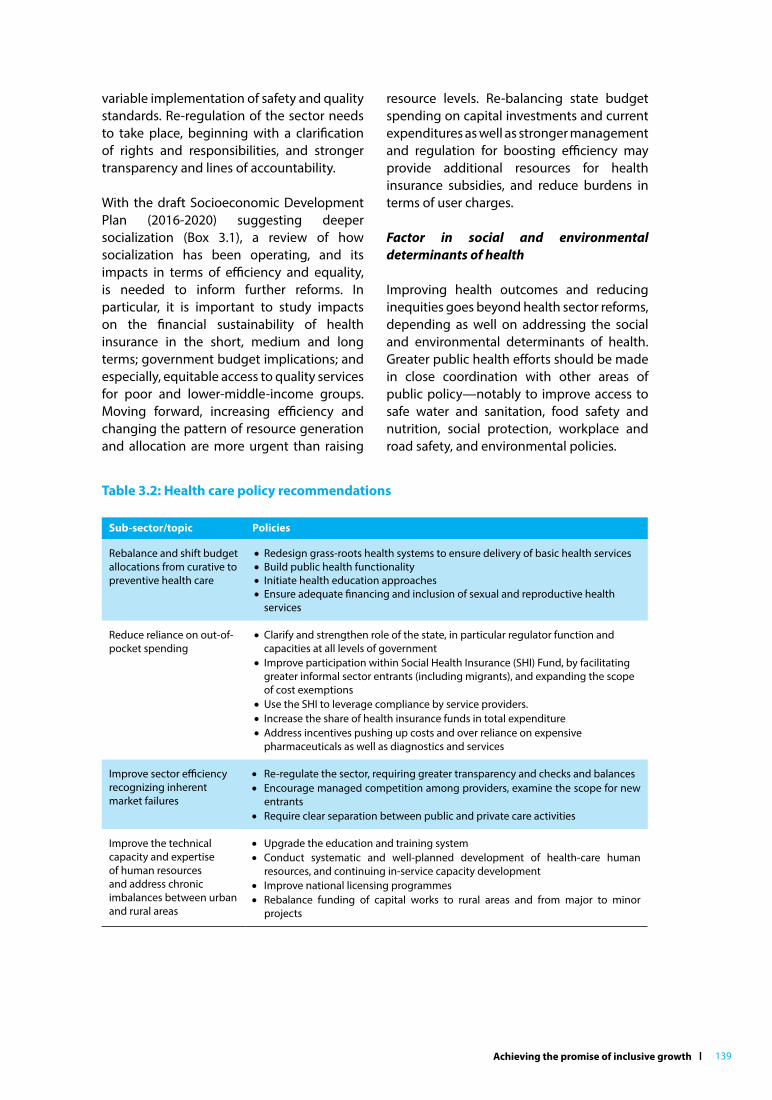
Achieving the promise of inclusive growth l 139
variable implementation of safety and quality standards. Re-regulation of the sector needs to take place, beginning with a clarification of rights and responsibilities, and stronger transparency and lines of accountability.
With the draft Socioeconomic Development Plan (2016-2020) suggesting deeper socialization (Box 3.1), a review of how socialization has been operating, and its impacts in terms of efficiency and equality, is needed to inform further reforms. In particular, it is important to study impacts on the financial sustainability of health insurance in the short, medium and long terms; government budget implications; and especially, equitable access to quality services for poor and lower-middle-income groups. Moving forward, increasing efficiency and changing the pattern of resource generation and allocation are more urgent than raising
resource levels. Re-balancing state budget spending on capital investments and current expenditures as well as stronger management and regulation for boosting efficiency may provide additional resources for health insurance subsidies, and reduce burdens in terms of user charges.
Factor in social and environmental determinants of health
Improving health outcomes and reducing inequities goes beyond health sector reforms, depending as well on addressing the social and environmental determinants of health. Greater public health efforts should be made in close coordination with other areas of public policy—notably to improve access to safe water and sanitation, food safety and nutrition, social protection, workplace and road safety, and environmental policies.
Table 3.2: Health care policy recommendations
Sub-sector/topic Policies
Rebalance and shift budget allocations from curative to preventive health care
•Redesign grass-roots health systems to ensure delivery of basic health services•Build public health functionality• Initiate health education approaches•Ensure adequate financing and inclusion of sexual and reproductive health
services
Reduce reliance on out-of-pocket spending
•Clarify and strengthen role of the state, in particular regulator function and capacities at all levels of government
• Improve participation within Social Health Insurance (SHI) Fund, by facilitating greater informal sector entrants (including migrants), and expanding the scope of cost exemptions
•Use the SHI to leverage compliance by service providers.• Increase the share of health insurance funds in total expenditure •Address incentives pushing up costs and over reliance on expensive
pharmaceuticals as well as diagnostics and services
Improve sector efficiency recognizing inherent market failures
• Re-regulate the sector, requiring greater transparency and checks and balances • Encourage managed competition among providers, examine the scope for new entrants• Require clear separation between public and private care activities
Improve the technical capacity and expertise of human resources and address chronic imbalances between urban and rural areas
• Upgrade the education and training system• Conduct systematic and well-planned development of health-care human resources, and continuing in-service capacity development• Improve national licensing programmes • Rebalance funding of capital works to rural areas and from major to minor projects

l VIET NAM HUMAN DEVELOPMENT REPORT 2015140
3.3: Towards a more comprehensive, inclusive and equitable social protection system
Modernizing the social protection system in Viet Nam is fundamental to fostering more inclusive development. This ensures that economic growth generates more job opportunities and higher productivity, and that all citizens have capabilities to take advantage of these, in the process both contributing to and benefitting from higher growth. Social protection plays an important role in enhancing resilience to risks and eradicating poverty.
Despite Viet Nam’s impressive progress in poverty reduction, 40 percent of people either live in or are vulnerable to poverty, while a further 40 percent have inadequate and insecure incomes. That means that most households, but especially those with elderly people or children, or members with disabilities, struggle to meet their needs, save for the future, invest in their children and deal with shocks. Crises – personal- such as a loss of income, illness or –commuinty wide – such as a natural disaster, could at any time throw vulnerable people back into poverty. Such vulnerabilities limit options for human development, including through the pursuit of new and better job opportunities.
Most people do not enjoy social protection coverage, despite the Constitution’s guarantee that every citizen has the right to social security. The current social protection system has large gaps. These include both the ‘missing middle’ of informal sector workers and those with insufficient incomes and a series of life cycle gaps related to childhood, working-age people with disabilities, and elderly people aged 65-79. These groups as well as the poorest have been prioritized by many other countries, especially middle-income and developed countries. Furthermore, social assistance coverage is low even among those living in poverty. These shortfalls, along with low coverage and low transfer values, reduce the potential contributions of social protection to both family well-being and economic growth.
Viet Nam’s key challenge, as in many other middle-income countries, is to build on past lessons and move towards more inclusive social protection. The system should focus on assisting the poorest to sustain minimum living conditions, and aim at preventing vulnerable middle-income groups from falling into poverty and helping them to stay at the lower-middle level and move up. Such a system could help build the resilience of all Vietnamese while deepening social cohesion and stability, as necessary ingredients for sustainable growth.
In aiming for a social protection system that is equitable and comprehensive, there are key questions about strategic directions for reform, realistic short and medium term targets, and practical and feasible steps suitable to current conditions and intended future growth models.
1. Towards universal health insurance
The expansion of health insurance should continue focusing on the poor but also include the ‘missing middle’—especially the most vulnerable, such the near poor, the elderly and groups affected by diseases that are public health priorities, such as HIV and tuberculosis. This needs to take into account financial implications. While increases in health insurance coverage have been impressive, there are challenges in reaching remaining uncovered people, mainly those who are middle-income and working in informal sectors. Given a strong correlation between coverage increases and levels of government subsidies,7 reaching full coverage may require substantially more investment from the state budget.
The World Bank (2014) estimates, based on a 60 percent coverage rate in 2010, that an additional 0.8–1.7 per cent of GDP will be required for reaching full coverage.8 Given current budget constraints, it is likely more feasible to gradually expand the health insurance subsidy for the near poor, and those who are middle-income and working in the informal sector. The process should start in the
Achieving the promise of inclusive growth l 141
poorest communes, districts and provinces, particularly those with concentrations of ethnic minorities, while encouraging richer provinces to finance expansion from their own resources. Attention should again be given also to vulnerable groups as noted above. Some forms of assistance, particularly to groups with infectious diseases, have in the past been heavily funded by external donors, who now plan to leave Viet Nam given its middle-income status.
2. Towards a fully funded social insurance system
One of the key constraints for the expansion of social insurance, is the VSS Fund’s chronic financial imbalance, which poses for its long-term viability and for the state’s fiscal position (as guarantor of the Fund). VSS pensions continue to be generous compared to contributions, and retirement ages remain low9 in the context of an ageing population and increasing life expectancy. For the next 10 years at least, government transfers to VSS for its own employees and pre-1995 retires, and potentially to support overall financial sustainability, will continue to be significant. Despite estimates that the current payment of around 1 percent of GDP to pre-1995 retirees will be reduced to only 0.3 percent in 2025,10 it is likely that the VSS, without rationalization of benefits and eligibility, will remain a major burden on the state budget. With the state subsidy to unemployment insurance and the pre-1995 subsidy running at 1.37 per cent
of GDP, the potential fiscal threat is much greater than that from expanded expenditure on social assistance.
In addition, with VSS not yet fully funded, it is unlikely to be able to expand its very low coverage of informal sector workers, which was 0.51 percent in 2014, while also sustaining the current average VSS pension level without serious financial consequences. This is an important consideration in examining proposals to expand contributory pension schemes to the informal sector through state-subsidized voluntary contributory pension schemes modelled on approaches in States that are more fiscally secure and have lower levels of informality.
It practice, these schemes, which involve matching past contributions with state subsidies, have a patchy record. While they offer a means of boosting coverage, filling life cycle gaps and reaching the ‘missing middle’, these schemes, especially those aiming at providing future pensions at ‘decent’ levels, are expensive and biased towards upper-income groups. Though cost estimates have not been prepared, international experiences show that the costs of implementing a state-subsidized voluntary contributory pension scheme for Viet Nam’s informal sector could be prohibitively high, beyond the budget capacity of the State. At the same time, without very substantial subsidies, the expected increase in coverage among lower-middle-income people and informal workers is likely to be disappointing.
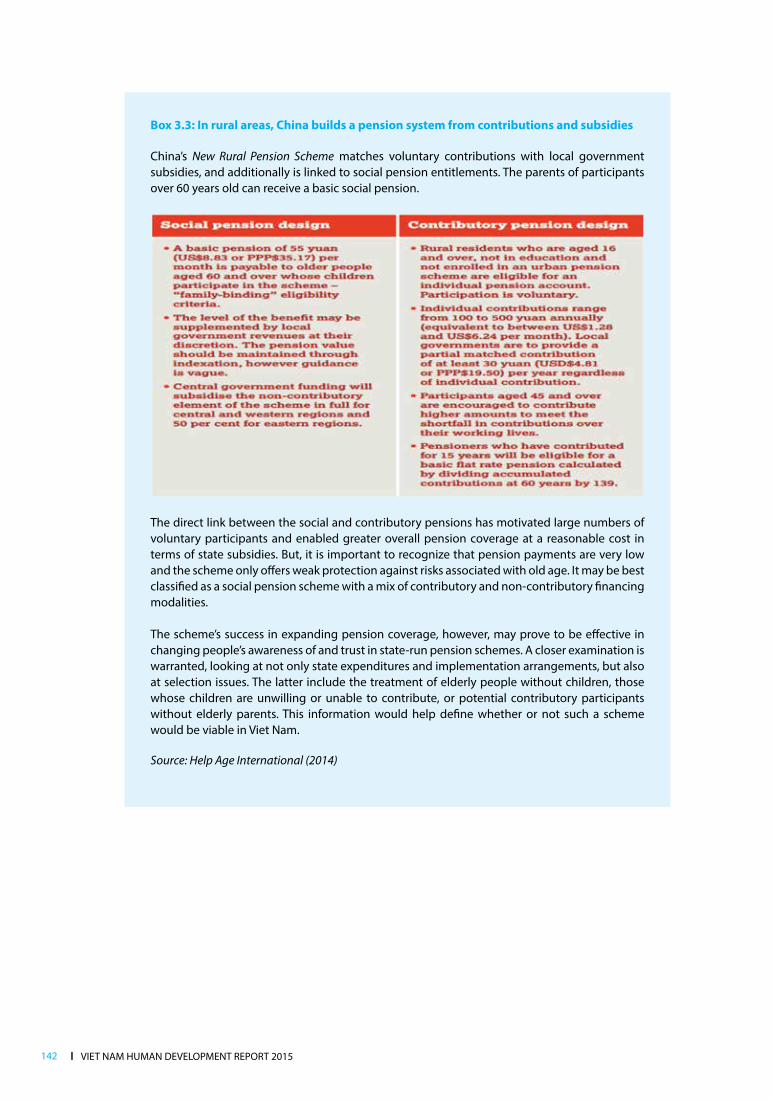
l VIET NAM HUMAN DEVELOPMENT REPORT 2015142
Box 3.3: In rural areas, China builds a pension system from contributions and subsidies
China’s New Rural Pension Scheme matches voluntary contributions with local government subsidies, and additionally is linked to social pension entitlements. The parents of participants over 60 years old can receive a basic social pension.
The direct link between the social and contributory pensions has motivated large numbers of voluntary participants and enabled greater overall pension coverage at a reasonable cost in terms of state subsidies. But, it is important to recognize that pension payments are very low and the scheme only offers weak protection against risks associated with old age. It may be best classified as a social pension scheme with a mix of contributory and non-contributory financing modalities.
The scheme’s success in expanding pension coverage, however, may prove to be effective in changing people’s awareness of and trust in state-run pension schemes. A closer examination is warranted, looking at not only state expenditures and implementation arrangements, but also at selection issues. The latter include the treatment of elderly people without children, those whose children are unwilling or unable to contribute, or potential contributory participants without elderly parents. This information would help define whether or not such a scheme would be viable in Viet Nam.
Source: Help Age International (2014)

Achieving the promise of inclusive growth l 143
With current state budget constraints, VSS should, over the next 10 years, primarily focus on formal sector workers. Expansion of coverage may increase as the economy formalizes, at a rate of about 2 percent per year before 2011, and as the VSS’s capacity for enforcing compulsory social insurance grows.
Increasing the retirement age, as identified in the draft Socioeconomic Development Plan (2016-2020); equalizing the retirement age for women and men; and accelerating the matching of pension benefits with contributions are necessary short-term actions to ensure balanced management of the VSS Fund in the coming 10-15 years. These actions, aimed at VSS becoming self-financing, will lay a solid foundation for financial viability and sustainable expansion over a longer term.11
Resolving the challenge posed by the ‘missing middle’ must primarily focus on reform and expansion of social assistance transfers so that these complement formal VSS and unemployment insurance, and protects people in the lower-middle-income, near poor and poor groups. 3. Towards expanded social assistance (cash transfer) schemes
Viet Nam’s total investment in social protection is at the level of many other middle-income countries, but spending on social assistance transfers is considerably lower, and spread over many small and fragmented schemes, especially those targeting the poor. While there is a need to increase investments in social transfers, a consolidation of current schemes, in line with the overall design of the social assistance system as an integrated component of the more inclusive social protection system, would reduce fragmentation. Otherwise, spreading increased investments too thinly across many small schemes will undercut their effectiveness.
Consolidation of social assistance transfer schemes
The fragmentation of social assistance schemes, particularly those linked to poverty reduction programmes, has already been recognized by the Government. Resolution 80 calls for reviewing such programmes and policies, eliminating those with low effectiveness, and consolidating effective ones into regular policies and the programmes of line ministries. These would be managed under a coherent social assistance system and new national targeted poverty reduction programmes for 2016-2020. While the decision has been made to reduce the number of these schemes from 16 to 2 in the next five years, delays in review and consolidation, and the formulation of sectoral programmes indicate that further efforts are needed to address fragmentation.
The Master Plan for Social Assistance Reform (MPSAR) is expected to lay the foundation for more comprehensive social assistance programmes as integral to a more inclusive social protection system. This offers an important chance for consolidation of social assistance schemes, not only to address fragmentation, but also to define a coherent, long-term framework and a set of core schemes.
Consolidation may involve considering beneficiary selection methods based on vigorous assessments, using the lenses of inclusiveness, equity, effectiveness and socioeconomic impacts to ensure the most suitable methods are applied. Annex 8 provides a more detailed discussion of these issues. The consolidation process also offers a chance to plan a gradual12 shift in resources allocated for infrastructure components of the National Targeted Programmes, once infrastructure development targets are met, to funding life cycle social assistance schemes.Consolidation and effective implementation of MPSAR will require the coherent formulation and regulation of social assistance and social protection policies. The Ministry of Labour, Invalids and Social Affairs, as the social welfare and social security

l VIET NAM HUMAN DEVELOPMENT REPORT 2015144
authority, will need stronger capacities for policy research, for monitoring vulnerability, for developing and applying modern payment mechanisms, for monitoring and evaluation and information management, and for consolidating the management of social protection and assistance systems, among other issues.
Increasing investment in social transfers as integral to further development
Rather than being viewed only as a cost to the state, social transfers should be regarded as an investment and an integral part of the country’s socioeconomic development strategy. Investment in social transfers beyond the current level could help Viet Nam return to higher levels of economic growth, facilitate greater productivity and labour force participation, and improve human well-being and resilience.
Investment in regular social transfers is currently very low, in 2013 reaching only 0.19 percent of GDP, or 0.42 percent including transfers related to school fee exemptions and stipends for poor students (the figure rises to 1.59 percent with transfers to meritorious people). This sum is at the bottom end of international comparisons, but should increase as Viet Nam develops and the overall tax base grows. Higher investment will allow the expansion of social assistance coverage and greater transfer values, and will thus increase the impacts on poverty and vulnerability of the social protection system as a whole, especially since contributory social protection schemes, notably VSS benefits and unemployment insurance, face difficulties in expanding coverage.
Some key questions relate to the optimal level of investment in coming years and the rate of increase. Viet Nam’s investment may follow trends in many other middle-income countries and reach 3-5 percent of GDP over the next two decades (Kidd and Abu-el-Haj forthcoming). Given the current investment level and budget constraints, over the next five years, investment in regular social transfers, excluding meritorious people and
school fee exemptions/stipends, could be in the range of 0.8 percent of GDP. This would be a prudent rate of expansion13 as the economy expands.
Analysis based on a standard social accounting matrix framework14 suggested that this expansion would, in the medium term, pay for itself, as increased social assistance transfers result in higher levels of economic growth and household compensation (see Figures 3.3 and 3.4). The analysis compared the efficiency of greater social assistance spending against an infrastructure project of a similar value, showing the former would increase GDP by just over 2 percent, similar to the impacts of an infrastructure investment. It would raise household consumption by 4.3 percent, well above the increase from comparable infrastructure spending.
Priority areas for increased investment and the proposed social transfer schemes
A modest increase in investment requires careful prioritization. Potential priorities could include schemes addressing life cycle risks for different groups, particularly an expanded comprehensive old-age social pension, enlarged disability benefits for people of working age, a benefit for pregnant women and children in their early years, and a disability benefit for children.
Many other areas could be supported by social transfers, but based on some core considerations and principles. To start, all proposed schemes should aim for higher coverage among specific categories of beneficiaries defined by types of life cycle risks, in line with Viet Nam’s pursuit of inclusive growth. This will ensure reaching both those living in poverty and the higher proportion of the population vulnerable to a fall in living standards. By providing higher coverage, schemes are likely to be politically popular with citizens, which should encourage increased and sustained investment. A further consideration would be to build on a focus on old age, disability and children in

Achieving the promise of inclusive growth l 145
Prioritizing the core schemes of a life cycle social security system, as other elements and benefits for other deserving groups are introduced over the longer term, would ensure that Viet Nam follows the path taken by most countries moving from middle- to high-income status, and provide the basis for a national social protection floor. At all stages of this process, impacts and cost efficiency, financial feasibility and sustainability as well as practical implementation steps need to be considered.
Proposed schemes for the next 5-10 years
Design and costs of proposed social transfers
There are many options for the design of social pensions, disability benefits and child
benefits. Table 3.1 outlines a proposal for expansion, but there are many options for designing benefits. Coverage, eligibility and benefits might all be changed and modify overall costs.
Table 3.3 sets out basic design parameters for schemes and potential costs, totaling around 0.8 percent of GDP, an additional investment of around 0.6 percent of GDP.15 While this may appear to be a significant sum, it is much less than many developing countries are investing in old-age social pensions alone, and only a quarter of the government subsidy to the VSS social insurance pension. See Annex 9 for more details.
Figures 3.3 and 3.4: Social assistance spending boosts GDP as much as infrastructure—and makes an even more powerful contribution to household consumption
Sources: Khondaker 2015
the evolution of the social protection system, since these are the main policy areas covered by social transfers at present, even with a minimal focus on young children. Viet Nam should continue to follow a rights-based
approach to social protection—in line with its Constitution—that aims to progressively provide access to all citizens within available resources.

l VIET NAM HUMAN DEVELOPMENT REPORT 2015146
Progressive introduction of the schemes
An increase in the financing of social assistance schemes by around 0.6 percent of GDP is affordable even in 2015-2016—if it is considered a priority, and recognized as effective in reducing vulnerability and poverty. It would entail the reallocation of resources from other areas. For example, some saving from the gradual reduction of the subsidy for fossil fuel, which is estimated at around US $3.5 billion in 2012 (UNDP 2014c), may be used to finance the social assistance expansion. New taxes, such as on property, and more progressively on tobacco and luxury goods, could also help increase revenues for social assistance.
Otherwise, given current fiscal constraints, and if reprioritization, reallocation and increase of revenues cannot take place, the proposed schemes could be introduced gradually over five years. Options include initiating each of the schemes in a different year. The old age pension could at first carry an eligibility age of 70 years, falling to 65 after several years. Prioritizing certain areas of the country and gradually rolling out the schemes nationally would be another option. ‘Richer’ provinces would be encouraged to expand the schemes using their own resources, while the central Government would back expansion of the schemes in the poorest communes and districts, and eventually provinces. Initially low transfer levels could be increased yearly
to an optimum level agreed by the central Government. Both expansion in coverage and benefit levels should be within the same nationally designed schemes.
Conclusions
Through its Doi Moi reforms, Viet Nam achieved economic growth from the 1990s through the mid-2000s that was not only rapid, but inclusive and socially transformative. It generated rapid and large-scale poverty reduction, an emerging middle class and improved human development. In recent years, the pace of improvement has slowed, however, compared to many other countries in the region. There is also evidence of growing inequities associated with a rapidly changing economy. Reforms are required to secure a return to rapid economic growth and ensure greater inclusion, two elements that are mutually supportive and maximize Viet Nam’s ability to fully harness its rich human and physical endowments.
It is commonly agreed that the scale and type of the gains made in the initial post-Doi Moi period have become considerably more difficult to secure. As Viet Nam moves up the development ladder, it is transitioning to a phase where efficiency and innovation play considerably greater roles, as do economies of scale through higher levels of specialization relative to traditional comparative advantages. In this new context,
Table 3.3: Basic design parameters and costs of proposed schemes16
Scheme Category (age in years) Coverage Value of benefit
(VND)Cost
(VND billions)Cost
(% of GDP)
Social pension 65+ 82.2% 360,000 22,100 0.49%
Disability benefit 18-65 2.4%17 360,000 6,300 0.14%
Early childhood benefit 0-4 70% 120,000 6,700 0.15%
Child disability benefit 0-17 0.9%18 360,000 900 0.02%
Total 36,000 0.8%
Source: Kidd and Abu-el-Haj, forthcoming
Achieving the promise of inclusive growth l 147
policy and institutional reforms in the management of the economy, social services and social protection should be designed appropriately and implemented effectively, helping to underpin a smooth and successful transition.
This process rests largely on putting in place policies and institutions that back higher labour productivity and upward income mobility within agriculture and formal employment, the movement of labour out of agriculture, and the accelerated formalization of the labour market. A policy framework for promoting inclusive productive employment has three key elements: combating macroeconomic instability without compromising the inclusiveness of growth; raising efficiency through further international integration combined with accelerated domestic reforms; and enhancing technological readiness and nurturing innovation.
The success of transition also requires addressing issues of income distribution, as urban-rural and regional gaps, and gaps
in returns to ideas, skills and capital relative to low-skilled labor are expected to rise. Within available policy and fiscal space, the Government should aggressively invest in strengthening social services and social protection to ensure equality of opportunity in terms of both quantity and quality. Priorities include expanding life-long learning opportunities, while maintaining progress in primary and lower secondary education; promoting early childhood development to build strong foundations for the entire human life cycle; addressing skills shortages and shortfalls in post-secondary education; and fostering a more inclusive and efficient health system. Other key elements entail moving towards universal health insurance, and improved social protection coverage based on a mix of social insurance and social assistance.
The policy framework outlined in this report is integral to an agenda that can bring Viet Nam’s human development to new heights, on par with high-performing countries in the surrounding region, and aligned with the country’s own aspirations.

l VIET NAM HUMAN DEVELOPMENT REPORT 2015148
Health Education Labor Productivity Social Protection Gender Equality Inclusive Growth Missing Middle Technological Readiness Innovation Medium Technology Emerging Lower Middle Class Health Education Labor Productivity Social Protection Gender Equality Inclusive Growth Missing Middle Technological Readiness Innovation Medium Technology Emerging Lower Middle Class Health Education Labor Productivity Social Protection Gender Equality Inclusive Growth Missing Middle Technological Readiness Innovation Medium Technology Emerging Lower Middle Class Health Education Labor Productivity Social Protection Gender Equality Inclusive Growth Missing Middle Technological Readiness Inclusive Growth Medium Technology Emerging Lower Middle Class Health Education Labor Productivity Social Protection Gender Equality Inclusive Growth Missing Middle Technological Readiness Innovation Medium Technology Emerging Lower Middle Class Health Education Labor Productivity Social Protection Gender Equality Inclusive Growth Missing Middle Technological Readiness Innovation Medium Technology Emerging Lower Middle Class Health Education Labor Productivity Social Protection Gender Equality Inclusive Growth Missing Middle Technological Readiness Innovation Medium Technology Emerging Lower Middle Class Health Education Labor Productivity Social Protection Gender Equality Inclusive Growth Missing Middle Technological Readiness Innovation Medium Technology Emerging Lower Emerging Lower Health Education Labor Productivity Social Protection Gender Equality Inclusive Growth Missing Middle Technological Readiness Innovation Medium Technology Emerging Lower Middle Class Health Education Labor Productivity Social Protection Gender Equality Inclusive Growth Missing Middle Technological Readiness Innovation Medium Technology Emerging Lower Middle Class Health Education Labor Productivity Social Protection Gender Equality Inclusive Growth Missing Middle Technological Readiness Innovation Medium Technology Emerging Lower Middle Class Health Education Labor Productivity Social Protection Gender Equality Inclusive Growth Missing Middle Technological Readiness Innovation Medium Technology Emerging Lower Middle Class Health Education Labor Productivity Social Protection Gender Equality
Health Education Labor Productivity Social Protection Gender Equality Inclusive Growth Missing Middle Technological Readiness Innovation Medium Technology Emerging Lower Middle Class Health Education Inclusive Growth Social Protection Gender Labor Productivity Missing Middle Technological Readiness Innovation Medium Technology Emerging Lower Middle Class Health Education Labor Productivity Social Protection Gender Equality Inclusive Growth Missing Middle Productivity Readiness Innovation Medium Technology Social Protection Middle Class Health Education Labor Education Social Protection Gender Equality Health Missing Middle Technological Readiness Inclusive Growth Medium Technology Emerging Lower Middle Class Health Education Labor Productivity Social Protection Gender Equality Inclusiv Gender Equality Missing Middle Technological Readiness Innovation Medium Technology
Health Education Labor Productivity Social Protection Gender Equality Inclusive Growth Missing Middle Technological Readiness Innovation Medium Technology Emerging Low Middle Class Health Education Labor Productivity Social Protection Gender Equality Inclusive Growth Missing Technological Readiness Innovation Medium Technology Emerging Lower Middle Class Health Education Labor Productivity Social Protection Gender Equality
Inclusive Growth Missing Middle Technological Readiness Innovation Medium Technology Emerging Lower Middle Class Health Education Labor Productivity Social Protection Gender Equality Inclusive Growth Missing Middle Technological Readiness Inclusive Growth Medium Gender Equality Middle Class Health Education Health Education Social Protection Gender Equality Inclusive Growth Missing Middle Technological Readiness Innovation Medium Technology Emerging Lower Middle Class Health Education Labor Productivity Social Protection Gender Equality Inclusive Growth Missing Middle Technological Readiness Innovation Medium Technology Emerging Lower Middle Class
Health Education Labor Productivity Social Protection Gender Equality Gender Equality Missing Middle Technological Readiness Innovation Medium Technology Emerging Lower Middle Class Health Education Labor
Productivity Social Inclusive Growth Gender Middle Technological Readiness Innovation Medium Techno Emerging Lower Middle Class Health Education Labor Produ Social Protection Gender Equality Inclusive Growth Missing Middle Technological Readiness Innovation Medium Technology Emerging Lower Middle Class Health Education Labor Productivity Social Protection Gender Equality Inclusive Growth Missing Middle Technological Readiness Inclusive Growth Medium Technology Emerging Lower Middle Class Health Education Labor Productivity Social Protection Gender Equality Inclusive Growth Missing Middle Technological Readiness Innovation Medium Technology Emerging Lower Middle Class Health Education Labor Productivity Social Protection Gender Equality Inclusive Growth Missing Middle
Health Education Labor Productivity Social Protection Gender Equality Inclusive Gr Missing Middle Technological Readiness Innovation Medium Technology Emerging Lower Middle Class Health Education Labor Productivity Social Protection Gender Equality Inclusive Growth Missing Middle Health Technological Innovation Medium Technology Emerging Lower Middle Health Education Labor Productivity
Social Protection Gender Equality Inclusive Growth Missing Middle Technological Readiness Innovation Medium Technology Emerging Lower Middle Class Health Education Labor Productivity Social Protection Gender Equality Inclusive Growth Missing Middle Technological Readiness Inclusive Growth Medium Technology Emerging Lower Middle Class Health Education Labor Productivity Social Protection Gender Equality Inclusive Growth Missing Middle Technological Readiness Innovation Medium Technology Emerging
Notes and references

Notes and references l 149
Health Education Labor Productivity Social Protection Gender Equality Inclusive Growth Missing Middle Technological Readiness Innovation Medium Technology Emerging Lower Middle Class Health Education Labor Productivity Social Protection Gender Equality Inclusive Growth Missing Middle Technological Readiness Innovation Medium Technology Emerging Lower Middle Class Health Education Labor Productivity Social Protection Gender Equality Inclusive Growth Missing Middle Technological Readiness Innovation Medium Technology Emerging Lower Middle Class Health Education Labor Productivity Social Protection Gender Equality Inclusive Growth Missing Middle Technological Readiness Inclusive Growth Medium Technology Emerging Lower Middle Class Health Education Labor Productivity Social Protection Gender Equality Inclusive Growth Missing Middle Technological Readiness Innovation Medium Technology Emerging Lower Middle Class Health Education Labor Productivity Social Protection Gender Equality Inclusive Growth Missing Middle Technological Readiness Innovation Medium Technology Emerging Lower Middle Class Health Education Labor Productivity Social Protection Gender Equality Inclusive Growth Missing Middle Technological Readiness Innovation Medium Technology Emerging Lower Middle Class Health Education Labor Productivity Social Protection Gender Equality Inclusive Growth Missing Middle Technological Readiness Innovation Medium Technology Emerging Lower Emerging Lower Health Education Labor Productivity Social Protection Gender Equality Inclusive Growth Missing Middle Technological Readiness Innovation Medium Technology Emerging Lower Middle Class Health Education Labor Productivity Social Protection Gender Equality Inclusive Growth Missing Middle Technological Readiness Innovation Medium Technology Emerging Lower Middle Class Health Education Labor Productivity Social Protection Gender Equality Inclusive Growth Missing Middle Technological Readiness Innovation Medium Technology Emerging Lower Middle Class Health Education Labor Productivity Social Protection Gender Equality Inclusive Growth Missing Middle Technological Readiness Innovation Medium Technology Emerging Lower Middle Class Health Education Labor Productivity Social Protection Gender Equality
Health Education Labor Productivity Social Protection Gender Equality Inclusive Growth Missing Middle Technological Readiness Innovation Medium Technology Emerging Lower Middle Class Health Education Inclusive Growth Social Protection Gender Labor Productivity Missing Middle Technological Readiness Innovation Medium Technology Emerging Lower Middle Class Health Education Labor Productivity Social Protection Gender Equality Inclusive Growth Missing Middle Productivity Readiness Innovation Medium Technology Social Protection Middle Class Health Education Labor Education Social Protection Gender Equality Health Missing Middle Technological Readiness Inclusive Growth Medium Technology Emerging Lower Middle Class Health Education Labor Productivity Social Protection Gender Equality Inclusiv Gender Equality Missing Middle Technological Readiness Innovation Medium Technology
Health Education Labor Productivity Social Protection Gender Equality Inclusive Growth Missing Middle Technological Readiness Innovation Medium Technology Emerging Low Middle Class Health Education Labor Productivity Social Protection Gender Equality Inclusive Growth Missing Technological Readiness Innovation Medium Technology Emerging Lower Middle Class Health Education Labor Productivity Social Protection Gender Equality
Inclusive Growth Missing Middle Technological Readiness Innovation Medium Technology Emerging Lower Middle Class Health Education Labor Productivity Social Protection Gender Equality Inclusive Growth Missing Middle Technological Readiness Inclusive Growth Medium Gender Equality Middle Class Health Education Health Education Social Protection Gender Equality Inclusive Growth Missing Middle Technological Readiness Innovation Medium Technology Emerging Lower Middle Class Health Education Labor Productivity Social Protection Gender Equality Inclusive Growth Missing Middle Technological Readiness Innovation Medium Technology Emerging Lower Middle Class
Health Education Labor Productivity Social Protection Gender Equality Gender Equality Missing Middle Technological Readiness Innovation Medium Technology Emerging Lower Middle Class Health Education Labor
Productivity Social Inclusive Growth Gender Middle Technological Readiness Innovation Medium Techno Emerging Lower Middle Class Health Education Labor Produ Social Protection Gender Equality Inclusive Growth Missing Middle Technological Readiness Innovation Medium Technology Emerging Lower Middle Class Health Education Labor Productivity Social Protection Gender Equality Inclusive Growth Missing Middle Technological Readiness Inclusive Growth Medium Technology Emerging Lower Middle Class Health Education Labor Productivity Social Protection Gender Equality Inclusive Growth Missing Middle Technological Readiness Innovation Medium Technology Emerging Lower Middle Class Health Education Labor Productivity Social Protection Gender Equality Inclusive Growth Missing Middle
Health Education Labor Productivity Social Protection Gender Equality Inclusive Gr Missing Middle Technological Readiness Innovation Medium Technology Emerging Lower Middle Class Health Education Labor Productivity Social Protection Gender Equality Inclusive Growth Missing Middle Health Technological Innovation Medium Technology Emerging Lower Middle Health Education Labor Productivity
Social Protection Gender Equality Inclusive Growth Missing Middle Technological Readiness Innovation Medium Technology Emerging Lower Middle Class Health Education Labor Productivity Social Protection Gender Equality Inclusive Growth Missing Middle Technological Readiness Inclusive Growth Medium Technology Emerging Lower Middle Class Health Education Labor Productivity Social Protection Gender Equality Inclusive Growth Missing Middle Technological Readiness Innovation Medium Technology Emerging
Notes
1 The population is broken into five groups by level of income: poor, with per capita income per day below US $2; near poor, between US $2-4; lower-middle class, between US $4-10; upper-middle class, between US $10-13; and high income, above US $13 (all in 2005 purchasing power parity or PPP).
2 The population share of the lower-middle class (termed by some studies as the developing world’s middle class) grew rapidly from only 28.4 percent in 2004 to 47.8 percent in 2012. It became the largest population group in 2012, from being the third largest group in 2004.
3 The combined share of the upper-middle and high-income groups, which approximates the ‘global middle class’ (earning between US $10 and US $100, 2005 PPP) stagnated, rising insignificantly from 13.4 percent in 2010 to 13.7 percent in 2012.
Part 11 This report uses data from the global Human
Development Report for comparing Viet Nam’s progress against other countries. The human development indexes use data from the United Nations Statistics Division (various datasets), the UNESCO Institute for Statistics (educational attainment data based on the Barro and Lee methodology) and the World Bank (on economic aggregates) to ensure cross-country consistency. In many cases, global data differ from data used for calculating the national human development indexes, which rely on data provided by Viet Nam’s General Statistics Office.
2 Expected years of schooling: number of years of schooling that a child of school entrance age can expect to receive if prevailing patterns of age-specific enrolment rates persist throughout the child’s life. Mean years of schooling: average number of years of education received by people aged 25 and older, converted from education attainment levels using official durations of each level.
3 Note that there is a slight difference between global values and nationally calculated values in the GII. The national GII amounted to 0.348 in 2012. See Annex 1 for details.
4 Calculating income per province (‘provincial GDP’) is complicated. Some economic activities are difficult to attribute to a province or to divide,
leading to several ‘outliers’ such as Vung Tau Ba Ria and Hoa Binh. The data therefore need to be read with caution and analysed drawing also on other data sources.
5 The Government’s poverty lines for 2011 to 2015 have been updated for inflation and are VND 530,000 per capita per month for rural areas and VND 660,000 per capita per month for urban areas.
6 This is in line with the finding in the global 2010 Human Development Report (UNDP, 2010a, page 98).
Part 21 In Figure 2.1, the sub-index on income distribution
has a negative or positive sign if income distribution worsens or improves, respectively.
2 Academic researchers have emphasized the middle clase as a source of entrepreneurship (Acemoglu and Zilibotti, 1997), human capital and saving (Doepke and Ziliboti, 2007), democracy (Banerjee and Duflo, 2007) and spending (Nomura, 2009 and Kharas, 2010)
3 Either income-based or consumption-based measurements can be used to classify economic classes. Each has advantages and disadvantages, and the differences between the two are modest at lower levels of income and consumption (Kapsos and Bourmpoula, 2013). In numerous studies that analyse the size and dynamics of the middle class at the global level, income-based and consumption-based classifications of economic classes are used interchangeably, as each is applied in different sets of countries. The choice of income for the calculation in this report was made to better match with the GNI income measure used in the calculation and analysis of the HDI in Chapter 1.2.
4 The first three thresholds (poor at <US $2, near poor at US $2-4, and lower-middle class at US $4-10, all in 2005 PPP) are used in a number of studies such as Chun (2010) and African Development Bank (2011). The former also terms the range of US $4-10 as “the developing world’s middle class.” These studies, however, set a higher bar of US $20 for the upper-middle class. The upper bound of US $13 for the middle class is used in (Ravalion, 2009) and (Kapsos and Bourmpoula, 2013). The latter also uses US $4 as the lower bound, and US $2-4 as the income range for the near poor group.
l VIET NAM HUMAN DEVELOPMENT REPORT 2015150
5 (Kharas, 2010) uses the range US $10-100 (2005 PPP) to define the so called ‘global middle class’. In Viet Nam, the share of people earning more than US $100 (2005 PPP) per day was negligible, being 0.12 percent and 0.07 percent in 2010 and 2012, respectively. Therefore, the combined group of upper-middle and high-income people can be considered an equivalent of the global middle class.
6 The US $10 threshold is increasingly accepted as the point where an individual is on a firm enough footing to not worry about mere subsistence or falling back into extreme poverty.
7 According to a new Pew Research Center analysis of the most recently available data, just 13 percent of people in the world are above the US $10 threshold and therefore could be considered part of the global middle class. Consequently, “…the emergence of a truly global middle class is still more promise than reality.” (Kochnar, 2015).
8 By the application of more sophisticated econometric methods to the panel component of the 2010-2012 household survey in examining these determinants, keeping all other things equal (Vu Hoang Dat, 2015).
9 Based on the data from the World Bank’s World Development Indicators.
10 Evidence of the rise of Asia in general and China in particular is their rapidly rising shares of the global middle class, an important driver of global growth. (Kharas, 2011) predicts that the share of the former will rise to 54 percent in 2020 and 66 percent in 2030 from only 28 percent in 2009, while that for the latter will reach 13 percent in 2020 and 18 percent in 2030 from a modest 4 percent in 2009.
11 As reported by the World Economic Forum’s Global Competitiveness Report 2014-2015, in terms of its 12 pillars, Viet Nam received its lowest rankings in these areas. In the 2014-2015 report, overall, Viet Nam ranks 68th out of 144 countries, but scores on indicators related to technological readiness are much lower (firm-level technology absorption, 121; FDI and technology transfer, 93; value chain breadth, 112; production process sophistication, 116; quality of scientific research institutions, 96; higher education and training, 96).
12 Viet Nam has enjoyed a favourable labour participation rate, which has been stable at around 77-78 percent over the last 20 years, according to the World Bank’s World Development Indicators.
13 A population projection (based on 2014 Inter-censal Population Survey, GSO, forthcoming) suggests that the share of the working-age population in Viet Nam will start declining from 2032.
14 World Development Indicators, as measured by GDP in US$ 2005 PPP per worker.
15 Specifically, if in 1994 labour productivity in Brunei, Singapore, Malaysia, Thailand, Indonesia and the Philippines was, respectively, 47.5, 22.5, 8.9, 4.2, 3.4 and 2.8 times that of Viet Nam, these relative gaps in 2012 declined to 18.5, 16, 6.2, 2.8, 2.3 and 1.8 times that of Viet Nam, respectively.
16 According to Nguyen Thang et al. 2014, one can decompose change in labour productivity into three parts: (i) the structural change (or reallocation) effect that measures the contribution of structural change as measured by changing employment shares of three broad sectors—agriculture, industry and services, to overall productivity growth; (ii) the within sector effect that measures the contribution of each sector’s productivity growth to overall productivity growth; and (iii) the interactive effect that measures the contribution of the interaction of within-sector and shift effects to overall productivity growth.
17 The interactive effect (also called the residual term of the decomposition) was negative, but small at only -2 percent.
18 Despite concerns about gender wage gaps, the World Economic Forum (2015) ranks Viet Nam highest on this indicator among 37 lower-middle-income countries.
19 McCaig and Pavnic (2013) provides a list of factors.
20 As shown by household survey data in the VHLSS.
21 As shown by data of the labour force survey.
22 Unlike internal economies of scale, which require large firm size and therefore tend to result in monopolies, external economies are generated through firms, not necessarily of large size, being located next to one another within a production network.
23 The Rapid Impact Monitoring Survey of global crisis found that only a few key personnel of registered enterprises in craft villages are registered with the social security system, although these enterprises are intensively engaged in export activities and employ relatively large number of workers (CAF 2009).
24 Such analysis evaluates how each factor affects labour productivity, keeping others unchanged, and avoiding a common analytical problem of comparing apples with oranges.
25 Labour productivity can be broken into two components: (i) capital intensity, i.e., capital per worker, with capital defined in broad terms to include land, physical and human capital; and

Notes and references l 151
(ii) total factor productivity, a measure of how capital is used efficiently, which in turn depends on technology used and the organization of business (as these influence the efficiency of how different kinds of capital are combined).
26 Sixteen countries covered in the Asian Development Bank study cited above are Bangladesh, Bhutan, China, Indonesia, India, Japan, Lao People’s Democratic Republic, Malaysia, Mongolia, Nepal, Pakistan, Philippines, the Republic of Korea, Sri Lanka, Thailand and Viet Nam
27 Productivity within sub-sectors and on farms is measured by value added per agricultural worker. This entails three components: value added price, or output price net of input prices; land productivity or yield in the case of crops, which is measured by output in physical unit per unit of land use; and land per agricultural worker. This decomposition establishes that productivity is linked to developments of the domestic and particularly global markets. It is also driven by the rate of rural population growth and the pace of structural transformation of the economy and the labour market, particularly the movement of workers out of agriculture.
28 Because of stagnation of agriculture in the two decades of 1970s and 1980s, the change in cereal yields between 1970 and 2010 can be used to assess the impacts of Doi Moi reforms, which were initiated in the second half of 1980s.
29 WHO (2014), Comparison of basic health indicators across countries,.
30 The mean years of schooling indicator used in this figure is for people aged 15 and above, while the indicator used in Chapter 1.2 and the global Human Development Report is for people aged 25 and above.
31 In the report, Viet Nam ranked 118th out of 144 countries in availability of research and training services and 119th in quality of management of schools.
32 Qualitative research conducted by Young Lives Vietnam documented that mathematics learned in school helps a number of respondents in their employment in FDI firms (Young Lives 2014).
33 “Observations on Undergraduate Education in Computer Science, Electrical Engineering, and Physics at Select Universities in Vietnam” 2006, study of the current state of undergraduate education in physics and engineering conducted by the National Academies for the Viet Nam Education Foundation.
34 Before 2015, with the exception of children under six and some other groups, co-payments were required. Co-payments were 5 percent for
individuals receiving social assistance and in the poor household category and 20 percent for all other groups, when receiving treatment at the health facility at which they are registered.
35 Ministry of Education and Training, Plan on Education Financing Mechanism Reform 2009-2014.
36 Viet Nam devotes around 12 percent of its education budget to higher education, while globally, spending on higher education often accounts for one quarter to one-third of total expenditure.
37 It is little known that schools are subjected to full financial audits.
38 See, for example, Dan Tri 2014.
39 Including direct budget subsidies to care providers, social health insurance and health-related official development assistance. It is difficult to ascertain exact public spending. Some estimates include both capital and recurrent expenditures, but others only recurrent spending. According to WHO, public spending on health amounted to 2.8 percent of GDP in 2012 (WHO, 2014). For 2013, the Ministry of Health put the same figure at 1.7 percent, but this does not include capital expenditures for infrastructure within poverty reduction programmes. Atypically, the Vietnamese accounting practice counts fee payments made to state facilities as government spending.
40 Decrees also encourage service delivery units to adopt a ‘business model of management’.
41 Out-of-pocket payments refer to those made by households where they receive health services. Typically these include doctor’s consultation fees, purchases of medication and hospital bills.
42 Private health care providers reportedly provide 60 percent of all outpatient contacts in Viet Nam [5] and provide care for 60 percent of all illnesses [6]. The number of private hospital beds, however, is still limited, accounting for less than 5 percent of the total number of hospital beds in the country (Nguyen X. Thanh et al. 2014).
43 For example, in a hospital in 2010, 90.4% of inpatients were prescribed the intravenous protein therapy and many were prescribed supplements, such as glutathione and arginine [11]. In another hospital in 2009, many normal delivery women were prescribed Klamentin (an antibiotic drug) for 16 consecutive days (ibid). Lack of effective control and regulatory mechanisms for medicine use and the low compliance with prescription regulation were identified among the reasons for irrational medicine use in Viet Nam (Mao et al. 2015).
l VIET NAM HUMAN DEVELOPMENT REPORT 2015152
44. Overall, public spending in Viet Nam, at levels roughly equivalent to 30 percent of GDP, are substantially higher than in most developing countries.
45 This chapter draws heavily on Kidd and Abu-el-Haj (forthcoming).
46 MOLISA 2015; ILLSA 2014 and ILSSA estimations provided for preparing MPSAR.
47 According to UNDESA (2002), the ageing index is calculated as the number of persons aged 60 or over per 100 persons under age 15. When this index is greater than 100, the elderly population is greater than the child population.
48 GSO 2010 and GSO Population and Housing censuses 1979, 1989, 1999 and 2009.
49 Some caution needs to be taken in interpreting these results since the MICS study used an asset index to measure wealth, rather than consumption. If consumption is used, the results may be different.
50 The VHLSS 2006 included a special module on disability that does not exist in any other VHLSS data sets. Though the data go back to 2006, as there have been no reasons for rapid changes in disability patterns since then, analyses of 2006 data can, to a significant extent, still be applied. Disability in the 2006 VHLSS has been defined as having a little difficulty in at least two of the six functional domains, or a lot of difficulty or unable to do at least one of the domains; severe disability has been defined as having considerable difficulty (a lot of difficulty and unable to do in at least one of the six functional domains).
51 Urban areas—excluding Ha Noi and Ho Chi Minh City—have the highest proportion of people over age 80 receiving the scheme, at 88.3 percent, while rural areas have 78.3 percent. Ha Noi and Ho Chi Minh City have only 63 percent (IL0 and UNFPA 2014)
52 In addition to the beneficiaries of the VSS and social pensions, there are around 41,500 elderly persons (above 60 years of age) without support who are cared for by a ‘willing person’ in a poor household, but who otherwise would be eligible to live in a Social Protection Centre and receive cash monthly transfer of VND 450,000 (MOLISA 2015). There may also be some errors in the selection of the social pension programme, with those below the age of eligibility accessing the scheme. So coverage of people over 80 may in reality be less. In fact, the Viet Nam National Ageing Survey (VNAS) of 2011 dataset suggests lower coverage of 64 percent, while the VHLSS 2012 indicates even lower coverage of around 45 percent.
53 Compared to MOLISA/SPD (Draft MPSAR). If using the World Bank estimate of 15 percent of the population with disabilities, the number of such
persons in all categories could be around 13-14 million in 2014.
54 Except for the electricity cash subsidy which could be regarded as a household-based poor relief scheme and some schemes that address life cycle contingency, but use a means test to target the beneficiaries (poverty targeting).
55 Including the target groups defined in Decree 136.
56 Somanathan et al. 2014: Economic deciles are based on household consumption per capita. The poor and near poor are defined as the bottom three economic deciles of the population.
57 The social pension for people aged 80 and above who have no formal pension and the Merits Programme target specific beneficiary categories across all income groups, including those in the middle. In addition, as discussed above, health insurance has high coverage and adopts different targeting approaches, including to reach some categories of beneficiaries across all income groups. Even so, the relatively small number of beneficiaries and low levels of benefit (except in the Merits Programme) suggest that a significant ‘missing middle’ in practice.
58 According to the draft MPSAR, the method for defining the base value of regular social assistance has been evolving: from rice-based (10-13 kilogrammes of rice per month in 1966, or in 1985, 15 kilogrammes a month equivalent to a third of the minimum wage) to cash-based (converting the rice-based level to equivalent cash since 1994) taking into the account price changes. The cash value of social assistance has increased six times, from VND 24,000 per month (equivalent to 12 kilogrammes of rice) in 1994, to VND 45,000 per month in 2000, to VND 65,000 per month in 2004, to VND 120,000 per month in 2007, to VND 180,000 per month in 2010 (equvalent to 13-15 kilogrammes of rice per month), to VND 270,000 per month in 2015 (equivalent to 15-20 kilogrammes of rice per month).
59 Minimum living standard is calculated as the amount of per capita monthly expenditure to meet the minimum needs of a person for food (2,100 kilocalories) and other essential non-food items. MOLISA and GSO (draft proposal for the new minimum living standard and poverty lines) are proposing for adoption in the 2016-2010 planning cycle two options for the minimum living standard. The first option is VND 1 million for rural and VND 1.3 million for urban areas. The second option is VND 1.3 million and VND 1.6 million, respectively. Both options are calculated based on the 2012 consumption basket, and 2012 prices with inflation adjustments. The only difference is the minimum food intake to meet 2,100 kilocalories and 2,230 kilocalories per person per day.
Notes and references l 153
60 In contrast, as noted, the value of Merits Programme payments compares favourably with the social pensions of most developing countries, and is on a par with the social pensions in Brazil and South Africa.
61 Disability Benefit Schemes database
62 (Kidd and Abu-el-Haj forthcoming): the values of many of the European child benefits are for the first child only. For subsequent children, it is common for the value of the benefits to increase, per child.
63 Financial data used in this section are from (i) MOLISA 2015; (ii) ILSSA background data (which were drawn from data of the above mentioned MOLISA 2015, MOET reports on education support, VSS on social, unemployment and health insurances and MOF data, with ILSSA’s disaggregation/classification and estimations for data at SP policy/scheme and annual levels) provided for preparation of MPSAR and (iii) the NHDR team calculation/estimation and classification applying the working definition of social protection programmes (as described in the Box 2.16) while focusing on the major programs/schemes with relatively larger coverage and expenditures (accepting some ‘omission’ of smaller programs). More detailed information on Social Protection Financial data can be found in the annex 7.
64 The expenditure here does not cover: (i) additional expenditures by local governments (as the result of ‘changing’ eligibility criteria and benefit levels, as discussed above) on social assistance/cash transfers; (ii) state transfers (of around 1 percent of GDP) to VSS as contributions to employees’ social insurance, (iii) state budget transfer to VSS health insurance as its contributions to its employees’ health insurance, (iv) state budget financed subsidies for health insurance for meritorious people; and (v) state spending (as well as official development assistance and ‘mobilized’ resources) on projects/programmes that indirectly support poverty reduction.
65 According to Viet Nam’s definition, including: social assistance (regular cash transfers under Decrees 67, 13 and 136); emergency relief; social care; education (fee exemption, stipends, boarding school support, lunches); electricity support for poor households; social insurance and unemployment insurance (pre-1995 pensions and unemployment insurance subsidy); health insurance subsidy; labour market (Vocational education/ training and labour export, employment programme); poverty reduction programmes (National Targeted Progarmme for Sustainable Poverty Reduction, 135P and 30A: infrastructure, production support and other components) and poverty reduction policies (except education and health).
66 VSS anticipates a reduction in these outlays as these pensioners pass away over the next 10-15 years (Khondaker 2015).
67 Pritchett (2005) explains that there is no such thing as a ‘fixed budget’. If a policy is politically popular, governments are prepared to increase budgets—and the value of transfers—since they will be rewarded politically. Governments are more likely to respond to the demands of citizens who are more powerful politically. This can be seen also in Viet Nam: Despite the financial forecast and budgeting methods that seemingly follow an approach of incremental proxies around different ‘target’ figures of different government expenditure categories, there is increased financing of social insurance pensions, the health insurance subsidy and education support as well as local governments (in some ‘self-financed’ provinces/cities) spending additional budgets (from locally raised revenues) by increasing the value of transfers and easing the eligibility requirements in some central social assistance schemes.
68 Including: regular social transfer schemes (social pension, disability benefits and other cash transfers to the most disadvantaged persons such as single elderly people and orphans, 0.19 percent of GDP), education support (fee exemption, school stipends/lunch allowance and boarding school stipends, etc. that are paid monthly during the nine months of the school year to the poorest and ethnic minority students, around 0.23 percent of GDP), monthly electricity support to the poor (using less than 50KWh per month, 0.02 percent of GDP), emergency assistance (0.16% percent) and social care (0.04 percent).
69 Merits Programme payments (1.07 percent of GDP in 2013) targeting the meritorious elderly, children of meritorious people and meritorius people with disabilities (thuong benh binh) can be classified as among core social transfers. If the Merits Programme is included, the level of Viet Nam’s expenditure on core social transfer schemes was around 1.71 percent of GDP in 2013.
70 Pension Watch Social Pension Database at: http://www.pension-watch.net/about-social-pensions/a b o u t- s o c i a l - p e n s i o n s / s o c i a l - p e n s i o n s -database/
71 According to the recently passed 2014 Social Insurance Law, the formula for calculating pension benefits will only ‘match’ the contributions for the Government and employees of state-owned enterprises (the majority of VSS participants) in 2025. The retirement age remains at 60 for men and 55 for women, despite population ageing.
72 Many of these expenditures involve regular—nine months of a school year and predictable

l VIET NAM HUMAN DEVELOPMENT REPORT 2015154
cash transfers, and therefore by internationally acceptable definition, such spending can be classified as social assistance expenditure.
73 UNDP 2009b reveals that there were more than 40 such policies and more than 160 documents guiding their implementation.
74 Information used in this section is drawn from the findings of Khondaker 2015 and ILSSA 2015.
Part 31 Four transitions, as highlighted earlier, include:
within agriculture—from lower to higher productivity and income; agriculture to non-farm informal employment; non-farm informal to formal employment; and within formal employment, from lower to higher productivity and income.
2 A common list of measures as suggested in VASS 2015 and other studies.
3 As summarized in VASS 2015.
4 As summarized in VASS 2015.
5 As summarized in VASS 2015.
6 As summarized in VASS 2015.
7 The World Bank 2014 (based on some evidence from World Bank-supported projects) suggests that affordability is the main reason why enrolment rates are low among the near poor group. Under the World Bank’s Central North Region Health Support Project, the subsidy for the near poor was increased to 80-90 percent and coverage has risen to 74 percent. Under the World Bank’s Mekong Region Health Project, the subsidy for the near poor was increased to 70 percent. In project areas, coverage rose to 50 percent. By contrast, the government subsidy for the near poor was 50 percent (until 2012), and the national average coverage rate is 17 percent.
8 The range of additional expenditures is constructed on two different scenarios based primarily on the extent of contributions and government premium subsidization: (i) contributions of 4.5 percent; minimum wage of VND 1,500,000 (increasing by 30 percent per year thereafter); (ii) premium subsidy for near poor: 70 percent, students: 50 percent, farmers: 30 percent; and (ii) contributions of 5 percent; minimum wage of VND 1,500,000 (increasing by 30 percent per year thereafter); premium subsidy for near poor: 70 percent; students: 50 percent; farmers: 30 percent in 2012. The additional spending will raise health care’s share of aggregate government expenditure by an additional 3.8-4.3 percentage points and 4.7-
8 percentage points accordingly, up from 6.3 percent in 2010.
9 According to the recently passed 2014 Social Insurance Law, the formula for calculating pension benefits will only ‘match’ the contributions for the Government and employees of state-owned enterprises (the majority of VSS participants) in 2025, and the retirement age remains at 60 for men and 55 for women, despite population ageing.
10 Costing Implication and Financing Options, Forthcoming report prepared by Bazlul Khondaker to support MPSAR formulation.
11 The same actions are recommended for unemployment insurance, which by design also targets formal sector workers. Coverage depends on state subsidy and enforcement capacity.
12 Based on the actual progress of the infrastructure components of the National Targeted Programmes.
13 One percent of GDP still means less than the investment level of many middle-income countries in social pension schemes alone, and is similar to that of a poor country such as Nepal.
14 See Khondaker (2015); Vietnam Master Plan for Social Assistance Reform (MPSAR) Costing Implication and Financing Options. This employs a standard social accounting matrix based on input/output tables that depict the relationships and elasticities of variables within the economy to predict outcome based on the GSO data.
15 If education support schemes (with the total expenditure of 0.23 percent of GDP in 2013) will be converted into/merged with the proposed schemes of social assistance transfers, the additional investment is only around 0.34 percent of GDP.
16 The ILO and UNFPA have provided different costs for the expansion of social pensions, based on different assumptions and data sources. The assumptions here use population data from the UN’s World Population database and economic data from the IMF’s World Economic Indicators database.
17 According to VHLSS 2006, 2.4 percent of the working age population has a severe disability.
18 Since the proportion of children with a disability is unknown, it is estimated using the Child Dependency Benefit in South Africa as a guide. It provides a disability benefit to 0.6 percent of children aged 0-17 years. The scheme is affluence tested, however, so it is likely that a universal child disability benefit would reach around 0.86 percent of children.
Notes and references l 155
Alesina, D. Rodrik. 1994. Distributive politics and economic growth. Quarterly Journal of Economics
Acemoglu, D., & Zilibotti, F. 1997. Was Prometheus unbound by chance? Risk, diversification, and growth. Journal of Political Economy.
ADB (Asian Development Bank). 2011. The Middle of the Pyramids: Dynamics of the Middle Class in Africa.
ADB (Asian Development Bank). 2012a. Asian Development Outlook 2012 Confronting Rising Inequality in Asia.
ADB (Asian Development Bank). 2012b. Framework of Inclusive Growth Indicators 2012, Key Indicators for Asia and the Pacific: Special Supplement.
ADB (Asian Development Bank). 2014. Technical and Vocational Education and Training in the Socialist Republic of Viet Nam – An Assessment.
Anwar, S., & Nguyen, L. P. 2014. Is foreign direct investment productive? A case study of the regions of Vietnam. Journal of Business Research, 67(7. 1376-1387.
Auriol, E., & Warlters, M. 2005. Taxation base in developing countries. Journal of Public Economics, 89(4). 625-646.
available at http://ash.harvard.edu/extension / ash/docs/Apex.pdf
Azuma, Y. and Grossman, H.I., 2002. A theory of the informal sector. No. w8823. National Bureau of Economic Research.
Azuma, Y., & Grossman, H. I. 2002. A Theory of the Informal Sector. No. w 8823. National Bureau of Economic Research.
Bach X. Tran; Arianna Waye; Christa Harstall; Lars Lindholm. 2014. “Socialization of Health Care” in Vietnam: What Is It and What Are Its Pros and Cons?”, Value Health regional issues, May 2014, Volume 3, Pages 24–26.
Banerjee, A. V., & Duflo, E. 2007. The economic lives of the poor. The journal of economic perspectives: a journal of the American Economic Association, 21(1. 141.
Berg, A. G., & Osrty, J. D. 2013. Inequality and unsustainable growth: Two sides of the same coin?. International Organisations Research Journal, 8(4. 77-99.
Birdsall, N. 2006. Rising inequality in the new global economy. International journal of development issues, 5(1. 1-9.
Birdsall, N. 2010. The (indispensable) middle class in developing countries; or, the rich and the rest, not the poor and the rest. EQUITY IN A GLOBALIZING WORLD, Ravi Kanbur and Michael Spence, eds., World Bank.
Bodewig, C., Badiani-Magnusson, R., & Macdonald, K. 2014. ‘Skilling Up in Vietnam: Preparing the Workforce for a Modern Market Economy’. World Bank Publications.
Botero, J., Djankov, S. La Porta, R., Lopez-de-Silanes, F. & Shleifer, A. 2004. The Regulation of Labor, Quarterly Journal of Economics 119, no. 4: 1339–82.
Bray, M., & Lykins, C. 2012. Shadow Education Private Supplementary Tutoring and Its Implications for Policy Makers in Asia.
Briones and Felipe. 2013. Agriculture and Structural Transformation in Developing Asia: Review and Outlook. ADB Economics Working Papers Series. No. 363, August 2013.
References

l VIET NAM HUMAN DEVELOPMENT REPORT 2015156
CAF (Centre for Analysis and Forecasting). 2009. Rapid Impact Monitoring of Global Economic Crisis. Report prepared for UNDP and UNICEF Vietnam. Ha Noi
CAF (Centre for Analysis and Forecasting). 2010. “Rapid Impact Assessment (RIM) 2010”, Report commissioned by UNDP and MOLISA, Ha Noi
CAF (Centre for Analysis and Forecasting). 2014. Small-Scale Survey on People’s Perceptions of Inclusive Growth. Background Paper prepared for the 2014 Vietnam’s National Human Development Report.
Cameron, Stuart. 2012. “Education, Urban Poverty, and Migration: Evidence from Bangladesh and Vietnam” UNICEF Office of Research Working Paper 2012-15.
Castel et al. 2014. Background study on social protection for NHDR 2015. Unpublished.
CECODES, VFF and UNDP. 2014. Viet Nam Provincial Governance and Public Administration Performance Index (PAPI) 2014.
Cervantes-Godoy, D., & Dewbre, J. 2010. Economic importance of agriculture for poverty reduction.
Chirot, L., & Wilkinson, B. 2010. The intangibles of excellence: governance and the quest to build a Vietnamese apex research university. New School, Harvard Kennedy school/Fulbright Economics Teaching Program in Ho Chi Minh city. Paper commissioned by UNDP.
Chiu, W. H., & Madden, P. 1998. Burglary and income inequality. Journal of Public Economics, 69(1). 123-141.
Chun 2010. Middle Class in the Past, Present and Future: A Description of Trends in Asia. ADB Economics Working Papers Series No. 217.
CIEM (Central Institute for Economic Management). 2014. Strengthening Institutional Reform Towards the Market Economy, 2015-2016 Period. Report
prepared for the Vietnam Development Forum. VDF. Hanoi,
Cling, J. P., Nguyen, T. T. H., Nguyen, H. C., Phan, T. N. T., Razafindrakoto, M., & Roubaud, F. 2010. The informal sector in Vietnam: a focus on Hanoi and Ho Chi Minh City. Hanoi: The Gioi Editions.
Coady David, Margaret Grosh, John Hoddinott. 2004. Targeting of Transfers in Developing Countries: Review of Lessons and Experience. The World bank and IFPRI, Washington. 2004.
Corak, M. 2013.‘Income Inequality, Equality of Opportunity, and Intergenerational Mobility’, Journal of Economic Perspectives, Volume 27, Number 3,79-102.
Coughlan, S., 2015. Asia tops biggest global school ranking. BBC. 13 May 2015 http://www.bbc.com/news/business-32608772. Last accessed 1 July 2015.
Cunningham, W,. and Maloney, W. 2001. Heterogeneity among Mexico’s Microenterprises: an application of factor and cluster analysis, Economic Development and Culture Change 50 no. 1: 131-56.
Dabla-Norris, Era; Mark Gradstein; and Gabriela Inchauste 2005. What Causes Firms to Hide Outputs? The Determinants of Informality, IMF Working Paper 05/160, International Moneraty Fund.
Dan Tri. 2014. “Sao nhiều khoản thu hộ thế? Bộ Giáo dục cần vào cuộc ngay”. “Why so many revenue streams? The Ministry of Education needs to get involved”, 10 January 2014. http://dantri.com.vn/giao-duc-khuyen-hoc/sao-nhieu-khoan-thu-ho-the-bo-giao-duc-can-vao-cuoc-ngay-1412650549.htm
Dang, H. A. 2011. A bird’s-eye view of the private tutoring phenomenon in Vietnam. IIAS Newsletter, 56, 26-27.
Dang, H. A. 2013. ‘Private Tutoring in Vietnam: A Review of Current Issues and Its Major Correlates’, World Bank

Notes and references l 157
David A. King 2004. ‘The Scientific Impact of Nations’ Nature, 430 no. 6997, July 2004, 311-316.
Deaton, A. 2013. ‘Weak States, Poor Countries’, commentary http://www.project-syndicate.org/commentary/economic-development-requires-effective-governments-by-angus-deaton. Last accessed 1 July 2015
Development Pathways. Disability Benefit Schemes database. http://www.developmentpathways.co.uk/resources/disability-benefits-scheme-database. Last accessed 1 July 2015
Director, S. W., Doughty, P., Gray, P. J., Hopcroft, J. E., & Silvera, I. F. 2006. ‘Observations on undergraduate education in computer science, electrical engineering, and physics at select universities in Vietnam’. Washington DC
Doepke, M., & Zilibotti, F. 2007. Occupational choice and the spirit of capitalism. No. w12917. National Bureau of Economic Research.
DSD, SASSA and UNICEF. 2012. The South African Child Support Grant Impact Assessment: Evidence from a survey of children, adolescents and their households. Pretoria: UNICEF, South Africa.
Dutta, I., Madden, P., & Mishra, A. 2014. Group Inequality and Conflict. The Manchester School, 82(3). 257-283.
Friedman, E., Johnson, S., Kaufman, D. and Zoido-Lobatón, P. 2000, Dodging the Grabbing Hand: The Determinants of Unofficial Activity in 69 Countries, Journal of Public Economics 76, no. 3: 459–92.
Friedman, T.L., 2000. The Lexus and the olive tree: Understanding globalization. Macmillan.
Giang, Thanh Long. 2010. ‘Toward an ageing population: mapping the reform process in the public service delivery of social protection services in Viet Nam’, background
paper, Viet Nam 2011 National Human Development Report. Ha Noi, UNDP-VASS.
Giles, D., and Tedds, L. 2002, Taxes and the Canadian Underground Economy, Canadian Tax Paper No. 106. Toronto: Canadian Tax Foundation.
Gill, I. S., Kharas, H. J. 2007. An East Asian renaissance: ideas for economic growth. World Bank Publications.
Government of Viet Nam. 2015. Resolution 14/2005/NQ-CP (2 November 2005) on the fundamental and comprehensive reform of Vietnamese university education during 2006-2010 (Nghị quyết về đổi mới cơ bản và toàn diện giáo dục đại học Việt Nam giai đoạn 2006-2010).
Government of Viet Nam. 2015. Viet Nam 2015 MDG Report, Ha Noi, 2015.
Government of Viet Nam. 2015. GOVN Report on implementation of Five Year 2011-2015 Socio-economic Development Plan to National Assembly. Ha Noi, October 2015.
GSO (General Statistics Office). 2015. Statistical Data (on HDI, GDI, MPI) for 2015 NHDR.
GSO (General Statistics Office). 2010. “Population projections for Viet Nam, 2009-2049”, monograph, Ha Noi, Viet Nam.GSO Population and Housing censuses 1979, 1989, 1999 and 2009
GSO (General Statistics Office). Various years, Viet Nam Living Standard Surveys (2002, 2004, 2006, 2008, 2010, 2012), Ha Noi, Viet Nam.
Haan, A. and Thorat, S. 2013. ‘Inclusive Growth: More than Safety Nets’, IDRC/SIG Working Paper 2013/1 p.2
Hausmann, R., Pritchett, L., & Rodrik, D. 2005. Growth accelerations. Journal of Economic Growth, 10(4. 303-329.
Health Strategy and Policy Institute. 2008. Assessment of hospital overload at some
l VIET NAM HUMAN DEVELOPMENT REPORT 2015158
hospitals in Hanoi and Ho Chi Minh cities and recommended solutions. Ministry of Health, Hanoi.
Help Age International (2014). Pension coverage in China and the expansion of the New Rural Social Pension, Pensions Watch Briefing No.11.
Help Age International. Pensions Watch Social Pension Database. http://www.pension-watch.net/about-social-pensions/about-social-pensions/social-pensions-database. Last accessed 1 July 2015.
Hoddinott, J., Maluccio, J. A., Behrman, J. R., Flores, R., & Martorell, R. 2008. Effect of a nutrition intervention during early childhood on economic productivity in Guatemalan adults. The Lancet, 371(9610). 411-416.
Holzmann R. et al. 2005. Old-age Income Support in the 21st Century: An International Perspective on Pension Systems and Reform. World Bank. 2005.
International Development Research Centre (IDRC). 2013. Arjan de Haan, International Development Research Centre, Ottawa Sukhadeo Thorat, Jawaharlal Nehru University, New Delhi. Inclusive Growth: More than Safety Nets.
ILO/UNFPA 2014. Income security for older people in Viet Nam: Social pensions. Policy Brief. Hanoi
ILSSA (Institute of Labour Science and Social Affairs). 2014. Social Insurance. Policy brief n. 2. December 2014.
ILSSA, 2015, ILSSA reports of field studies for MPSAR. Ha Noi.
Inchauste, M.G., Gradstein, M.M. and Dabla-Norris, M.E., 2005. What Causes Firms to Hide Output? the Determinants of Informality (No. 5-160). International Monetary Fund (IMF).
IPSARD (Institute of Policy and Strategy for Agriculture and Rural Development).
2015. ‘Agriculture and the rural economy: Challenges and opportunities for inclusive growth’, background paper for Viet Nam 2014 National Human Development Report, Ha Noi, UNDP/VASS.
IRC, CAF, IPPM and CDES (unpublished) ‘Parental Spending for Education in Vietnam’, funded by Belgium Development Agency (BTC).
Issacs, J. B. 2008. Economic mobility of families across generations. The Brookings Institution. http : / /w w w.brook ings.edu/research/papers/2007/11/generations-isaacs. Accessed 2 August 2014.
Jenkins, H. 2006. Convergence culture: Where old and new media collide. NYU press.
Johnson, S., Kaufmann, D., and Shleifer, A. 1997. The unofficial economy in transition. Brookings papers on economic activity, pp.159-239.
Johnson, S., Kaufmann, D., Shleifer, A., Goldman, M. I., & Weitzman, M. L. 1997. The unofficial economy in transition. Brookings papers on economic activity, 159-239.
Jourdain, D., Boere, E., van den Berg, M., Dang, Q. D., Cu, T. P., Affholder, F., & Pandey, S. 2014. Water for forests to restore environmental services and alleviate poverty in Vietnam: A farm modeling approach to analyze alternative PES programs. Land Use Policy, 41, 423-437.
Kanbur, R. 2009. Conceptualising informality: regulation and enforcement. Indian Journal of Labour Economics 52 (1):33-42
Kapsos, S., & Bourmpoula, E. 2013. Employment and economic class in the developing world. ILO.
Karoly, L.A., S.S. Everingham, J. Hoube, R. Kilburn,C.P. Rydell, M. Sanders, and P.W. Greenwood. 1997. ‘Benefits and Costs of Early-Childhood Interventions: A Documented Briefing.’ RAND Corporation, Santa Monica, CA.
Notes and references l 159
Kazemzadeh, R. B., Sepehri, M. M., & Jahantigh, F. F. (2012, February. Design and analysis of a health care supply chain management. Advanced Materials Research (Vol. 433, pp. 2128-2134.
Khan, Mushtaq. 2015. ‘The Role of Industrial Policy: Lessons from Asia.’ In: Bailey, David and Cowling, Keith and Tomlinson, Philip R., (eds.. New Perspectives on Industrial Policy for a Modern Britain. Oxford: Oxford University Press, pp. 79-98.
Kharas, H. 2010. The emerging middle class in developing countries.
Kharas, H., & Kohli, H. 2011. What is the middle income trap, why do countries fall into it, and how can it be avoided?.Global Journal of Emerging Market Economies, 3(3. 281-289.
Khondaker. 2015. Vietnam Master Plan for Social Assistance Reform (MPSAR) Costing Implication and Financing Options.
Khuong V., M. 2014. ‘Boosting Labor Productivity as a Strategic Approach to Deepening Economic Reforms’. P. 80.
Kidd et al. 2015. Social Assistance in Viet Nam: a review and proposals for reform. Technical report commissioned by UNDP and MOLISA under the Support Social Assistance Reform project. Ha Noi.
Kidd, S. 2015. The Political Economy of “Targeting” of Social Security Schemes. Development Pathway Oct. l/2015.
Kidd, S., Barrett. 2015. “The design and management of cash transfer programmes: an overview”, Materials on Development Financing, No. 3, March 2015. KfW Development Bank.
Kidd, S., Abu-el-Haj, T. A. Forthcoming. ‘Overview of poverty, insecurity and social transfers in Viet Nam’, Report commissioned by UNDP and MOLISA under the Support Social Assistance Reform project. Ha Noi.
Kidd, S., Wylde E. 2011. Targeting the poorest: An Assessment of the proxy means test methodology. AusAid
Klasen, S. 2010. ‘Measuring and Monitoring Inclusive Growth: Multiple Definitions, Open Questions, and Some Constructive Proposals’, Asian Development Bank, Sustainable Development Working Paper 12
Kochhar, R. 2015. ‘A Global Middle Class Is More Promise than Reality’. Pew Research Center. http://www.pewglobal.org/2015/07/08/a-global-middle-class-is-more-promise-than-reality/#why-the-middle-matters. Last accessed on 11 October 2015.
Krugman, P. (2011. “Currency Wars” and the Impossible Trinity (Wonkish. http://krugman.blogs.nytimes.com/2011/05/09/currency-wars-and-the-impossible-trinity-wonkish/?_r=0. Last accessed on 11 October 2015.
Kuznets S. 1955. ‘Economic growth and Income Inequality’, The American Economic Review Vol XLV, March 1955, Number One.
La Porta, R., & Shleifer, A. (2014) Informality and Development, Journal of Economic Perspectives, 28(3): 109-26.
La, Hai Anh and Nguyen, Kim Thai (2015. ‘Spatial Distribution of Employment Opportunities in the New Context’, Policy Paper for the Mekong Economic Research Network (MERN)
Levenson, A.R. and Maloney, W.F. 1998. The informal sector, firm dynamics and institutional participation. World Bank Policy Research Working Paper.
Lipton, M. 1997. Editorial: Poverty—are there holes in the consensus?. World Development, 25(7. 1003-1007.
Malesky, E. & Taussig, M. 2009. Out of the Gray: The Impact of Provincial Institutions on Business Formalization in Vietnam, Journal of East Asian Studies, 9: 249-290.
l VIET NAM HUMAN DEVELOPMENT REPORT 2015160
Malesky, E., 2007. The Vietnam Provincial Competitiveness Index, 2007: Measuring Economic Governance for Private Sector Development. Vietnam Chamber of Commerce and Industry.
Malesky, E.J., 2008. Vietnam Provincial Competitiveness Index 2008. Vietnam competitiveness initiative policy paper. (13).
Maloney, W. F., Nunez, J., Cunningham, W., Fiess, N., Montenegro, C., Murrugarra, E., ... & Sepulveda, C. 2001. Measuring the Impact of minimum wages : evidence from Latin America, Policy Research Working Paper Series 2597, The World Bank.
Mao W, Vu H, Xie Z, Chen W, Tang S (2015) Systematic Review on Irrational Use of Medicines in China and Vietnam. PLoS ONE 10(3): e0117710.
Marcouiller , D. ,Ruiz de Castilla , V. and Woodruff , C. 1997. Formal measures of the informal-sector wage gap in Mexico, Economic Development and Culture Change, Vol. 45, Iss. 2, pp. 367-392.
Marcouiller, D. and Young, L., 1995. The black hole of graft: the predatory state and the informal economy. The American Economic Review, pp.630-646.
McCaig, B., & Pavcnik, N. (2013. Moving out of agriculture: structural change in Vietnam (No. w19616. National Bureau of Economic Research.
McCulloch, N., Malesky, E., & Duc, N. N. 2013. Does better provincial governance boost private investment in Vietnam?. IDS Working Papers, 2013(414. 1-27.
Meyer, K. E., & Nguyen, H. V. 2005. Foreign Investment Strategies and Sub‐national Institutions in Emerging Markets: Evidence from Vietnam. Journal of management studies, 42(1. 63-93.
Mkandawire 2005. ‘Targeting and Universalism in Poverty reduction’, Social Policy and Development Paper Number 23,
United Nations Research Institute for Social Development Programme.
MOET (Ministry of Education and Training). 2005, Higher Education Reform Agenda, 2006-2020 [Đề án Đổi mới Giáo dục Đại học, giai đoạn 2006-2020].
MOET (Ministry of Education and Training). 2009. ‘Proposal to renovate education finance 2009-2014’, Ha Noi, Viet Nam.
MOH (Ministry of Health). 2010. ‘Five Year Health Sector Development Plan (2011-2015)’, Ha Noi, Viet Nam.
MOH (Ministry of Health). 2013. Joint Annual Health Review 2013, Health Partnership Group, Ha Noi, Viet Nam.
MOH (Ministry of Health). 2014. Report of Health care sector 2014, Ha Noi, Viet Nam.
MOLISA (Ministry of Labour, Invalids and Social Affairs). 2015. MOLISA/SPD Report to National Assembly’s Standing Committee, July 2015.
MPI (Ministry of Planning and Investment). 2015. ‘Labor Productivity in Viet Nam: Current Status and Solutions’. Năng suất lao động của Việt Nam: Thực trạng và Giải pháp. Hanoi.
Mukoyama 1999. ‘Promotion of Small Business Development in Korea’. The Japan Research Institute Working Paper. June 1999. http://www.jri.co.jp/english/periodical/rim/1999/RIMe199903korea/ Accessed on 27 November 2015.
NA (National Assembly of Viet Nam). 2004. Resolution 37/2004/NQ-QH11 of the National Assembly, Ha Noi.
Nguyen Dinh Tai. 2006. ‘Promoting Private Sector Development in Viet Nam: Policy Effectiveness’. Presented at the 2006 International Forum on Economic Transition.
Nguyen Ngoc Anh et al. 2015. Global and Regional integration and Inclusive Foreign
Notes and references l 161
Direct Investment’, background paper for Viet Nam 2014 National Human Development Report, Ha Noi, UNDP/VASS.
Nguyen Thang et al. 2014. ‘Labour Productivity in Vietnam: Performance and Determinants’, Background Paper under the ONE UN/ILO Project “Enhancing Employment Policies, Economic Stabilization and Restructuring for an Inclusive, Effective and Sustainable Growth Model for Viet Nam”, Centre for Analysis and Forecasting.
Nguyen Thi Tue Anh. 2009. Foreign Direct Investment and Technology Transfer in Vietnam: A Case Study of Que Vo Industrial Park, Bac Ninh Province, Paper prepared for the World Bank.
Nguyen Viet Cuong 2009. Can Vietnam Achieve Millennium Development Goal on Poverty Reduction and Economic Stagnation? Working Paper 01. Development and Policies Research Center (DEPOCEN). Vietnam.
Nguyen X. Thanh; Nguyen, A. N., & Nguyen, T. 2008. Foreign direct investment in Vietnam: Is there any evidence of technological spillover effects. SSRN 1117202.
Nguyen, Thi Phuong Mai et al. 2015. ‘Modelling the determinants of job satisfaction‘. Research paper for the Mekong Economic Research Network (MERN).
Nguyen, Viet-Cuong, & Van den Berg, M. 2014. Informal Credit, Usury, or Support? A case study for Vietnam, The Developing Economies 52, no. 2: 154-78.
Noy and Vu. 2009. The Economics of Natural Disasters in a Developing Country: The Case of Vietnam; Ilan Noy (Department of Economics University of Hawai‘i at Mānoa) and Tam Bang Vu (College of Business and Economics University of Hawai‘i at Hilo); Working Paper No. 09-3 May 2009.
OECD 2014a. ‘Changing the Conversation on Growth: Going Inclusive’, February 2014. Ford Foundation. New York.
OECD 2014b. ‘Social Policies in Vietnam” Social Cohesion Policy Review of Viet Nam’. May 2014.
OECD 2014c. “Social Cohesion at a Crossroads: Evolving Challenges in Vietnam” Social Cohesion Policy Review of Viet Nam.
OECD 2015. All on Board: Making Inclusive Growth Happen, OECD Publishing, Paris.
Ohno, K. 2009. ‘Avoiding the Middle-Income Trap – Renovating Industrial Policy Formulation in Vietnam’ ASEAN Economic Bulletin 26
Olsen, W., Nomura, H. 2009. Poverty Reduction: Fuzzy Sets vs. Crisp Sets Compared, Sociological Theory and Methods
P Aghion, E Caroli, C Garcia-Penalosa. 1999. ‘Inequality and economic growth: the perspective of the new growth theories’. Journal of Economic literature.
Pension Watch Social Pension Database at: http://www.pension-watch.net/about-social-pensions/about-social-pensions/social-pensions-database/
Pham, Minh Thai 2015. ‘Determinants of Labor Productivity: Evidence from GSO’s Household Business Survey 2012’. Paper commissioned by ONE UN/ILO project “Enhancing employment policies, economic stabilization and restructuring for an inclusive, effective and sustainable growth model for Viet Nam”.
Pham, Minh Thai and Vu, T. Van Ngoc. 2015. ‘Migration and Inclusive Growth in Vietnam: Recent Trends and Policy Implications’. Policy paper. Mekong Economic Research Network (MERN).
Pham, T. T. T. 2015. Does Exporting Spur Firm Productivity?: Evidence from Vietnam. Journal of Southeast Asian Economies (JSEAE). 32(1). 84-105.
Phan, D., & Coxhead, I. 2013. Education In Southeast Asia: Investments, Achievements,
l VIET NAM HUMAN DEVELOPMENT REPORT 2015162
And Returns. Routledge Handbook of Southeast Asian Economics. Draft version 24/7/2013.
Pomfret, R., Le Quoc Hoi 2010. Foreign direct investment and wage Spillovers in Vietnam: Evidence from firm level data. Asean economic bulletin, 27(2) 159-172.
Porta, R. L., & Shleifer, A. 2014. Informality and development. (No. w20205). National Bureau of Economic Research.
Pritchett, L. 2005. ‘The Political Economy of Targeted Safety Nets’, Social Protection Unit Human Development Network The World Bank.
R. Briones, J. Felipe 2013. Agriculture and Structural Transformation in Developing Asia: Review and Outlook August 2013. Asian Development Bank Economics Working Paper Series No. 363.
Rand, J., & Torm, N. 2012. The benefits of formalization: Evidence from Vietnamese manufacturing SMEs. World development, 40(5). 983-998.
Ravallion, M. 2009. The Developing World’s Bulging (but Vulnerable) Middle Class. Policy Research Working Paper No. 4816, the World Bank, Development Research Group.
Razavi, S. 2012. World Development Report 2012: gender equality and development—a commentary. Development and Change, 43(1). 423-437.
Rodrik, D. 2010. The Return of Industrial Policy. https://www.project-syndicate.org/commentary/the-return-of-industrial-policy. Last accessed on 15 July 2015.
Rodrik, D. 2014. ‘The Past, Present and Future of Economic Growth’. Challenge, 57(3). 5-39.
Samson, M. 2007. ‘Social Cash Transfers and Pro-poor growth’ In Promoting Pro-Poor Growth: Social Protection, pp. 43-59. OECD.
Saxena N.C. et al. 2009. Report of the expert
group to advise the ministry of rural development on the methodology for conducting the Below Poverty Line (BPL) census for 11th Five Year Plan. Government of India, Ministry of rural development. Krishi Bahvan, New Delhi. August 2009.
Soares, S.; Ribas, R. P.; and Osório, R. G. 2010) “Evaluating the Impact of Brazil’s Bolsa Família: Cash Transfer Programs in Comparative Perspective”, Latin American Research Review, Vol. 45(2. pp. 173-190. African Social Security Agency Publication, South Africa.
Somanathan, A., Tandon, A., Dao, H. L., Hurt, K. L., & Fuenzalida-Puelma, H. L. (2014. Moving toward Universal Coverage of Social Health Insurance in Vietnam: Assessment and Options. World Bank Publications.
Stiglitz, J. 2012.‘The Price of Inequality – How Today’s Divided Society endangers our Future’, Penguin UK.
Straub, S. 2005. Informal sector: the credit market channel. Journal of Development Economics, 78(2). 299-321.
Subramanian A, Devesh R. 2001. ‘Who Can Explain the Mauritian Miracle: Meade, Romer, Sachs, or Rodrik’, IMF.
Tai, N. D. 2006. Promoting private sector development in Vietnam from the effectiveness of supporting policies (No. 22840. East Asian Bureau of Economic Research.
Tenev, S., Carlier, A., Chaudry, O. and Nguyen, Q.T., 2003. Informality and the playing field in Vietnam’s business sector. Washington, DC: World Bank and the International Finance Corporation.
Tenev, S., Carlier, A., Chaudry, O., & Nguyen, Q. T. 2003. Informality and the playing field in Vietnam’s business sector. Washington, DC: World Bank and the International Finance Corporation.
Thanh, N. X., Tran, B. X., Waye, A., Harstall, C., & Lindholm, L. 2014. ‘Socialization of Health
Notes and references l 163
Care” in Vietnam: What Is It and What Are Its Pros and Cons?’. Value in Health Regional Issues, 3, 24-26.
Tien, T. V., Phuong, H. T., Mathauer, I., & Phuong, N. T. K. 2011. ‘A health financing review of Viet Nam with a focus on social health insurance’. Geneva: World Health Organization.
To Trung Thanh et al. 2015. Occupational selection in Viet Nam: business owner or wage worker? Determinants and policy implications. Research paper for the Mekong Economic Research Network (MERN). Tran, Thi Bich and Hai Anh, La. 2015. ‘Under-sized Firms in Vietnam: Prevalence and Explanations’, Policy Paper for the Mekong Economic Research Network (MERN).
UN (United Nations) 2012. The future we want, UN Conference on Sustainable Development Rio+20, outcome document.
UNCTAD (United Nations Conference on Trand and Development. 2014. Growth with structural transformation: A post-2015 development agenda’. Chapter 3: From MDGs to SDGs: Reconnecting Economic and Human development.
UNDESA (United Nations Department of economic and social affairs), Population Division. 2002. World Population Ageing: 1950-2050; United Nations. New York.
UNDESA (United Nations Department of economic and social affairs), Population Division. 2015, World Population Prospects: the 2015 Revision. United Nations, New York.
UNDP (United Nations Development Programme). 1990. Human Development Report 1990, ‘Concept and Measurement of Human Development’. New York.
UNDP (United Nations Development Programme). 2009a. Global Human Development Report 2009, New York.
UNDP (United Nations Development Programme). 2009b. ‘A mapping exercise – Poverty Reduction programs and policies in Viet Nam’, Hanoi.
UNDP (United Nations Development Programme). 2010a. Human Development Report 2010, ‘The Real Wealth of Nations: Pathways to Human Development’. New York.
UNDP (United Nations Development Programme). 2010b. “Urban Poverty Assessment in Ha Noi and HCMC”, September 2010, Ha Noi. UNDP (United Nations Development Programme). 2012. “Urban Poverty Survey in Ha Noi and HCMC”, Ha Noi.
UNDP (United Nations Development Programme). 2013. ‘Mapping Inclusive Growth’. Working Paper Number 105. International Policy Centre for Inclusive Growth.
UNDP (United Nations Development Programme). 2014a. Human Development Report 2014. ‘Sustaining Human Progress: Reducing Vulnerabilities and Building Resilience’. New York.
UNDP (United Nations Development Programme). 2014b. Humanity Divided: Confronting Inequality in Developing Countries. New York.
UNDP (United Nations Development Programme). 2014c. Green growth and fossil fuel fiscal policies in Viet Nam: Recommendations on a roadmap for policy reform.
UNDP (United Nations Development Programme). 2015. Global Human Development Report 2015 “Work for Human Development”. New York.
UNDP (United Nations Development Programme). 2015b. The Viet Nam Provincial Governance and Public Administration Performance Index: Measuring citizen’s experiences (PAPI 2014), Ha Noi April 2015.
l VIET NAM HUMAN DEVELOPMENT REPORT 2015164
UNFPA (United Nations Population Fund). 2011. Ageing and elderly people in Viet Nam. Factsheet.
UNICEF (United Nations Children’s Fund). 2011. Key Findings Report, Multiple Indicator Cluster Survey 2011. Ha Noi.
UNICEF (United Nations Children’s Fund). 2014. Key Findings Report, Multiple Indicator Cluster Survey 2014. Ha Noi.
UNICEF/UN Women. 2013. Addressing Inequalities: Synthesis Report of Global Public Consultation. Global Thematic Consultation on the Post-2015 Development Agenda. UNICEF.
Van Minh, H., Phuong, N. T. K., & Saksena, P. 2012. ‘Assessment of financial protection in the Viet Nam Health system: Analyses of Viet Nam Living Standard Survey Data 2002-2010’, World Health Organization and Hanoi Medical University, Hanoi.
Van Minh, Hoang, et al., 2013. Out-of-School Children in Viet Nam: A Country Study, Financial burden of household out-of pocket health expenditure in Viet Nam: Findings from the National Living Standard Survey 2002–2010. Social science & medicine 96 (2013): 258-263.
Van Thanh, H., & Hoang, P. T. 2010. Productivity Spillovers from Foreign Direct Investment: The Case of Vietnam.
VASS (Viet Nam Academy of Social Sciences). 2015. Kinh tế Việt Nam và thế giới 2014-2015: Nỗ lực phục hồi để chuyển sang quỹ đạo tăng trưởng mới (The World and Vietnamese Economies: Accelerating Recovery towards a New Growth Strategy).
Veras, F.; Peres, R. and Guerreiro, R. (2007) “Evaluating the Impact of Brazil’s Bolsa Família: Cash Transfer Programmes”, Comparative Perspective, International Poverty Centre Evaluation Note No. 1, International Poverty Centre: Brasilia, Brazil.
Vilela A. 2013. Pension coverage in China and the expansion of the New Rural Social
Pension, Pension watch briefing no. 11, London, HelpAge International, Vol. 24 (2. 219-246.
Vu Hoang Dat. 2015. ‘Inclusive Growth Index in Vietnam: An Analysis’, Policy Paper for the Mekong Economic Research Network (MERN).
Vu Hoang Linh and Paul Glewwe. 2009. Impacts of Rising Food Prices on Poverty and Welfare in Vietnam. Journal of Agricultural and Resource Economics in Vietnam. Working Papers 13. Development and Policy Research Center (DEPOCEN). Vietnam.
WHO (World Health Organization) and HMU (Ha Noi Medical University) Research Report. 2012 Assessment of Financial Proetecion in the Viet Nam Health System: Analyses of Viet Nam Living Standards Survey Data 2002-2010; Hoang Van Minh, Nguyen Thi Kim Phuong, and Priyanka Saksena; Ha Noi- July 2012; Page 17.
Whyte, M., 2010. Myth of the social volcano: Perceptions of inequality and distributive injustice in contemporary China. Stanford University Press.
Wilkinson, R., & Pickett, K. 2010. The spirit level: why equality is better for everyone. Penguin UK.
Wittenbaum, et al. 2004. From cooperative to motivated information sharing in groups: Moving beyond the hidden profile paradigm. Communication Monographs, 71(3. 286-310.
World Bank. 1994. Averting the Old Age Crisis: Policies to Protect the Old and Promote Growth. A World Bank policy research report. Oxford Press. 1994.
World Bank. 2003. Poverty, Vietnam Development Report 2004. Hanoi.
World Bank. 2008. Social Protection, Vietnam Development Report 2008. The World Bank.
World Bank. 2009. What is Inclusive Growth, note, 10 February 2009, available at http://siteresources.worldbank.org/INTDEBTDEPT/
Notes and references l 165
R e s o u r c e s / 4 6 8 9 8 0 - 1 2 1 8 5 6 7 8 8 4 5 4 9 /WhatIsInclusiveGrowth20081230.pdf (last accessed 01 September 2014).
World Bank. 2011. Private Tutoring in Vietnam: A Review of Current Issues and Its Major Correlates. Hai Anh Dang, World Bank, September 2011.
World Bank. 2012a. ‘Corruption from the Perspective of Citizens, Firms and Public Officials’, 51.
World Bank. 2012b. ‘World Development Report 2012 : Gender Equality and Development’. Washington, DC.
World Bank. 2013. ‘World Development Report 2013 : Jobs’. Washington, DC.
World Bank. 2014a. ‘Taking Stock: An Update on Vietnam’s Recent Economic Developments’. Hanoi, pp. 52-53.
World Bank. 2014b. ‘Well Begun, But Not Yet Done’. Hanoi, p. 228.
World Bank. Various years. Doing Business Report, Washington DC. World Bank/ILSSA. 2014. Qualitative study on the Vietnamese people’s perceptions of inequality.
World Economic Forum. 2014. The Global Competitiveness Report 2014-2015. Switzerland.
World Economic Forum. 2015. The Global Competitiveness Report 2015-2016. Switzerland.
Young Lives. 2012a. Bob Baulch, Vu Hoang Dat and Nguyen Thang. Do Vietnamese Schools Provide the Right Education for an Industrialising Country? Young Lives Working Paper 87. Oxford.
Young Lives. 2012b. Le Thuc Duc, Boc Baulch ‘Do extra classes improve cognitive test scores? Evidence from Viet Nam’. Young Lives working paper n. 89. Oxford.
Young Lives. 2013. Caine Rolleston et al. Making Progress: Report of the Young Lives School Survey in Vietnam. Young Lives Working Paper 100. Oxford.
Young Lives. 2013. Le Thuc Duc & Tran Ngo Minh Tam. Why children in Viet Nam drop out of school and what they do after that. Young Lives Working Paper 102. Oxford.
Young Lives. Forthcoming. Wilson E. and Pells K. How do children enrolled in national health insurance schemes seek health care in Vietnam and Peru? Evidence from a mixed method study. Young Lives Working Paper, Oxford.
Yusuf, S. 2014. Evolving Global Value Chains: Policy Implications for Vietnam.

l VIET NAM HUMAN DEVELOPMENT REPORT 2015166
Health Education Labor Productivity Social Protection Gender Equality Inclusive Growth Missing Middle Technological Readiness Innovation Medium Technology Emerging Lower Middle Class Health Education Labor Productivity Social Protection Gender Equality Inclusive Growth Missing Middle Technological Readiness Innovation Medium Technology Emerging Lower Middle Class Health Education Labor Productivity Social Protection Gender Equality Inclusive Growth Missing Middle Technological Readiness Innovation Medium Technology Emerging Lower Middle Class Health Education Labor Productivity Social Protection Gender Equality Inclusive Growth Missing Middle Technological Readiness Inclusive Growth Medium Technology Emerging Lower Middle Class Health Education Labor Productivity Social Protection Gender Equality Inclusive Growth Missing Middle Technological Readiness Innovation Medium Technology Emerging Lower Middle Class Health Education Labor Productivity Social Protection Gender Equality Inclusive Growth Missing Middle Technological Readiness Innovation Medium Technology Emerging Lower Middle Class Health Education Labor Productivity Social Protection Gender Equality Inclusive Growth Missing Middle Technological Readiness Innovation Medium Technology Emerging Lower Middle Class Health Education Labor Productivity Social Protection Gender Equality Inclusive Growth Missing Middle Technological Readiness Innovation Medium Technology Emerging Lower Emerging Lower Health Education Labor Productivity Social Protection Gender Equality Inclusive Growth Missing Middle Technological Readiness Innovation Medium Technology Emerging Lower Middle Class Health Education Labor Productivity Social Protection Gender Equality Inclusive Growth Missing Middle Technological Readiness Innovation Medium Technology Emerging Lower Middle Class Health Education Labor Productivity Social Protection Gender Equality Inclusive Growth Missing Middle Technological Readiness Innovation Medium Technology Emerging Lower Middle Class Health Education Labor Productivity Social Protection Gender Equality Inclusive Growth Missing Middle Technological Readiness Innovation Medium Technology Emerging Lower Middle Class Health Education Labor Productivity Social Protection Gender Equality
Health Education Labor Productivity Social Protection Gender Equality Inclusive Growth Missing Middle Technological Readiness Innovation Medium Technology Emerging Lower Middle Class Health Education Inclusive Growth Social Protection Gender Labor Productivity Missing Middle Technological Readiness Innovation Medium Technology Emerging Lower Middle Class Health Education Labor Productivity Social Protection Gender Equality Inclusive Growth Missing Middle Productivity Readiness Innovation Medium Technology Social Protection Middle Class Health Education Labor Education Social Protection Gender Equality Health Missing Middle Technological Readiness Inclusive Growth Medium Technology Emerging Lower Middle Class Health Education Labor Productivity Social Protection Gender Equality Inclusiv Gender Equality Missing Middle Technological Readiness Innovation Medium Technology
Health Education Labor Productivity Social Protection Gender Equality Inclusive Growth Missing Middle Technological Readiness Innovation Medium Technology Emerging Low Middle Class Health Education Labor Productivity Social Protection Gender Equality Inclusive Growth Missing Technological Readiness Innovation Medium Technology Emerging Lower Middle Class Health Education Labor Productivity Social Protection Gender Equality
Inclusive Growth Missing Middle Technological Readiness Innovation Medium Technology Emerging Lower Middle Class Health Education Labor Productivity Social Protection Gender Equality Inclusive Growth Missing Middle Technological Readiness Inclusive Growth Medium Gender Equality Middle Class Health Education Health Education Social Protection Gender Equality Inclusive Growth Missing Middle Technological Readiness Innovation Medium Technology Emerging Lower Middle Class Health Education Labor Productivity Social Protection Gender Equality Inclusive Growth Missing Middle Technological Readiness Innovation Medium Technology Emerging Lower Middle Class
Health Education Labor Productivity Social Protection Gender Equality Gender Equality Missing Middle Technological Readiness Innovation Medium Technology Emerging Lower Middle Class Health Education Labor
Productivity Social Inclusive Growth Gender Middle Technological Readiness Innovation Medium Techno Emerging Lower Middle Class Health Education Labor Produ Social Protection Gender Equality Inclusive Growth Missing Middle Technological Readiness Innovation Medium Technology Emerging Lower Middle Class Health Education Labor Productivity Social Protection Gender Equality Inclusive Growth Missing Middle Technological Readiness Inclusive Growth Medium Technology Emerging Lower Middle Class Health Education Labor Productivity Social Protection Gender Equality Inclusive Growth Missing Middle Technological Readiness Innovation Medium Technology Emerging Lower Middle Class Health Education Labor Productivity Social Protection Gender Equality Inclusive Growth Missing Middle
Health Education Labor Productivity Social Protection Gender Equality Inclusive Gr Missing Middle Technological Readiness Innovation Medium Technology Emerging Lower Middle Class Health Education Labor Productivity Social Protection Gender Equality Inclusive Growth Missing Middle Health Technological Innovation Medium Technology Emerging Lower Middle Health Education Labor Productivity
Social Protection Gender Equality Inclusive Growth Missing Middle Technological Readiness Innovation Medium Technology Emerging Lower Middle Class Health Education Labor Productivity Social Protection Gender Equality Inclusive Growth Missing Middle Technological Readiness Inclusive Growth Medium Technology Emerging Lower Middle Class Health Education Labor Productivity Social Protection Gender Equality Inclusive Growth Missing Middle Technological Readiness Innovation Medium Technology Emerging
Annexes
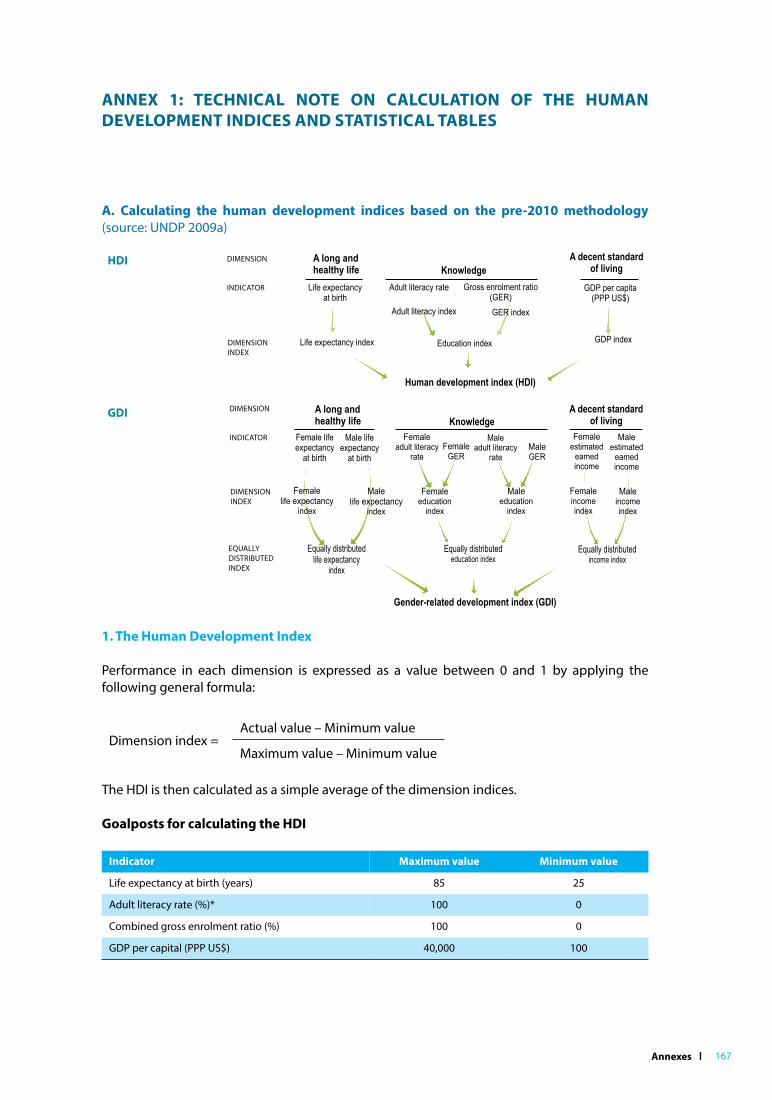
Annexes l 167
A. Calculating the human development indices based on the pre-2010 methodology (source: UNDP 2009a)
1. The Human Development Index
Performance in each dimension is expressed as a value between 0 and 1 by applying the following general formula:
Dimension index =Actual value – Minimum value
Maximum value – Minimum value
The HDI is then calculated as a simple average of the dimension indices.
Goalposts for calculating the HDI
Indicator Maximum value Minimum value
Life expectancy at birth (years) 85 25
Adult literacy rate (%)* 100 0
Combined gross enrolment ratio (%) 100 0
GDP per capital (PPP US$) 40,000 100
ANNEX 1: TECHNICAL NoTE oN CALCuLATIoN oF THE HuMAN DEVELoPMENT INDICES AND STATISTICAL TABLES
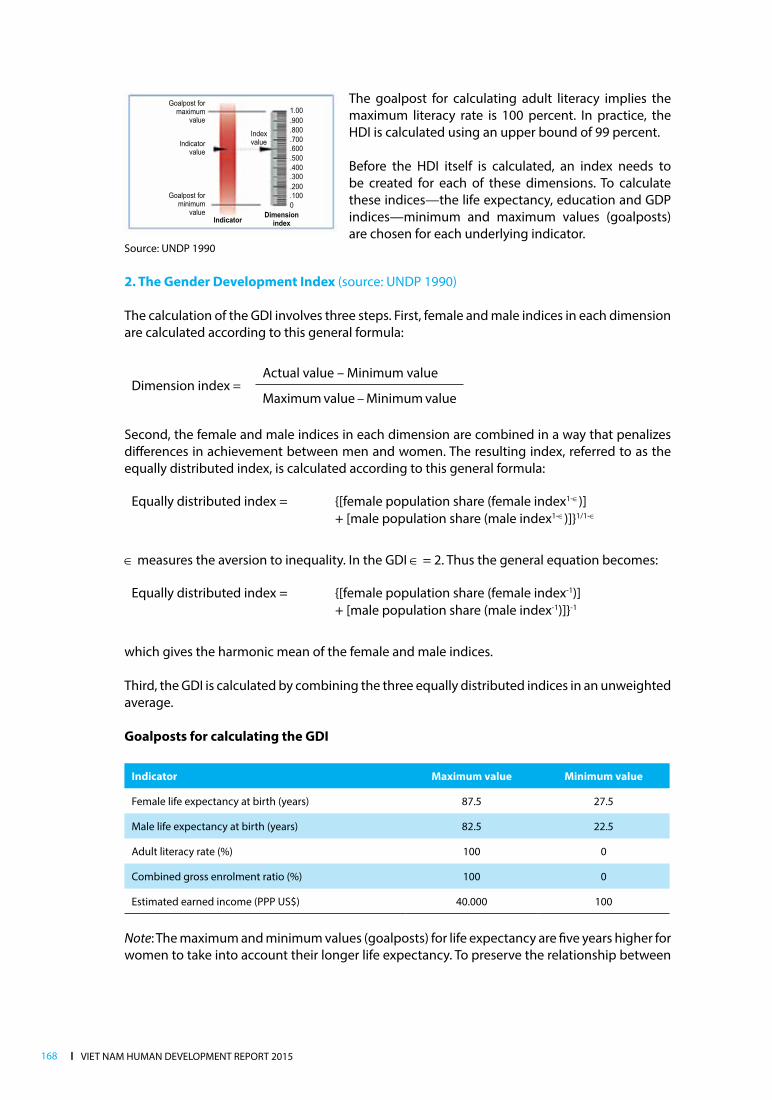
l VIET NAM HUMAN DEVELOPMENT REPORT 2015168
The goalpost for calculating adult literacy implies the maximum literacy rate is 100 percent. In practice, the HDI is calculated using an upper bound of 99 percent.
Before the HDI itself is calculated, an index needs to be created for each of these dimensions. To calculate these indices—the life expectancy, education and GDP indices—minimum and maximum values (goalposts) are chosen for each underlying indicator.
Source: UNDP 1990
2. The Gender Development Index (source: UNDP 1990)
The calculation of the GDI involves three steps. First, female and male indices in each dimension are calculated according to this general formula:
Dimension index =Actual value – Minimum value
Maximum value – Minimum value
Second, the female and male indices in each dimension are combined in a way that penalizes differences in achievement between men and women. The resulting index, referred to as the equally distributed index, is calculated according to this general formula:
Equally distributed index = {[female population share (female index1-Î)] + [male population share (male index1-Î)]}1/1-Î
Î measures the aversion to inequality. In the GDI Î = 2. Thus the general equation becomes:
Equally distributed index = {[female population share (female index-1)] + [male population share (male index-1)]}-1
which gives the harmonic mean of the female and male indices.
Third, the GDI is calculated by combining the three equally distributed indices in an unweighted average.
Goalposts for calculating the GDI
Indicator Maximum value Minimum value
Female life expectancy at birth (years) 87.5 27.5
Male life expectancy at birth (years) 82.5 22.5
Adult literacy rate (%) 100 0
Combined gross enrolment ratio (%) 100 0
Estimated earned income (PPP US$) 40.000 100
Note: The maximum and minimum values (goalposts) for life expectancy are five years higher for women to take into account their longer life expectancy. To preserve the relationship between
Annexes l 169
female and male values of each indicator, scaled values are computed and used in place of figures where either the female or male value exceeds the threshold (in the case of adult literacy, a practical threshold value of 99 percent is used). The scaling is achieved by multiplying the female and male values by the practical threshold value divided by the maximum reported value for either females or males.
B. Calculating HDI indices based on the new methodology introduced in 2010 (Source: UNDP 2010)
1. The Human Development Index
The education and income components in the traditional HDI were replaced by following indicators:
• Mean years of schooling – UIS & Barro & Lee methodology
• Expected years of schooling – UNESCO UIS; and
• GNI per capita (2005 PPP US$) – WB & IMF, UNSD and UNDESA
Two innovative indicators of education can better capture the level of education and recent changes. GNI is a more accurate measure of a country’s economic welfare, as it expresses income accrued to residents of a country, including international flows and excluding income generated in the country but repatriated abroad.
The HDI derived under the 2010 methodology has a form of geometric mean of dimension indices obtained from the indicators by normalization based on minima and maxima observed over the period for which the HDI has been computed and reported. Thus, the previous ‘cap’ on the income component was replaced by an ‘observed maximum’ per capita income level. Adopting the geometric mean produces lower index values, with the largest changes occurring in countries with uneven development across dimensions. The geometric mean has only a moderate impact on HDI rankings.
Unlike the old HDI, the new HDI based on the geometric mean takes into account differences in achievement across dimensions. Poor performance in any dimension is now directly reflected in the new HDI, which captures how well a country’s performance is across the three dimensions. A low achievement in one dimension is not anymore linearly compensated for by high achievement in another dimension. The geometric mean reduces the level of substitutability between dimensions and at the same time ensures that a 1 percent decline in any index, for instance, has the same impact on the HDI as the same decline in any other index. As a basis for comparison of achievements, this method is more respectful of the intrinsic differences across the dimensions than a simple average.
For this report, the new HDI was calculated for 2010 and 2012 only at the national level. It is also compared with global data for Viet Nam.
2. The Gender Inequality Index
The GII reflects gender-based disadvantages in three dimensions—reproductive health, empowerment and the labour market—for as many countries as data of reasonable quality allow. The index shows the loss in potential human development due to inequality between female and male achievements in these dimensions. It varies between 0, where women and men fare equally, and 1, where either gender fares as poorly as possible in all measured dimensions.
l VIET NAM HUMAN DEVELOPMENT REPORT 2015170
The GII is based on:
• Maternal mortality ratio
• Adolescent fertility rate
• Female and male population with at least secondary education
• Female and male shares of parliament seats
• Female and male labour force participation rates
The index was calculated only at the national level for 2010 and 2012 for this report. It is also compared with global data for Viet Nam.
C. Calculating the Multidimensional Poverty Index (source: UNDP 2010)
Introduced in 2010, the MPI is the product of the multidimensional poverty headcount (the share of people who are multi-dimensionally poor) and the intensity of their poverty (the average number of deprivations each multi-dimensionally poor household experiences). The MPI captures how many people experience overlapping deprivations and how many deprivations they face on average. In this regard, the measure requires that all data should come from one survey, and therefore the options for selecting dimensions for this index are limited in Viet Nam.
This report introduced the revised MPI and adapted it to the local context, using the VHLSS 2010 and 2012 dataset. In order to ensure that the MPI actually reflects multidimensional deprivations in Vietnamese households, the MPI indicators in the report have been revised and expanded by two additional dimensions (see the below table). This is also roughly in line with Viet Nam’s national specification compared to Viet Nam’s 2011 National Human Development Report. Given limited information on health in the full VHLSS dataset, only one health indicator is used.
The methodology to calculate the MPI uses the following steps:
• Step 1: Choose unit of analysis. The MPI is calculated at the household level.
• Step 2: Choose dimensions. Five dimensions have been selected in line with the final proposed national specification: health, education, housing, clean water and sanitation, and information accessibility.
• Step 3: Choose indicators. It is best to choose indicators that are not highly correlated. The MPI for Viet Nam uses nine indicators: one for the health dimension, and two for each of the remaining four dimensions. Equal weight for these nine indicators is assumed for simplicity.
• Step 4: Set poverty lines. A poverty cut-off is set for each dimension (see the table below). Every person can then be identified as deprived or non-deprived with respect to each dimension.
• Step 5: Apply poverty lines. In this exercise, households with a weighted deprivation score of at least 33.3 percent were considered multi-dimensionally poor.
• Step 6: Calculate the headcount ratio (H). Divide the number of poor people by the total number of people.
• Step 7: Calculate the intensity of poverty (A). A is the average number of deprivations a poor person suffers. It is calculated by adding up the proportion of total deprivations each person suffers, divided by the total number of poor persons.
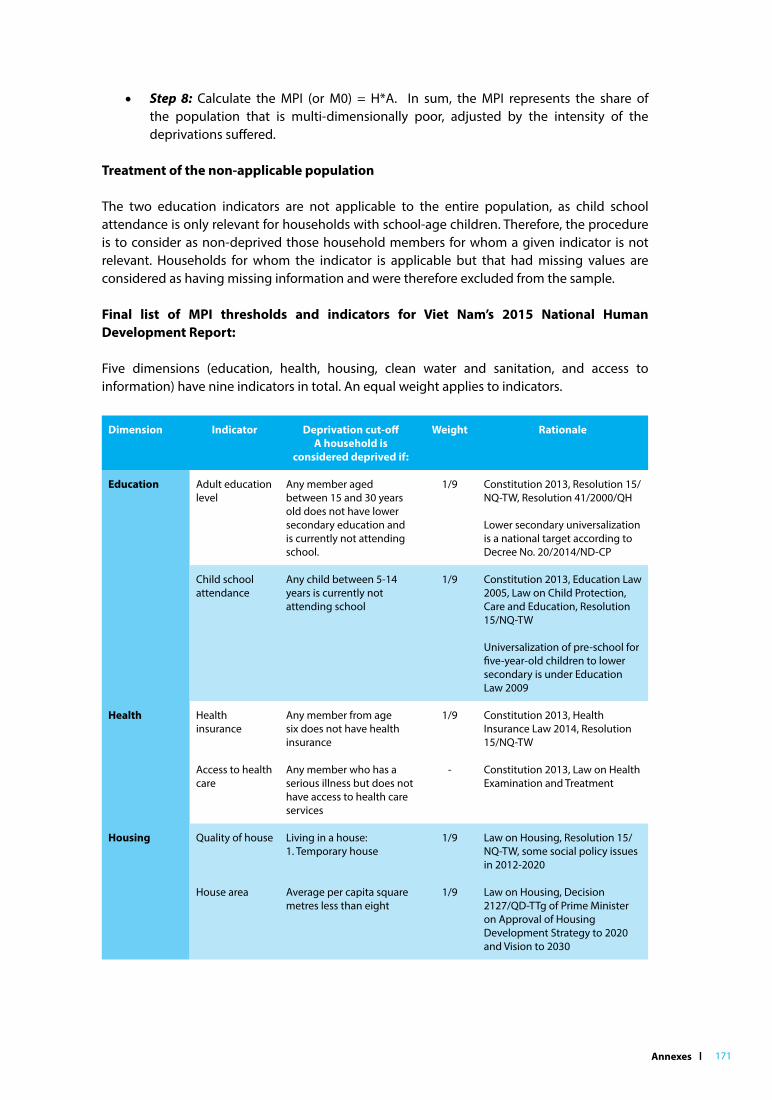
Annexes l 171
• Step 8: Calculate the MPI (or M0) = H*A. In sum, the MPI represents the share of the population that is multi-dimensionally poor, adjusted by the intensity of the deprivations suffered.
Treatment of the non-applicable population
The two education indicators are not applicable to the entire population, as child school attendance is only relevant for households with school-age children. Therefore, the procedure is to consider as non-deprived those household members for whom a given indicator is not relevant. Households for whom the indicator is applicable but that had missing values are considered as having missing information and were therefore excluded from the sample.
Final list of MPI thresholds and indicators for Viet Nam’s 2015 National Human Development Report:
Five dimensions (education, health, housing, clean water and sanitation, and access to information) have nine indicators in total. An equal weight applies to indicators.
Dimension Indicator Deprivation cut-offA household is
considered deprived if:
Weight Rationale
Education Adult education level
Any member aged between 15 and 30 years old does not have lower secondary education and is currently not attending school.
1/9 Constitution 2013, Resolution 15/NQ-TW, Resolution 41/2000/QH
Lower secondary universalization is a national target according to Decree No. 20/2014/ND-CP
Child school attendance
Any child between 5-14 years is currently not attending school
1/9 Constitution 2013, Education Law 2005, Law on Child Protection, Care and Education, Resolution 15/NQ-TW
Universalization of pre-school for five-year-old children to lower secondary is under Education Law 2009
Health Health insurance
Any member from age six does not have health insurance
1/9 Constitution 2013, Health Insurance Law 2014, Resolution 15/NQ-TW
Access to health care
Any member who has a serious illness but does not have access to health care services
- Constitution 2013, Law on Health Examination and Treatment
Housing Quality of house Living in a house:1. Temporary house
1/9 Law on Housing, Resolution 15/NQ-TW, some social policy issues in 2012-2020
House area Average per capita square metres less than eight
1/9 Law on Housing, Decision 2127/QD-TTg of Prime Minister on Approval of Housing Development Strategy to 2020 and Vision to 2030
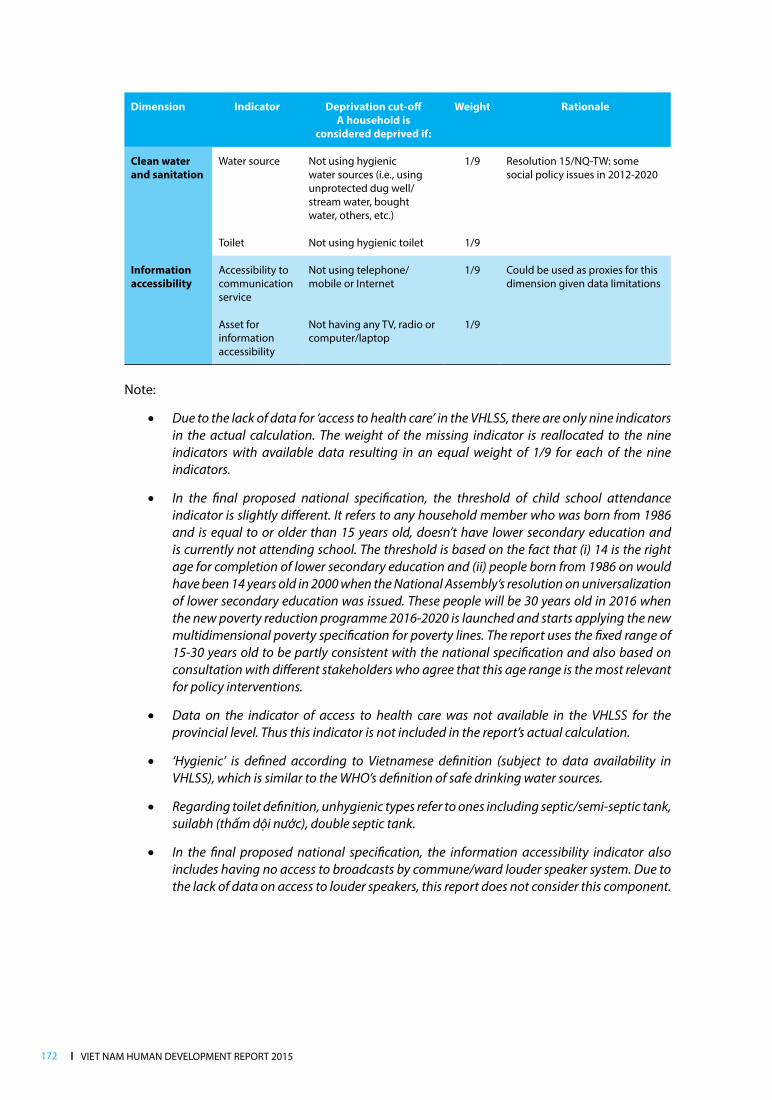
l VIET NAM HUMAN DEVELOPMENT REPORT 2015172
Dimension Indicator Deprivation cut-offA household is
considered deprived if:
Weight Rationale
Clean water and sanitation
Water source Not using hygienic water sources (i.e., using unprotected dug well/stream water, bought water, others, etc.)
1/9 Resolution 15/NQ-TW: some social policy issues in 2012-2020
Toilet Not using hygienic toilet 1/9
Information accessibility
Accessibility to communication service
Not using telephone/mobile or Internet
1/9 Could be used as proxies for this dimension given data limitations
Asset for information accessibility
Not having any TV, radio or computer/laptop
1/9
Note:
• Due to the lack of data for ‘access to health care’ in the VHLSS, there are only nine indicators in the actual calculation. The weight of the missing indicator is reallocated to the nine indicators with available data resulting in an equal weight of 1/9 for each of the nine indicators.
• In the final proposed national specification, the threshold of child school attendance indicator is slightly different. It refers to any household member who was born from 1986 and is equal to or older than 15 years old, doesn’t have lower secondary education and is currently not attending school. The threshold is based on the fact that (i) 14 is the right age for completion of lower secondary education and (ii) people born from 1986 on would have been 14 years old in 2000 when the National Assembly’s resolution on universalization of lower secondary education was issued. These people will be 30 years old in 2016 when the new poverty reduction programme 2016-2020 is launched and starts applying the new multidimensional poverty specification for poverty lines. The report uses the fixed range of 15-30 years old to be partly consistent with the national specification and also based on consultation with different stakeholders who agree that this age range is the most relevant for policy interventions.
• Data on the indicator of access to health care was not available in the VHLSS for the provincial level. Thus this indicator is not included in the report’s actual calculation.
• ‘Hygienic’ is defined according to Vietnamese definition (subject to data availability in VHLSS), which is similar to the WHO’s definition of safe drinking water sources.
• Regarding toilet definition, unhygienic types refer to ones including septic/semi-septic tank, suilabh (thấm dội nước), double septic tank.
• In the final proposed national specification, the information accessibility indicator also includes having no access to broadcasts by commune/ward louder speaker system. Due to the lack of data on access to louder speakers, this report does not consider this component.
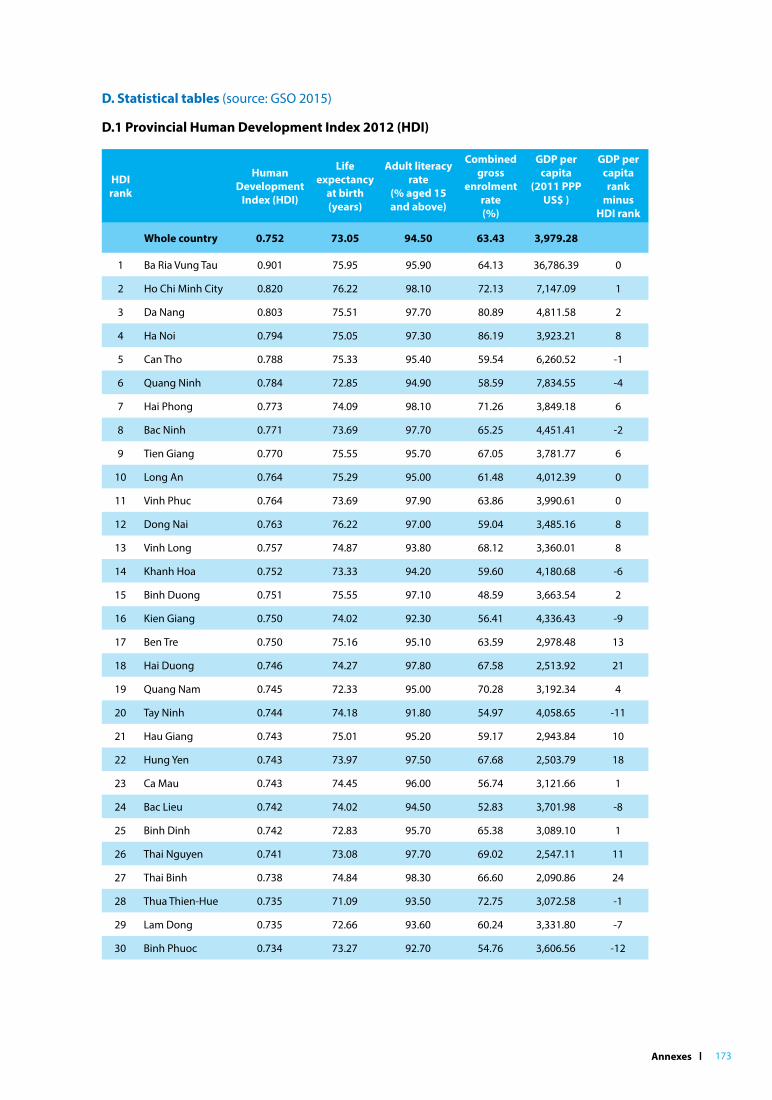
Annexes l 173
D. Statistical tables (source: GSO 2015)
D.1 Provincial Human Development Index 2012 (HDI)
HDI rank
Human Development
Index (HDI)
Life expectancy
at birth (years)
Adult literacy rate
(% aged 15 and above)
Combined gross
enrolment rate(%)
GDP per capita
(2011 PPP uS$ )
GDP per capita rank
minus HDI rank
Whole country 0.752 73.05 94.50 63.43 3,979.28
1 Ba Ria Vung Tau 0.901 75.95 95.90 64.13 36,786.39 0
2 Ho Chi Minh City 0.820 76.22 98.10 72.13 7,147.09 1
3 Da Nang 0.803 75.51 97.70 80.89 4,811.58 2
4 Ha Noi 0.794 75.05 97.30 86.19 3,923.21 8
5 Can Tho 0.788 75.33 95.40 59.54 6,260.52 -1
6 Quang Ninh 0.784 72.85 94.90 58.59 7,834.55 -4
7 Hai Phong 0.773 74.09 98.10 71.26 3,849.18 6
8 Bac Ninh 0.771 73.69 97.70 65.25 4,451.41 -2
9 Tien Giang 0.770 75.55 95.70 67.05 3,781.77 6
10 Long An 0.764 75.29 95.00 61.48 4,012.39 0
11 Vinh Phuc 0.764 73.69 97.90 63.86 3,990.61 0
12 Dong Nai 0.763 76.22 97.00 59.04 3,485.16 8
13 Vinh Long 0.757 74.87 93.80 68.12 3,360.01 8
14 Khanh Hoa 0.752 73.33 94.20 59.60 4,180.68 -6
15 Binh Duong 0.751 75.55 97.10 48.59 3,663.54 2
16 Kien Giang 0.750 74.02 92.30 56.41 4,336.43 -9
17 Ben Tre 0.750 75.16 95.10 63.59 2,978.48 13
18 Hai Duong 0.746 74.27 97.80 67.58 2,513.92 21
19 Quang Nam 0.745 72.33 95.00 70.28 3,192.34 4
20 Tay Ninh 0.744 74.18 91.80 54.97 4,058.65 -11
21 Hau Giang 0.743 75.01 95.20 59.17 2,943.84 10
22 Hung Yen 0.743 73.97 97.50 67.68 2,503.79 18
23 Ca Mau 0.743 74.45 96.00 56.74 3,121.66 1
24 Bac Lieu 0.742 74.02 94.50 52.83 3,701.98 -8
25 Binh Dinh 0.742 72.83 95.70 65.38 3,089.10 1
26 Thai Nguyen 0.741 73.08 97.70 69.02 2,547.11 11
27 Thai Binh 0.738 74.84 98.30 66.60 2,090.86 24
28 Thua Thien-Hue 0.735 71.09 93.50 72.75 3,072.58 -1
29 Lam Dong 0.735 72.66 93.60 60.24 3,331.80 -7
30 Binh Phuoc 0.734 73.27 92.70 54.76 3,606.56 -12
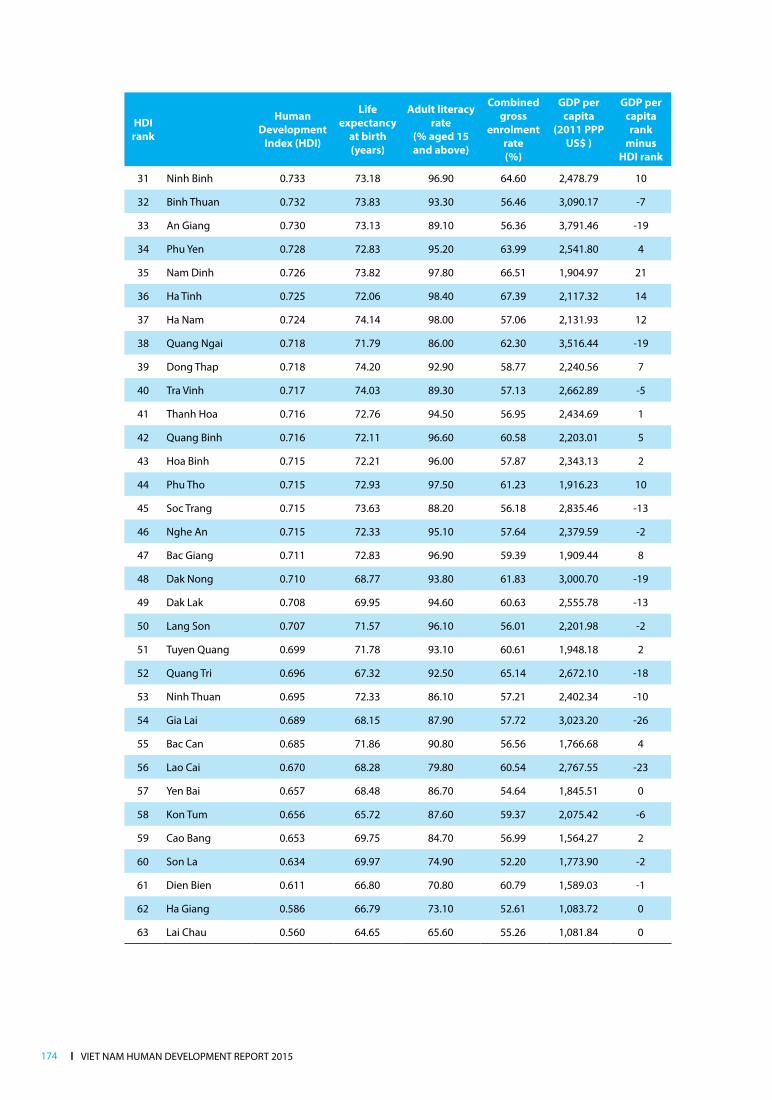
l VIET NAM HUMAN DEVELOPMENT REPORT 2015174
HDI rank
Human Development
Index (HDI)
Life expectancy
at birth (years)
Adult literacy rate
(% aged 15 and above)
Combined gross
enrolment rate(%)
GDP per capita
(2011 PPP uS$ )
GDP per capita rank
minus HDI rank
31 Ninh Binh 0.733 73.18 96.90 64.60 2,478.79 10
32 Binh Thuan 0.732 73.83 93.30 56.46 3,090.17 -7
33 An Giang 0.730 73.13 89.10 56.36 3,791.46 -19
34 Phu Yen 0.728 72.83 95.20 63.99 2,541.80 4
35 Nam Dinh 0.726 73.82 97.80 66.51 1,904.97 21
36 Ha Tinh 0.725 72.06 98.40 67.39 2,117.32 14
37 Ha Nam 0.724 74.14 98.00 57.06 2,131.93 12
38 Quang Ngai 0.718 71.79 86.00 62.30 3,516.44 -19
39 Dong Thap 0.718 74.20 92.90 58.77 2,240.56 7
40 Tra Vinh 0.717 74.03 89.30 57.13 2,662.89 -5
41 Thanh Hoa 0.716 72.76 94.50 56.95 2,434.69 1
42 Quang Binh 0.716 72.11 96.60 60.58 2,203.01 5
43 Hoa Binh 0.715 72.21 96.00 57.87 2,343.13 2
44 Phu Tho 0.715 72.93 97.50 61.23 1,916.23 10
45 Soc Trang 0.715 73.63 88.20 56.18 2,835.46 -13
46 Nghe An 0.715 72.33 95.10 57.64 2,379.59 -2
47 Bac Giang 0.711 72.83 96.90 59.39 1,909.44 8
48 Dak Nong 0.710 68.77 93.80 61.83 3,000.70 -19
49 Dak Lak 0.708 69.95 94.60 60.63 2,555.78 -13
50 Lang Son 0.707 71.57 96.10 56.01 2,201.98 -2
51 Tuyen Quang 0.699 71.78 93.10 60.61 1,948.18 2
52 Quang Tri 0.696 67.32 92.50 65.14 2,672.10 -18
53 Ninh Thuan 0.695 72.33 86.10 57.21 2,402.34 -10
54 Gia Lai 0.689 68.15 87.90 57.72 3,023.20 -26
55 Bac Can 0.685 71.86 90.80 56.56 1,766.68 4
56 Lao Cai 0.670 68.28 79.80 60.54 2,767.55 -23
57 Yen Bai 0.657 68.48 86.70 54.64 1,845.51 0
58 Kon Tum 0.656 65.72 87.60 59.37 2,075.42 -6
59 Cao Bang 0.653 69.75 84.70 56.99 1,564.27 2
60 Son La 0.634 69.97 74.90 52.20 1,773.90 -2
61 Dien Bien 0.611 66.80 70.80 60.79 1,589.03 -1
62 Ha Giang 0.586 66.79 73.10 52.61 1,083.72 0
63 Lai Chau 0.560 64.65 65.60 55.26 1,081.84 0
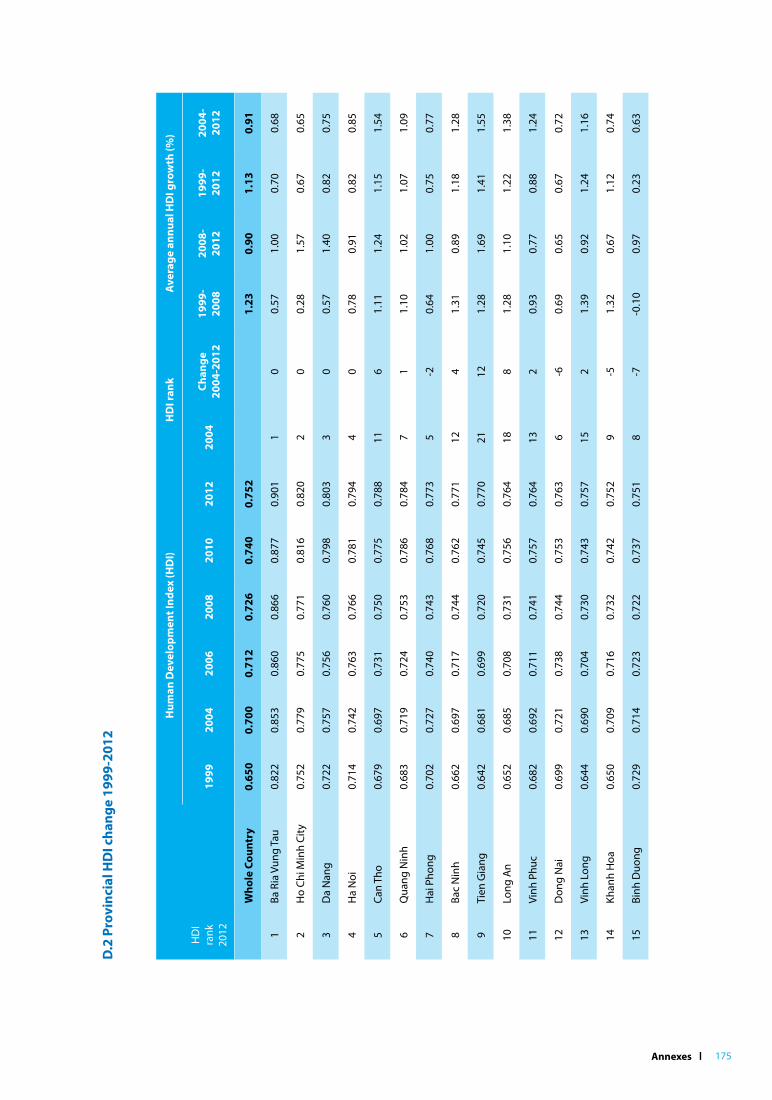
Annexes l 175
D.2
Pro
vinc
ial H
DI c
hang
e 19
99-2
012
Hum
an D
evel
opm
ent I
ndex
(HD
I)H
DI r
ank
Ave
rage
ann
ual H
DI g
row
th (%
)
HD
I ra
nk
2012
1999
2004
2006
2008
2010
2012
2004
Chan
ge
2004
-201
219
99-
2008
2008
-20
1219
99-
2012
2004
-20
12
Who
le C
ount
ry0.
650
0.70
00.
712
0.72
60.
740
0.75
21.
230.
901.
130.
91
1Ba
Ria
Vun
g Ta
u0.
822
0.85
30.
860
0.86
60.
877
0.90
11
00.
571.
000.
700.
68
2H
o Ch
i Min
h Ci
ty0.
752
0.77
90.
775
0.77
10.
816
0.82
02
00.
281.
570.
670.
65
3D
a N
ang
0.72
20.
757
0.75
60.
760
0.79
80.
803
30
0.57
1.40
0.82
0.75
4H
a N
oi0.
714
0.74
20.
763
0.76
60.
781
0.79
44
00.
780.
910.
820.
85
5Ca
n Th
o0.
679
0.69
70.
731
0.75
00.
775
0.78
811
61.
111.
241.
151.
54
6Q
uang
Nin
h0.
683
0.71
90.
724
0.75
30.
786
0.78
47
11.
101.
021.
071.
09
7H
ai P
hong
0.70
20.
727
0.74
00.
743
0.76
80.
773
5-2
0.64
1.00
0.75
0.77
8Ba
c N
inh
0.66
20.
697
0.71
70.
744
0.76
20.
771
124
1.31
0.89
1.18
1.28
9Ti
en G
iang
0.64
20.
681
0.69
90.
720
0.74
50.
770
2112
1.28
1.69
1.41
1.55
10Lo
ng A
n0.
652
0.68
50.
708
0.73
10.
756
0.76
418
81.
281.
101.
221.
38
11Vi
nh P
huc
0.68
20.
692
0.71
10.
741
0.75
70.
764
132
0.93
0.77
0.88
1.24
12D
ong
Nai
0.69
90.
721
0.73
80.
744
0.75
30.
763
6-6
0.69
0.65
0.67
0.72
13Vi
nh L
ong
0.64
40.
690
0.70
40.
730
0.74
30.
757
152
1.39
0.92
1.24
1.16
14Kh
anh
Hoa
0.65
00.
709
0.71
60.
732
0.74
20.
752
9-5
1.32
0.67
1.12
0.74
15Bi
nh D
uong
0.72
90.
714
0.72
30.
722
0.73
70.
751
8-7
-0.1
00.
970.
230.
63
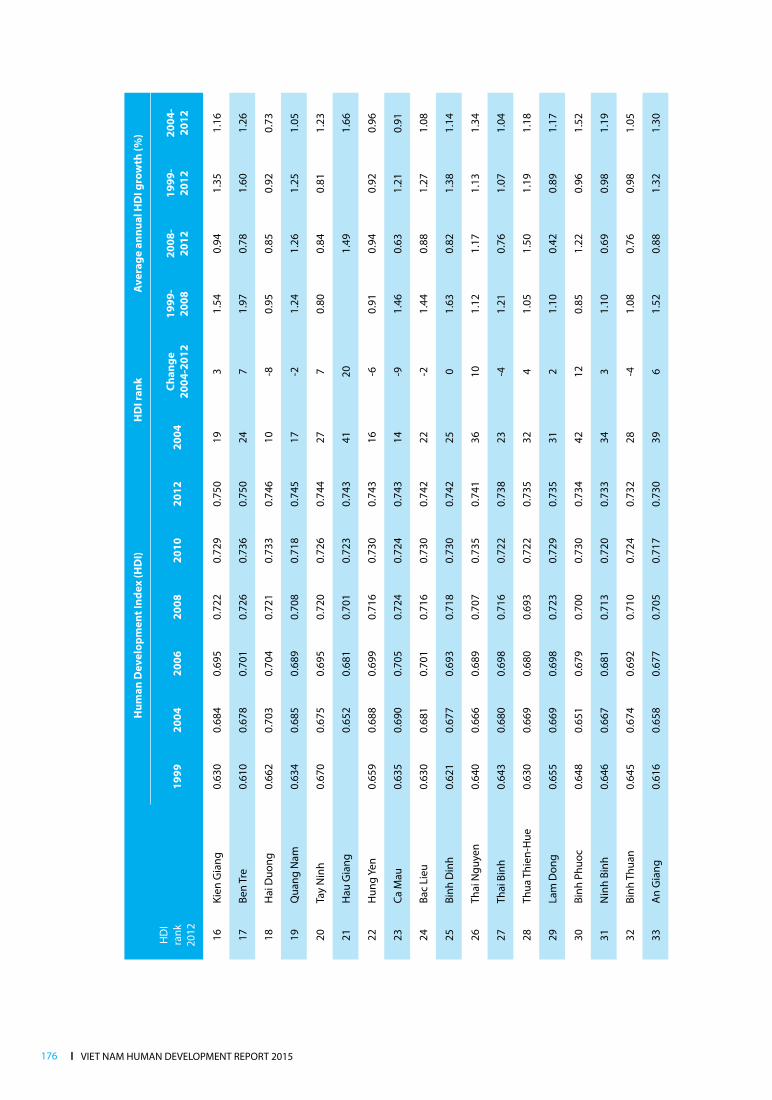
l VIET NAM HUMAN DEVELOPMENT REPORT 2015176
Hum
an D
evel
opm
ent I
ndex
(HD
I)H
DI r
ank
Ave
rage
ann
ual H
DI g
row
th (%
)
HD
I ra
nk
2012
1999
2004
2006
2008
2010
2012
2004
Chan
ge
2004
-201
219
99-
2008
2008
-20
1219
99-
2012
2004
-20
12
16Ki
en G
iang
0.63
00.
684
0.69
50.
722
0.72
90.
750
193
1.54
0.94
1.35
1.16
17Be
n Tr
e0.
610
0.67
80.
701
0.72
60.
736
0.75
024
71.
970.
781.
601.
26
18H
ai D
uong
0.66
20.
703
0.70
40.
721
0.73
30.
746
10-8
0.95
0.85
0.92
0.73
19Q
uang
Nam
0.63
40.
685
0.68
90.
708
0.71
80.
745
17-2
1.24
1.26
1.25
1.05
20Ta
y N
inh
0.67
00.
675
0.69
50.
720
0.72
60.
744
277
0.80
0.84
0.81
1.23
21H
au G
iang
0.65
20.
681
0.70
10.
723
0.74
341
201.
491.
66
22H
ung
Yen
0.65
90.
688
0.69
90.
716
0.73
00.
743
16-6
0.91
0.94
0.92
0.96
23Ca
Mau
0.63
50.
690
0.70
50.
724
0.72
40.
743
14-9
1.46
0.63
1.21
0.91
24Ba
c Li
eu0.
630
0.68
10.
701
0.71
60.
730
0.74
222
-21.
440.
881.
271.
08
25Bi
nh D
inh
0.62
10.
677
0.69
30.
718
0.73
00.
742
250
1.63
0.82
1.38
1.14
26Th
ai N
guye
n0.
640
0.66
60.
689
0.70
70.
735
0.74
136
101.
121.
171.
131.
34
27Th
ai B
inh
0.64
30.
680
0.69
80.
716
0.72
20.
738
23-4
1.21
0.76
1.07
1.04
28Th
ua T
hien
-Hue
0.63
00.
669
0.68
00.
693
0.72
20.
735
324
1.05
1.50
1.19
1.18
29La
m D
ong
0.65
50.
669
0.69
80.
723
0.72
90.
735
312
1.10
0.42
0.89
1.17
30Bi
nh P
huoc
0.64
80.
651
0.67
90.
700
0.73
00.
734
4212
0.85
1.22
0.96
1.52
31N
inh
Binh
0.64
60.
667
0.68
10.
713
0.72
00.
733
343
1.10
0.69
0.98
1.19
32Bi
nh T
huan
0.64
50.
674
0.69
20.
710
0.72
40.
732
28-4
1.08
0.76
0.98
1.05
33A
n G
iang
0.61
60.
658
0.67
70.
705
0.71
70.
730
396
1.52
0.88
1.32
1.30
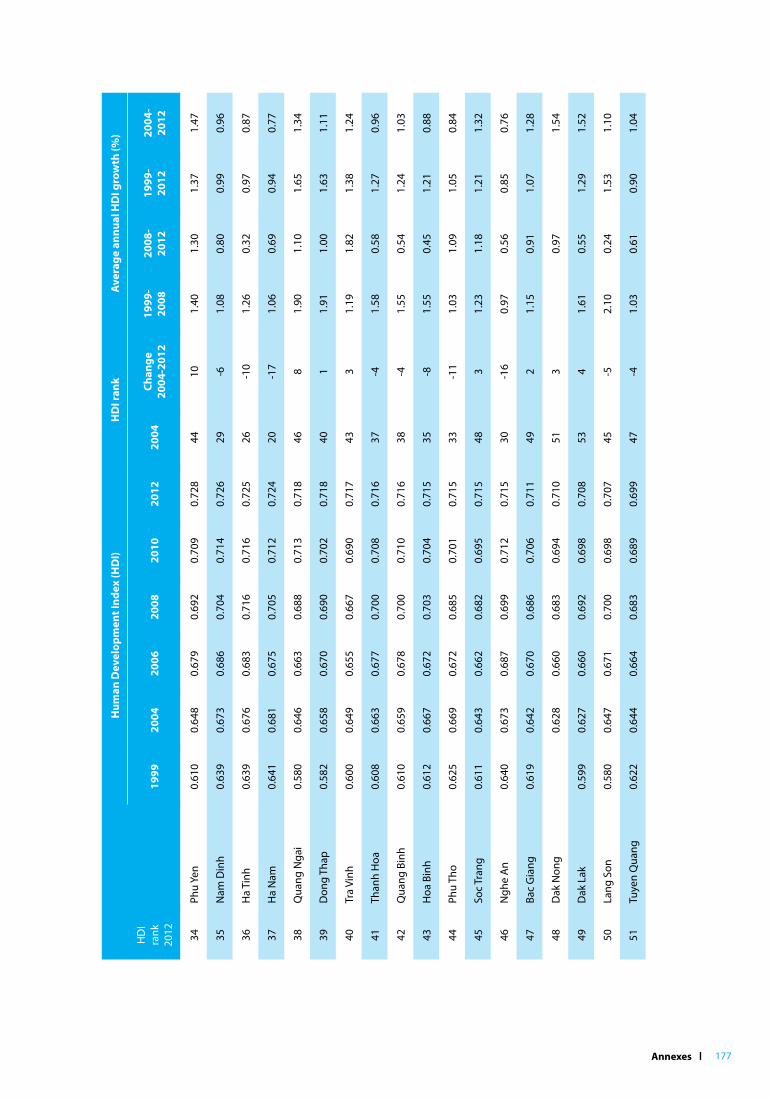
Annexes l 177
Hum
an D
evel
opm
ent I
ndex
(HD
I)H
DI r
ank
Ave
rage
ann
ual H
DI g
row
th (%
)
HD
I ra
nk
2012
1999
2004
2006
2008
2010
2012
2004
Chan
ge
2004
-201
219
99-
2008
2008
-20
1219
99-
2012
2004
-20
12
34Ph
u Ye
n0.
610
0.64
80.
679
0.69
20.
709
0.72
844
101.
401.
301.
371.
47
35N
am D
inh
0.63
90.
673
0.68
60.
704
0.71
40.
726
29-6
1.08
0.80
0.99
0.96
36H
a Ti
nh0.
639
0.67
60.
683
0.71
60.
716
0.72
526
-10
1.26
0.32
0.97
0.87
37H
a N
am0.
641
0.68
10.
675
0.70
50.
712
0.72
420
-17
1.06
0.69
0.94
0.77
38Q
uang
Nga
i0.
580
0.64
60.
663
0.68
80.
713
0.71
846
81.
901.
101.
651.
34
39D
ong
Thap
0.58
20.
658
0.67
00.
690
0.70
20.
718
401
1.91
1.00
1.63
1.11
40Tr
a Vi
nh0.
600
0.64
90.
655
0.66
70.
690
0.71
743
31.
191.
821.
381.
24
41Th
anh
Hoa
0.60
80.
663
0.67
70.
700
0.70
80.
716
37-4
1.58
0.58
1.27
0.96
42Q
uang
Bin
h0.
610
0.65
90.
678
0.70
00.
710
0.71
638
-41.
550.
541.
241.
03
43H
oa B
inh
0.61
20.
667
0.67
20.
703
0.70
40.
715
35-8
1.55
0.45
1.21
0.88
44Ph
u Th
o0.
625
0.66
90.
672
0.68
50.
701
0.71
533
-11
1.03
1.09
1.05
0.84
45So
c Tr
ang
0.61
10.
643
0.66
20.
682
0.69
50.
715
483
1.23
1.18
1.21
1.32
46N
ghe
An
0.64
00.
673
0.68
70.
699
0.71
20.
715
30-1
60.
970.
560.
850.
76
47Ba
c G
iang
0.61
90.
642
0.67
00.
686
0.70
60.
711
492
1.15
0.91
1.07
1.28
48D
ak N
ong
0.62
80.
660
0.68
30.
694
0.71
051
30.
971.
54
49D
ak L
ak0.
599
0.62
70.
660
0.69
20.
698
0.70
853
41.
610.
551.
291.
52
50La
ng S
on0.
580
0.64
70.
671
0.70
00.
698
0.70
745
-52.
100.
241.
531.
10
51Tu
yen
Qua
ng0.
622
0.64
40.
664
0.68
30.
689
0.69
947
-41.
030.
610.
901.
04

l VIET NAM HUMAN DEVELOPMENT REPORT 2015178
Hum
an D
evel
opm
ent I
ndex
(HD
I)H
DI r
ank
Ave
rage
ann
ual H
DI g
row
th (%
)
HD
I ra
nk
2012
1999
2004
2006
2008
2010
2012
2004
Chan
ge
2004
-201
219
99-
2008
2008
-20
1219
99-
2012
2004
-20
12
52Q
uang
Tri
0.59
80.
634
0.64
80.
684
0.68
60.
696
50-2
1.51
0.43
1.17
1.16
53N
inh
Thua
n0.
595
0.62
70.
629
0.65
20.
657
0.69
552
-11.
021.
591.
201.
29
54G
ia L
ai0.
518
0.58
20.
629
0.66
50.
680
0.68
959
52.
800.
902.
212.
12
55Ba
c Ca
n0.
585
0.62
10.
635
0.66
40.
672
0.68
554
-11.
410.
791.
221.
23
56La
o Ca
i0.
525
0.60
60.
603
0.64
20.
647
0.67
056
02.
251.
071.
881.
27
57Ye
n Ba
i0.
579
0.61
50.
619
0.62
70.
649
0.65
755
-20.
901.
160.
980.
83
58Ko
n Tu
m0.
533
0.56
70.
614
0.63
50.
643
0.65
661
31.
970.
791.
611.
84
59Ca
o Ba
ng0.
540
0.59
60.
617
0.65
30.
636
0.65
357
-22.
14-0
.01
1.47
1.15
60So
n La
0.52
40.
586
0.60
20.
638
0.63
30.
634
58-2
2.20
-0.1
51.
470.
99
61D
ien
Bien
0.57
60.
574
0.59
60.
577
0.61
160
-10.
620.
75
62H
a G
iang
0.47
50.
517
0.54
90.
567
0.57
80.
586
620
1.98
0.82
1.62
1.57
63La
i Cha
u0.
557
0.49
00.
499
0.53
40.
547
0.56
063
0-0
.46
1.17
0.04
1.68
Not
es: D
ata
for H
a Ta
y be
fore
200
08 w
as in
tegr
ated
into
Ha
Noi
for c
onsi
sten
cy w
ith re
cent
yea
rs.
In 1
999:
Dat
a fo
r Lai
Cha
u al
so in
clud
es D
ien
Bien
; Dak
Lak
dat
a al
so in
clud
es D
ak N
ong;
Can
Tho
incl
udin
g H
au G
iang
. GD
P da
ta fo
r Hoa
Bin
h al
so c
aptu
res
hydr
o-el
ectr
icity
reve
nue;
and
pet
role
um so
urce
s for
the
case
of B
a Ri
a - V
ung
Tau,
whi
ch sh
ould
be
trea
ted
as o
utlie
rs.

Annexes l 179
D.3
Pro
vinc
ial G
ende
r Dev
elop
men
t Ind
ex 2
012
(GD
I)
HD
I ra
nk
Gen
der
Dev
elop
men
t In
dex
(GD
I)
Life
exp
ecta
ncy
at b
irth
(y
ears
)A
dult
lite
racy
rate
(%)
Com
bine
d gr
oss
enro
llmen
t rat
e (%
)G
DP
per c
apit
a (P
PP $
uSD
)
Fe
mal
eM
ale
Fem
ale
Mal
eFe
mal
eM
ale
Fem
ale
Mal
e
Who
le C
ount
ry0.
752
75.8
70.4
92.6
96.4
64.8
62.2
3620
.743
45.6
1Ba
Ria
Vun
g Ta
u0.
899
78.7
73.3
95.3
96.7
66.0
62.4
2534
9.3
4823
3.1
2H
o Ch
i Min
h Ci
ty0.
831
79.0
73.6
97.6
98.8
71.4
72.8
5916
.385
05.9
3D
a N
ang
0.79
378
.073
.196
.599
.083
.778
.343
13.1
5323
.8
4H
a N
oi0.
811
77.6
72.6
96.2
98.5
87.6
84.8
3723
.841
25.8
5Ca
n Th
o0.
771
77.9
72.9
94.3
96.6
60.3
58.9
5382
.871
33.2
6Q
uang
Nin
h0.
792
75.6
70.2
93.3
96.5
59.6
57.7
6685
.789
20.2
7H
ai P
hong
0.78
576
.871
.697
.299
.173
.169
.634
29.5
4274
.9
8Ba
c N
inh
0.78
376
.471
.196
.499
.066
.364
.243
52.6
4552
.7
9Ti
en G
iang
0.75
278
.173
.294
.197
.368
.565
.730
49.4
4533
.1
10Lo
ng A
n0.
748
77.8
72.9
93.5
96.5
63.6
59.5
3577
.544
53.2
11Vi
nh P
huc
0.77
676
.471
.196
.999
.066
.061
.936
60.7
4328
.7
12D
ong
Nai
0.77
079
.073
.696
.098
.160
.757
.430
81.2
3904
.3
13Vi
nh L
ong
0.74
077
.472
.591
.995
.969
.267
.129
35.0
3797
.5
14Kh
anh
Hoa
0.74
176
.170
.792
.795
.863
.356
.033
55.1
5021
.8
15Bi
nh D
uong
0.75
778
.173
.296
.397
.946
.750
.733
29.0
4023
.7
16Ki
en G
iang
0.73
276
.771
.590
.294
.458
.254
.735
22.4
5141
.5
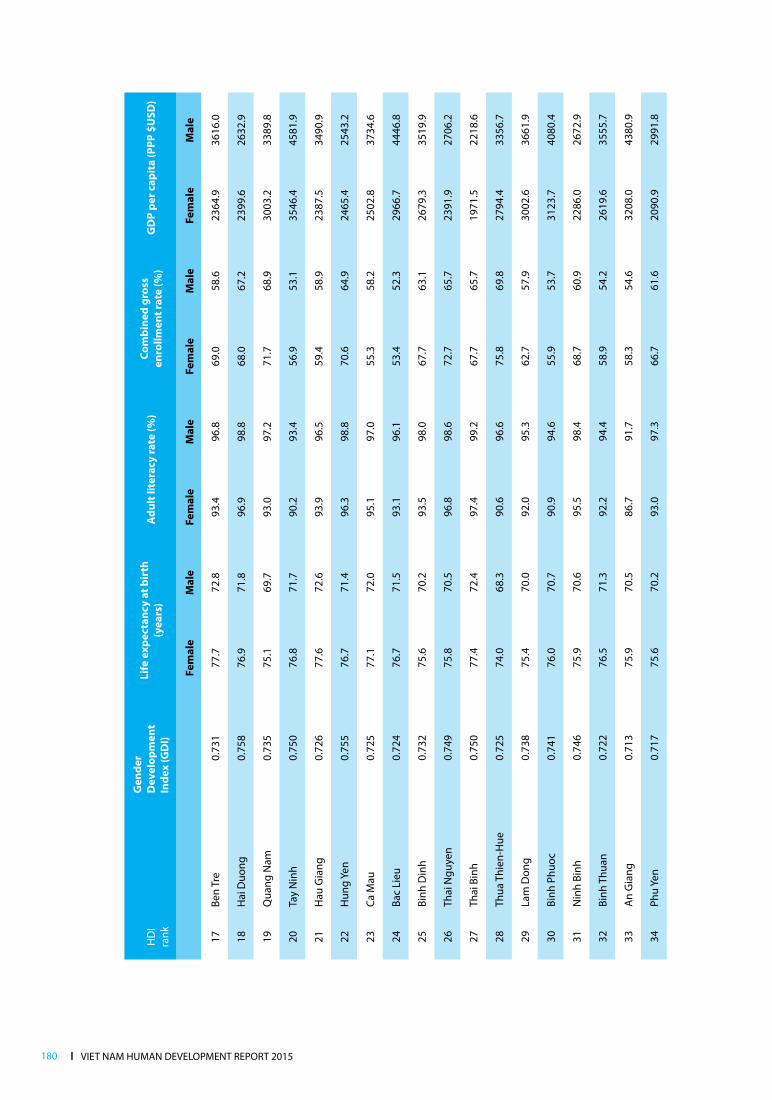
l VIET NAM HUMAN DEVELOPMENT REPORT 2015180
HD
I ra
nk
Gen
der
Dev
elop
men
t In
dex
(GD
I)
Life
exp
ecta
ncy
at b
irth
(y
ears
)A
dult
lite
racy
rate
(%)
Com
bine
d gr
oss
enro
llmen
t rat
e (%
)G
DP
per c
apit
a (P
PP $
uSD
)
Fe
mal
eM
ale
Fem
ale
Mal
eFe
mal
eM
ale
Fem
ale
Mal
e
17Be
n Tr
e0.
731
77.7
72.8
93.4
96.8
69.0
58.6
2364
.936
16.0
18H
ai D
uong
0.75
876
.971
.896
.998
.868
.067
.223
99.6
2632
.9
19Q
uang
Nam
0.73
575
.169
.793
.097
.271
.768
.930
03.2
3389
.8
20Ta
y N
inh
0.75
076
.871
.790
.293
.456
.953
.135
46.4
4581
.9
21H
au G
iang
0.72
677
.672
.693
.996
.559
.458
.923
87.5
3490
.9
22H
ung
Yen
0.75
576
.771
.496
.398
.870
.664
.924
65.4
2543
.2
23Ca
Mau
0.72
577
.172
.095
.197
.055
.358
.225
02.8
3734
.6
24Ba
c Li
eu0.
724
76.7
71.5
93.1
96.1
53.4
52.3
2966
.744
46.8
25Bi
nh D
inh
0.73
275
.670
.293
.598
.067
.763
.126
79.3
3519
.9
26Th
ai N
guye
n0.
749
75.8
70.5
96.8
98.6
72.7
65.7
2391
.927
06.2
27Th
ai B
inh
0.75
077
.472
.497
.499
.267
.765
.719
71.5
2218
.6
28Th
ua T
hien
-Hue
0.72
574
.068
.390
.696
.675
.869
.827
94.4
3356
.7
29La
m D
ong
0.73
875
.470
.092
.095
.362
.757
.930
02.6
3661
.9
30Bi
nh P
huoc
0.74
176
.070
.790
.994
.655
.953
.731
23.7
4080
.4
31N
inh
Binh
0.74
675
.970
.695
.598
.468
.760
.922
86.0
2672
.9
32Bi
nh T
huan
0.72
276
.571
.392
.294
.458
.954
.226
19.6
3555
.7
33A
n G
iang
0.71
375
.970
.586
.791
.758
.354
.632
08.0
4380
.9
34Ph
u Ye
n0.
717
75.6
70.2
93.0
97.3
66.7
61.6
2090
.929
91.8

Annexes l 181
HD
I ra
nk
Gen
der
Dev
elop
men
t In
dex
(GD
I)
Life
exp
ecta
ncy
at b
irth
(y
ears
)A
dult
lite
racy
rate
(%)
Com
bine
d gr
oss
enro
llmen
t rat
e (%
)G
DP
per c
apit
a (P
PP $
uSD
)
Fe
mal
eM
ale
Fem
ale
Mal
eFe
mal
eM
ale
Fem
ale
Mal
e
35N
am D
inh
0.73
776
.571
.396
.799
.167
.465
.615
89.5
2234
.1
36H
a Ti
nh0.
715
74.9
69.4
97.7
99.1
70.2
64.9
2022
.222
14.6
37H
a N
am0.
736
76.8
71.6
97.1
98.9
59.8
54.5
1976
.422
94.8
38Q
uang
Nga
i0.
708
74.6
69.1
81.1
91.1
64.2
60.4
3065
.539
79.7
39D
ong
Thap
0.70
276
.971
.791
.594
.460
.857
.020
58.4
2424
.0
40Tr
a Vi
nh0.
700
76.7
71.5
85.9
93.0
57.2
57.1
2257
.330
80.8
41Th
anh
Hoa
0.70
775
.570
.191
.997
.258
.655
.424
13.5
2456
.4
42Q
uang
Bin
h0.
706
74.9
69.5
95.5
97.6
62.9
58.4
2107
.522
98.5
43H
oa B
inh
0.72
475
.069
.694
.397
.860
.155
.922
93.9
2393
.3
44Ph
u Th
o0.
723
75.7
70.3
96.5
98.6
61.9
60.6
1940
.018
91.7
45So
c Tr
ang
0.69
776
.471
.185
.691
.057
.954
.623
18.3
3358
.9
46N
ghe
An
0.70
575
.169
.793
.596
.858
.656
.722
00.0
2561
.8
47Ba
c G
iang
0.71
975
.670
.295
.798
.260
.858
.119
33.2
1885
.2
48D
ak N
ong
0.71
271
.865
.992
.295
.263
.160
.727
98.0
3179
.0
49D
ak L
ak0.
711
72.9
67.1
92.8
96.4
63.6
57.9
2497
.926
12.6
50La
ng S
on0.
715
74.4
68.9
95.1
97.0
58.2
54.1
2122
.722
81.4
51Tu
yen
Qua
ng0.
708
74.6
69.1
90.5
95.9
63.3
58.2
1984
.319
12.2
52Q
uang
Tri
0.68
670
.464
.588
.996
.267
.063
.525
46.1
2800
.6
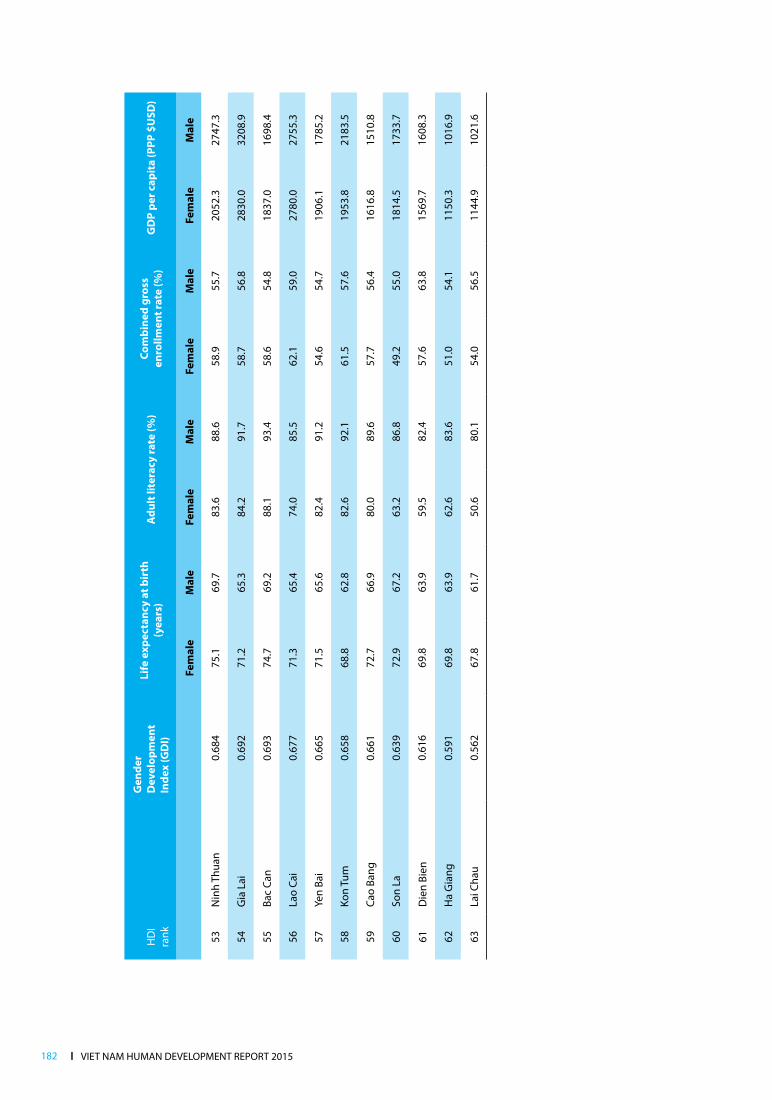
l VIET NAM HUMAN DEVELOPMENT REPORT 2015182
HD
I ra
nk
Gen
der
Dev
elop
men
t In
dex
(GD
I)
Life
exp
ecta
ncy
at b
irth
(y
ears
)A
dult
lite
racy
rate
(%)
Com
bine
d gr
oss
enro
llmen
t rat
e (%
)G
DP
per c
apit
a (P
PP $
uSD
)
Fe
mal
eM
ale
Fem
ale
Mal
eFe
mal
eM
ale
Fem
ale
Mal
e
53N
inh
Thua
n0.
684
75.1
69.7
83.6
88.6
58.9
55.7
2052
.327
47.3
54G
ia L
ai0.
692
71.2
65.3
84.2
91.7
58.7
56.8
2830
.032
08.9
55Ba
c Ca
n0.
693
74.7
69.2
88.1
93.4
58.6
54.8
1837
.016
98.4
56La
o Ca
i0.
677
71.3
65.4
74.0
85.5
62.1
59.0
2780
.027
55.3
57Ye
n Ba
i0.
665
71.5
65.6
82.4
91.2
54.6
54.7
1906
.117
85.2
58Ko
n Tu
m0.
658
68.8
62.8
82.6
92.1
61.5
57.6
1953
.821
83.5
59Ca
o Ba
ng0.
661
72.7
66.9
80.0
89.6
57.7
56.4
1616
.815
10.8
60So
n La
0.63
972
.967
.263
.286
.849
.255
.018
14.5
1733
.7
61D
ien
Bien
0.61
669
.863
.959
.582
.457
.663
.815
69.7
1608
.3
62H
a G
iang
0.59
169
.863
.962
.683
.651
.054
.111
50.3
1016
.9
63La
i Cha
u0.
562
67.8
61.7
50.6
80.1
54.0
56.5
1144
.910
21.6
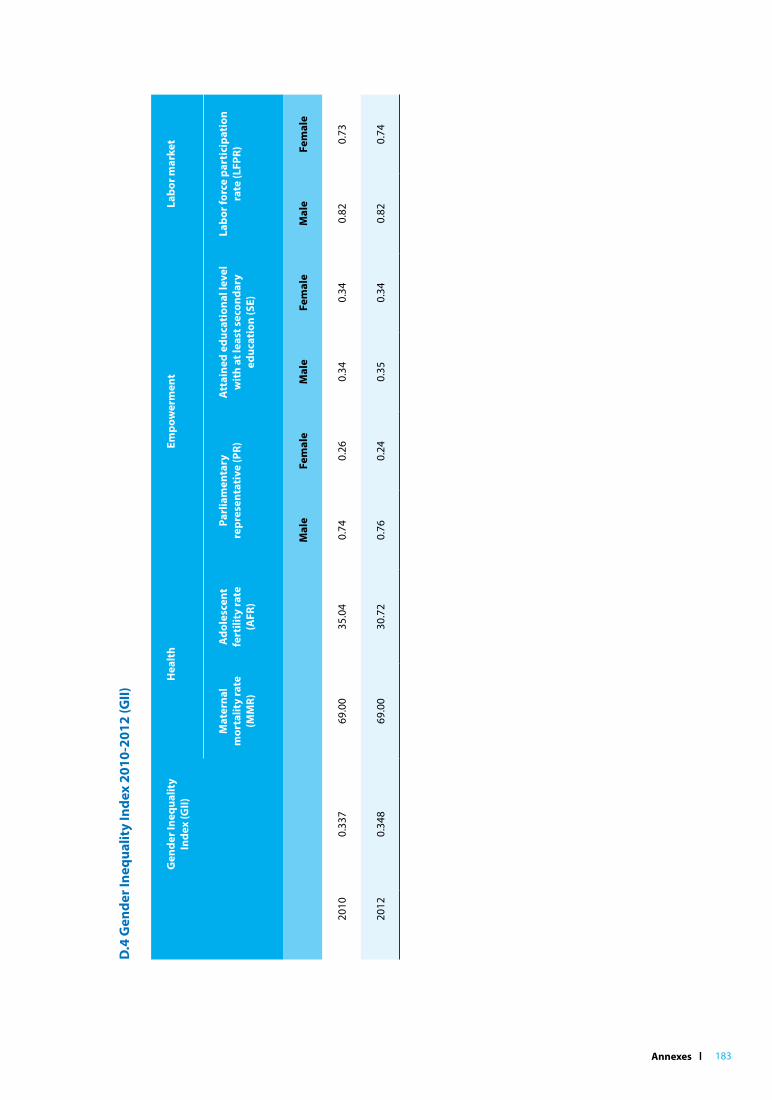
Annexes l 183
D.4
Gen
der I
nequ
alit
y In
dex
2010
-201
2 (G
II)
Gen
der I
nequ
alit
y In
dex
(GII)
Hea
lth
Empo
wer
men
tLa
bor m
arke
t
Mat
erna
l m
orta
lity
rate
(M
MR)
Ado
lesc
ent
fert
ility
rate
(A
FR)
Parl
iam
enta
ry
repr
esen
tati
ve (P
R)A
ttai
ned
educ
atio
nal l
evel
w
ith
at le
ast s
econ
dary
ed
ucat
ion
(SE)
Labo
r for
ce p
arti
cipa
tion
ra
te (L
FPR)
M
ale
Fem
ale
Mal
eFe
mal
eM
ale
Fem
ale
2010
0.33
769
.00
35.0
40.
740.
260.
340.
340.
820.
73
2012
0.34
869
.00
30.7
20.
760.
240.
350.
340.
820.
74

l VIET NAM HUMAN DEVELOPMENT REPORT 2015184
D.5
: Pro
vinc
ial M
ulti
-dim
ensi
onal
Pov
erty
Inde
x 20
12 a
nd p
erce
ntag
e of
hou
seho
lds
depr
ived
in e
ach
indi
cato
r (%
)
Mul
ti-
dim
ensi
onal
po
vert
y in
dex
(MPI
)
Mul
tidi
men
sion
al
pove
rty
Prop
orti
on o
f poo
r hou
seho
lds
depr
ived
in e
ach
indi
cato
r (%
)Pr
opor
tion
of p
oor
hous
ehol
ds d
epri
ved
in e
ach
indi
cato
r (%
)
H
*AH
ead
coun
t
Ínte
nsit
yof
de
priv
atio
nEd
ucat
ion
Hea
lth
Hou
sing
Safe
dri
nkin
g w
ater
and
sa
nita
tion
Info
rmat
ion
Acc
essi
bilit
y
H (%
)A
(%)
Adul
t ed
ucat
ion
leve
l
Child
Sc
hool
A
tten
danc
e
Hea
lth
insu
ranc
eQ
ualit
y of
ho
use
Livi
ng
area
Acce
ss to
sa
fe d
rinki
ng
wat
er
Acce
ss to
hy
gien
ic
toile
t
Acce
ssib
ility
to
com
mun
icat
ion
serv
ice
Ass
et fo
r in
form
atio
n ac
cess
ibili
ty
Who
le c
ount
ry0.
0864
21.3
40.6
11.6
2.1
13.4
10.2
5.0
6.7
16.7
8.3
3.7
Ha
Noi
0.01
554.
435
.01.
71.
04.
20.
21.
40.
42.
02.
60.
4
Qua
ng N
inh
0.04
019.
642
.06.
41.
15.
23.
82.
93.
16.
84.
72.
1
Vinh
Phu
c0.
0357
10.2
35.1
3.9
1.1
8.4
0.3
1.7
2.6
7.8
4.6
1.8
Bac
Nin
h0.
0174
4.8
35.9
3.4
0.7
4.4
0.1
2.8
0.1
2.1
1.0
0.9
Hai
Duo
ng0.
0090
2.7
33.3
0.3
0.3
2.6
-1.
60.
20.
61.
60.
9
Hai
Pho
ng0.
0172
4.9
35.4
2.6
0.6
4.1
-3.
20.
51.
42.
21.
0
Hun
g Ye
n0.
0212
5.8
36.8
2.6
0.4
5.2
0.1
2.1
0.3
3.6
3.4
1.3
Thai
Bin
h0.
0168
4.8
34.8
0.6
0.8
4.0
-1.
1-
3.0
4.1
1.4
Ha
Nam
0.02
717.
834
.81.
80.
77.
0-
2.2
0.2
6.2
5.0
1.3
Nam
Din
h0.
0224
6.3
35.5
1.4
0.6
5.8
0.2
1.1
0.3
4.5
3.9
2.3
Nin
h Bi
nh0.
0460
12.8
35.9
3.7
1.5
10.9
0.2
4.7
0.9
10.7
5.6
3.1

Annexes l 185
Mul
ti-
dim
ensi
onal
po
vert
y in
dex
(MPI
)
Mul
tidi
men
sion
al
pove
rty
Prop
orti
on o
f poo
r hou
seho
lds
depr
ived
in e
ach
indi
cato
r (%
)Pr
opor
tion
of p
oor
hous
ehol
ds d
epri
ved
in e
ach
indi
cato
r (%
)
H
*AH
ead
coun
t
Ínte
nsit
yof
de
priv
atio
nEd
ucat
ion
Hea
lth
Hou
sing
Safe
dri
nkin
g w
ater
and
sa
nita
tion
Info
rmat
ion
Acc
essi
bilit
y
H (%
)A
(%)
Adul
t ed
ucat
ion
leve
l
Child
Sc
hool
A
tten
danc
e
Hea
lth
insu
ranc
eQ
ualit
y of
ho
use
Livi
ng
area
Acce
ss to
sa
fe d
rinki
ng
wat
er
Acce
ss to
hy
gien
ic
toile
t
Acce
ssib
ility
to
com
mun
icat
ion
serv
ice
Ass
et fo
r in
form
atio
n ac
cess
ibili
ty
Ha
Gia
ng0.
2748
64.3
42.8
44.7
10.6
7.9
51.0
6.1
21.0
62.4
27.6
15.9
Cao
Bang
0.18
1742
.642
.623
.13.
93.
729
.82.
231
.741
.716
.910
.5
Bac
Kan
0.13
2431
.142
.519
.62.
73.
924
.12.
617
.227
.713
.57.
9
Tuye
n Q
uang
0.17
2742
.241
.018
.72.
616
.533
.44.
620
.339
.312
.87.
2
Lao
Cai
0.20
8047
.643
.723
.53.
610
.138
.34.
221
.844
.532
.29.
1
Die
n Bi
en0.
3389
71.5
47.4
47.3
8.7
12.0
33.6
18.1
47.2
70.7
44.3
23.2
Lai C
hau
0.28
2262
.944
.949
.27.
11.
533
.922
.826
.060
.933
.719
.0
Son
La0.
2308
52.4
44.0
33.7
5.6
9.2
24.5
11.3
29.3
48.6
29.0
16.6
Yen
Bai
0.19
0944
.842
.621
.11.
513
.734
.88.
621
.738
.621
.110
.7
Hoa
Bin
h0.
0972
24.9
39.1
10.8
1.0
4.0
13.4
6.8
12.3
22.3
13.7
3.2
Thai
Ngu
yen
0.04
5912
.237
.74.
81.
16.
55.
82.
47.
39.
13.
01.
3
Lang
Son
0.17
0442
.739
.921
.22.
18.
228
.42.
915
.440
.922
.611
.7
Bac
Gia
ng0.
0457
12.2
37.4
6.9
1.1
7.0
4.2
4.4
2.2
7.0
5.6
2.8

l VIET NAM HUMAN DEVELOPMENT REPORT 2015186
Mul
ti-
dim
ensi
onal
po
vert
y in
dex
(MPI
)
Mul
tidi
men
sion
al
pove
rty
Prop
orti
on o
f poo
r hou
seho
lds
depr
ived
in e
ach
indi
cato
r (%
)Pr
opor
tion
of p
oor
hous
ehol
ds d
epri
ved
in e
ach
indi
cato
r (%
)
H
*AH
ead
coun
t
Ínte
nsit
yof
de
priv
atio
nEd
ucat
ion
Hea
lth
Hou
sing
Safe
dri
nkin
g w
ater
and
sa
nita
tion
Info
rmat
ion
Acc
essi
bilit
y
H (%
)A
(%)
Adul
t ed
ucat
ion
leve
l
Child
Sc
hool
A
tten
danc
e
Hea
lth
insu
ranc
eQ
ualit
y of
ho
use
Livi
ng
area
Acce
ss to
sa
fe d
rinki
ng
wat
er
Acce
ss to
hy
gien
ic
toile
t
Acce
ssib
ility
to
com
mun
icat
ion
serv
ice
Ass
et fo
r in
form
atio
n ac
cess
ibili
ty
Phu
Tho
0.05
6614
.938
.05.
51.
27.
78.
62.
54.
510
.96.
04.
1
Than
h H
oa0.
0691
17.9
38.7
6.7
0.8
7.8
6.4
6.0
6.4
13.2
12.4
2.6
Ngh
e A
n0.
0667
16.0
41.6
8.3
1.5
6.8
7.0
3.2
6.9
13.9
8.5
3.8
Ha
Tinh
0.03
519.
138
.52.
20.
46.
75.
11.
02.
75.
74.
23.
6
Qua
ng B
inh
0.08
0420
.539
.29.
51.
711
.75.
73.
16.
715
.915
.32.
8
Qua
ng T
ri0.
0964
22.2
43.4
10.6
3.9
9.7
6.4
14.5
9.5
18.1
11.0
3.1
Thua
Thi
en H
ue0.
0489
12.5
39.1
6.7
1.3
6.5
1.9
4.5
4.9
8.7
6.2
3.3
Da
Nan
g Ci
ty0.
0071
1.9
36.7
0.9
0.2
1.6
0.2
0.8
0.5
0.2
1.1
0.9
Qua
ng N
am0.
0715
18.1
39.5
9.2
1.3
7.1
7.2
4.5
5.8
13.7
11.7
3.8
Qua
ng N
gai
0.08
7121
.540
.511
.41.
79.
83.
37.
38.
318
.513
.84.
1
Binh
Din
h0.
0703
18.8
37.4
8.7
1.1
14.3
1.3
3.0
6.4
17.3
7.4
3.7
Phu
Yen
0.07
5219
.838
.111
.52.
717
.02.
15.
83.
016
.27.
02.
5
Khan
h H
oa0.
0655
17.1
38.4
11.1
2.1
11.7
3.7
6.6
5.2
9.1
6.5
3.0
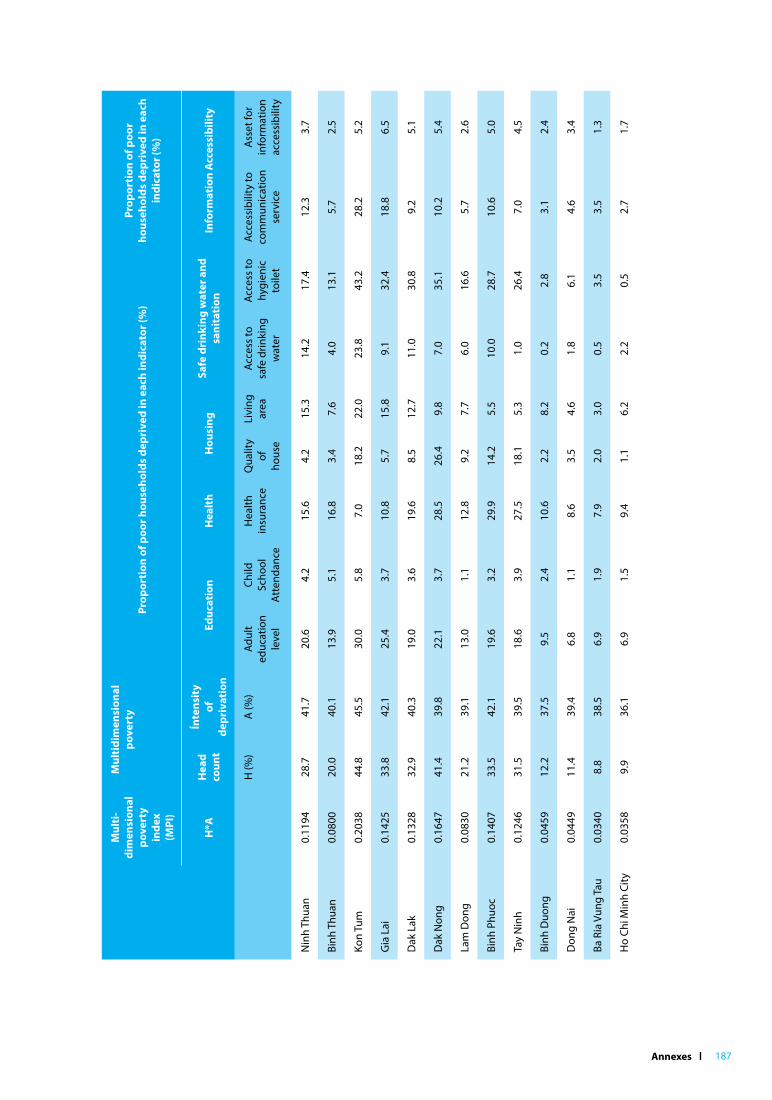
Annexes l 187
Mul
ti-
dim
ensi
onal
po
vert
y in
dex
(MPI
)
Mul
tidi
men
sion
al
pove
rty
Prop
orti
on o
f poo
r hou
seho
lds
depr
ived
in e
ach
indi
cato
r (%
)Pr
opor
tion
of p
oor
hous
ehol
ds d
epri
ved
in e
ach
indi
cato
r (%
)
H
*AH
ead
coun
t
Ínte
nsit
yof
de
priv
atio
nEd
ucat
ion
Hea
lth
Hou
sing
Safe
dri
nkin
g w
ater
and
sa
nita
tion
Info
rmat
ion
Acc
essi
bilit
y
H (%
)A
(%)
Adul
t ed
ucat
ion
leve
l
Child
Sc
hool
A
tten
danc
e
Hea
lth
insu
ranc
eQ
ualit
y of
ho
use
Livi
ng
area
Acce
ss to
sa
fe d
rinki
ng
wat
er
Acce
ss to
hy
gien
ic
toile
t
Acce
ssib
ility
to
com
mun
icat
ion
serv
ice
Ass
et fo
r in
form
atio
n ac
cess
ibili
ty
Nin
h Th
uan
0.11
9428
.741
.720
.64.
215
.64.
215
.314
.217
.412
.33.
7
Binh
Thu
an0.
0800
20.0
40.1
13.9
5.1
16.8
3.4
7.6
4.0
13.1
5.7
2.5
Kon
Tum
0.20
3844
.845
.530
.05.
87.
018
.222
.023
.843
.228
.25.
2
Gia
Lai
0.14
2533
.842
.125
.43.
710
.85.
715
.89.
132
.418
.86.
5
Dak
Lak
0.13
2832
.940
.319
.03.
619
.68.
512
.711
.030
.89.
25.
1
Dak
Non
g0.
1647
41.4
39.8
22.1
3.7
28.5
26.4
9.8
7.0
35.1
10.2
5.4
Lam
Don
g0.
0830
21.2
39.1
13.0
1.1
12.8
9.2
7.7
6.0
16.6
5.7
2.6
Binh
Phu
oc0.
1407
33.5
42.1
19.6
3.2
29.9
14.2
5.5
10.0
28.7
10.6
5.0
Tay
Nin
h0.
1246
31.5
39.5
18.6
3.9
27.5
18.1
5.3
1.0
26.4
7.0
4.5
Binh
Duo
ng0.
0459
12.2
37.5
9.5
2.4
10.6
2.2
8.2
0.2
2.8
3.1
2.4
Don
g N
ai0.
0449
11.4
39.4
6.8
1.1
8.6
3.5
4.6
1.8
6.1
4.6
3.4
Ba R
ia V
ung
Tau
0.03
408.
838
.56.
91.
97.
92.
03.
00.
53.
53.
51.
3
Ho
Chi M
inh
City
0.03
589.
936
.16.
91.
59.
41.
16.
22.
20.
52.
71.
7
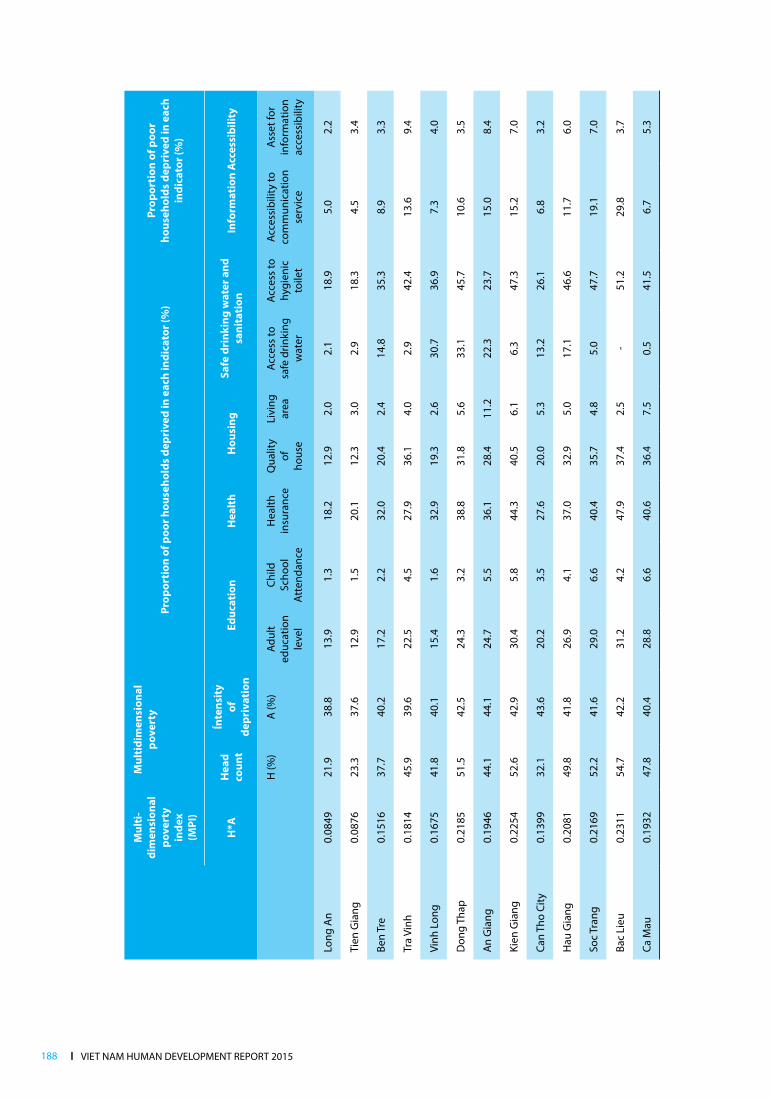
l VIET NAM HUMAN DEVELOPMENT REPORT 2015188
Mul
ti-
dim
ensi
onal
po
vert
y in
dex
(MPI
)
Mul
tidi
men
sion
al
pove
rty
Prop
orti
on o
f poo
r hou
seho
lds
depr
ived
in e
ach
indi
cato
r (%
)Pr
opor
tion
of p
oor
hous
ehol
ds d
epri
ved
in e
ach
indi
cato
r (%
)
H
*AH
ead
coun
t
Ínte
nsit
yof
de
priv
atio
nEd
ucat
ion
Hea
lth
Hou
sing
Safe
dri
nkin
g w
ater
and
sa
nita
tion
Info
rmat
ion
Acc
essi
bilit
y
H (%
)A
(%)
Adul
t ed
ucat
ion
leve
l
Child
Sc
hool
A
tten
danc
e
Hea
lth
insu
ranc
eQ
ualit
y of
ho
use
Livi
ng
area
Acce
ss to
sa
fe d
rinki
ng
wat
er
Acce
ss to
hy
gien
ic
toile
t
Acce
ssib
ility
to
com
mun
icat
ion
serv
ice
Ass
et fo
r in
form
atio
n ac
cess
ibili
ty
Long
An
0.08
4921
.938
.813
.91.
318
.212
.92.
02.
118
.95.
02.
2
Tien
Gia
ng0.
0876
23.3
37.6
12.9
1.5
20.1
12.3
3.0
2.9
18.3
4.5
3.4
Ben
Tre
0.15
1637
.740
.217
.22.
232
.020
.42.
414
.835
.38.
93.
3
Tra
Vinh
0.18
1445
.939
.622
.54.
527
.936
.14.
02.
942
.413
.69.
4
Vinh
Lon
g0.
1675
41.8
40.1
15.4
1.6
32.9
19.3
2.6
30.7
36.9
7.3
4.0
Don
g Th
ap0.
2185
51.5
42.5
24.3
3.2
38.8
31.8
5.6
33.1
45.7
10.6
3.5
An
Gia
ng0.
1946
44.1
44.1
24.7
5.5
36.1
28.4
11.2
22.3
23.7
15.0
8.4
Kien
Gia
ng0.
2254
52.6
42.9
30.4
5.8
44.3
40.5
6.1
6.3
47.3
15.2
7.0
Can
Tho
City
0.13
9932
.143
.620
.23.
527
.620
.05.
313
.226
.16.
83.
2
Hau
Gia
ng0.
2081
49.8
41.8
26.9
4.1
37.0
32.9
5.0
17.1
46.6
11.7
6.0
Soc
Tran
g0.
2169
52.2
41.6
29.0
6.6
40.4
35.7
4.8
5.0
47.7
19.1
7.0
Bac
Lieu
0.23
1154
.742
.231
.24.
247
.937
.42.
5-
51.2
29.8
3.7
Ca M
au0.
1932
47.8
40.4
28.8
6.6
40.6
36.4
7.5
0.5
41.5
6.7
5.3
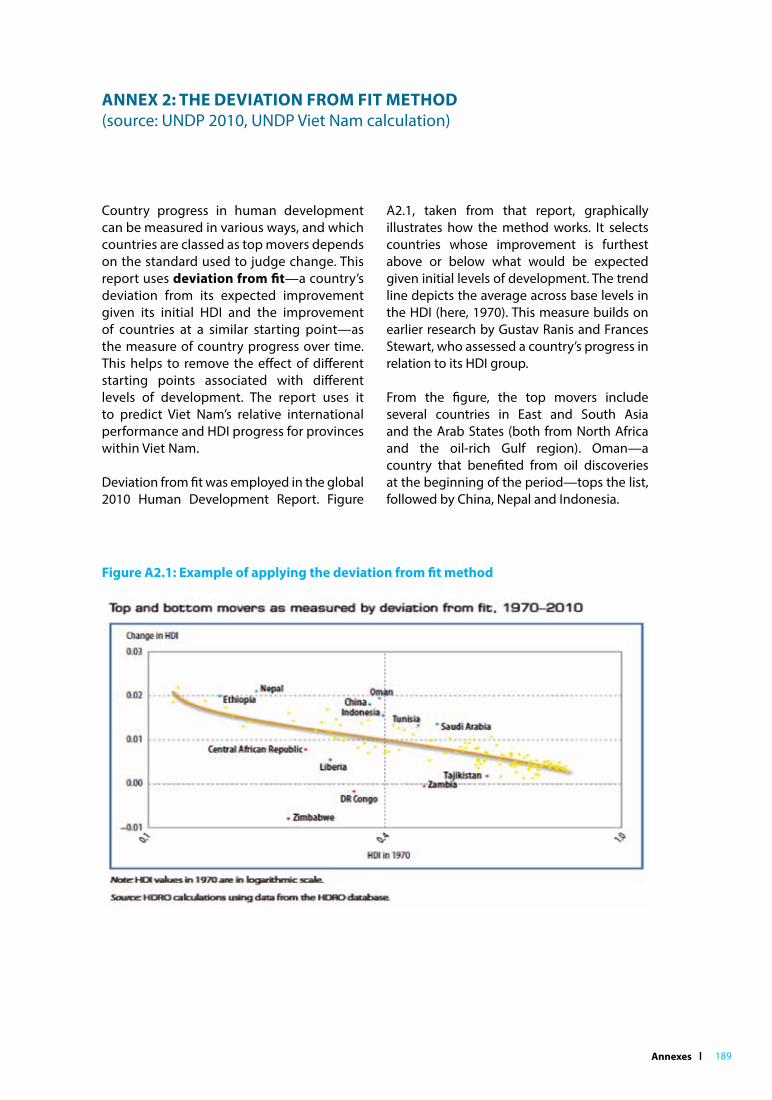
Annexes l 189
Country progress in human development can be measured in various ways, and which countries are classed as top movers depends on the standard used to judge change. This report uses deviation from fit—a country’s deviation from its expected improvement given its initial HDI and the improvement of countries at a similar starting point—as the measure of country progress over time. This helps to remove the effect of different starting points associated with different levels of development. The report uses it to predict Viet Nam’s relative international performance and HDI progress for provinces within Viet Nam.
Deviation from fit was employed in the global 2010 Human Development Report. Figure
A2.1, taken from that report, graphically illustrates how the method works. It selects countries whose improvement is furthest above or below what would be expected given initial levels of development. The trend line depicts the average across base levels in the HDI (here, 1970). This measure builds on earlier research by Gustav Ranis and Frances Stewart, who assessed a country’s progress in relation to its HDI group.
From the figure, the top movers include several countries in East and South Asia and the Arab States (both from North Africa and the oil-rich Gulf region). Oman—a country that benefited from oil discoveries at the beginning of the period—tops the list, followed by China, Nepal and Indonesia.
ANNEX 2: THE DEVIATIoN FRoM FIT METHoD (source: UNDP 2010, UNDP Viet Nam calculation)
Figure A2.1: Example of applying the deviation from fit method
l VIET NAM HUMAN DEVELOPMENT REPORT 2015190
Technically, the approach uses regression techniques to enable the comparison of countries with different developmental starting points. It uses the residual from a regression of log changes in the HDI on the initial log HDI level to measure a country’s distance from the group (level) average. This method measures how well a country does relative to other countries starting out at the same point.
This report followed a three-stage estimation process (for countries and for Viet Nam’s provinces):
1. It regressed the logarithm of the average annual growth rate (AAGR) on the logarithm of the base year HDI. This was estimated by the second order polynomial regression.
2. Using the estimated parameters of this polynomial regression, the expected values of the log of AAGR for the full period were estimated for each country.
3. The residual—the difference of the log of the observed AAGR and log of expected AAGR—was calculated for each country.
These resiuals are then the deviations from fit. A positive difference means that a country or (province) performed better than expected, while a negative is the opposite. Countries are ranked, so that the largest positive deviation is assigned 1.
For an internat ional comparison (chapter 1.2), the report used 141 countries and three sub-periods of 1990-2000, 2000-2008 and 2008-2013 for the regression to establish the deviation from fit results. It only provides the ranking of Viet Nam versus other Asian nations (second time ranking).
For Viet Nam’s provinces (chapter 1.2), the report employed data from all 63 provinces over 2004-2012. It lists both ranks and values. These are displ ayed against HDI levels to categorize the performance of provinces four ways, as shown in the main report. Below is the list of provinces based on their deviation from fit ranking, in contrast with their ranking based on annua l average growth rate. In some cases, the gaps in the two rankings are quite considerable.
List of provinces based on deviation from fit ranking, 2004-2012
HDI (2012)Deviation from fit: ln(AAGR)-Expected
ln(AAGR)
Rank (the lower number
the better)
Rank (on AAGR)
Cần Thơ 0.788 0.428239 1 7
Gia Lai 0.689 0.424275 2 1
Tiền Giang 0.770 0.3821 3 6
Hậu giang 0.743 0.360264 4 4
Long An 0.764 0.279129 5 12
Bình Phước 0.734 0.270999 6 10
Kon Tum 0.656 0.248096 7 2
Bắc Ninh 0.771 0.24055 8 19
Phú Yên 0.728 0.230863 9 11
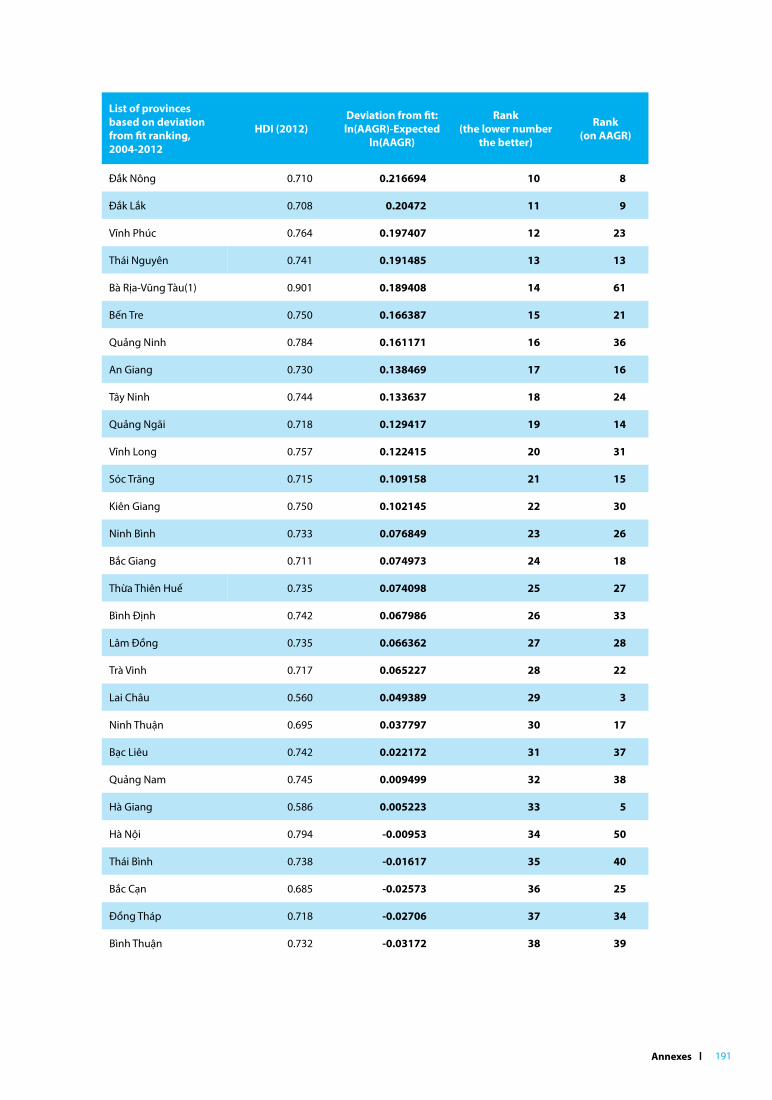
Annexes l 191
List of provinces based on deviation from fit ranking, 2004-2012
HDI (2012)Deviation from fit: ln(AAGR)-Expected
ln(AAGR)
Rank (the lower number
the better)
Rank (on AAGR)
Đắk Nông 0.710 0.216694 10 8
Đắk Lắk 0.708 0.20472 11 9
Vĩnh Phúc 0.764 0.197407 12 23
Thái Nguyên 0.741 0.191485 13 13
Bà Rịa-Vũng Tàu(1) 0.901 0.189408 14 61
Bến Tre 0.750 0.166387 15 21
Quảng Ninh 0.784 0.161171 16 36
An Giang 0.730 0.138469 17 16
Tây Ninh 0.744 0.133637 18 24
Quảng Ngãi 0.718 0.129417 19 14
Vĩnh Long 0.757 0.122415 20 31
Sóc Trăng 0.715 0.109158 21 15
Kiên Giang 0.750 0.102145 22 30
Ninh Bình 0.733 0.076849 23 26
Bắc Giang 0.711 0.074973 24 18
Thừa Thiên Huế 0.735 0.074098 25 27
Bình Định 0.742 0.067986 26 33
Lâm Đồng 0.735 0.066362 27 28
Trà Vinh 0.717 0.065227 28 22
Lai Châu 0.560 0.049389 29 3
Ninh Thuận 0.695 0.037797 30 17
Bạc Liêu 0.742 0.022172 31 37
Quảng Nam 0.745 0.009499 32 38
Hà Giang 0.586 0.005223 33 5
Hà Nội 0.794 -0.00953 34 50
Thái Bình 0.738 -0.01617 35 40
Bắc Cạn 0.685 -0.02573 36 25
Đồng Tháp 0.718 -0.02706 37 34
Bình Thuận 0.732 -0.03172 38 39

l VIET NAM HUMAN DEVELOPMENT REPORT 2015192
List of provinces based on deviation from fit ranking, 2004-2012
HDI (2012)Deviation from fit: ln(AAGR)-Expected
ln(AAGR)
Rank (the lower number
the better)
Rank (on AAGR)
Lào Cai 0.670 -0.03487 39 20
Quảng Trị 0.696 -0.04446 40 29
Lạng Sơn 0.707 -0.06046 41 35
Hưng Yên 0.743 -0.07245 42 46
Đà Nẵng 0.803 -0.08463 43 57
Quảng Bình 0.716 -0.09112 44 42
Cà Mau 0.743 -0.11518 45 47
Nam Định 0.726 -0.1181 46 44
Tuyên Quang 0.699 -0.13089 47 41
TP. Hồ Chí Minh 0.820 -0.14697 48 62
Thanh Hóa 0.716 -0.14764 49 45
Cao Bằng 0.653 -0.15483 50 32
Hải Phòng 0.773 -0.16376 51 54
Hà Tĩnh 0.725 -0.20603 52 49
Hòa Bình(1) 0.715 -0.22786 53 48
Đồng Nai 0.763 -0.25263 54 60
Phú Thọ 0.715 -0.26683 55 51
Khánh Hòa 0.752 -0.27083 56 58
Hải Dương 0.746 -0.2972 57 59
Hà Nam 0.724 -0.31472 58 53
Sơn La 0.634 -0.3336 59 43
Nghệ An 0.715 -0.3571 60 55
Bình Dương 0.751 -0.41111 61 63
Yên Bái 0.657 -0.4308 62 52
Điện Biên 0.611 -0.63017 63 56
Full datasets for both exercises are available on request from UNDP Viet Nam.
Annexes l 193
Debates over the causal links between economic growth and inequality are long running. The standard position has been that some inequality is central to incentives within a market economy. Therefore, a trade-off existed—some inequality is beneficial for economic growth. Very early on, however, structuralist economists countered this notion by highlighting how the maldistribution of assets and land could be a major constraint on productivity.
Kuznets (1955) showed empirically that there is an inverted U-shaped relationship between inequality and growth. As such, inequality rises during the early and middle stages of development, and then declines during the later stages. Kuznets explained initially worsening distribution in terms of a process of unequal opportunities and bottlenecks that occurs with structural change, and its progressive improvement as these biases decline. For example, an initially restricted number of skilled workers enjoys privileged access to opportunities, but this advantage declines as the supply of workers improves with development. Hence, inequality is a natural outcome of the growth process. This side of the debate featured some unlikely alliances, with the heterodox economist Kaldor, for example, arguing that higher inequality tends to
favour higher growth via greater aggregate savings.
But the record of worsening inequality in some developed economies from the 1970s onward, and the maintenance of relatively low inequality in the East Asian Tigers, raised major doubts. Econometric critiques, which discredited Kuznets’ findings, provided further support to those who questioned inequality’s positive impact on growth.
In the 1990s, a variety of thinkers went further, finding that inequality reduces growth, especially in developing countries. Their ideas underpin the new emphasis on inclusive growth. They focused on two broad channels. The first is the impact of inequality on credit constraints in capital markets (Aghion et al, 1999), and especially, as a result, the distribution and take up of human capital (Lipton, 1997). The second involves political economy tensions and a host of institutional failures within unequal states (Alesina and Rodrik,1994).
While the debates continue, overall, the consensus position has shifted. Lower inequality (especially in the distribution of assets) is held to be causally positive in the longer term for economic performance, with the proviso that specific country conditions remain important.
ANNEX 3: THE RELATIoNSHIP BETWEEN ECoNoMIC GRoWTH AND INEQuALITY
l VIET NAM HUMAN DEVELOPMENT REPORT 2015194
Governments can ensure that growth is more inclusive by facilitating the development of new sectors that create entrepreneurial and productive employment opportunities open to broader segments of society. But to be sustainable, these strategies have to ensure the eventual emergence of competitive firms and activities that can survive beyond the policy support that helped them to emerge.
In developing countries, the sectors most likely to drive inclusive growth are in medium technology. These are intermediate in terms of technological sophistication. Compared to high-technology sectors, they require less capital and generate more employment, and compared to low-technology sectors, they offer higher wages and rates of wage growth.
Medium-technology sectors include many ‘supporting industries’ that provide
inputs to more sophisticated final product producers and assemblers, which are more likely to be global multinational companies. Without local clusters of supporting industries, higher technology sectors, dominated by multinationals, will either not arrive, or if they do, they are likely to import most of their required components from abroad, with limited creation of local employment and entrepreneurial opportunities.
For an inclusive growth strategy in countries like Viet Nam, the active promotion of competitive medium-technology sectors, particularly in component producing clusters, is therefore essential. The importance of this is likely to grow as Viet Nam increasingly seeks greater regional and global integration.
Source: Mushtaq Khan (2015).
ANNEX 4: THE IMPoRTANCE oF THE MEDIuM-TECHNoLoGY SECToR FoR INCLuSIVE GRoWTH

Annexes l 195
Scheme Selection criteria Number of recipients Value of transfer (VND per month)1
Child support
Children without parental support
Without parental support2 and a) under 4, b) 4-16 years old and c) aged 16-22 and in education
58,6503 250,000 (<4 years)180,000 (4+ years)
Children with HIV Children with HIV (on poor households list)
Subsumed under the number of 3,703 children and people living with HIV
250,000
Children with a disability Set out in law on persons with disabilities
Subsumed under the number of 9,000 children and elderly recipients of the disability benefit
450,000
School stipend/fee exemption (Decrees 49 and 74)
Children at school and on the Poor List
4,868,280 70,000 (9 months/year )
Secondary school stipend (Decision 12)
Ethnic minority and poor Kinh children in secondary education
139,130 460,000 (9 months/year )
Boarding school stipend (Decision 82)
Ethnic minority and poor Kinh children in secondary education
45,224 115,000 (9 months/year )
Lunch support for students (Decisions 239, 60 and 85)
Students-children of household on the Poor List
1,231,683 Around VND 1 million/year (school year)
ANNEX 5: MAjoR CHILD SuPPoRT AND DISABILITY BENEFIT CASH TRANSFER SCHEMES IN 2014
1. These are values according to national policies. Some provinces with budget surpluses provide higher values, while some individuals and families can receive higher multipliers.
2. The categories of children without care are set out in Decree 136/2013.
3. Around 5,000 households that adopted abandoned children under four years of age receive ‘social care’ (carer) support of VND 540,000 per month, and 10,000 households that adopted abandoned children above four years of age receive VND 360,000 per month (MOLISA 2015).
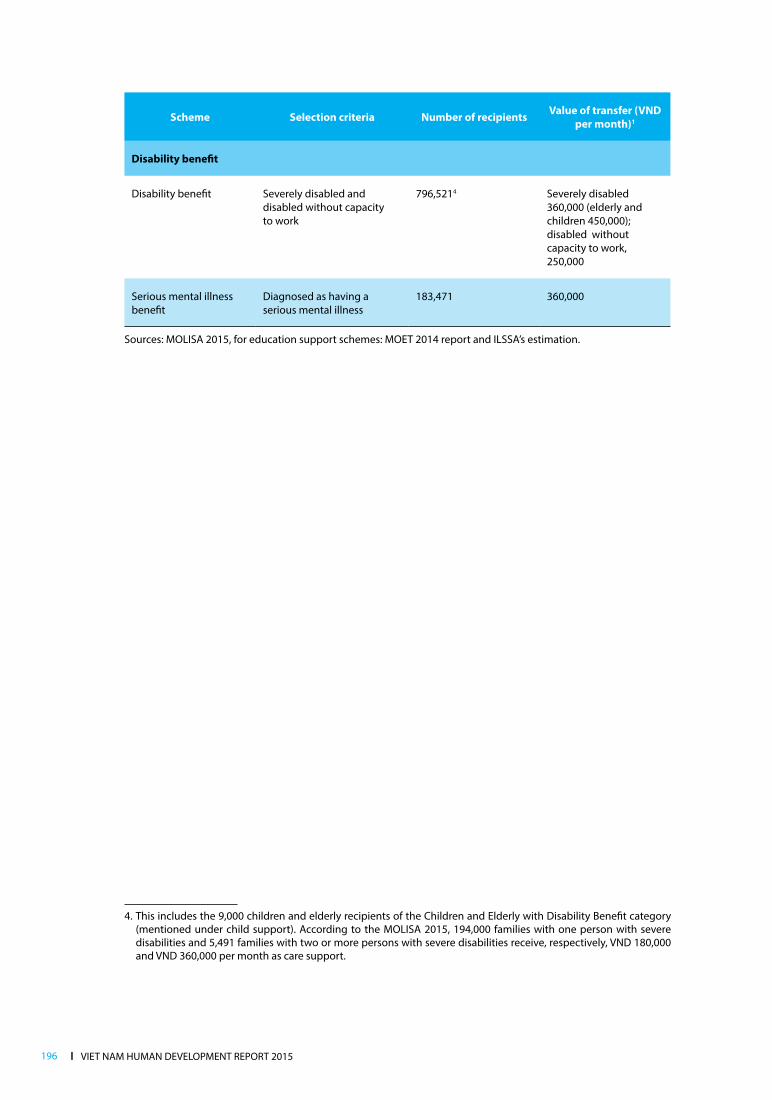
l VIET NAM HUMAN DEVELOPMENT REPORT 2015196
Scheme Selection criteria Number of recipients Value of transfer (VND per month)1
Disability benefit
Disability benefit Severely disabled and disabled without capacity to work
796,5214 Severely disabled 360,000 (elderly and children 450,000); disabled without capacity to work, 250,000
Serious mental illness benefit
Diagnosed as having a serious mental illness
183,471 360,000
Sources: MOLISA 2015, for education support schemes: MOET 2014 report and ILSSA’s estimation.
4. This includes the 9,000 children and elderly recipients of the Children and Elderly with Disability Benefit category (mentioned under child support). According to the MOLISA 2015, 194,000 families with one person with severe disabilities and 5,491 families with two or more persons with severe disabilities receive, respectively, VND 180,000 and VND 360,000 per month as care support.
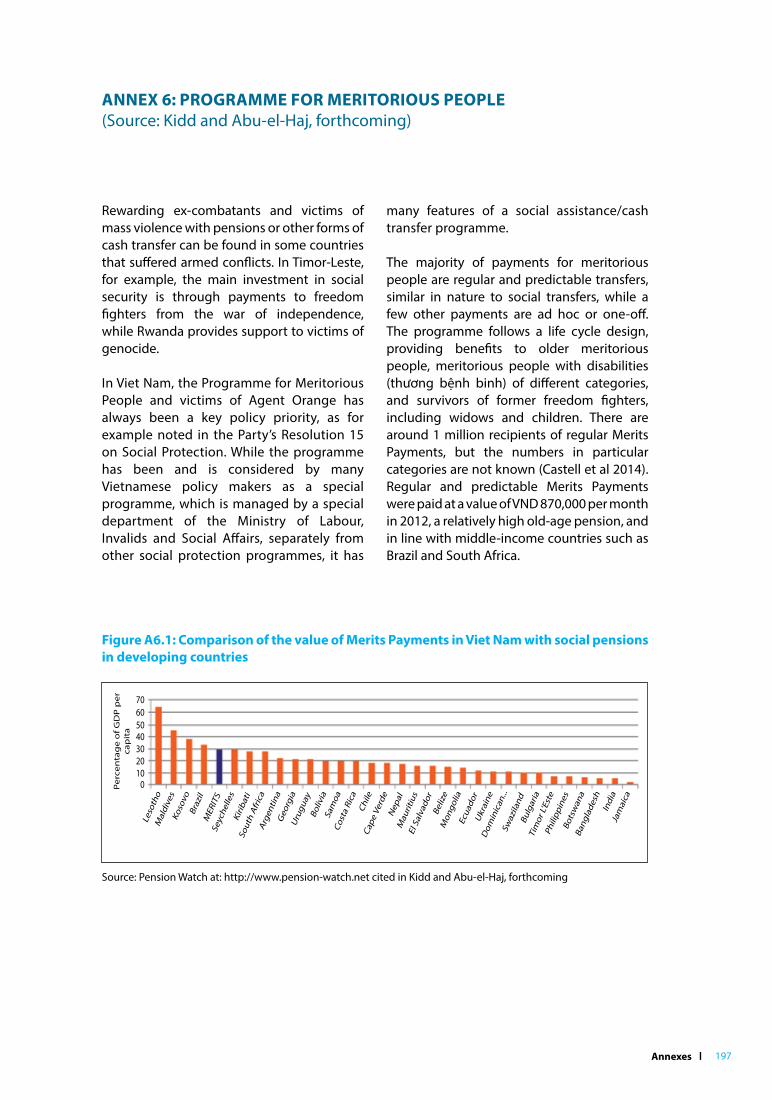
Annexes l 197
Rewarding ex-combatants and victims of mass violence with pensions or other forms of cash transfer can be found in some countries that suffered armed conflicts. In Timor-Leste, for example, the main investment in social security is through payments to freedom fighters from the war of independence, while Rwanda provides support to victims of genocide.
In Viet Nam, the Programme for Meritorious People and victims of Agent Orange has always been a key policy priority, as for example noted in the Party’s Resolution 15 on Social Protection. While the programme has been and is considered by many Vietnamese policy makers as a special programme, which is managed by a special department of the Ministry of Labour, Invalids and Social Affairs, separately from other social protection programmes, it has
many features of a social assistance/cash transfer programme.
The majority of payments for meritorious people are regular and predictable transfers, similar in nature to social transfers, while a few other payments are ad hoc or one-off. The programme follows a life cycle design, providing benefits to older meritorious people, meritorious people with disabilities (thương bệnh binh) of different categories, and survivors of former freedom fighters, including widows and children. There are around 1 million recipients of regular Merits Payments, but the numbers in particular categories are not known (Castell et al 2014). Regular and predictable Merits Payments were paid at a value of VND 870,000 per month in 2012, a relatively high old-age pension, and in line with middle-income countries such as Brazil and South Africa.
ANNEX 6: PRoGRAMME FoR MERIToRIouS PEoPLE (Source: Kidd and Abu-el-Haj, forthcoming)
Figure A6.1: Comparison of the value of Merits Payments in Viet Nam with social pensions in developing countries
Source: Pension Watch at: http://www.pension-watch.net cited in Kidd and Abu-el-Haj, forthcoming

l VIET NAM HUMAN DEVELOPMENT REPORT 2015198
Although it is commonly assumed that Merits Payments are captured by the more affluent members of society, the reality appears to be different. Figure A6.2 shows targeting incidence is very progressive, with the majority of recipients in the poorest deciles: 65 percent of recipients are in the poorest 40 percent of the population, which compares very well with many poverty schemes in
developing countries. This may be the result of many Merits Payments being given to people with disabilities, who, without the payment, may find it difficult to gain an independent income. Indeed, their presence in households may depress incomes if they also require significant levels of care, meaning that other household members are unable to access employment.
Figure A6.2: Targeting incidence of Merits Payments
Note: VHLSS 2012. The graph uses pre-transfer consumption deciles.Source: Kidd and Abu-el-Haj, forthcoming
The analysis of VHLSS 2012 data shows that the Merits Payments reduce the national poverty rate by 2.9 percent. The poverty rate would be 17.68 percent in the absence of these payments, rather than 17.2 percent. The Merits Payments have also had positive impacts on older people. The receipt of a payment moves a significant proportion of older people out of the lowest income decile, while others move into the upper-middle consumption deciles. Much of this movement is the result of these payments having a reasonable value.
The programme, despite targeting a small proportion of the population, will likely continue to be an integral and important part of Viet Nam’s social security system. It demonstrates that if transfers are paid at a level consistent with international good practice, impacts on household well-being can be significant. Further, a progressive approach is possible without the explicit targeting of poor households. The programme offers something of an example to the social assistance system as a whole, and demonstrates the potential of social assistance transfers to reduce poverty and insecurity.
Annexes l 199
Consistent data on social protection finance from different sources—including the Ministry of Labour, Invalids and Social Affairs, its different departments and sources, and the Ministry of Finance—are difficult to obtain. Based on data collection for this National Human Development Report, some root causes of this problem can be identified. The first involves clarity and consistency in applying the definitions of social protection and its sub-components. While conceptually the four pillars of social protection—social insurance, social assistance (with its three sub-pillars of regular cash transfers, emergency support and social care), poverty reduction and labour market solutions, and basic social services—as defined in Resolution 15 seem to be in line with the social protection concept promoted by several international organizations, consistent understanding is not applied in policies and the design of schemes. There seems to be confusion in classifying expenditures as ‘social protection’, especially those related to social assistance and poverty reduction, including expenditures on infrastructure and production support in the poorest communes under the national targeted programmes for poverty reduction, immunization programmes, and other cash/in-kind support to poor households and their communities (such as for land and housing, water and sanitation, resettlement, subsidies on essential consumer goods, etc.).
The health insurance subsidy (with no direct cash transfers to beneficiaries), school fee exemptions/stipends for poor students (with direct and rather regular cash transfers to beneficiaries over nine months/year) and monthly electricity subsidies for poor households using less than 50KWh per month, for example, are classified under
Resolution 15’s pillar of basic social services, rather than under insurance and regular transfer/social assistance pillars as might be expected based on the international definition.
Secondly, this confusion seems to contribute to, and become more serious as the result of, the classification of many different expenditures—though still under the broad definition of the concept/pillars of social protection—under one budget line of ‘social assurance’ (in local government budgets) and/or ‘wrapped’ in the budgets of multipurpose national targeted programs for poverty reduction, especially prior to 2010. This, together with the decentralization of funding and provision of social protection to local level governments without enforcement of clear and disaggregated financial recording and reporting, makes it almost impossible to obtain precise budget and expenditure data disaggregated by programmes and policies as well as by localities, gender, ethnicities and sometime by ages.
Thirdly, many assistance policies issued by the central level allow the local provincial level to increase coverage by altering beneficiary selection criteria and benefit levels as local fiscal conditions allow. For example, many ‘self-financed’ provinces, in implementation of the Social Pension Scheme, have lowered the age limit from 80 years to 75 or 70, and increased the benefit level from VND 180,000 per month to around VND 350,000. Some provinces also apply a much higher poverty line, which is also used to identify beneficiaries of social assistance and other social protection support. This results in additional expenditures of local governments on such ‘altered’ social assistance programmes/schemes from local sources of revenue, but due to current recording, reporting and data-sharing practices, such expenditures are not
ANNEX 7: SoCIAL PRoTECTIoN EXPENDITuRE DATA
l VIET NAM HUMAN DEVELOPMENT REPORT 2015200
captured precisely and with sufficient detail at the national level.
Last, current data recording, reporting and dissemination, as the result of inconsistent understanding and application of definitions and classifications, are not standardized, and modern tools are not available or used by different players at different levels.
These issues, together with others related to the governance of the social protection system and service delivery, make it almost impossible to identify consistent data needed for vigorously monitoring and analysing the financial situation, and hamper the possibility for assessing impacts, and ensuring transparency and accountability in social protection and social assistance programmes.

Annexes l 201
According to Sen (1995), Pritchett (2005), Mkandawire (2005) and Kidd et al. (2014), based on various political economy considerations, countries adopt a wide range of different approaches to selecting recipients of social transfers. The key motivation for poverty targeting is cost: Social transfers to a smaller number of people living in poverty will require fewer resources than those targeting a larger number of beneficiaries. The motivation for poverty targeting is also based on the assumption of a ‘limited’ (or fixed) budget.
The key motivation for ‘universal’ or ‘category’ targeted programmes with higher coverage tends to be the recognition of the social and economic benefits of social transfers as well as the political benefits that high coverage can bring to governments, due to their popularity. This motivation often leads policy makers who are proponents of the social protection rights of all citizens, as, for example, guaranteed in the Constitution of Viet Nam, to endorse schemes with larger budgets. Many so-called ‘universal’ programmes do have target beneficiaries, by categories, other than the ‘poor’, such as the elderly over age 80, meritorious people, ethnic minorities, people with severe disabilities, children under six years of age or pregnant women, etc. These schemes should be called ‘category targeted’ rather than ‘universal’, which could be confusing. To avoid confusion, this report refers to ‘poverty’ and ‘category’ targeted approaches.
Many countries use a mix of these two beneficiary selection approaches in their social transfer schemes and even within a scheme. In Viet Nam, there are category targeted schemes with high coverage and budgets, social transfer schemes such as social pensions and the Merits Programme, and schemes that target the poor such
as school fee exemptions/stipends or electricity support. Even within poverty or category targeted programmes, as Pritchett (2005) shows, during implementation, local governments may allow changes in the selection of beneficiaries to make the programmes more politically popular or widely accepted. This can also be seen in Viet Nam where some provinces make changes in beneficiary selection criteria and benefit levels compared to central policies.
Within category targeted schemes, there are elements of poverty targeting (for example, with conditions that would exclude the ‘rich’ using tools to test for affluence) and vice versa. Besides the category targeted policy of free health insurance for children under six year of age, the health insurance subsidy to the poor and near poor households is also used. Both aim at contributing to universal coverage. Within this poverty targeting approach, the health insurance subsidy for the poor is made ‘universal’ in the poorest ethnic minority communes (i.e., all poor and non-poor residents of the poorest communes are considered eligible for the health insurance subsidy).
While universal and category targeted schemes tend to have higher coverage and budgets, and poverty targeted schemes tend to be lower on both counts, in both theory and practice, this may not be the case. The coverage and budget of poverty targeted social transfer schemes can be adjusted by applying different poverty or poverty reduction policy lines and levels of benefits, as has been done in Viet Nam. Similarly, the coverage and budget of ‘universal’ schemes can also be adjusted by the definition of eligible beneficiary categories—such as people over age 80 without a formal pension, or people with severe disabilities or mental problems, or
ANNEX 8: BENEFICIARY SELECTIoN MECHANISMS

l VIET NAM HUMAN DEVELOPMENT REPORT 2015202
children under six years of age—and in the levels of benefits.
This basically suggests that both beneficiary selection approaches can be used when it comes to addressing budget constraints, an important consideration in designing social transfers in developing countries. The key question is which beneficiary selection approaches and levels of benefits will maximize outcomes, socially, economically and politically, and minimize the cost of administration of social transfers. It is important to understand the ‘targeting efficacy’ of different beneficiary selection methods, and consider their application in each scheme.5
Targeting efficacy of poverty targeted schemes
In developed countries, where most people are in the formal sector, it is possible to use means-testing to accurately measure incomes. In most developing countries, however, where most people are either in the informal or subsistence sectors, it is not possible to accurately identify those living in poverty. As a result, in middle-income countries, all mechanisms used to target the poor with different methods of defining poor households, including proxy means testing, though implemented with high administrative costs, have high errors. For example, the Bolsa Familia scheme in Brazil and Mexico’s Oportunidades programme—both of which are regarded as well-targeted—exclude 49 percent and 70 percent, respectively, of their target populations. Both aim to reach approximately one-fifth of households nationally (Veras et al. 2007; Soares et al. 2010).
Even affluence-tested schemes exclude eligible people. For example, South Africa’s
Child Support Grant covered around 60 percent of children in 2012, yet excluded 23.7 percent of those who were eligible (UNICEF and SASSA 2014). While South Africa’s old age pension reached 70 percent of the elderly population in 2004, it excluded 13 percent of those who were eligible (Samson et al 2007). Studies (such as Kidd and Wylde 2011) show that the proxy means test targeting mechanism, which has become very popular in developing countries in recent years, has particularly high errors included within its design, usually excluding over 50 percent of intended recipients even before it is implemented. Errors usually increase during the selection and registration process. Coady et al. (2004) show that inclusion errors, such as inclusion of non-poor people in schemes targeting the poor, are above 5 percent, including in means-testing schemes.
Figure A8.1 indicates the targeting incidence of Viet Nam’s Poor List nationwide, measured by the proportion of selected households found in each income decile. Overall, the Poor List, accompanied by a list of near poor, which can be used to offer fee exemptions or livelihoods programmes, includes 11.8 percent of households nationwide, which is close to the poverty rate produced by the MOLISA poverty line.
As with poverty targeted selection mechanisms in other developing countries, however, a high proportion of the poorest households are excluded from the Poor List. The figure shows around 48 percent of households in the poorest decile were not identified as poor in the Poor List and, as a result, would be unable to access any benefits from schemes that target the poor. In the second decile, which includes people highly likely to fall into the first decile if hit by a shock, almost 80 percent of households
5. A Government of India-commissioned Report of the expert group to advise the ministry of rural development on the methodology for conducting the Below Poverty Line (BPL) census for 11th Five Year Plan (Saxena et al 2009) and commentaries made an important point on the need for careful considerations in applying the line and selecting the method for identifying poor households in different poverty-targeted programmes. The main argument is that it is more effective if different targeting tools/approaches (such as area-based, self-selection/application, etc.) are used, based on suitability to different programme goals and types of services/support, rather than using the same poverty line and list of poor households for all programmes.

Annexes l 203
are not included in the Poor List, although this is mainly the result of the List’s low coverage. The list has a degree of ‘inclusion error’, with around half of beneficiaries not in the poorest 11.8 percent of the population. Further, people in some of the most affluent consumption deciles were included in the Poor List.
One alternative to the Poor List would be to implement a proxy means test. Figure A8.2 compares the Poor List coverage of wealth deciles with a theoretical proxy means test. It shows that the latter appears to perform slightly better than the Poor List. As happens in many other countries, however, in actual implementation, the proxy means test would almost certainly show worse targeting efficacy.
Figure A8.1: Targeting incidence of the Poor List, 2012, Source: VHLSS 2012.
Note: VHLSS 2012. Source: Kidd and Abu-el-Haj, forthcoming
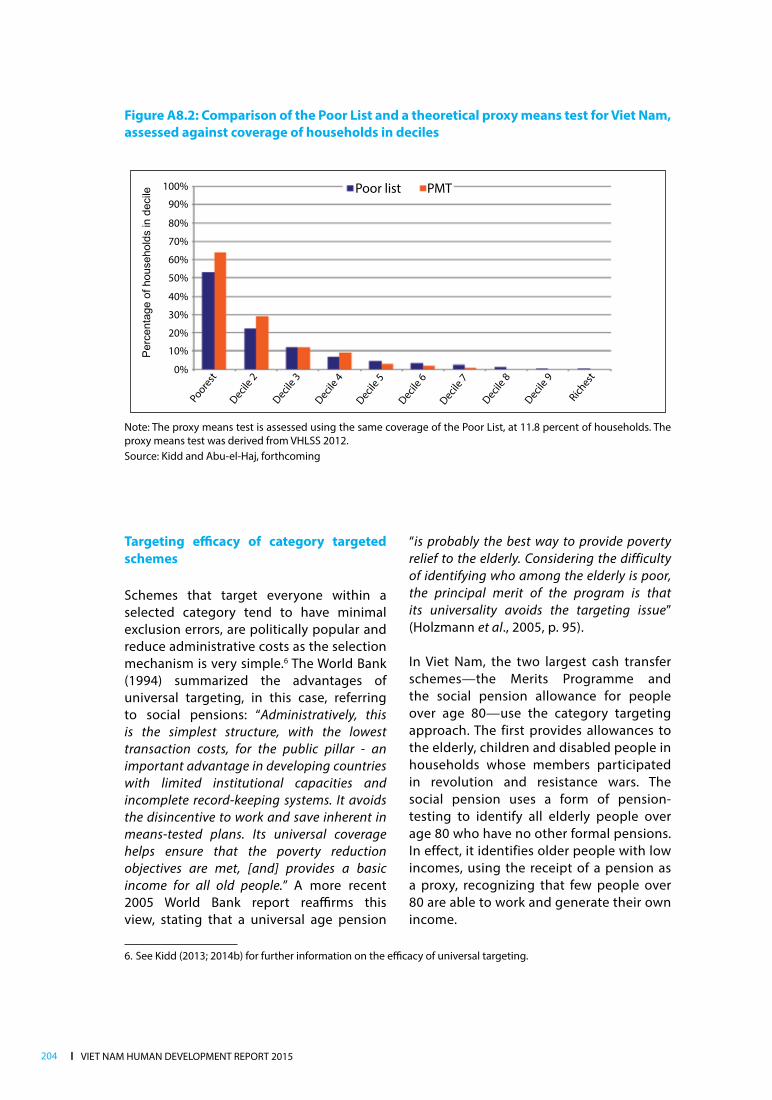
l VIET NAM HUMAN DEVELOPMENT REPORT 2015204
Targeting efficacy of category targeted schemes
Schemes that target everyone within a selected category tend to have minimal exclusion errors, are politically popular and reduce administrative costs as the selection mechanism is very simple.6 The World Bank (1994) summarized the advantages of universal targeting, in this case, referring to social pensions: “Administratively, this is the simplest structure, with the lowest transaction costs, for the public pillar - an important advantage in developing countries with limited institutional capacities and incomplete record-keeping systems. It avoids the disincentive to work and save inherent in means-tested plans. Its universal coverage helps ensure that the poverty reduction objectives are met, [and] provides a basic income for all old people.” A more recent 2005 World Bank report reaffirms this view, stating that a universal age pension
“is probably the best way to provide poverty relief to the elderly. Considering the difficulty of identifying who among the elderly is poor, the principal merit of the program is that its universality avoids the targeting issue” (Holzmann et al., 2005, p. 95).
In Viet Nam, the two largest cash transfer schemes—the Merits Programme and the social pension allowance for people over age 80—use the category targeting approach. The first provides allowances to the elderly, children and disabled people in households whose members participated in revolution and resistance wars. The social pension uses a form of pension-testing to identify all elderly people over age 80 who have no other formal pensions. In effect, it identifies older people with low incomes, using the receipt of a pension as a proxy, recognizing that few people over 80 are able to work and generate their own income.
Figure A8.2: Comparison of the Poor List and a theoretical proxy means test for Viet Nam, assessed against coverage of households in deciles
Note: The proxy means test is assessed using the same coverage of the Poor List, at 11.8 percent of households. The proxy means test was derived from VHLSS 2012.Source: Kidd and Abu-el-Haj, forthcoming
6. See Kidd (2013; 2014b) for further information on the efficacy of universal targeting.

Annexes l 205
The targeting incidence of the Merits Payments has been surprisingly progressive. Although it is not targeted at those living in poverty, more beneficiaries tend to come from the poorer wealth deciles. Similar findings apply to the social pension programme. Inclusion and exclusion errors,7 if any in these programmes, are unlikely to be the result of inherent design errors or bad targeting design per se, since the schemes use simple merit (plus age and disability) and pension (plus age) tests. Possible errors may be caused by implementation problems, such as in the social pension scheme. These include poor communications, with people not knowing how and when to apply for the scheme; challenges of access, with people living at a distance being unable to travel; a lack of identity documents; administrative challenges during registration etc.
Viet Nam also incorporates geographic targeting into its broader selection system, such as national poverty reduction programmes targeting the poorest districts
and communes as well as poor costal communes and islands, or the health insurance subsidy for the poor targeting all people in the poorest ethnic minority communes. In communes where the vast majority of people live in poverty, geographic targeting has significant advantages in reducing administrative costs and exclusion errors.
Some schemes using affluence testing or poverty targeting allow people to apply for the schemes on demand, at any time, such as the Child Support Grant in South Africa and the Targeted Social Assistance Programme in Georgia. People can be assessed against the eligibility criteria and register for the scheme at the same time. Though these schemes may have lower inclusion errors—and also exclusion errors, as by design the excluded can be considered as ‘having no demand’—such an approach requires governments to establish local-level permanent offices that can receive applications at any time and thus involves rather high administrative costs.8
7. According to the GSO 2013 Population Change Survey, the total population of people aged 80 and above was 1.825 million in 2013. If excluding those who are over 80 but are not eligible for the social pension scheme—retirees from the formal sector who already receive VSS pensions and merits, around 20 percent of the total population over age 80—the total number of eligible people is around 1.46 million, not including those under 80 who receive social pensions per the decisions of some provinces/cities to lower the entitlement age. This together with the MOLISA-reported 1.4 million beneficiaries of the social pension for those over age 80 makes coverage of the scheme around 96 percent, meaning almost universal coverage and thus almost no exclusion error.
8. See Kidd (2014b) and Kidd and Barrett (2014) for further information on on-demand targeting mechanisms.

l VIET NAM HUMAN DEVELOPMENT REPORT 2015206
Proposed social transfer schemes
Social pension as an expansion of the current 80-plus allowance scheme
The proposed old-age social pension would be offered to those aged 65 years and over. It could be known as a social pension or citizens’ pension, as it would be an entitlement offered to all citizens—and qualifying residents—as a result of their lifetime contributions to the nation. It builds on the current age 80 allowance scheme as well as its ‘variations’ at local levels in some provinces, and therefore will continue being pension tested, so that all those receiving a Merits Payment or VSS pension would not receive it. In 2012, this would have meant that 82.2 percent of people over age 65 would have been eligible for a social pension (noting potential additional requirements below).9
To reduce any possible disincentive for the working-age population to contribute to the VSS pension, universal coverage (i.e., for all people aged 65 years and over, including those with VSS pensions and Merits Programme payments) and tapering10 (for example, for every VND 100,000 received from the VSS pension or Merits Payment, the citizens’ pension could be reduced by VND 30,000) could be used. With such a design, universal coverage would be provided through a complementary mix of the social pension, social insurance pensions and Merits Payments.
The social pension’s transfer value is proposed as VND 360,000 per month. This is similar to the amount currently provided by some provinces, but is relatively low, as a share of GDP per capita, compared with other countries. It allows room
for a future increase of the transfer value as the economy and tax base grow.
The overall cost of the proposed social pension would be around 0.49 percent of GDP in 2015, a relatively low cost compared to other social pension schemes providing universal coverage in many other middle-income countries, where, as these countries develop and populations age, the costs of social pensions tend to increase to 3-4 percent of GDP. Although the population will age in future decades, the costs of the social pension would not necessarily rise, assuming the value of the pension is indexed to inflation and the per capita economic growth rate is higher than the rate of increase in the elderly pension. It is also noted that the future possible expansion of the coverage of the VSS/formal social insurance pension would limit the costs of the social pension.
Linked to this, eligibility might also be conditional on children’s participation (excluding the poor and non-poor) in the Social Insurance (VSS) Fund, either via mandatory or voluntary pension contributions. This is unlikely to restrict coverage substantially and hence costs, but it would contribute to the overall policy objective of securing sustainable and widespread social security coverage. Special provision may be needed for elderly people without children, and where children who are not already included under the poor and near poor exemptions decline to participate.
Disability benefit for working-age adults as an expansion of the current disability benefit scheme
The proposed disability benefit for working age adults would be linked to the VSS
ANNEX 9: PRoPoSED SoCIAL TRANSFER SCHEMES AND SIMuLATIoN oF IMPACTS AND CoST-EFFICIENCY ANALYSIS (Source: Kidd and Abu-el-Haj, forthcoming)
9. This estimate is taken from VHLSS 2012, since around 17.8 percent of people over age 65 already receive the VSS pension or a Merits Payment.
10. Tapering would potentially increase the cost of the social pension, but only slightly.
Annexes l 207
pension, in much the same way as the social pension and VSS formal pension schemes would complement each other. Initially, it would be provided to everyone of working age (18-65) with a severe disability, which corresponds currently to around 2.4 percent of the working age population, based on VHLSS 2006. The disability benefit is proposed as VND 360,000 per month, similar to the social pension, and is relatively low compared to the adult disability benefit in many other countries. At age 65, recipients would transfer from the disability benefit to the social pension or VSS.
Early childhood (0-4 years) benefit as an expansion and consolidation of the current child support schemes
The proposed early childhood benefit could be offered to around 70 percent of children, with priority given to those families with lower incomes. This benefit would be affluence tested, and a beneficiary selection mechanism would have to be developed that would identify those families with the highest incomes and exclude them from the scheme. This might use income tax records or other means, noting also that affluence testing tends to be easier and is better than means testing for identifying the poorest families. An alternative would be to offer the early childhood benefit to every child under four years of age, similar to health insurance targeting every child under age six, and rely on more affluent families self-excluding from the scheme, as they may find the value too small to attract them. The value of the early childhood benefit could be set at VND 120,000 per month, which is again still relatively low when compared with child benefits of many other countries that provide similar schemes.
This would also be accompanied by consolidation (hence withdrawal) of the existing child support schemes. Since the population of children is likely to fall in coming decades, the total cost of the child
benefit should also fall. This would provide some fiscal space for gradually expanding the age of eligibility and/or the level of benefit of the proposed scheme.
Child disability benefit as an expansion and consolidation of the current child support and disability schemes
The proposed child disability benefit would provide a monthly allowance to all children with a disability, starting from the most severe forms. Its value could be set at VND 360,000 per month, since the costs of caring for children with disabilities is likely to be relatively high. The cost of the benefit at national scale would be minimal—at 0.02 percent of GDP—but the impact on the lives of children and their families could be very significant.
Simulations of impacts and cost-efficiency of proposed schemes11
Simulations of impacts
The proposed schemes would significantly increase the coverage of social transfers in Viet Nam. Around 42 percent of households would receive at least one transfer, compared to the current coverage of 10.2 percent. As Figure A9.1 indicates, coverage of households living in poverty and insecurity would be relatively high. Over 60 percent of households in the poorest decile and over 50 percent in the poorest three deciles would receive a benefit. Around 40 percent of households in the ‘missing middle’—in other words, those living with insecure incomes—would also receive at least one social transfer. Coverage across all consumption deciles would be significantly higher than that provided by the current system. Coverage of households could be further increased by lowering the age for the old age pension, increasing the age of eligibility for the early childhood benefit or opening the disability benefit to people with less severe disabilities.
11. The Child Disability Benefit is not included in the simulations since it is not possible to accurately identify children with a disability. Given that the scheme is small, however, it would have minimal impact on the overall results.

l VIET NAM HUMAN DEVELOPMENT REPORT 2015208
The proposed schemes would have larger impacts on poverty and inequality than the current system of social transfers, as a result of higher coverage and transfer values. The proposed transfers, if they had taken place in 2012, together would reduce the GSO/World Bank poverty rate from 17.2 percent to 15.2 percent, almost 12 percent on the base, which compares favourably with the 1.9 percent reduction generated by the current social transfer schemes. They would cut the national extreme poverty gap by
around 16 percent, from 4.5 percent to 3.8 percent.
Figure A9.2 shows the relative contributions of the different schemes to the reduction in the GSO/World Bank poverty rate and gap. Unsurprisingly, given the higher budget, the old-age benefit makes the greatest contribution. Its contribution to the reduction in the poverty rate is relatively higher, however, probably because older people are closer to the poverty line than children.
Figure A9.1: Coverage of households across wealth deciles by the proposed schemes compared to current coverage of MoLISA’s social transfers
Source: Kidd and Abu-el-Haj, forthcoming
Figure A9.2: Contribution of different schemes to reductions in the national poverty rate and gap
Source: Kidd and Abu-el-Haj, forthcoming
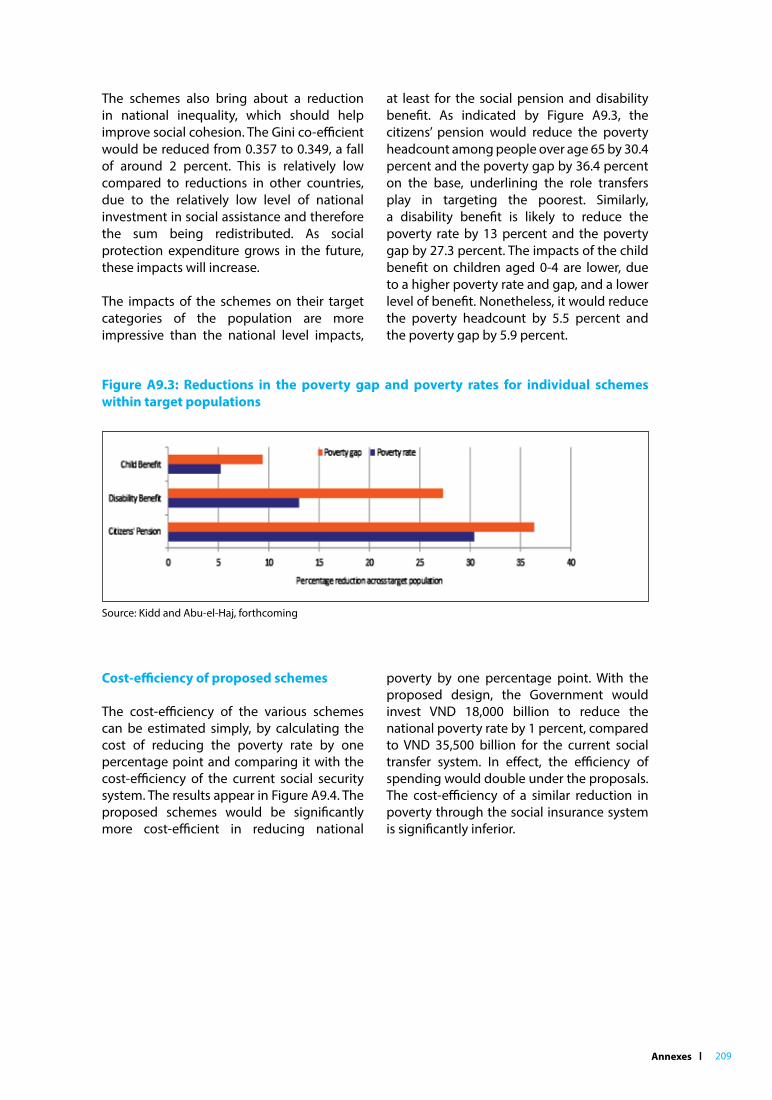
Annexes l 209
The schemes also bring about a reduction in national inequality, which should help improve social cohesion. The Gini co-efficient would be reduced from 0.357 to 0.349, a fall of around 2 percent. This is relatively low compared to reductions in other countries, due to the relatively low level of national investment in social assistance and therefore the sum being redistributed. As social protection expenditure grows in the future, these impacts will increase.
The impacts of the schemes on their target categories of the population are more impressive than the national level impacts,
at least for the social pension and disability benefit. As indicated by Figure A9.3, the citizens’ pension would reduce the poverty headcount among people over age 65 by 30.4 percent and the poverty gap by 36.4 percent on the base, underlining the role transfers play in targeting the poorest. Similarly, a disability benefit is likely to reduce the poverty rate by 13 percent and the poverty gap by 27.3 percent. The impacts of the child benefit on children aged 0-4 are lower, due to a higher poverty rate and gap, and a lower level of benefit. Nonetheless, it would reduce the poverty headcount by 5.5 percent and the poverty gap by 5.9 percent.
Figure A9.3: Reductions in the poverty gap and poverty rates for individual schemes within target populations
Source: Kidd and Abu-el-Haj, forthcoming
Cost-efficiency of proposed schemes
The cost-efficiency of the various schemes can be estimated simply, by calculating the cost of reducing the poverty rate by one percentage point and comparing it with the cost-efficiency of the current social security system. The results appear in Figure A9.4. The proposed schemes would be significantly more cost-efficient in reducing national
poverty by one percentage point. With the proposed design, the Government would invest VND 18,000 billion to reduce the national poverty rate by 1 percent, compared to VND 35,500 billion for the current social transfer system. In effect, the efficiency of spending would double under the proposals. The cost-efficiency of a similar reduction in poverty through the social insurance system is significantly inferior.
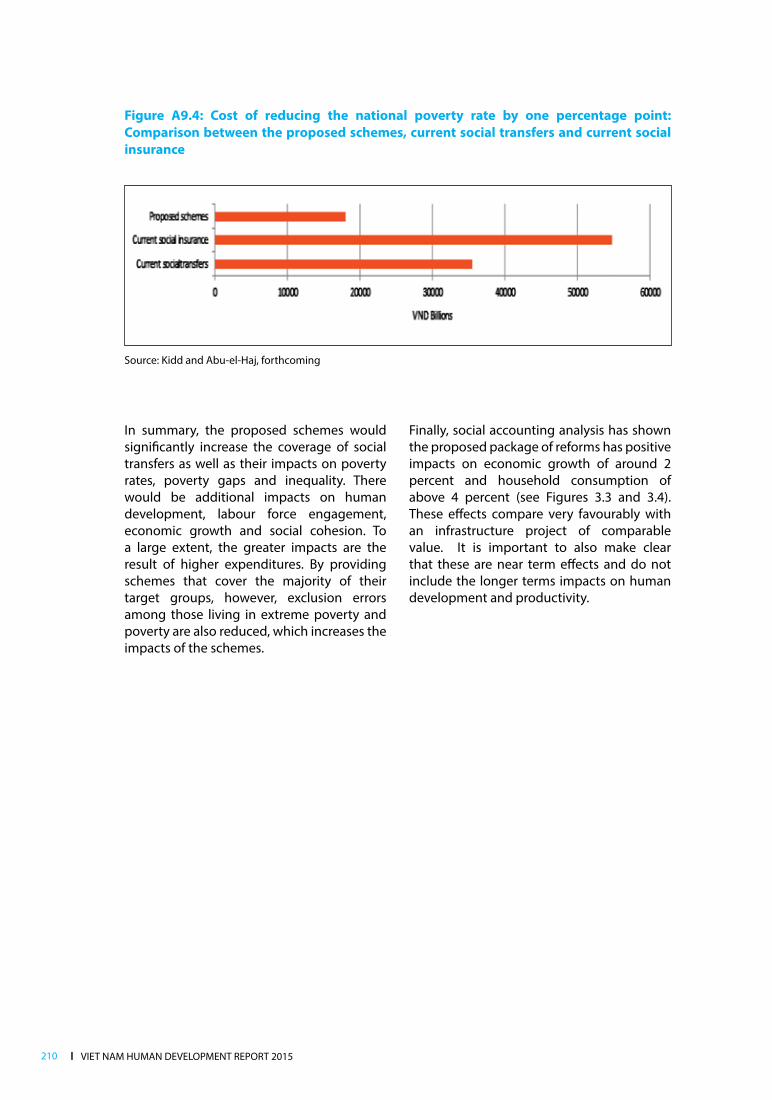
l VIET NAM HUMAN DEVELOPMENT REPORT 2015210
In summary, the proposed schemes would significantly increase the coverage of social transfers as well as their impacts on poverty rates, poverty gaps and inequality. There would be additional impacts on human development, labour force engagement, economic growth and social cohesion. To a large extent, the greater impacts are the result of higher expenditures. By providing schemes that cover the majority of their target groups, however, exclusion errors among those living in extreme poverty and poverty are also reduced, which increases the impacts of the schemes.
Finally, social accounting analysis has shown the proposed package of reforms has positive impacts on economic growth of around 2 percent and household consumption of above 4 percent (see Figures 3.3 and 3.4). These effects compare very favourably with an infrastructure project of comparable value. It is important to also make clear that these are near term effects and do not include the longer terms impacts on human development and productivity.
Figure A9.4: Cost of reducing the national poverty rate by one percentage point: Comparison between the proposed schemes, current social transfers and current social insurance
Source: Kidd and Abu-el-Haj, forthcoming

SOCIAL SCIENCES PUBLISHING HOUSE26 Ly Thuong Kiet - Hoan Kiem - Ha Noi
Tel: 04.39719073 - Fax: 04.39719071Website: http://nxbkhxh.vass.gov.vn
Email: [email protected]
Branch in Hochiminh city57 Suong Nguyet Anh - Ben Thanh Ward - District 1, Hochiminh city
Tel: 08.38394948 - Fax: 08.38394948
VIET NAM HuMAN DEVELoPMENT REPoRT 2015 VIET NAM HUMAN DEVELOPMENT REPORT 2015 ON INCLUSIVE GROWTH
Responsible for PublicationDirector LE HUU THANH
Responsible for ContentEditor in Chief NGUYEN XUAN DUNG
Content Editor: DIEU THUYComputer Technician: SONG HIEUPrinting corrector: DIEU THUYCover designed by: PHAN HUONG GIANG
Number of printed copies 800, size 20,5 x 29 printed in Vietnam by Huong Xuan Import - Export Trading and Service Development Company LimitedRegistration number: 280 - 2016/CXBIPH/11 - 11/KHXHPublication issue number: 03/QĐ-NXB KHXH, 28/01/2016Published and submitted for catalog record in 2/2016


UNITED NATIONS DEVELOPMENT PROGRAMME304 Kim Ma, Ha Noi, Viet NamTel: (+84 4) 38 500 100 Fax: (+84 4) 37 265 520Email: [email protected]
www.vn.undp.org
VIET NAM ACADEMY OF SOCIAL SCIENCES1 Lieu Giai, Ha Noi, Viet NamTel: (+84 4) 62 730 408Fax: (+84 4) 62 730 450Email: [email protected]
Top Related