


Languages
Pages
Legal


POUR L'OBTENTION DU GRADE DE DOCTEUR ÈS SCIENCES
PAR
M.Eng. in civil engineering, University of Tokyo, Japonet de nationalité indienne
acceptée sur proposition du jury:
Prof. P. Muralt, président du juryProf. K. Scrivener, directrice de thèse
Dr R. Flatt, rapporteur Prof. A. Nonat, rapporteur
Prof. M. Rappaz, rapporteur
Vector Modelling of Hydrating Cement Microstructure and Kinetics
Shashank BIShNOI
ThÈSE NO 4093 (2008)
ÉCOLE POLYTEChNIQUE FÉDÉRALE DE LAUSANNE
PRÉSENTÉE LE 5 JUIN 2008
À LA FACULTE SCIENCES ET TEChNIQUES DE L'INGÉNIEUR
LABORATOIRE DES MATÉRIAUX DE CONSTRUCTION
PROGRAMME DOCTORAL EN SCIENCE ET GÉNIE DES MATÉRIAUX
Suisse2008


Abstract
A new modelling framework, called μic, has been developed to enable
simulations of complex particulate growths, in particular the microstructural
evolution of hydrating cement paste. μic has been developed using the vector
approach, which preserves the multi-scale nature of the cement microstructure.
Support libraries built into the framework enable fast simulation of systems
containing millions of particles, allowing every single particle in a system to be
modelled and all the interactions to be calculated. The modelling framework has
been developed using object oriented programming and its extensible and flexible
architecture, due to this microstructural development mechanisms and algorithms
can be easily added. The framework facilitates the otherwise complex task of
modelling new systems and phenomena. The microstructures generated by μic can
be used to obtain important information that can in the future be used to model
the evolution of mechanical properties and durability-related phenomena. The
model can also be used to study the mechanisms of microstructural development of
cement.
Various models of cement hydration kinetics and the reaction mechanism
were tested using μic. It was observed that while the traditional approach to the
nucleation and growth mechanism could be used to explain the acceleration of
reaction-rates during the early hydration of cement pastes, the subsequent
deceleration could not be reproduced. If a diffusion controlled mechanism is used
to explain the deceleration, changes larger than an order of magnitude in the
transport properties of C-S-H have to be assumed. Furthermore, the rate of change
of reaction rates shows a continuous linear evolution through the reaction peak
and the thickness around different particle sizes would be very different at the
onset of the supposed diffusion regime. It was found that it is possible to explain
I

the hydration kinetics during the first 24 hours using a nucleation and growth
mechanism when a loosely packed C-S-H with a lower bulk density is assumed to
form. It is proposed that this loosely packed C-S-H fills a large fraction of the
microstructure within a few hours of hydration and that its density continues to
increase due to an internal growth process within the bulk of the product. It was
found that an initial density of C-S-H between 0.1 g/cc and 0.2 g/cc was required
in order to fit the observed experimental behaviour. While this density is much
lower than the generally accepted range of 1.7 g/cc to 2.1 g/cc, this low packing
density can explain the absence of water in large capillary pores observed in NMR
measurements that study cement hydration on wet samples, and the fibrous or
ribbon-like nanostructure of C-S-H observed in high-resolution TEM images.
The current study demonstrates the versatility of μic and how the possibility
of modelling different phenomena on a multi-scale three-dimensional model can
prove to be an important tool to achieve better understanding of cement
hydration. It was also shown that the use of mechanistic, rather than empirical,
rules can improve the predictive power of the models.
Key Words: Microstructure, Modelling, Modelling platform, Vector approach,
Cement, Alite, Hydration, Kinetics, Mechanism, Calcium silicate
hydrate, Densification
II

Résumé
Une nouvelle architecture dédiée à la modélisation ayant pour nom μic a été
développée pour permettre la simulation de phénomènes de croissance particulaire
complexes, en particulier l'évolution micro-structurelle de la pâte de ciment au
cours de son hydratation. µic a été développé avec une approche vectorielle, apte à
préserver la nature multi-échelle de la microstructure du ciment. Les bibliothèques
de support fournies avec µic rendent possible la simulation rapide de systèmes
comprenant des millions de particules, chaque particule étant modellisée
individuellement et toutes les interactions traitées explicitement. Cet
environnement de simulation à été écrit en utilisant une approche orientée objet et
son architecture permet une grande flexibilité dans l'ajout de mécanismes de
développement et d'algorithmes spécifiques. Cette architecture facilite la tâche
complexe de construction de modèles pour de nouveaux systèmes ou phénomènes.
Les microstructures générées par µic peuvent être utilisées pour obtenir des
informations importantes, utilisables dans le futur pour la modélisation de
l'évolution des propriétés mécaniques ainsi que les phénomènes liés aux problèmes
de durabilité. Ce modèle peut aussi être utilisé pour l'étude des mécanismes
d'hydratation eux-mêmes.
Différents modèles de cinétique d'hydratation du ciment et de mécanismes de
réaction ont été testés avec µic. Il a été observé que quoique l'approche
traditionnelle de nucléation et croissance pût expliquer l'accélération du taux de
réaction lors de l'hydratation initiale, la décélération qui s'en suit ne pouvait être
reproduite. Si un mécanisme contrôlé par un phénomène de diffusion est supposé
pour expliquer la décélération, des changement de plus d'un ordre de grandeur des
propriétés de transport du C-S-H doivent être admis. De plus, la variation du taux
de la réaction évolue linéairement lors du passage du pic de chaleur et l'épaisseur
III

du C-S-H autour de particules de tailles différentes serait très variable au moment
du changement de régime. Il est possible d'expliquer la cinétique d'hydratation
durant les premières 24 heures en utilisant un mécanisme de nucléation et
croissance si l'on suppose la formation d'un C-S-H peu dense. Il est proposé que ce
C-S-H peu dense remplisse une importante part de la microstructure lors des
premières heures de l'hydratation, puis que sa densité augmente par le moyen d'un
processus de croissance interne. Il a été trouvé que la densité initiale devait être
entre 0.1 g/cc et 0.2 g/cc pour reproduire le comportement expérimental observé.
Quoique cette densité soit très inférieure au bornes généralement acceptées,
comprises entre 1.7 g/cc et 2.1 g/cc, elle peut expliquer l'absence d'eau dans les
grands pores capillaires observée lors d'études utilisant la RMN sur des
échantillons en condition humide, ainsi que la nanostructure fibreuse en rubans du
C-S-H observée sur des images MET à haute résolution.
Cette étude démontre la versatilité de µic et le potentiel offert par la
possibilité de modéliser différents phénomènes au sein d'un même modèle multi-
échelle tri-dimensionnel, comme outil permettent une meilleure compréhension de
l'hydratation du ciment. Il est également montré que l'usage de règles de nature
mécaniste plutôt qu'empirique améliore le pouvoir prédictif des modèles.
Mots Clés: Microstructure, Modélisation, Architecture de modélisation,
Approche vectorielle, Ciment, Alite, Hydratation, Cinétique,
Mécanisme, Silicate de calcium hydraté, Densification
IV

Acknowledgement
I would like to express my gratitude to all the people who helped me over the
last three and a half years in the work leading to this dissertation. Firstly I would
like to thank my supervisor Prof. Karen Scrivener for giving me the opportunity to
work with her, for the regular (at times heated) discussions, for being a constant
source of motivation (and at times annoyance) and most of all for being a great
boss and an even greater sport from the first to the last day of this work. I thank
EPFL for accepting me as a student and supporting me with a scholarship for the
first year of the Ph.D. I thank the Swiss National Science Foundation for providing
financial support for this research.
Thanks to all my colleagues at LMC for the all the great work and fun.
Special thanks to my office mates Mohsen and Julien for all the great times (and
stupid pranks), to Cyrille, the encyclopaedia of all useful (and lots more pointless)
information, for all the stimulating discussions, to Kyle for bringing the much
needed practical perspective (and prudishness). Thanks to Dr. Navi and Dr. Pignat
for letting me work on their model and explaining its details. Thanks to Mercedes
for letting me steal her experimental results and alite, and to Emmanuel for
philosophising about these results. Thanks to Amor for the discussions. To all
LMC colleagues for their invaluable help and support. Also thanks to all the
different people who were willing to discuss my work during workshops, seminars
and weekdays.
My love and thanks to my loving, caring and patient (and at times pestering)
wife Ruchi for getting me through all the rough and the smooth, for always being
there and supporting me no matter what, for being my best friend. Thanks to my
parents for giving me the motivation to work and the freedom and support to be
myself.
V


Table of Contents
Abstract....................................................................................................i
Résumé....................................................................................................iii
Acknowledgement....................................................................................v
Table of Contents...................................................................................vii
List of Tables...........................................................................................xi
List of Figures........................................................................................xiii
Glossary.................................................................................................xix
Chapter 1: Introduction...........................................................................1
Chapter 2: Cement Hydration: Chemistry and Numerics.......................52.1 Production, Composition and Hydration of Cement......................52.2 Hydration of Alite..........................................................................7
2.2.1 Models of C-S-H......................................................................72.2.2 Distribution of Hydrates........................................................11
2.3 Hydration Kinetics of Cement......................................................14
VII

2.4 Stages of Alite Hydration.............................................................152.4.1 Stages 1 & 2: Dissolution and Induction Periods..................162.4.2 Stage 3: Accelerating Reaction Rates....................................172.4.3 Stages 4 & 5: Reducing Reaction Rates................................19
2.5 Analytical and Numerical Models of Hydration Kinetics.............202.5.1 Concentric Growth Models....................................................202.5.2 The Johnson-Mehl-Avrami-Kolmogorov Equation................232.5.3 The Dijon Numerical Model for Boundary Nucleation.........26
2.6 Summary of Cement Hydration and Outstanding Questions.......282.7 Modelling Cement Hydration.......................................................30
2.7.1 Numerical Models for Cement Microstructure......................332.7.2 Limitations of Currently available Models............................43
2.8 Current Study...............................................................................44
Chapter 3: μic the Model.......................................................................453.1 Why a Microstructural Model......................................................453.2 Requirements from μic..................................................................47
3.2.1 Extensibility..........................................................................473.2.2 Ease of Development.............................................................483.2.3 Multi-scale Microstructural Representation..........................483.2.4 Performance...........................................................................493.2.5 Accessibility...........................................................................49
3.3 The Vector Approach...................................................................493.3.1 Possible Assumptions in Vector Approach...........................523.3.2 Vector Approach as Used in μic............................................533.3.3 Algorithms for a Faster Vector Approach.............................57
3.4 Modelling Cement Hydration.......................................................623.4.1 Materials and Reactions........................................................643.4.2 Cement Particles...................................................................643.4.3 Reaction Kinetics..................................................................663.4.4 Distribution of Materials.......................................................673.4.5 Density Variation..................................................................673.4.6 Mechanisms of Microstructural Evolution............................683.4.7 Specific Workarounds............................................................693.4.8 Plugins...................................................................................713.4.9 An Example Problem definition............................................72
3.5 Output from the Model................................................................76
Chapter 4: Simulating Microstructures using μic...................................794.1 Traditional Microstructural Simulations: Particle-Sizes..............79
4.1.1 Mechanisms and Rules..........................................................804.1.2 The Simulations.....................................................................834.1.3 Approximate Pore-Size Distributions....................................85
VIII

4.1.4 Observations and Discussion.................................................864.2 Non-Traditional Examples with μic.............................................87
4.2.1 Mechanisms and Rules..........................................................874.2.2 The Simulations.....................................................................894.2.3 Results...................................................................................904.2.4 Discussion..............................................................................91
4.3 Conclusions...................................................................................92
Chapter 5: Nucleation and Growth Kinetics of Alite.............................935.1 Introduction..................................................................................935.2 Numerical Modelling of Reaction Kinetics...................................94
5.2.1 Requirements from Numerical Models of Kinetics................945.2.2 Using Experimental Results in Conjunction with Models.....94
5.3 The Avrami Equation...................................................................965.3.1 A Simplified Derivation of the Avrami Equation..................975.3.2 Limitations of the Avrami Equation.....................................98
5.4 Simulating the Nucleation and Growth Mechanism...................1015.4.1 Homogeneous Nucleation and Growth................................1025.4.2 Heterogeneous Nucleation and Growth...............................1055.4.3 Results.................................................................................108
5.5 Experimental Investigations into Hydration Kinetics................1105.5.1 Avrami Fits of Curves.........................................................1125.5.2 Rate of Acceleration............................................................1135.5.3 Effect of Inert Fillers...........................................................1155.5.4 Summary of Experimental Results......................................117
5.6 Key Questions before Modelling Alite Hydration.......................1185.6.1 Induction Period..................................................................1185.6.2 Accelerating Stage...............................................................119
5.7 Modelling Traditional Nucleation and Growth in μic................1215.7.1 Kinetics................................................................................1235.7.2 Fit Parameters and Results.................................................1255.7.3 Discussion............................................................................127
5.8 Existence of a Diffusion Controlled Regime...............................1305.8.1 Simulations with a Diffusion Controlled Mechanism..........1305.8.2 Rate of Change of Hydration Kinetics................................1335.8.3 Dependence of Reaction Rate on Hydrate Thickness..........135
5.9 C-S-H with Age-Dependent Density...........................................1365.9.1 Kinetics................................................................................1365.9.2 Fit Parameters and Results.................................................1395.9.3 Discussion............................................................................142
5.10 Simulating the Filler Effect......................................................1445.11 Deductions from the Simulations..............................................1465.12 Discussion..................................................................................1475.13 Conclusions...............................................................................150
IX

Chapter 6: Conclusions and Perspectives.............................................1536.1 Microstructural Modelling and μic.............................................1536.2 Hydration Kinetics......................................................................1546.3 Perspectives on Microstructural Modelling................................1556.4 Perspectives on Hydration Kinetics............................................157
References.............................................................................................159
X
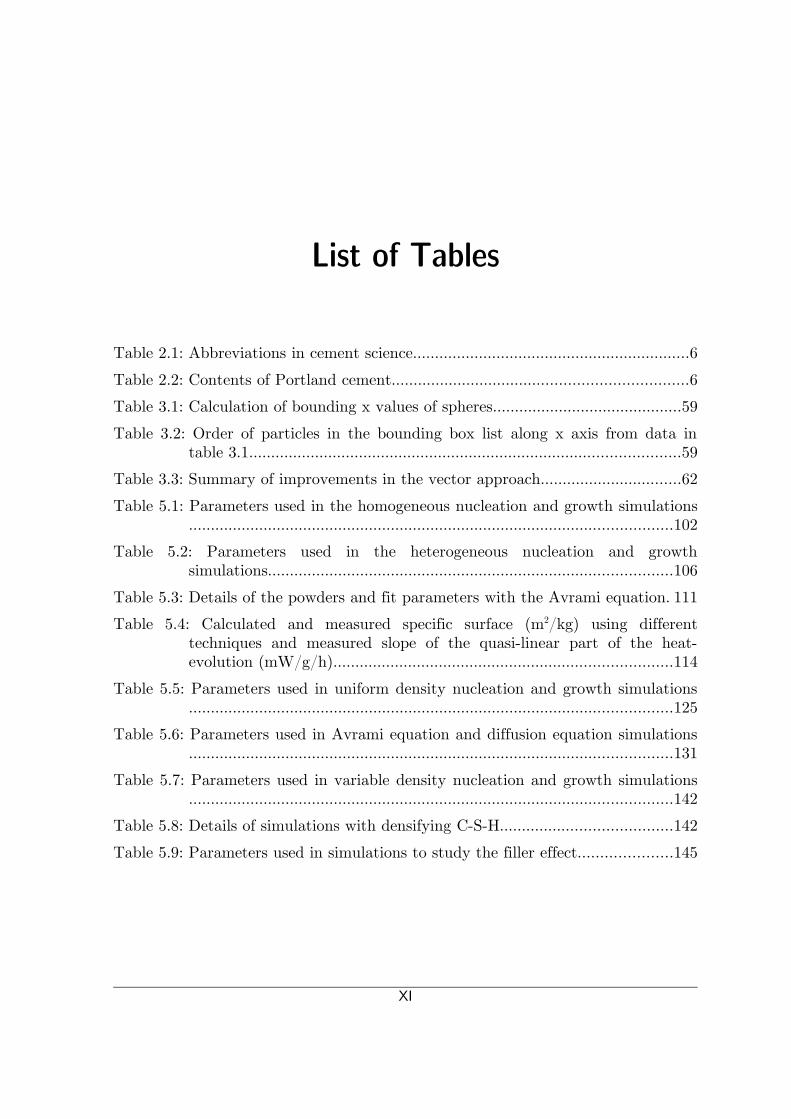
List of Tables
Table 2.1: Abbreviations in cement science...............................................................6
Table 2.2: Contents of Portland cement...................................................................6
Table 3.1: Calculation of bounding x values of spheres...........................................59
Table 3.2: Order of particles in the bounding box list along x axis from data in table 3.1..................................................................................................59
Table 3.3: Summary of improvements in the vector approach................................62
Table 5.1: Parameters used in the homogeneous nucleation and growth simulations..............................................................................................................102
Table 5.2: Parameters used in the heterogeneous nucleation and growth simulations............................................................................................106
Table 5.3: Details of the powders and fit parameters with the Avrami equation. 111
Table 5.4: Calculated and measured specific surface (m2/kg) using different techniques and measured slope of the quasi-linear part of the heat-evolution (mW/g/h).............................................................................114
Table 5.5: Parameters used in uniform density nucleation and growth simulations..............................................................................................................125
Table 5.6: Parameters used in Avrami equation and diffusion equation simulations..............................................................................................................131
Table 5.7: Parameters used in variable density nucleation and growth simulations..............................................................................................................142
Table 5.8: Details of simulations with densifying C-S-H.......................................142
Table 5.9: Parameters used in simulations to study the filler effect.....................145
XI


List of Figures
Figure 2.1: The Feldman-Sereda model of C-S-H17, the circles show adsorbed water and crosses show inter-layer water...........................................................8
Figure 2.2: Schematics of low-density (left) and high-density (middle) C-S-H according to Jennings model20, and the modified globular unit22..............9
Figure 2.3: SEM micrograph of C3S hydrating in paste (from de Jong et al.23) (Left), and TEM micrograph showing low-density fibrillar outer and inner C-S-H in a mature cement paste (from Richardson27) (Right).......9
Figure 2.4: Transmission electron micrograph of low-density product inside the shell (from Mathur24). Pores are in black and materials in lighter tones in this dark-field image...........................................................................10
Figure 2.5: TEM image of inner product in a hardened cement paste resembling a colloidal suspension of fibres (from Richardson26)..................................10
Figure 2.6: Drawing of cement microstructure for 0.3 w/c having a capillary porosity of 7%33. Spaces marked 'C' represent capillary pores...............12
Figure 2.7: Evolution of a hydrating cement grain (after Scrivener44)...................13
Figure 2.8: Typical heat evolution curve of Portland cement.................................14
Figure 2.9: Typical heat evolution curve of the alite phase....................................15
Figure 2.10: Schematic representation of hydrating C3S grain in concentric growth models by Kondo and Ueda38 (left) and Pommersheim and Clifton49
(right).....................................................................................................20
Figure 2.11: Schematics of overlapping spherical grains from Avrami67..................23
Figure 2.12: Schematics of the nucleation and growth implemented in the Dijon model......................................................................................................27
Figure 2.13: Relationship of compressive strength with gel-space ratio (after Powers 19589)..........................................................................................31
Figure 2.14: Experimental scatter of compressive strengths of different systems against Balshin's model92........................................................................31
XIII
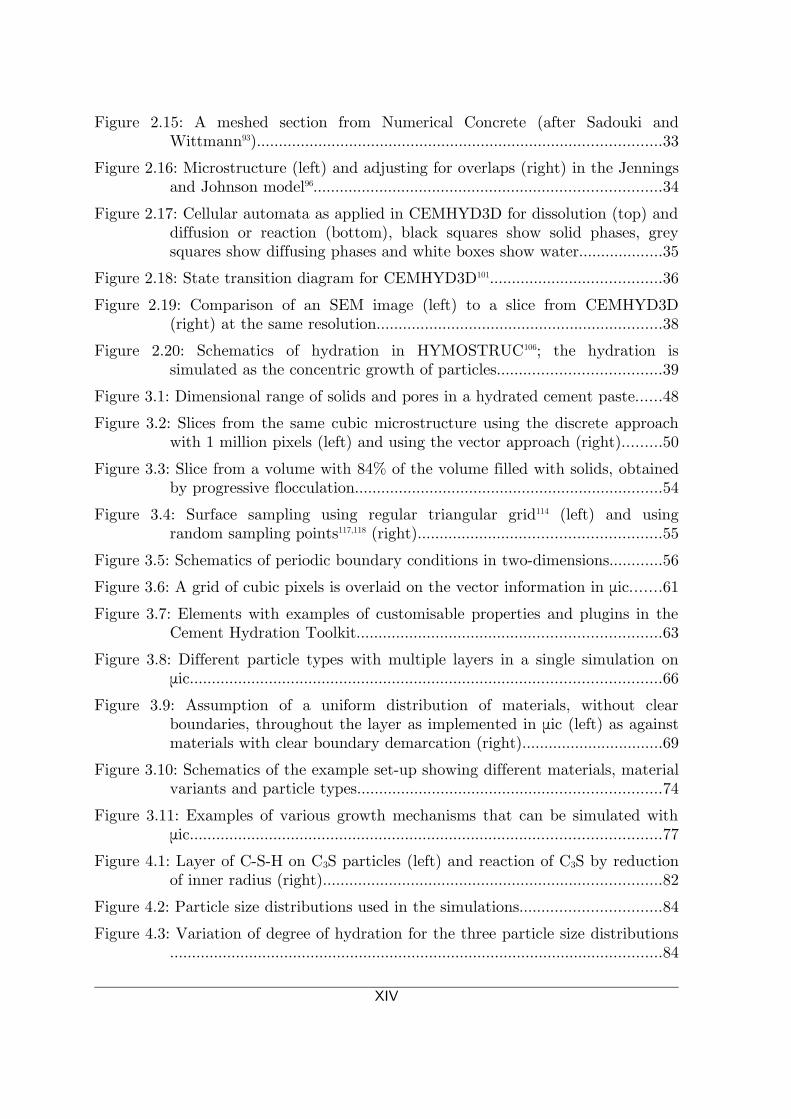
Figure 2.15: A meshed section from Numerical Concrete (after Sadouki and Wittmann93)............................................................................................33
Figure 2.16: Microstructure (left) and adjusting for overlaps (right) in the Jennings and Johnson model96...............................................................................34
Figure 2.17: Cellular automata as applied in CEMHYD3D for dissolution (top) and diffusion or reaction (bottom), black squares show solid phases, grey squares show diffusing phases and white boxes show water...................35
Figure 2.18: State transition diagram for CEMHYD3D101.......................................36
Figure 2.19: Comparison of an SEM image (left) to a slice from CEMHYD3D (right) at the same resolution.................................................................38
Figure 2.20: Schematics of hydration in HYMOSTRUC106; the hydration is simulated as the concentric growth of particles.....................................39
Figure 3.1: Dimensional range of solids and pores in a hydrated cement paste......48
Figure 3.2: Slices from the same cubic microstructure using the discrete approach with 1 million pixels (left) and using the vector approach (right).........50
Figure 3.3: Slice from a volume with 84% of the volume filled with solids, obtained by progressive flocculation......................................................................54
Figure 3.4: Surface sampling using regular triangular grid114 (left) and using random sampling points117,118 (right).......................................................55
Figure 3.5: Schematics of periodic boundary conditions in two-dimensions............56
Figure 3.6: A grid of cubic pixels is overlaid on the vector information in μic.......61
Figure 3.7: Elements with examples of customisable properties and plugins in the Cement Hydration Toolkit.....................................................................63
Figure 3.8: Different particle types with multiple layers in a single simulation on μic...........................................................................................................66
Figure 3.9: Assumption of a uniform distribution of materials, without clear boundaries, throughout the layer as implemented in μic (left) as against materials with clear boundary demarcation (right)................................69
Figure 3.10: Schematics of the example set-up showing different materials, material variants and particle types.....................................................................74
Figure 3.11: Examples of various growth mechanisms that can be simulated with μic...........................................................................................................77
Figure 4.1: Layer of C-S-H on C3S particles (left) and reaction of C3S by reduction of inner radius (right).............................................................................82
Figure 4.2: Particle size distributions used in the simulations................................84
Figure 4.3: Variation of degree of hydration for the three particle size distributions................................................................................................................84
XIV

Figure 4.4: Microstructures at 75% hydration for PSD-1 (left), PSD-2 (middle) and PSD-3 (right), with C3S in lightest grey-scale, followed by CH and C-S-H and pores in black...............................................................................85
Figure 4.5: Erosion to identify pore-skeleton using pixels (the solids are shown in black)......................................................................................................85
Figure 4.6: Pore size distribution at 75% and 95% degree of hydration.................86
Figure 4.7: Schematics for normal (left) and branching growth (right)..................88
Figure 4.8: Example of step-wise addition of spheres in branching growth............89
Figure 4.9: Evolution of the microstructure with non-branching fibres with solid-volume fraction of 13.3% (left), 22.7% (middle) and 32.0% (right).......90
Figure 4.10: Evolution of the microstructure with branching fibres with solid-volume fraction of 7.1% (left), 31.5% (middle) and 65.7% (right).........90
Figure 4.11: Evolution of the volume filled by solids with normal and branching fibres.......................................................................................................91
Figure 4.12: Rate of reaction with non-branching (left) and branching (right) fibres................................................................................................................91
Figure 5.1: Dependence of reaction rates predicted by the Avrami equation on k and n.......................................................................................................99
Figure 5.2: Fraction of volume filled (left) and rate of filling (right) for the first set of simulations........................................................................................103
Figure 5.3: Snapshots of slices from the first set of simulations, with fraction of volume occupied approximately 36% (left) and 90% (right)................103
Figure 5.4: Fit of simulations 1-BB and 4-OB with the Avrami equation............104
Figure 5.5: Different perpendicular and vertical growth rates from spherical nuclei..............................................................................................................106
Figure 5.6: Degree of reaction (left) and rate of reaction (right) for the second set of simulations........................................................................................107
Figure 5.7: Three-dimensional snapshots from simulations 6-BB (left) and 7-BD (right)....................................................................................................107
Figure 5.8: Best fits of the Avrami equation with results from simulations 6 to 8..............................................................................................................108
Figure 5.9: Particle size distributions of different fractions of alite.......................110
Figure 5.10: Rate of heat evolution for alite fractions A, B, C, E and F..............112
Figure 5.11: Rate of heat evolution for alite fractions A, D and G.......................112
Figure 5.12: Fits of the Avrami equation with three fractions without an induction period....................................................................................................113
XV

Figure 5.13: Renormalised specific fineness' of powders against measured slopes. 114
Figure 5.14: Particle size distributions of alite and fillers used.............................116
Figure 5.15: Heat evolution from samples with alite replaced by rutile................116
Figure 5.16: Heat evolution from samples with alite replaced by silica fume........117
Figure 5.17: Heat evolution curve as a sum of exponential decay and Avrami equation with and without an induction period...................................119
Figure 5.18: Evolution of heat-flow measured by isothermal calorimetry (left) and surface area measured by NMR relaxometry (right) by Zajac126..........119
Figure 5.19: Schematics of the nucleation and growth mechanism with different parallel and outwards growth rates for a single particle (top) and between particles (bottom)...................................................................123
Figure 5.20: Comparison between simulations and experimental results of heat-evolution rates and degrees of hydration..............................................126
Figure 5.21: A slice from the simulation of fraction F-15 μm at the peak. The pores are shown in black, alite in dark-grey and hydrates in white..............128
Figure 5.22: Degree of hydration against rate of reaction for calculations and experiments...........................................................................................128
Figure 5.23: Comparison between simulations and experimental results of heat-evolution rates and degrees of hydration..............................................132
Figure 5.24: Heat-rates and differential of heat-rates for the fractions and calculated from the Avrami equation, as marked.................................134
Figure 5.25: Dependence of the rate of hydration on the approximate thickness of products................................................................................................136
Figure 5.26: Schematics of the nucleation and growth mechanism with different parallel and outwards growth rates and densification of the product for a single particle (top) and between particles (bottom)........................138
Figure 5.27: Comparison between simulations and experimental results of heat-evolution rates and degrees of hydration for simulations with variable density of product.................................................................................140
Figure 5.28: Dependence of simulated heat-evolution on parameters for fraction E-18 μm.................................................................................................141
Figure 5.29: Variation of k2 with the number of particles per unit volume in the simulations............................................................................................141
Figure 5.30: A slice from fraction B-83 μm close to the peak, with pore-space in black, anhydrous grains in dark grey and hydrates in white................144
Figure 5.31: Calculated rates of heat-evolution from simulations with inert fillers..............................................................................................................145
XVI

Figure 5.32: Degree of hydration against the rate of heat-evolution from different alite samples with and without fine filler particles...............................149
XVII


Glossary
Abbreviations
BET: Brunauer, Emmett and Teller theory
BSE: Back-Scattered Electrons
CA: Cellular Automata
CHT: Cement Hydration Tool-kit
CV: Computational Volume
FEM: Finite Element Method
IPKM: Integrated Particle Kinetics Model
JDK: Java Development Kit
JVM: Java Virtual Machine
NMR: Nuclear Magnetic Resonance
OPC: Ordinary Portland Cement
PSD: Particle Size Distribution
QENS: Quasi-Elastic Neutron Scattering
REV: Representative Elementary Volume
SEM: Scanning Electron Microscopy
TEM: Transmission Electron Microscopy
w/c: Water to Cement Ratio
Cement chemistry notation
C: CaO
S: SiO2
H: H2O
A: Al2O3
F: Fe2O3
S: SO3
C3S: Tricalcium Silicate
C2S: Dicalcium Silicate
C3A: Tricalcium Aluminate
C4AF: Tetracalcium Aluminoferrite
C-S-H: Calcium Silicate Hydrate
CH: Calcium Hydroxide
XIX


Chapter 1: Introduction
This study presents a new modelling platform called μic (pronounced Mike).
This platform uses the vector approach in three-dimensions to model the
microstructural development of hydrating cement pastes. μic uses the vector
approach to represent the geometry of the microstructure. The efficiency of the
vector approach was improved in order to enable simulations of millions of
particles with the calculation of all interactions in the system. Due to its flexible
design, the users of the platform can define custom materials, particles and
reactions, and control the development of the microstructure by defining laws that
define the mechanisms of the reactions. The versatility of μic allows users to model
many different particulate growth systems not limited to cement hydration.
In this study the modelling platform has been used to model various possible
hydration mechanisms and the applicability of these mechanisms has been tested
by comparison with experimental results. The hydration kinetics of alite samples
with different particle size distributions were simulated. The calculated results
were compared against heat-evolution from hydrating alite samples measured using
isothermal calorimetry. The results provide important information regarding
cement hydration and highlight the gaps in our understanding of the underlying
mechanisms.
One of the major problems in studying cement is the large number of
interactions at work during hydration. This interaction happens between different
materials and different particles at the same time. As most of these processes occur
1
Introduction
at the micro-scale, they cannot be directly observed and indirect experimental
techniques are used to study them. For example, while calorimetry is widely used
to study the rate of hydration of cement, since only the total heat-evolved from
samples is measured, the individual reaction rates of individual phases are not
available. Similarly, while electron microscopy is widely used to study the
evolution of cement microstructures, since most of the high-resolution techniques
require a drying of the sample, the progress of hydration on the same sample
cannot be observed.
Since most of our understanding of the mechanism of cement hydration
depends on various indirect experimental techniques, the results are often open to
interpretation. While most experimental techniques provide bulk-values of the
properties, the underlying mechanisms occur at the micrometre or nanometre scale,
interpretation of the link between mechanisms and properties requires
simplifications regarding interactions which are difficult to test. However, with the
continuous development of computational techniques, it has now become possible
to numerically simulate these processes and to observe their macroscopic effects,
which can be compared with experimental results.
Numerical models use combinations of fundamental processes to simulate
systems and processes. The processes underlying these models generally define the
behaviour of smaller discrete sub-systems and the interactions between these sub-
systems. Since smaller and simpler elements of the system are considered, the
behavioural laws are much simpler to formulate analytically and the task of
integration of the behaviour of the entire system is left to the computer. Numerical
models can, therefore, be used as an important technique, which works in a way
complimentary to the experiments, in order to further our understanding of cement
hydration.
Still, most of the currently available numerical models on cement remain
empirical and highly dependent on experimental results. While this is not
2

Chapter 1: Introduction
surprising, given the wide range of parameters on which the properties of cements
depend, these models can only serve a limited purpose in the advancement of our
understanding of the processes underlying cement hydration. Empirical models are
mathematical expressions that are designed to follow the experimental results and
do not necessarily represent the mechanisms that control these properties. Even if
used only for predicting properties for different conditions, empirical models are
only applicable over a limited range of conditions and are hard to extend beyond
this range.
For these reasons, the need for a numerical microstructural model which can
incorporate customised mechanisms in simulations was felt. μic provides a
modelling platform on which different theories concerning cement hydration could
be explicitly modelled and studied. At the same time, μic provides an effective
means to reconstruct numerical microstructures resulting from complex processes
that occur at the level of individual particles. These microstructures can be
analysed for the calculation of different properties, such as mechanical and
transport properties in the case of cement.
The following chapters discuss the importance of numerical modelling in
cement science, the development of μic and its features, and numerical studies of
cementitious systems using μic. Chapter 2 discusses our current understanding of
cement hydration and different approaches used thus far to understand and model
hydration and microstructural development. Various microstructural models and
their advantages and drawbacks are also presented in this chapter.
Chapter 3 presents the concepts behind the development of μic and its
architecture. The typical procedure for defining a problem in μic has also been
presented.
Chapter 4 demonstrates that while μic can be used to simulate hydrating
cement microstructures using the traditionally applied laws on customary set-ups,
it can also be used to model other, completely different, systems. It has also been
3

Introduction
shown that microstructural models can be used to obtain both, the localised effects
of bulk properties and the macroscopic effects of microscopic mechanisms.
In chapter 5, μic has been used to investigate hydration kinetics of alite.
Rates of hydration measured from alite powders with different particle size
distributions have been compared with computed results obtained from the
simulation of different hydration mechanisms. It has been shown that some of the
widely accepted mechanisms cannot explain the hydration kinetics of alite and new
explanations of the observed behaviour are needed.
Chapter 6 presents the conclusions of the study and the perspectives for
future numerical and experimental studies on cement hydration.
4

Chapter 2: Cement Hydration: Chemistry and Numerics
In this chapter, our current state of knowledge of cement hydration and the
approaches used to understand it further and to model it are presented. In the
discussion, some of the important aspects of hydration that are still not well
understood are identified. It is seen that, while cement science has evolved
considerably over the last century, many important aspects of hydration are still
not well understood. While many advances have been made in modelling cement
hydration, most of the existing models rely heavily on empirical results, often
limiting the applicability of the models. Since the current work deals with alite
hydration, the hydration of alite will be focussed upon in the following discussion.
2.1 Production, Composition and Hydration of CementPortland cement is produced by burning lime, clay and other naturally
available minerals mixed in a kiln in large amounts at around 1450°C1. The
materials partially fuse to form clinker nodules upon cooling. Clinker is chiefly
composed of phases containing calcium oxide, silicon dioxide, aluminium oxide and
ferric oxide, present with other minority components such as magnesium,
potassium and sodium oxides. The nodular clinker is then mixed with a small
quantity (typically around 5%) of calcium sulphate and is finely ground to produce
cement.
5

Production, Composition and Hydration of Cement
For the sake of convenience, the names of most of the constituents of cement
are abbreviated, as listed in table 2.1. The oxides in the clinker combine to form
phases that constitute cement. For example, calcium oxide and silicon dioxide
combine to form a modified form of tricalcium silicate, which is also known as alite
and is the most important phase in cement. The other major phases present in
cement are belite, aluminate and ferrite (table 2.2). The phases are not present in
their pure form and contain ionic substitutions in their crystalline structures.
Calcium sulphate is added to the clinker before grinding. Although typically
referred to as gypsum, other forms of calcium sulphate may also be used.
Table 2.1: Abbreviations in cement scienceFormula Abbreviation Formula Abbreviation
CaO C SiO2 S
Al2O3 A Fe2O3 F
MgO M K2O K
SO3 S H2O H
Table 2.2: Contents of Portland cementCompound Phase Names Abbreviated Name Typical amount
Tricalcium Silicate Alite C3S 50-70%
Dicalcium Silicate Belite C2S 15-30%
Tricalcium Aluminate Aluminate C3A 5-10%
Tetracalcium Aluminoferrite Ferrite C4AF 5-15%
Cement reacts with water in a process called hydration. With hydration, the
solid volume in cement paste increases, converting cement into a stiff solid. The
reaction products, called hydrates, give cement its binding properties and are
responsible for strength development. In the following sections, the hydration of
cement, and particularly alite, the development of its microstructure and its
reaction kinetics are discussed in more detail.
6
Chapter 2: Cement Hydration: Chemistry and Numerics
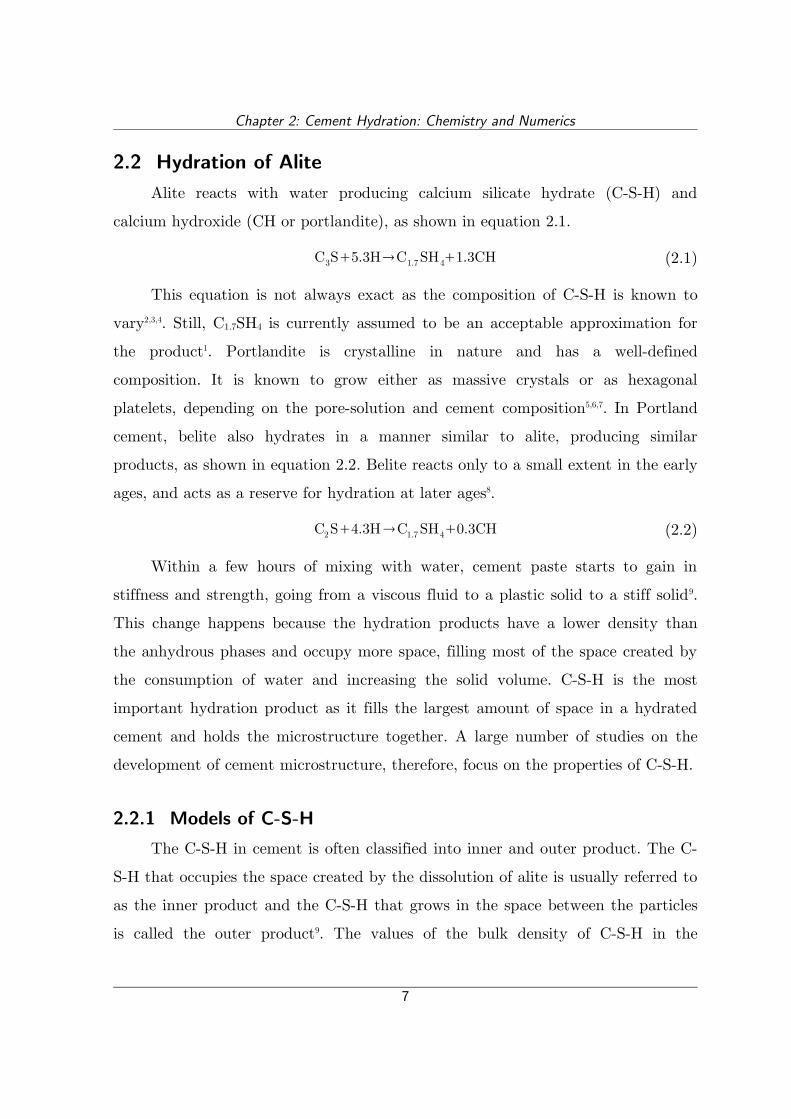
2.2 Hydration of AliteAlite reacts with water producing calcium silicate hydrate (C-S-H) and
calcium hydroxide (CH or portlandite), as shown in equation 2.1.
C3S5.3HC1.7SH41.3CH (2.1)
This equation is not always exact as the composition of C-S-H is known to
vary2,3,4. Still, C1.7SH4 is currently assumed to be an acceptable approximation for
the product1. Portlandite is crystalline in nature and has a well-defined
composition. It is known to grow either as massive crystals or as hexagonal
platelets, depending on the pore-solution and cement composition5,6,7. In Portland
cement, belite also hydrates in a manner similar to alite, producing similar
products, as shown in equation 2.2. Belite reacts only to a small extent in the early
ages, and acts as a reserve for hydration at later ages8.
C2S4.3HC1.7SH40.3CH (2.2)
Within a few hours of mixing with water, cement paste starts to gain in
stiffness and strength, going from a viscous fluid to a plastic solid to a stiff solid9.
This change happens because the hydration products have a lower density than
the anhydrous phases and occupy more space, filling most of the space created by
the consumption of water and increasing the solid volume. C-S-H is the most
important hydration product as it fills the largest amount of space in a hydrated
cement and holds the microstructure together. A large number of studies on the
development of cement microstructure, therefore, focus on the properties of C-S-H.
2.2.1 Models of C-S-HThe C-S-H in cement is often classified into inner and outer product. The C-
S-H that occupies the space created by the dissolution of alite is usually referred to
as the inner product and the C-S-H that grows in the space between the particles
is called the outer product9. The values of the bulk density of C-S-H in the
7

Hydration of Alite
literature vary, mostly between 1.85 g/cc and 2.1 g/cc10,11,12,13. While values of
porosity of C-S-H found in the literature vary between 28% and 49%9,14, it is
generally accepted that inner C-S-H has a lower porosity than the outer C-S-H.
The solid density of C-S-H has been reported to be between 2.5 g/cc and
2.8 g/cc14,15,16.
There is general agreement on the development of a porous, gel-like, higher-
density inner and a lower-density outer product, although the structure of C-S-H is
still not clear and several models of C-S-H exist. Feldman and Sereda17,18 postulated
a layered structure of C-S-H with water bonded between the layers of C-S-H and
also adsorbed on the surface of the layers (figure 2.1). This model was based on
nitrogen sorption and the observed length and modulus changes in samples at
different moisture conditions. Daimon et al.19 made similar conclusions based on
nitrogen and water-vapour absorption and made minor modifications to the model.
Based on surface-area and shrinkage measurements using different techniques,
Jennings presented a colloidal structure for C-S-H20,21, which is similar to the
Powers model in many aspects9. According to this model, C-S-H exists as a fractal
assembly of spherical globules, that are arranged in different configurations that
control its density and the presence of two types of C-S-H was suggested20 (figure
2.2). The variable density of C-S-H has been proposed in many earlier studies as
well9,10. In a later modification, the spherical globules were replaced by layered
8
Figure 2.1: The Feldman-Sereda model of C-S-H17, the circles show adsorbed water and crosses show inter-layer water

Chapter 2: Cement Hydration: Chemistry and Numerics
bricks, although they are still referred to as globules, in order to explain large
irreversible changes resulting from shrinkage and creep22.
Although the exact chemical structure of C-S-H is not known, it is often
compared to that of jennite and tobermorite3,25. The molecular structure of C-S-H
is beyond the scope of the current study, but it is noteworthy that C-S-H has
generally been attributed with a layered chain structure with short-range
crystallinity3,25,27. This structure also manifests at the sub-micron-scale as in
microscopic studies C-S-H has been described as a platy or fibrous3,6,23,28,27. A
9
Figure 2.2: Schematics of low-density (left) and high-density (middle) C-S-H according to Jennings model20, and the modified globular unit22
Figure 2.3: SEM micrograph of C3S hydrating in paste (from de Jong et al.23) (Left), and TEM micrograph showing low-density fibrillar outer and inner C-S-H in a mature cement
paste (from Richardson27) (Right)

Hydration of Alite
fibrillar C-S-H can be seen in many published micrographs (figures 2.3 and 2.4)
and images resembling suspensions of fibrillar or foil-like C-S-H can also be found.
The fibrous structure of C-S-H has often been used to explain the
development of mechanical properties in cement6,23,28,27. It has been argued that the
fibrous structures grow outwards from cement particles and get tangled, or join
with the fibres from the other particles giving cement its mechanical properties6,18,28.
The microstructure of C-S-H is still not well understood. All models of C-S-H
suffer from different weaknesses and none of them can explain all observed
10
Figure 2.5: TEM image of inner product in a hardened cement paste resembling a colloidal suspension of fibres (from Richardson26)
Figure 2.4: Transmission electron micrograph of low-density product inside the shell (from Mathur24). Pores are in black and materials in lighter tones in this dark-field image.

Chapter 2: Cement Hydration: Chemistry and Numerics
properties. But until the formation of C-S-H cannot be directly observed as it
occurs, our understanding of its structure can only be limited to extrapolative
interpretations of indirect experimental measurements.
2.2.2 Distribution of HydratesThe main problem in understanding the development of cement
microstructure lies in the fact that all the important processes in hydration happen
on the microscopic scale and cannot be observed directly. A combination of various
techniques have traditionally been used to study the hydration of Portland cement
and many different theories regarding the mechanism of hydration and the
structure of hydrates have been presented.
In their pioneering work on the development of cement microstructure in
1940s, Powers and Brownyard29 presented a systematic study of cement hydration
and the development of properties of cement paste. Although their experiments
were largely limited to observed macroscopic phenomena, the theories postulated
extended into the nano-scale. The authors carried out wide ranging experiments
measuring properties such as compressive strength, bleeding rate, length-changes
and weight loss due to drying and presented an extensive set of theories on the
development of properties of concrete and cement. Some of the ideas presented in
their work are still used practically30,31,32.
In their study, cement microstructure was presented as a collection of
spherical gel hydrate particles collecting around cement particles, leaving empty
spaces which were called the capillary pores. A denser inner product, which
constitutes around 45% of the total product, forms inside the original boundaries
of the grains and a lower density outer product fills the space outside, binding the
grains together. The inner product grows inwards and the outer product outwards
from the original grain boundaries.
11

Hydration of Alite
The gel was suggested to contain a water-filled porosity in the vicinity of 28
percent by volume and the water in these pores was referred to as the non-
evaporable water. The spherical particles of gel were later replaced by ribbon-like
fibres in line with microscopic observations. A drawing of the modified model is
shown in figure 2.6. Powers also used this model to explain the mechanical and
frost-resistance properties of concrete9,34,35.
The Powers’ model of cement microstructure was originally developed before
high resolution electron micrographs of cement were available, but later
microscopic observations reinforced and improved many of the ideas presented. For
example, the spherical gel particles in the Powers model were replaced by ribbon-
like fibres9 in line with electron micrographs presented by Grudemo36,37, who was
one of the first to study the microstructure of cement paste using electron
microscopy. While there were some discrepancies between the early observations,
most studies agreed with the growth of an outer product away from the grain and
an inner product towards the hydrating particles6,38,39,40. It was noted that no clear
boundary between the inner and outer products was apparent40.
While the microstructure can be affected due to sample processing before
microscopic observations, the micrographs still provide important information
about the development of the microstructure. Hadley41 observed the presence of
shells of hydrates around cement grains, at a small distance, in SEM images of
12
Figure 2.6: Drawing of cement microstructure for 0.3 w/c having a capillary porosity of 7%33. Spaces marked 'C' represent capillary pores.

Chapter 2: Cement Hydration: Chemistry and Numerics
fracture surfaces. The shells were observed to remain unfilled even after 28 days of
curing. He also observed the growth of needle-like crystals, thought to be
ettringite, inside the shells. In many cases the shells were found to be completely
hollow, without cement grains inside them and these features were later named
“Hadley Grains”. The presence of these hollow shells was later confirmed in other
studies and the growth of products, both inwards and outwards, from this shell
with hydration became the accepted mechanism of microstructural
development42,43,44,45. This also led to the conclusion that hydration takes place by
the dissolution of anhydrous phases and their later deposition relatively far-away.
Recent studies have shown that the shells are in fact not completely hollow and
contain a fibrous low density product, which can only be observed at very high
magnifications24 (figure 2.4).
Using a combination of different electron microscopy techniques, Scrivener44
presented the evolution of hydration (figure 2.7) as the formation of AFt
(Alumino-Ferro-tri) needles around cement grains at the onset of hydration and
the later deposition of outer C-S-H on these needles at a distance from the reacting
particles, explaining the formation of hollow shells. Although at first it was
suggested that these hollow shells are limited only to cements and are not observed
in pure alite46, recent studies have indicated the presence of shells and Hadley
grains in the hydration of pure C3S, where the only known hydrates are C-S-H and
portlandite47.
13
Figure 2.7: Evolution of a hydrating cement grain (after Scrivener44)

Hydration of Alite
It must be noted here that most samples for electron microscopy go through
extensive preparation, usually involving drying, fracturing or polishing and
impregnation in resin, which could alter the microstructure. Still electron
microscopy is a powerful means to study processes that may otherwise not be
visible.
2.3 Hydration Kinetics of CementDifferent phases of cement react at different and time-varying rates. As
cement hydration is exothermic in nature, heat evolution measured by calorimetry
is an effective method of following the overall progress of hydration. Figure 2.8
shows the typical heat evolution curve recorded using an isothermal calorimeter
during approximately the first day of hydration of ordinary Portland cement. The
curve is broadly divided into five stages.
The first stage gives a rapid evolution of heat for several minutes. This is
generally attributed to the initial rapid dissolution of cement particles and a rapid
hydration of the aluminate phase48. A continuous low evolution of heat is observed
in the second stage of the process. This stage is referred to as the induction period
or the dormant period and, although the mechanism behind this period is disputed,
14
Figure 2.8: Typical heat evolution curve of Portland cement

Chapter 2: Cement Hydration: Chemistry and Numerics
it is apparent that there is some barrier to reaction before it picks up again in the
next stage. In stage three, the reaction accelerates for a few hours before a peak is
reached. The heat evolution subsides in the following hours in stage four and
settles to a more constant value in stage five38,49,50.
At any stage of hydration, the observed heat evolution might be the result of
a combined reaction of more than one cement phase and it is difficult to isolate the
contribution of individual phases. Although these phases might behave in a
different way in isolation than in the presence of other phases in cement, studies
on pure cement phases have provided valuable information about the reaction
mechanism and kinetics of each phase in cement. Since alite, the primary phase in
cement, is focussed upon in this study, the hydration of alite is discussed in more
detail in the following discussion.
2.4 Stages of Alite HydrationFigure 2.9 shows the typical heat evolution curve from the hydration of alite.
As shown in the figure. the curve can be divided into five main stages, the
commonly used names of which are listed below:
• Stage 1: Dissolution period,
15
Figure 2.9: Typical heat evolution curve of the alite phase

Stages of Alite Hydration
• Stage 2: Induction period,
• Stage 3: Acceleration period,
• Stage 4: Deceleration period, and
• Stage 5: Slow reaction.
2.4.1 Stages 1 & 2: Dissolution and Induction PeriodsA large evolution of heat, generally attributed to the rapid dissolution of C3S,
which rapidly subsides within a few minutes, is observed in the first stage of the
curve38. It has been shown that the rate of dissolution in this stage depends on the
particle size, crystalline structure and defects of C3S51,52. Leading into the second
stage, the rate of reaction slows-down considerably before a saturation with respect
to the anhydrous phases is reached48 and it has been proposed that the dissolution
slows down due to saturation with respect to C-S-H53. It has also been suggested
that the reaction slows down due to the formation of a meta-stable layer of
hydrates around the reacting particles38,54.
The second stage witnesses a much lower heat evolution that can last for
over an hour. Despite this stage being often referred to as the dormant period, a
continuous heat-evolution is observed in this stage. This indicates that the reaction
continues at a slow rate during this period.
The mechanism behind the second stage has long been a subject of debate.
Possibly due to the shape of the evolution during the first two stages, which looks
similar to the dissolution of salts nearing saturation, the induction period was at
first attributed to saturation with respect to the anhydrous phases55, but this was
quickly rejected as evidence indicated much lower concentrations in the solution48.
The formation of an inhibiting or protective layer of early hydrates around the
reacting particles, which is later breached, was suggested to slow down the
reaction during the induction period54,56,57,58.
16

Chapter 2: Cement Hydration: Chemistry and Numerics
Kondo and Ueda38, and later Pommersheim and Clifton49, presented the
mechanism of early hydration of cement using mathematical models, where the
induction period was explained by the formation of a protective layer on the
surface of the particles and the subsequent acceleration was explained by the
gradual erosion of this layer. These models are discussed in more detail in section
2.5.1. It was also suggested that calcium ions tend to dissolve faster than the
silicate ions upon the initial hydrolysis of C3S immediately after mixing with water
and the adsorption of these calcium ions on the silica-rich surface layer could lead
to a slow-down in the dissolution of C3S59. Still, no conclusive evidence of the
presence of any inhibiting layer has been reported and most arguments in its
favour are speculative.
The poisoning of CH crystals by SiO2 has also been suggested to cause the
induction period59,60. It has however been shown using dilute solutions of alite that
the nucleation of portlandite can be repressed until the accelerating part of the
reaction, indicating that CH crystals do not play a role in the induction period61.
It is now widely accepted that once the pore-solution is saturated, which
generally happens during mixing, the nucleation and growth of C-S-H starts53,62.
According to this viewpoint, the induction period is not a separate chemical or
physical process, and is observed because the rate of reaction, albeit accelerating, is
too low to be measurable. This inference is also supported by the fact that
induction period is found to be shorter for finer powders where the reaction in the
third stage is faster56,63.
2.4.2 Stage 3: Accelerating Reaction RatesIn the third stage the hydration accelerates until a peak is reached. As this
feature is consistently observed in all studies and is, in all certainty, directly linked
to the mechanism of the reaction, the reason for this acceleration has been, and
continues to be, the subject of an extensive debate. The reaction rate and the
17

Stages of Alite Hydration
position of the peak is known to depend on the temperature and the particle sizes
of C3S64. The rate of reaction is also known to depend on the crystal structure and
surface defects in C3S51,52.
In most of the early work on hydration kinetics, the first four stages of
hydration were explained using separate processes38,49,65. As discussed earlier, Kondo
and Ueda38, and Pommersheim and Clifton49, explained the acceleration in the
reaction rate by the gradual deconsumption of a protective layer that forms early
in the reaction54. While many recent studies still propose similar mechanisms, no
conclusive evidence to the presence of a protective layer is reported.
In 1970 Tenoutasse and DeDonder50 suggested that a single mechanism of
nucleation and growth could be used to explain the behaviour observed in stages 2
to 4. One of the reasons for this conclusion was that the Johnson-Mehl-Avrami-
Kolmogorov equation66,67,68,69, which models the nucleation and growth of solid
nuclei in a homogeneous fluid medium, can be used to fit the observed rate of
hydration for cement. Later studies verifying that this equation can be used to fit
the rate of hydration in pure-alite56,64,70 and for Portland cement71 leant further
credence to the possibility of cement hydration being controlled by a nucleation
and growth mechanism.
The nucleation and growth mechanism is a demand based process and the
rate of the reaction is not limited by the availability of reactants. In this process,
germs of the product form and start to grow at a rate that is proportional to the
surface area available on these germs. Since these germs can redissolve, they have
to reach a minimum critical size over which growth is preferred to dissolution. The
nuclei continue to grow at a rate proportional to their free surface area leading
first to an acceleration in the process, and then a subsequent deceleration due to
reduction in the available surface area resulting from impingement of neighbouring
nuclei66,67,68,69. This process results in an S-shaped evolution of the reaction similar
to that observed in cement.
18

Chapter 2: Cement Hydration: Chemistry and Numerics
Based on the nucleation and growth mechanism, it was suggested that a slow
nucleation of C-S-H occurs on the surface of alite particles during the so-called
induction period. Once the nuclei reach a critical size the reaction accelerates,
entering the third stage63,72,73. While most authors have suggested the formation of a
continuous layer of C-S-H forming over the surface of C3S particles63, it was
recognised that increase in the surface area of the particles due to growth of
particles could not account for the increased reaction rate. Studies have suggested
the possibility of discontinuous growth of nuclei on the surface of the particles well
into the third stage of the reaction53,74.
Apart from slight variations, it is now generally accepted that the nucleation
and growth mechanism is responsible for the observed acceleration in stage three.
The reaction kinetics of alite during the nucleation and growth period are
discussed in more detail in chapter 5.
2.4.3 Stages 4 & 5: Reducing Reaction RatesIn stage 4, the reaction rates slow down to almost half their value quickly
followed by a slower reduction in stage 5 until most of the C3S or water has been
consumed70. In most early studies, it was postulated that thickness of hydrates
depositing over the cement particles increases with hydration and the rate of
reaction is controlled by the diffusion of ions through this layer of hydrates.
According to this theory, stage 4 occurs when a shift towards a diffusion controlled
mechanism starts and in stage 5 the reaction is controlled entirely by diffusion and
the availability of materials38,75.
Some recent studies have indicated that the nucleation and growth
mechanism can also be used to explain the observed behaviours until a few hours
after the peak74,62. In these studies, the reduction in the reaction rate is explained
by the reduction in the available surface area for growth due to impingement
between neighbouring nuclei, either from the same particle, or from the
19

Stages of Alite Hydration
surrounding particles. It has also been suggested that as the nucleation and growth
process continues, the surface of the particles gets progressively covered by
hydrates, leading to a diffusion controlled regime when the entire surface of the
particles gets covered61. However, no conclusive evidence of this was found.
Only a limited number of studies focussing on these stages of hydration have
been found and the reaction mechanism in these stages is still not clear. If a
diffusion controlled regime is assumed, the point of transition from the nucleation
and growth mechanism to diffusion controlled kinetics is also not clear.
2.5 Analytical and Numerical Models of Hydration Kinetics
2.5.1 Concentric Growth ModelsKondo and Ueda38, and later Pommersheim and Clifton49,75, explained the
hydration kinetics of alite using mathematical models of suggested mechanisms
acting due to concentric layered growth of hydrates over reacting spherical cement
particles (figure 2.10). In both these models, an initial layer of meta-stable
hydrates forms upon the first contact of cement with water. This “barrier-layer” of
early hydrates slows down the reaction, leading to the so-called “induction period”.
This layer dissolves or becomes more permeable with time leading to an
acceleration in the reaction rate.
20
Figure 2.10: Schematic representation of hydrating C3S grain in concentric growth models by Kondo and Ueda38 (left) and Pommersheim and Clifton49 (right)

Chapter 2: Cement Hydration: Chemistry and Numerics
With hydration the reacting core of the particle reduces and is replaced by an
inner hydration product, which grows inwards from the original “barrier-layer”.
Outside this layer an outer hydration product grows outwards into the capillary
pore-space. Once the cover of hydrates around the particles reaches a certain
thickness, the resistance offered to the reacting ions becomes sufficiently high to
control the rate of the reaction, and the reaction shifts to a diffusion controlled
regime. The relations used by the authors of these models can be found in the
original works referred to above. Since each mechanism uses a different equation,
the relation that predicts the slowest reaction rate any any instant in time is
chosen as the governing mechanism.
Although these and other similar models were used to explain the hydration
kinetics of alite for many years, experimental observations did not show the
presence of a protective “barrier-layer” during the induction period or afterwards.
Since the presence of this layer is crucial to the validity of these models, the
validity of these models is often questioned. However, the idea of spherical cement
particles with concentric growth of hydrates is still widely used to model various
phenomena.
Various other simple mathematical relations have been developed to model
chemical processes using the assumption of a spherical reaction front. While most
of these models were developed for systems other than cement, they have been
widely used to model cement hydration. For example, one such sigmoid relation,
which was developed by Jander76 for solid state reactions, has been used in various
forms to fit the early evolution of hydration38,64. One of the frequently used forms of
this equation is shown in equation 2.3.
r =1−1− ktr 3
(2.3)
21
Analytical and Numerical Models of Hydration Kinetics
In this equation α is the degree of hydration, t the time, k is the rate constant
and r the radius of the particle. This equation models the formation of a
thickening diffusion barrier on the reaction surfaces that slows down the reactions.
Ginstling and Brounshtein77 derived another expression to account for the
reduction in the interfacial area between the reactants and the products (eq. 2.4).
1−23−1−
23=
ktr 2
(2.4)
A problem with using these relations with cement is that while most of these
relations are derived for a single particle or for a powder with particles of the same
size, cement is composed of particles of a wide range of sizes and these relations
may therefore not be applicable to cement65,78. In the models that choose between
multiple mechanisms, such as the Pommersheim and Clifton model discussed
above, the switch between different regimes could take place at different moments
for different particles, which cannot be accounted for in single particle models.
These relations could still be applied to polydisperse powders by adding the effect
of individual particle sizes and it was also shown that the fit parameters in this
case are not the same as in the case when the fits are made assuming a single
averaged particle size64.
Relations modelling similar mechanisms to explicitly consider the effect of
different particle sizes have also been developed specially for cement79,80,81,82. While
these relations provided insight about hydration, since each equation is dedicated
to a single hypothesised mechanism for which it is derived, the derivation, and
even the use, of these relations may be cumbersome. Moreover, while these
relations can be useful in studying systems where the reaction mechanism is
understood, a good fit of experimental data with these equations does not
necessarily mean that the mechanisms being studied are similar to those assumed
for the derivation of the equation. In fact most sigmoid equations with sufficient
number of parameters can be fit to cement hydration.
22

Chapter 2: Cement Hydration: Chemistry and Numerics
2.5.2 The Johnson-Mehl-Avrami-Kolmogorov EquationThe Johnson-Mehl-Avrami-Kolmogorov equation66,67,68, more commonly
referred to as the Avrami equation, was originally empirically derived by Austin
and Rickett to model the decomposition of austenite69. The later derivations of the
equation modelled the rate of phase change in solidifying metal melts. Although
this equation could also be considered a concentric growth model, it is being
considered separately here because of its frequent use in cement. This equation
models the nucleation and growth process, where small nuclei of the product form
at random locations in the pore-space and grow to overlap and form a solid
skeleton, at constant rates on all available surfaces. In the derivation, spherical
isotropic growth of the nuclei is assumed, and the reduction in the surface area due
to overlaps between neighbouring nuclei is accounted for statistically.
The most commonly used form of this equation is shown in equation 2.5,
where α is the degree of phase change, t the time, and k and n are parameters that
depend on the rate of reaction and the mechanism of growth of crystals
respectively.
−ln1−=ktn (2.5)
23
Figure 2.11: Schematics of overlapping spherical grains from Avrami67

Analytical and Numerical Models of Hydration Kinetics
While this equation has often been erroneously used for systems with varying
temperature, it is only applicable to isothermal systems. To study the rates of
reactions, the equation can be differentiated to the form in equation 2.6.
dd t
=kntn−1e−kt n
(2.6)
Although in the original theory, n was defined to be an integer between 1
and 4, it was found that the value of n may be non-integral83,84. Later, the
parameter n was further defined in terms of three other parameters, P, S and Q as
shown in equation 2.7.
n=PS Q (2.7)
In this equation P is a dimensionality constant for the growth of products,
being 1 for a one-dimensional growth, 2 for a two-dimensional growth and 3 for a
three-dimensional growth. S is related to the rate-limiting mechanism, being 1 for
interface controlled growth, where the creation of new surface controls the rate,
and 2 for cases where the diffusion of ions to the growth sites controls the rate. Q
depends on the nucleation rate, being 1 for a constant nucleation rate and 0 for
cases where only an initial nucleation event occurs56. This means that as long as
the mechanism of a reaction remains the same, the value of n should stay constant
for a reaction.
Tenoutasse and DeDonder50 reported the first use of this equation to model
cement hydration. Many researchers have since reported good fits of the equation
with experimental results56,64,70,71 and the Avrami equation has become the most
widely accepted relation used to model the early-age hydration kinetics of cement.
In the Avrami equation, the parameter k is a combined rate constant that
can depend on many factors such as the rate of nucleation and the rate of growth,
the diffusion in solution and the temperature of the system. In the case of cement,
24

Chapter 2: Cement Hydration: Chemistry and Numerics
this factor can depend on the temperature, the state of the pore-solution and the
specific surface, and hence by extension the particle size distribution, of the
cement, amongst other factors. Although some studies assumed a negligible effect
of particle size distribution on hydration85, it is generally accepted that the fit
value of k in the Avrami equation is found to be higher for finer cements64,78, which
directly follows from the fact that finer cements exhibit higher reaction rates.
However, a relation linking the variation of k to the particle size distribution or the
specific surface area of cement can not be found in the literature.
Although the value of n in the Avrami equation should depend only on the
reaction mechanism, wide discrepancies in reported values for cement and alite
hydration can be found in the literature. While in the original application of the
equation by Tenoutasse and DeDonder50, 3 was found to be an acceptable value for
n, later studies found n to vary between 2 and 356,70,86. Earlier, Bezjak and Jelenik64
had suggested that the lower observed values of n could be due to
misinterpretation of the Avrami parameters for poly-sized cement specimens. They
pointed out that, in a poly-sized cement specimen, particles of different sizes react
together and are at different stages of the reaction at any moment in time. This
results in an overall behaviour that is a mixture of the overlapping of hydration
mechanisms, making the interpretation of the Avrami parameters difficult.
Consequently, the observed value of n could also result from a combination of
different mechanisms acting together.
The use of the Avrami equation in cement has often been criticised. One of
the important criticisms arising from the above discussion is that the use of this
equation usually becomes only a fitting exercise, and the relationship between the
fit-parameters and the material properties or the reaction mechanism is not clear.
It has also been shown that the fits are not sensitive to the value of n and that
with a variation in n, the data can still be fit by varying k70. The fits do not
25
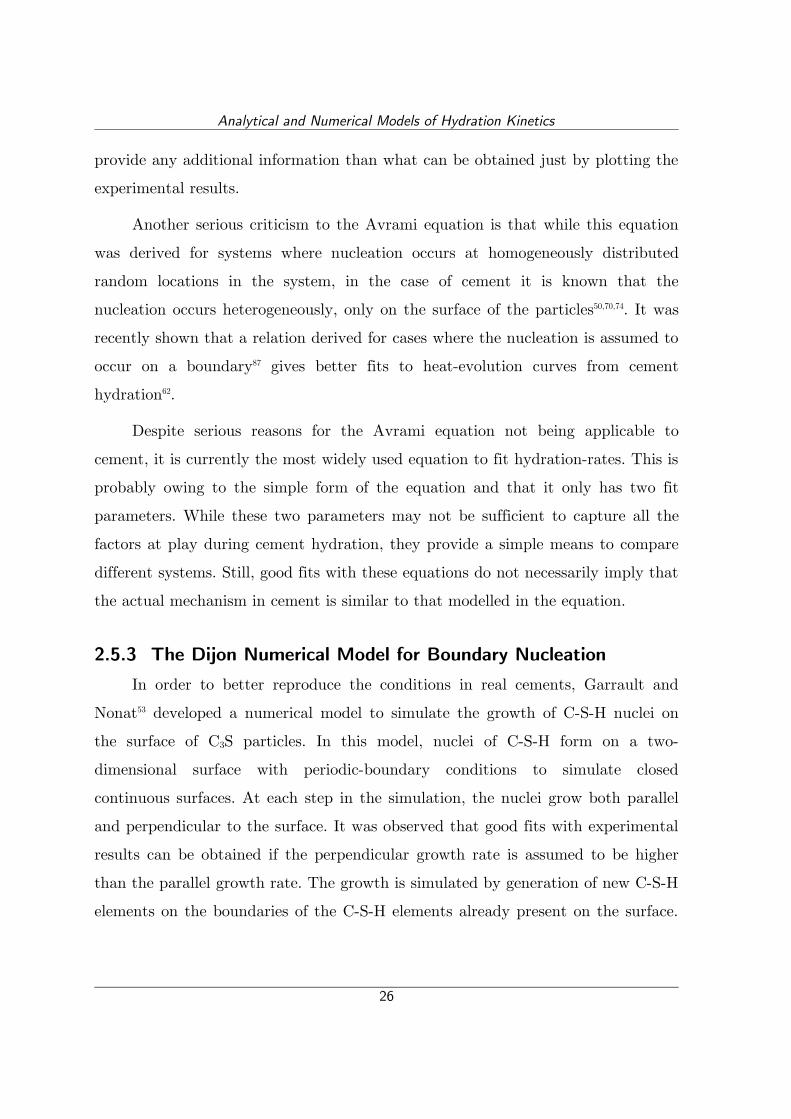
Analytical and Numerical Models of Hydration Kinetics
provide any additional information than what can be obtained just by plotting the
experimental results.
Another serious criticism to the Avrami equation is that while this equation
was derived for systems where nucleation occurs at homogeneously distributed
random locations in the system, in the case of cement it is known that the
nucleation occurs heterogeneously, only on the surface of the particles50,70,74. It was
recently shown that a relation derived for cases where the nucleation is assumed to
occur on a boundary87 gives better fits to heat-evolution curves from cement
hydration62.
Despite serious reasons for the Avrami equation not being applicable to
cement, it is currently the most widely used equation to fit hydration-rates. This is
probably owing to the simple form of the equation and that it only has two fit
parameters. While these two parameters may not be sufficient to capture all the
factors at play during cement hydration, they provide a simple means to compare
different systems. Still, good fits with these equations do not necessarily imply that
the actual mechanism in cement is similar to that modelled in the equation.
2.5.3 The Dijon Numerical Model for Boundary NucleationIn order to better reproduce the conditions in real cements, Garrault and
Nonat53 developed a numerical model to simulate the growth of C-S-H nuclei on
the surface of C3S particles. In this model, nuclei of C-S-H form on a two-
dimensional surface with periodic-boundary conditions to simulate closed
continuous surfaces. At each step in the simulation, the nuclei grow both parallel
and perpendicular to the surface. It was observed that good fits with experimental
results can be obtained if the perpendicular growth rate is assumed to be higher
than the parallel growth rate. The growth is simulated by generation of new C-S-H
elements on the boundaries of the C-S-H elements already present on the surface.
26
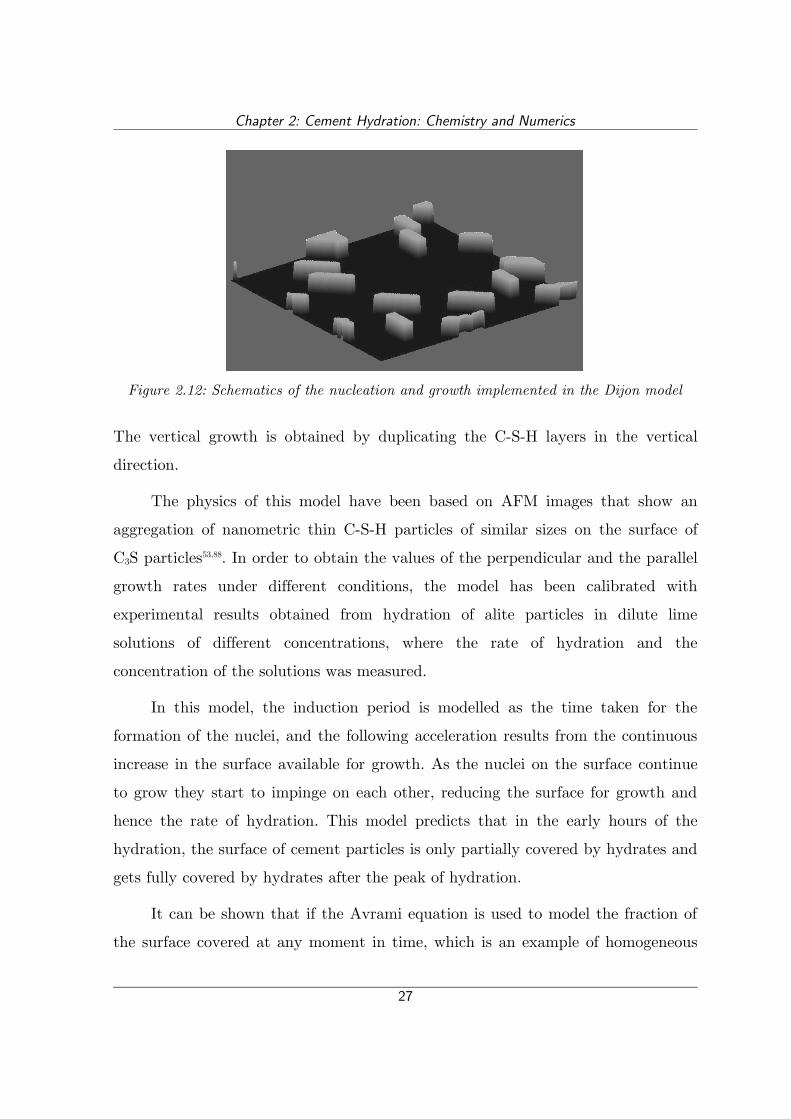
Chapter 2: Cement Hydration: Chemistry and Numerics
The vertical growth is obtained by duplicating the C-S-H layers in the vertical
direction.
The physics of this model have been based on AFM images that show an
aggregation of nanometric thin C-S-H particles of similar sizes on the surface of
C3S particles53,88. In order to obtain the values of the perpendicular and the parallel
growth rates under different conditions, the model has been calibrated with
experimental results obtained from hydration of alite particles in dilute lime
solutions of different concentrations, where the rate of hydration and the
concentration of the solutions was measured.
In this model, the induction period is modelled as the time taken for the
formation of the nuclei, and the following acceleration results from the continuous
increase in the surface available for growth. As the nuclei on the surface continue
to grow they start to impinge on each other, reducing the surface for growth and
hence the rate of hydration. This model predicts that in the early hours of the
hydration, the surface of cement particles is only partially covered by hydrates and
gets fully covered by hydrates after the peak of hydration.
It can be shown that if the Avrami equation is used to model the fraction of
the surface covered at any moment in time, which is an example of homogeneous
27
Figure 2.12: Schematics of the nucleation and growth implemented in the Dijon model

Analytical and Numerical Models of Hydration Kinetics
nucleation in two-dimensions, the volume of product (V) on the surface can be
written as equation 2.8 where A is the surface area of the particle, kpar the parallel
growth rate constant, kperp the perpendicular growth rate and t the time.
V=A⋅1−exp−kpar⋅t2⋅kperp⋅t (2.8)
One of the critical drawbacks of this approach is that while the growth of
nuclei is considered explicitly, the effect of inter-particle interaction is not
considered. Since the setting of cement can mechanically occur only when the
hydrates start to bind the particles together, the interaction between the hydration
products from different particles starts before the set. In this model, although the
reaction rate is modelled until times well beyond the observed setting times of
normal cement, the interaction between different particles cannot be considered in
the numerical system used in this model. Still, this model provides important
information about cement hydration as the parameters obtained from this model
are able to predict reaction rates in systems that are significantly different from
those used for calibration.
2.6 Summary of Cement Hydration and Outstanding Questions
It can be seen from the above discussion that while tremendous progress in
understanding cement has been made, many outstanding questions remain. In this
section, the aspects of our knowledge relevant to this study and the pertaining
questions are discussed. Since the current study focusses on alite, the discussion is
limited to the points relevant to alite.
Although most of the reactant and product phases in alite hydration are
known, discrepancies in the chemical composition of C-S-H exist. While the
properties exhibited by cement indicate complexity in its structure, an accurate
model of C-S-H structure is not available and descriptions of the product vary
from colloidal to fibrillar. Fibres or suspension of fibres of C-S-H can be often
28

Chapter 2: Cement Hydration: Chemistry and Numerics
observed in micrographs, but the observations are at times inconsistent. As
samples are dried before observation, the microstructure of the samples could be
altered and the morphology of C-S-H is still not well understood. The density of C-
S-H has been shown to vary and the exact range of this variation is not known.
The fibres observed in micrographs could indicate the variation of the density over
a wide range.
Even though the presence of empty hollow shells around cement particles has
been widely accepted, recent results show that the shells are not empty and are
filled with a low density product. This observation is contrary to the belief that
the inner product is always “high-density”.
Compared to C-S-H, CH displays more consistent properties, but it hasn’t
been as extensively studied as C-S-H. The shape and size of CH crystals is known
to vary, but their relationship with various controlling factors is not well
understood. An early idea that portlandite might play an important role in
reaction kinetics was later rejected.
While the hydration mechanism during the induction period is still not clear,
it is generally agreed that the nucleation and growth of C-S-H controls the
hydration kinetics. Nucleation and growth is a physical process depending on the
shape and dispersion of a phase and proper understanding of the kinetics would
require a better knowledge of the morphology of C-S-H.
The hydration mechanism after the peak of hydration and the point of shift
from the nucleation and growth regime to a diffusion controlled regime is also not
clear. Data concerning the post-peak hydration is limited and it is generally
assumed that hydration peaks due to a shift to a diffusion controlled mechanism.
However, the disperse nature of C-S-H observed in micrographs suggests high
permeability for fluids and ions. Studies have also shown the possibility of the
nucleation and growth mechanism explaining the post-peak behaviour.
29
Summary of Cement Hydration and Outstanding Questions
Understanding hydration is critical to the progress of cement science and it is
hoped that answers to some of the questions above are brought out in the current
study.
2.7 Modelling Cement HydrationThe tremendous advances in computing technology in the last few decades
have provided a great impetus to computer based scientific research. Increased
speeds and availability of computers have made possible extensive numerical
modelling of various extremely complex materials and processes. Computer based
numerical models, at the same time, provide a methodology to study the anomalies
and characteristic peculiarities of a material by allowing comparison of model
derived values against those experimentally observed. The use of numerical
modelling is arguably best justified for complex composite materials like cement,
where simplified equation based models would entail over-simplification of the
problem and would overlook some of the smaller features that could significantly
affect the final result.
In the hundred odd year history of cement research, a number of studies have
focussed on developing prediction models of cement behaviour. The compressive
strength of cement has been the focal point of most of these studies and is still a
critical parameter in determining the quality of a cement.
The mechanical properties of concrete vary over time, directly dependent on
hydration and the development of cement microstructure. Mechanical strength of
materials is known to reduce with increasing porosity and several relations linking
the two have been proposed for different materials89,90,91. On the basis of a wide
experimental programme, Powers proposed an empirical relationship linking the
gel-space ratio to mechanical strength of mortars9 (figure 2.13). The gel-space ratio
is defined as the ratio of the volume of hydrates, to the volume that the hydrates
can occupy and is therefore directly related to porosity.
30

Chapter 2: Cement Hydration: Chemistry and Numerics
While this relationship might hold for one particular type of mix, it would be
a gross generalisation to assume that the changes in arrangement and structure of
porosity and the microstructure do not have a role to play. Figure 2.14, which
compares the variation of compressive strength with porosity against Balshin's89
model for different systems92, clearly shows that a mortar mix can have twice as
31
Figure 2.14: Experimental scatter of compressive strengths of different systems against Balshin's model92
Figure 2.13: Relationship of compressive strength with gel-space ratio (after Powers 19589)

Modelling Cement Hydration
much mechanical strength for the same porosity, clearly demonstrating the
importance of accounting for microstructure and not just the total porosity in the
calculation of mechanical properties.
In recent years an increasing emphasis is being laid on durability based
design. With the demands on concrete structures increasing rapidly, problems like
corrosion, ion transport and other long term effects have gained focus in many
studies and porosity and pore-connectivity have been found to be important
parameters controlling deterioration. Since most of these effects are long term, only
accelerated tests, whose accuracy is frequently questioned, are possible in
laboratories. Furthermore, these phenomena are microscopic in nature and depend
on three-dimensionally connected pores that are hard to study using the test
methods currently today. Microstructural models can hence play a vital role in
providing information that would be vital to understanding cement.
Given our current understanding of cementitious materials, no computer
model can claim to accurately model cement paste. However, it is still possible to
compute properties at various stages based on certain assumptions that, despite
simplifications, maintain the essence of processes that lead to the formation of the
material. These computed values can then be used both to predict the properties
and to understand the processes underlying cement hydration, satisfying both
engineers and scientists.
All models are by definition a simplified representation of the reality and are
valid only in the range of assumptions and simplifications made during the
development of the model. However, this does not in any way reduce the value of
the models as long as the simplifications are made keeping the objective of the
model in mind and the limitations are understood by the user. In fact every
different assumption or simplification of a problem can be considered to be a
different approach to the problem. Many different models and approaches to
modelling cement have therefore emerged over the years and several of them are
32

Chapter 2: Cement Hydration: Chemistry and Numerics
still being developed. Some of these approaches are discussed in the following
sections in chronological order. Since the current study presents a new
microstructural model, mainly the currently available microstructural models are
focussed on.
2.7.1 Numerical Models for Cement Microstructure
2.7.1.1 Numerical Concrete
Numerical concrete was one of the first attempts to model the mechanical
properties of concrete as a composite94,95,93. In this model two-dimensional sections
of concrete with aggregates having spherical, polygonal or other arbitrary shapes
were generated from statistical representation of three-dimensional specimens and
meshed (figure 2.15). The finite element method was then used to calculate the
mechanical properties of the samples. Although this model does not simulate
cement hydration, the approach of analysing the properties of concrete as a
composite material is note-worthy and numerically generated cement
microstructures can be similarly analysed for mechanical or other phase-related
properties.
33
Figure 2.15: A meshed section from Numerical Concrete (after Sadouki and Wittmann93)

Modelling Cement Hydration
2.7.1.2 Jennings and Johnson Model
Around the same time as numerical concrete, a three-dimensional model
simulating the hydration of C3S was developed by Jennings and Johnson96,97
working at the National Bureau of Standards (now known as the National
Institute of Standards and Technology or NIST), USA. In this model the cement
particles were represented as spheres placed inside a cubic specimen. Hydration
was simulated as the reduction in the radii of the anhydrous phases and the
concentric growth of C-S-H layers on the surface of these particles. CH particles
grew as new nuclei formed in the pore-space. The overlaps between particles
increased with hydration and were accounted for by redistribution of products in
space (figure 2.16). It was noted that spheres have a significant advantage over
other shapes in simulations due to computational factors. In the Jennings and
Johnson model, all spheres were represented by the coordinates of their centres
and radii. This approach of representing shapes using properties that are not
limited by a resolution was later referred to as the continuum approach. This term,
however, does not accurately represent the approach and can be confused with
other disciplines such as continuum mechanics. For this reason this approach has
now been renamed the “vector approach”. Due to limited computational power at
the time of development, this model was not widely used and could not be
developed further.
34
Figure 2.16: Microstructure (left) and adjusting for overlaps (right) in the Jennings and Johnson model96

Chapter 2: Cement Hydration: Chemistry and Numerics
2.7.1.3 CEMHYD3D
Another model using a significantly different approach, known as the discrete
or pixel approach, was later developed at NIST98,99. In this model, called
CEMHYD3D, the microstructure is stored as a grid of discrete three-dimensional
cubic elements, called volume-pixels or voxels. Each voxel is marked as an
anhydrous or hydrate phase or pore. The model uses the cellular-automata (CA)
approach, which was developed in the 1950s by John von Neumann, with the help
of his co-worker Stanislaw Ulam, to study biological self-replication100. In the CA
approach, at any step in the simulation, every cell (or voxel) in a system can have
one of a finite number of pre-defined states and is allowed to update its state to
another of the pre-defined states based on its neighbourhood.
In CEMHYD3D, the CA approach has been used to simulate the diffusion of
species through the pore-water leading to reactions and precipitations as in figure
2.17. In the figure, the first set of pixels in dissolution and diffusion/reaction
indicate the initial states of the pixels and the following three sets of pixels
indicate the states after a movement of the pixel in the centre in the direction
indicated by the arrow. In short, in this set-up, when a solid pixel attempts to
move into water it dissolves, and when a diffusing specie moves towards a solid
boundary it reacts.
35
Figure 2.17: Cellular automata as applied in CEMHYD3D for dissolution (top) and diffusion or reaction (bottom), black squares show solid phases, grey squares show
diffusing phases and white boxes show water

Modelling Cement Hydration
For the development of this model, an extensive set of cement specimens was
analysed using microscopy and other techniques. Properties such as particle
shapes, distribution of phases and reactions were represented statistically for
different types of cements. As the resolution of these analyses was limited to 1 μm,
this is also the smallest possible size of a voxel in this model. The cellular-
automata was then set up with the probabilities of events being derived from the
statistical analysis. Spherical particles of sizes dependent on the mesh size are
packed in a cubic computational volume and are assigned phases based on the
input characteristics of the cement. The cellular-automata system is then started
and species are allowed to undergo phase transitions according to the chart shown
in figure 2.18.
CEMHYD3D is still one of the most widely used and well known models in
cement today. The discrete approach is well suited for easy spatial distribution of
different phases and representation of different shapes and faster calculations. Also,
as the model is already in the form of discrete elements, this approach can be
easily integrated with finite element methods for calculation of mechanical
properties. Another advantage of this approach is that due to the regular nature of
the mesh, most operations on the system are fast. Support of randomly shaped
cement particles, reconstructed from X-Ray tomography results, has been also
included in the recent versions of the model102,103. The functionality of the model
36
Figure 2.18: State transition diagram for CEMHYD3D101

Chapter 2: Cement Hydration: Chemistry and Numerics
has been extended to calculate mechanical properties, early age properties and
durability of different cement systems, largely based on empirical relations.
However, the validity of using the rather coarse mesh, as in this model, for
calculation of all these properties can be questioned.
Despite the computational advantages, the discrete approach suffers from
several shortcomings when applied to cement. One of the most important problems
in this approach arises from that the fact the size of the smallest feature that can
be represented in the computations is limited by the size of the voxel and features
with sizes close to that of the voxel are represented less accurately. This
shortcoming has important implications in cement as while the size of the voxels in
this model is limited to 1 μm, real cement contains particles that are only a
fraction of a micrometre in size. Given the large range of particle sizes in cement, if
the size of the voxels were to be reduced to accommodate all sizes of cement
particles present, the total number of elements in the system would be
prohibitively large to analyse. Furthermore, as the size of capillary pores in cement
goes down to 10 nm, a large part of the pore-features cannot be represented even
with this large number of elements.
One of the major criticisms of CEMHYD3D is that because of the cellular-
automata used in the model, very early into the hydration, cement particles
disintegrate into single voxels and “diffuse” in the microstructure. Due to this no
clear boundaries of cement particles remain and the system can be compared to a
soup of voxels, whereas distinct boundaries of cement particles can be clearly seen
in micrographs (figure 2.19). Being a microstructural model, the relative
arrangement of phases in the microstructure is a property that should be preserved
in the model. Another criticism of the model is that the cellular-automata scheme
used prevents direct conversion of the simulation steps to time, necessitating
empirical calibration with experiments. Also, while this model attempts to simulate
37

Modelling Cement Hydration
the diffusion of species in the microstructure, the correct representation of ionic
movements is not possible at 1 μm scale.
When conceived CEMHYD3D was an important development, but its use has
been extended beyond its capabilities, pointing towards the need for a new
microstructural model that can take the recently acquired knowledge into account
and to make proper use of the currently available computational power. The wide
use of this model also shows the lack of simple user-friendly models in the field of
cement.
2.7.1.4 DuCOM
A multi-scale model, called DuCOM, to model concrete has been developed
at the University of Tokyo104,105. This model has been developed as a finite-element
package aimed at predicting the durability of structures based on semi-empirical
relations connecting a large number of process parameters to the final properties of
the structure. This model simulates the pore-sizes in cement based on the
hydration of representative unit cells. Although this model is not a microstructural
model, its development has been backed by a comprehensive experimental and
analytical program presenting interesting co-relations between process parameters
and concrete properties. This model also highlights the complexity of processes
38
Figure 2.19: Comparison of an SEM image (left) to a slice from CEMHYD3D (right) at the same resolution

Chapter 2: Cement Hydration: Chemistry and Numerics
underlying concrete construction and the importance of durability based design in
structures.
However, this model depends almost entirely on empirical relations that have
been calibrated to experimental results. Furthermore, the hydration is simulated
using a single particle of cement. The median size of the particle size distribution
of the cement is used as the size for this particle.
2.7.1.5 HYMOSTRUC
Using a vector approach similar to that used by Jennings and Johnson
earlier, a microstructural model simulating the cement hydration was developed by
van Breugel106,107. In this model, the hydration of equally spaced cement particles is
followed based on the assumption that reaction rate of a particle depends only on
the particle size and not on its neighbourhood. As the particles react concentric
layers of hydrates form around cement grains causing particles to grow and come
in contact with each other (figure 2.20). In this model, the pore-size distribution is
modelled assuming a logarithmic variation shown in equation 2.9.
V por=a⋅ln 0 (2.9)
In this equation Vpor is the pore-volume, φ the size of the pore, φ0 the size of
the smallest pore fixed at 0.002 μm, representing the boundary between gel-pores
39
Figure 2.20: Schematics of hydration in HYMOSTRUC106; the hydration is simulated as the concentric growth of particles

Modelling Cement Hydration
and capillary pores, and a is the pore-structure constant that depends on the
microstructure and was obtained experimentally.
The model was later modified to account for random parking of particles
replacing the original assumption of equal spacing between the particles108. In this
extended version of the model, the pore-structure constant was determined by
analysis of two-dimensional slices from the simulations. At the same time, the
model was extended for calculating autogenous shrinkage based on the pore-
structure using a combination of various empirical equations using pore-parameters
calculated from the model. The specifics of how these parameters were extracted
from the model are not clear. Another pixel-based method to analyse pores was
later added to the model109.
The authors of this model noted that if the hydration of every individual
particle in the model were to be followed the computation would become too large
and time-consuming to be carried out. So, only a statistical approach to reaction
rates is used assuming that the reaction rates of the particles depend only on size.
Since this model does not do any calculation of interactions or overlaps between
particles, the microstructural information is not utilised in the simulations and the
state at any step in the calculation can theoretically be calculated directly from
the initial state, possibly using only semi-empirical equations and without using
the microstructural information available in the model.
Furthermore, since the neighbourhood of particles is not considered for the
calculation of reaction rates, although the overall progress of hydration for the
system may be statistically justified, localised information at the level of particles,
which is extremely important for microstructural properties such as pore-
connectivity, is lost.
Another major criticism of this model is that only a single reaction product,
the one that grows on the surface of the cement particles, is modelled, not
accounting for nucleation of products in the pore-space. It is believed that
40

Chapter 2: Cement Hydration: Chemistry and Numerics
nucleation in the pore-space was not supported in the interest of performance of
the programmes. Formation of outer product could be important to the
microstructural properties of cement and limit the applicability of this model.
Since this model treats the entire microstructure in only a statistical fashion,
localised information is lost and cannot be used for further analysis. For example,
the analysis of pores and connectivity in this model, not to mention autogenous
shrinkage, would be an attempt to invent information that is lost in the first basic
simplification made in the development of the model. This approach is therefore
not well suited to study the evolution of cement microstructure, or any property
affected by the microstructure.
2.7.1.6 Integrated Particle Kinetics Model
In 1990s, the integrated particle kinetics model was developed at EPFL by
Navi and Pignat110,111,112. This model simulates the hydration of spherical C3S
particles using the vector approach similar to that used in the Jennings and
Johnson model earlier. One of the important features of the this model is that,
unlike in HYMOSTRUC, it simulates the hydration of every individual particle
using kinetics laws that depend not only on the size of the particle, but also on the
neighbourhood of every individual particle. This model also supports the
nucleation and growth of new nuclei in the pore-space, away from the cement
particles, instead of depositing the entire reaction product on the surface of cement
particles. This is a more accurate representation of cement microstructure as
growth of products away from cement particles is well known. In this model, the
hydration of C3S particles is simulated as shrinking of the reacting cores and the
concentric growth of C-S-H on the surface of particles. The CH produced grows at
new spherical nuclei forming in the pore-space at an exponentially reducing rate.
The reaction of individual particles is simulated using three reaction regimes,
namely nucleation and growth regime, phase-boundary reaction and diffusion
41

Modelling Cement Hydration
controlled reaction. A typical Avrami-type equation has been used for the initial
nucleation and growth regime of reaction. In the first step, as the Avrami equation
only predicts the rate of hydration of the entire system and not individual
particles, the equation was modified to model the rate of change of radii of
particles as in equation 2.10, where r is the radius of the particle, t is time and k
and n are coefficients from the Avrami equation (equation 2.8).
drdt
=−rnkt n−1e ktn
(2.10)
In the second stage, a phase-boundary reaction was modelled, where the rate
of reaction depends on the surface area of the particles. In the third phase of the
reaction, the rate of consumption of material is inversely proportional to the
thickness of hydrates deposited on the surface of cement particles. All rates are
corrected for the available surface area of individual particles. It has been noted by
the authors of this model that the unique treatment of individual particles is
computationally expensive using the vector approach. This proved to be a major
obstacle to modelling cement hydration as the number of particles had to be
limited to around ten thousand due to practical constraints, while a sample of real
cement of 100 μm size can contain millions of particles.
Various numerical techniques for pore-characterisation were also presented by
the authors. As a first approach morphological thinning of the discretised pore-
structure was used to analyse the pore-sizes and connectivity113. A vector approach
to modelling the pore-structure was later developed. In this approach, the pore
centres were modelled by fitting spheres of largest possible sizes in every space
between four particles, and neighbouring pore-centres were connected using tubes
with diameters depending on the hydraulic radius of the connection between the
pores112. Although this is an extremely powerful technique that can capture the
pores and the connections over all sizes important for cement, it was found to be
computationally time consuming.
42

Chapter 2: Cement Hydration: Chemistry and Numerics
Due to the comprehensive treatment of the microstructure and the possibility
to model multiple reactants and products using the approach used by Navi and
Pignat, their model was chosen as the basis for the development of the new
approach presented in this study.
The above list of models is not exhaustive and other numerical models
simulating cement microstructure and other properties directly related to the
microstructure can be found in literature114,115,116. This list only broadly represents
the approaches used by various researchers to model properties of hydrating
cement paste.
2.7.2 Limitations of Currently available ModelsIt can be seen from the discussion above that our current computational
capabilities in the calculation of the properties of hydrating cement paste are
seriously limited. The most used model is more than a decade old, which is a
considerably long period given the advances in computer science that have taken
place over this period. The principles hard-wired into these models also reflect the
ideas from the same period and are often out of date. These ideas also tend to be
biased towards the opinion of the developers. Most models choose the path of over-
simplification in the interest of performance, either by compromising some of the
critical properties of cement, such as its multi-scale nature, or by ignoring some of
the useful microstructural information that is available in the model. The model
that was recognised to provide a comprehensive treatment of all the information
available and was the closest to cement, is also limited due to performance issues
limiting its usability to only small simulations.
Another important factor limiting the current models is the availability of
knowledge concerning cement hydration. As has been seen in the earlier discussion
in this chapter, many aspects of cement hydration that are crucial to the
development of microstructural or hydration models are still not understood. Still,
43

Modelling Cement Hydration
most of the currently available models have built-in laws and mechanisms that
cannot be easily modified. This “hard-wired” approach to modelling makes models
obsolete the moment any theory used in the model is found to be inaccurate or
insufficient.
2.8 Current StudyThe current study presents a new microstructural modelling framework,
called μic, which derives its basics from the Navi and Pignat approach. Although
the Navi-Pignat model was limited to the hydration of C3S, it contains all the
necessary features for extension to any type of cementitious system. This is mainly
due to the fact that since the hydration of each particle is simulated, multiple
cement phases can be included in the hydration. Also, since this model supports
nucleation of products in the pore-space, away from the cement grains, any type of
hydration product can be modelled. Although the vector approach is known to be
computationally expensive, the fact that it does not depend on a resolution makes
it suitable for modelling a multi-scale material like cement. For these reasons, the
principles used in the Navi and Pignat model were used as the basis for the
development of μic.
μic addresses the performance issues associated with the vector approach and
it has been developed as a modelling platform which has not been hard-wired with
any mechanistic, chemical or physical information, enabling the simulations on μic
to evolve as our knowledge of cement evolves. μic is aimed at improving our
understanding of cement by enabling the users to observe own new their ideas at
work in four-dimensions.
44

Chapter 3: μic the Model
A new modelling platform, called μic (pronounced Mike) has been developed
to model the microstructural evolution of hydrating cement paste. Deriving its
basics from the Navi and Pignat model110, which uses the vector approach, μic has
been developed as an engine for modelling particulate reactions and can be used to
model the hydration of many different cementitious and other particulate systems.
In this chapter, the ideas behind the development of μic and its main features are
discussed. The model has the primary short-term objective of aiding, rather than
replacing experiments, therefore the complexity of cement hydration and the gaps
in our current understanding of cement are kept in mind.
3.1 Why a Microstructural ModelBefore being mixed with water, concrete is a mixture of granular material
with no cohesive properties. As cement hydrates, it acts like glue, holding together
the different grains in concrete. Hydrated cement paste is the most porous and also
the most chemically active part of concrete, making properties of concrete highly
sensitive to cement microstructure. Understanding cement microstructure and its
variation over time is therefore of utmost importance.
The mechanical properties of concrete vary over time, directly dependent on
hydration and the development of cement microstructure. Mechanical strength of
materials is known to reduce with increasing porosity and several relations linking
the two have been proposed for different materials89,90,91. On the basis of a wide
experimental programme, Powers proposed an empirical relationship linking the
45

Why a Microstructural Model
gel-space ratio to mechanical strength of mortars9 (figure 2.13). It would be,
however, be a gross generalisation to assume that the changes in arrangement and
structure of porosity and the microstructure do not play a role. It has been shown
that the large variations in mechanical strengths between different mixes with the
same porosity can be found92. The microstructure, therefore, plays an important
role in the mechanical properties of cement paste.
While mechanical strength continues to be the most important factor
governing concrete design, durability concerns are gaining increasing importance as
many countries face the problem of ageing infrastructure. Cement microstructure
plays an even bigger role in durability. A majority of durability related problems
are associated with ion and mass transport through the pores and hence depend on
pore-properties. Microstructural modelling can play an important role in modelling
the transport properties of cementitious systems providing a valuable method for
predicting durability.
Another important application of microstructural models lies in
understanding cement science. Cement microstructure evolves over time with
hydration as different phases, present in particles of different sizes, react to form
different hydrates and intermediate products at varying rates. The extent of
different reactions are generally difficult to isolate as most experimental techniques
depend on indirect measurements and many aspects of hydration are still poorly
understood. Since it is possible to treat different phases and cement particles
separately in a model, microstructural modelling can prove to be an effective tool
to study the process of hydration and to test the accuracy of hypothesis concerning
microstructural development. Microstructural modelling has therefore an
important role to play, not only for prediction and practical applications, but also
in bridging the gaps in our knowledge of cement science.
46

Chapter 3: μic the Model
3.2 Requirements from μicμic has been designed as a framework for highly customisable simulations of
particulate reactions. The vector approach, which is a resolution-free method for
representation of geometrical information, was implemented using object-oriented
programming in Java. While the model was designed keeping in mind the special
requirements for cement, the framework can be used to model a wide variety of
particulate reactions.
For the design of any model, it is important to first identify the requirements
from the model. Since models are by definition a simplification of the problem, the
requirements from a model affect the simplifications and assumptions that can be
justifiably made in order to satisfy these requirements. The following sections
discuss some of the requirements from μic and the simplifications used in the
model in the course of satisfying these requirements.
3.2.1 ExtensibilityEven as cement science continues to progress at a tremendous pace, many
aspects of hydration are still not well understood. Since models generally involve
large number of assumptions and simplifications, the capabilities of models are
generally limited to the information available to the developer and newer findings
can quickly render a model outdated and of little use. Additions to models due to
both, the advances in science and the introduction of newer materials, would
require regular extensive developments to the models, which are not always
practically possible. Extensibility was therefore considered an essential feature
during the design of μic. The model was designed to allow users to input and test
their own ideas in simulations, making experimentation with the model possible.
This unique feature of μic can make it an important tool for understanding cement
chemistry.
47

Requirements from μic
3.2.2 Ease of DevelopmentAs it would be unreasonable to assume that the model will not require future
development, the model has been designed in a programmer-friendly manner, with
object-oriented programming in Java. The programmes make the task of editing
and development by different and multiple developers easier as the programmes
are segmented into smaller modules, resulting in smaller sized, easier to maintain
programmes. Java was chosen as the programming language as it is considered to
strike the right balance between ease of learning and power. Being a modern
language, Java contains all the necessary features and built-in libraries to support
advanced development. Java is also known for encouraging better coding practices,
resulting in easier-to-read codes. The syntax of Java is easier to learn, making it
ideal also for researchers without much prior experience in programming.
Furthermore, Java is a platform-independent language, and its compiled
programmes can be executed on most operating systems and hardware platforms.
Although many programmers question the speed of execution of Java programmes,
the advantages of Java were considered to outweigh this limitation and Java was
chosen as the language for the development of μic.
3.2.3 Multi-scale Microstructural RepresentationParticles of cement extend over a wide range of sizes, from over a hundred
micrometers to just a fraction of a micrometre and particles of all sizes play an
important role in the progress of hydration and the development of the
microstructure. So, in order to correctly simulate the evolution of microstructure,
48
Figure 3.1: Dimensional range of solids and pores in a hydrated cement paste

Chapter 3: μic the Model
it must be possible to represent particles of all sizes in the model. μic uses the
vector approach in order to preserve the multi-scale nature of cement as it has the
advantage of being relatively resolution-free. The vector approach is discussed in
more detail later in this chapter.
3.2.4 PerformanceIt was considered important that problems of significant size be solved within
reasonable amounts of time. Performance is an important requirement from the
models, specially since the vector approach is known to be computationally
expensive. The manner in which the information is usually stored in the vector
approach makes the calculation of interactions difficult and time-consuming. The
performance issued associated with the vector approach were dealt with, as an
integral part of the design of the model. These issues are discussed in more detail
in later sections.
3.2.5 AccessibilityAs μic has been designed as an experimentation tool, easy accessibility is an
important feature required from the model. Keeping this in mind, the model has
been designed for use on normal desktop computers. This is an important
requirement from the model since access to large work-stations is generally limited.
In order to encourage a wider use of the model, emphasis was given to more
advanced and efficient algorithms, rather than parallelization, to enhance the
performance of the model. Simulations on larger work-stations and mainframes are
still possible owing to the platform-independent nature of Java.
3.3 The Vector ApproachThe vector and discrete approach are the two main alternatives for
representation of geometry. In the discrete approach, the geometrical information
is represented using an assembly of simpler shapes. The computational volume can
49

The Vector Approach
be modelled more closely to the actual geometry as the elements become finer.
This, however, increases the number of elements that have to be modelled and, in
most cases, a trade-off is made between the size of the problem and the accuracy
of the representation. While the size of the computational volume would depend on
the size of the largest particle in the system, the size of the mesh would depend on
the size of the smallest particle to be modelled. As the sizes of cement particles
vary over more than four orders of magnitude, the proper representation of all
particles could necessitate meshing the computational volume using from billions
to trillions of elements. As problems of such large sizes might not be possible to
solve due to practical and computational limitations, only a limited range of
particle sizes is generally modelled when this approach is used.
Even if a high-resolution representation of cement were to be possible, the
information about a large fraction of capillary pores will be lost (see figure 3.1),
reducing the usefulness of the simulated microstructure.
In vector approach, the features to be modelled are represented by their
location, size and shape information. This way all features can be represented in
the computational volume, independent of their size. Using the vector approach,
50
Figure 3.2: Slices from the same cubic microstructure using the discrete approach with 1 million pixels (left) and using the vector approach (right)

Chapter 3: μic the Model
the size of the problem in the memory depends on the number of features to be
modelled, as opposed to the number of mesh elements in the discrete approach.
For example, in cement, the particles can be represented as spheres of known radii
and centres, making the representation of particles of a wide range of sizes
possible, thereby preserving the multi-scale nature of cement.
The vector approach is known to be computationally expensive due to the
manner in which the information is usually stored. The main problem lies in the
calculation of interactions, for example the calculation of overlap between two
spheres. In the discrete approach, phases are represented as elements that are
stored as three-dimensional arrays with neighbouring elements being stored in
neighbouring locations of the array. This makes calculations of interactions with
neighbours fast as all information about the neighbourhood is instantly available.
However, in the vector approach, only the locations and sizes of the particles are
available and the simplest approach to calculate overlaps would be to calculate the
distance of every sphere from every other sphere. This means that the number of
calculations required to check for all interactions can be written as in equation 3.1,
where n indicates the number of particles.
number of checks=n n−1
2(3.1)
While for a small number of particles the number of checks is small and can
be easily handled, as the number of particles increases, the number of checks
required increases approximately as the square of n, seriously affecting the
performance of the approach. Earlier models using this approach have used
different simplifications in order to bring the performance of this approach to
practically acceptable levels. Some of these simplifications are discussed in the
following sections.
51

The Vector Approach
3.3.1 Possible Assumptions in Vector Approach
3.3.1.1 Spherical Assumption
The first important simplification used by most models using vector approach
is the representation of all particles as spheres106,110,114. Being the most regular
geometrical shape, computations of geometrical features and interactions are
fastest with spheres, making them the most suitable shape for the purpose of
modelling. Handled correctly, the effects of this simplification can be easily
managed and need not significantly affect the results.
One of the features of spheres is that they have the smallest surface area to
volume ratio of all shapes. While this artificially reduces the specific surface area of
the samples, it can be easily accounted for numerically, and is therefore not
considered a significant restriction. Another, less manageable problem, is that the
use of any predetermined regular geometrical shape for the development of
hydration will affect the shapes of boundaries between phases. While this might
affect the results, the use of irregular shapes in vector approach would make the
problem computationally too expensive for practical applications.
Any simplification in a model need not cause too many problems as long as
the user of the model is aware of and accounts for the limitation and its possible
implications. In this case, the main effect of the shapes is seen on the shapes of the
pores and artificially created angular contacts between particles. Depending on the
application, these features can be accounted for and smoothed out. Based on these
considerations, the spherical approximation was considered acceptable for μic.
3.3.1.2 Statistical Homogeneity
In order to avoid the computationally expensive calculation of interactions, in
some models, the localised effect of geometry is ignored and only a statistically
calculated global correction is applied106. However, since this models aims to allow
users to calculate the overall effect of localised laws input at the level of particles,
52

Chapter 3: μic the Model
the explicit calculation of the interaction between particles was considered an
important requirement from the model. Also as the model is expected to provide
information about pores and pore-connectivity, localised information is an
important output from the model. The assumption of statistical homogeneity was
not considered acceptable and μic was built with support-libraries to enable fast
calculation of interactions.
3.3.1.3 Reduced Particle Size Distributions
As shown in equation 3.1, the number of checks required in the model
depends on the number of particles, so one of the approaches used to make
simulations practically manageable is to reduce the number of particles by
reducing the size of the computational volume or increasing the size of the smallest
particle, thereby redistributing the volume of the smaller particles to the larger
ones110,114. However, since local geometries are important in μic, the effect of smaller
particles cannot be ignored. The fine particles have an important effect on the
pore-sizes and connectivity (see section 4.1.3).
As μic will be used to study the progress of hydration, in which the smaller
particles have an important role to play, specially in the early part of the reaction,
these particles cannot be ignored and have to be modelled explicitly. By discarding
the finer particles in cement, the main advantage of the vector approach, that with
it we can model particles of all sizes, is lost. The possibility to model all particle
sizes explicitly was considered an important requirement from μic.
3.3.2 Vector Approach as Used in μicIn μic, hydrating cement particles have been represented as spheres that are
assigned a radius and an initial position inside a cubic computational volume using
random parking. Simple user-invokable routines have been provided to simulate
flocculation and to achieve high-density packings using progressive flocculation
during random-parking (figure 3.3). It must be noted that typical unhydrated
53
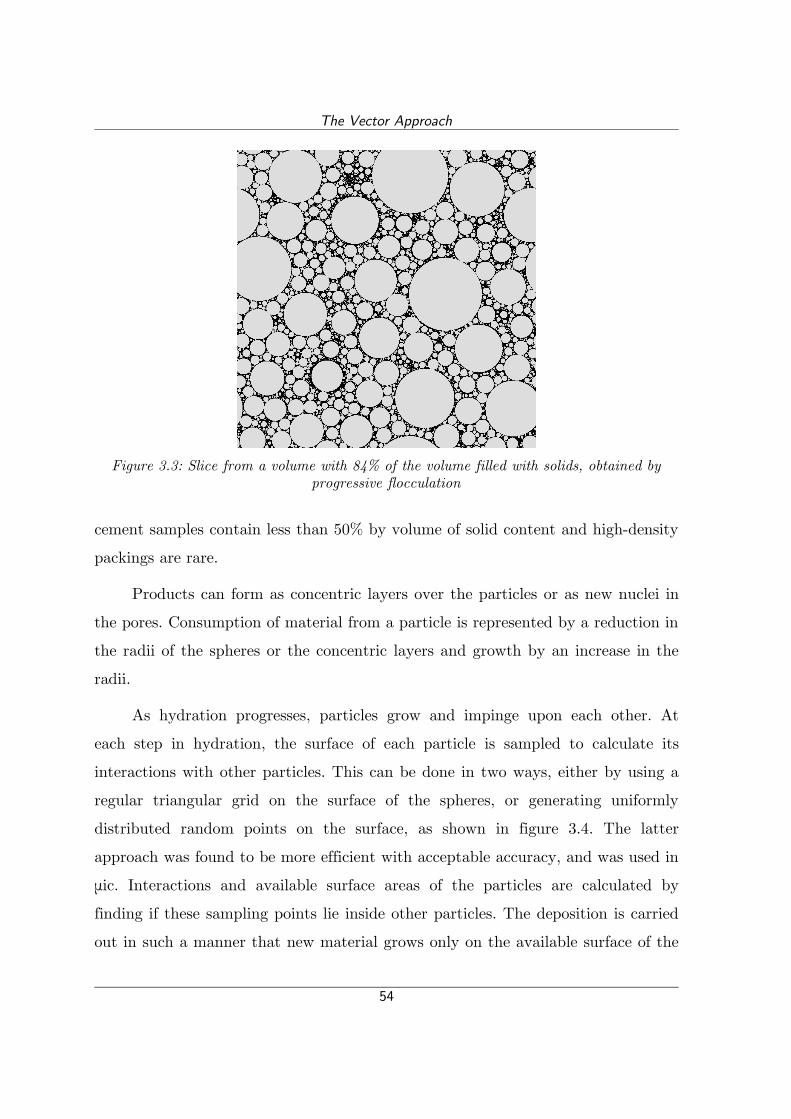
The Vector Approach
cement samples contain less than 50% by volume of solid content and high-density
packings are rare.
Products can form as concentric layers over the particles or as new nuclei in
the pores. Consumption of material from a particle is represented by a reduction in
the radii of the spheres or the concentric layers and growth by an increase in the
radii.
As hydration progresses, particles grow and impinge upon each other. At
each step in hydration, the surface of each particle is sampled to calculate its
interactions with other particles. This can be done in two ways, either by using a
regular triangular grid on the surface of the spheres, or generating uniformly
distributed random points on the surface, as shown in figure 3.4. The latter
approach was found to be more efficient with acceptable accuracy, and was used in
μic. Interactions and available surface areas of the particles are calculated by
finding if these sampling points lie inside other particles. The deposition is carried
out in such a manner that new material grows only on the available surface of the
54
Figure 3.3: Slice from a volume with 84% of the volume filled with solids, obtained by progressive flocculation

Chapter 3: μic the Model
particle. As the particles grow they continue to fill the empty space in the matrix
and the microstructure evolves.
Since the spheres overlap, there are parts of the microstructure that lie inside
more than a single sphere, although in reality the space can be occupied only by a
single particle. If it is required to identify the particle in which a point lies, when it
lies inside more than one sphere, one would have to go though the history of the
evolution to check which particle occupied that space first. This can be important
in applications where the resulting microstructure is required to be discretised into
elements.
The only simplification of the vector approach used in μic is the spherical
approximation. As even with the use of this approximation, earlier researchers
have found computing times to be too large to be practically acceptable, in the
first part of the development of μic, the enhancement of the vector approach, to
bring its performance to practically acceptable levels, was focussed upon. As many
features of the model depend upon these enhancements, they are an integral part
of the development of the model. The methods used to improve the performance
are discussed in section 3.3.3.
55
Figure 3.4: Surface sampling using regular triangular grid114 (left) and using random sampling points117,118 (right)

The Vector Approach
3.3.2.1 Periodic Boundary Conditions
This model uses the periodic boundary conditions for the representation of
information. The size of samples simulated is small, typically around 100 μm
cubes. In reality, specimens of these sizes are not practical even if possible. So, the
computed volume only represents a small computational volume element of the
real material. This means that the boundary of this volume would pass through
many particles. This effect is represented well in the periodic boundary conditions
as particles are allowed to cross boundaries and re-enter the volume from the
opposite side, avoiding the wall effect. The periodic boundary conditions make the
calculations a bit more complex since now particles can overlap after crossing
boundaries. This is illustrated in figure 3.5, where the square 1 shows a two
dimensional example of a periodic volume. So, the real specimen can be supposed
to be of infinite size and composed of these smaller elements tiled next to each
other in all directions. The figure shows the tiles in the immediate neighbourhood
of the primary volume.
In order to find the sphere closest to the surface of sphere A in the set-up in
figure 3.5, the coordinates of the centres of the spheres cannot be directly used.
The sphere closest to the surface of sphere A in this set-up is in fact sphere C with
its centre in volume 6. So, in order to find the closest sphere, the centre of sphere
A has to be compared with spheres B and C in all nine volumes and that of sphere
A in volumes 2 to 9. However, in most cases, this problem can be simplified. In
56
Figure 3.5: Schematics of periodic boundary conditions in two-dimensions

Chapter 3: μic the Model
this case, if the absolute values of the individual components of the vector between
the centres of the two spheres are not more than half the side of the volume the
smallest distance between the two spheres is the length of that vector. If any
component has an absolute value greater than half the side of the cube, it can be
subtracted by the side of the cube to get the required value, simplifying the
calculation of the shortest distance between two spheres.
3.3.3 Algorithms for a Faster Vector ApproachSince the calculation of free-surfaces was, speed-wise, the most critical step in
the hydration simulation, the first objective was to speed up the process of locating
overlaps between spheres. For this different new and previously employed methods
were compared. All these methods were developed using object-oriented
programming. In object-oriented programming, the representation of values as
objects allows storage of the same information in multiple collections without
significant memory overhead. Advanced data-structures, that are an integral part
of the programming languages, provide tools to organise and efficiently retrieve
information. For example, in this case, the information about reacting particles can
be stored in different lists ordered, say, by grain sizes or by grain coordinates.
These lists contain only references to centrally stored information and so provide
fast access to information without redundancies. Furthermore, since the actual
information is stored only at a central location, inconsistencies are avoided. If a
change in the information is routed through one of the collections, it is reflected
universally. So, data-structures effectively provide tools to overcome problems
posed by the storage of information in vector format and ease the development of
efficient algorithms.
3.3.3.1 Verlet Lists
In 1967, Verlet introduced a list technique that significantly speeded up
simulations of particles with short term interactions119 and is still widely used in
57

The Vector Approach
molecular dynamics simulations. In this method, lists of possible interactions of
particles are generated before the simulations start, and may or may not be
updated during the simulations depending on the application. In the case of
hydration, this means the creation of a list of all the other particles that could
possibly overlap at the end of hydration, for each particle. A conservative estimate
of the growth of each particle is guessed. Now all the particles that could
potentially lie in this zone, based on their conservatively guessed final sizes, are
added to the list of possible neighbours. The lists are generated keeping in mind
the periodicity of the volume.
Using these lists, the comparison between spheres can be limited only to the
neighbours and a significant reduction in execution times can be achieved.
However, this approach is suitable only for a limited number of particles. With
each particle potentially having thousands of neighbours, the memory consumption
in this approach again limits the maximum number of particles in the system.
For the use of Verlet lists, the maximum possible size of the zone of possible
interactions has to be guessed. All interactions that lie beyond this range will not
be recognised. In cases where new particles are formed, the lists would have to be
updated at every step in the simulation, leading to additional computational costs.
This only provided a minor improvement in the performance of the model to about
40,000 particles.
3.3.3.2 Bounding Box Lists
This new method was developed in this work to allow the use of dynamic,
global lists to calculate interactions. In this method, three ordered global lists, one
for each of x, y and z axes, are created. Each particle is present at two positions in
each of these lists. If the list corresponds to the x axis, the positions of a particle
depend upon the lower and higher x bounds of the sphere. That is to say, if the x
coordinate of the centre of a sphere is x and its radius is r, the value of x + r and
58

Chapter 3: μic the Model
x – r for each particle is calculated and the list is sorted in the order of these
values. These positions are corrected for the periodic boundary conditions. An
example of the list in the x direction in two dimensions is shown in tables 3.1 and
3.2. Table 3.1 lists the coordinates of eight spheres in a periodic volume and along
with their bounds along the x-axis. The primary volume is a square with one edge
at the origin (x = 0 and y = 0) and a size of 100, with its sides oriented along the
Cartesian axes. Each sphere is placed in the ordered list twice based on the value
of the two bounds as in Table 3.2. This list can help in quick identification of
particles present in a narrow zone. For example, if all the spheres that lie between
the x coordinates of 35 and 65 were to be identified, they can be found by locating
the bounds 35 and 65 in the list in table 3.2, which are indices 5 and 7, inclusive,
respectively. Some spheres might be present in duplicate in this list depending on
whether the sphere is completely inside this zone.
Table 3.1: Calculation of bounding x values of spheresSphere No. Radius x y x – r x + r Primary(x – r) Primary(x + r)
0 14.20 98.24 31.55 84.04 112.44 84.04 12.44
1 13.20 23.10 83.94 9.90 36.30 9.90 36.30
2 12.55 27.30 49.56 14.75 39.85 14.75 39.85
3 12.29 25.06 5.08 12.77 37.35 12.77 37.35
4 12.05 92.45 0.32 80.40 104.50 80.40 4.50
Table 3.2: Order of particles in the bounding box list along x axis from data in table 3.1Index 0 1 2 3 4 5 6 7 8 9
Sphere No. 4 1 0 3 2 1 3 2 4 0
Bound 4.50 9.90 12.44 12.77 14.75 36.30 37.35 39.85 80.40 84.04
These lists are also periodic, meaning that they can be treated as connected
in a circular fashion. If one of the bounds of the zone in question lies outside the
primary volume, the bound can be translated to the primary volume and the first
index in the list can be considered to follow the sphere at the last index. For
example, to find the particles in the zone between x coordinates 80 and 110, the
59

The Vector Approach
spheres between 80 – 100, and 0 – 10 can be used, as the coordinate 110 can be
mapped to 10 within the primary volume.
In three dimensions, three global lists can be created, based on x, y and z
coordinates. To identify all spheres in a smaller cube, three sets of spheres based
on the three global lists have to be obtained and the common spheres in the three
lists have to be identified. A major limitation of this approach is that spheres
larger than the width of the zone being checked may be ignored if both their
boundaries lie outside the zone. This reduces the efficiency of this approach in a
system like cement where the particle sizes vary over several orders of magnitude.
While identifying spheres in the bounding box around smaller particles, the larger
particles might be ignored. This can be worked around by starting the
identification of the interactions from the larger particles and storing the
interactions of larger particles with smaller ones for later use. A minimum size of
the search box may also be set based on the largest particle in the system. This,
however, should not be a problem in systems where the sizes of spheres are in the
same order of magnitude.
This approach has been implemented with object-oriented programming in
μic using standard data structures available in the Java development kit (JDK).
Using bounding box lists, it was possible to improve the capacity of the model to
around 200,000 particles, above which the computational times for the set
operations may be too slow.
The advantage of this approach is that only three global lists have to be
stored, reducing memory requirements. Furthermore, these lists are more dynamic
in nature as they can be re-ordered after every step of simulation, based on their
new positions and sizes, without much processor overhead. This approach can be
more useful in applications like molecular dynamics, where the particles simulated
are allowed to move and are more closely sized.
60

Chapter 3: μic the Model
3.3.3.3 Grid Subdivisions
This approach uses the principles behind the discrete approach to improve
the performance of the vector approach. A cubic grid is overlaid over the vector
microstructure with each cube containing a list of spheres that lie in the cube. The
search for neighbours can be limited to a smaller number of cubes in the grid. To
identify the spheres overlapping with a sphere, the distance of the sphere needs be
compared only with the other particles that lie in the cubes that the sphere
occupies. For example in figure 3.6, when looking for the overlaps with particle 1,
particle 3 can be ignored as it does not share a grid square with particle 1.
This approach has also been implemented with object-oriented programming
and was found to be the most effective approach for cement with the capacity of
the programmes improved to around 3,000,000 particles for desktop computers.
Simulations with over tens of millions of particles can be carried out on work-
stations and mainframes.
When using this approach, it is important to optimise the size of the mesh. If
the size of the mesh is too large, the volume would be divided into a small number
of cubes and the number of spheres per cube would be large. When searching for
neighbours, too many spheres that are outside the zone of interest are returned
and the effectiveness of the method is reduced. While smaller cubes also consume
higher memory, they also slow down the computations. The identification of
61
Figure 3.6: A grid of cubic pixels is overlaid on the vector information in μic

The Vector Approach
neighbours of a sphere requires collection of all spheres present in the cubes in
which the sphere lies. If the number of elements is too large, it will be required to
go through a larger number of cubes in order to collect all the neighbours and the
computation time is larger. The time required for maintenance is also larger for a
larger number of cubes. Good performance was found when the median radius of a
continuous particle size distribution was used as the grid size.
3.3.3.4 Result of Improvements
The grid-subdivision method was found to be best suited for simulation of
cement pastes. Since the simulation generally involves growing particles over a
large range of sizes, while updating the lists, the earlier occupants of each element
need not be cleared and only the new spheres need to be added. As the Navi and
Pignat model110 was used as a starting point for μic, a summary of the
improvements in the vector approach achieved in the new programmes compared
to the Navi-Pignat model is listed in table 3.3.
Table 3.3: Summary of improvements in the vector approachNavi and Pignat model110 μic
Procedural programming in Fortran Object-oriented programming in Java10,000 particles in a few days 3,000,000 particles in a few hours
time ∝ n2 time ∝ n • log(n)Platform: Unix workstations Platform independent
3.4 Modelling Cement HydrationModelling hydration of cement is a complicated problem. The main problem
in modelling cement hydration arises from the complexity of the process and the
fact that many aspects of hydration are not well understood. This means that
during the design of the model, not only the information available currently, but
also possible developments in the future have to be kept in mind. Not only is it,
therefore, required that easy developments on the model be possible, but also that
extensions may be added to the model at run-time to change the mechanisms of
62

Chapter 3: μic the Model
reaction, without the user having to change the structure of the programmes. This
is why, the Cement Hydration Tool-kit (CHT) was developed to provide a flexible
framework for the simulations. Object-oriented programming was found to be
indispensable for the development of the tool-kit.
The idea for this tool-kit was derived from commercial FEM packages where
users are given the flexibility to define the properties of materials, design the
specimens and even specify behaviour laws as equations. This flexibility is
currently not available in other microstructural models of cement and most models
are limited by the knowledge of the developer. The existing models are based on
fixed laws that control the microstructural development of cement, limiting the
control of the user only to certain parameters. The CHT is designed to allow users
to define materials with customised properties and reactions. Many of these
features have been implemented as plugins. Plugins are programmes that can be
compiled separately from the model and can be provided as inputs at execution
63
Figure 3.7: Elements with examples of customisable properties and plugins in the Cement Hydration Toolkit

Modelling Cement Hydration
time. The users can choose from a wide range of available plugins, or create their
own plugins to control mechanisms of microstructural development. The various
possibilities considered during the design of the tool-kit are discussed in the
following sections.
3.4.1 Materials and ReactionsCement, which itself is composed of many reactive species, is often used in
combination with other reactive additives and the proportions of different
components is variable. The most common approach used to model the effect of
different materials is through the use of a pre-defined library of materials, the
proportions of which can be changed. This, however, limits the model only to the
materials that are existent and known at the time of development, and the task of
adding new materials to the model would be difficult as it would require
development in the programmes. It was therefore sought to allow users to define
different materials at execution time. For this purpose, the model was provided
with a generic implementation of materials with customisable properties and the
user can define both reactants and products to be modelled in the simulations.
During simulations, the model treats each material separately according to the
user-defined properties of the materials.
The functionality of customisable materials is completed by the possibility to
define customised reactions. Multiple reactions can be defined in the model having
different materials as reactants and products. Since the order of execution of the
reactions can change the course of the simulations, the order in which the reactions
are to be executed at each step should also be defined. Other possibilities for
customising reactions are discussed later.
3.4.2 Cement ParticlesAs the hydration of cement progresses, layers of products form over the
reacting particles and new clusters grow in the pore-space. The properties of the
64

Chapter 3: μic the Model
progressively formed layers at both locations may vary with time depending on
various conditions. While each cement particle can contain a mixture of various
phases, the cement may also be blended with other particulate materials, such as
pozzolans. At the same time, hydrates can form new clusters in the pore-space.
This implies that the particles and clusters in the microstructure can be divided
into different categories depending on possibility of materials being present in the
particles and the number of layers of products being formed.
In order to allow the model to account for this variability in the number and
properties of layers, the model has been provided with a generic implementation of
spheres which can have any arbitrary number of resizeable layers, containing
different materials, and simulations can contain multiple types of such pre-defined
particles in the system. As calculations in a generic implementation can be
unnecessarily expensive, specialised implementations for many cases usually found
in cement have also been provided. Some of the specialised cases considered
common in cement are listed below.
• Unreactive single-layered particle, e.g. for inert fillers,
• Single-layered particle, e.g. for portlandite clusters in pore-space,
• Two-layered particle, e.g. for reacting cement particles with a layer of
hydrates,
• Three-layered particle, e.g. for reacting cement particles with layers of
inner and outer products, etc.
In order to reduce the complexity of the inputs, once the complete problem is
defined, the process of choosing the right implementation for any specific case is
done automatically by the model. The users are also allowed to choose the required
implementation according to requirements.
In the problem definition, the user has to define “models” for all possible
types of particles. The definition of the models involves the definition of all the
65

Modelling Cement Hydration
possible layers of materials in each type of particle. These models are then used by
μic to generate particles at the beginning or during the simulations.
3.4.3 Reaction KineticsThe reaction kinetics of any system depend on the mechanism of the reaction
and can depend on many different parameters. Since the exact mechanism of
hydration is not well understood, most information on reaction kinetics currently
available depends on empirical relations or fitting of relations that were developed
for other systems, such as crystal growth in the case of the Avrami equation67, the
most widely used kinetics model in cement. At the same time, the presence of
other species can affect reaction rates and change the mechanism of the reaction.
One of the important objectives of μic is to aid in better understanding cement
hydration and the development of mechanism-based laws specific to cement. This
is why it is important to allow the users of the model to input reaction kinetics,
that can depend on different parameters available in the model.
66
Figure 3.8: Different particle types with multiple layers in a single simulation on μic

Chapter 3: μic the Model
In μic, reaction kinetics have been designed as plugins to reactions that can
be compiled separately and given as input. In this way, users can develop relations
based on reaction mechanisms, using the information available in the model, and
test their applicability using μic. Reaction kinetics are only one of the possible
plugins in the model, and the other aspects of plugins are discussed in more detail
in the following sections.
As it is also possible that some reactions be triggered only on the occurrence
of certain events or when certain conditions are fulfilled, the model also allows
users to define triggers or stoppers for reactions, that can affect the activity of
reactions or materials.
3.4.4 Distribution of MaterialsCement grains generally contain a mixture of several phases, while some
other phases can be present as separate particles, for example in the case of
pozzolans. In cement factories, several centimetre sized nodules of clinker are
crushed to produce cement, which generally contains a wide range of sizes of
particles. The size of the particles formed can depend on many process parameters,
such as the duration of grinding, and the properties of the phases. As some phases
may be harder than the others, they may tend to be present in higher proportions
in the larger particles. This means that the initial composition of every cement
particle may be different and depend on many parameters. μic therefore allows the
user to control the distribution of phases in particles.
3.4.5 Density VariationThe density of some hydrates, for example C-S-H, is known to increase in
some parts of the microstructure with the progress of hydration. As this means
that the mass to volume ratio of the product is variable, the microstructure can be
by different amounts from the same mass of product. Densification was therefore
considered an important factor in the design of materials. In μic, the user can
67

Modelling Cement Hydration
define densification laws that can control the density of the products formed.
Again these laws can be based on any of the information available to the model.
3.4.6 Mechanisms of Microstructural EvolutionCement microstructure evolves with the production of different hydrates that
precipitate at various locations. While some products grow on the surface of the
reacting particles, others have a tendency to form new clusters in the pore-space.
At the same time, hydrates may also tend to grow on the surface of other particles
in the system, for example on inert fillers that may be blended with cement. Also,
the proportions of materials depositing at different places may vary depending on
various parameters. For example, whereas for some processes, the rate of growth of
a product may depend on the surface area available on a particle, for some other
process it might depend on the proximity to the reaction site. As the distribution
of products in the microstructure plays an important role in microstructural
evolution, μic was designed to allow the user to control all different possibilities of
product distribution.
In the case of products growing from nuclei formed in the pores, the evolution
of the microstructure can be significantly affected depending on the rate of
formation and growth of these nuclei. Therefore, in μic, nucleation rates can also
be controlled.
It is known that during hydration, cement phases first dissolve as ions and
then react to form hydrates elsewhere. In some cases it may be desirable to use the
spatial information available to create localised zones of reactions. In μic, the user
is allowed to build groups of particles that can react together or affect the reaction
rates of each other. However, while using this feature it should be kept in mind
that since calculation of interactions and distances can be computationally
expensive, these calculations should be minimised.
68

Chapter 3: μic the Model
3.4.7 Specific WorkaroundsIt can be seen from the above discussion that the structure of the
programmes can become quite complicated due to the high level of flexibility
provided to the user. While this improves the performance and the capabilities of
the model, a good balance between functionality and complexity is required to ease
any future development of the model. This is why, some parts of the model were
intentionally restricted, when it was thought that any problems due to these
restrictions can be worked around using other features present in the model or
through new simpler features. Some of these restrictions and their workarounds are
discussed in the following sections.
3.4.7.1 Multi-Phase Grains
The presence of multiple phases in particles poses a big problem in modelling.
Clinker is formed by fusing of different phases together into nodules, and even
after grinding, clear boundaries between different phases present in single particles
can be observed. However, due to the high computational costs of the vector
approach, it is difficult to mark boundaries between phases in multi-phase
particles. This is why, in the model, each layer in a particle is considered to be
composed of a homogeneous distribution of different phases. In this way, many
phases can be distributed in varying proportions in different particles, which can
69
Figure 3.9: Assumption of a uniform distribution of materials, without clear boundaries, throughout the layer as implemented in μic (left) as against materials with clear boundary
demarcation (right)

Modelling Cement Hydration
be controlled by the user. In the model, every particle keeps track on the amounts
and densities of various materials present in every layer.
3.4.7.2 Universal Materials
As it is possible that some reactive species, for example water or dissolved
species, may not be present as particles, the model allows definition of “universal”
materials. These materials are not allocated space in the microstructure and are
assumed to be present in all available space, as opposed to the “discrete” materials
that are assigned space in discrete particles. These materials can be consumed or
produced in reactions, in a way similar to discrete materials as the model keeps
track of the amounts and densities of these materials in the system.
3.4.7.3 Material Variants
In order to simplify implementation of the model, the presence of discrete
materials has been restricted to only a single layer in a single particle model. So, in
order to allow the growth of the same or similar material at different types of
locations, the model allows users to define variants of a material, which may be
present elsewhere. Material can be redistributed between variants by creating
reactions which only convert one variant of a material into another.
For example, in the case of hydration of C3S, part of the C-S-H produced,
called the inner C-S-H, can grow on the surface of the reacting particles, while the
other part, called the outer C-S-H, can form new clusters in the pores. So, outer C-
S-H and inner C-S-H can be defined at variants of the material C-S-H and can be
redistributed at separate locations.
3.4.7.4 Recalculations and Runtime Redefinitions
As it may be desirable to produce different variants of a material from the
same reaction, the amounts of the variants produced may changed at each step of
the calculation. In order to control the proportions of the variants produced, the
70

Chapter 3: μic the Model
user can change the properties of a reaction before every step of calculation. In fact
this feature can be used to make any arbitrary changes in the system as it also
allows a user to execute any code before the execution of the next step.
3.4.8 PluginsMost of the features discussed above have been implemented as plugins, so
that users can write small programmes to control the simulations, compile them
separately from the model and give them as input to the model during execution.
This feature of run-time plugins was only possible because of the “reflective” nature
of objects in Java. As instead of being executed directly on the processor, Java
programmes are executed on the Java Virtual Machine (JVM), which in turn is
executed on the processor, much more information about the process and the
programme itself is available to the programme. This allows the programme to
access specific parts of the programme chosen dynamically at run-time. In this
way, the control-flow of the programme can be moved to code that has been
separately loaded in the JVM and is not a part of the original programmes.
The main plugins and their functions in the model are summarised below.
• Particle Proportion Initialisers control the proportions of different materials
in particles,
• Reaction Kinetics control reaction rates,
• Reaction Triggers control the activity of reactions,
• Densification Profiles control variation in density of materials,
• Nuclei Generators generate new nuclei for products growing in pores,
• Material Distribution Profiles control redistribution of products over
particles,
• Particle Group Choosers control groups of particles that affect reactions of
each other,
71

Modelling Cement Hydration
• Particle Distribution Profiles control the distribution of available space in
particles to different materials, and
• Recalculators can be used to make changes to properties of reactions, etc.
before each step of simulation.
It can be seen from the above discussion that since the user can control most
of the possible mechanisms in a reaction, μic can be used to simulate practically
any particulate reaction. A drawback of this approach is that the model requires a
large number of inputs and at first the definition of the problem might be
cumbersome. However, most input can be reused making definition of future
problems simpler. An example definition of a problem is presented in the following
section.
3.4.9 An Example Problem definitionThe hydration of alite containing an unreactive material in the presence of
inert filler particles are defined here as an example. CH and C-S-H are the main
products produced from the hydration of alite. While CH generally grows nuclei
formed in the pores, a large part of C-S-H grown on alite particles, while the rest
can grow over nuclei in the pores. In the presence of inert fillers, part of the C-S-H
produced can grow on the surface of the filler particles.
Since the reaction mechanisms of such a system are still not well understood,
some assumptions are made for the sake of this example. The C-S-H can grow at
three locations, over the reacting particles, in the pores and on the filler particles
and the first part of C-S-H is assumed to replace the reacting C3S. The remaining
C-S-H is redistributed over the filler particles, cement particles and new nuclei.
The definition of the problem is discussed in the following sub-sections.
3.4.9.1 Materials
The materials are defined based on the requirements of the simulation. Six
materials, namely C3S, water, filler, an unreactive phase mixed in C3S, C-S-H and
72

Chapter 3: μic the Model
CH, can be clearly seen to be present. Due to the presence of C-S-H at multiple
locations, the material has to be split up into five different variants as listed below.
• Variant A – is the inner product that takes the place of the reacting C3S,
• Variant B – grows on the C3S particles outside the original bounds of the
particles,
• Variant C – grows on nuclei forming in the pores,
• Variant D – grows on the surface of the filler particles, and
• Variant E – is a temporary material buffer for C-S-H to help redistribution
of the product, as is presented later.
The initial amounts and base densities of the materials are defined at this
stage. As the model simulates the evolution of geometries, all amounts are dealt in
volumes rather than masses. Figure 3.10 shows the different variations of C-S-H in
this example.
3.4.9.2 Particle Models
The particle models are then defined as spheres made of layers of materials
defined concentrically outwards. In the current case four particle models have to
be defined as listed below.
• Model 1 – cement particles with C3S, C-S-H A and C-S-H B,
• Model 2 – filler particles with filler and C-S-H D,
• Model 3 – CH particles nucleating in the pores with a layer of CH, and
• Model 4 – C-S-H particles nucleating in the pores with a layer of C-S-H C.
As the variant E of C-S-H is only a temporary storage place for
redistribution, it is not assigned space in the microstructure and is defined as a
universal material. The unreactive material is defined to be dispersed in C3S and is
automatically assigned to model 1. For all models that contain materials that are
present in the system at the start of the reaction, the initial particle size
73

Modelling Cement Hydration
distributions are defined. Figure 3.10 shows the different particle-models defined in
this example.
3.4.9.3 Reactions
Multiple reactions can be defined to consume different materials in specified
volumetric ratios. In the current case two reactions are defined. The first reaction
has water and C3S as reactants and CH, C-S-H A and C-S-H E as products. This
means that as the reaction progresses, the space created by the consumption of
C3S is immediately filled by C-S-H produced from the same particle, while some
more C-S-H is produced to be redistributed to other locations.
The second reaction defines the rules for redistribution of C-S-H E. As this
C-S-H has to be distributed to three types of models, the reaction has C-S-H E as
the only reactant and C-S-H B, C and D as products. Although arbitrary initial
proportions for the three types of C-S-H have to be defined, the proportions of
products forming in this reactions will have to be changed at every step of
74
Figure 3.10: Schematics of the example set-up showing different materials, material variants and particle types

Chapter 3: μic the Model
simulation, based on the surface area available for each variant of the product.
This is done using a plugin and is discussed later.
3.4.9.4 Reaction Kinetics
Reaction kinetics are defined as plugins that calculate the rate of
consumption of different materials in a reaction based on various information
available in the model. Several kinetics, based on different possible mechanisms,
can be defined for a reaction. The kinetics giving the slowest rate is assumed to
control the reaction. The controlling kinetics are determined individually for each
particle at each step in the simulation. The user is allowed to control the switch
between mechanisms by preventing the control to switch back to an earlier
mechanism. This is done by assigning different levels to kinetics, and the reaction
mechanism is not allowed to switch to kinetics that have a level that is lower than
the current mechanism.
For example, if the hydration of C3S is split into nucleation and growth
controlled regime and diffusion through hydrates controlled regime, the regimes are
calculated separately for each particle. So by defining nucleation and growth
kinetics to be at level 0 and diffusion controlled kinetics to be at level 1, particles
are not allowed to calculate their reaction rates from the nucleation and growth
kinetics once diffusion controlled reaction has started for that particle.
The second reaction, which controls the redistribution of the C-S-H, also has
to be plugged in with kinetics. As C-S-H E is only a transient storage location,
kinetics to convert all available C-S-H E to the other three forms at each step of
simulation have to be defined.
3.4.9.5 Plugins Controlling Microstructural Formation
For this example, several plugins have to be defined to control the evolution
of the microstructure based on well-defined rules. The first plugin sets the initial
proportions of the C3S and unreactive materials in cement particles. As the
75
Modelling Cement Hydration
unreactive material is interspersed with C3S, each C3S particle can contain a
different proportion of C3S and the unreactive material, as defined by this plugin.
The next set of plugins controls the rate of formation of new nuclei forming
in the pores, in this case CH and C-S-H C. This plugin calculates the number of
new nuclei to be generated at any step in hydration and asks the model to assign
locations to these nuclei.
Another more important set of plugins redistributes C-S-H E to the variants
B, C and D. The first plugin of this set is a “recalculator” that adjusts the
proportions of the different types of C-S-H formed from the second reaction after
calculating the available surface area for each type of C-S-H. After the production
of different types of C-S-H, each variant has to be distributed on the surface of the
particles of each type already present. For this another plugin has to be defined for
each variant of C-S-H to calculate the proportion of the generated variant for each
particle where that variant is allowed to grow.
As the CH produced from the reaction also has to be distributed over a large
number of CH nuclei present in the pores, another plugin, similar to the ones used
to redistribute each variant of C-S-H, has to be defined to complete the definition
of the problem.
As can be seen from the description above, in μic, the user is allowed to
control a large number of parameters and mechanisms, making the creation of
inputs a rather long process. In many cases default implementations for plugins are
provided in the model, but still given the complexity of cement hydration, these
complex definitions cannot be avoided. The input files created for one problem can
be later reused to be extended for other problems.
3.5 Output from the ModelThe customisability of μic can allow users to simulate a variety of growth
mechanisms (figure 3.11). The output from the model is in the form of the
76

Chapter 3: μic the Model
geometry of the microstructure at each step of simulation. This geometry can be
used for further analysis, for example for mechanical properties or pore-properties.
Information about all materials in every particle and in the entire system is also
available. Most experimental results from cement are valid for bulk-samples and
localised information that can be more useful for understanding the science behind
processes is lost. This model can prove to be a useful tool for researchers as, using
a bottom-up approach, laws that govern local or short-term behaviour can be
input to the model, and the overall effects of these laws on the entire system,
77
Figure 3.11: Examples of various growth mechanisms that can be simulated with μic

Output from the Model
which can be compared to experiments, can be studied, after accounting for the
large number of interactions that occur in a complex system like cement.
78

Chapter 4: Simulating Microstructures using μic
In this chapter, μic has been used to study some simple systems to
demonstrate how a microstructural model, and especially the versatile, high-
performance architecture of μic can be used to study cementitious and other
particulate systems. In these examples, the model has been used not only to
simulate the microstructure, but also to explore growth kinetics that depend on
the microstructure. In the first set of examples, traditionally used hydration rules
are applied to demonstrate the significant effect of particle size distribution on the
microstructure. In the second set of examples, a simple fibrous growth mechanism
is investigated and growth kinetics and fill-fractions are calculated using the
model.
4.1 Traditional Microstructural Simulations: Particle-SizesIn the following examples, alite samples with different particle size
distributions are simulated according to rules earlier used by Pignat111, as
summarised in the following sub-sections. It must be noted that the rules listed
below are customisable in μic and have been used as input only for the current
simulations, in order to reproduce conditions traditionally simulated, especially
those used in the Navi and Pignat model. The simulations shown here demonstrate
the influence of the particle size distribution on microstructure.
79

Traditional Microstructural Simulations: Particle-Sizes
4.1.1 Mechanisms and Rules
4.1.1.1 Generation of Particle Sizes
The particles are generated from the particle size distribution input by the
user. The distribution can be input either as discrete sizes with the fraction of
particles of this size or smaller than the size, or as functions describing the particle
size distribution. If discrete sizes with fractions are provided, a linear variation
between these sizes is assumed. As the size of the volume is usually taken to be at
least two and a half times the size of the largest particle, it is assumed that the
size of the computational volume is sufficiently large to represent the entire
particle size distribution. The total volume of the powder is calculated from the
water to cement ratio and the size of the computational volume. The first particle
is assumed to have a size equal to the largest point in the particle size distribution.
With the inclusion of this particle in the volume, the fraction of the powder
remaining and the equivalent radius for this fraction is calculated from the given
particle size distribution. Another particle of this radius is generated and the
process is continued by recalculating the fraction of the powder that remains to be
generated. This process is continued until the required volume of particles is
obtained.
To explain this process, if the cumulative fraction of particle below the size r
is given by the function f(r), and the inverse of this function, which gives the size
of the particle below which a fraction f of the powder falls, is defined as r(f), the
size of the next particle to be placed (rn+1) is determined by the equation below,
where V is the total volume of particles to be placed and n is the total number of
particles already placed.
r n1=r 1− 43V ∑
i=1
n
r i3 (4.1)
80

Chapter 4: Simulating Microstructures using μic
4.1.1.2 Reaction Stoichiometry
As microstructural models simulate the variation of geometry of the
microstructure, it is convenient to represent reactions in terms of volumes rather
than masses. The hydration of C3S (equation 2.1) is rewritten in volumetric terms
in the equation 4.2. as presented by Pignat111. Here the density of C3S is assumed
to be 3.15 g/cc, 1.0 g/ml for H2O, 2.0 g/cc for C-S-H and 2.24 g/cc for CH.
1.0V C 3S1.318V H 2O
1.57V C−S−H0.593V CH (4.2)
While the volume of CH formed per unit volume of C3S reacting was reported
as 0.596 in the original work by Pignat, 0.593, which was found to be a more
accurate value based on the densities mentioned above, is used here.
4.1.1.3 Nucleation of CH Particles
As portlandite forms new clusters in the pore-space, the number of
portlandite clusters and their rate of formation has to be known. In the model by
Pignat, the final number of CH clusters was assumed to be a fifth of the number of
particles of cement, based on data from Jennings and Parrott120. The number of
clusters is assumed to grow according to equation 4.3. The value of a was
calculated to be 0.213 from the data by Jennings and Parrott.
n t =nmax⋅1−e−at (4.3)
4.1.1.4 Distribution of Reactants and Products
The reacting alite particles are packed as spheres in the volume. As C3S
reacts, the radius of the reactive core of the particle reduces. C-S-H deposits on the
surface of the reacting C3S particles and CH forms new clusters in the pores as
discussed earlier. Since the volume of C-S-H produced is larger than the amount of
C3S reacting, the empty space created by the consumption of C3S and some
additional space outside the particles is filled by the C-S-H produced. Figure 4.1
shows the schematics of the reaction for a particle. In the figure ro is the original
81

Traditional Microstructural Simulations: Particle-Sizes
radius of the particle, rin the radius of the reacting core and rout the outer radius of
the C-S-H deposited on the particle. The CH produced is distributed randomly on
the available clusters of this phase. The reduction in the surface available for
deposition of the new product due to overlaps with other particles is calculated
and accounted for, for each particle.
4.1.1.5 Reaction Kinetics
The rate of reaction is calculated for each particle based on three reaction
mechanisms assumed for the hydration. In the model by Navi and Pignat, this rate
is calculated as the rate of reduction of the radius of the inner reactive core, from
the equations 4.4, 4.5 and 4.6.
dr in
dt=−r in⋅k 1
3 t 2e−k 1
3 t3
3 (4.4)
dr in
dt=−k2 (4.5)
dr in
dt=
−k3
r out−r in
(4.6)
The above equations represent nucleation and growth mechanism, phase
boundary mechanism and diffusion controlled mechanism respectively. Equation
4.4 is a modified form of the Avrami equation (equation 2.5) discussed earlier. It
82
Figure 4.1: Layer of C-S-H on C3S particles (left) and reaction of C3S by reduction of inner radius (right)

Chapter 4: Simulating Microstructures using μic
can, however, be shown that the above relation leads to the same rate of reaction
for powders having different particle size distributions for the first few hours of
hydration. For this reason, this equation was re-derived from the Avrami equation,
assuming a reaction rate proportional to the surface area of the particles. The new
form of this equation, shown in equation 4.7, is used in the current simulations.
dr in
dt=−3⋅k1⋅t
2⋅e−k1 t3
(4.7)
Equation 4.5 represents a reaction dependent on the surface area of the
reacting core and equation 4.6 is applicable when the reaction rate is controlled by
the slow diffusion of ions through the layer of product on C3S particles, and
therefore by the thickness of the C-S-H layer on the particle. At any step, the
slowest of the three mechanisms controls the reaction rate. For any particle, the
transition between mechanisms is only allowed in one direction. This means that
once it is determined that phase boundary kinetics become the controlling
mechanism for a particle, the mechanism cannot switch back to nucleation and
growth, and a switch to other mechanisms from the diffusion controlled mechanism
cannot take place.
4.1.2 The SimulationsThe hydration of powders with three different particle size distributions,
shown in figure 4.2, was simulated. Cubic computational volumes, 100 μm on the
side, were packed with 44.25% of solids, equivalent to 0.4 water to cement ratio.
The first particle size distribution contains mainly large particles, with a total of
199 alite particles in the volume. The third particle size distribution is from a
commercial cement, with a total of 2,472,151 alite particles in the volume. The
second particle size distribution is a close approximation of the third particle size
distribution, although containing only 117,679 particles. Based on the values
reported by Pignat111, k1 was set at 1.14×10⁻⁴ h-3, k2 at 1.0 μm/h and k3 at
83

Traditional Microstructural Simulations: Particle-Sizes
0.01 μm2/h. These values were obtained by fits with isothermal calorimetry on C3S
samples. Due to the chosen values of the parameters, the second equation is
usually not used. The evolution of the degree of hydration for the three simulations
are shown in figure 4.3. A snapshot of the three microstructures around 75%
degree of hydration are shown in figure 4.4.
84
Figure 4.3: Variation of degree of hydration for the three particle size distributions
Figure 4.2: Particle size distributions used in the simulations

Chapter 4: Simulating Microstructures using μic
4.1.3 Approximate Pore-Size DistributionsThe pore-size distributions of the microstructures obtained were calculated
using a three-dimensional pixel-erosion method. In the original model, Navi and
Pignat had presented a three-dimensional vector approach to characterise the
porosity113. However, the performance of this approach could only be improved to
around 200,000 particles. For this reason this approach is not used here.
In the method used here, the vector microstructure was overlaid with a cubic
mesh and the voxels were marked to be solid or pore based on their occupancy.
The pore voxels sharing a face with a solid voxels were marked with the number 1,
and in the next step the pore voxels sharing a face with the voxels marked 1, were
85
Figure 4.4: Microstructures at 75% hydration for PSD-1 (left), PSD-2 (middle) and PSD-3 (right), with C3S in lightest grey-scale, followed by CH and C-S-H and pores in
black
1 1 11 1 2 2 1 1 2 1
1 1 2 2 3 3 2 1 2 3 2 11 1 2 2 3 3 4 4 3 2 3 4 3 2 1 11 2 3 3 4 4 5 5 4 3 4 5 4 3 2 11 2 3 4 5 4 5 6 5 4 5 4 3 2 1
1 1 1 1 2 3 4 3 4 5 6 5 4 3 2 11 2 2 1 1 2 3 3 2 3 4 5 4 3 2 11 2 2 2 1 1 2 3 3 2 1 2 3 4 3 2 11 1 1 2 2 1 1 2 3 3 2 1 1 2 3 3 2 11 1 2 2 2 3 3 2 1 1 2 2 11 1 2 2 2 3 3 2 1 1 2 11 1 2 1 1 2 3 2 1 1 2 11 1 1 1 1 1 2 3 2 1 1 2 11 2 1 1 2 3 2 1 1 2 11 2 1 1 2 2 2 2 2 11 1 1 1 1 1 1 1 1 1 1
Figure 4.5: Erosion to identify pore-skeleton using pixels (the solids are shown in black)

Traditional Microstructural Simulations: Particle-Sizes
marked with 2, and so on until all voxels were marked with the number of steps
required to reach them from solid boundaries. This method allows identification of
voxels farthest away from the solid walls in each pore, which are defined as the
centres of the pores. The schematics of this algorithm are shown in figure 4.5.
The extent of each pore can be identified by a walk in the reverse direction
from the pore-centres. While this is only one of the many possible definitions of
pores and pore-sizes, and ignores information regarding pore-topology, it can be
used to obtain quick comparative results. The simulations were carried out with a
voxel size of 0.2 μm for PSD-1 and 0.1 μm for PSDs 2 and 3. The different voxel-
sizes were used to reduce computational times as a larger voxel size was considered
sufficient for the coarser particle sizes in PSD-1. The results obtained from this
analysis are shown in figure 4.6.
4.1.4 Observations and DiscussionThe importance of accounting for all particle sizes can be clearly seen in the
results obtained. The results also demonstrate that the faster implementation of
the vector approach in μic can be crucial to the correct representation of the
86
Figure 4.6: Pore size distribution at 75% and 95% degree of hydration

Chapter 4: Simulating Microstructures using μic
microstructure. Although the second particle size distribution appears to be close
to the third particle size distribution, the pore-sizes of the microstructures are
significantly different. The simulations with PSD-3 took less than 2 hours on a
desktop computer with μic, while most of the other currently available
microstructural models can only simulate a smaller number of particles, requiring
the truncation of the particle sizes, thereby seriously altering the microstructural
properties. It must be noted that although in this case the analysis has been
carried out using voxels having a relatively large size for cement, the vector
information contained in the model is resolution-free and also contains information
about much finer pores. Still, the voxel size used in this analysis is much smaller
than those used in earlier models.
4.2 Non-Traditional Examples with μicIn these examples, μic is used to simulate fibrous growth, and the overall
growth kinetics and fill fraction are simulated based on the mechanism described
below. Two examples of fibrous growth, without and with branching, are presented
here. As micrographs have shown C-S-H forming a fibrillar structure121, the
structures simulated here could be similar to the microstructural development of
C-S-H. More details about the simulation are discussed below.
4.2.1 Mechanisms and RulesIn these simulations, spherical seeds occupying only a small fraction of the
volume were placed. The growth was simulated by the addition of new spherical
particles of the same size at each step of the simulation, to form a chain of
overlapping spheres. In the first simulation, new particles form only at the end of
the chains, leading to a non-branching growth, while in the second case, new
particles are also allowed to grow from inner particles in the chain, leading to a
branching growth. The centre of the new particles is generated randomly at the
specified distance from from the end particles in the first case, and all particles in
87

Non-Traditional Examples with μic
the second case. A new particle is allowed to form if the new particle overlaps only
with its seed particle. The random generation of the locations of the new particles
leads to a growth in random directions. Similar growth patterns have also been
used to study other inorganic and biological growths122,123,124. The main steps in the
simulation are listed below.
• Initial spherical particles occupying a small fraction of the volume are
randomly placed.
• At each step of the simulation new particles are added to the system,
overlapping by a known amount with one of the particles already present.
The particles that allow new particles to form overlapping with them are
called seed particles. The overlap is made in order to have shapes closer to
a fibre than a chain of spheres.
• At each step of the simulation, all seed particles generate a new random
centre for a new particle at a given distance from their centres.
• The new particle is placed only if it can be placed without overlaps with
particles other than the seed. For this reasons, growth might not occur at
some of the seeds at some steps in the simulation.
• As the growth is simulated in three-dimensions, in the case of branching
fibres, multiple branches could form from the same particle.
The schematics of the growth are shown in figures 4.7 and 4.8.
88
Figure 4.7: Schematics for normal (left) and branching growth (right)

Chapter 4: Simulating Microstructures using μic
In the first simulation it is expected that while the growth will progress at a
constant rate in the beginning, as the volume is filled, and less space for new
particles remains available, the rate is expected to reduce. Only a relatively small
fraction is expected to be filled at the end of this process. In the second simulation,
the rate is expected to accelerate in the beginning due to branching and reduce
later due to filling of space. In this case a larger fraction of the volume is expected
to be filled. However, quantification of the rates analytically can be difficult, and
the exact final solid fraction cannot be calculated analytically. It is shown here
how μic can be used to quantify processes, which can otherwise be complex to
solve.
4.2.2 The SimulationsIn the current simulations, initial spherical seed particles occupying 0.1% of
the computational volume were placed at random locations. The size of the
computational volume is 20 units on each side and the diameter of the seeds is
1 units. The growth is simulated by the addition of new spherical particles of the
same size in the volume. The centres of the new particles are located such that the
89
Figure 4.8: Example of step-wise addition of spheres in branching growth

Non-Traditional Examples with μic
new particles overlap with the seeds by 75% of their radii (figure 4.7). Three-
dimensional images of the the evolution of the microstructures for the two
simulations are shown in figures 4.9 and 4.10.
4.2.3 ResultsFigures 4.11 and 4.12 show the evolution of the volume filled and the rate of
growth in the simulations. As expected, the volume is filled much faster in the
branching case and also reaches a higher fill-density. In the case of non-branching
fibres, the final packing density achieved was only around 32.0% and in the case of
branching growth the final packing volume of around 65.7% was achieved. It is
90
Figure 4.9: Evolution of the microstructure with non-branching fibres with solid-volume fraction of 13.3% (left), 22.7% (middle) and 32.0% (right)
Figure 4.10: Evolution of the microstructure with branching fibres with solid-volume fraction of 7.1% (left), 31.5% (middle) and 65.7% (right)

Chapter 4: Simulating Microstructures using μic
interesting to note that the final packing achieved in the latter case is closed to the
reported solid fraction in C-S-H20.
4.2.4 DiscussionIt can be seen from the above example that the versatility of μic provides a
relatively simple way to simulate a complex process. Taking the local mechanism
91
Figure 4.11: Evolution of the volume filled by solids with normal and branching fibres
Figure 4.12: Rate of reaction with non-branching (left) and branching (right) fibres

Non-Traditional Examples with μic
of a semi-random process as input, the overall growth rate of fibres was simulated.
This was possible in μic as not only the rate of a reaction, but also the location of
nucleation can be controlled. The process is relatively complex as the fibres tangle
when they grow, thereby inhibiting the growth of other fibres. Still, the overall
progress of the reaction can be simulated after accounting for all the interactions
and the final volume filled by the particles could be calculated.
One of the interesting observations from the simulations is that, in the case
of branching fibres, the final fraction of fill obtained is similar to the solid fraction
reported in C-S-H and the shape of the observed rate of fill is similar to the
observed rate of hydration of cement.
4.3 ConclusionsIn the above examples, the importance of the faster algorithms used in μic in
order to properly represent cement microstructure by accounting for all particle
sizes was highlighted. It was also shown using simple examples that the versatile
architecture of μic can be used to study processes. While the first set of examples
show how μic can be used to reproduce local effects, such as pore-sizes, the second
set of examples show how localised mechanisms can be used to study the overall
progress of the microstructure. It can be seen that due to its performance and
customisability, μic provides an effective tool to study reaction mechanisms and
microstructural development of growth processes which can prove useful to study
cement hydration and other particulate systems.
92

Chapter 5: Nucleation and Growth Kinetics of Alite
5.1 IntroductionIn this chapter, the hydration kinetics of alite are studied using μic. As
discussed in the preceding chapters, μic has been designed as a modelling platform
that enables explicit simulations of microscopic phenomena at the level of
individual cement particles. Here, this feature of the model is used to study various
hydration mechanisms of alite and their effect on the hydration kinetics and
microstructure.
Reaction kinetics are an important part of microstructural modelling, as not
only do they link microstructural development to time, but they also control the
relative reaction rates of particles. Particles of different sizes make different
contributions to hydration at different stages of the reaction depending on the
reaction mechanism. Furthermore, as is presented in the following discussion,
reaction kinetics can also provide important information about reaction
mechanisms and the microstructure itself.
Over the years, various models for hydration and kinetics have been
presented. However, since most of these models are empirical in nature, it is
difficult to extract any meaningful information regarding reaction mechanisms
from them. μic, however, works in the opposite manner as it uses localised rules to
93
Introduction
simulate overall results after taking interactions between various elements into
account.
In this chapter, the validity of different hydration mechanisms of alite is
studied using μic by comparing the calculated reaction kinetics to experimentally
measured values. Only alite is studied here as it is the largest and the most
important component of cement. The first 24 hours of alite hydration are studied
in this chapter, as this is the most important period in terms of microstructural
development.
5.2 Numerical Modelling of Reaction Kinetics
5.2.1 Requirements from Numerical Models of KineticsIn μic, the reaction rates of individual particles are calculated at each step in
time and the development of the microstructure during the next step is simulated
accordingly. There are, therefore, some special requirements from the kinetics laws
that are implemented in the model, as listed below.
• It must be possible to decompose the kinetics laws to the level of each
particle.
• Rules for interaction between particles must be known.
• If several possible mechanisms exist, rules to choose the governing
mechanism at any instant in time, for each particle, should be known.
• For more effective modelling of the systems, the kinetics should be based
on the actual mechanism of the reaction and only the essential assumptions
should be made.
5.2.2 Using Experimental Results in Conjunction with ModelsOne of the major problems in studying hydration mechanisms is that since
most experiments are only possible on bulk specimens and the results only
represent the overall effect of all elements acting together; and most of the
94

Chapter 5: Nucleation and Growth Kinetics of Alite
information regarding the contribution of individual elements, e.g. inter-particle
interactions, is therefore not accessible from these experiments.
Since most microstructural models also use these empirical relations in the
simulations, the results are designed to follow the experimental observations.
While empirical fits can reproduce the shape of the observed results, they do not
necessarily model the processes in action. This is specially true for cement, where
isolation of the effects of individual elements is not always possible. Empirical fits
of experimental results are, therefore, not well suited for application to models.
Microstructural models work in a manner opposite to experiments. Different
processes at the level of individual particles can be implemented in μic and the
overall results, calculated from the model, can be compared to experimental results
for verification of the applicability of the applied rules. In this way, the model can
provide a technique that is complimentary to experiments, helping to reconstruct
the information that is otherwise lost in the macroscopic behaviour.
Since μic does not contain any hard-wired rules all simulations are
customisable. It is possible to input rules at the level of individual particles and to
explicitly calculate the interactions for the calculation of values that can then be
compared to the experimental results, to verify the applicability of the mechanisms
to the system.
In this chapter, μic is used to study the period of alite hydration, which is
most commonly associated with a nucleation and growth mechanism. First the
validity of the Avrami equation, which is widely accepted and used to model its
hydration is investigated, both analytically and using μic. Then a combination of
experimental results and simulations is used to investigate different possible
hydration mechanisms of alite.
95

The Avrami Equation
5.3 The Avrami EquationThe Avrami equation was originally derived to model the growth of crystals
and the solidification of metallic melts and its first application to modelling cement
hydration kinetics was more than thirty years after it was first published. Despite
the fact that its form allows representation of many different nucleation and
growth mechanisms, the simplifications behind the derivation of this equation do
not necessarily apply to cement. Its sigmoid shape, which resembles the evolution
of cement hydration, and its simple form are probably the most important reasons
behind the popular use of this equation in cement science. For the sake of
completeness, the equation is reproduced in its most commonly used form below.
−ln1−=ktn (5.1)
As described earlier, α is the fraction of volume converted to solid, t the time,
and k and n are parameters that depend on the rate of reaction and the
mechanism of growth of crystals respectively. The parameter n can be further
defined in terms of three other parameters, P, S and Q as in equation 5.2.
n=PS Q (5.2)
In this equation P is a dimensionality constant for the growth of products,
being 1 for a one-dimensional growth, 2 for a two-dimensional growth and 3 for a
three-dimensional growth. S is related to the rate-limiting mechanism, being 1 for
interface controlled growth, where the creation of new surface controls the rate,
and 2 for cases where the diffusion of ions to the growth sites controls the rate. Q
depends on the nucleation rate, being 1 for a constant nucleation rate and 0 for
cases where only an initial nucleation event occurs56. The equation can be written
in a differential form, as shown below, for comparison with the measured rates of
heat-evolution.
96

Chapter 5: Nucleation and Growth Kinetics of Alite
dd t
=k⋅n⋅t n−1⋅e−k⋅t n
(5.3)
5.3.1 A Simplified Derivation of the Avrami EquationIn order to better understand the meaning and the applicability of the
Avrami equation, a simplified form of its derivation is reproduced here. Here we
calculate the volume fraction filled at any instant in time by isotropically growing
nuclei that form in a homogeneous manner at random locations in the volume. As
the growth is assumed to be isotropic the nuclei will grow to form spherical
particles that will overlap with each other as the reaction progresses. It is also
assumed in the current derivation that the materials required for growth are
available in sufficient amounts throughout the process and that the rate at any
moment is only controlled by, and is proportional to, the available surface for
growth.
First, we calculate the volume of a single particle if the overlaps are
neglected, calling it the extended volume (V'). Since the growth of a particle is
proportional to the available surface area on the particle, the radius, ri, of an
individual nucleus i can be related to the age of the nucleus, ti, as in equation 5.4.
d 4⋅⋅r i3
3 d t i
∝4⋅⋅r i2⇒
dr i
dt=k1⇒r i=k 1⋅t i
(5.4)
In the above equation, k1 is the rate of growth in one dimension. The total
extended volume at any instant in time can therefore be related to the age of
individual nuclei as in equation 5.5.
V '=∑i=0
i=n 4⋅⋅k13 t i
3
3(5.5)
If the rate of nucleation (k2) is assumed to be constant, the number of nuclei
formed in a small period dt can be written as below.
97

The Avrami Equation
dN=k 2⋅dt (5.6)
Equation 5.5 can therefore be rewritten by grouping particles formed in a
small period dt in the differential form as shown below.
dV '=4⋅⋅k 1
3
3⋅t i
3⋅k 2⋅dt i (5.7)
If it is assumed that the rate of increase of the actual volume, V, is
proportional to the rate of change of the extended volume and reduces with the
amount of space available, equation 5.7 can be rewritten as below.
dV =4⋅⋅k1
3⋅k2
3⋅t i
3⋅dt i⋅1−V (5.8)
Equation 5.8 can be integrated to get:
−ln1−V =k⋅t 4 (5.9)
Where the combined rate constant k can be written as:
k=⋅k 1
3⋅k 2
3(5.10)
Equation 5.9 has the same general form as equation 5.1, with the parameter
n having a value 4. The equation can be similarly derived for other conditions and
it can be shown that n changes as shown in equation 5.2.
5.3.2 Limitations of the Avrami EquationThe two parameters in the equation, k and n, are usually fit to experimental
results to study the reaction mechanisms. However, in complex systems like
cement, these two parameters might not sufficiently represent all the possible
variables in the system. It would not be possible to study the contribution of all of
the parameters affecting the reaction rate just from the analysis of these two
98

Chapter 5: Nucleation and Growth Kinetics of Alite
parameters. While it can be convenient for fitting that the equation has only two
parameters, this limits the applicability of the equation.
Figure 5.1 shows how the predicted rate of reaction depends on the
parameters k and n. When applied to cement, the two parameters would have to
control at least the following three independent features of the cement hydration
curve:
• Initial rate of acceleration of reaction rate,
• Time at peak, and
• Rate of deceleration.
By doing so, the equation satisfies the requirement that the total amount of
reaction does not exceed the total availability of space and material. This means
that the equation models the compounded effect of at least two of the factors that
can affect reaction rates. This results in a reduction in the time of peak, if the
initial rate of acceleration is varied by increasing k, or the reaction mechanism is
varied by increasing n.
99
Figure 5.1: Dependence of reaction rates predicted by the Avrami equation on k and n

The Avrami Equation
This is because not only does the equation model the reaction mechanisms, it
also predicts the variation of geometry. The equation first predicts an increase in
rates as the available surface area for growth increases with the progress of the
reaction. The rates are then assumed to reduce as different nuclei impinge,
reducing the surface available for growth. While the assumption used is not
necessarily incorrect, it implicitly assumes the geometry of the growth and the
homogeneity of the nucleation, which might not be valid for all cases.
One of the major criticisms of the application of the Avrami equation to
cement is that it assumes homogeneous nucleation throughout a volume and
cannot be used in cases with heterogeneous nucleation, as is thought to be the case
in cement, where the nucleation of C-S-H occurs on the surface of the particles and
not randomly in the pore-space. Thomas62 showed that a relation derived by
Cahn87 to model the growth of nuclei that form close to a surface, can provide
better fits to cement hydration particularly after the peak. Similar to the Avrami
equation, in this derivation, the initial acceleration is attributed the increase in
surface area from the growth of nuclei, which are assumed to nucleate only in a
narrow zone around the cement particles. The later reduction in rate is attributed
to the reduction in the surface available for growth due to impinging of the
hydrates from different grains. In this derivation, the author uses the
transformation from extended volume to real volume twice, first for the two
directions parallel to the surface of the particles and secondly for the direction
perpendicular to the surface. Important assumptions regarding the geometry of
growth of the products are therefore made in this derivation. The validity of these
assumptions is investigated in later sections.
One of the important features of microstructural models is that they can
explicitly model the geometry of the system and do not rely on implicit
assumptions regarding the geometry. This means that the use of any equation that
makes assumptions regarding the geometry could reduce the strength of a
100

Chapter 5: Nucleation and Growth Kinetics of Alite
microstructural model to utilise all the information available from the simulated
microstructure. For example, while the Avrami equation makes implicit
assumptions concerning overlaps between particles, these assumptions are not
required as this information can be directly extracted from the model. Therefore,
even if the equations predict the correct rates, the values cannot be decomposed to
the level of individual particles.
In μic, the basic mechanisms behind nucleation and growth can still be used
to calculate reaction rates after explicit calculation of the interactions. In the
following discussion, the nucleation and growth mechanism and the applicability of
the Avrami equation to nucleation and growth processes are studied using μic. In
later sections, the possibility of applying nucleation and growth kinetics to the
hydration of alite is explored using experimental and simulation results.
5.4 Simulating the Nucleation and Growth MechanismIn the following sub-sections, μic is used to study the nucleation and growth
process. The applicability of the Avrami equation to cases of homogeneous
nucleation, for which the equation was originally derived, and then to cases of
boundary nucleation, as is believed to be the case in cement. The systems
simulated here also demonstrate how the versatility of μic can be used to study the
overall result of mechanisms occurring at the level of individual particles.
In these simulations, the nucleation and growth of a single phase is simulated
under different conditions and the reaction rates are calculated. In the first set of
simulations, a homogeneous nucleation is modelled, and a heterogeneous nucleation
on the surface of spherical particles is simulated in the second case. In the first set
the materials are assumed to be present in sufficient quantities, and in the second
set, the material is assumed to be derived from the particles on which the
nucleation occurs. The details and results from the simulation are discussed in the
following sub-sections.
101

Simulating the Nucleation and Growth Mechanism
5.4.1 Homogeneous Nucleation and GrowthIn this set of simulations, a simple spherical nucleation and growth process is
simulated in a cube with periodic boundary conditions. The results obtained are
then compared with the Avrami equation.
5.4.1.1 Setup
The model is set up with a single material, which forms nuclei in the
available space and grows at a constant rate at all available surfaces. The main
set-up parameters used here are listed below.
• Material: The growth of a single material has been simulated
• Nucleation rate: The material is assumed to form nuclei at a constant rate
in time in some cases and it is assumed to have a fixed number of growing
nuclei throughout the process in the other cases.
• Growth rate: All nuclei are assumed to grow at a constant rate on the
surface available for growth. The parts of any growing particle that overlap
with another neighbouring particle are considered not to contribute to
growth.
A total of five simulations, 1 to 5, were carried out. In simulations 1 to 3, a
constant rate of nucleation is assumed and in simulations 4 and 5 only an initial
nucleation event at the beginning is assumed. Compared to the other cases, twice
the growth rate was used in simulations 3 and 5. The different cases simulated
here are listed in table 5.1.
Table 5.1: Parameters used in the homogeneous nucleation and growth simulationsSim. 1-BB Sim. 2-DB Sim. 3-BD Sim. 4-OB Sim. 5-OD
Nucleation rate Base Double Base Zero Zero
Growth rate Base Base Double Base Double
102

Chapter 5: Nucleation and Growth Kinetics of Alite
5.4.1.2 Results
The calculated volume fraction filled and rate of filling are shown in figure
5.2. As expected, the rate of transformation accelerates at first as the surface for
growth increases and then starts to reduce as the growing particles start to
impinge upon their neighbours, reducing available surface. Snapshots of two-
dimensional slices of the microstructures are shown in figure 5.3.
The results demonstrate that the shape of the overall growth rate depends on
whether there is only an initial nucleation event or nucleation continues at a
103
Figure 5.2: Fraction of volume filled (left) and rate of filling (right) for the first set of simulations
Figure 5.3: Snapshots of slices from the first set of simulations, with fraction of volume occupied approximately 36% (left) and 90% (right)

Simulating the Nucleation and Growth Mechanism
constant rate. The rates of reaction are observed to be similar when the nucleation
rate is doubled (simulation 2) and when the growth rate is doubled (simulation 3).
5.4.1.3 Fit with Avrami Equation
The calculated rate of solidification for simulations 1 and 4 were fit with the
differential form of the Avrami equation. As expected, a near-perfect fit could be
obtained with a value of 4 for n for simulation 1 and a value of 3 for simulation 4.
The differential of the equation was fit instead of the original form to
demonstrate the accuracy of the results, as differentials are generally harder to fit
and the agreement reduces after every differential. This set of simple simulations
demonstrates the accuracy of results calculated from μic and also the applicability
of the Avrami equation to homogeneous nucleation and growth. As shown in figure
5.4, the values of n for the fits were found to agree with equation 5.2. Only two of
the simulations have been shown in this figure for the sake of clarity of the plots.
104
Figure 5.4: Fit of simulations 1-BB and 4-OB with the Avrami equation

Chapter 5: Nucleation and Growth Kinetics of Alite
5.4.2 Heterogeneous Nucleation and GrowthSimilar to the last set of simulations, another set of simulations was carried
out under slightly different conditions. In these simulations the nucleation was
allowed only on the surface of spherical particles already present in the volume.
The nuclei are allowed to draw material only from the particle on which they
nucleate. The solid-volume increase resulting from the reaction is kept similar to
that observed in the hydration of alite and the original volume of the reactive
particles corresponds to 0.4 water to cement ratio. The set-up of the problem and
the results are discussed below.
5.4.2.1 Setup
The model was set up with a material, which forms nuclei on the surface of
spherical particles present at the onset of the reaction. The nuclei grow at a
constant rate at all available surfaces of the precipitating material. The main set-
up parameters used here are listed below.
• Material: Three materials are defined, the first (material 1) being the
reactant that is present as spherical particles at the onset of the reaction,
the second (material 2) nucleates on the surface of material 1 and the third
(material 3) fills up the space created by the consumption of material 1.
• Nucleation rate: The material is assumed to have a fixed number of
growing nuclei on the surface of the particles of material 1 throughout the
process.
• Growth rate: All nuclei are assumed to grow at a constant rate on the
surface available for growth. In one of the simulations, the growth rate
perpendicular to the surface of the particles is set to twice that parallel to
the surface, leading to a conical growth, as shown in figure 5.5. The higher
perpendicular growth rate was simulated by the agglomeration of a large
number of small spherical nuclei outwards from the reacting particles.
105

Simulating the Nucleation and Growth Mechanism
A total of three simulations, 6 to 8, were carried out. The number of nuclei
on the surface of the particles is kept constant throughout the process in all three
cases. In simulation 7, the growth rate perpendicular to the surface is fixed at
twice the growth rate parallel to the surface. The growth rate parallel to the
surface is the same in simulations 6 and 7. The growth rate in simulation 6 is
assigned such that the initial rate of reaction observed is similar to that for
simulation 7. The different cases simulated here are listed in table 5.2.
Table 5.2: Parameters used in the heterogeneous nucleation and growth simulationsSim. 6-BB Sim. 7-BD Sim. 8-HB
Nucleation rate Zero Zero Zero
Parallel growth rate Base Base Higher
Perpendicular growth rate Base Double Base
5.4.2.2 Results
The calculated degree of reaction and rate of reaction are shown in figure 5.6.
Similar to the first set of simulations, the rate of filling accelerates at first as the
surface for growth increases and then starts to reduce as the growing particle start
to impinge upon their neighbours, reducing available surface.
The results here are different from the first set of simulations in that while in
the first set of simulations, all three dimensions are filled at the same rate, in the
current set, the filling of the surface of the reacting particles and that of the space
in the direction perpendicular to the surface does not occur at the same time and
rate, changing the observed rate of the reaction. The reaction rates for simulations
106
Figure 5.5: Different perpendicular and vertical growth rates from spherical nuclei

Chapter 5: Nucleation and Growth Kinetics of Alite
6 and 8 display a prominent flattish rate of reaction after the peak. This is because
while the peak occurs at the moment when surface of the particles gets filled up,
the rate does not change much until the nuclei start to impinge in the direction
perpendicular to the surface of the particles. Snapshots of the simulated
microstructures are shown in figure 5.7.
107
Figure 5.6: Degree of reaction (left) and rate of reaction (right) for the second set of simulations
Figure 5.7: Three-dimensional snapshots from simulations 6-BB (left) and 7-BD (right)

Simulating the Nucleation and Growth Mechanism
5.4.2.3 Fit with Avrami Equation
The accelerating parts (up to 20 time units) of the reaction rates of
simulations 6 to 8 were fit with the Avrami equation. The fits along with the
simulated results and the value of the parameter n calculated from the best fits are
shown in figure 5.8. It is interesting to note that the values of n found for these fits
are similar to those reported when the Avrami equation is fit with experimental
results from cement62,64.
The fit curves have been extended beyond the range of fit in the figure. The
fits clearly show that although it is possible to obtain a close fit with the Avrami
equation in the range of fit, these fits do not predict the evolution beyond this
range. It can be seen from these results that the Avrami equation cannot be used
to fit results from a pure nucleation and growth process when the nucleation is
heterogeneous.
5.4.3 ResultsThe results from the simulations show, that the Avrami equation can be used
to predict the reaction rates in systems with homogeneous nucleation, with the
108
Figure 5.8: Best fits of the Avrami equation with results from simulations 6 to 8
Chapter 5: Nucleation and Growth Kinetics of Alite
required materials available in sufficient quantities, for which this equation was
originally derived. However, this equation cannot effectively model systems with
heterogeneous nucleation, with limited availability of the reactant, as is the case in
cement. Although the equation can be used to fit the early part of the evolution,
the fits cannot predict the values beyond the range of the fit, as observed for
cement. The observed values of n in these fits are close to those reported for
cement, possibly indicating that the nucleation and growth scheme simulated here
is close to the mechanism in cement. These results have important implications for
microstructural models of cement as they clearly show the inadequacy of the
Avrami equation to model processes with heterogeneously distributed nucleation
sites. Furthermore, although in the second set of simulations only the growth rate
of the nuclei was varied (described by the k parameter in the Avrami equation),
the same value of n could not be used for the fit, demonstrating that the equation
is not strictly valid even in the part of the reaction where a good fit is possible.
It is seen in simulation 6, that while the peak of the reaction-rate occurs
when the entire surface of the particles gets covered, as suggested earlier53, a clear
reduction in the reaction rates can only occur when products from neighbouring
particles start to impinge. This means that a flat region of nearly constant
reaction-rate would be observed just after the peak. However, such a feature is
usually not observed in cement hydration and the heat-evolution measured
generally displays a clear peak with a large reduction in reaction rate immediately
after the peak. In simulation 7, where a shorter peak was observed, the degree of
hydration at the peak was observed to be 55.6%, which is much higher compared
to that usually observed in cements around the time they exhibit the peak in the
reaction-rate. The results presented here also point towards the need for a turn
away from curve-fitting of relations that might not correctly represent the
processes in action.
109

Simulating the Nucleation and Growth Mechanism
The results above demonstrate how μic can be used to model complex
phenomenon and verify the applicability of theories to specific cases. This
versatility is a unique feature that μic has amongst all currently available
microstructural models. The results produced simulate the overall rate of reaction,
which can be compared to experimental observations, e.g. heat evolution measured
using calorimetry in the case of exothermic reactions, in order to verify the
applicability of the laws and parameters used in the simulations. In the following
discussion, the possible implications of the above observations, in combination with
more simulations and experimental results are discussed.
5.5 Experimental Investigations into Hydration KineticsThe hydration of alite with different particle size distributions was studied
using isothermal calorimetry. Most of the experimental work presented here,
including establishment of the production protocol and the production of Alite,
fractionation and isothermal calorimetry, has been carried out by Ph.D. colleague
110
Figure 5.9: Particle size distributions of different fractions of alite
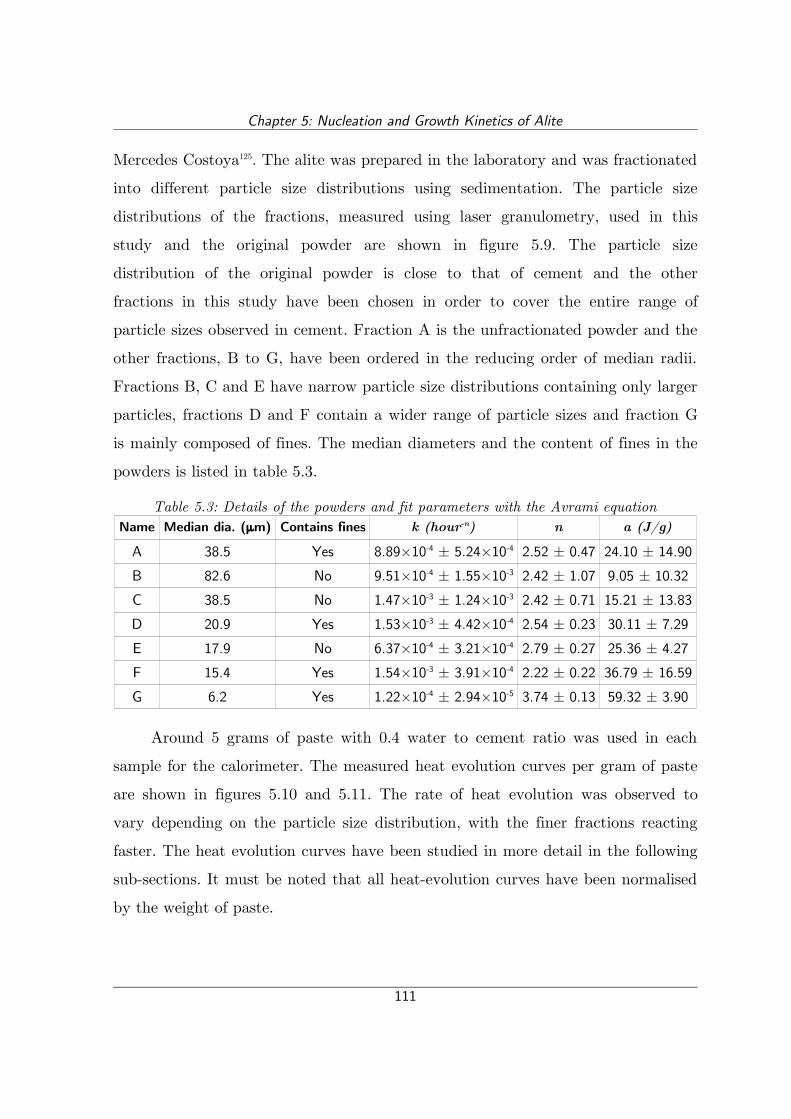
Chapter 5: Nucleation and Growth Kinetics of Alite
Mercedes Costoya125. The alite was prepared in the laboratory and was fractionated
into different particle size distributions using sedimentation. The particle size
distributions of the fractions, measured using laser granulometry, used in this
study and the original powder are shown in figure 5.9. The particle size
distribution of the original powder is close to that of cement and the other
fractions in this study have been chosen in order to cover the entire range of
particle sizes observed in cement. Fraction A is the unfractionated powder and the
other fractions, B to G, have been ordered in the reducing order of median radii.
Fractions B, C and E have narrow particle size distributions containing only larger
particles, fractions D and F contain a wider range of particle sizes and fraction G
is mainly composed of fines. The median diameters and the content of fines in the
powders is listed in table 5.3.
Table 5.3: Details of the powders and fit parameters with the Avrami equationName Median dia. (μm) Contains fines k (hour-n) n a (J/g)
A 38.5 Yes 8.89×10⁻⁴ ± 5.24×10⁻⁴ 2.52 ± 0.47 24.10 ± 14.90
B 82.6 No 9.51×10⁻⁴ ± 1.55×10⁻³ 2.42 ± 1.07 9.05 ± 10.32
C 38.5 No 1.47×10⁻³ ± 1.24×10⁻³ 2.42 ± 0.71 15.21 ± 13.83
D 20.9 Yes 1.53×10⁻³ ± 4.42×10⁻⁴ 2.54 ± 0.23 30.11 ± 7.29
E 17.9 No 6.37×10⁻⁴ ± 3.21×10⁻⁴ 2.79 ± 0.27 25.36 ± 4.27
F 15.4 Yes 1.54×10⁻³ ± 3.91×10⁻⁴ 2.22 ± 0.22 36.79 ± 16.59
G 6.2 Yes 1.22×10⁻⁴ ± 2.94×10⁻⁵ 3.74 ± 0.13 59.32 ± 3.90
Around 5 grams of paste with 0.4 water to cement ratio was used in each
sample for the calorimeter. The measured heat evolution curves per gram of paste
are shown in figures 5.10 and 5.11. The rate of heat evolution was observed to
vary depending on the particle size distribution, with the finer fractions reacting
faster. The heat evolution curves have been studied in more detail in the following
sub-sections. It must be noted that all heat-evolution curves have been normalised
by the weight of paste.
111
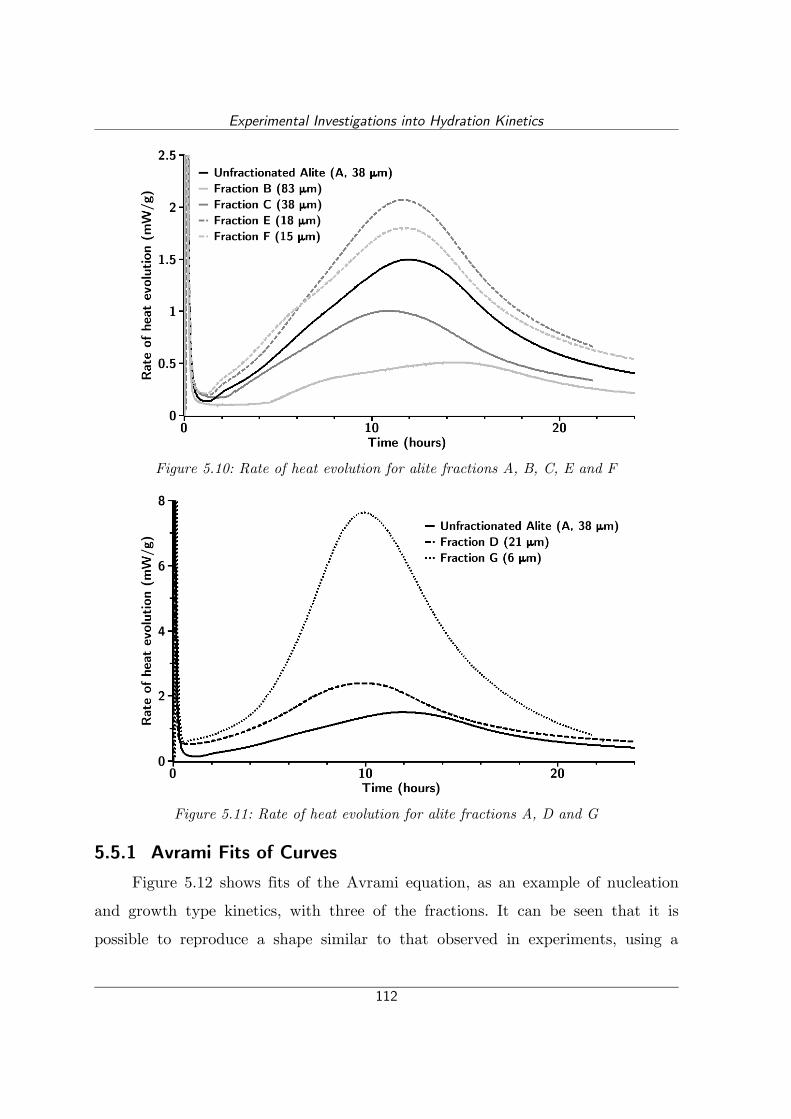
Experimental Investigations into Hydration Kinetics
5.5.1 Avrami Fits of CurvesFigure 5.12 shows fits of the Avrami equation, as an example of nucleation
and growth type kinetics, with three of the fractions. It can be seen that it is
possible to reproduce a shape similar to that observed in experiments, using a
112
Figure 5.10: Rate of heat evolution for alite fractions A, B, C, E and F
Figure 5.11: Rate of heat evolution for alite fractions A, D and G

Chapter 5: Nucleation and Growth Kinetics of Alite
combination of an exponential decay resulting from dissolution and a nucleation
and growth curve, without the assumption of an induction period. While this does
not necessarily mean that the induction period does not exist, the curves show that
it is possible to explain the short period of flattish heat-evolution without the
requirement of a separate chemical process. The equation used for the fit is shown
in equation 5.11, and the fit parameters are listed in table 5.3. It must be noted
that since an effort to fit all curves with the same value of the factor n was not
made, the values of the factor k are not directly comparable. Only three of the fits
are shown here for the sake of clarity of the plots.
dd t
=a⋅k⋅n⋅tn−1⋅e−k⋅tn
(5.11)
5.5.2 Rate of AccelerationAn approximately linear rate of heat evolution was observed in most samples
at around 4 to 6 hours of hydration. The slope of this quasi-linear part was
measured and compared to the specific surface area of the powders measured using
three different techniques. Firstly the specific surface area was calculated using μic
for powders using spherical particles with matching particle size distribution. A set
113
Figure 5.12: Fits of the Avrami equation with three fractions without an induction period

Experimental Investigations into Hydration Kinetics
of particles following the particle size distributions was generated and their total
surface area and mass was used to calculate the specific surface area. The fineness
was also measured with nitrogen adsorption using the BET theory and with Blaine
permeametry. The specific surface of the fractions, along with the slope of the
linear part are listed in table 5.4. The experimental measurements for some of the
fractions are not available. The specific surface values, normalised against those for
fraction D, are plotted against the measured slopes, also normalised against
fraction D, in figure 5.13.
Table 5.4: Calculated and measured specific surface (m2/kg) using different techniques and measured slope of the quasi-linear part of the heat-evolution (mW/g/h)Fraction A-38 μm B-83 μm C-38 μm D-21 μm E-18 μm F-15 μm G-6 μm
Calculated 549.7 26.8 59.1 769.5 160.2 456.4 1273.5
Blaine 190.5 61.0 121.2 525.5 239.3 305.9 -
BET 597.7 376.8 1033.7 592.2 1537.7 - -
Slope 0.154 0.059 0.110 0.255 0.230 0.178 1.264
The results show that, although a linear relationship between the factors was
not found, the reaction is generally faster as the fineness increases. The normalised
Blaine fineness values were found to be closest to the measured normalised slopes.
One of the important observations from the figure is that the reaction rates do not
114
Figure 5.13: Renormalised specific fineness' of powders against measured slopes

Chapter 5: Nucleation and Growth Kinetics of Alite
directly scale with the specific surface of the powders calculated from the particle
size distributions. Most nucleation and growth models, on the other hand, will
predict an initial reaction rate that is linearly scalable with the specific surface of
the cement particles, if the process is assumed to occur homogeneously on the
surface of the particles. While this might indicate a non-homogeneous process on
the surface of the particles, one of the reasons for the reaction rates not scaling
linearly with the specific surface areas could be due to agglomeration of particles
during laser granulometry measurements, making the measurements less reliable.
Another factor affecting this relationship could be the reduction in the specific
surface area during the dissolution period, which has not been considered here. As
smaller particles would dissolve faster than the larger ones in the beginning, the
specific surface available at the beginning of the nucleation and growth process can
be different from that at the beginning of dissolution. This is supported by the
relatively good trends observed in the measured Blaine fineness. Since this
technique is not able to measure the finer particles, it compensates for the
reduction in the specific surface area during the initial rapid dissolution period.
5.5.3 Effect of Inert FillersThe effect of the presence of fine inert fillers on hydration kinetics of alite
was studied. Isothermal calorimetry was carried out on samples with alite replaced
by rutile (titanium dioxide) and silica fume to extents varying between 5% and
15% by weight. The particle size distributions of the alite and the fillers used are
shown in figure 5.14. While both fillers were found to be much finer than the alite,
the silica fume was found to be finer than the rutile used. As the alite was used
directly after grinding, its particle size distribution was found to vary between
batches (alites 1 and 2 in the figure). Alite from one batch was used with rutile
and alite from the other batch was used with silica fume. The rate of heat-
evolution measured are shown in figures 5.15 and 5.16.
115
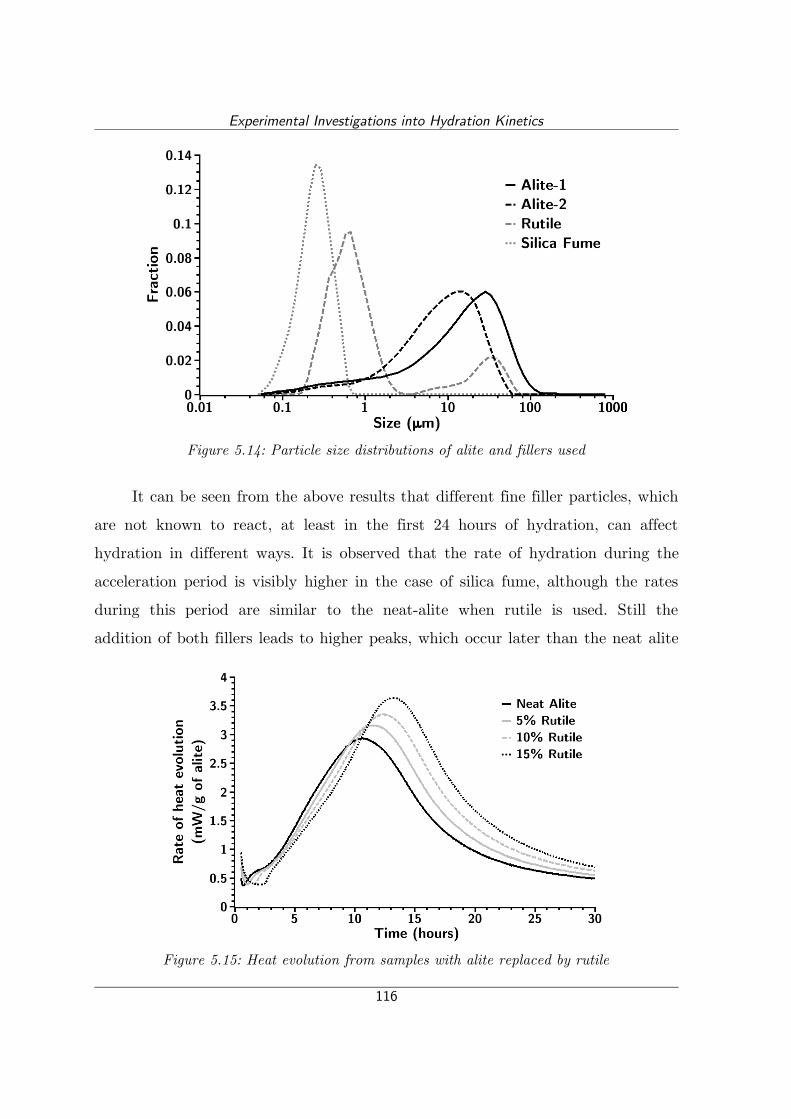
Experimental Investigations into Hydration Kinetics
It can be seen from the above results that different fine filler particles, which
are not known to react, at least in the first 24 hours of hydration, can affect
hydration in different ways. It is observed that the rate of hydration during the
acceleration period is visibly higher in the case of silica fume, although the rates
during this period are similar to the neat-alite when rutile is used. Still the
addition of both fillers leads to higher peaks, which occur later than the neat alite
116
Figure 5.14: Particle size distributions of alite and fillers used
Figure 5.15: Heat evolution from samples with alite replaced by rutile
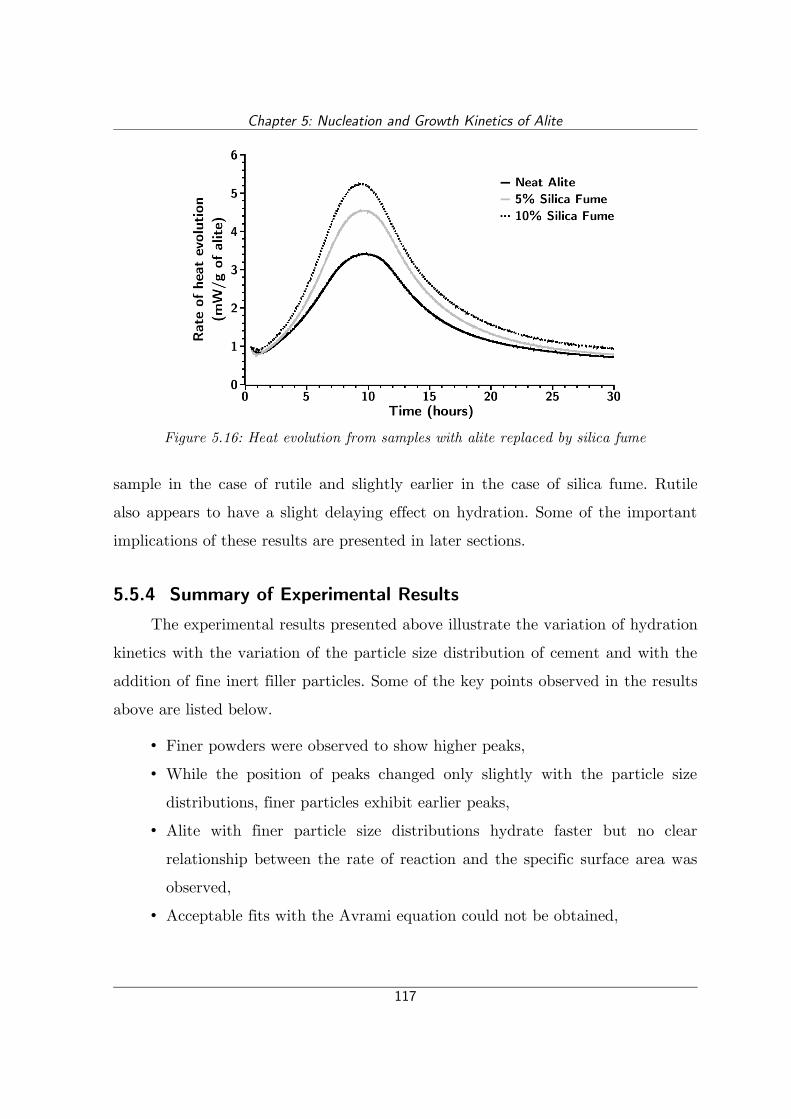
Chapter 5: Nucleation and Growth Kinetics of Alite
sample in the case of rutile and slightly earlier in the case of silica fume. Rutile
also appears to have a slight delaying effect on hydration. Some of the important
implications of these results are presented in later sections.
5.5.4 Summary of Experimental ResultsThe experimental results presented above illustrate the variation of hydration
kinetics with the variation of the particle size distribution of cement and with the
addition of fine inert filler particles. Some of the key points observed in the results
above are listed below.
• Finer powders were observed to show higher peaks,
• While the position of peaks changed only slightly with the particle size
distributions, finer particles exhibit earlier peaks,
• Alite with finer particle size distributions hydrate faster but no clear
relationship between the rate of reaction and the specific surface area was
observed,
• Acceptable fits with the Avrami equation could not be obtained,
117
Figure 5.16: Heat evolution from samples with alite replaced by silica fume

Experimental Investigations into Hydration Kinetics
• The replacement of alite by inert fine fillers was observed to enhance the
rate of hydration.
In the following sections, an explanation of the observed results based on the
nucleation and growth mechanism is attempted. The results presented above are
compared with simulations to study the possibility different mechanisms explaining
the experimental observations. This comparison provides important information
concerning alite hydration.
5.6 Key Questions before Modelling Alite HydrationThe five main stages of alite hydration were discussed earlier. The nucleation
and growth period is generally assumed to start at the end of the induction period
and end somewhere between stages four and five. Before the process is modelled
using μic, some of the key questions about alite hydration that could affect
numerical modelling of hydration, and especially its nucleation and growth period
are discussed below.
5.6.1 Induction PeriodOne of the most important questions concerning the nucleation and growth
period is the existence of the induction period. While it is generally accepted that
the initial rapid evolution of heat in stage 1 is due to the dissolution of alite, the
cause of the short flattish period observed between the “dissolution peak” and the
following increase in the heat evolution rate is debated. It has been argued that
the induction is period is not a separate chemical process, and is the period during
which the nucleation and growth process is too low to be measured1,53,62. As can be
seen in figure 5.17, a sum of exponential decay and the differential form of the
Avrami equation can reproduce the shape exhibited in alite hydration, with or
without the assumption of an induction period. The rate factors during the
nucleation and growth period can, however, depend on the existence of the
118

Chapter 5: Nucleation and Growth Kinetics of Alite
induction period. For the purpose of the current study, unless explicitly stated, it
is assumed that the induction period is not a separate process, but is the period
when the rate of hydration is too low to be observed.
5.6.2 Accelerating StageOne of the important reasons why the reaction mechanism of alite is
considered to be related to nucleation and growth is the acceleration observed in
stage 3. It has been shown that as the surface for growth increases, the reaction
119
Figure 5.17: Heat evolution curve as a sum of exponential decay and Avrami equation with and without an induction period
Figure 5.18: Evolution of heat-flow measured by isothermal calorimetry (left) and surface area measured by NMR relaxometry (right) by Zajac126

Key Questions before Modelling Alite Hydration
rate increases, until the surface available for growth starts to reduce126, as shown in
figure 5.18. At the same time, it is also generally accepted that the growth takes
place on the surface of cement particles. However, the increase in the surface area
due to the increasing radii of the particles due to the deposition of layers of
products alone cannot explain the observed increase in the reaction rates. In order
to explain the acceleration stage, it has been proposed that before the peak, the
surface of the reacting particles is only partially covered with product and the
product grows outwards from the covered part of the surface. The rate accelerates
as more of the surface continues to be filled53,62.
For the purpose of the current study, in order to explain the acceleration in
hydration, it is assumed that for the first few hours, the hydrates cover only a part
of the cement particles and that the nuclei of C-S-H grow at different rates parallel
and perpendicular to the surface of the particles.
In the following discussion, three different hydration mechanisms are
simulated in μic and fit against the experimentally measured calorimetry curves to
study the applicability of these mechanisms to cement hydration. In the first set of
simulations, the traditional approach to nucleation and growth, where C-S-H,
having a uniform bulk-density, nucleates on cement particles and grows outwards
into the pore-space is simulated. It is shown that while this mechanism can
reproduce the observed acceleration in the rate of hydration, the deceleration
observed just after the peak is not reproduced. In the second set of simulations,
the possibility of a diffusion controlled regime controlling the deceleration is
studied and it is shown while such a mechanism can explain the observed rates of
hydration, widely varying transport properties of C-S-H have to be used in order
to obtain the fits.
In the third set of simulations a modified nucleation and growth mechanism
is studied. In this mechanism, C-S-H nucleates on the cement particles and grows
outwards into the pores, similar to the first mechanism. However, in these
120

Chapter 5: Nucleation and Growth Kinetics of Alite
simulations, it is assumed that the C-S-H forms at a lower bulk-density initially
and its density increases with time. It is shown in these simulations that while
such a mechanism can explain the rate of hydration during most of the first 24
hours of hydration, the fit parameters may vary by large extents. However, a clear
trend in the fit parameters was observed. The results from the simulations
demonstrate the necessity of more investigation into hydration mechanisms using
numerical methods.
5.7 Modelling Traditional Nucleation and Growth in μicIn this set of simulations, the applicability of the traditionally accepted
nucleation and growth mechanism to alite hydration is investigated using μic. As
discussed earlier, numerical studies of the nucleation and growth mechanism in two
dimensions53, have shown that the rates of reaction observed can be explained by
the slow growth of product over cement particles, with the peak occurring when
the entire surface gets covered by the product. However, these simulations were
made in two-dimensions and the effect of space-filling and the effect of other
particles was not considered. In μic it is possible to model a similar processes in
three-dimensions, taking the overlaps between particles into account. Here the
process of nucleation and growth is simulated on particle size distributions similar
to those used in experiments earlier. It must be noted that due to the large
amount of missing information, these simulations are not intended to provide
perfect fits to experimental results, and that they only explore the possibility of
various mechanisms explaining the observed behaviour.
The information used in these simulations is as follows:
• Particle size distribution of the alite fractions as discussed earlier,
• A water to cement ratio of 0.4,
• A specific heat of hydration of 500 J/g of alite, and
• The measured calorimetry curves shown earlier.
121

Modelling Traditional Nucleation and Growth in μic
The simplifications used in the simulations are as follows:
• The particles are assumed to be spherical and randomly distributed in
space,
• The product formed inside the original boundary of the particle, referred to
as the inner product here, is assumed to uniformly fill the space created by
the dissolving particles, and
• The surface filling process is assumed to be the same for all particle sizes,
such that at any moment the same fraction of all particles is covered.
It is understood that the effect of the above simplifications on the calculated
values may not necessarily be negligible. However, the current simulations only
seek to provide possible explanations for the observations through approximate fits
with the use of limited amount of information available from the experiments. It is
expected that the effects of these simplifications is within the error from the input.
These simplifications are also not expected to alter the accuracy of the
investigative simulations presented in the following discussion. It must be noted
that, apart from the first assumption, the others are not essential in μic and have
only been used in order to simplify the calculations.
As a microstructural model, μic ensures the following in the calculations:
• Mass is conserved by strictly following the stoichiometry of the defined
reactions,
• All space is accounted for in the calculations, such that products grow only
at locations that are not already occupied, and
• The available surface for growth is calculated individually for each particle
and all possible overlaps are calculated.
In the following simulations, a uniformly dense product is assumed to grow
over the covered portion of the particles. As the outward growth is only assumed
to occur at locations where the particles are covered, the growing front around the
122

Chapter 5: Nucleation and Growth Kinetics of Alite
particles is rough, similar to the nucleation and growth simulations shown earlier.
However, unlike simulations 6 to 8 shown earlier in section 5.4.2, the nuclei are not
explicitly modelled here. It is assumed that the nuclei are small enough to consider
the roughness uniformly spread over the surface growing products.
The volumetric stoichiometry used here is the same as that shown in
equation 4.2. This equation assumes a density of 3.15 g/cc for alite, 1.0 g/ml for
water, 2.0 g/cc for C-S-H and 2.24 g/cc for CH. For convenience, the equation is
reproduced below.
1.0⋅V C 3S1.318⋅V H1.569⋅V C−S−H0.593⋅V CH (5.12)
5.7.1 KineticsIn this case the hydration mechanism is assumed to be purely governed by
the nucleation and growth of the product on the reacting particles. Small nuclei of
the product form at uniformly distributed random locations on the surface of the
reacting particles. The nuclei grow at a fixed rate, continuously covering the
surface of the particles and filling the pore-space. The outwards rate is defined to
be different from that parallel to the surface. The schematics of this mechanism
are shown in figure 5.19.
123
Figure 5.19: Schematics of the nucleation and growth mechanism with different parallel and outwards growth rates for a single particle (top) and between particles (bottom)

Modelling Traditional Nucleation and Growth in μic
The schematics are only representative in nature and the nuclei are not
simulated explicitly in these simulations. Instead, the covered fraction of the
particle surface, f, at time t, is calculated using the Avrami equation in two-
dimensions, which is reproduced again below.
f =1−exp −k 1⋅tn (5.13)
In this equation k1 is the rate factor in the direction parallel to the surface.
Since it is assumed that the product grows outwards at a uniform rate k2, the age
of the product at a distance r from the surface of the particle can be written as:
t r=t− rk 2 (5.14)
The fraction of the volume fv filled at a distance r from the centre of the
particle, with an original radius r0, can therefore be calculated as:
f v=1−exp −k1⋅t−r−r 0
k2n
(5.15)
The total amount of product around a grain, mi, at time t can be calculated
as:
m i= ∫r0
r 0k 2⋅t
4⋅⋅r2⋅f v⋅dr (5.16)
However, since a part of the volume can be occupied by other particles, only
a fraction of the surface, ffree, at any moment is available for growth. This factor
depends on the distance from the surface and is calculated explicitly in μic. The
actual amount of products around the grain at time, t, can therefore be written as:
m i= ∫r 0
r0k 2⋅t
4⋅⋅r2⋅1−exp −k1⋅t−r−r 0
k 2n
⋅f free⋅dr (5.17)
124

Chapter 5: Nucleation and Growth Kinetics of Alite
5.7.2 Fit Parameters and ResultsEquation 5.17 is input as a reaction kinetics plugin to μic and is solved
numerically to calculate the amount of product around each grain at any moment
in time. Since nucleation and growth is a demand based mechanism, the amount of
product that can form governs the amount of reactant. The results from the
simulations are shown in figure 5.20 along with the experimental results for the
corresponding powders. The parameters used in the simulations are listed in table
5.5. In the table, the factor k1 has been replaced by the more intuitive t2/3, which
was arbitrarily chosen to be the time at which two-thirds of the surface of the
particles is covered. The experimental degrees of hydration in the curve have been
reduced by the factor α0, to make the measured and calculated curves overlap for
better comparison. This parameter corrects for the difference in the values due to
the rapid heat evolution during the initial dissolution period, which is included in
the calculation of the experimental degree of hydration and is not accounted for in
the calculations.
Table 5.5: Parameters used in uniform density nucleation and growth simulationsFraction A-38 μm B-83 μm C-38 μm D-21 μm E-18 μm F-15 μm G-6 μm
t2/3 (hours) 7.0 8.0 6.5 6.0 7.3 7.3 6.4
n 3.0 3.0 3.0 3.0 3.0 3.0 3.0
k2 (μm/hour) 0.0045 0.0315 0.0290 0.0070 0.0215 0.0061 0.0078
α0 (%) 2.8 2.4 1.9 3.5 2.1 4.2 0.7
In the simulations, the factors were modified to obtain heat-evolution curves
close to the experimentally measured values by manual trial and error. Perfect fits
were not sought in the simulations and the trials were stopped when it was
considered that a fair comparison with the experimental results was possible. It
was also not aimed to obtain the same fit parameters for all powders and the
different particle size distributions were simulated only to obtain more reliable and
reproducible results. It must be noted that since the early slope and the time of
peak are the only two features that are fit in these simulations, and three factors,
125

Modelling Traditional Nucleation and Growth in μic
126
Figure 5.20: Comparison between simulations and experimental results of heat-evolution rates and degrees of hydration

Chapter 5: Nucleation and Growth Kinetics of Alite
namely k1, k2 and n can be varied, a non-unique solution for the fit-parameters
exist. The value of n was therefore fixed to remove this redundancy.
The value of n was fixed at 3 as better results were obtained throughout the
tests with this value. This value of n theoretically corresponds to a two-
dimensional growth with continuing nucleation, at least at the early ages.
Therefore, in effect, the two other parameters, t2/3 and k2, were varied in the
simulations to obtain the fit. While the position of the peak was found to depend
on t2/3, the rate of heat evolution depends on k2. The results were found to be
extremely sensitive to both values.
5.7.3 DiscussionFor all the powders simulated, it was found that it is possible to
approximately follow the rate of heat evolution in the rising part of the curve. The
value of n used indicates that in the first few hours of the process, new nuclei
continue to form close to the surface. This is not completely improbable since
during this period, a large part of the surface of the particles is exposed to the
pore-solution with generally high ionic concentrations.
Although a good agreement was observed in the accelerating part of the
curves, it was found that, for all samples simulated, the heat-evolution after the
peak continued to be significantly higher than the experimentally observed values.
This is because, while the peak is reached due to the entire surface of the particle
being covered, a reduction in the heat-evolution rate can only happen when the
surface of the product available for growth reduces. In the present scenario, free
surface of the product can be reduced only due to overlap between neighbouring
particles. However, it can be seen from the simulations, that although the vertical
rate of growth has been set to closely match the observed heat-evolutions, the
overlap between the particles is not high enough to cause a reduction in the
reaction rates, at the experimentally observed rates.
127

Modelling Traditional Nucleation and Growth in μic
Figure 5.21 shows a slice of the simulated microstructure of sample F-15 μm
at the peak of heat evolution. The white hydrate rims indicate the outermost
layers of the rough product surface. While the solids in the two-dimensional figure
appear to be much less connected than in reality in the three-dimensional
structure, it can nevertheless be seen that only a small fraction of the volume is
128
Figure 5.21: A slice from the simulation of fraction F-15 μm at the peak. The pores are shown in black, alite in dark-grey and hydrates in white.
Figure 5.22: Degree of hydration against rate of reaction for calculations and experiments

Chapter 5: Nucleation and Growth Kinetics of Alite
filled by solids, and the inter-particle overlaps are too little to lead to a reduction
in the reaction rate.
To better understand the results, the results here have been compared to
results from simulations 6 to 8 shown earlier. In these simulations, the reaction
stoichiometry had been kept the same as that for cement and the volumetric ratios
were equivalent to a 0.4 water to cement ratio paste. The rate of heat evolution is
plotted against the degree of hydration for both cases in figure 5.22. As can be
clearly seen in the figure, in the experiments, the peak occurs at much lower
degrees of hydration than those observed in the simulations. This is because the
volume of product produced at these degrees of hydration in the simulations is not
large enough to cause sufficient overlaps, if a uniform density product is assumed.
The above results show that a nucleation and growth process on the surface
of the particles, and an outward growth rate that corresponds to the
experimentally measured heat-evolutions alone cannot explain the post-peak
behaviour of hydration. In order to obtain a clear peak, without a following
plateau, a significant overlap of the product from different particles is required. As
this overlap cannot be explained with the assumption that a uniformly dense
product is produced, the possibility of a lower density product that increases in
density with hydration is investigated in the later sections.
It is often argued that the slow diffusion of ions through the layers of
hydrates depositing over the cement particles controls the rate of reaction leading
to the deceleration. It is shown in the following discussion that evidence suggesting
that diffusion does not play an important role in hydration at least during the first
24 hours of hydration exists. It is also shown that the observed behaviour points
towards the nucleation and growth mechanism controlling the reaction well into
the fifth stage of hydration.
129
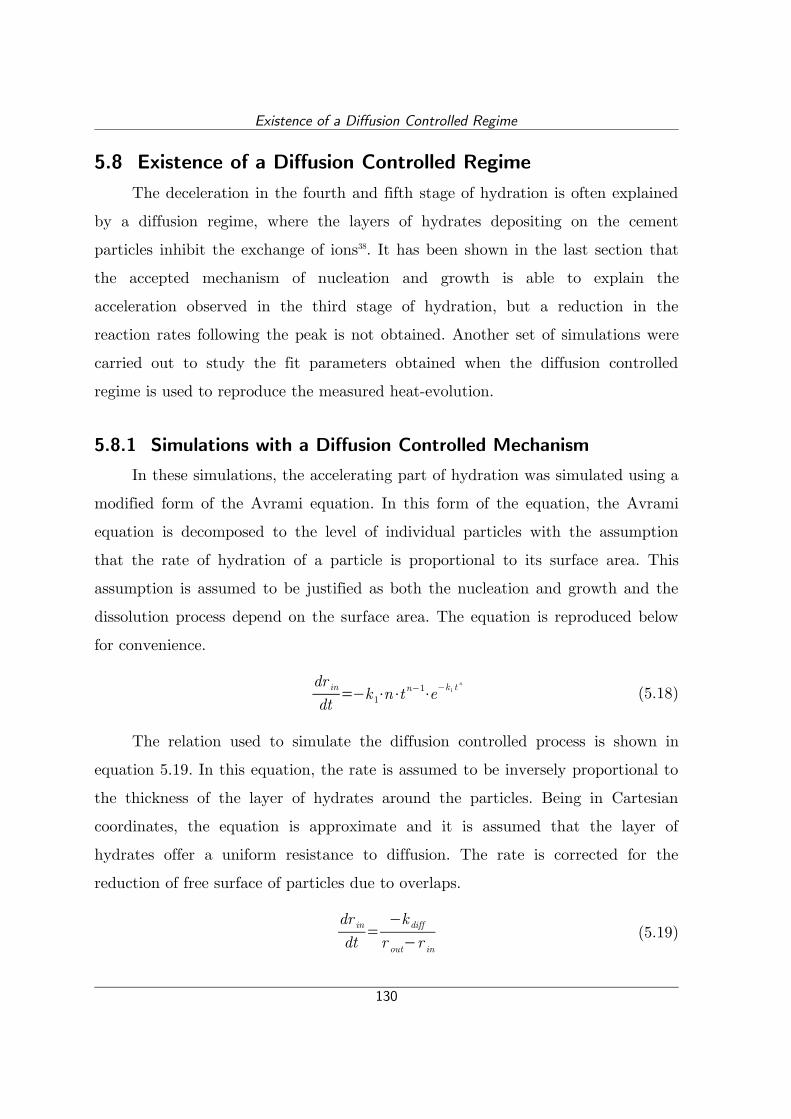
Existence of a Diffusion Controlled Regime
5.8 Existence of a Diffusion Controlled RegimeThe deceleration in the fourth and fifth stage of hydration is often explained
by a diffusion regime, where the layers of hydrates depositing on the cement
particles inhibit the exchange of ions38. It has been shown in the last section that
the accepted mechanism of nucleation and growth is able to explain the
acceleration observed in the third stage of hydration, but a reduction in the
reaction rates following the peak is not obtained. Another set of simulations were
carried out to study the fit parameters obtained when the diffusion controlled
regime is used to reproduce the measured heat-evolution.
5.8.1 Simulations with a Diffusion Controlled MechanismIn these simulations, the accelerating part of hydration was simulated using a
modified form of the Avrami equation. In this form of the equation, the Avrami
equation is decomposed to the level of individual particles with the assumption
that the rate of hydration of a particle is proportional to its surface area. This
assumption is assumed to be justified as both the nucleation and growth and the
dissolution process depend on the surface area. The equation is reproduced below
for convenience.
dr in
dt=−k 1⋅n⋅t
n−1⋅e−k1 tn
(5.18)
The relation used to simulate the diffusion controlled process is shown in
equation 5.19. In this equation, the rate is assumed to be inversely proportional to
the thickness of the layer of hydrates around the particles. Being in Cartesian
coordinates, the equation is approximate and it is assumed that the layer of
hydrates offer a uniform resistance to diffusion. The rate is corrected for the
reduction of free surface of particles due to overlaps.
dr in
dt=
−k diff
r out−r in
(5.19)
130

Chapter 5: Nucleation and Growth Kinetics of Alite
Equation 5.18 was fit to the accelerating part of the evolution such that the
calculated rate of hydration fit closely with the measured values up to as close to
the peak as possible. While this equation does not perfectly fit the measurements
and does not model the correct mechanism, its current form where the reaction
rate depends on the surface area of the particle is assumed to provide a good
starting point for a switch to the diffusion controlled mechanism. It is used only to
reproduce the thickness of the layer of hydrates at the measured degree of
hydration and time at the peak for the powders. The mechanism is assumed to
switch from the first to the second equation when the reaction rate predicted by
the second equation is lower than that from the first equation. This switch is
allowed to occur at different moments independently for each particle and can
happen only in one direction. The single parameter in the equation simulating
diffusion controlled regime was then varied to fit the decelerating part of the
curve.
The fits along with the original curves are shown in figure 5.23. The
parameters obtained from the fits are shown in table 5.6. The parameter n in the
Avrami equation was kept constant at 2.6 for most simulations. This value was
chosen as, on an average, it provided the best fits in the simulations 6 to 8 shown
earlier. A higher value of n was required to obtain an acceptable fit for fraction
G-6 μm. Also, an period with no reaction lasting 2.5 hours was required to be
assumed for this fraction.
Table 5.6: Parameters used in Avrami equation and diffusion equation simulationsFraction A-38 μm B-83 μm C-38 μm D-21 μm E-18 μm F-15 μm G-6 μm
k1 (hours-n) 1.25×10⁻⁴ 5.60×10⁻⁴ 6.70×10⁻⁴ 2.60×10⁻⁴ 4.50×10⁻⁴ 1.54×10⁻⁴ 2.00×10⁻⁴
n 2.6 2.6 2.6 2.6 2.6 2.6 3.2kdiff (μm2/h) 4.00×10⁻⁴ 4.80×10⁻³ 2.80×10⁻³ 1.20×10⁻³ 2.00×10⁻³ 4.00×10⁻⁴ 3.20×10⁻³
t0 (hours) 0.0 0.0 0.0 0.0 0.0 0.0 2.5α0 (%) 2.3 2.0 1.3 2.0 0.9 3.0 2.0
The smallest diffusion coefficient fit over the range was found to be 12 times
smaller than the largest one. The rather large spread of the parameters indicates
131
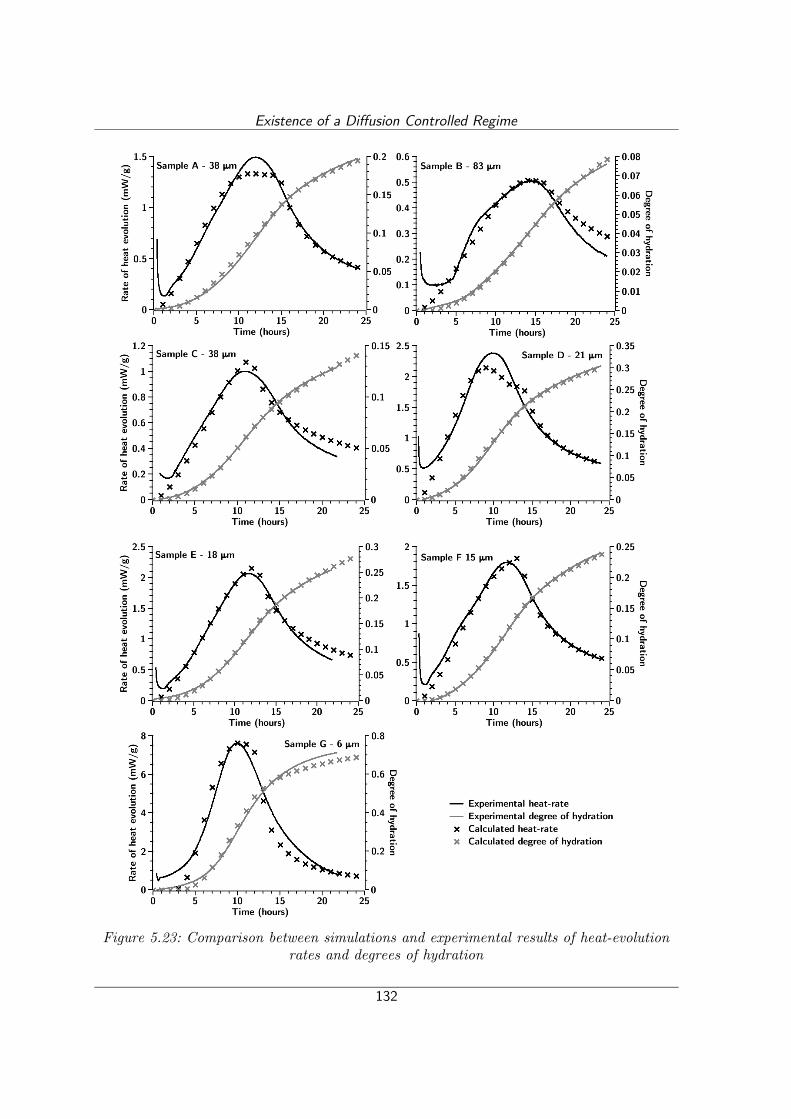
Existence of a Diffusion Controlled Regime
132
Figure 5.23: Comparison between simulations and experimental results of heat-evolution rates and degrees of hydration

Chapter 5: Nucleation and Growth Kinetics of Alite
that the thickness of the layer of product on the particles, when the switch to the
diffusion control occurs, differs by at least an order of magnitude between particle
size distributions.
The observed variability in the thickness of the product layer between
particle size distributions could either indicate that the properties of the hydrate
change dramatically depending on the particle size distribution, or that although
the equation produces the right shape of the evolution, it does not model the
actual mechanism controlling hydration. Since such a large difference in the
properties of C-S-H due to different particle size distributions is not expected, the
above results clearly show that a slow diffusion of ions through the layer of
hydrates cannot explain the dependence of the behaviour on the particle size
distributions.
In the following discussion the rate of change of the hydration kinetics are
studied to get more insight into a possible point of switch between mechanisms.
5.8.2 Rate of Change of Hydration KineticsThe rates of heat evolution for all fractions were smoothed using Savitzky–
Golay smoothing filter127 with a window size of eleven points. The values were then
differentiated and the results are plotted in figure 5.24. The rate of reaction and its
differential calculated from an Avrami equation, with an arbitrary value of k and
the value of n set at 3, is also plotted in the figure.
The information for the first two-three hours of the experiments is missing
due to the dissolution peak. The results for fraction B – 83 μm are not very clear
possibly due to a bimodal particle size distribution leading to observed reaction
rates being a combination of two widely different particle sizes reacting together at
different rates. For the other samples, the differential of the reaction rate was
found to be either constant or increasing almost linearly for a few hours. Before
the peak of heat-evolution the second order differential starts to reduce, almost
133

Existence of a Diffusion Controlled Regime
134
Figure 5.24: Heat-rates and differential of heat-rates for the fractions and calculated from the Avrami equation, as marked

Chapter 5: Nucleation and Growth Kinetics of Alite
linearly, up to a few hours after the peak. When compared to the calculated
values, the trend starting a few hours before the peak, up to 24 hours is similar to
that observed for the curve calculated from the Avrami equation. It must be noted
here that the Avrami equation is used here only as an example of the nucleation
and growth process since it represents the shape of the evolution quite well.
The smooth, almost linear, variation of the second order differential from a
few hours before the peak to a few hours after the peak suggests that the
mechanism of the reaction does not change in this period, pointing towards the
nucleation and growth mechanism continuing well beyond the peak. A similar
conclusion was drawn by Thomas62 on comparing a relation derived for
heterogeneous nucleation and growth with measured heat evolution values.
One of the important prerequisites for the reaction to be controlled by a
diffusion mechanism is the presence of a thick and continuous layer that inhibits a
free exchange of ions. However, in order to explain the accelerating part of the
reaction using the nucleation and growth mechanism, as discussed earlier, it is
necessary to assume that the surface of the particle is not completely covered by
product until the peak. This implies that the surface of particles is still partially
exposed to the pore solution, without any diffusion barrier inhibiting reaction. It is
therefore only logical that the diffusion controlled regime can only become the
controlling mechanism after the peak.
5.8.3 Dependence of Reaction Rate on Hydrate ThicknessThe approximate dependence of the reaction rate on the thickness of the
layer of hydrates was studied. The thickness of the product was calculated from
the degree of hydration, assuming mono-sized spherical particles. The size of the
particles was set at the median radius of the distribution. The variation of the rate
of heat evolution with the thickness of the product is shown in figure 5.25. While it
is understood that the calculated thickness of the product is only an approximate
135

Existence of a Diffusion Controlled Regime
value, it can be seen that, depending on the particle size, the rate of hydration can
vary to a large extent even when the thickness of the product is the same.
The arguments above strongly point towards the diffusion controlled
mechanism not reducing the hydration rate at least up to a few hours after the
peak. In the following discussion, a modification to the nucleation and growth
mechanism, which could explain most of the observed behaviour during the first
24 hours, is presented.
5.9 C-S-H with Age-Dependent Density
5.9.1 KineticsIn this set of simulations, the kinetics used are similar to those used in the
earlier case where the nucleation and growth mechanism was simulated on the
particles, with the C-S-H only partially covering the surface of the particles during
the first few hours. The main difference in these simulations is that the density of
the product formed is variable. Here, it is assumed that the product formed from
the reaction is low in density and that its density increases with time.
136
Figure 5.25: Dependence of the rate of hydration on the approximate thickness of products
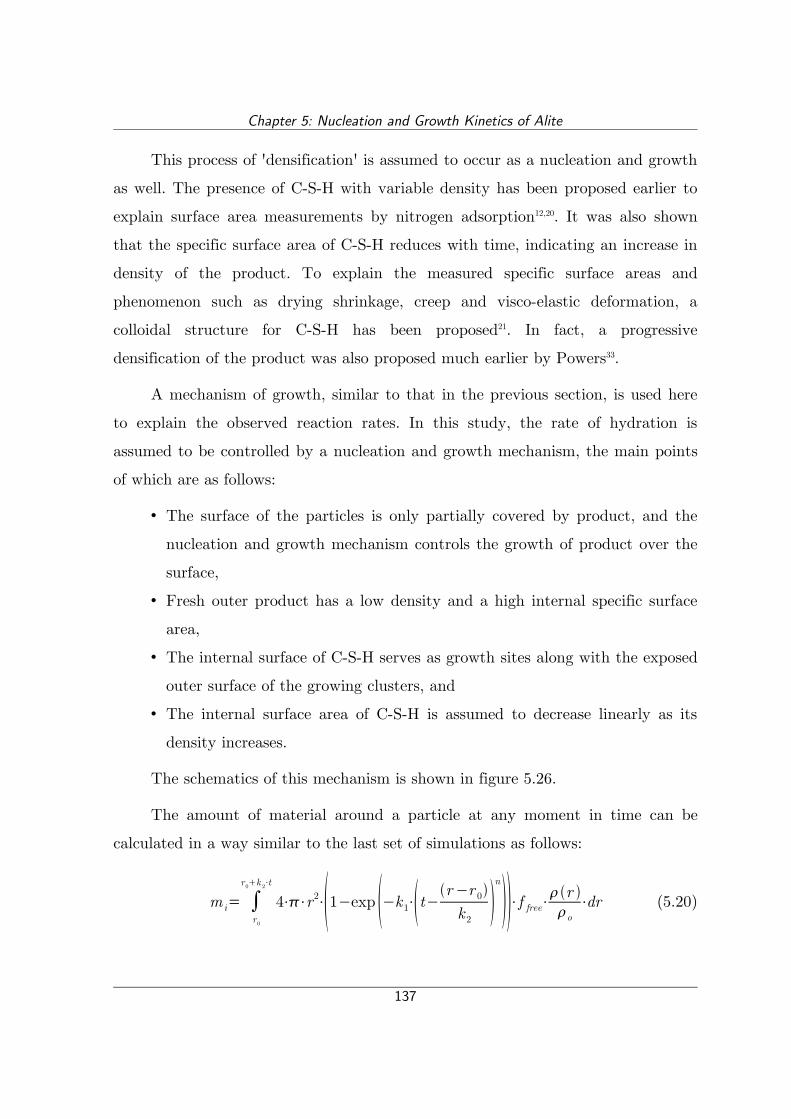
Chapter 5: Nucleation and Growth Kinetics of Alite
This process of 'densification' is assumed to occur as a nucleation and growth
as well. The presence of C-S-H with variable density has been proposed earlier to
explain surface area measurements by nitrogen adsorption12,20. It was also shown
that the specific surface area of C-S-H reduces with time, indicating an increase in
density of the product. To explain the measured specific surface areas and
phenomenon such as drying shrinkage, creep and visco-elastic deformation, a
colloidal structure for C-S-H has been proposed21. In fact, a progressive
densification of the product was also proposed much earlier by Powers33.
A mechanism of growth, similar to that in the previous section, is used here
to explain the observed reaction rates. In this study, the rate of hydration is
assumed to be controlled by a nucleation and growth mechanism, the main points
of which are as follows:
• The surface of the particles is only partially covered by product, and the
nucleation and growth mechanism controls the growth of product over the
surface,
• Fresh outer product has a low density and a high internal specific surface
area,
• The internal surface of C-S-H serves as growth sites along with the exposed
outer surface of the growing clusters, and
• The internal surface area of C-S-H is assumed to decrease linearly as its
density increases.
The schematics of this mechanism is shown in figure 5.26.
The amount of material around a particle at any moment in time can be
calculated in a way similar to the last set of simulations as follows:
m i= ∫r0
r 0k 2⋅t
4⋅⋅r2⋅1−exp −k 1⋅t−r−r 0
k 2n
⋅f free⋅r o
⋅dr (5.20)
137

C-S-H with Age-Dependent Density
The above relation includes a variable density, ρ(r), which depends on the
distance from the centre of the particle. It is assumed that the internal surface area
(si) of the product varies linearly with density, as follows:
s i∝max−
max−min
(5.21)
In the above equation, ρmin and ρmax are the minimum and maximum possible
densities of the product respectively. Since, the internal densification is
proportional to the available internal surface area, the rate of change of the
density of the product, ρ, can be related to time, t, as follows:
d
dt=kden⋅
max−
max−min
(5.22)
In this equation, kden is a rate constant. Rearranging we get:
∫min
max−min
max−⋅d =∫
0
tr
kden⋅dt (5.23)
Where tr is the age of the product at any point at a distance r from the
centre of a particle. Integrating we get:
138
Figure 5.26: Schematics of the nucleation and growth mechanism with different parallel and outwards growth rates and densification of the product for a single particle (top) and
between particles (bottom)

Chapter 5: Nucleation and Growth Kinetics of Alite
max−minln max−min
max− =kden⋅t r (5.24)
Rearranging we get:
=max−max−min ⋅exp −k den⋅t r
max−min (5.25)
As in the last case, tr can be related to the distance of the product from the
original surface of the particle, r, and time, t, using the vertical rate of growth, k2,
as follows:
t r=t− rk 2 (5.26)
5.9.2 Fit Parameters and ResultsEquations 5.20, 5.25 and 5.26 were given as an input plugin in μic and solved
numerically to calculate the amount of product around the grains at any moment
in time. Similar to the last set of simulations, the rates of reaction were calculated
from the demand generated from the nucleation and growth process described
above. The results from the simulations are shown in figure 5.27 along with the
experimentally measured values for the corresponding powders. The fit parameters
used in the simulations are listed in table 5.7. The value of ρmax was set to 2.0 g/cc
for all simulations, which was also assumed to be the density of the inner product.
In the simulations, the parameters were varied using manual trial and error.
Like in the previous case, perfect fits were not sought and the trials were stopped
when it was considered that the calculated results fairly replicate the
experimentally measured values. The value of n was again fixed at 3.0 and the
other four parameters were varied for individual simulations. It must be noted that
since the density of the inner product was fixed at the highest possible density of
the product, the actual average density of the product is higher than ρmin.
139

C-S-H with Age-Dependent Density
140
Figure 5.27: Comparison between simulations and experimental results of heat-evolution rates and degrees of hydration for simulations with variable density of product

Chapter 5: Nucleation and Growth Kinetics of Alite
The position of the peak was observed to depend on t2/3, and k2 and kden were
observed to have a combined effect on the rate of hydration. The factors k2, kden
and ρmin have a combined effect on the time and heat evolution at peak and also
the rate of heat evolution after the peak. Once again, the fits were found to be
extremely sensitive to all four parameters and obtaining good fits was time-
consuming. Due to time-constraints, in some cases the trials were stopped when a
reduction in the rates was observed at degrees of hydration similar to those in the
experiments. Figure 5.28 shows the variation of the curves with the parameters.
The parameter k2 was found to have a large dependence on the particle size
distribution. The value of this parameter was found to be lower for finer particle
141
Figure 5.28: Dependence of simulated heat-evolution on parameters for fraction E-18 μm
Figure 5.29: Variation of k2 with the number of particles per unit volume in the simulations

C-S-H with Age-Dependent Density
size distributions. The variation of this factor with the number of particles per unit
volume is shown in figure 5.29. The data used for this figure is listed in table 5.7.
Table 5.7: Parameters used in variable density nucleation and growth simulationsFraction A-38 μm B-83 μm C-38 μm D-21 μm E-18 μm F-15 μm G-6 μm
t2/3 (hours) 6.2 8.0 7.0 8.0 8.0 8.4 10.2
n 3.0 3.0 3.0 3.0 3.0 3.0 3.0
k2 (μm/hour) 0.04 1.10 0.78 0.12 0.34 0.08 0.23
kden (g/cc/hour) 0.0050 0.0020 0.0052 0.0095 0.0110 0.0090 0.0050
ρmin (g/cc) 0.214 0.100 0.109 0.150 0.182 0.127 0.245
α0 (%) 2.90 2.20 2.30 4.70 3.15 5.90 0.80
Table 5.8: Details of simulations with densifying C-S-HFraction A-38 μm B-83 μm C-38 μm D-21 μm E-18 μm F-15 μm G-6 μm
Number of particles 2034071 241 244 2096401 2173 805725 843168
Size of C.V. (μm) 100 400 175 125 100 75 40
Similar to the earlier fits, there is a redundancy in the fit parameters in these
simulations. While four parameters, not including n, could be varied, three main
features of the curves, viz. the time of peak, the height of the peak and the rate of
deceleration were sought to be reproduced. However, despite the redundancies, in
these simulations all the four parameters were varied together in order to avoid
biasing effects resulting from fixing one parameter to a value that might not work
well for some of the simulations.
5.9.3 DiscussionFor all particle size distributions, it was found that, using the proposed
mechanism, it was possible to obtain reasonable fits to the experimental results for
a large part of the first 24 hours. Although the best possible fits were not achieved
in some cases, the trends demonstrate that the experimentally measured reaction
kinetics can be obtained using the described mechanism. The variation in the fit
142

Chapter 5: Nucleation and Growth Kinetics of Alite
parameters, specially k2, is quite large, however a large number of unknowns and
assumptions exist in the simulations, some of which are listed below.
• The variation of specific surface area with density is not known. The first
order approximation used here can affect the shape of the results.
• The inner product is assumed to always have a high density. While this
assumption should not affect the results much and is only expected to scale
the parameters, some side-effects might occur.
• No induction period was assumed. The shape of the curves is affected if an
induction period precedes the nucleation and growth process.
• At any moment, the same fraction of all particles is assumed to be covered
by product.
Apart from the numerical factors discussed above, one of the most important
factors affecting the results is that, as discussed above, the measured calorimetry
results do not scale with the specific surface areas calculated from the measured
particle-size distributions. The nucleation and growth mechanism simulated here
assumes that the rate of nucleation and therefore the rate of initial growth depends
on the surface available, which, in the current case, is proportional to the specific
surface area of the cement. This observed variation might be either due to errors
in the measured particle size distributions, or in the nucleation and growth process
being non-homogeneous on the surface of the particles. While the initial dissolution
of cement, which is not considered in the simulations, would also affect the surface
available for nucleation, it is not expected to lead to the large deviation observed
in the trend (figure 5.13).
Figure 5.30 shows a slice of the simulated fraction B-83 μm at the peak, with
the outer boundary of the hydrates marked in white. It can be seen in the figure,
at the peak, the low density product has filled a significant portion of the
microstructure, explaining the sharp peak observed in the simulations. The high
outward growth rates simulated here quickly increase the reach of the reaction to
143

C-S-H with Age-Dependent Density
almost the entire microstructure, covering the entire volume with a fine mesh of
low-density product, converting the process into a volumetric process.
It was also observed that the fit parameter k2 was lower for simulations with
larger number of particles per unit volume. In computational volumes with larger
number of particles, the average distance between neighbouring particles is lower
and grain boundaries are distributed more uniformly throughout the volume. A
lower rate perpendicular to the grain boundaries is, therefore, required for
impingement between different particles. The observed dependence of k2 on the
average distance between particles indicates that the process of nucleation and
growth of C-S-H tends to spread throughout the pore-volume quite rapidly.
5.10 Simulating the Filler EffectIn order to understand the possible mechanism of the observed effect of fine
inert fillers on hydration kinetics, simulations using the above-discussed nucleation,
growth and densification mechanism were carried out. Here, it is assumed that this
C-S-H also forms on the surface of the filler particles and densifies, similar to the
product growing on the surface of the alite particles. The particle size distribution
used for the alite particles is the same as that shown for PSD-2 earlier in figure 4.2
144
Figure 5.30: A slice from fraction B-83 μm close to the peak, with pore-space in black, anhydrous grains in dark grey and hydrates in white
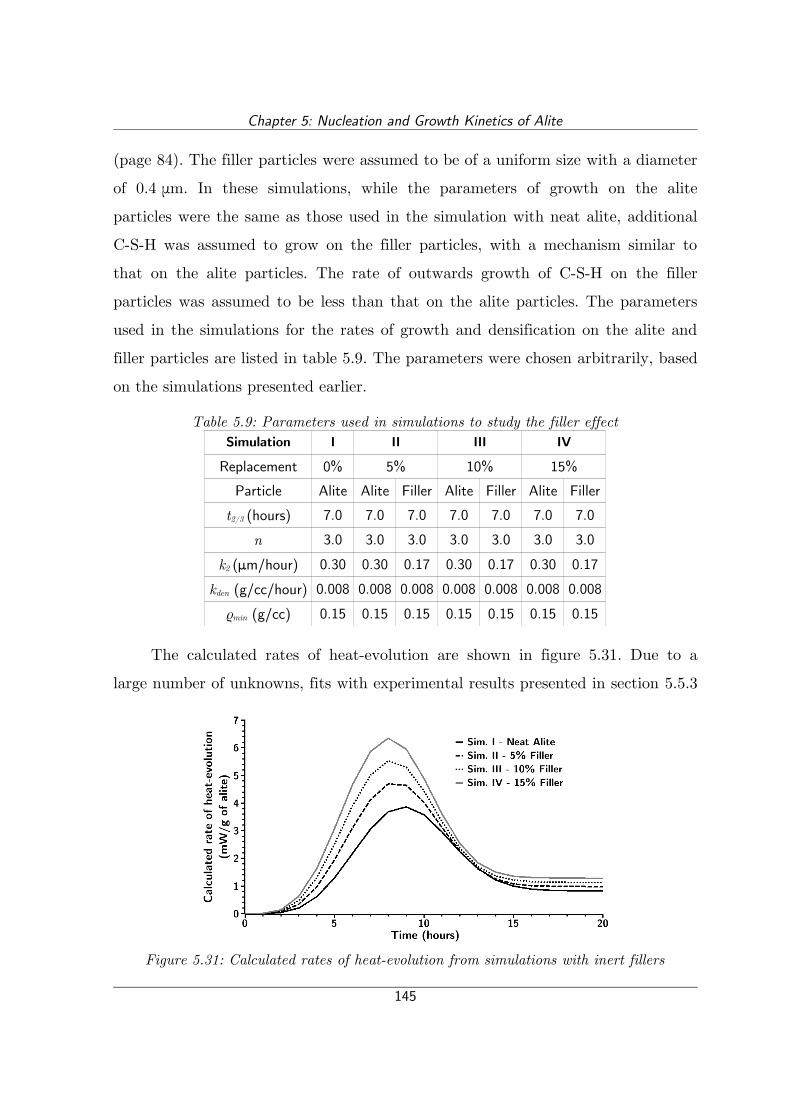
Chapter 5: Nucleation and Growth Kinetics of Alite
(page 84). The filler particles were assumed to be of a uniform size with a diameter
of 0.4 μm. In these simulations, while the parameters of growth on the alite
particles were the same as those used in the simulation with neat alite, additional
C-S-H was assumed to grow on the filler particles, with a mechanism similar to
that on the alite particles. The rate of outwards growth of C-S-H on the filler
particles was assumed to be less than that on the alite particles. The parameters
used in the simulations for the rates of growth and densification on the alite and
filler particles are listed in table 5.9. The parameters were chosen arbitrarily, based
on the simulations presented earlier.
Table 5.9: Parameters used in simulations to study the filler effectSimulation I II III IV
Replacement 0% 5% 10% 15%
Particle Alite Alite Filler Alite Filler Alite Filler
t2/3 (hours) 7.0 7.0 7.0 7.0 7.0 7.0 7.0
n 3.0 3.0 3.0 3.0 3.0 3.0 3.0
k2 (μm/hour) 0.30 0.30 0.17 0.30 0.17 0.30 0.17
kden (g/cc/hour) 0.008 0.008 0.008 0.008 0.008 0.008 0.008
ρmin (g/cc) 0.15 0.15 0.15 0.15 0.15 0.15 0.15
The calculated rates of heat-evolution are shown in figure 5.31. Due to a
large number of unknowns, fits with experimental results presented in section 5.5.3
145
Figure 5.31: Calculated rates of heat-evolution from simulations with inert fillers

Simulating the Filler Effect
earlier have not been attempted. Still, the above results show that the
enhancement in hydration on the addition of inert fillers can be explained by the
additional growth of C-S-H on the filler particles, which provide additional surface
for nucleation of the product. As a larger fraction of the product grows close to a
surface, the average density of C-S-H is higher at the same degree of hydration.
These simulations also predict a denser and less-porous microstructure with the
addition of fine fillers resulting from the more uniform distribution of hydrates in
the microstructure.
5.11 Deductions from the SimulationsBased on the simulations discussed above, given that the assumptions made
above are not incorrect, the following deductions can be made:
• The low heat evolution during the 'induction period' and the acceleration
of the hydration rate afterwards can be explained by the nucleation and
growth mechanism.
• In the nucleation and growth mechanism, nuclei of product form on the
surface of the particles and grow at a constant rate. The rate may be
different in the directions along the surface and outwards from the particle.
• The peak in the hydration curve corresponds to the time when the surface
of the particles is almost fully covered.
• A pure nucleation and growth process with the formation of a uniformly
dense material cannot explain the post-peak behaviour of the hydration
curves.
• In order to explain the observed deceleration with the slow diffusion of ions
through the layers of hydrates, a large variability in the transport
properties of C-S-H has to be assumed.
• Almost the entire hydration kinetics during the first 24 hours can be fit if
it is assumed that the initial density of the product formed is low and that
146

Chapter 5: Nucleation and Growth Kinetics of Alite
there is an internal surface associated with the low density product, which
is available for growth.
• The process simulated in the simulations with variable densities, is close to
a volumetric homogeneous nucleation and growth, and models the
formation of a fine low-density mesh of the product through a large portion
of the volume, which grows in density with the progress of hydration.
• The fit parameters obtained from these simulations vary to a large extent.
However, a clear relationship between the rate of perpendicular growth
from the particle boundaries, k2, which is the parameter showing the largest
scatter, and the number of particles per unit volume was observed. This
might indicate that the process tends to spread throughout the pore-
volume quite rapidly.
• The enhancement in the rate of hydration observed on the replacement of
alite by fine inert fillers can be explained by the nucleation of C-S-H on the
filler particles, and the faster densification of C-S-H occurring due to a
larger proportion of the product being present close to grain boundaries.
5.12 DiscussionThe results above indicate that the nucleation and growth process in
hydration is more volumetric in nature than being confined to the surface of the
particles. The results indicate the presence of a loose product, holding all the
particles together, from quite an early age. Although such a microstructure is not
seen in micrographs of cement paste, this could be attributed to the process of
sample preparation required for microscopic observations, which involves drying.
As this outer product would be suspended in the pore-solution like a colloid,
drying of the paste will lead to a collapse of the structure. Still, a loose, low-
density structure of C-S-H, growing as a loose packing of fires or sheets can be
observed in many micrographs36,27,24.
147
Discussion
Although with a much higher density, a colloidal structure of C-S-H was
postulated by Jennings, in order to explain its specific surface, creep and visco-
elastic behaviour21. Since the techniques reported measure only the bulk values,
only an average estimate of the values is obtained and a much higher localised
variation in the properties could still lead to similar bulk values. Therefore,
although only two possible densities of C-S-H have been proposed by Jennings12,
the actual variation at the level of individual particles could be much higher and
more continuous.
Another evidence in the support of a low density product filling a large part
of the microstructure is that when pore-sizes are measured using Quasi Electron
Neutron Scattering and NMR relaxation, which are two of the few techniques that
can explore the pores without having to dry the samples, capillary pores are not
observed128,129,130. In these measurements, mobile water was not observed after just
one hour of hydration, indicating that most of the water at this stage is present
only in smaller pores. This observation has been explained by the hypothesis that
since the water is present close to surfaces its mobility is limited, similar to water
in supercooled state131. It was also proposed that the water continues to get
“glassier” as it penetrates into the colloidal particles of C-S-H, increasing its
immobile fraction. However, the absence of large capillary pores, and the increase
in the glassiness of the water with hydration observed in these experiments could
also support the argument that a low density product quickly fills a large amount
of the space available in the system and continues to get denser.
This process of densification can also explain the early setting of paste even
at low degree of hydration, when just a small amount of product can lead to the
transformation of the paste from a viscous liquid to a visco-elastic solid. The
presence of a low-density product can improve the bond between the particles
leading to a set and the progressive densification of the product would lead to a
stiffening of the matrix.
148

Chapter 5: Nucleation and Growth Kinetics of Alite
In figure 5.32, the observed rate of hydration is plotted against the degree of
hydration at around 24 hours, just after the reaction reaches a more constant rate.
In this figure, data points from different series of experiments, first series with
variable particle size distributions, second series with rutile as a fine filler and the
third series with silica fume as a filler, which were presented in section 5.5.3, are
plotted using different shapes of points.
Contrary to intuition, it is observed that the rate of hydration is higher when
the degree of hydration is higher. One of the points, corresponding to fraction
G-6 μm, was found to be much higher than the rest of the trend as data points
beyond 21 hours of hydration were not available. The results show that around 24
hours the rate of hydration is approximately proportional to the volume of the
product present in the microstructure. This is consistent with the hypothesis above
that the process of hydration at this time is volumetric in nature.
Although, conclusive photographic evidence of the presence of this low-
density product is currently not available, the current study points towards an
important possibility in microstructural development, which requires further
149
Figure 5.32: Degree of hydration against the rate of heat-evolution from different alite samples with and without fine filler particles

Discussion
investigation. It is not claimed that the presented hypothesis is an accurate
representation of the hydration mechanism. Even if the basic mechanism is correct,
the current version of the theory has many gaps and uses many assumptions that
may not necessarily be justified. The spread in the fit parameters also indicates
significant missing information in the input and the mechanism.
More importantly, it has been conclusively shown that in the form it is
currently accepted, the nucleation and growth mechanism cannot explain the
observed reaction rates beyond the peak of hydration. It was also shown that in
order to explain the decelerating part of hydration using the diffusion controlled
mechanism, hydrates with widely varying diffusion properties have to be assumed.
The simulations presented also shows the adaptability of μic to different
simulation scenarios and in predicting results based on different mechanisms that
can be input to the model. The results also show that as long as unreasonable
simplifications are not made, microstructural models can be used to study
hydration mechanisms.
5.13 ConclusionsIn this chapter, the hydration kinetics of alite were investigated using μic.
The rates of hydration for different particle size distributions were studied and
were observed to be higher for finer powders. Powders of similar particle size
distributions close to the measured particle sizes of the powders were simulated in
μic using two different nucleation and growth mechanisms. It was shown that the
nucleation and growth of a uniformly dense material alone cannot explain the
observed hydration kinetics of alite. It was also shown that in order to explain the
deceleration using a diffusion controlled regime, drastic changes in the transport
properties of C-S-H, only with the variation of cement particle sizes would have to
be assumed. If a low-density C-S-H is assumed to be distributed in the pore-space,
150

Chapter 5: Nucleation and Growth Kinetics of Alite
the reaction kinetics for most of the first 24 hours of hydration can be explained
using a nucleation and growth mechanism.
The versatility of μic in enabling the simulation of a wide range of
phenomenon in three-dimensions was demonstrated. The simulation of kinetics,
taking into account both the consumption of particles and space-filling would not
be possible in two-dimensions. Although there is a lot of information regarding the
simulated processes missing, this study demonstrates how μic can be used to
identify the important parameters in the process, to help in the design of further
experiments.
151


Chapter 6: Conclusions and Perspectives
6.1 Microstructural Modelling and μicIn the current work it was shown that microstructural models can provide
important information about cement hydration. It was also shown that a flexible
modelling platform, which enables an easy inclusion of new mechanisms in the
simulations, can help in the better interpretation of experimental results. The
design of better algorithms can help us to avoid unnecessary simplifications in the
models and can lead to more accurate results. For example in the case of cement,
the possibility to simulate the microstructure, with every particle included in the
simulations, can provide more accurate results and a better understanding of the
mechanisms.
With this objective in mind, μic has been designed to provide cement
scientists with a powerful and flexible modelling tool. μic uses the vector approach
to enable the multi-scale representation of the cement microstructure. The
performance of the vector approach has been improved to allow modelling of
millions of cement particles. The flexible architecture of μic allows simulations of a
wide range of particulate growths. The user is allowed to define the materials,
particles and reactions in the simulations and to control the reaction mechanisms
by creating short programmes, called plugins, that can be given as input at
execution-time. The high amount of flexibility offered by μic can help achieve a
better understanding of cement hydration.
153

Microstructural Modelling and μic
Some of the important numerical and scientific advanced made with the
development of μic are listed below.
• The vector approach was improved to enable simulations with millions of
particles with the explicit calculation of all interactions.
• A microstructural modelling platform with the ability to simulate user-
defined materials, reactions, particles and mechanisms was developed.
• The flexibility of μic enables the easy inclusion of more cement phases and
hydration conditions in simulations.
• The flexibility is also useful for studying the macroscopic effects of
microscopic phenomena for comparison with experiments.
6.2 Hydration KineticsIt has been shown that a simple nucleation and growth mechanism cannot
explain the deceleration in reaction rates observed after the peak. In order to
explain the deceleration by a diffusion controlled mechanism, the transport
properties of C-S-H would have to vary drastically between samples. The
nucleation and growth of a low-density product and its subsequent densification
can explain the experimentally observed hydration rates at least during the first 24
hours of hydration. Experimental evidence, such as the absence of large capillary
pores when pore-sizes are studied using QENS or NMR without prior drying of the
samples129,130, and the fibrous low-density structure of C-S-H seen in TEM
images24,27, supports the presence of a disperse C-S-H that can fill a large part of
the microstructure from the early hours of hydration. Simulations of the nucleation
and growth mechanisms demonstrate the synergy between hydration kinetics and
microstructural development. Nevertheless, many aspects of the hypothesis
presented here have to be refined.
Still, since these suppositions are mostly speculative and are based on
microstructural fits of hydration kinetics, perfect accuracy of the model presented
154

Chapter 6: Conclusions and Perspectives
is not claimed. In fact, the main aim of the current study is to demonstrate the
need for a better understanding of the hydration mechanisms and shows that the
mechanisms that are mostly assumed to be true might not be as accurate as they
are believed to be. It is also demonstrated that computers and numerical models
can aid in better understanding of cement hydration and also in the verification of
the currently accepted theories on microstructural development.
Some of the important conclusions from the numerical study of the hydration
kinetics of alite are listed below.
• The simple nucleation and growth mechanism cannot explain the
deceleration of hydration after the peak.
• In order to explain the deceleration using the slow diffusion of ions through
the layer of hydrates growing of the surface of the particles, large changes
in the transport properties of C-S-H across particle size distributions have
to be assumed.
• The rate of hydration during the first 24 hours can be fit with simulations
modelling the nucleation and growth of a loosely packed C-S-H, which
densifies with hydration, but a large variation in the fit parameters is
observed.
• The fit parameters were observed to depend on the number of particles per
unit volume in the simulations, with the trends indicating a that the
loosely packed C-S-H spreads throughout the pore-volume within a few
hours.
• This study demonstrates the important role that numerical modelling can
play in further developing our understanding of cement hydration.
6.3 Perspectives on Microstructural Modellingμic, like most other microstructural models, is currently limited to spherical
particles. While it is possible to build most shapes as an assembly of smaller
155

Perspectives on Microstructural Modelling
spherical particles, this can be computationally expensive and less accurate than
explicit modelling of other shapes. The modelling of certain microstructural
features might necessitate the presence of non-spherical shapes in the simulations.
It is therefore important to develop algorithms that can enable fast calculation of
interactions between non-spherical shapes such as rods, cubes, prisms and
ellipsoids.
A resolution-free, or even high-resolution, characterisation of the porosity
poses a great challenge to modelling the microstructure and other important
properties, such as ion-transport, that can affect the durability of concrete.
Currently two different pore-characterisation methods have been implemented in
μic. One of the techniques implemented uses the vector approach to characterise
the pores and their connectivity. However, this approach is currently limited to
200,000 particles and requires further improvement before it can be applied to
cement. In the other approach, a regular mesh with 1 billion pixels has been used
to obtain the approximate pore-sizes. However, for typical simulations, the voxel-
size in this approach is limited to 0.1 μm, which, although smaller than the voxels
used in other voxel-based models, is much larger than the smaller capillary pores.
In order to be able to use the simulated microstructures to calculate durability-
related properties of cement, a better characterisation of the pores is needed.
In all the simulations presented here, thermodynamics and ion diffusion are
ignored and only processes that depend on physical characteristics have been
modelled. While thermodynamic calculations have not been included in the current
version of μic, because of the flexible and extensible design of μic, a
thermodynamic engine could be easily added to the model. A discrete model
simulating local thermodynamic properties and ion transport could be overlaid on
the vector information in the model in order to obtain a better representation of
cement hydration. The current architecture of μic already provides tools to overlay
discrete information on the vector-encoded geometry and also to facilitate
156

Chapter 6: Conclusions and Perspectives
communication and inter-conversion between the vector and discrete information.
Further development would still be required for efficient modelling of the coupled
chemical and physical processes.
6.4 Perspectives on Hydration KineticsWhile it has been demonstrated that our current understanding of hydration
kinetics is limited, the implications of the kinetics on the microstructure and vice-
versa have also been shown. The study points towards the need for new ideas to be
developed and tested in order to better explain cement hydration. As kinetics
depend directly on the mechanism, it is more important to achieve a better
understanding of hydration mechanism than to obtain blind fits to widely accepted
equations. Significant amount of work is still required to understand the hydration
mechanism of alite and other phases in cement in order to allow comprehensive
modelling of cement hydration. The results also show that many of the currently
accepted ideas may have to be reverified using the newer computational and
experimental techniques.
While only limited evidence supporting the hypothesis presented in this study
is present, the real mechanism of hydration could still be similar to that presented
here. A refinement of the assumptions and the information used in the current
study could provide important information pertaining cement hydration. The early
dissolution of cement phases, which can potentially alter the surface available for
the growth of products, and also cause a variation between different particle sizes
has not been studied here. This process could, however, be easily included in the
calculations, if the dissolution mechanisms and saturation concentrations were
known.
This study demonstrates the importance of the importance of using a
combination of experimental techniques and a good balance between experimental
and analytical studies. Many possibilities of development in cement science still
157

Perspectives on Hydration Kinetics
exist and tremendous development can be made using the right combination of
experimental, numerical and analytical techniques.
158
References
1. Taylor H.F.W., Cement Chemistry, Thomas Telford, 1997 2. Diamond S., C/S mole ratio of C-S-H gel in a mature C3S paste as determined by
EDXA, Cement and Concrete Research, Vol. 6, 1976, pp.413-416 3. Gard J.A. and Taylor H.F.W., Calcium silicate hydrate (II) ("C-S-H(II)"),
Cement and Concrete Research, Vol. 6, 1976, pp.667-677 4. Rayment D.L. and Majumdar A.J., The composition of the C-S-H phases in
Portland cement pastes, Cement and Concrete Research, Vol. 12, 1982, pp.753-764 5. Young J.F. and H. -S. Tong, Microstructure and strength development of beta-
dicalcium silicate pastes with and without admixtures, Cement and Concrete Research, Vol. 7, 1977, pp.627-636
6. Daimon M., Ueda S. and Kondo R., Morphological study on hydration of tricalcium silicate, Cement and Concrete Research, Vol. 1, 1971, pp.391-401
7. Gallucci E. and Scrivener K., Crystallisation of calcium hydroxide in early age model and ordinary cementitious systems, Cement and Concrete Research, Vol. 37, 2007, pp.492-501
8. RILEM Technical Committee 68-HMM, Mathematical modelling of hydration of cement: Hydration of dicalcium silicate, Materials and Structures, Vol. 20, 1987, pp.377-382
9. Powers T.C., Structure and Physical Properties of Hardened Portland Cement Paste, Journal of American Ceramic Society, Vol. 41, 1958, pp.1-6
10. Relis M. and Soroka I., Variation in density of Portland cement hydration products, Cement and Concrete Research, Vol. 7, 1977, pp.673-680
11. Young J.F. and Hansen W., Volume relationships for C-S-H formation based on hydration stoichiometries, Materials Research Society Symposium Proceedings, Vol. 85, 1987, pp.313-322
12. Tennis P.D. and Jennings H.M., A model for two types of calcium silicate hydrate in the microstructure of Portland cement pastes, Cement and Concrete Research, Vol. 30, 2000, pp.855-863
13. Brouwers H.J.H., The work of Powers and Brownyard revisited: Part 1, Cement and Concrete Research, Vol. 34, 2004, pp.1697-1716
14. Thomas J.J. and Jennings H.M., A colloidal interpretation of chemical aging of the C-S-H gel and its effects on the properties of cement paste, Cement and Concrete Research, Vol. 36, 2006, pp.30-38
15. Allen A.J., Thomas J.J. and Jennings H.M., Composition and density of nanoscale calcium-silicate-hydrate in cement, Nature Materials, Vol. 6, 2007, pp.311-316
159

Vector modelling of hydrating cement microstructure and kinetics
16. Constantinides G. and Ulm F.-J., The nanogranular nature of C-S-H, Journal of the Mechanics and Physics of Solids, Vol. 55, 2007, pp.64-90
17. Feldman R.F. and Sereda P.J., A new model for hydrated Portland cement and its implications, Engineering Journal, Vol. 53, 1970, pp.53-59
18. Feldman R.F. and Sereda P.J., A model for hydrated Portland cement paste as deduced from sorption-length change and mechanical properties, Materiaux et Construction, Vol. 1, 1968, pp.509-520
19. Daimon M., Abo-el-Enein S.A., Rosara G., Goto S. and Kondo R., Pore structure of calcium silicate hydrate in hydrated tricalcium silicate, Journal of the American Ceramic Society, Vol. 60, 1977, pp.110-114
20. Jennings H.M., A model for the microstructure of calcium silicate hydrate in cement paste, Cement and Concrete Research, Vol. 30, 2000, pp.101-116
21. Jennings H.M., Colloid model of C-S-H and implications to the problem of creep and shrinkage, Materials and Structures, Vol. 37, 2004, pp.59-70
22. Jennings H.M., Refinements to colloid model of C-S-H in cement: CM-II, Cement and Concrete Research, Vol. 38, 2008, pp.275-289
23. de Jong J.G.M., Stein H.N. and Stevels J.M., Hydration of tricalcium silicate, Journal of Applied Chemistry, Vol. 17, 1967, pp.246-250
24. Mathur P.C., Study of cementitious materials using transmission electron microscopy, Doctoral Thesis, École Polytechnique Fédérale de Lausanne, 2007
25. Kantro D.L., Brunauer S., and Weise C.H., Development of surface in the hydration of calcium silicates. ii. Extension of investigations to earlier and later stages of hydration, The Journal of Physical Chemistry, Vol. 66, 1962, pp.
26. Richardson I.G., Tobermorite/jennite- and tobermorite/calcium hydroxide-based models for the structure of C-S-H: applicability to hardened pastes of tricalcium silicate, beta-dicalcium silicate, Portland cement, and blends of Portland cement with blast-furnace slag, metakaolin, or silica fume, Cement and Concrete Research, Vol. 34, 2004, pp.1733-1777
27. Richardson I.G., The nature of C-S-H in hardened cements, Cement and Concrete Research, Vol. 29, 1999, pp.1131-1147
28. Ciach T.D., Gillott J.E., Swenson E.G. and Sereda P.J., Microstructure of calcium silicate hydrates, Cement and Concrete Research, Vol. 1, 1971, pp.13-25
29. Powers T.C. and Brownyard T.L., Studies of the physical properties of hardened Portland cement paste, American Concrete Society Journal Proceedings, Vol. 43, 1946, pp.101-132, 249-336, 469-504, 549-602, 669-712, 845-880, 933-992
30. Bonavetti V., Donza H., Menéndez G., Cabrera O. and Irassar E.F., Limestone filler cement in low w/c concrete: A rational use of energy, Cement and Concrete ResearchCement and Concrete Research, Vol. 33, 2003, pp.865-871
31. Garboczi E.J., Bullard J.W. and Bentz D.P., Virtual testing of cement and concrete-USA 2004, Concrete International, Vol. 26, 2004, pp.33-37
32. Heikal M., Physico-mechanical and microstructural characteristics of superplasticized silica fume-blended cement pastes, Silicates Industriels, Vol. 70, 2005, pp.135-142
33. Powers T.C., Physical properties of cement paste, Proceedings of the Fourth International Symposium on Chemistry of Cement, Washington, USA, 1960, pp.577-613
160
References
34. Powers T.C., A working hypothesis for further studies of frost resistance of concrete, American Concrete Society Journal Proceedings, Vol. 41, 1945, pp.245-272
35. Powers T.C., Void Space as a Basis for Producing Air-Entrained Concrete, American Concrete Society Journal Proceedings, Vol. 50, 1954, pp.741-760
36. Grudemo A., An electronographic study of the morphology and crystrallization properties of calcium silicate hydrates, Procedings of the Swedish Cement and Concrete Institute, Royal Institute of Technology Stockholm, Vol. 26, 1955, pp.103
37. Grudemo A., The microstructure of hardened cement paste, Proceedings of the Fourth International Symposium on the Chemistry of Cement, Washington, USA, 1960, pp.615-648
38. Kondo R. and Ueda S., Kinetics of hydration of cements, Proceedings of the 5th international symposium on chemistry of cement, Tokyo, 1968, pp.203-248
39. Ciach T.D. and Swenson E.G., Morphology and microstructure of hydrating Portland cement and its constituents II. Changes in hydration of calcium silicates alone and in the presence of triethanolamine and calcium lignosulphonate, both with and without gypsum, Cement and Concrete Research, Vol. 1, 1971, pp.159-176
40. Lawrence F.V. and Young J.F., Studies on the hydration of tricalcium silicate pastes I. Scanning electron microscopic examination of microstructural features, Cement and Concrete Research, Vol. 3, 1973, pp.149-161
41. Hadley D.W., The nature of the paste-aggregate interface, Doctoral Thesis, Purdue University, USA, 1972
42. Barnes B.D., Diamond S. and Dolch W.L., Hollow shell hydration of cement particles in bulk cement paste, Cement and Concrete Research, Vol. 8, 1978, pp.263-271
43. Walker H.N., A discussion of the paper "Hollow shell hydration of cement particles in bulk cement paste" By B.D. Barnes, Sidney Diamond and W.L. Dolch, Cement and Concrete Research, Vol. 9, 1979, pp.525-526
44. Scrivener K.L., The development of microstructure during the hydration of Portland cement, Doctoral Thesis, Imperial college of science and technology, University of London, 1984
45. Kjellsen K.O., Jennings H.M. and Lagerblad B., Evidence of hollow shells in the microstructure of cement paste, Cement and Concrete Research, Vol. 26, 1996, pp.593-599
46. Pratt P.L. and Ghose A., Electron microscope studies of Portland cement microstructure during setting and hardening, Philosophical Transactions of the Royal Society of London A, Vol. 310, 1983, pp.93-103
47. Kjellsen K.O. and Lagerblad B., Microstructure of tricalcium silicate and Portland cement systems at middle periods of hydration-development of Hadley grains, Cement and Concrete Research, Vol. 37, 2007, pp.13-20
48. Stein H.N., Thermodynamic considerations on the hydration mechanisms of Ca3SiO5 and Ca3Al2O, Cement and Concrete Research, Vol. 2, 1972, pp.167-177
49. Pommersheim J.M. and Clifton J.R., Mathematical modeling of tricalcium silicate hydration, Cement and Concrete Research, Vol. 9, 1979, pp.765-770
50. Tenoutasse N. and de Donder A., Silicates Industriels, Vol. 35, 1970, pp.301-307 51. Odler I. and Schüppstuhl J., Early hydration of tricalcium silicate III. Control of
the induction period, Cement and Concrete Research, Vol. 11, 1981, pp.765-774
161

Vector modelling of hydrating cement microstructure and kinetics
52. Maycock J.N., Skalny J. and Kalyoncu R., Crystal defects and hydration I. Influence of lattice defects, Cement and Concrete Research, Vol. 4, 1974, pp.835-847
53. Garrault S. and Nonat A., Hydrated layer formation on tricalcium and dicalcium silicate surfaces: Experimental study and numerical simulations, Langmuir, Vol. 17, 2001, pp.8131-8138
54. Gartner E.M., A proposed mechanism for the growth of C-S-H during the hydration of tricalcium silicate, Cement and Concrete Research, Vol. 27, 1997, pp.665-672
55. Frohnsdorff G.J.C., Fryer W.G. and Johnson P.D., The mathematical simulation of chemical, physical and mechanical changes accompanying the hydration of cement, Proceedings of the 5th International Symposium on Chemistry of Cement, Tokyo, 1968, pp.321
56. Brown P.W., Pommersheim J. and Frohnsdroff G., A kinetics model for the hydration of tricalcium silicate, Cement and Concrete Research, Vol. 15, 1985, pp.35-41
57. Stein H.N. and Stevels J.M., Influence of silica on the hydration of 3CaO SiO2, Journal of Applied Chemistry, Vol. 14, 1964, pp.338-346
58. Jennings H.M., Aqueous Solubility Relationships for Two Types of Calcium Silicate Hydrate, Journal of the American Ceramic Society, Vol. 69, 1986, pp.614-618
59. Tadros M.E., Skalny J. and Kalyoncu R.S., Early hydration of tricalcium silicate, Journal of the American Ceramic Society, Vol. 59, 1976, pp.344-347
60. Wu Z. and Young J.F., Formation of calcium hydroxide from aqueous suspensions of tricalcium silicate, Journal of the American Ceramic Society, Vol. 67, 1984, pp.48-51
61. Garrault S., Behr T. and Nonat A., Formation of the C-S-H layer during early hydration of tricalcium silicate grains with different sizes, Journal of Physical Chemistry, Vol. 110, 2006, pp.270-275
62. Thomas J.J., A new approach to modeling the nucleation and growth kinetics of tricalcium silicate hydration, Journal of the American Ceramic Society, Vol. 90, 2007, pp.3282-3288
63. Odler I. and Dörr H., Early hydration of tricalcium silicate II. The induction period, Cement and Concrete Research, Vol. 9, 1979, pp.277-284
64. Bezjak A. and Jelenic I., On the determination of rate constants for hydration processes in cement pastes, Cement and Concrete Research, Vol. 10, 1980, pp.553-563
65. Taplin J.H., On the hydration kinetics of hydraulic cements, Proceedings of the 5th International Symposium on chemistry of cement, Tokyo, 1968, pp.337-348
66. Johnson W.A. and Mehl R.F., Reaction kinetics in processes of nucleation and growth, Transactions of the American Institute of Mining and Metallurgy, Vol. 135, 1939, pp.416-458
67. Avrami M., Kinetics of phase change. I, Journal of Chemical Physics, Vol. 7, 1939, pp.1103-1112
68. Kolmogorov A., Statistical theory of crystallization of metals (in Russian), Akademiia nauk SSSR Izvestiia Seriia khimicheskaia (Bulletin of the Academy of Sciences of the USSR. Division of chemical sciences), Vol. 3, 1937, pp.355-359
162

References
69. Austin J.B. and Rickett R.L., Kinetics of the decomposition of austenite at constant temperature, Transactions of the American Institute of Mining, Metallurgical, and Petroleum Engineers, Vol. 135, 1939, pp.396-443
70. Thomas J.J., and Jennings H.M., Effects of D2O and mixing on the early hydration kinetics of tricalcium silicate, Chemistry of Materials, Vol. 11, 1999, pp.1907-1914
71. Bernard O., Ulm F.J. and Lemarchand E., A multiscale micromechanics-hydration model for the early-age elastic properties of cement-based materials, Cement and Concrete Research, Vol. 33, 2003, pp.1293-1309
72. Fierens P. and Verhaegen J. P., Hydration of tricalcium silicate in paste - Kinetics of calcium ions dissolution in the aqueous phase, Cement and Concrete Research, Vol. 6, 1976, pp.337-342
73. Odler I. and Dörr H., Early hydration of tricalcium silicate I. Kinetics of the hydration process and the stoichiometry of the hydration products, Cement and Concrete Research, Vol. 9, 1979, pp.239-248
74. Garrault S., Finot E., Lesniewska E. and Nonat A., Study of C-S-H growth on C3S surface during its early hydration, Materials and Structures, Vol. 38, 2005, pp.435-442
75. Pommersheim J.M. and Clifton J.R., Mathematical modeling of tricalcium silicate hydration. II. Hydration sub-models and the effect of model parameters, Cement and Concrete Research, Vol. 12, 1982, pp.765-772
76. Jander W., Reaktionen im festen Zustande bei höheren Temperaturen. Reaktionsgeschwindigkeiten endotherm verlaufender Umsetzungen, Zeitschrift für anorganische und allgemeine Chemie, Vol. 163, 1927, pp.1-30
77. Ginstling A.M. and Brounshtein B.I., Concerning the diffusion kinetics of reactions in spherical particles, Journal of Applied Chemistry (Russia), Vol. 23, 1950, pp.1327-1338
78. Brown P.W., Effects of Particle Size Distribution on the Kinetics of Hydration of Tricalcium Silicate, Journal of the American Ceramic Society, Vol. 72, 1989, pp.1829-1832
79. A. Bezjak, Kinetic analysis of cement hydration including various mechanistic concepts. I. Theoretical development, Cement and Concrete Research, Vol. 13, 1983, pp.305-318
80. Knudsen T., The dispersion model for hydration of Portland cement I. General concepts, Cement and Concrete Research, Vol. 14, 1984, pp.622-630
81. A. Bezjak, An extension of the dispersion model for the hydration of Portland cement, Cement and Concrete Research, Vol. 16, 1986, pp.260-264
82. A. Bezjak, Nuclei growth model in kinetic analysis of cement hydration, Cement and Concrete Research, Vol. 16, 1986, pp.605-609
83. W. Banks, M. Gordon, R.-J. roe and A. Sharples, The crystallization of polyethylene I, Polymer, Vol. 4, 1963, pp.61-74
84. Hillier I.H., Modified Avrami equation for the bulk crystallization kinetics of spherulitic polymers, Journal of Polymer Science Part A: General Papers, Vol. 3, 1965, pp.3067-3078
85. Frigione G. and Marra S., Relationship between particle size distribution and compressive strength in Portland cement, Cement and Concrete Research, Vol. 6, 1976, pp.113-127
163

Vector modelling of hydrating cement microstructure and kinetics
86. FitzGerald S.A., Neumann D.A., Rush J.J., Bentz D.P. and Livingston R.A., In situ quasi-elastic neutron scattering study of the hydration of tricalcium silicate, Chemistry of Materials, Vol. 10, 1998, pp.397-402
87. Cahn J.W., The kinetics of grain boundary nucleated reactions, Acta Metallurgica, Vol. 4, 1956, pp.449-459
88. Gauffinet S., Finot E., Lesniewska E. and Nonat A., Observation directe de la croissance d'hydrosilicate de calcium sur des surfaces d'alite et de silice par microscopie a force atomique, Comptes Rendus de l'Academie de Sciences - Serie IIa: Sciences de la Terre et des Planetes, Vol. 327, 1998, pp.231-236
89. Balshin M.Y., Relation of mechanical properties of powder metals and their porosity and the ultimate properties of porous metal-ceramic materials, Doklady Akademii Nauk (USSR), Vol. 67, 1949, pp.831-834
90. Ryshkewitch E., Compression strength of porous sintered alumina and zirconia, Journal of the American Ceramic Society, Vol. 36, 1953, pp.65-68
91. Schiller K.K., Mechanical properties of non-metallic brittle materials, Butterworths, London, 1958
92. Lamberet S., Durability of ternary binders based on Portland cement, calcium aluminate cement and calcium sulfate, Doctoral Thesis, EPFL, Switzerland, 2005
93. Sadouki H. and Wittmann F.H., On the analysis of the failure process in composite materials by numerical simulation, Materials Science and Engineering, Vol. 104, 1988, pp.9-20
94. Wittmann F.H., Roelfstra P.E. and Sadouki H., Simulation and analysis of composite structures, Materials Science and Engineering, Vol. 68, 1985, pp.239-248
95. Roelfstra P.E., Sadouki H. and Wittmann F.H., Le béton numérique, Materials and Structures, Vol. 18, 1985, pp.327-335
96. Jennings H.M. and Johnson S.K., Simulation of microstructure development during the hydration of a cement compound, Journal of the American Ceramic Society, Vol. 69, 1986, pp.790-795
97. Johnson S.K. and Jennings H.M., Computer simulated hydration of a cement model, Proceedings of the 10th CIB congress, International council for building research, studies, and documentation, Washington D.C., U.S.A., 1986, pp.2086-2095
98. Bentz D.P., Three-dimensional computer simulation of Portland cement hydration and microstructure development, Journal of the American Ceramic Society, Vol. 80, 1997, pp.3-21
99. Bentz D.P., Modelling cement microstructure: Pixels, particles, and property prediction, Materials and Structures, Vol. 32, 1999, pp.187-195
100. von Neumann J., The theory of self-reproducing automata, Univ. of Illinois Press, USA, 1966
101. Bentz D.P., A Three-Dimensional Cement Hydration and Microstructure Program. I. Hydration Rate, Heat of Hydration, and Chemical Shrinkage, NISTIR 5756, U.S. Department of Commerce, 1995
102. Bullard J.W. and Garboczi E.J., A model investigation of the influence of particle shape on Portland cement hydration, Cement and Concrete Research, Vol. 36, 2006, pp.1007-1015
103. Garboczi E.J. and Bullard J.W., Shape analysis of a reference cement, Cement and Concrete Research, Vol. 34, 2004, pp.1933-1937
164
References
104. Maekawa K., Chaube R. and Kishi T., Modelling of concrete performance: Hydration, microstruture and mass transport, E. & F.N. Spon, 1999
105. Maekawa K., Ishida T. and Kishi T., Multi-scale modeling of concrete performance - integrated material and structural mechanics, Journal of Advanced Concrete Technology, Vol. 1, 2003, pp.91-126
106. van Breugel K., Numerical simulation of hydration and microstructural development in hardening cement-based materials (I): Theory, Cement and Concrete Research, Vol. 25, 1995, pp.319-331
107. van Breugel K., Numerical simulation of hydration and microstructural development in hardening cement-based materials : (II) applications, Cement and Concrete Research, Vol. 25, 1995, pp.522-530
108. Koenders E.A.B. and van Breugel K., Numerical modelling of autogenous shrinkage of hardening cement paste, Cement and Concrete Research, Vol. 27, 1997, pp.1489-1499
109. Ye G., van Breugel K. and Fraaij A.L.A., Three-dimensional microstructure analysis of numerically simulated cementitious materials, Cement and Concrete Research, Vol. 33, 2003, pp.215-222
110. Navi P., and Pignat C., Simulation of cement hydration and the connectivity of the capillary pore space, Advanced Cement Based Materials, Vol. 4, 1996, pp.58-67
111. Pignat C., Simulation numérique de l'hydration du silicate tricalcique, charactérisation de la structure poreuse et de la perméabilité, Doctoral Thesis, École Polytechnique Fédérale de Lausanne, 2003
112. Pignat C., Navi P. and Scrivener K., Simulation of cement paste microstructure hydration, pore space characterization and permeability determination, Materials and Structures, Vol. 38, 2005, pp.459-466
113. Navi P. and Pignat C., Three-dimensional characterization of the pore structure of a simulated cement paste, Cement and Concrete Research, Vol. 29, 1999, pp.507-514
114. Stroeven M. and Stroeven P., SPACE system for simulation of aggregated matter application to cement hydration, Cement and Concrete Research, Vol. 29, 1999, pp.
115. Park K., Noguchi T. and Plawsky J., Modeling of hydration reactions using neural networks to predict the average properties of cement paste, Cement and Concrete Research, Vol. 35, 2005, pp.1676-1684
116. Grondin F., Dumontet H., Ben Hamida A., Mounajed G. and Boussa H., Multi-scales modelling for the behaviour of damaged concrete, Cement and Concrete Research, Vol. 37, 2007, pp.1453-1462
117. Cook J.M., Technical notes and short papers: rational formulae for the production of a spherically symmetric probability distribution, Mathematical Tables and other Aids to Computation, Vol. 11, 1957, pp.81-82
118. Weisstein E.W., Sphere point picking,from MathWorld--A Wolfram web resource http://mathworld.wolfram.com/SpherePointPicking.html
119. Verlet L., Computer "Experiments" on Classical Fluids. I. Thermodynamical Properties of Lennard-Jones Molecules, Physical Review, Vol. 159, 1967, pp.98-103
120. Jennings H.M. and Parrott L.J., Microstructural Analysis of Hardened Alite Paste, Part II: Microscopy and Reaction Products, Journal of Materials Science, Vol. 21, 1986, pp.4053-4059
165

Vector modelling of hydrating cement microstructure and kinetics
121. Richardson I.G., The calcium silicate hydrates, Cement and Concrete Research, Vol. 38, 2008, pp.137-158
122. Cotterill R.M.J. Ed., Models of brain function, Cambridge University Press, 1989 123. Lastow O., Simulation of dendrite formations of aerosol particles on a single
fibre, Journal of Aerosol Science , Vol. 25, Supplement 1, 1994, pp.199-200 124. Wilson M.R., Ilnytskyi J.M. and Stimson L.M., Computer simulations of a liquid
crystalline dendrimer in liquid crystalline solvents, The Journal of Chemical Physics, Vol. 119, 2003, pp.3509-3515
125. Costoya M., Kinetics and microstructural investigation on the hydration of tricalcium silicate, Doctoral Thesis, École Polytechnique Fédérale de Lausanne, Switzerland, 2008
126. Zajac M., Étude des relations entre vitesse d'hydratation, texturation des hydrates et résistance mécanique finale des pâtes et micro-mortiers de ciment Portland, Doctoral thesis, Institut Carnot de Bourgogne, Université de Bourgogne, 2007
127. Savitzky A. and Golay M.J.E., Smoothing and Differentiation of Data by Simplified Least Squares Procedures, Analytical Chemistry, Vol. 36, 1964, pp.1627-1639
128. Halperin W.P., Jehngb J.Y. and Yi-Qiao Song, Application of spin-spin relaxation to measurement of surface area and pore size distributions in a hydrating cement paste, Magnetic Resonance Imaging, Vol. 12, 1994, pp.169-173
129. Fratini E., Chen S.-H. Baglioni P. and Bellissent-Funel M.-C., Quasi-elastic neutron scattering study of translational dynamics of hydration water in tricalcium silicate, Journal of Physical Chemistry B, Vol. 106, 2002, pp.158-166
130. McDonald P.J., Mitchell J., Mulheron M., Monteilhet L. and Korb J.-P., Two-dimensional correlation relaxation studies of cement pastes, Magnetic Resonance Imaging , Vol. 25, 2007, pp.470-473
131. Fratini E., Chen S.-H. and Baglioni P., Investigation of the temporal evolution of translational dynamics of water molecules in hydrated calcium aluminate pastes, Journal of Physical Chemistry B, Vol. 107, 2003, pp.10057-10062
166

Shashank BishnoiMaterials Science Doctoral Student Home Address:Laboratory of Construction Materials Ch. du Bochet 18Ecole Polytechnique Fédérale de Lausanne 1024 EcublensEPFL-STI-IMX-LMC, Station 12 SwitzerlandLausanne 1015, SwitzerlandPh : (+41)-21-693-68-59 Email: [email protected]
PersonalDate of Birth : 13 December 1980Nationality : Indian
Educational Qualifications Masters of Engineering, Civil Engineering (September 2004)
University of Tokyoo Awarded the Furuichi award for best Masters thesis presentation in Department of Civil
Engineering, University of Tokyoo Monbu-kagaku-sho scholarship awarded by Ministry of Education, Culture, Sports, Science
and Technology, Government of Japan Bachelor of Technology, Civil Engineering (May 2002)
Indian Institute of Technology Kanpuro Awarded the Prof. A.S.R. Sai Memorial Medal for “Outstanding all round achievements
among students graduating in B.Tech. programme in Civil Engineering
Journal Publications submitted Smilauer V., Bittnar Z., Bishnoi S. and Scrivener K., “The differences in homogenized
elastic properties between discrete and vector cement hydration models”, submitted to Materials and Structures
Bishnoi S. and Uomoto T., “Strain temperature hysteresis in concrete under cyclic freeze-thaw conditions”, Cement and Concrete Composites (accepted, in press)
Conference Publications
Bishnoi S. and Scrivener K., “Micro-structural modelling of cementitious materials using vector approach”, Proceedings of the 12th International Congress on the Chemistry of Cement, Montreal, Canada, July 2007
Costoya M., Bishnoi S., Gallucci E. and Scrivener K., “Synthesis and hydration of tricalcium silicate”, Proceedings of the 12th International Congress on the Chemistry of Cement, Montreal, Canada, July 2007
Guidoum A., Jaouadi I., Bishnoi S. and Navi P., “Modelling mechanical properties of cement-based materials from their microstructure”, Proceedings of the 12th International Congress on the Chemistry of Cement, Montreal, Canada, July 2007
Bishnoi S. and Scrivener K., “Multi-scale numerical characterisation of cement porosity”, Proceedings of the 5th International Essen Workshop on Transport in Concrete, Essen, Germany, June 2007
Bishnoi S. and Scrivener K., “Modelling the hydration of portland cement using μic”, Modelling of Heterogenous Materials with Applications in Construction and Biomedical Engineering, Prague, Czech Republic, June 2007

Shashank Bishnoi
Bishnoi S. and Scrivener K., "Optimised continuum cement hydration modelling", Proceedings of the 2nd International Symposium on Advances in Concrete through Science and Engineering, Quebec, Canada, September 2006
Costoya M., Bishnoi S., Gallucci E. and Scrivener K., “Effect of particle size distribution of alite on its hydration”, Cement and Concrete Science, Sheffield Hallam University, U.K., September 2006
Gallucci E., Scrivener K., Bishnoi S., Groso A. and Stampanoni M., “3D imaging of the pore network of hydrated cement pastes. Experimental and modelling approaches”, Cementitious Materials as Model Porous Media: Nanostructure and Transport Processes, Monte Verita, Switzerland, July 2005
Bishnoi S. and Uomoto T., “Strain variations in concrete under freeze-thaw conditions”, Proceedings of the 59th Annual Meeting of Japan Society of Civil Engineers, 2004, Nagoya, Japan
Bishnoi S. and Uomoto T., “Temperature and strain variation in concrete under freeze-thaw conditions”, Proceedings of the Annual Convention of Japan Concrete Institute, 2004, Kochi, Japan
Bishnoi S., Singh A. and Misra S., “Parameters affecting steel anchorages under shear”, Proceedings of the Annual Convention of Japan Concrete Institute, 2003, Kyoto, Japan
Lecture Lectured on “Modelling of Cement Microstructure” as part of the Second Marie Curie
Research and Training Network course for doctoral students funded by the European Union at Ljubljana, Slovenia, March 2007
Work/Field Experience Actively involved in several doctoral and other research projects at current
laboratory. Supervised several interns and one undergraduate project. Part time job at International Center for Urban Safety Engineering, Institute of
Industrial Science, University of Tokyo, Japan (Dec. 2002 – Mar. 2004) Intern at Laboratory of Construction Materials, EPFL (June – August 2002)
Worked on computer modelling of evolutionary cement microstructure to study progress of hydration and change in porosity characteristics
Industrial Trainee on Construction Site, M/s Gammon India Limited, Guwahati, India (May – June 2001)
Project Fellow in Structural Engineering Laboratory, Department of Civil Engineering, Indian Institute of Technology Kanpur (May – July 2000)
Computer Skills and Experience Programming Languages : Java, C, Fortran
Languages English : Speak, read and write Hindi : Speak, read and write French : Speak, read and write imperfectly Japanese : Speak imperfectly
Page 2 of 2
Top Related