


Languages
Pages
Legal

Varma’s Financial Statement 201615 February 2017
15 Feb 2017 | Financial Statement 2016
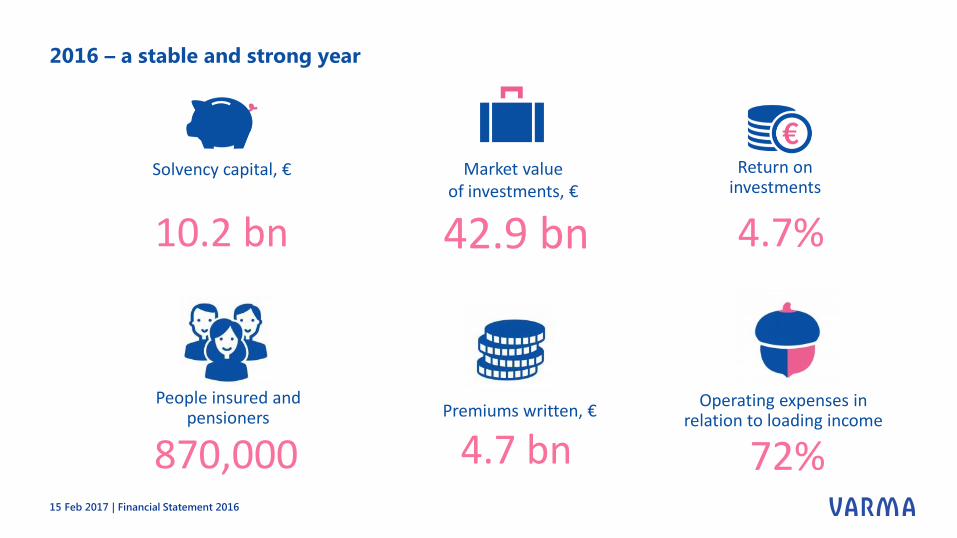
2016 – a stable and strong year
15 Feb 2017 | Financial Statement 2016
Market valueof investments, €
42.9 bn
Return oninvestments
4.7%
Solvency capital, €
10.2 bn
Premiums written, €
4.7 bn
Operating expenses in relation to loading income
72%
People insured and pensioners
870,000
Investments and solvency
15 Feb 2017 | Financial Statement 2016
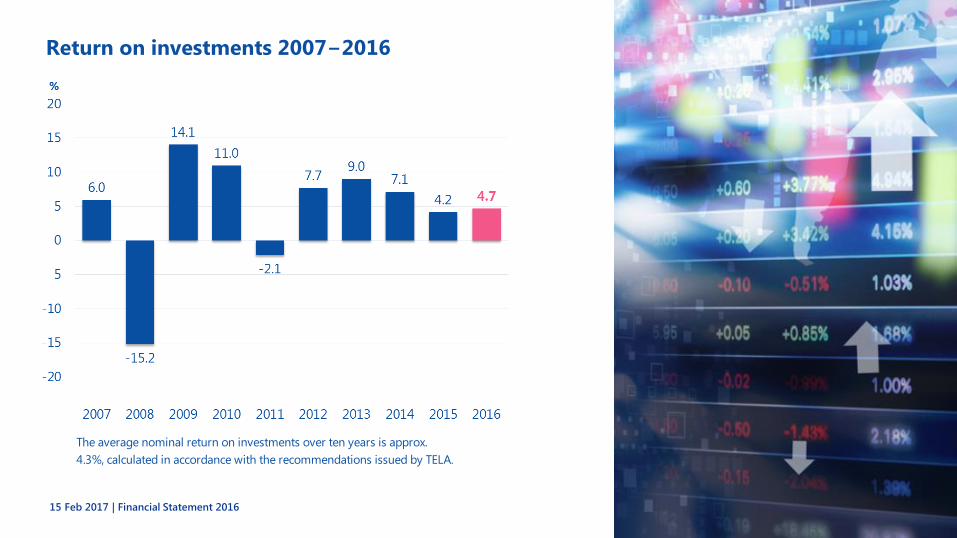
Return on investments 2007−2016
15 Feb 2017 | Financial Statement 2016
The average nominal return on investments over ten years is approx.
4.3%, calculated in accordance with the recommendations issued by TELA.

Market value of investments highest ever in Varma’s history
15 Feb 2017 | Financial Statement 2016

Post-financial-crisis upturn leveled out
15 Feb 2017 | Financial Statement 2016
90
100
110
120
130
140
150
160
170
180
Since 2009, the return on Varma’s investments is EUR 18.1 billion, i.e. cumulative return amounts to 70.4%.
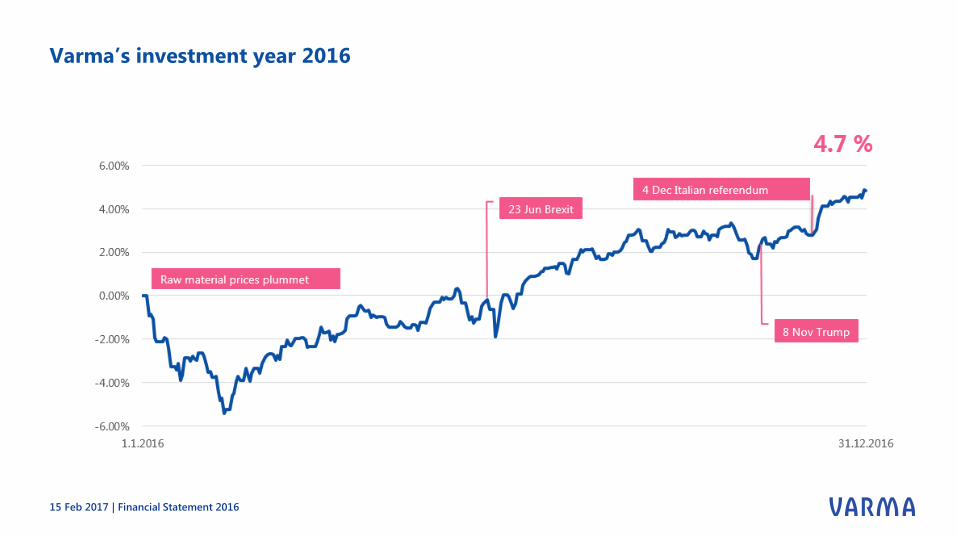
Varma’s investment year 2016
15 Feb 2017 | Financial Statement 2016

Composition of the investment result
15 Feb 2017 | Financial Statement 2016
Investment return was 2,0 bn € and it exceeded the interest credited on technical provisions
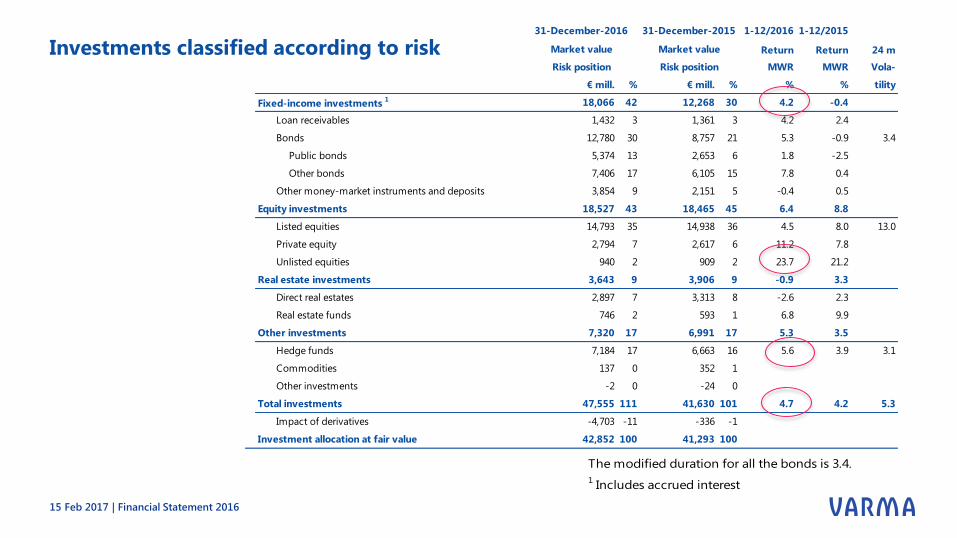
Investments classified according to risk
15 Feb 2017 | Financial Statement 2016
1-12/2016 1-12/2015
Return Return 24 m
MWR MWR Vola-
€ mill. % € mill. % % % tility
18,066 42 12,268 30 4.2 -0.4
Loan receivables 1,432 3 1,361 3 4.2 2.4
Bonds 12,780 30 8,757 21 5.3 -0.9 3.4
Public bonds 5,374 13 2,653 6 1.8 -2.5
Other bonds 7,406 17 6,105 15 7.8 0.4
Other money-market instruments and deposits 3,854 9 2,151 5 -0.4 0.5
18,527 43 18,465 45 6.4 8.8
Listed equities 14,793 35 14,938 36 4.5 8.0 13.0
Private equity 2,794 7 2,617 6 11.2 7.8
Unlisted equities 940 2 909 2 23.7 21.2
3,643 9 3,906 9 -0.9 3.3
Direct real estates 2,897 7 3,313 8 -2.6 2.3
Real estate funds 746 2 593 1 6.8 9.9
7,320 17 6,991 17 5.3 3.5
Hedge funds 7,184 17 6,663 16 5.6 3.9 3.1
Commodities 137 0 352 1
Other investments -2 0 -24 0
47,555 111 41,630 101 4.7 4.2 5.3
Impact of derivatives -4,703 -11 -336 -1
42,852 100 41,293 100
Market valueMarket value
Fixed-income investments 1
Equity investments
31-December-2016 31-December-2015
Total investments
Investment allocation at fair value
Risk position Risk position
Real estate investments
Other investments
The modified duration for all the bonds is 3.4.
1 Includes accrued interest

% Varma
Finnish
equities
European
equities US equities
Euro
government
bonds
Euro
corporate
bonds
2016 4.7 13.3 1.7 12.0 3.3 4.7
2015 4.2 15.9 9.6 1.4 1.6 -0.7
Average nominal return
5 years 6.5 17.2 11.3 14.7 6.1 5.5
10 years 4.3 5.9 2.9 6.9 5.0 4.5
Since 1999 *
5.5 8.5 4.1 5.4 4.8 4.5
Average real return
5 years 5.4 15.9 10.1 13.5 5.0 4.4
10 years 2.6 4.2 1.2 5.2 3.3 2.8
Since 1999 *
3.8 6.8 2.4 3.7 3.1 2.8
* Varma, as it is today, was founded in mid-1998, so comparison data earlier than 1999 is not available.
Finnish equities = OMX Helsinki Cap Index Euro government bonds = IBOXX Eurozone EUR (Total Return)
European equities = Stoxx 600 Total Return Index EUR Euro corporate bonds = IBOXX Corporate Overall Performance Index EUR (Total Return)
US equities= S&P500 Total Return Index
Investment returns for Varma and the markets
15 Feb 2017 | Financial Statement 2016

Strong solvency capital
15 Feb 2017 | Financial Statement 2016

Solvency legislation was reformed at the beginning of 2017
15 Feb 2017 | Financial Statement 2016
• Regulations concerning the calculation of the solvency limit and investment diversification were renewed at the start of 2017
• All the relevant investment risks and insurance risks will be taken into account in the calculation of the solvency limit. Separate regulations on technical provisions were abolished
• The changes have little effect on Varma’s risk-bearing capacity

Solvency
• In 2016, Varma’s solvency
capital strengthened by
EUR 243 million to EUR
10.2 (10.0) billion
• Solvency ratio was 30.9%
(31.4%)
• Varma’s strategic goal is
to maintain strong
solvency through returns
and operational
efficiency
15 Feb 2017 | Financial Statement 2016

Insurance and pensions
15 Feb 2017 | Financial Statement 2016
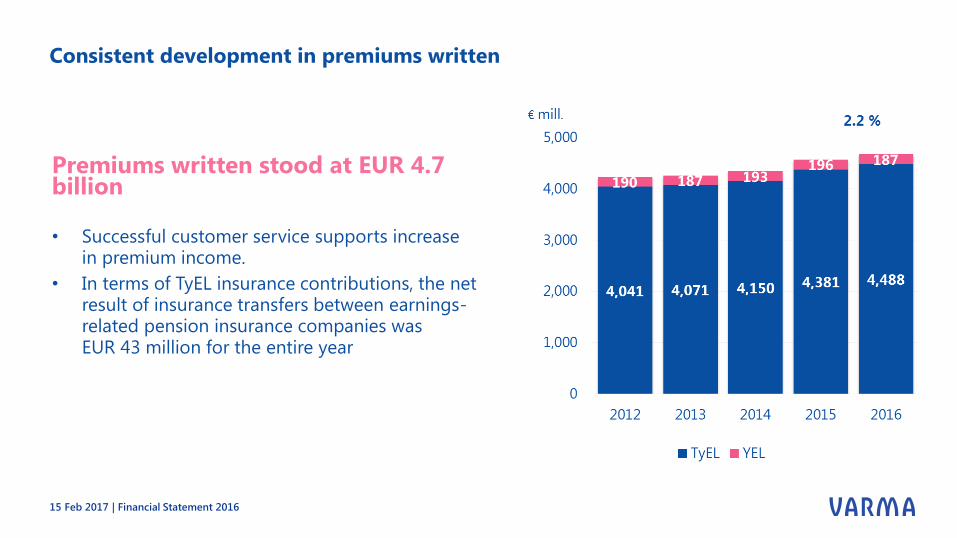
Consistent development in premiums written
15 Feb 2017 | Financial Statement 2016
Premiums written stood at EUR 4.7 billion
• Successful customer service supports increase in premium income.
• In terms of TyEL insurance contributions, the net result of insurance transfers between earnings-related pension insurance companies was EUR 43 million for the entire year

Pensions paid
15 Feb 2017 | Financial Statement 2016
We paid out pensions in the amount of EUR 5.3 billion to 340,100 people
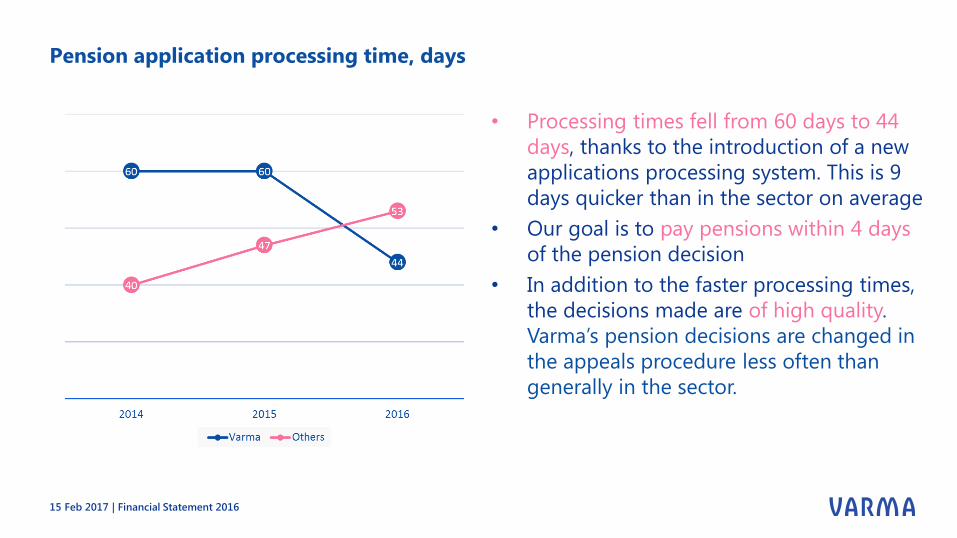
Pension application processing time, days
15 Feb 2017 | Financial Statement 2016
• Processing times fell from 60 days to 44
days, thanks to the introduction of a new
applications processing system. This is 9
days quicker than in the sector on average
• Our goal is to pay pensions within 4 days
of the pension decision
• In addition to the faster processing times,
the decisions made are of high quality.
Varma’s pension decisions are changed in
the appeals procedure less often than
generally in the sector.

New pension decisions totalled some 22,600
15 Feb 2017 | Financial Statement 2016
Pension applications made online accounted for 47% of all new pension applications.
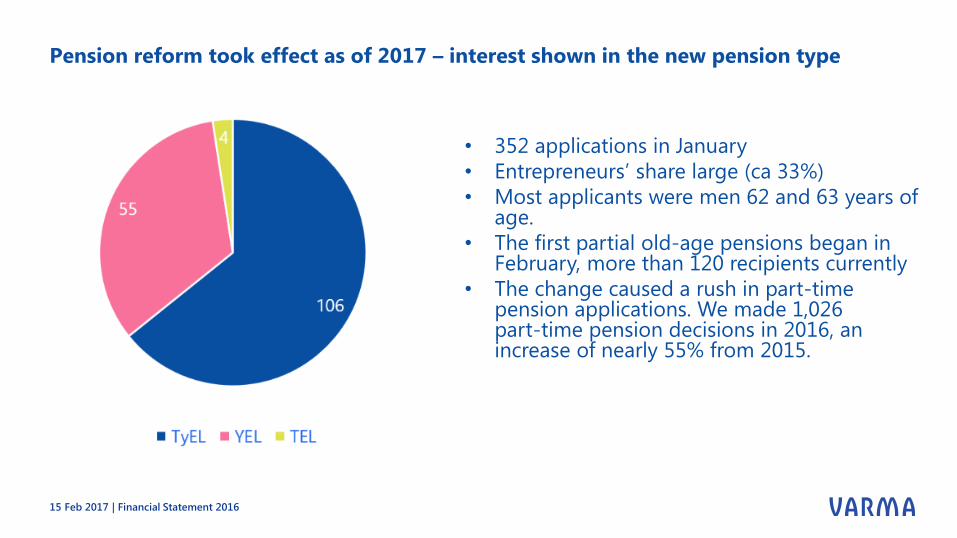
Pension reform took effect as of 2017 – interest shown in the new pension type
15 Feb 2017 | Financial Statement 2016
• 352 applications in January
• Entrepreneurs’ share large (ca 33%)
• Most applicants were men 62 and 63 years of age.
• The first partial old-age pensions began in February, more than 120 recipients currently
• The change caused a rush in part-time pension applications. We made 1,026part-time pension decisions in 2016, an increase of nearly 55% from 2015.
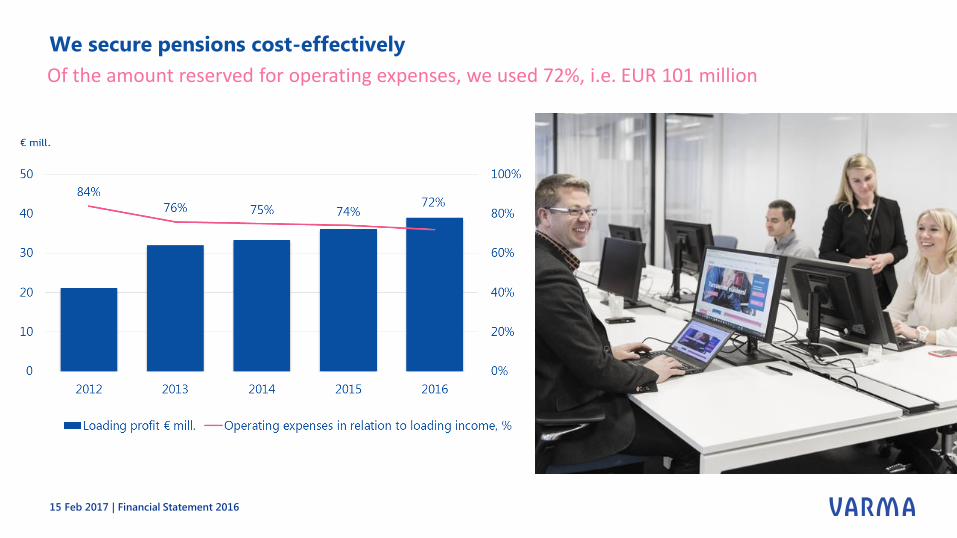
We secure pensions cost-effectively
15 Feb 2017 | Financial Statement 2016
Of the amount reserved for operating expenses, we used 72%, i.e. EUR 101 million
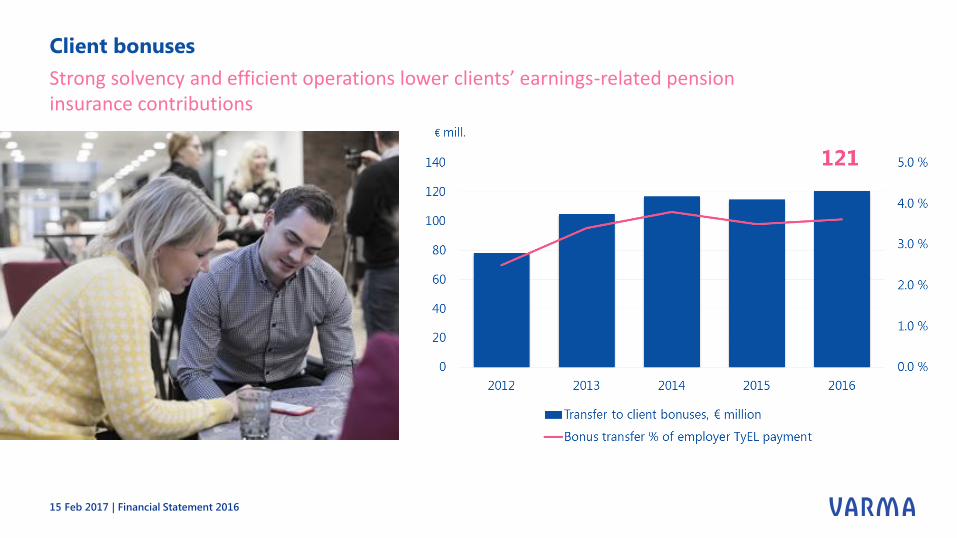
Client bonuses
15 Feb 2017 | Financial Statement 2016
Strong solvency and efficient operations lower clients’ earnings-related pension insurance contributions
Responsible Varma
15 Feb 2017 | Financial Statement 2016
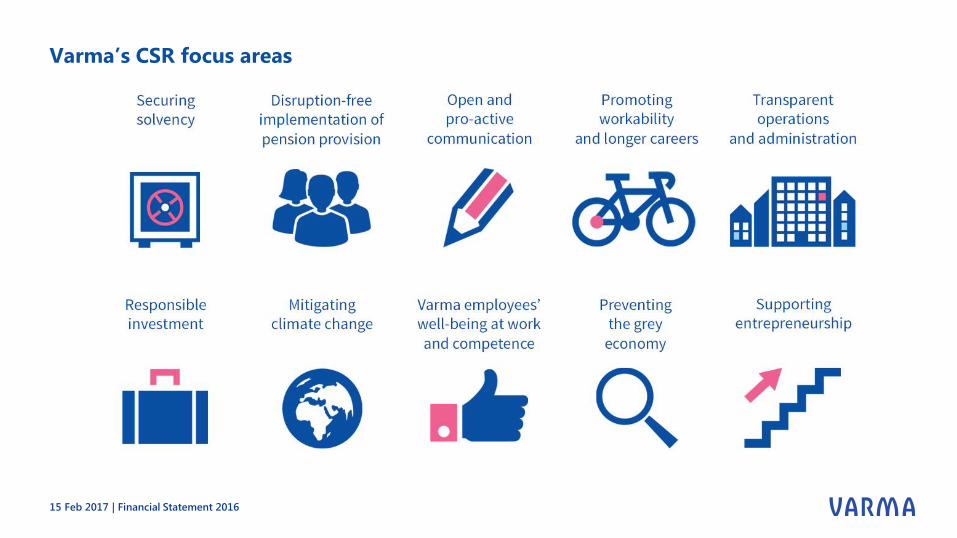
Varma’s CSR focus areas
15 Feb 2017 | Financial Statement 2016

CSR results in 2016
Investments’ CO2 footprint
reduced
• The carbon footprint of the equity portfolio declined 22% in a year, that of corporate bonds 25%, and of real estate 8%
• Measures include weighing of low-emissions sectors, sustainable development equity portfolio (ca 400 million €) and the use of solar power in buildings.
• We published the Code of Conduct, updated insider guidelines and a sponsorship and donation policy
• As of April 2017, we will publish information on our new well-being at work contracts
• GRI CSR report for 2016
Ethical and transparent
business
• We improve environmental friendliness through WWF’s Green Office system; we calculated, e.g. company cars’ emissions limitsand we switched to green electricity.
• We have been improving our responsibility-related competence and promoted equality and modern work culture.
Varma employees’
responsibility
15 Feb 2017 | Financial Statement 2016

Current issues
15 Feb 2017 | Financial Statement 2016
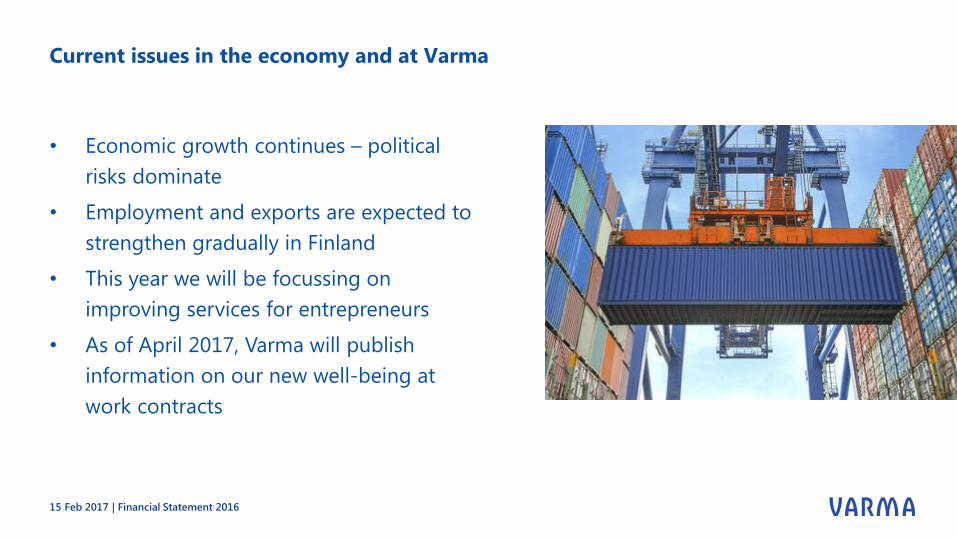
Current issues in the economy and at Varma
• Economic growth continues – political
risks dominate
• Employment and exports are expected to
strengthen gradually in Finland
• This year we will be focussing on
improving services for entrepreneurs
• As of April 2017, Varma will publish
information on our new well-being at
work contracts
15 Feb 2017 | Financial Statement 2016

Attachments

Key figures
15 Feb 2017 | Financial Statement 2016
2016 2015
Premiums written, € million 4,675 4,576
Pensions paid, € million ¹) 5,345 5,183
TyEL-insured 493,890 486,960
YEL insurance policies 36,000 37,380
Pensioners 340,100 337,100
Investments, € million 42,852 41,293
Return on investment, € million 1,953 1,679
Return on investment, % 4.7 4.2
Total result, € million 457 -164
Loading profit, € million 39 36
Operating expenses as % of loading component 72 74
Technical provisions, € million 33,501 31,866
Solvency capital, € million 10,199 9,956
Solvency capital/technical provisions 2) 30.9 31.4
Solvency capital/solvency limit 1.9 1.9
Parent company staff 540 549
1)
2)
Before the reduction of received clearing of pay-as-you-go (PAYG) pensions
Ratio calculated as a percentage of the technical provisions used in calculating the solvency limit
Top Related