


Languages
Pages
Legal


© HOERBIGER 2007
Valve Theory and Design
Compressor valves permit one-way
flow of gas into and out of the cylinder.
There must be one or more valves
for suction and discharge in each
compressor cylinder end.
A compressor valve must open and close
with every stroke of the piston – 1000
times or more a minute, and must do
so day after day, month after month. It
must do this directly in the path of the
gas stream which can be entrained with
liquids, foreign particles, corrosive gases
or materials. A valve is also subjected
to all types of destructive forces such as
tension, compression, impact, twisting,
bending, abrasion, erosion and extreme
heat or cold. It is a marvel then, not that
we have valve trouble, but that we have
as little as we do.
A failure of the valve to perform means
the compressor must be shut down for
corrective action. Consequently, anything
that can be done to improve the operation
of a compressor valve will improve the
operation of the overall machine.
A compressor valve requires only three
components to do the job it is required
to do:
� Valve seat
� Sealing element
� A stop to contain the travel of the
sealing element
A valve comprised of the above
components installed in a modern
compressor would not fulfill life and
efficiency requirements. Due to the
high sophistication level of today’s
reciprocating compressors, the demands
on a compressor valve require a much
more elaborate design than the three
basic components mentioned above.
The basic demands on today’s compressor
valves require:
� A large passage area and good
aerodynamics of flow for low
throttling effect (pressure drop)
� The moving parts should be of a low
mass for low impact energy
� A quick response to low differential
pressure
� Small outside dimensions to allow for
low clearance volume
� Low noise level
� High reliability factor and long life
� Ease of maintenance and service
� Tightness in closed position
The valves have the greatest effect on the
operation of a reciprocating compressor
in terms of its efficiency and mechanical
performance.
© HOERBIGER 2007
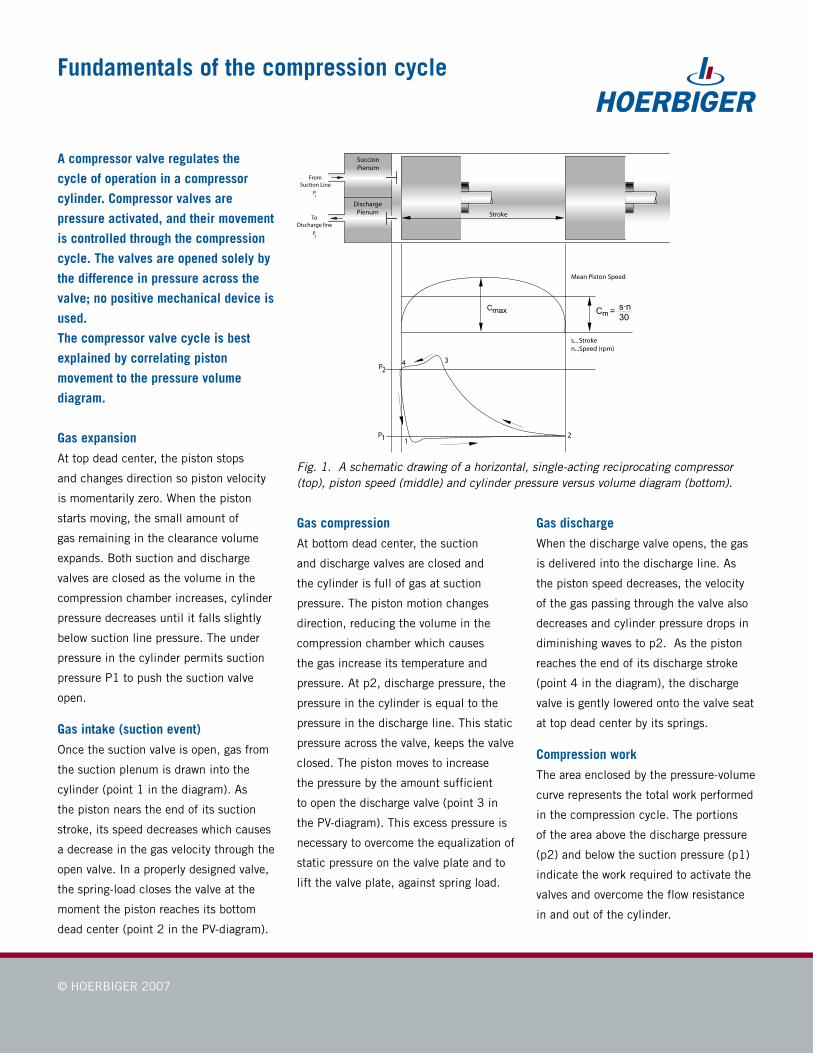
A compressor valve regulates the
cycle of operation in a compressor
cylinder. Compressor valves are
pressure activated, and their movement
is controlled through the compression
cycle. The valves are opened solely by
the difference in pressure across the
valve; no positive mechanical device is
used.
The compressor valve cycle is best
explained by correlating piston
movement to the pressure volume
diagram.
Gas expansion
At top dead center, the piston stops
and changes direction so piston velocity
is momentarily zero. When the piston
starts moving, the small amount of
gas remaining in the clearance volume
expands. Both suction and discharge
valves are closed as the volume in the
compression chamber increases, cylinder
pressure decreases until it falls slightly
below suction line pressure. The under
pressure in the cylinder permits suction
pressure P1 to push the suction valve
open.
Gas intake (suction event)
Once the suction valve is open, gas from
the suction plenum is drawn into the
cylinder (point 1 in the diagram). As
the piston nears the end of its suction
stroke, its speed decreases which causes
a decrease in the gas velocity through the
open valve. In a properly designed valve,
the spring-load closes the valve at the
moment the piston reaches its bottom
dead center (point 2 in the PV-diagram).
Gas compression
At bottom dead center, the suction
and discharge valves are closed and
the cylinder is full of gas at suction
pressure. The piston motion changes
direction, reducing the volume in the
compression chamber which causes
the gas increase its temperature and
pressure. At p2, discharge pressure, the
pressure in the cylinder is equal to the
pressure in the discharge line. This static
pressure across the valve, keeps the valve
closed. The piston moves to increase
the pressure by the amount sufficient
to open the discharge valve (point 3 in
the PV-diagram). This excess pressure is
necessary to overcome the equalization of
static pressure on the valve plate and to
lift the valve plate, against spring load.
Gas discharge
When the discharge valve opens, the gas
is delivered into the discharge line. As
the piston speed decreases, the velocity
of the gas passing through the valve also
decreases and cylinder pressure drops in
diminishing waves to p2. As the piston
reaches the end of its discharge stroke
(point 4 in the diagram), the discharge
valve is gently lowered onto the valve seat
at top dead center by its springs.
Compression work
The area enclosed by the pressure-volume
curve represents the total work performed
in the compression cycle. The portions
of the area above the discharge pressure
(p2) and below the suction pressure (p1)
indicate the work required to activate the
valves and overcome the flow resistance
in and out of the cylinder.
Fundamentals of the compression cycle
SuccionPienum
DischargePienum Stroke
Mean Piston Speed
s... Stroken...Speed (rpm)
P 2
P 1
FromSuction Line
ToDischarge line
P 1
P 2
4 3
21
Cmax mC = s·n30
Fig. 1. A schematic drawing of a horizontal, single-acting reciprocating compressor (top), piston speed (middle) and cylinder pressure versus volume diagram (bottom).

© HOERBIGER 2007
a (∆p)
Initial Motion Conditions
ccacce
lerati
on
v=ve
locity
s=lift
v,s
t
t
lift=distance from seat
∆p spri
ngloa
d
Once we understand how the pressure
in the compression cycle activates
the valves, we can look closely at the
factors that affect the valve’s operation.
When the valve is closed, part of the valve
plate or valve ring is firmly set against
the seat lands. The sealing element
initially lifts off the seat land slowly but
accelerates rapidly towards the guard
once three forces are overcome:
� cylinder pressure is exposed to the
entire surface area of the sealing
element
� the sticking effect of lubrication or
condensate
� the spring load force (Fig. 3a)All of these factors account for the initial
pressure differential between cylinder and
line pressure at valve opening that is seen
on all PV-diagrams.
Pressure differential opens the valve
To lift the sealing element off the
seat land, a pressure differential is
required across the sealing element. The
difference in area of a sealing element
is normally 15% to sometimes as high
as 30% between exposure underneath
(seat side) and exposure on top (guard
side). Since there is always some leakage
through the closed valve plate along the
seat lands, there is a certain amount of
pressure build-up in this area. Therefore,
the actual pressure differential needed to
break the valve open is only 5% to 15%
over the line pressure.
As the sealing element lifts off the seat
lands, it accelerates rapidly against the
spring load toward the guard. The sealing
element impacts against the guard
causing the opening impact, at this stage
the valve is considered fully open.
Gas velocity keeps the valve open
Piston velocity at top or bottom dead
center is zero and increases gradually to
a maximum at the middle of its stroke.
Valve velocity follows a slower path than
the piston (Fig. 3b).
The flow of the gas out through the seat
keeps the sealing element open. As the
flow diminishes due to the decreasing
piston speed, the springs or other
cushioning elements force the sealing
element to return to the seat lands and
close the valve in time. Preferably, the
valve is completely closed when the
piston is at or near dead center.
Fig. 2. Sealing element movement in suction and discharge valves.
In
Suction Valve
Suction Line Pressure
Flow throughopen suctionvalve to cylinder
Spring
Closed
Open
Out
Discharge Valve
Cylinder Pressure
Flow through opendischarge valveinto discharge line
Disc
Open
Closed
Piston Side
Fundamentals of valve operation
Fig. 3a (top). Linear acceleration to
overcome springload.
Fig. 3b (bottom). Piston velocity versus
sealing element velocity (lift).

© HOERBIGER 2007
In this section we explore the geometry
of a typical plate valve. Other valve
types, like ring valve, poppet valves,
and channel valves can be analyzed
using the methods we use here.
Every valve has three critical areas:
� Seat area
� Guard area
� Lift of gap area (passage area)
The flow of gas through a valve is
demonstrated in the Fig. 4a. The gas
always passes first through the valve
seat, then through the lift area where it
is forced to turn twice and finally through
the valve guard.
From these three areas, the lift area,
which varies with the applied valve lift, is
the most important one. This is why valve
velocities are calculated based on lift
area. However, it is equally important that
the other two areas are within a certain
proportion to the lift area to allow for an
efficient valve.
Seat Area
The seat area is the area where light
can be seen when the valve seat is held
against a light source. This means, that
the webs or bridges on a valve seat are
not included in the seat area. The shaded
areas in the bottom view of a drilled and
milled valve seat are considered seat
areas (Fig. 4b).
In most valves, the seat area is somewhat
smaller than the lift area at maximum lift.
This is tolerated since the flow conditions
through the valve seat are more favorable
than the ones through the lift area.
Guard area
The available guard area is the area that
remains open when the valve plate is
placed on top of the guard (that is, when
the valve is open). Ports or holes that are
covered by the sealing element when the
valve is open are useless.
Valve geometry
Valve Lift (N)
Guard Port (B)
Seat Land (W)
Seat Port (A)
Fig. 5. Cross section of a valve guard (top), seat (bottom) and sealing element (positioned against guard).
BottomView
Gas Flow
Fig. 4a. Gas fow through an open valve.
Fig. 4b. Valve seat area.
© HOERBIGER 2007
Valve lift
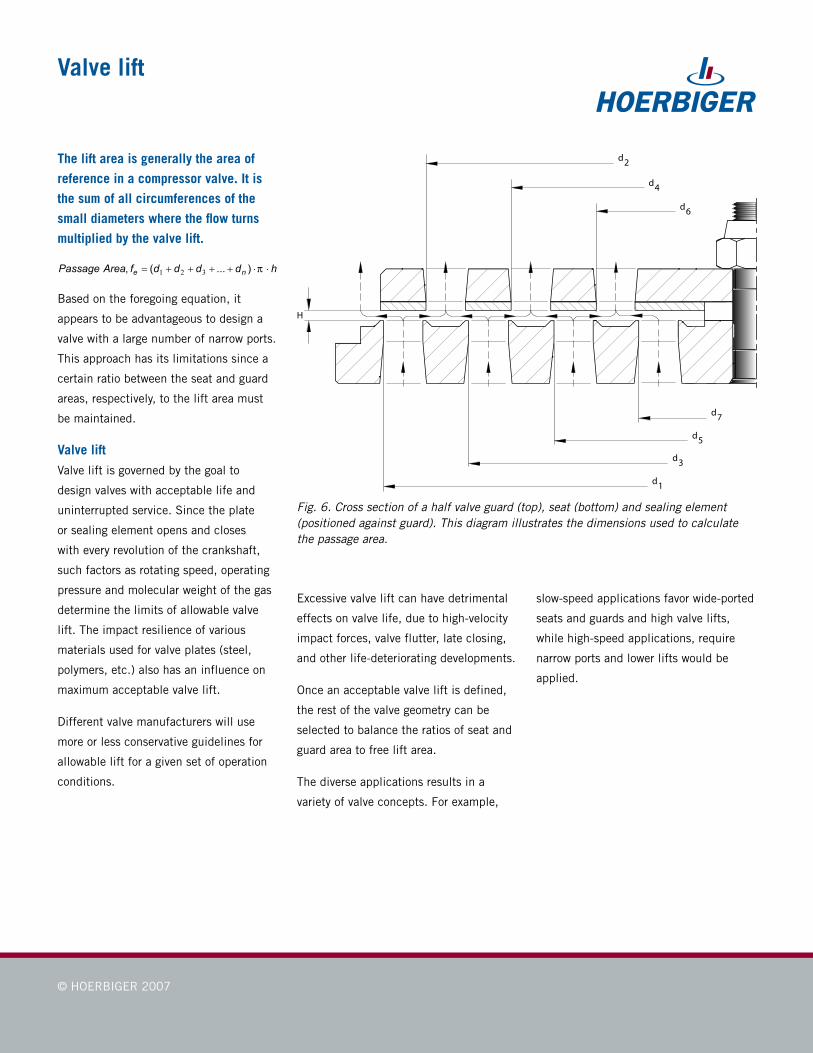
The lift area is generally the area of
reference in a compressor valve. It is
the sum of all circumferences of the
small diameters where the flow turns
multiplied by the valve lift.
Based on the foregoing equation, it
appears to be advantageous to design a
valve with a large number of narrow ports.
This approach has its limitations since a
certain ratio between the seat and guard
areas, respectively, to the lift area must
be maintained.
Valve lift
Valve lift is governed by the goal to
design valves with acceptable life and
uninterrupted service. Since the plate
or sealing element opens and closes
with every revolution of the crankshaft,
such factors as rotating speed, operating
pressure and molecular weight of the gas
determine the limits of allowable valve
lift. The impact resilience of various
materials used for valve plates (steel,
polymers, etc.) also has an influence on
maximum acceptable valve lift.
Different valve manufacturers will use
more or less conservative guidelines for
allowable lift for a given set of operation
conditions.
Excessive valve lift can have detrimental
effects on valve life, due to high-velocity
impact forces, valve flutter, late closing,
and other life-deteriorating developments.
Once an acceptable valve lift is defined,
the rest of the valve geometry can be
selected to balance the ratios of seat and
guard area to free lift area.
The diverse applications results in a
variety of valve concepts. For example,
slow-speed applications favor wide-ported
seats and guards and high valve lifts,
while high-speed applications, require
narrow ports and lower lifts would be
applied.
H
d 6
d 2
d 4
d 5
d 3
d 1
d 7
Fig. 6. Cross section of a half valve guard (top), seat (bottom) and sealing element (positioned against guard). This diagram illustrates the dimensions used to calculate the passage area.

© HOERBIGER 2007
Compressor valve performance is
generally categorized in two ways,
efficiency and life. Valve efficiency
can be defined as that part of the
overall compression horsepower that is
attributed to the accumulative flow loss
in all valves.
Measuring flow loss
Each valve causes a certain pressure
loss as gas flows through it. The factors
that determine this loss are based on the
valve’s geometry, valve lift, free lift area,
and spring load.
Analyzing one cylinder at a time, we can
calculate the flow losses for both suction
and discharge valves and determine the
horsepower required to flow gas past the
valve. We can measure this pressure drop
by conducting a static flow test.
Calculating the coefficient of flow
The purpose of static flow testing is
to measure the pressure drop through
the valve. The pressure drop is used to
calculate the coefficient of flow that
corresponds to the lift area.
The valve is mounted in a sufficiently
sized pipe and a constant flow of air
passes through the valve. The pressure
drop across the valve is measured.
The coefficient of flow is a volumetric
flow rate (or capacity). It can be
determined from the measured pressure
drop, the measured flow rate, and the
density of the gas. The coefficient of flow
is a parameter for the flow efficiency
of a specific valve and can be used to
calculate valve losses in a compressor
cylinder with some degree of accuracy.
The derivative of the coefficient of flow
is called the equivalent area or phi-value.
It constitutes an orifice area (with a
flow coefficient = 1) with an equal flow
restriction as the value with its multiple
port openings.2
=
AreaEquivalentAreaLiftFlowoftCoefficien
The coefficient of flow and equivalent
area are defined for a specific valve
geometry at a specific valve lift and vary
as these criteria are changed.
Pressure drop
Valve
�p
Flow
Fig. 7. A static flow test measures the pressure drop through a valve. The pressure drop
is used to calculate the flow coefficient and equivalent area.

© HOERBIGER 2007
The suction and discharge valves are
designed differently because there are
differences in
� the piston velocities at which suction
and discharge valves open and close
� the duration of the suction and
discharge events, and
� the pressure and temperature at
which suction and discharge occur
All gas displaced in a compressor cylinder
must pass through the suction and
discharge valves mounted in the cylinder.
For efficiency reasons, it is important
that the gas passes through the valves at
a reasonably slow speed. This speed is
referred to as either the mean gas velocity
or valve velocity. High mean gas velocities
have the following consequences:
� large pressure loss due to the
throttling effect within the valve
� temperature increase due to gas
friction
The pressure loss results in higher
horsepower consumption.
Higher intake temperature means a lower
actual output since less gas is taken into
the cylinder.
The calculation for mean valve velocity
is given in the side bar. Note as lift
area increases, the mean gas velocity
decreases.
Mean gas velocity
Valve velocity
The valve velocity is calculated at
the lift area and decreases if the
lift area is increased. The mean gas
velocity through a valve is a widely
used parameter for comparative valve
evalution.
where:
vm is the mean valve velocity [ft/min]
(m/sec)
d is the piston diameter [inch] (mm)
s is the piston stroke [inch] (mm)
n is the compressor speed in RPM
π is 3,14159
fe is the lift area of valve [sq. inch]
(cm²)
z is the number of suction or
discharge valves per cylinder end
k is the [24] for inches (1.2 x 10⁷) for
S.I. dimensions
Typical valve velocities
� Slow-speed transmission line
2,500-4,000 ft/min (12-20 m/s)
� Process and petrochemical
3,000-6,000 ft/min (15-30 m/s)
� High-speed gas gathering
5,000-11,000 ft/min (25-55 m/s)
� Air compressors
8,000-13,000 ft/min (40-65 m/s)
© HOERBIGER 2007
The seat area, free lift area, and guard
area have little meaning individually,
but all three together determine the flow
losses through a valve.
To measure or calculate flow loss, various
indicators have been introduced and
are used today by valve manufacturers.
Typical indicators are:
� coefficient of flow, and/or
� equivalent area
The resistance factor, used by some
manufacturers, relates the equivalent area
to the available pocket area.
The valve geometry and comparative
performance parameters, discussed in
this section, serve a purpose in comparing
competitive products and can be valuable
in deciding which might best be applied
in a certain operating environment.
The rated mileage of a car, for example,
will differs from the actual gas mileage
achieved since gas mileage varies with
the driving pattern of the operator.
The same is true for valves, where the
valve dynamics and motion pattern
of the opening and closing cycle of a
valve can drastically influence the valve
performance, both in terms of efficiency
and life.
Flow loss
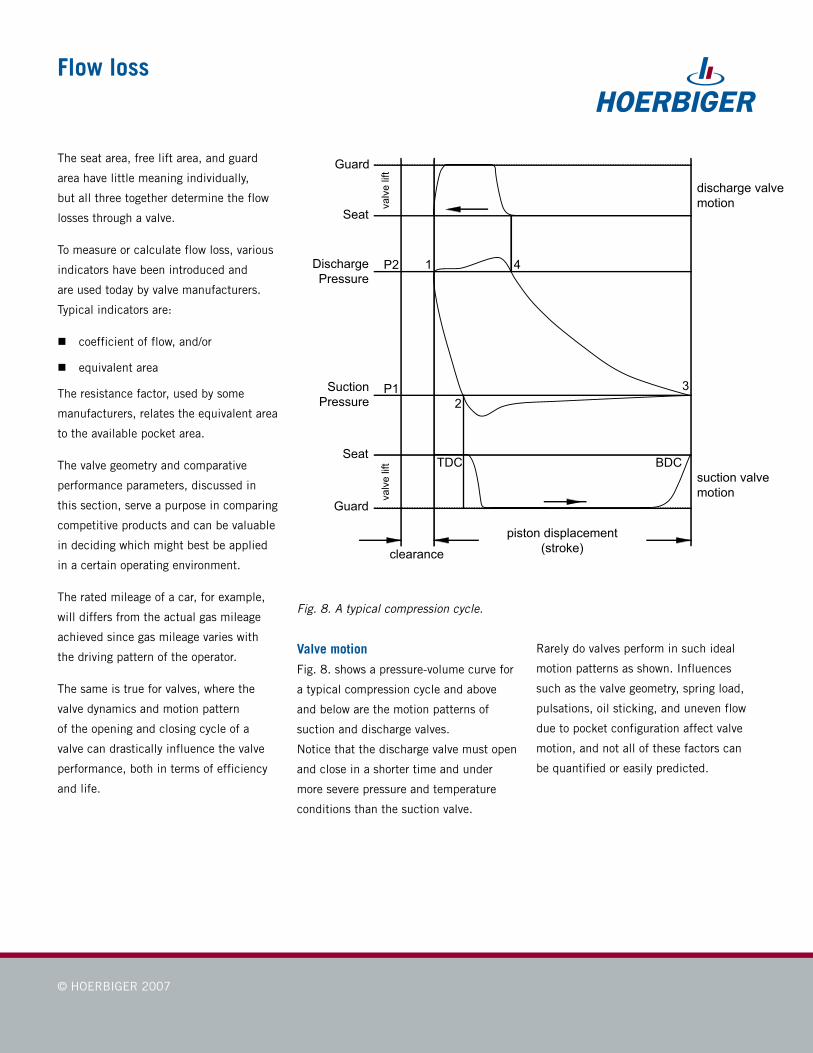
Valve motion
Fig. 8. shows a pressure-volume curve for
a typical compression cycle and above
and below are the motion patterns of
suction and discharge valves.
Notice that the discharge valve must open
and close in a shorter time and under
more severe pressure and temperature
conditions than the suction valve.
Rarely do valves perform in such ideal
motion patterns as shown. Influences
such as the valve geometry, spring load,
pulsations, oil sticking, and uneven flow
due to pocket configuration affect valve
motion, and not all of these factors can
be quantified or easily predicted.
Fig. 8. A typical compression cycle.
1 4
32
P2
P1
TDC BDC
DischargePressure
Seat
Guard
SuctionPressure
Guard
Seat
valv
e lif
tva
lve
lift
piston displacement(stroke)clearance
discharge valvemotion
suction valvemotion
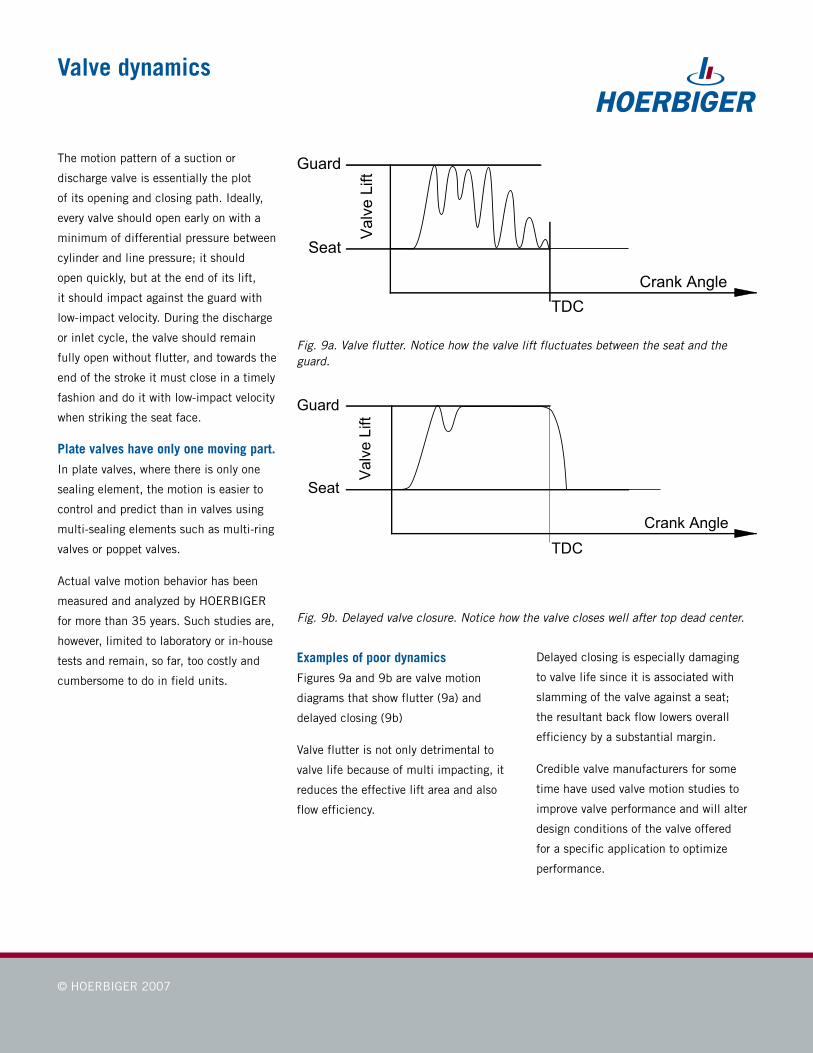
The motion pattern of a suction or
discharge valve is essentially the plot
of its opening and closing path. Ideally,
every valve should open early on with a
minimum of differential pressure between
cylinder and line pressure; it should
open quickly, but at the end of its lift,
it should impact against the guard with
low-impact velocity. During the discharge
or inlet cycle, the valve should remain
fully open without flutter, and towards the
end of the stroke it must close in a timely
fashion and do it with low-impact velocity
when striking the seat face.
Plate valves have only one moving part.
In plate valves, where there is only one
sealing element, the motion is easier to
control and predict than in valves using
multi-sealing elements such as multi-ring
valves or poppet valves.
Actual valve motion behavior has been
measured and analyzed by HOERBIGER
for more than 35 years. Such studies are,
however, limited to laboratory or in-house
tests and remain, so far, too costly and
cumbersome to do in field units.
Examples of poor dynamics
Figures 9a and 9b are valve motion
diagrams that show flutter (9a) and
delayed closing (9b)
Valve flutter is not only detrimental to
valve life because of multi impacting, it
reduces the effective lift area and also
flow efficiency.
Delayed closing is especially damaging
to valve life since it is associated with
slamming of the valve against a seat;
the resultant back flow lowers overall
efficiency by a substantial margin.
Credible valve manufacturers for some
time have used valve motion studies to
improve valve performance and will alter
design conditions of the valve offered
for a specific application to optimize
performance.
Crank Angle
Valv
e Li
ft
TDC
Guard
Seat
Guard
Seat
Crank Angle
Valv
e Li
ft
TDC
Fig. 9a. Valve flutter. Notice how the valve lift fluctuates between the seat and the guard.
Fig. 9b. Delayed valve closure. Notice how the valve closes well after top dead center.
© HOERBIGER 2007
Valve dynamics

Engineering valves that perform
Computer Modeling
Computer modeling simulates valve
motion and is a tool valve designers
use to predict valve behavior during the
design phase.
The objective is to design valves in a
geometry with a lift and springload that
provide a motion pattern as close to ideal
as possible.
If adverse effects such as flutter or early
or late closing can be prevented, both
valve efficiency and valve life will be
substantially improved.
Engineering know-how and support on
all levels
Compressor valve engineering and
manufacturing may seem simple on the
surface. However, designing a long-
lasting, efficient valve requires an entire
team of specialists in the fields of:
� metallurgy
� flow dynamics
� non-metallic material specialists
� thermodynamic properties of gas
� mechanical engineering
� compressor applications
� 3D modelling
Once a design is developed, the valve
needs to be manufactured in the most
cost-effective manner using the best
choice of materials. That requires an
entirely different team of specialists:
� procurement
� manufacturing design engineers
� CNC programmers
� experienced machinists
� quality control
� field engineers
Because the valve is such a critical
component in every compressor, users are
ill-advised if they accept compromises in
design and quality.
The best valve performance in both life
and efficiency is normally found from
designers who provide the engineering
know-how and support on all levels, as
outlined above.
Although the reciprocating compressor
industry is considered mature,
reciprocating compressors continue to be
valuable plant assets because they are
easy to repair and they run reliably.
Older field units or installations where
performance is not up to expectations
often can be corrected or upgraded to
better designs, and the money invested
frequently experiences a fast payback.
Therefore, in an effort to keep these
assets efficient and up-to-date, valve
technology and research has advanced
continually in the last 25 years.
The introduction of non-metallic valve
sealing elements, for example, in the
mid-1970s, allowed valve designers to
invent valves that could withstand higher
impacts for longer periods of time and
wouldn’t damage the compressor cylinder
if they failed (like steel plates can).
New valve designs lead to new
compressor designs—ones that could
operate at higher speeds.
Developments in electronics lead to more
responsive, more automated capacity
control devices.
Research and development continues
to advance the field of valve design and
will undoubtedly continue to bring about
new valve concepts that will ultimately
improve new cylinder designs.
© HOERBIGER 2007
Valve upgrade and retrofit proposals
A valve retrofit proposal starts with a
study of the operating conditions and a
list of the customer’s expected objectives.
Proper material selection is critical to
a valve’s performance. Some materials
perform good at low temperatures but
become brittle at higher temperatures,
some resist corrosive environments better
than others, some are designed for use
with specific gases. To select the right
material and components for the valve, a
valve application engineer must study the
gas analysis and operating pressures and
temperatures.
The application may contain clean, dry
gas, or it may contain contaminants. If
contaminants or impurities cannot be
removed the valve design must minimize
their negative effects. A thermodynamic
study tells the valve designer if the
compressor will operating close to the
gas dew point (the point where the gas
changes to a liquid).
The compressor design is also important.
Is the compressor lubricated? is it a
multi-stage unit? How are the valves
positioned in the cylinder? Do the
passages allow for even the gas flow
distribution in the valve cage?
Similarly, fluctuations in pressures or
molecular weight of the gas or changes
in the operating mode, such as added
clearances, should be known when
designing a replacement valve so the
“window of proper application” can be
selected for a successful retrofit.
Correct dimensional information of the
envelope of the current valve is also
required.
The more the designer knows about
the application and the expected
performance, the more successful the
valve retrofit will be.
What your proposal should contain
Besides price and delivery, look for the
following information in your valve offer:
Fundamental Valve Information
� valve geometry
� valve lift
� the mean gas velocity calculated at
medium piston speed
� the selected materials for the
different valve components
Valve Performance
Some valve manufacturers will provide
more comprehensive information on valve
performance such as:
� energy consumption in both absolute
horsepower or percent of adiabatic
� the coefficient of flow for a specific
valve at a specified valve lift or
equivalent area
� the temperature increase generated
through the throttling effect of the
valves. The temperature increases
through valve throttling increases the
discharge temperature and reduces
the cylinder capacity.
� the valve clearance volume for both
suction and discharge because
changes in clearance will affect
volumetric efficiency and may,
therefore, impact on the overall
performance of the compressor.
� In critical applications, it is advisable
to complement static flow criteria
with a dynamic performance analysis
Simulated Valve Dynamics
The most comprehensive analysis
would include valve information, valve
performance, plus a dynamic simulation.
Today, most valve manufacturers have
computer programs that allow them to
perform valve dynamics; and although
there is always a discrepancy between
the computer simulated dynamics and
the real world operation, the proximity of
the two in actual comparisons has been
quite close. Simulated valve dynamics
is used more in valve failure diagnostics
to analyze the performance of a field
installation that is unsatisfactory.
Comprehensive information is required to
run a proper valve simulation and many
customers are not always able to provide
enough information to run the simulation.
With the multitude of brands and valve
concepts that are available, a buyer truly
has a choice. No single valve design will
outperform all others; nor does one valve
cover all the different applications.
Luckily, purchasing decisions can
be made with a good certainty of
performance based on the analytical tools
that are available.
© HOERBIGER 2007

The HOERBIGER Group
HOERBIGER Compression Technology is a business unit of HOERBIGER Holding AG, Zug / Switzerland. HOERBIGER is active throughout the world as a leading player in the fields of compression technology, automation technology and drive technology. In 2008, its 6,300 employees achieved sales of around 1 billion Euro. The focal points of its business activities include key components and services for compressors, engines and turbomachines, hydraulic systems and piezo technology for vehicles and machine tools, as well as components and systems for shift and clutch operations in vehicle drive trains of all kinds. Through innovations in attractive technological niche markets, the HOERBIGER Group sets standards and delivers cutting-edge solutions for the benefit of its customers.
Algeria · Argentina · Australia · Austria · Bolivia · Brasil · Brunei · Canada · Chile · China · Colombia · Croatia · Czech Republic · Ecuador · Egypt · Finland · France
Germany · Greece · Hungary · India · Indonesia · Israel · Italy · Japan · Kuwait · Libya · Lithuania · Malaysia · Mexico · Montenegro · Netherlands · New Zealand
Nigeria · Norway · Oman · Pakistan · Peru · Philippines · Poland · Portugal · Romania · Russia · Saudi Arabia · Serbia · Singapore · Slovakia · South Africa · South
Korea · Spain · Sweden · Switzerland · Syria · Taiwan · Thailand · Turkey · United Arab Emirates · United Kingdom · United States of America · Venezuela · Vietnam
www.hoerbiger.com
HOERBIGER Compression Technology – Always near you, anywhere in the world
Top Related