


Languages
Pages
Legal


www.bakertilly.co.uk
Value for Money – the Road to Excellence Peter Lunio – Director
Agenda
• Introductions
• Self Assessments - personal
view
• Current experiences
• The case for VFM
• Delivering VFM excellence – a
Strategy & Process
• Summary
2

Baker Tilly - Continuing to
Support the RP Sector
•Baker Tilly 7th largest professional services firm in the UK, with
4000+ staff and 45 office locations
• Leading NFP specialists
-No. 2 provider in the SH sector – UK wide
-No. 1 provider in the ALMO sector - UK wide
• Dedicated team of over 30 Partners and 130 staff
Our innovative services include:
• A comprehensive VfM and efficiency programme covering
procurement, business process improvement review and
comparisons from our benchmarking service;
• Social investment and social impact measurement;
• Fraud and risk management;
• ICT – selection and implementation planning, effectiveness and
risk reviews;
• Corporation tax and VAT planning;
• Robust internal and external audit;
• Corporate finance – funding, acquisitions and mergers.
3

HCA’s VFM Standard
4
Required outcomes
Registered providers shall articulate and deliver a comprehensive and strategic approach to
achieving value for money in meeting their organisation’s objectives.
Their boards must maintain a robust assessment of the performance of all their assets and resources
(including for example financial, social and environmental returns). This will take into account the
interests of and commitments to stakeholders, and be available to them in a way that is transparent and
accessible.
This means managing their resources economically, efficiently and effectively to provide quality services
and homes, and planning for and delivering on-going improvements in value for money.
HCA’s VFM Standard continued
5
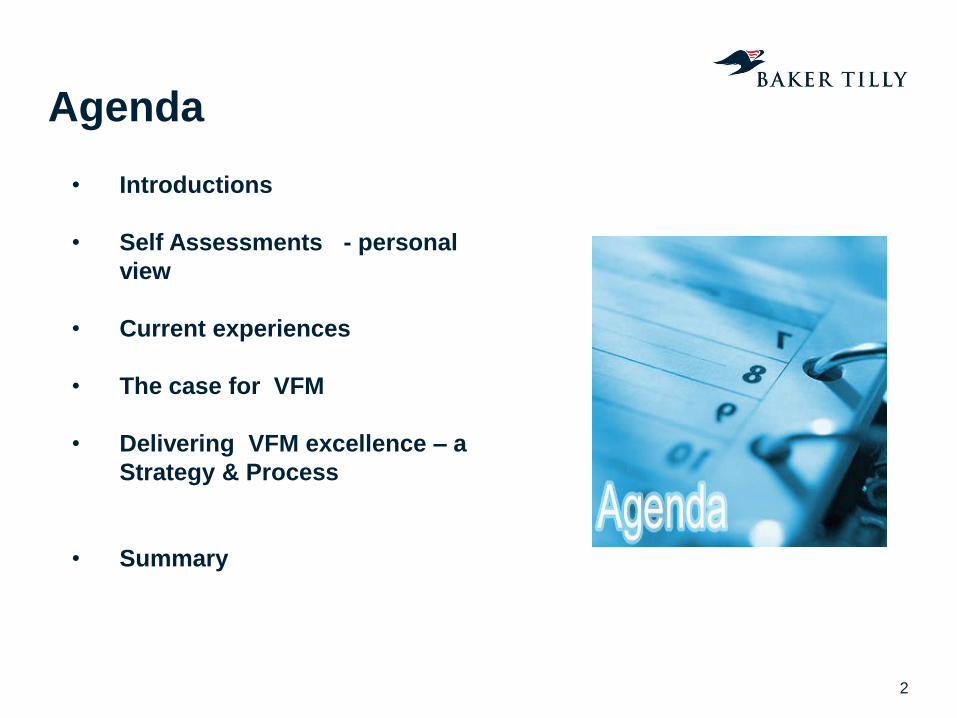
Specific Expectations
Registered providers shall have a robust approach to making decisions on the use of resources to deliver
the provider’s objectives, including an understanding of the trade-offs and opportunity costs of its decisions.
Registered providers shall understand the return on its assets, and have a strategy for optimising the future
returns on assets – including rigorous appraisal of all potential options for improving value for money
including the potential benefits in alternative delivery models - measured against the organisation’s purpose
and objectives.
Registered providers shall have performance management and scrutiny functions which are effective at
driving and delivering improved value for money performance.
Registered providers shall understand the costs and outcomes of delivering specific services and which
underlying factors influence these costs and how they do so.
Registered providers’ boards shall demonstrate to stakeholders how they are meeting this standard. As
part of that process, on an annual basis, they will publish a robust self-assessment which sets out in a way
that is transparent and accessible to stakeholders how they are achieving value for money in delivering their
purpose and objectives.
The assessment shall enable stakeholders to understand the return on assets measured against the
organisation’s objectives.
The assessment shall set out the absolute and comparative costs of delivering specific services
The assessment shall evidence the value for money gains that have been and will be made and how these
have and will be realised over time.
HCA VFM 13/14 Assessment Summary
• Are not planning to be more prescriptive concerning
what needs to be published
• Think that the response to the standard was very weak
and that the sector overall did not demonstrate ways in
which it is known how they are delivering VFM.
• Expect RP’s to be able to demonstrate how they
understand peaks and troughs in their costs, rather than
detailed accounting and reasoning of their exact Cost
per Unit
• Think that RP’s were very weak in demonstrating the
return on their assets. Assets also encompasses use
of resources.
• Want reassurance from the Self Assessments that the
Board is assured that the RP is delivering VFM and that
they are driving it.
• Would like to see better demonstration of VFM
efficiencies from the business plan and how larger
scale VFM can be demonstrated
• Found only a handful of good Self Assessments out of
the largest 250 HA’s in the country 6
Personal View – to what happened
• Confusion with regards to what the HCA wanted
• Complacency from some organisations within the sector?
• Not taken seriously by the board
• Allocated to the wrong individual?
• Not enough input and scrutiny from other parts of the organisation
• Most assessments were one year snapshots
• Few organisations had a “robust “ self assessment process
.
7

Current experiences
8
What do we think based on what we have seen?
Positives Areas for improvement
Overall, much improved since last time Tends to be written by one particular person
Self-assessments are longer and go into
more detail
Of all the reviews we have conducted, only
one written by somebody other than a
member of the Finance Team.
Has been taken much more seriously by
providers
Lack of scrutiny and involvement by the
Board and Audit Committee
On the whole, providers have a connection
between VfM approach and strategic
objectives
Cherry pick the best Key Performance
Indicators
Lots of evidence to support VfM gains made
during the year
Organisations have found it difficult to collate
data for measurement
Commendable use of benchmarking. There is a financial return focus. Not much
attention paid to social and environmental
return.
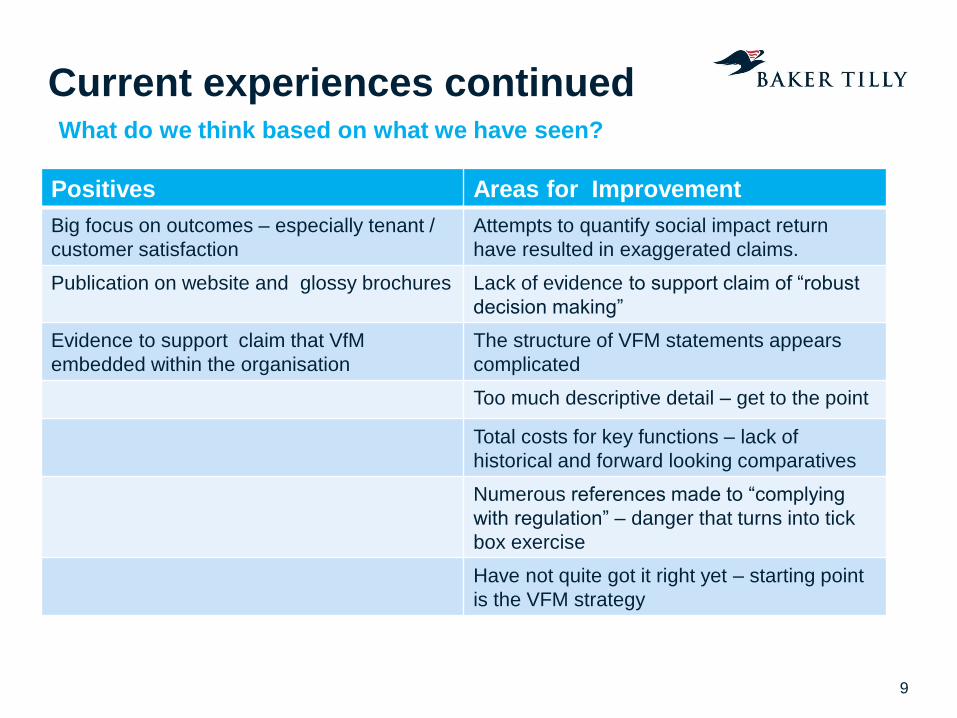
Current experiences continued
9
What do we think based on what we have seen?
Positives Areas for Improvement
Big focus on outcomes – especially tenant /
customer satisfaction
Attempts to quantify social impact return
have resulted in exaggerated claims.
Publication on website and glossy brochures Lack of evidence to support claim of “robust
decision making”
Evidence to support claim that VfM
embedded within the organisation
The structure of VFM statements appears
complicated
Too much descriptive detail – get to the point
Total costs for key functions – lack of
historical and forward looking comparatives
Numerous references made to “complying
with regulation” – danger that turns into tick
box exercise
Have not quite got it right yet – starting point
is the VFM strategy

www.bakertilly.co.uk
The case for having to tell your story….

Sector Income, Surplus and Assets
11
2011-2013:
Assets % change: 16%
2010-2013:
Income % change: 21%
Surplus % change: 216%
Source : Global A/c HCA 12/13
Collective
Income &
Surplus - £14b &
£2B
Responsible for
- £87B of assets

How you spend your money….
Source : Global A/c HCA 12/13
Total spend £8.8B – 12/13
To manage ~ 2.5m homes
£3400 per/an home….
£2.3B
£1.8B

Do you know which provides you with …
The best return on Investment?
The best Social Return ?
Community
Investment
Asset
Investment
Development
Investment
Social Enterprise
Investment
13
• Only 22% of registered providers refer to assets.
• Only 45% refer to social, financial and environmental considerations
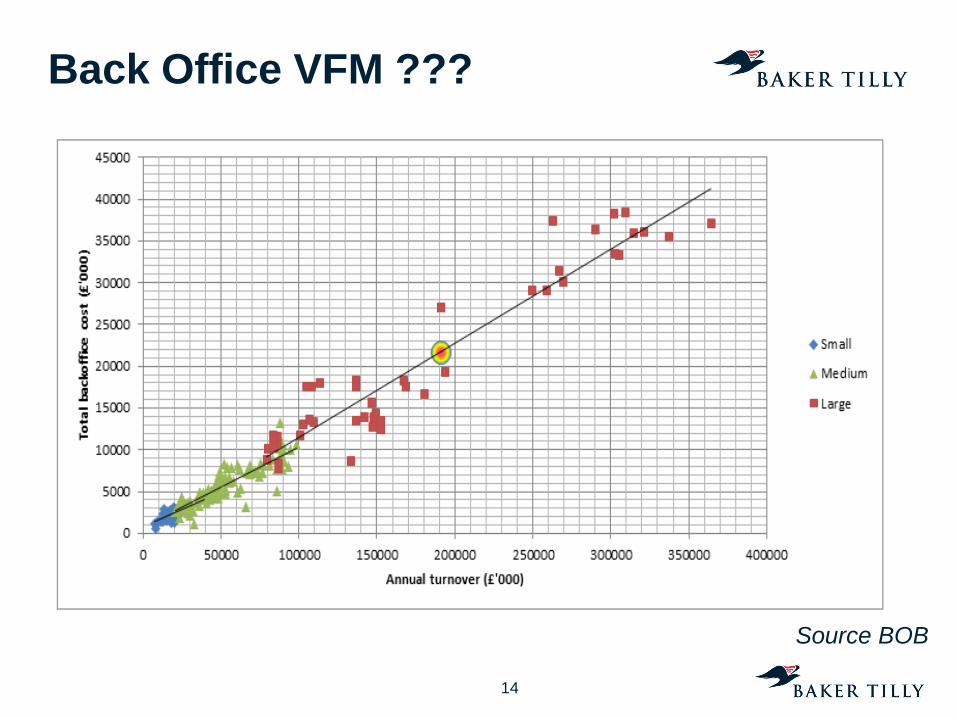
Back Office VFM ???
14
Source BOB
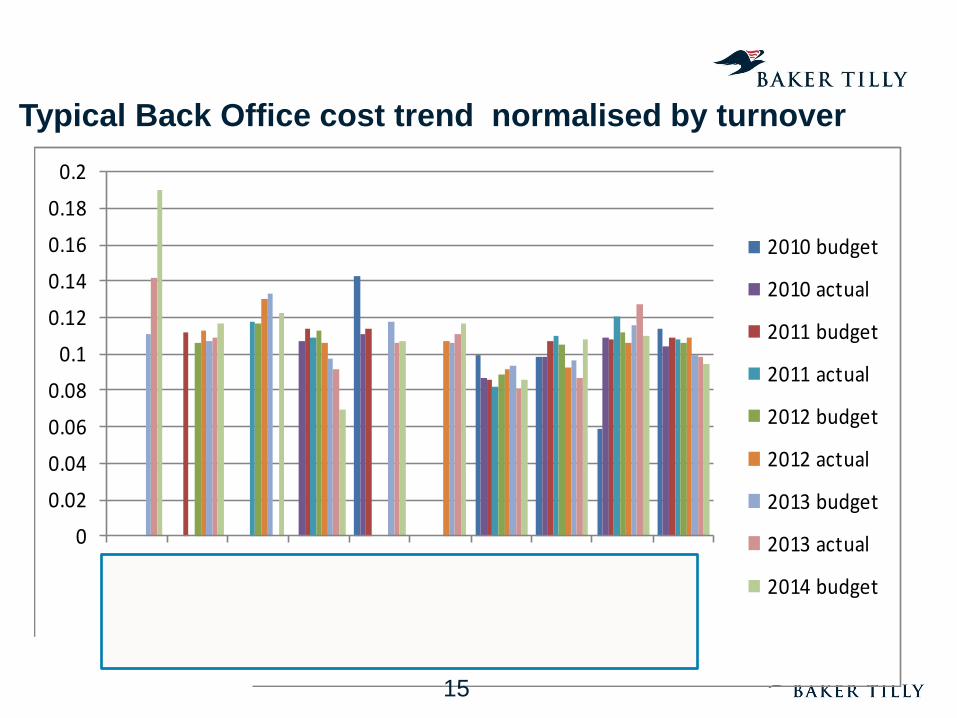
Typical Back Office cost trend normalised by turnover
0
0.02
0.04
0.06
0.08
0.1
0.12
0.14
0.16
0.18
0.2
2010 budget
2010 actual
2011 budget
2011 actual
2012 budget
2012 actual
2013 budget
2013 actual
2014 budget
15

www.bakertilly.co.uk
Delivering VFM excellence - a Strategy & Process

Looking to the future ….more than a tick box
Embedding VfM
1. Developing a Sustainable VfM Strategy
2. Systematic
Implementation
Regulations
17
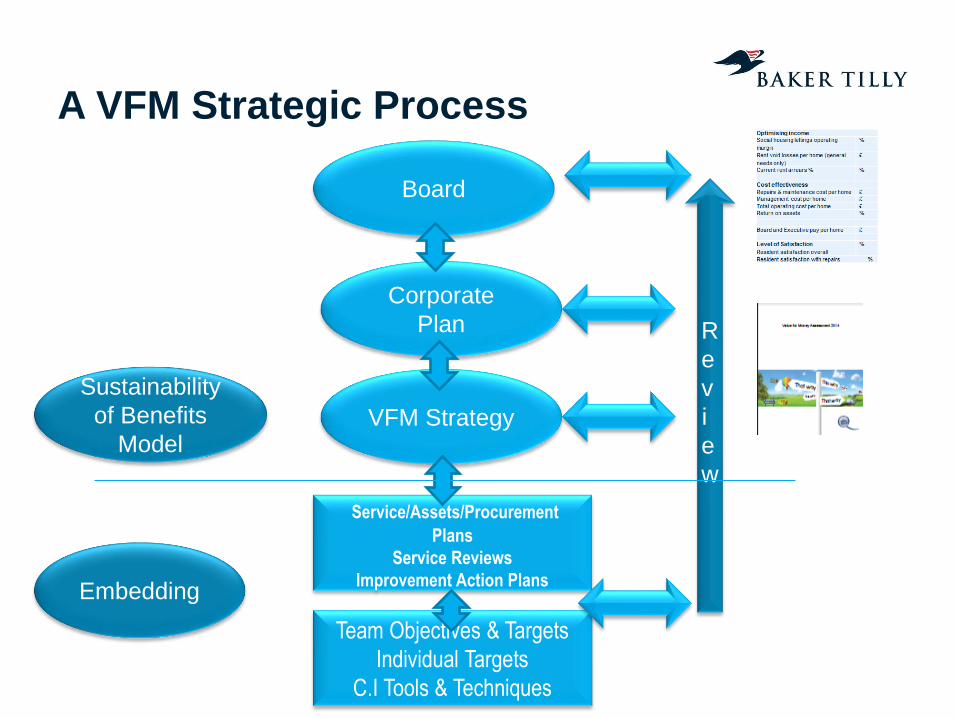
A VFM Strategic Process
Board
Corporate
Plan
VFM Strategy
Service/Assets/Procurement
Plans
Service Reviews
Improvement Action Plans
Team Objectives & Targets
Individual Targets
C.I Tools & Techniques
Embedding
Sustainability
of Benefits
Model
R
e
v
i
e
w
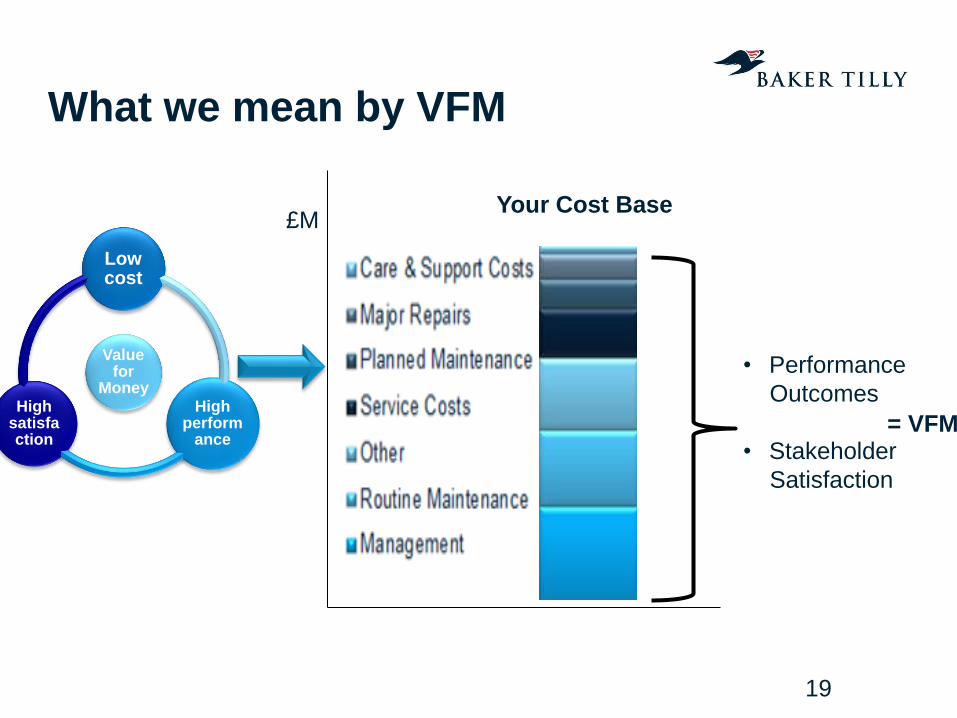
What we mean by VFM
£M
• Performance
Outcomes
• Stakeholder
Satisfaction
= VFM
Value for
Money
Low cost
High perform
ance
High satisfaction
Your Cost Base
19

Measuring VFM Strategically Optimising income
Social housing lettings operating
margin
%
Rent void losses per home (general
needs only)
£
Current rent arrears %
%
Cost effectiveness
Repairs & maintenance cost per home £
Management cost per home £
Total operating cost per home £
Return on assets %
Board and Executive pay per home £
Level of Satisfaction
Resident satisfaction overall
%
Resident satisfaction with repairs %
20
Cultural Value
Historical &
Future
Performance
• 23% of assessments refer to their KPIs and
how they performed against targets.
• 59% either make no reference to their KPIs, or
do not list them.

Strategic KPI’s example L&Q
21

Routes on the VFM Journey… Sustainable VFM model
22

VFM – Transactional (Tactical )
• Performance
Outcomes
• Tenant Satisfaction
Typically remain the
same and not
sustainable
= VFM
Typically 1-3%
Cost Base
Characterised by
• Cost Centre approach
• Recruitment Freeze
• Corporate expense reduction
23

VFM – Transitional (Operational)
• Performance Outcomes
• Tenant Satisfaction
Some improvement and
gains are more
sustainable
= VFM
Typically 6-10%
Cost Base
Characterised by
• Lean Transformation
• Functional Consolidation – Shared
Services
• Market Testing
• Estate Rationalisation
• SROI
24
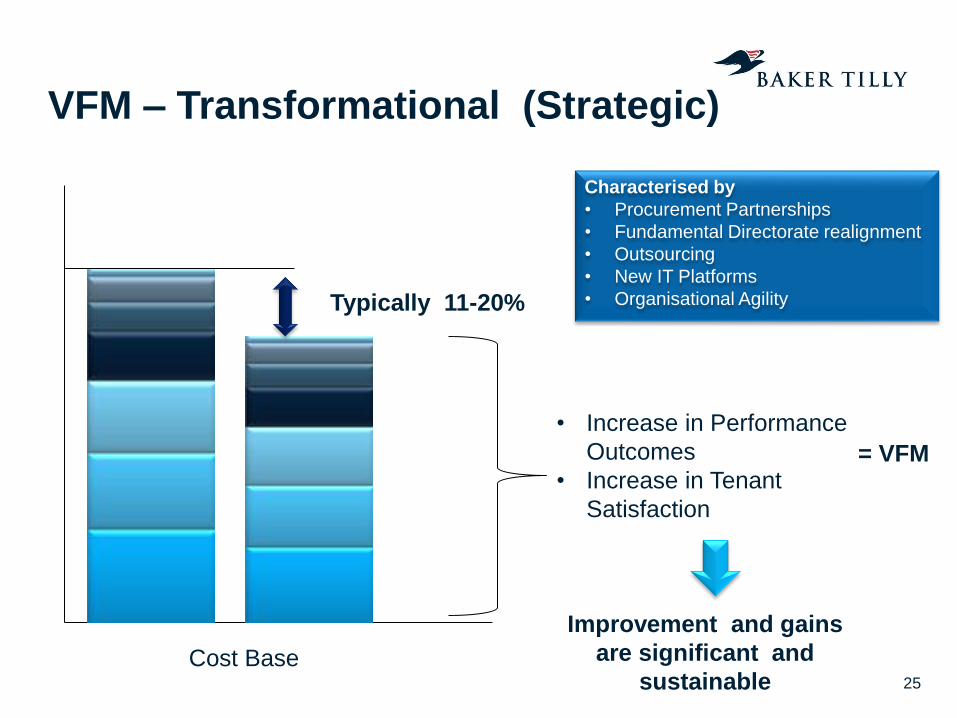
VFM – Transformational (Strategic)
• Increase in Performance
Outcomes
• Increase in Tenant
Satisfaction
Improvement and gains
are significant and
sustainable
= VFM
Typically 11-20%
Cost Base
Characterised by
• Procurement Partnerships
• Fundamental Directorate realignment
• Outsourcing
• New IT Platforms
• Organisational Agility
25

Making VFM stick
26

Typical VFM Route Map summary ….
Transactional
Transitional
Transformation
Recruitment Freeze
Corporate Expense Reduction
Budget Reductions
Process Improvement
Strategic Sourcing
Estate Rationalisation
Partnership Procurement
Directorate Realignment
Outsourcing
Re-investment
Re-investment
Time Typically 2/3 years
Increase in
benefits &
Sustainability
Project & Change Mgt
Social Return
27

How to Embed VFM ?
Principles ...
• A data driven approach
• A change in
organisational culture
• A comprehensive risk
assessment
• A robust evidence based
cost reduction strategy
• Accountability
• A focus on benefits
realisation
• A business as usual
approach to VFM .
28
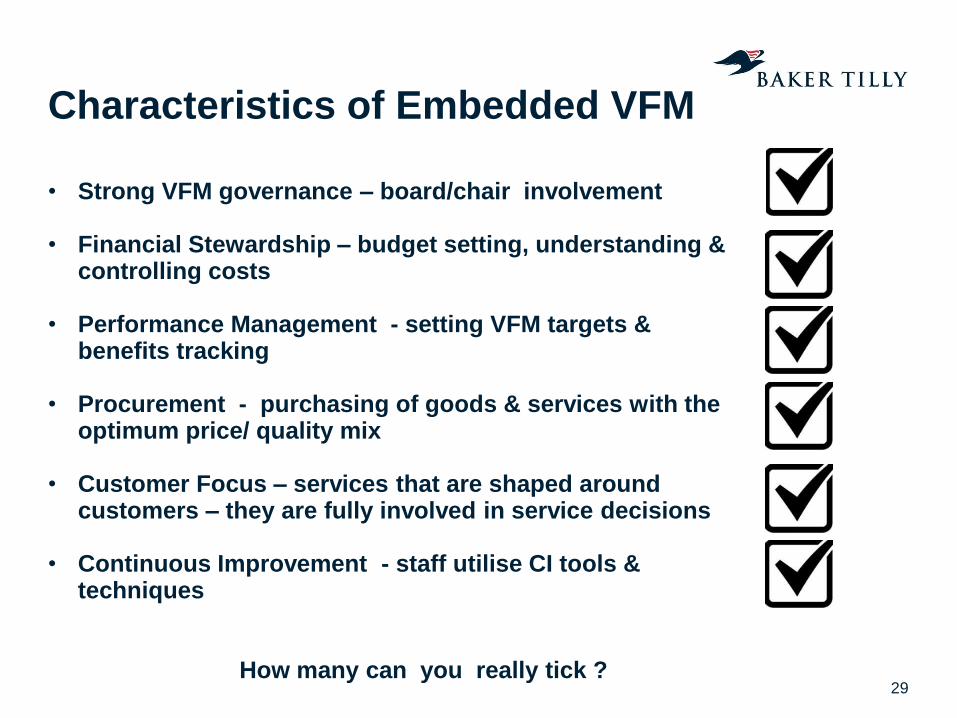
Characteristics of Embedded VFM
• Strong VFM governance – board/chair involvement
• Financial Stewardship – budget setting, understanding & controlling costs
• Performance Management - setting VFM targets & benefits tracking
• Procurement - purchasing of goods & services with the optimum price/ quality mix
• Customer Focus – services that are shaped around customers – they are fully involved in service decisions
• Continuous Improvement - staff utilise CI tools & techniques
How many can you really tick ?
29
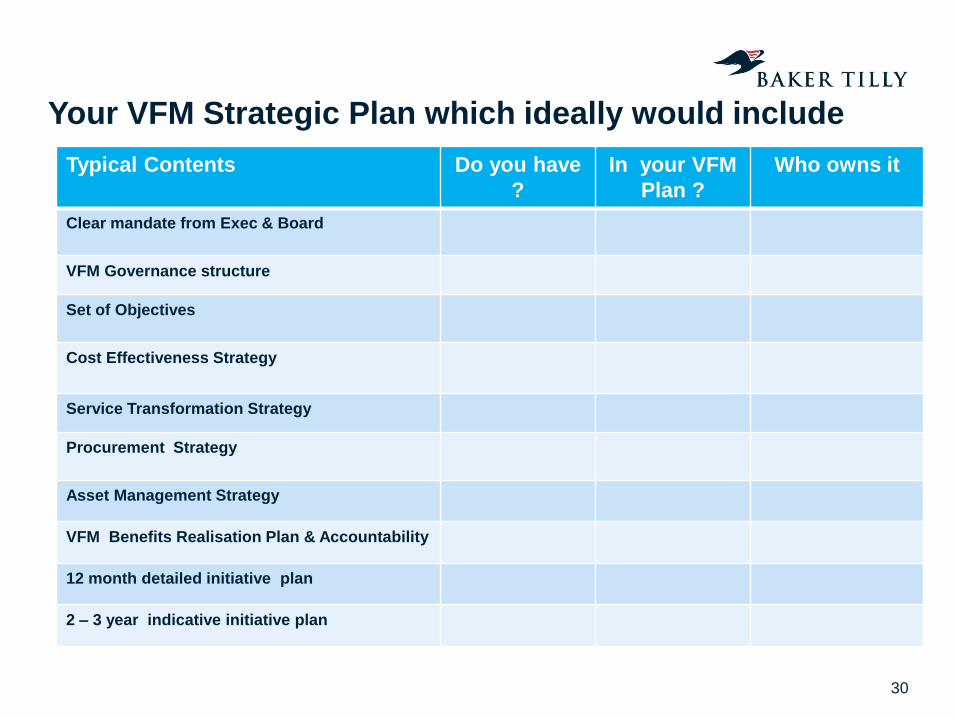
Your VFM Strategic Plan which ideally would include
30
Typical Contents Do you have
?
In your VFM
Plan ?
Who owns it
Clear mandate from Exec & Board
VFM Governance structure
Set of Objectives
Cost Effectiveness Strategy
Service Transformation Strategy
Procurement Strategy
Asset Management Strategy
VFM Benefits Realisation Plan & Accountability
12 month detailed initiative plan
2 – 3 year indicative initiative plan

Robust Self Assessment
31
Cultural Value
Where are you and where do you
want to be on your VFM Journey?
How this will help you on going…
• Provide you with a VFM model against which you can assess yourselves against – current and future
• Give you a roadmap and plan on how to
get there
• Identify current and future initiatives
• Enables you to identify current and future benefits – whether they are sustainable or not
• Approach to embedding VFM
• Gives you something to assess yourselves next and the year after
32
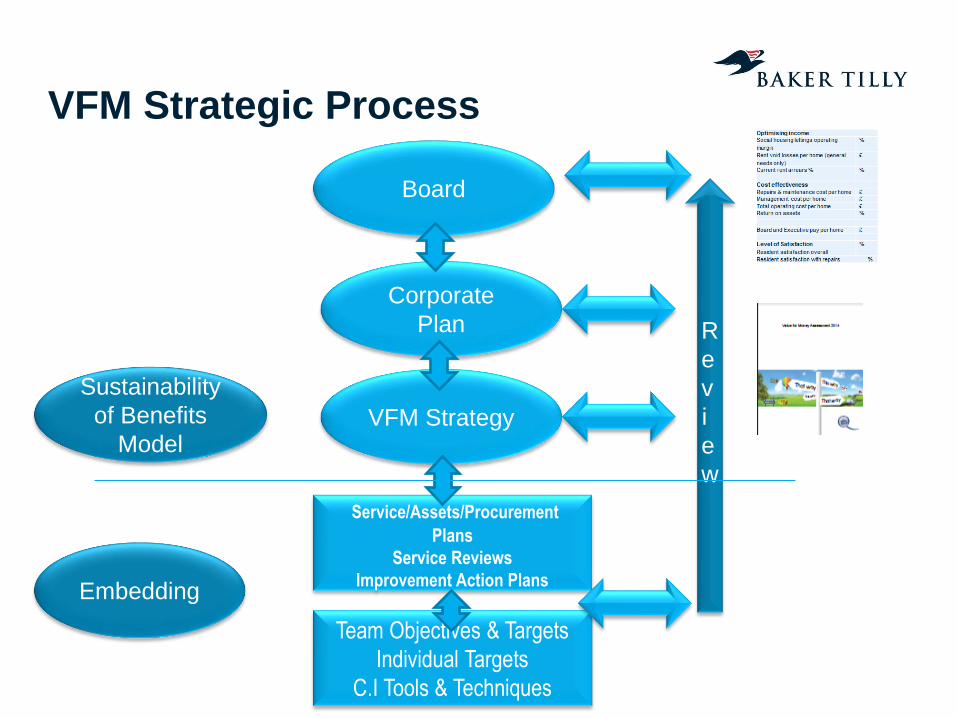
VFM Strategic Process
Board
Corporate
Plan
VFM Strategy
Service/Assets/Procurement
Plans
Service Reviews
Improvement Action Plans
Team Objectives & Targets
Individual Targets
C.I Tools & Techniques
Embedding
Sustainability
of Benefits
Model
R
e
v
i
e
w
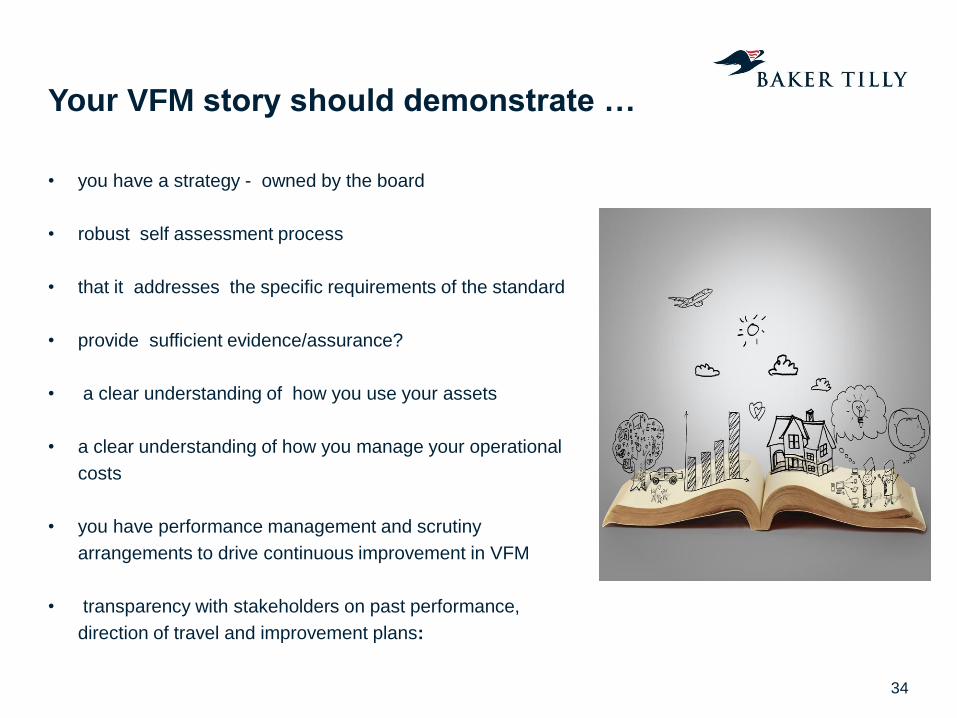
Your VFM story should demonstrate …
• you have a strategy - owned by the board
• robust self assessment process
• that it addresses the specific requirements of the standard
• provide sufficient evidence/assurance?
• a clear understanding of how you use your assets
• a clear understanding of how you manage your operational
costs
• you have performance management and scrutiny
arrangements to drive continuous improvement in VFM
• transparency with stakeholders on past performance,
direction of travel and improvement plans:
•
34

VFM Excellence – our solution set
Value for
Money
Low cost
High perform
ance
High satisfaction
VFM Strategy
/Embedding
3P’s Benchmarking SROI
VFM Transformation Solution Set
Associated
Guides
Identifying the
journey
Implementation &
CI
Reducing Costs
Increasing Quality
Objective comparison
of performance &
Practices
Delivering better
outcomes Deliverables
35
Top Related