


Languages
Pages
Legal

Value-added Instructional Supervision
Pennsylvania’s Urban Leadership Academy
Kenneth D. Jenkins
June 2004
First thing… Change your mindset about doing
performance evaluations. If you see it as a chore, those you
supervise will see your efforts in the same light.
Few will take this process seriously if the principal does not take it seriously.
Like students, teachers will rise or lower their performance to meet the principal’s expectations.

Why should you do this? Helps you in aligning the
taught curriculum with the learned curriculum. There are few
achievement downsides to higher alignment between these two curriculums.
You can’t lead improvements over stuff you don’t understand.
Second, change your focus Alter your observational
attention from teaching to learning.
What are the kids doing? What evidences of THEIR
learning can you observe? Takes a little of the
inspection mentality away from the process.
Backward map from the observations on learning to the teaching that generated it. The feedback is more teacher-driven than principal-driven.

What does this require of you? Understanding the work
students are doing? Understanding the instructional
approaches the teacher is applying to the curriculum
Understanding the curriculum Resisting the occasional urges
to succumb to a “gotcha” mindset.

OK! So what’s next? Working on the Work
In the teaching – learning process, we focus a lot on inputs (teaching) and outputs (test scores), but we spend little time really looking hard at the stuff that transitions teaching into learning.
The assignments teachers design for kids to do in the name of learning can have as much to do with learning success as quality teaching.
The things that most engage students in classrooms is a competent and caring teacher who assigns work they find interesting and enjoyable.
What do I have to do?
Talk about the work, using actual artifacts the teacher uses.
How well does the work align?
How well did it engage learners?
Will students know what they’ve learned after they finish the work?

Whew! Is there anything else? Of course! You can use observation data
as a source for small group conversations. Gather a small group with some common
discretionary time for a 20-30 minute professional conversation.
Provide appropriate snacks and beverages.
Start with an instructional highlight you saw and ask the teacher to talk about it to his/her peers.
Invite others to describe successful lessons they accomplished recently.
Thank them!

What do I have to do to make that happen?
Get a PDA with a digital camera. In your walkthroughs, scribble notes and take digital images.
Use those for feedback purposes as well as graphic images of what you observed.

Ok, that’s enough for me right now!
Nice try, but there’s one more thing you might do. When’s the last time you looked
at your own teaching with an honest and critical eye?
I’m talking about how we structure the professional meetings we conduct and control.

What are you talking about? 3:30 -- Administrative Action items 3:40 -- Report from Leadership Team re:
school-based staff development options for the summer, some with compensation.,
3:50 -- Presentation by (grade level, department, team, etc.) on their progress in meeting a priority school improvement goal
4:05 -- Preparation for improving reading scores -- an examination of student work on teacher-made reading tests aimed at improving reading comprehension
4:20 -- Stories of successful interventions with at-risk students.
4:30 Adjourn

Does this stuff really work?
Here’s a true, true story!
A Research Study by the NC Principals’ Executive Program
Find places serving a high poverty, high minority student populations who were doing well on accountability tests.
Identify what factors (teachers, leaders, community, etc.) contributed to the school’s academic and social success
Use findings to help school leaders in the state

School A Demographic Profile
Located in the Northwestern part of North Carolina
48% of student body is minority
35% of parents did not graduate from high school
13% of students have limited English proficiency
25% of students are exceptional
64% of students live in poverty
Academic Profile
1996 Overall Rank 1213(1603)
1997 Composite 74.6 1998 Composite 76.3 Exemplary Growth in 1997 &
1998 School of Excellence in
2003.
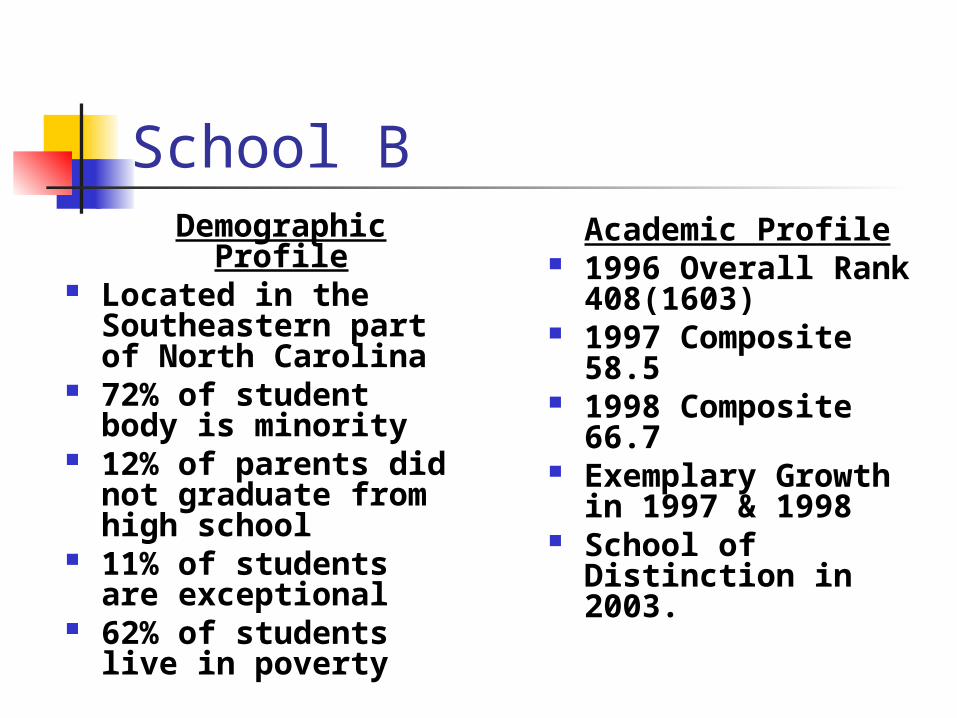
School B Demographic Profile
Located in the Southeastern part of North Carolina
72% of student body is minority
12% of parents did not graduate from high school
11% of students are exceptional
62% of students live in poverty
Academic Profile 1996 Overall Rank
408(1603) 1997 Composite 58.5 1998 Composite 66.7 Exemplary Growth in
1997 & 1998 School of Distinction
in 2003.

School C Demographic Profile
Located in the Southeastern part of North Carolina
49% of student body is minority
29% of parents did not graduate from high school
17% of students are exceptional
81% of students live in poverty
Academic Profile 1996 Overall Rank
1163(1603) 1997 Composite 68.4 1998 Composite 72.1 Exemplary Growth in
1997 & 1998 School of Excellence
in 2003
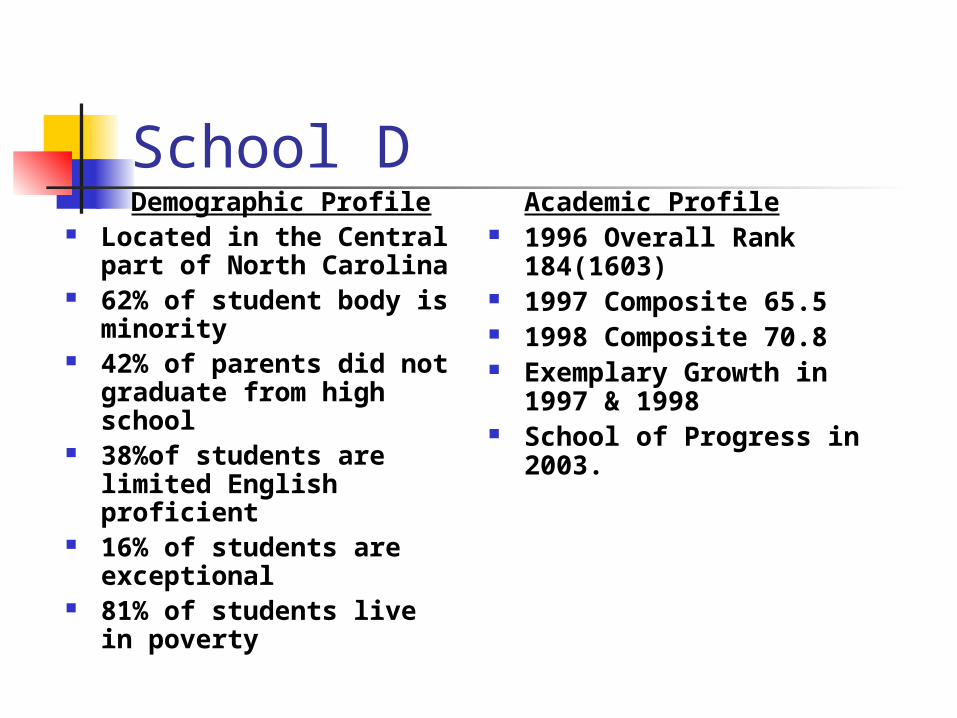
School D Demographic Profile
Located in the Central part of North Carolina
62% of student body is minority
42% of parents did not graduate from high school
38%of students are limited English proficient
16% of students are exceptional
81% of students live in poverty
Academic Profile 1996 Overall Rank 184(1603) 1997 Composite 65.5 1998 Composite 70.8 Exemplary Growth in 1997 &
1998 School of Progress in 2003.

School E Demographic Profile
Located in the Southeastern part of North Carolina
46% of student body is minority
16% of parents did not graduate from high school
12% of students are exceptional
53% of students live in poverty
Academic Profile 1996 Overall Rank
783(1603) 1997 Composite 74.8 1998 Composite 82.4 Exemplary Growth in
1997 & 1998 School of Distinction
in 2003.
Study Findings Professional Relationships School Factors Teachers Leadership
Professional Relationships School Relationships were based on
trust, mutual across job descriptions. Colleagues were willing to work
together. Collaboration was neither forced nor contrived.
Teachers were a genuine part of the decision-making at the school.
School Leader recognized that a teacher’s time was valuable; they didn’t waste it.

School Factors A deep knowledge of the curriculum,
both above, below, and within their grade level.
Leadership visibility A relationship with parents that reached
into the community Caring school environment; every
student had line-of-sight to at least one adult in the school.

Findings-About Teachers
Teachers felt responsible for every student in their school...not just those in their classroom!
Teachers used multiple sources of data to determine what was taught and how
Teachers believed a “genuine caring about all students” is the most important factor in being a good teacher
Teachers described themselves as relentless in their efforts to motivate students to meet high expectations.

Findings-Teachers
Teachers in all five schools describe themselves as equally relentless in their efforts to involve parents in the academic lives of their children.
Teachers work together by grade level and as a faculty to improve the learning experiences of all students.
Teachers share what is working in their classrooms with their colleagues.

Findings-About Leadership Teachers attribute a great deal of their
effectiveness to the school leadership. Distributive leadership was evident.
Membership on the school improvement team was respected and sought after.
The school principals demonstrated a deep understanding of the standard course of study at each grade level.
The school principals were thoughtful and protective of teachers non-instructional duties and planning time
Findings-About Leadership The school principals made spending
time in classrooms a priority Principals encouraged teacher
innovativeness and created a culture that was supportive of teacher risk taking
Teachers trusted their principals The school principals had a great deal of
trust in their teachers
Steps to Turnaround Find out who you serve Clean it up and make it inviting Focus on management to create an orderly
and disciplined environment Focus on instruction Focus on professional development Celebrate success…even small
accomplishments.
Top Related