


Languages
Pages
Legal

November 10, 2017
ICICI Securities Ltd | Retail Equity Research
Result Update
Strong performance continues…
VA Tech Wabag (Wabag) reported strong Q2FY18 numbers. Wabag
reported revenues of | 886.5 crore, up 14% YoY (I-direct estimate: |
924.2 crore). Lower than expected growth in topline was on account
of muted execution in the domestic segment. In the overseas
segment, the company witnessed strong execution in projects like
Petronas, Malaysia and AMAS, Bahrain.
Absolute EBITDA increased 32.5% YoY to | 77.5 crore. EBIDTA
margins came in at 8.7% vs. 7.5% in Q2FY17. Our estimates for
EBITDA margins were 7.8% for the quarter. The company reported
better margins mostly due to higher operational efficiencies.
Wabag also witnessed significant spike in interest cost, up 51% YoY
to | 14.3 crore in Q2FY18. This was mainly on account of higher bank
charges driven by new orders.
The company reported profit of | 33.4 crore, up 39% YoY. We
estimated PAT of | 31.4 crore for the quarter. Order intake for the
quarter stood over | 504 crore. The company now has an order
backlog of | 7954 crore, including a framework orders of | 795 crore.
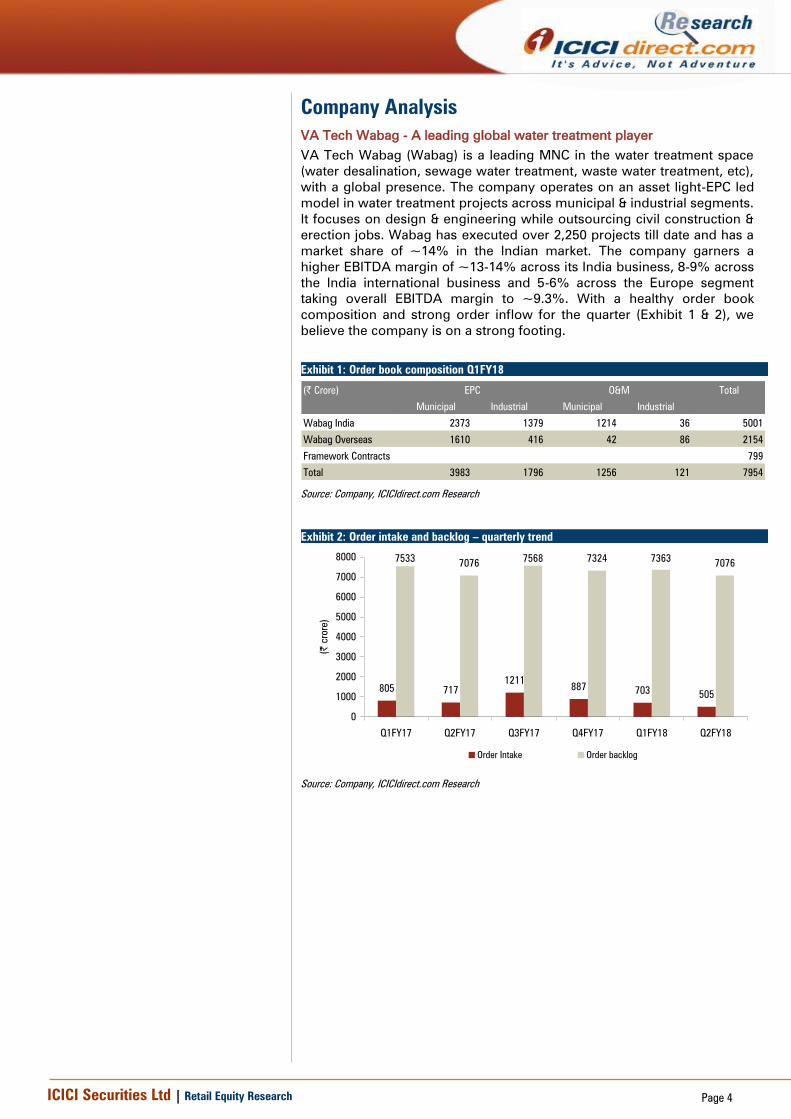
Healthy order backlog, improved execution in overseas projects
Wabag now has an order backlog of | 7954 crore, including a framework
order of | 798 crore. Order intake for Q2FY18 was at | 504 crore.
Execution in the overseas segment witnessed health pick-up. The same
contributed 71% to the topline in Q2FY18. The management indicated
that all overseas projects are now progressing as per schedule. In the
overseas market, the management is seeing good traction from Southeast
Asia, Latin America, Middle East regions and Sub-Saharan regions.
Positive outlook, orders win from Namami Gange
The company may witness large order inflows from ‘Namami Gange’, the
tendering process for which has already started. The management has
pegged this opportunity to be | 4000-5000 crore over the next 2-3 years.
The company has also planned fund raising upto | 400 crore for meeting
equity contribution criteria in any such large project. All such projects are
likely to be centrally funded to tune of 40%. The rest 60% is to be funded
via debt and equity. Of the 60%, 26% equity to be held by the key
technology partner with a 3 year lock-in and 15 years O&M contract. Apart
from this opportunity, Wabag is likely to participate in large upcoming
orders from Maharashtra (~| 8000 crore) for mega sewage treatment
plants, Tamil Nadu (~| 5000 crore) for desalination plants, Delhi (~| 2500
crore) & Karnataka (~| 2500 crore) for water treatment.
Maintain BUY on improving working capital, strong order inflows
Wabag has witnessed working capital deterioration to 101 days in Sept 17
from 68 days in Mar 17. This was due to GST related uncertainties in the
municipal contracts and pending receivable from the AP Genco contract.
The management intends to return to regular NWC days (~75 days) by
Q4YF18 as it is expecting ~| 150 crore from AP Genco contract by FY18E
plus accelerated payments from domestic municipalities. Higher
receivables coupled healthy order wins of | 4,500 crore and | 5000 crore
for FY18E and FY19E, respectively gives us reasonable confidence about
the future prospects of the company. Accordingly, we continue value the
company at 16x FY19E EPS of | 46.4 to arrive at a target price of | 765.
We have a BUY recommendation on the company.
Rating matrix
Rating : Buy
Target : | 765
Target Period : 12 months
Potential Upside : 32%
What’s Changed?
Target Unchanged
EPS FY18E Unchanged
EPS FY19E Unchanged
Rating Unchanged
Quarterly Performance
Q2FY18 Q2FY17 YoY (%) Q1FY18 QoQ (%)
Revenue 886.5 777.6 14.0 668.6 32.6
EBITDA 77.5 58.5 32.5 41.8 85.3
EBITDA (%) 8.7 7.5 121.9 6.3 248.5
APAT 33.4 24.0 39.0 8.4 298.8
Key Financials
| Crore FY16 FY17 FY18E FY19E
Revenue 2,549 3,219 3,851 4,594
EBITDA 225 308 393 474
EBITDA (%) 8.8 9.6 10.2 10.3
Net Profit 93 170 206 253
EPS (|) 16.9 18.8 37.7 46.4
Valuation summary
FY16 FY17 FY18E FY19E
P/E 34.3 30.9 15.4 12.5
Target P/E 44.9 24.6 20.3 16.5
EV / EBITDA 14.4 10.5 8.2 6.8
P/BV 3.4 3.2 2.7 2.4
RoNW (%) 10.1 10.6 19.1 20.3
RoCE (%) 20.7 25.8 27.8 28.9
Stock data
Particular Amount
Market Capitalization (| Crore) 3,149
Total Debt (FY17) (| Crore) 113.0
Cash and Investments (FY17) (| Crore) 239.1
EV (| Crore) 3,023.0
52 week H/L (|) 749 / 450
Equity capital (| crore) 10.9
Face value | 2
Price performance (%)
1M 3M 6M 12M
VA Tech (9.1) (7.1) 26.7 6.2
L&T (2.5) (2.2) 13.0 15.1
Thermax (6.5) (16.0) (0.9) (4.7)
Research Analyst
Chirag J Shah
Sagar K Gandhi
VA Tech Wabag (VATWAB) | 580

ICICI Securities Ltd | Retail Equity Research Page 2
Variance analysis
Q2FY18 Q2FY18E Q2FY17 YoY (%) Q1FY18 QoQ (%) Comments
Revenue 886.5 924.2 777.6 14.0 668.6 32.6 Healthy top-line growth due to robust execution in IIU projects like Petronas,
Malaysia and AMAS, Bahrain.
Cost of sales & Services 714.2 787.6 662.6 7.8 527.0 35.5
Employees Remunaration &
Benefits
63.9 73.8 62.1 2.9 66.1 (3.3)
Other Expenses & Forex loss/(gain) 34.7 37.0 27.5 26.2 35.2 (1.5)
Total operating expenses 809.1 852.1 719.1 12.5 626.7 29.1
EBITDA 77.5 72.1 58.5 32.5 41.8 85.3 Healthy growth in EBITDA mostly due to operational efficiencies
EBITDA Margin (%) 8.7 7.8 7.5 122 bps 6.3 249 bps Operational efficiences coupled with strong exectuion in overseas market helped
clocked better margins
Depreciation 4.5 6.0 4.7 (5.7) 4.5 (1.3)
Finance charges 14.3 18.0 9.4 51.6 13.3 7.4 Increase in finance cost mainly due to higher bank charges driven by new orders
PBT 59.0 48.1 44.3 33.0 25.9 127.3
Tax 22.0 15.9 18.6 18.3 16.0 37.7
PAT 36.9 32.2 25.7 43.6 9.9 271.5
Minority Interest 4.2 1.2 2.5 68.4 1.8 135.2
Share of profit in associate 0.7 0.4 0.8 (15.7) 0.2
Adjusted PAT 33.4 31.4 24.0 39.0 8.4 298.8
Key Metrics
Order Intake 2,377 717 231.7 703 238.2
Order backlog 7,076 7,076 0.0 7,363 (3.9)
Source: Company, ICICIdirect.com Research
Change in estimates
(| Crore) Old New % Change Old New % Change
Revenue 3,851.0 3,851.0 0.0 4,594.3 4,594.3 0.0
EBITDA 393.2 393.2 0.0 474.1 474.1 0.0
EBITDA Margin (%) 10.2 10.2 0 bps 10.3 10.3 2 bps
PAT 205.9 205.9 0.0 253.3 253.3 (0.0)
EPS (|) 37.7 37.7 0.0 46.4 46.4 0.0
FY18E FY19E
Source: Company, ICICIdirect.com Research
Assumptions
FY17 FY18E FY19E FY18E FY19E
Order Intake 3,620 4,500 5,000 4,500 5,000
Order Backlog 7,328 8,620 9,770 8,620 9,770
EBITDA margin (%) 9.6 10.2 10.3 10.3 10.4
Current Earlier
Source: Company, ICICIdirect.com Research
ICICI Securities Ltd | Retail Equity Research Page 3
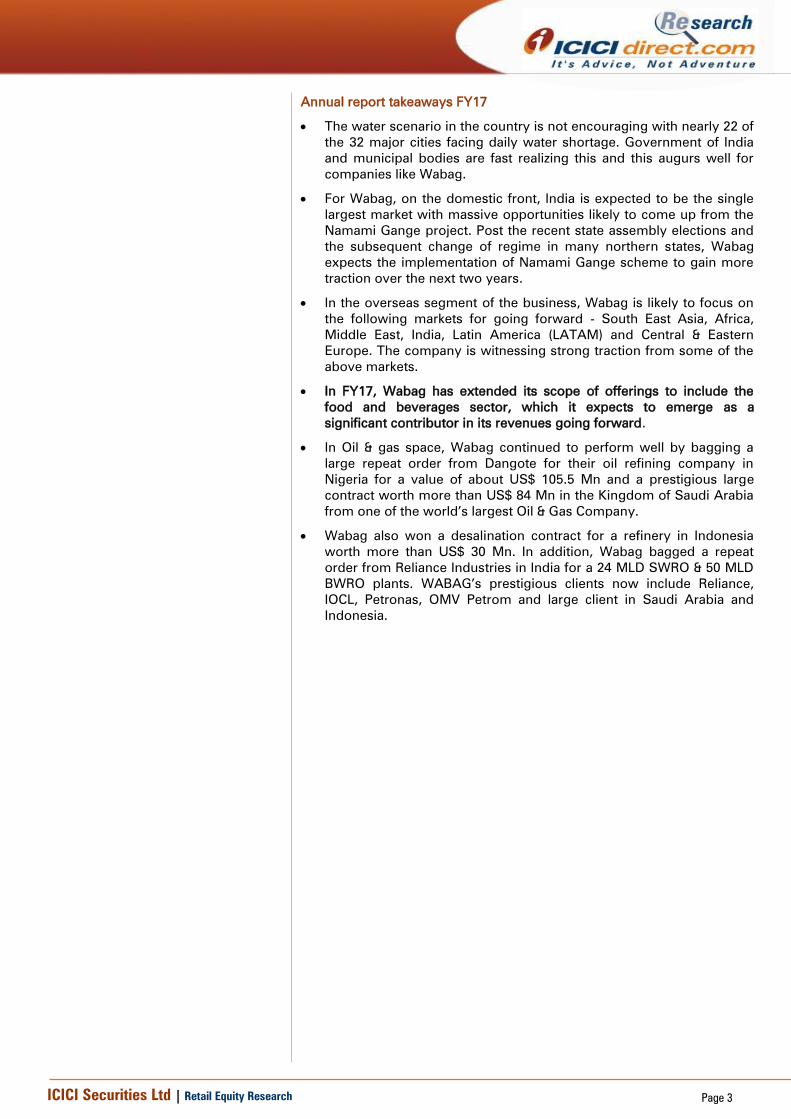
Annual report takeaways FY17
The water scenario in the country is not encouraging with nearly 22 of
the 32 major cities facing daily water shortage. Government of India
and municipal bodies are fast realizing this and this augurs well for
companies like Wabag.
For Wabag, on the domestic front, India is expected to be the single
largest market with massive opportunities likely to come up from the
Namami Gange project. Post the recent state assembly elections and
the subsequent change of regime in many northern states, Wabag
expects the implementation of Namami Gange scheme to gain more
traction over the next two years.
In the overseas segment of the business, Wabag is likely to focus on
the following markets for going forward - South East Asia, Africa,
Middle East, India, Latin America (LATAM) and Central & Eastern
Europe. The company is witnessing strong traction from some of the
above markets.
In FY17, Wabag has extended its scope of offerings to include the
food and beverages sector, which it expects to emerge as a
significant contributor in its revenues going forward.
In Oil & gas space, Wabag continued to perform well by bagging a
large repeat order from Dangote for their oil refining company in
Nigeria for a value of about US$ 105.5 Mn and a prestigious large
contract worth more than US$ 84 Mn in the Kingdom of Saudi Arabia
from one of the world’s largest Oil & Gas Company.
Wabag also won a desalination contract for a refinery in Indonesia
worth more than US$ 30 Mn. In addition, Wabag bagged a repeat
order from Reliance Industries in India for a 24 MLD SWRO & 50 MLD
BWRO plants. WABAG’s prestigious clients now include Reliance,
IOCL, Petronas, OMV Petrom and large client in Saudi Arabia and
Indonesia.
ICICI Securities Ltd | Retail Equity Research Page 4
Company Analysis
VA Tech Wabag - A leading global water treatment player
VA Tech Wabag (Wabag) is a leading MNC in the water treatment space
(water desalination, sewage water treatment, waste water treatment, etc),
with a global presence. The company operates on an asset light-EPC led
model in water treatment projects across municipal & industrial segments.
It focuses on design & engineering while outsourcing civil construction &
erection jobs. Wabag has executed over 2,250 projects till date and has a
market share of ~14% in the Indian market. The company garners a
higher EBITDA margin of ~13-14% across its India business, 8-9% across
the India international business and 5-6% across the Europe segment
taking overall EBITDA margin to ~9.3%. With a healthy order book
composition and strong order inflow for the quarter (Exhibit 1 & 2), we
believe the company is on a strong footing.
Exhibit 1: Order book composition Q1FY18
(| Crore) Total
Municipal Industrial Municipal Industrial
Wabag India 2373 1379 1214 36 5001
Wabag Overseas 1610 416 42 86 2154
Framework Contracts 799
Total 3983 1796 1256 121 7954
EPC O&M
Source: Company, ICICIdirect.com Research
Exhibit 2: Order intake and backlog – quarterly trend
805 717
1211887
703505
75337076
7568 7324 73637076
0
1000
2000
3000
4000
5000
6000
7000
8000
Q1FY17 Q2FY17 Q3FY17 Q4FY17 Q1FY18 Q2FY18
(|
crore)
Order Intake Order backlog
Source: Company, ICICIdirect.com Research

ICICI Securities Ltd | Retail Equity Research Page 5
Engineering excellence and asset light business model
VA Tech Wabag (Wabag) operates on an asset light EPC model, thereby
manifesting a lean balance sheet. With growing concern on access to
clean water and urgent measures to solve the issue of depleting water
resources, the investment in water treatment is likely to increase manifold
globally. Accordingly, Wabag is expected to benefit significantly by
leveraging its strong domestic presence and rising global footprint. The
company’s strong book-to-bill ratio of ~2.3x provides revenue visibility
for over two years. This coupled with a strong execution track record is
expected to lead to 19.5% revenue CAGR in FY17-19E to | 4594 crore
while the margin is expected to increase to 10.4% in FY19E.
Exhibit 3: Annual trend – Order intake and backlog
2977
5140
3620
50005400
7308 7328
8620
9770
4500
0
2000
4000
6000
8000
10000
12000
FY15 FY16 FY17 FY18E FY19E
(|
crore)
Order Intake Order backlog
Source: Company, ICICIdirect.com Research
Exhibit 4: Revenue growth to be driven by strong order intake …
24352549
3219
3851
4594
0
1000
2000
3000
4000
5000
FY15 FY16 FY17 FY18E FY19E
(|
crore)
Revenue
Source: Company, ICICIdirect.com Research
EBITDA margin likely to improve over next two years…
Wabag has earned average EBITDA margins of 9.6% in FY17. Going
ahead, margins are likely to improve on the back of shifting of its
operations base from high cost countries to low cost local markets.
Accordingly, we expect EBITDA margins to improve from 9.6% in FY17 to
10.3% in FY19E. We expect margins to improve further by 180 bps over
the next two years. Overall, the EBITDA is expected to grow at a CAGR of
24.5% to | 474 crore in FY19E.
Exhibit 5: Share of O&M revenue to remain at 20-25% of total revenue
80 80 78 75 80
20 20 22 25 20
0
20
40
60
80
100
120
FY15 FY16 FY17 FY18E FY19E
(%
)
EPC revenue O&M revenue
Source: Company, ICICIdirect.com Research
Exhibit 6: EBITDA and EBITDA margin trend
235 225
308
393
4749.6
8.8
9.6
10.210.3
0
100
200
300
400
500
FY15 FY16 FY17 FY18E FY19E
(|
crore)
8
9
9
10
10
11
(%
)
EBITDA EBITDA Margin
Source: Company, ICICIdirect.com Research

ICICI Securities Ltd | Retail Equity Research Page 6
Exhibit 7: PAT trend
110
92102
206
253
4.5
3.6
3.2
5.35.5
0
50
100
150
200
250
300
FY15 FY16 FY17 FY18E FY19E
(|
crore)
0
1
2
3
4
5
6
(%
)
PAT PAT Margin
Source: Company, ICICIdirect.com Research
Return ratios likely to improve over FY17-19E
With no major capex requirement over FY17-19E, Wabag’s D/E is likely to
remain subdued at ~0.3x. Furthermore, with an improvement in margin
over FY17-19E (mostly due to higher contribution from the domestic
segment), return ratios are likely to improve here. We expect Wabag’s
RoE and RoCE to improve from 10.6% and 25.8% in FY17 to 20.3% and
28.9%, respectively, in FY19E. The return on invested capital (RoIC) is
expected to improve from 32.9% in FY17 to 36.5% in FY19E.
Exhibit 8: RoE expected to increase on the back of improved operational performances
12.6
10.110.6
19.120.3
18.9
20.7
25.8
27.8 28.9
24.3
30.032.9
35.936.5
0
5
10
15
20
25
30
35
40
FY15 FY16 FY17 FY18E FY19E
(%
)
RoE RoCE RoIC
Source: Company, ICICIdirect.com Research

ICICI Securities Ltd | Retail Equity Research Page 7
Outlook and valuation
Strong management pedigree and execution capabilities
Wabag has a strong management team in place. The company
continuously conducts an enterprise-wide exercise that results in
reengineering of processes, realignment of strengths and reorganisation
of business verticals. Since 2007, the company operated through four
strategic business units (SBUs) comprising municipal business group
(MBG), industrial water group (IWG), operations business group (OBG)
and desalination business group (DBG) earlier known as international
business group (IBG).
As part of organisational realignment, Wabag fine-tuned its business
strategy and created four clusters — India, Europe, Middle East & Africa
(MEA) and LatAm. This cluster approach tries to strike a balance between
centralisation and decentralisation leading to enhanced capacity, better
collaboration, greater competitiveness and increased competency
Going ahead, we expect Wabag’s growth to come from a revival in
industrial capex across Indian and global markets. Revenues are expected
to grow at a CAGR of 19.5% over FY17-19E while PAT is expected to
grow at a CAGR of 59.9% over the same period coupled with a margin
improvement of 180 bps over FY17-19E. The margin improvement is
expected to be driven by higher execution of domestic orders. This, we
believe, will lead to a healthy return ratio profile, going ahead, as RoE is
expected to improve to 19.1% in FY19E from 10% in FY17. Hence, we
believe Wabag will witness quality earning growth over FY17-19E.
Wabag has witnessed working capital deterioration to 101 days in Sept 17
from 68 days in Mar 17. This was due to GST related uncertainties in the
municipal contracts and pending receivable from the AP Genco contract.
The management intends to return to regular NWC days (~75 days) by
Q4YF18 as it is expecting ~| 150 crore from AP Genco contract by FY18E
plus accelerated payments from domestic municipalities. Higher
receivables coupled healthy order wins of | 4,500 crore and | 5000 crore
for FY18E and FY19E, respectively gives us reasonable confidence about
the future prospects of the company. Accordingly, we continue value the
company at 16x FY19E EPS of | 46.4 to arrive at a target price of | 765.
We have a BUY recommendation on the company.

ICICI Securities Ltd | Retail Equity Research Page 8
Recommendation history vs. consensus
0
20
40
60
80
100
120
0
100
200
300
400
500
600
700
800
900
Nov-17Aug-17Jun-17Apr-17Jan-17Nov-16Aug-16Jun-16Mar-16Jan-16Nov-15
(%
)
(|)
Series1 Idirect target Consensus Target Mean % Consensus with BUY
Source: Bloomberg, Company, ICICIdirect.com Research, Initiated coverage on 17th December 2014
Key events
Date Event
Aug-11 Stock split from | 5/- to | 2/-
Jun-12 Wabag receives an order worth | 270 crore for construction of a 32.4 MLD effluent treatment plant with recycle facility from Reliance Industries for setting up an
industrial effluent treatment plant at Dahej
Nov-12 Wabag in consortium with Cadagua (Spain) and Galfar (Oman) has bagged a 192 MLD SWRO desalination project in Al Gubrah, Muscat, Sultanate of Oman at a cost
of $ 350 mn
Feb-13 Wabag completes the Nemelli desalination project within the stipulated time
Jun-13 Wabag wins | 325 crore JICA funded projects from Orissa Water Supply Sewerage Board and |344 crore order from Phillipines funded by World Bank
Nov-13 Order intake surpasses | 2000 crore for the first time in any particular year surpassing the annual target set by the company
Jan-14 Wabag achieves breakthrough in Tanzania by bagging orders worth $40 mn, which is funded by EXIM bank of India. The project involves building of 130 MLD Upper
Ruvu Water Treatment Plant
Sep-15 WABAG secures its largest ever ETP order from PETRONAS, Malaysia worth | 1,500 crore
Mar-16 Board recommends a bonus issue of 1:1
Mar-16 Polgahawela order in Sri lanka propels WABAG's order book to an all time high. Over INR 5,000 crores of orders secured in FY15-16
Source: Company, ICICIdirect.com Research
Top 10 Shareholders Shareholding Pattern
Rank Name Latest Filing Date % O/S Position (m) Change (m)
1 Mittal (Rajiv) 30-09-2017 17.78% 9.71M 0
2 SBI Funds Management Pvt. Ltd. 30-09-2017 7.44% 4.06M 0
3 IDFC Asset Management Company Private Limited 30-09-2017 5.84% 3.19M +0.08M
4 BNP Paribas Asset Management Asia Limited 30-09-2017 5.29% 2.89M -0.31M
5 Sumitomo Corp 30-09-2017 4.50% 2.46M 0
6 Varadarajan (S) 30-09-2017 4.00% 2.19M 0
7 Sengupta (Amit) 30-09-2017 3.56% 1.94M -0.25M
8 Aditya Birla Sun Life AMC Limited 30-09-2017 2.97% 1.62M +0.15M
9 Saraf (Shiv Narayan) 30-09-2017 2.93% 1.60M 0
10 ICICI Prudential Life Insurance Company Ltd. 30-06-2017 2.28% 1.24M -0.32M
(in %) Sep-16 Dec-16 Mar-17 Jun-17 Sep-17
Promoter 28.8 28.8 24.7 24.7 24.7
FII 27.9 26.1 25.9 26.7 26.7
DII 22.2 21.4 24.0 24.6 22.3
Others 21.2 23.7 25.4 24.0 26.3
Source: Reuters, ICICIdirect.com Research
Recent Activity
Investor name Value Shares Investor name Value Shares
Goldman Sachs Asset Management (India) Private Ltd. +9.37M +1.04M ICICI Prudential Life Insurance Company Ltd. -3.37M -0.32M
Sundaram Asset Management Company Limited +3.04M +0.34M BNP Paribas Asset Management Asia Limited -2.77M -0.31M
Mirae Asset Global Investments (Hong Kong) Limited +2.10M +0.21M Sengupta (Amit) -2.26M -0.25M
Aditya Birla Sun Life AMC Limited +1.36M +0.15M BNP Paribas Asset Management India Pvt. Ltd. -1.49M -0.16M
IDFC Asset Management Company Private Limited +0.72M +0.08M William Blair Investment Management, LLC -0.76M -0.08M
Investor name Investor name
Source: Reuters, ICICIdirect.com Research
ICICI Securities Ltd | Retail Equity Research Page 9
.
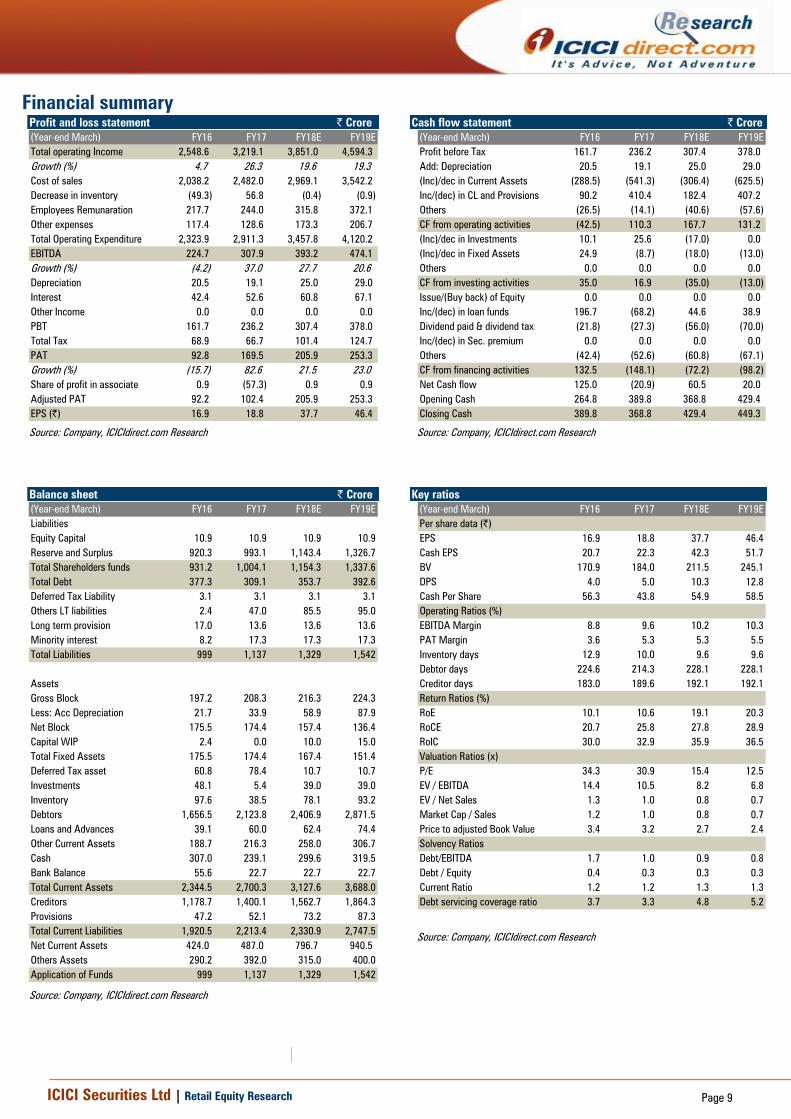
Financial summary
Profit and loss statement | Crore
(Year-end March) FY16 FY17 FY18E FY19E
Total operating Income 2,548.6 3,219.1 3,851.0 4,594.3
Growth (%) 4.7 26.3 19.6 19.3
Cost of sales 2,038.2 2,482.0 2,969.1 3,542.2
Decrease in inventory (49.3) 56.8 (0.4) (0.9)
Employees Remunaration 217.7 244.0 315.8 372.1
Other expenses 117.4 128.6 173.3 206.7
Total Operating Expenditure 2,323.9 2,911.3 3,457.8 4,120.2
EBITDA 224.7 307.9 393.2 474.1
Growth (%) (4.2) 37.0 27.7 20.6
Depreciation 20.5 19.1 25.0 29.0
Interest 42.4 52.6 60.8 67.1
Other Income 0.0 0.0 0.0 0.0
PBT 161.7 236.2 307.4 378.0
Total Tax 68.9 66.7 101.4 124.7
PAT 92.8 169.5 205.9 253.3
Growth (%) (15.7) 82.6 21.5 23.0
Share of profit in associate 0.9 (57.3) 0.9 0.9
Adjusted PAT 92.2 102.4 205.9 253.3
EPS (|) 16.9 18.8 37.7 46.4
Source: Company, ICICIdirect.com Research
Cash flow statement | Crore
(Year-end March) FY16 FY17 FY18E FY19E
Profit before Tax 161.7 236.2 307.4 378.0
Add: Depreciation 20.5 19.1 25.0 29.0
(Inc)/dec in Current Assets (288.5) (541.3) (306.4) (625.5)
Inc/(dec) in CL and Provisions 90.2 410.4 182.4 407.2
Others (26.5) (14.1) (40.6) (57.6)
CF from operating activities (42.5) 110.3 167.7 131.2
(Inc)/dec in Investments 10.1 25.6 (17.0) 0.0
(Inc)/dec in Fixed Assets 24.9 (8.7) (18.0) (13.0)
Others 0.0 0.0 0.0 0.0
CF from investing activities 35.0 16.9 (35.0) (13.0)
Issue/(Buy back) of Equity 0.0 0.0 0.0 0.0
Inc/(dec) in loan funds 196.7 (68.2) 44.6 38.9
Dividend paid & dividend tax (21.8) (27.3) (56.0) (70.0)
Inc/(dec) in Sec. premium 0.0 0.0 0.0 0.0
Others (42.4) (52.6) (60.8) (67.1)
CF from financing activities 132.5 (148.1) (72.2) (98.2)
Net Cash flow 125.0 (20.9) 60.5 20.0
Opening Cash 264.8 389.8 368.8 429.4
Closing Cash 389.8 368.8 429.4 449.3
Source: Company, ICICIdirect.com Research
Balance sheet | Crore
(Year-end March) FY16 FY17 FY18E FY19E
Liabilities
Equity Capital 10.9 10.9 10.9 10.9
Reserve and Surplus 920.3 993.1 1,143.4 1,326.7
Total Shareholders funds 931.2 1,004.1 1,154.3 1,337.6
Total Debt 377.3 309.1 353.7 392.6
Deferred Tax Liability 3.1 3.1 3.1 3.1
Others LT liabilities 2.4 47.0 85.5 95.0
Long term provision 17.0 13.6 13.6 13.6
Minority interest 8.2 17.3 17.3 17.3
Total Liabilities 999 1,137 1,329 1,542
Assets
Gross Block 197.2 208.3 216.3 224.3
Less: Acc Depreciation 21.7 33.9 58.9 87.9
Net Block 175.5 174.4 157.4 136.4
Capital WIP 2.4 0.0 10.0 15.0
Total Fixed Assets 175.5 174.4 167.4 151.4
Deferred Tax asset 60.8 78.4 10.7 10.7
Investments 48.1 5.4 39.0 39.0
Inventory 97.6 38.5 78.1 93.2
Debtors 1,656.5 2,123.8 2,406.9 2,871.5
Loans and Advances 39.1 60.0 62.4 74.4
Other Current Assets 188.7 216.3 258.0 306.7
Cash 307.0 239.1 299.6 319.5
Bank Balance 55.6 22.7 22.7 22.7
Total Current Assets 2,344.5 2,700.3 3,127.6 3,688.0
Creditors 1,178.7 1,400.1 1,562.7 1,864.3
Provisions 47.2 52.1 73.2 87.3
Total Current Liabilities 1,920.5 2,213.4 2,330.9 2,747.5
Net Current Assets 424.0 487.0 796.7 940.5
Others Assets 290.2 392.0 315.0 400.0
Application of Funds 999 1,137 1,329 1,542
Source: Company, ICICIdirect.com Research
Key ratios
(Year-end March) FY16 FY17 FY18E FY19E
Per share data (|)
EPS 16.9 18.8 37.7 46.4
Cash EPS 20.7 22.3 42.3 51.7
BV 170.9 184.0 211.5 245.1
DPS 4.0 5.0 10.3 12.8
Cash Per Share 56.3 43.8 54.9 58.5
Operating Ratios (%)
EBITDA Margin 8.8 9.6 10.2 10.3
PAT Margin 3.6 5.3 5.3 5.5
Inventory days 12.9 10.0 9.6 9.6
Debtor days 224.6 214.3 228.1 228.1
Creditor days 183.0 189.6 192.1 192.1
Return Ratios (%)
RoE 10.1 10.6 19.1 20.3
RoCE 20.7 25.8 27.8 28.9
RoIC 30.0 32.9 35.9 36.5
Valuation Ratios (x)
P/E 34.3 30.9 15.4 12.5
EV / EBITDA 14.4 10.5 8.2 6.8
EV / Net Sales 1.3 1.0 0.8 0.7
Market Cap / Sales 1.2 1.0 0.8 0.7
Price to adjusted Book Value 3.4 3.2 2.7 2.4
Solvency Ratios
Debt/EBITDA 1.7 1.0 0.9 0.8
Debt / Equity 0.4 0.3 0.3 0.3
Current Ratio 1.2 1.2 1.3 1.3
Debt servicing coverage ratio 3.7 3.3 4.8 5.2
Source: Company, ICICIdirect.com Research

ICICI Securities Ltd | Retail Equity Research Page 10
ICICIdirect.com coverage universe (Capital Goods)
CMP M Cap
(|) TP(|) Rating (| Cr) FY17 FY18E FY19E FY17 FY18E FY19E FY17 FY18E FY19E FY17 FY18E FY19E
L&T (LARTOU) 1220 1430 Buy 169580 33.9 42.0 48.6 35.9 29.1 25.1 10.2 12.0 13.5 11.4 13.3 14.4
Bhel (BHEL) 90 81 Hold 41608 1.2 3.4 4.8 72.6 26.8 18.8 0.6 0.5 3.0 1.3 3.6 4.9
AIA Engineering 1400 1,420 Hold 12880 43.9 40.9 54.2 31.9 34.2 25.8 24.7 21.9 22.4 22.1 19.6 19.9
Thermax (THERMA) 950 1050 Buy 10223 12.2 25.1 33.1 77.9 37.8 28.7 11.6 12.0 14.5 5.6 10.6 12.6
KEC International (KECIN) 317 410 Buy 8100 12.8 15.3 20.4 24.8 20.7 15.5 16.3 17.8 20.3 17.4 17.6 19.7
Greaves Cotton (GREAVE) 127 140 Hold 3099 7.3 8.3 8.7 17.4 15.3 14.6 28.7 31.1 31.7 21.2 22.1 22.6
Bharat Electronics (BHAELE) 185 215 Buy 48023 6.7 7.9 8.6 27.7 23.4 21.6 23.7 24.4 23.5 17.6 18.4 17.7
Engineers India (ENGIND) 200 190 Hold 12804 6.1 6.5 7.6 29.3 27.8 23.7 19.0 18.3 19.8 13.2 13.2 14.4
VaTech Wabag (VATWAB) 582 765 Buy 4154 18.8 37.7 46.4 31.0 15.4 12.5 25.8 27.8 28.9 10.6 19.1 20.3
SKF (SKFIND) 1700 1,850 Buy 9756 46.3 53.0 61.7 35.2 30.8 26.4 20.7 23.1 23.8 13.5 15.1 15.6
Timken India (TATTIM) 706 867 Buy 5895 14.3 15.9 19.3 48.3 43.3 35.8 22.7 24.2 25.5 16.0 15.7 16.6
NRB Bearing (NRBBEA) 142 170 Buy 1551 5.6 6.1 7.3 21.9 20.0 16.8 16.1 17.8 18.9 17.0 16.8 17.6
Grindwell Norton (GRINOR) 490 525 Hold 5813 12.5 14.4 16.4 39.3 34.1 29.9 21.3 22.4 23.0 14.2 15.0 15.4
RoE (%)EPS (|) P/E (x) RoCE (%)
Source: Company, ICICIdirect.com Research

ICICI Securities Ltd | Retail Equity Research Page 11
RATING RATIONALE
ICICIdirect.com endeavours to provide objective opinions and recommendations. ICICIdirect.com assigns
ratings to its stocks according to their notional target price vs. current market price and then categorises them
as Strong Buy, Buy, Hold and Sell. The performance horizon is two years unless specified and the notional
target price is defined as the analysts' valuation for a stock.
Strong Buy: >15%/20% for large caps/midcaps, respectively, with high conviction;
Buy: >10%/15% for large caps/midcaps, respectively;
Hold: Up to +/-10%;
Sell: -10% or more;
Pankaj Pandey Head – Research [email protected]
ICICIdirect.com Research Desk,
ICICI Securities Limited,
1st
Floor, Akruti Trade Centre,
Road No. 7, MIDC,
Andheri (East)
Mumbai – 400 093
ANALYST CERTIFICATION
We /I, Rashesh Shah CA, Darpan Thakkar MBA research analysts, authors and the names subscribed to this report, hereby certify that all of the views expressed in this research report accurately reflect our
personal views about any and all of the subject issuer(s) or securities. We also certify that no part of our compensation was, is, or will be directly or indirectly related to the specific recommendation(s) or
view(s) in this report. Analysts aren't registered as research analysts by FINRA and might not be an associated person of the ICICI Securities Inc.
Disclosures:
ICICI Securities Limited (ICICI Securities) and its affiliates are a full-service, integrated investment banking, investment management and brokerage and financing group. We along with affiliates are leading
underwriter of securities and participate in virtually all securities trading markets in India. We and our affiliates have investment banking and other business relationship with a significant percentage of
companies covered by our Investment Research Department. Our research professionals provide important input into our investment banking and other business selection processes. ICICI Securities
generally prohibits its analysts, persons reporting to analysts and their dependent family members from maintaining a financial interest in the securities or derivatives of any companies that the analysts
cover.
The information and opinions in this report have been prepared by ICICI Securities and are subject to change without any notice. The report and information contained herein is strictly confidential and
meant solely for the selected recipient and may not be altered in any way, transmitted to, copied or distributed, in part or in whole, to any other person or to the media or reproduced in any form, without
prior written consent of ICICI Securities. While we would endeavour to update the information herein on reasonable basis, ICICI Securities, its subsidiaries and associated companies, their directors and
employees (“ICICI Securities and affiliates”) are under no obligation to update or keep the information current. Also, there may be regulatory, compliance or other reasons that may prevent ICICI Securities
from doing so. Non-rated securities indicate that rating on a particular security has been suspended temporarily and such suspension is in compliance with applicable regulations and/or ICICI Securities
policies, in circumstances where ICICI Securities is acting in an advisory capacity to this company, or in certain other circumstances.
This report is based on information obtained from public sources and sources believed to be reliable, but no independent verification has been made nor is its accuracy or completeness guaranteed. This
report and information herein is solely for informational purpose and may not be used or considered as an offer document or solicitation of offer to buy or sell or subscribe for securities or other financial
instruments. Though disseminated to all the customers simultaneously, not all customers may receive this report at the same time. ICICI Securities will not treat recipients as customers by virtue of their
receiving this report. Nothing in this report constitutes investment, legal, accounting and tax advice or a representation that any investment or strategy is suitable or appropriate to your specific
circumstances. The securities discussed and opinions expressed in this report may not be suitable for all investors, who must make their own investment decisions, based on their own investment
objectives, financial positions and needs of specific recipient. This may not be taken in substitution for the exercise of independent judgment by any recipient. The recipient should independently evaluate
the investment risks. The value and return of investment may vary because of changes in interest rates, foreign exchange rates or any other reason. ICICI Securities and affiliates accept no liabilities for any
loss or damage of any kind arising out of the use of this report. Past performance is not necessarily a guide to future performance. Investors are advised to see Risk Disclosure Document to understand the
risks associated before investing in the securities markets. Actual results may differ materially from those set forth in projections. Forward-looking statements are not predictions and may be subject to
change without notice.
ICICI Securities and its affiliates might have managed or co-managed a public offering for the subject company in the preceding twelve months. ICICI Securities and affiliates might have received
compensation from the companies mentioned in the report during the period preceding twelve months from the date of this report for services in respect of public offerings, corporate finance, investment
banking or other advisory services in a merger or specific transaction. It is confirmed that Rashesh Shah CA, Darpan Thakkar MBA research analysts and the authors of this report have not received any
compensation from the companies mentioned in the report in the preceding twelve months. Our research professionals are paid in part based on the profitability of ICICI Securities, which include earnings
from Investment Banking and other business.
ICICI Securities or its subsidiaries collectively do not own 1% or more of the equity securities of the Company mentioned in the report as of the last day of the month preceding the publication of the
research report.
It is confirmed that Rashesh Shah CA, Darpan Thakkar MBA research analysts and the authors of this report or any of their family members does not serve as an officer, director or advisory board member
of the companies mentioned in the report.
ICICI Securities may have issued other reports that are inconsistent with and reach different conclusion from the information presented in this report. ICICI Securities and affiliates may act upon or make use
of information contained in the report prior to the publication thereof.
This report is not directed or intended for distribution to, or use by, any person or entity who is a citizen or resident of or located in any locality, state, country or other jurisdiction, where such distribution,
publication, availability or use would be contrary to law, regulation or which would subject ICICI Securities and affiliates to any registration or licensing requirement within such jurisdiction. The securities
described herein may or may not be eligible for sale in all jurisdictions or to certain category of investors. Persons in whose possession this document may come are required to inform themselves of and
to observe such restriction.

ICICI Securities Ltd | Retail Equity Research Page 12
Disclaimer
ANALYST CERTIFICATION
We /I, Chirag Shah PGDBM; Sagar Gandhi MBA (Finance), Research Analysts, authors and the names subscribed to this report, hereby certify that all of the views expressed in this research report accurately reflect our views about the subject
issuer(s) or securities. We also certify that no part of our compensation was, is, or will be directly or indirectly related to the specific recommendation(s) or view(s) in this report.
Terms & conditions and other disclosures:
ICICI Securities Limited (ICICI Securities) is a full-service, integrated investment banking and is, inter alia, engaged in the business of stock brokering and distribution of financial products. ICICI Securities Limited is a Sebi registered Research Analyst with Sebi Registration Number – INH000000990. ICICI Securities is a wholly-owned subsidiary of ICICI Bank which is India’s largest private sector bank and has its various subsidiaries engaged in businesses of housing finance, asset management, life insurance, general insurance, venture capital fund management, etc. (“associates”), the details in respect of which are available on www.icicibank.com.
ICICI Securities is one of the leading merchant bankers/ underwriters of securities and participate in virtually all securities trading markets in India. We and our associates might have investment banking and other business relationship with a significant percentage of companies covered by our Investment Research Department. ICICI Securities generally prohibits its analysts, persons reporting to analysts and their relatives from maintaining a financial interest in the securities or derivatives of any companies that the analysts cover.
The information and opinions in this report have been prepared by ICICI Securities and are subject to change without any notice. The report and information contained herein is strictly confidential and meant solely for the selected recipient and may not be altered in any way, transmitted to, copied or distributed, in part or in whole, to any other person or to the media or reproduced in any form, without prior written consent of ICICI Securities. While we would endeavour to update the information herein on a reasonable basis, ICICI Securities is under no obligation to update or keep the information current. Also, there may be regulatory, compliance or other reasons that may prevent ICICI Securities from doing so. Non-rated securities indicate that rating on a particular security has been suspended temporarily and such suspension is in compliance with applicable regulations and/or ICICI Securities policies, in circumstances where ICICI Securities might be acting in an advisory capacity to this company, or in certain other circumstances.
This report is based on information obtained from public sources and sources believed to be reliable, but no independent veri fication has been made nor is its accuracy or completeness guaranteed. This report and information herein is solely for informational purpose and shall not be used or considered as an offer document or solicitation of offer to buy or sell or subscribe for securities or other financial instruments. Though disseminated to all the customers simultaneously, not all customers may receive this report at the same time. ICICI Securities will not treat recipients as customers by virtue of their receiving this report. Nothing in this report constitutes investment, legal, accounting and tax advice or a representation that any investment or strategy is suitable or appropriate to your specific circumstances. The securities discussed and opinions expressed in this report may not be suitable for all investors, who must make their own investment decisions, based on their own investment objectives, financial positions and needs of specific recipient. This may not be taken in substitution for the exercise of independent judgment by any recipient. The recipient should independently evaluate the investment risks. The value and return on investment may vary because of changes in interest rates, foreign exchange rates or any other reason. ICICI Securities accepts no liabilities whatsoever for any loss or damage of any kind arising out of the use of this report. Past performance is not necessarily a guide to future performance. Investors are advised to see Risk Disclosure Document to understand the risks associated before investing in the securities markets. Actual results may differ materially from those set forth in projections. Forward-looking statements are not predictions and may be subject to change without notice.
ICICI Securities or its associates might have managed or co-managed public offering of securities for the subject company or might have been mandated by the subject company for any other assignment in the past twelve months.
ICICI Securities or its associates might have received any compensation from the companies mentioned in the report during the period preceding twelve months from the date of this report for services in respect of managing or co-managing public offerings, corporate finance, investment banking or merchant banking, brokerage services or other advisory service in a merger or specific transaction.
ICICI Securities or its associates might have received any compensation for products or services other than investment banking or merchant banking or brokerage services from the companies mentioned in the report in the past twelve months.
ICICI Securities encourages independence in research report preparation and strives to minimize conflict in preparation of research report. ICICI Securities or its associates or its analysts did not receive any compensation or other benefits from the companies mentioned in the report or third party in connection with preparation of the research report. Accordingly, neither ICICI Securities nor Research Analysts and their relatives have any material conflict of interest at the time of publication of this report.
It is confirmed that Chirag Shah PGDBM; Sagar Gandhi MBA (Finance), Research Analysts of this report have not received any compensation from the companies mentioned in the report in the preceding twelve months.
Compensation of our Research Analysts is not based on any specific merchant banking, investment banking or brokerage service transactions.
ICICI Securities or its subsidiaries collectively or Research Analysts or their relatives do not own 1% or more of the equity securities of the Company mentioned in the report as of the last day of the month preceding the publication of the research report.
Since associates of ICICI Securities are engaged in various financial service businesses, they might have financial interests or beneficial ownership in various companies including the subject company/companies mentioned in this report.
It is confirmed that Chirag Shah PGDBM; Sagar Gandhi MBA (Finance), Research Analysts do not serve as an officer, director or employee of the companies mentioned in the report.
ICICI Securities may have issued other reports that are inconsistent with and reach different conclusion from the information presented in this report.
Neither the Research Analysts nor ICICI Securities have been engaged in market making activity for the companies mentioned in the report.
We submit that no material disciplinary action has been taken on ICICI Securities by any Regulatory Authority impacting Equity Research Analysis activities.
This report is not directed or intended for distribution to, or use by, any person or entity who is a citizen or resident of or located in any locality, state, country or other jurisdiction, where such distribution, publication, availability or use would be contrary to law, regulation or which would subject ICICI Securities and affiliates to any registration or licensing requirement within such jurisdiction. The securities described herein may or may not be eligible for sale in all jurisdictions or to certain category of investors. Persons in whose possession this document may come are required to inform themselves of and to observe such restriction.
Top Related