


Languages
Pages
Legal


Rochester Institute of Technology Rochester Institute of Technology
RIT Scholar Works RIT Scholar Works
Theses
5-8-2015
Utilizing Crime Analysis to Evaluate Criminal Justice Initiatives Utilizing Crime Analysis to Evaluate Criminal Justice Initiatives
Peter Tran
Follow this and additional works at: https://scholarworks.rit.edu/theses
Recommended Citation Recommended Citation Tran, Peter, "Utilizing Crime Analysis to Evaluate Criminal Justice Initiatives" (2015). Thesis. Rochester Institute of Technology. Accessed from
This Thesis is brought to you for free and open access by RIT Scholar Works. It has been accepted for inclusion in Theses by an authorized administrator of RIT Scholar Works. For more information, please contact [email protected].
Utilizing Crime Analysis to
Evaluate Criminal Justice Initiatives
by
Peter Tran
A Thesis/Dissertation Submitted in Partial Fulfillment of the
Requirements for the Degree of Master of Science in
Criminal Justice
School/Department of Criminal Justice
College of Liberal Arts
Rochester Institute of Technology
Rochester, NY
May 08, 2015
I
Committee Approval:
John McCluskey Date
Professor and Graduate Program Director/ Thesis Advisor
John Klofas
Professor and Director of The Center for Public Safety
Initiatives/Thesis Advisor
Date
Laverne McQuiller Williams
Department Chairperson of Criminal Justice Program
and Professor/Thesis Advisor
Date
II
Table of Contents
Utilizing Crime Analysis to Evaluate Criminal Justice Initiatives ........................................... 1
Chapter 1: Evaluation of Criminal Justice Approaches ............................................................. 2
History of Housing as a Criminal Justice Approach .............................................................. 4
History of Community Outreach as a Criminal Justice Approach ......................................... 5
History of Street Crackdowns as Criminal Justice Approach .............................................. 6
Chapter 2: Housing and Habitat for Humanity .......................................................................... 9
Introduction .............................................................................................................................. 9
History of Habitat for Humanity ............................................................................................. 9
The Levels of Organization ................................................................................................... 10
Flower City Habitat for Humanity .................................................................................... 11
Neighborhood Selection .................................................................................................... 12
Construction Methods ............................................................................................................ 13
House Payments and Resources ............................................................................................ 13
Housing and Crime ................................................................................................................ 15
Public Housing and Private Housing ................................................................................. 16
Disadvantages of Public Housing ...................................................................................... 16
Case Study in Public Housing: Louisville, KY .................................................................... 19
Case Study in Public Housing: Denver, CO ...................................................................... 19
Housing Type: Advantages of Private Housing ................................................................. 20
Case Study in Private Housing: Wilmington, DE .............................................................. 21
Theories ............................................................................................................................ 22
Routine Activity ................................................................................................................ 22
Routine Activities of Places .................................................................................................. 23
Defensible Space ............................................................................................................... 24
Hypothesis ........................................................................................................................ 25
Analysis ............................................................................................................................ 26
Data collection ....................................................................................................................... 27
Methods and Testing ............................................................................................................. 27
Area of Intervention: Flower City (Rochester, NY) ........................................................... 31
Flower City Zip Code Area: 14609 ...................................................................................... 31
Flower City Zip Code Area: 14605 ...................................................................................... 32
Flower City Zip Code Area: 14611 ...................................................................................... 32
Results .................................................................................................................................... 32
Property Crimes ..................................................................................................................... 34
Conclusion ........................................................................................................................ 35
III
Chapter 3: Community Outreach and Operation SNUG .......................................................... 36
Operation SNUG ............................................................................................................... 36
Pathways to Peace – Rochester, NY .................................................................................. 38
Theory ............................................................................................................................... 39
Analysis ............................................................................................................................ 40
Area of Intervention ............................................................................................................... 42
Results .................................................................................................................................... 45
Conclusion ........................................................................................................................ 47
Chapter 4: Rochester Street Corner Crackdown ....................................................................... 49
Introduction ............................................................................................................................ 49
Rochester Safe and Sound ..................................................................................................... 50
Theory ............................................................................................................................... 51
Analysis ............................................................................................................................ 52
Area of Intervention ............................................................................................................... 53
Results .................................................................................................................................... 60
Conclusion ........................................................................................................................ 61
Chapter 5: Overall Results on Best Criminal Justice Practices ................................................ 62
Conclusion: Housing as a Criminal Justice Approach .......................................................... 62
Fit/ Approach Type ........................................................................................................... 63
Measure and Dosage ......................................................................................................... 63
Design/ Pre-Tests Post-Tests ................................................................................................. 64
Geographic Unit .................................................................................................................... 65
Decay/ Weakness .............................................................................................................. 65
Conclusion: Community Outreach as a Criminal Justice Approach .................................... 66
Fit/ Approach Type ........................................................................................................... 67
Association with Crime ......................................................................................................... 68
Measure and Dosage ......................................................................................................... 68
Design/ Pre-Tests Post-Tests ................................................................................................. 69
Geographical Unit ............................................................................................................. 70
Decay/ Weakness .............................................................................................................. 71
Conclusion: Crackdowns as a Criminal Justice Approach ................................................. 71
Association with Crime ......................................................................................................... 72
Measure and Dosage ......................................................................................................... 73
Geographical Unit ............................................................................................................. 73
Decay/ Weakness .............................................................................................................. 74
Bibliography ......................................................................................................................... 76
1
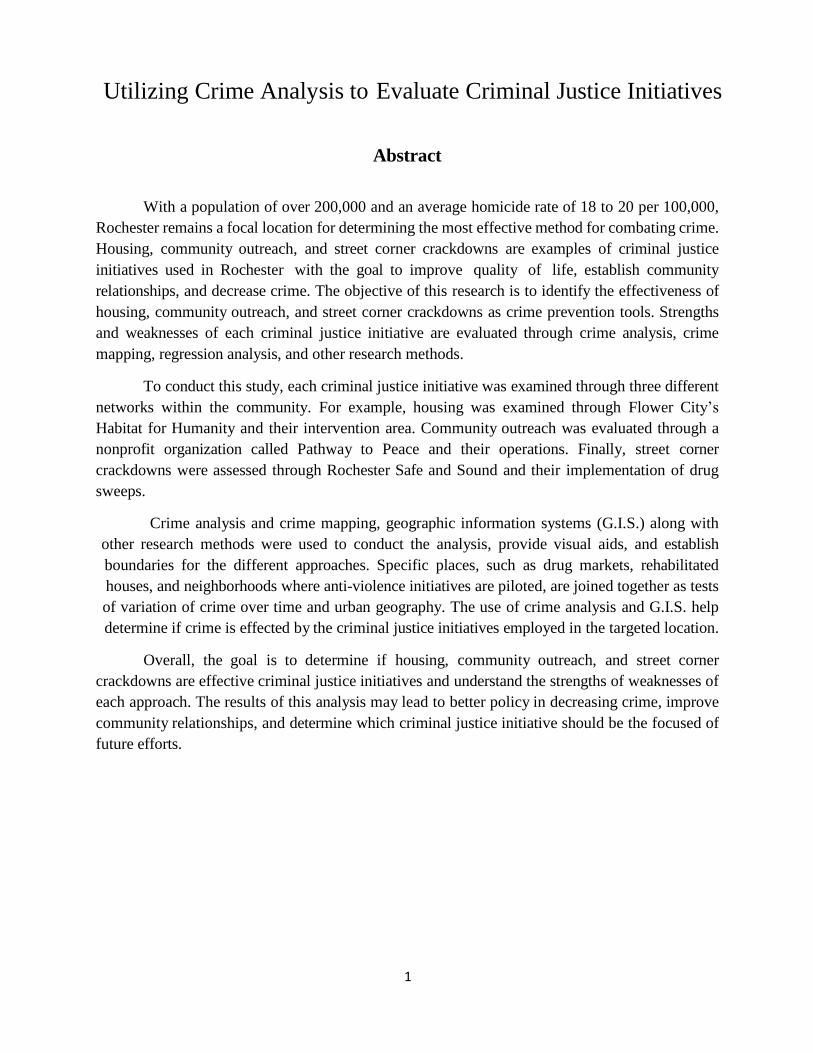
Utilizing Crime Analysis to Evaluate Criminal Justice Initiatives
Abstract
With a population of over 200,000 and an average homicide rate of 18 to 20 per 100,000,
Rochester remains a focal location for determining the most effective method for combating crime.
Housing, community outreach, and street corner crackdowns are examples of criminal justice
initiatives used in Rochester with the goal to improve quality of life, establish community
relationships, and decrease crime. The objective of this research is to identify the effectiveness of
housing, community outreach, and street corner crackdowns as crime prevention tools. Strengths
and weaknesses of each criminal justice initiative are evaluated through crime analysis, crime
mapping, regression analysis, and other research methods.
To conduct this study, each criminal justice initiative was examined through three different
networks within the community. For example, housing was examined through Flower City’s
Habitat for Humanity and their intervention area. Community outreach was evaluated through a
nonprofit organization called Pathway to Peace and their operations. Finally, street corner
crackdowns were assessed through Rochester Safe and Sound and their implementation of drug
sweeps.
Crime analysis and crime mapping, geographic information systems (G.I.S.) along with
other research methods were used to conduct the analysis, provide visual aids, and establish
boundaries for the different approaches. Specific places, such as drug markets, rehabilitated
houses, and neighborhoods where anti-violence initiatives are piloted, are joined together as tests
of variation of crime over time and urban geography. The use of crime analysis and G.I.S. help
determine if crime is effected by the criminal justice initiatives employed in the targeted location.
Overall, the goal is to determine if housing, community outreach, and street corner
crackdowns are effective criminal justice initiatives and understand the strengths of weaknesses of
each approach. The results of this analysis may lead to better policy in decreasing crime, improve
community relationships, and determine which criminal justice initiative should be the focused of
future efforts.
2
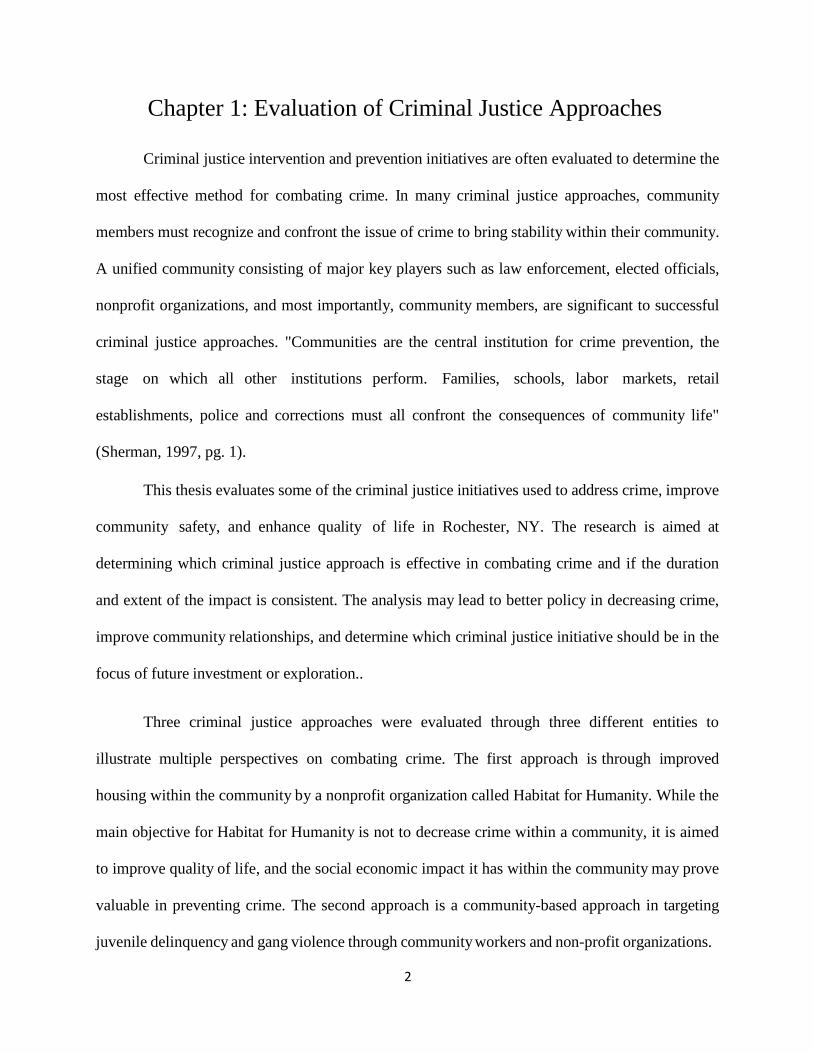
Chapter 1: Evaluation of Criminal Justice Approaches
Criminal justice intervention and prevention initiatives are often evaluated to determine the
most effective method for combating crime. In many criminal justice approaches, community
members must recognize and confront the issue of crime to bring stability within their community.
A unified community consisting of major key players such as law enforcement, elected officials,
nonprofit organizations, and most importantly, community members, are significant to successful
criminal justice approaches. "Communities are the central institution for crime prevention, the
stage on which all other institutions perform. Families, schools, labor markets, retail
establishments, police and corrections must all confront the consequences of community life"
(Sherman, 1997, pg. 1).
This thesis evaluates some of the criminal justice initiatives used to address crime, improve
community safety, and enhance quality of life in Rochester, NY. The research is aimed at
determining which criminal justice approach is effective in combating crime and if the duration
and extent of the impact is consistent. The analysis may lead to better policy in decreasing crime,
improve community relationships, and determine which criminal justice initiative should be in the
focus of future investment or exploration..
Three criminal justice approaches were evaluated through three different entities to
illustrate multiple perspectives on combating crime. The first approach is through improved
housing within the community by a nonprofit organization called Habitat for Humanity. While the
main objective for Habitat for Humanity is not to decrease crime within a community, it is aimed
to improve quality of life, and the social economic impact it has within the community may prove
valuable in preventing crime. The second approach is a community-based approach in targeting
juvenile delinquency and gang violence through community workers and non-profit organizations.
3
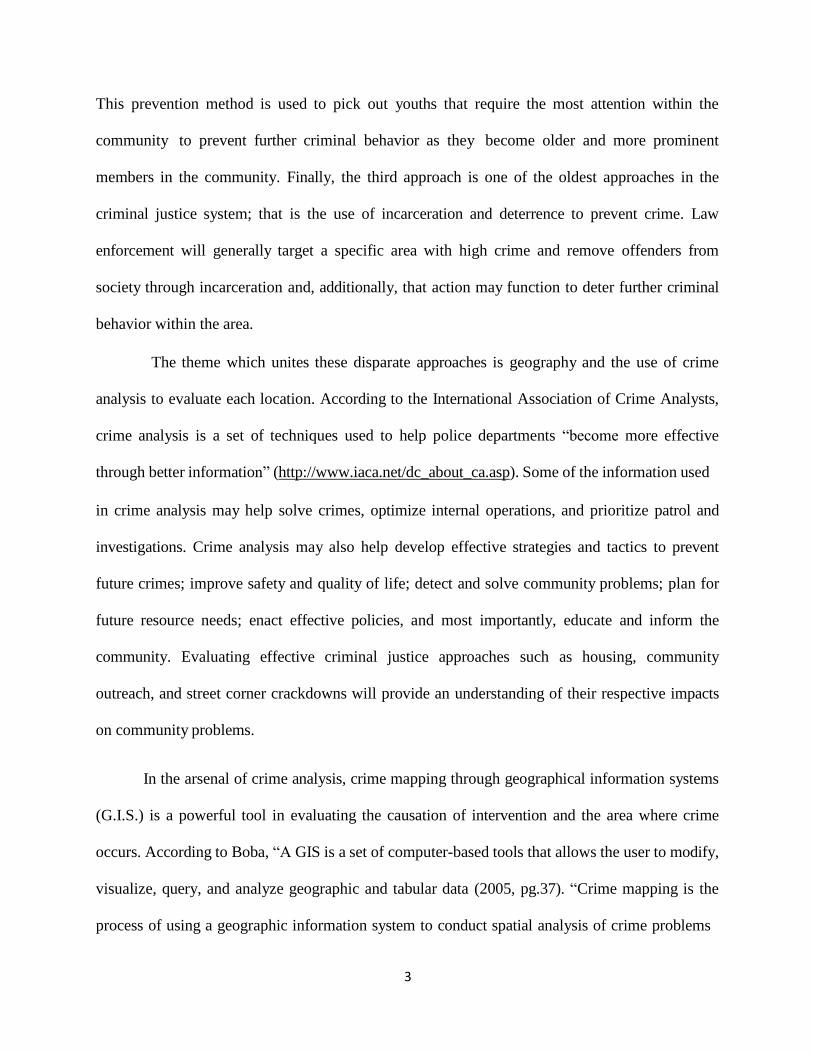
This prevention method is used to pick out youths that require the most attention within the
community to prevent further criminal behavior as they become older and more prominent
members in the community. Finally, the third approach is one of the oldest approaches in the
criminal justice system; that is the use of incarceration and deterrence to prevent crime. Law
enforcement will generally target a specific area with high crime and remove offenders from
society through incarceration and, additionally, that action may function to deter further criminal
behavior within the area.
The theme which unites these disparate approaches is geography and the use of crime
analysis to evaluate each location. According to the International Association of Crime Analysts,
crime analysis is a set of techniques used to help police departments “become more effective
through better information” (http://www.iaca.net/dc_about_ca.asp). Some of the information used
in crime analysis may help solve crimes, optimize internal operations, and prioritize patrol and
investigations. Crime analysis may also help develop effective strategies and tactics to prevent
future crimes; improve safety and quality of life; detect and solve community problems; plan for
future resource needs; enact effective policies, and most importantly, educate and inform the
community. Evaluating effective criminal justice approaches such as housing, community
outreach, and street corner crackdowns will provide an understanding of their respective impacts
on community problems.
In the arsenal of crime analysis, crime mapping through geographical information systems
(G.I.S.) is a powerful tool in evaluating the causation of intervention and the area where crime
occurs. According to Boba, “A GIS is a set of computer-based tools that allows the user to modify,
visualize, query, and analyze geographic and tabular data (2005, pg.37). “Crime mapping is the
process of using a geographic information system to conduct spatial analysis of crime problems
4
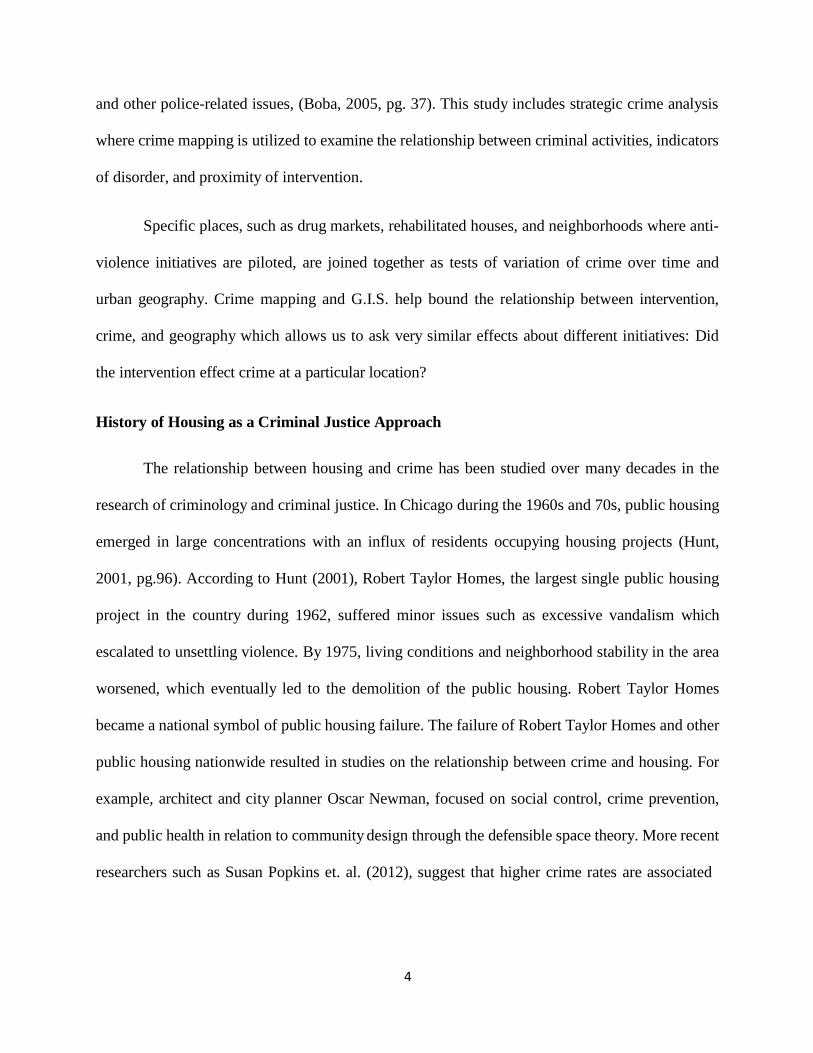
and other police-related issues, (Boba, 2005, pg. 37). This study includes strategic crime analysis
where crime mapping is utilized to examine the relationship between criminal activities, indicators
of disorder, and proximity of intervention.
Specific places, such as drug markets, rehabilitated houses, and neighborhoods where anti-
violence initiatives are piloted, are joined together as tests of variation of crime over time and
urban geography. Crime mapping and G.I.S. help bound the relationship between intervention,
crime, and geography which allows us to ask very similar effects about different initiatives: Did
the intervention effect crime at a particular location?
History of Housing as a Criminal Justice Approach
The relationship between housing and crime has been studied over many decades in the
research of criminology and criminal justice. In Chicago during the 1960s and 70s, public housing
emerged in large concentrations with an influx of residents occupying housing projects (Hunt,
2001, pg.96). According to Hunt (2001), Robert Taylor Homes, the largest single public housing
project in the country during 1962, suffered minor issues such as excessive vandalism which
escalated to unsettling violence. By 1975, living conditions and neighborhood stability in the area
worsened, which eventually led to the demolition of the public housing. Robert Taylor Homes
became a national symbol of public housing failure. The failure of Robert Taylor Homes and other
public housing nationwide resulted in studies on the relationship between crime and housing. For
example, architect and city planner Oscar Newman, focused on social control, crime prevention,
and public health in relation to community design through the defensible space theory. More recent
researchers such as Susan Popkins et. al. (2012), suggest that higher crime rates are associated

5
with greater concentrations of relocated households, whereas the neighborhoods where public
housing was demolished, violent crime decreased more than 60 percent (pg. 148-151).
Theories such as Newman’s defensible space and Popkin’s public housing issues are
applicable to some criminal justice approaches we use today. Since public housing developments
suffered extreme violent crime and drug trafficking rates (Popkins et. al, 2012, pg. 154), other
approaches such as single family homes created by Habitat for Humanity may prove more
beneficial in neighborhood stability and crime reductions. After all, Habitat for Humanity housing
operations differs widely from public housing. This thesis examines the pros and cons of Habitat
for Humanity housing, the operations of Habitat for Humanity, and how it may affect the number
of crimes in the nearby area. However, housing will be one of the three criminal justice approaches
that will be examined.
History of Community Outreach as a Criminal Justice Approach
The second criminal justice approach that will be evaluated is community outreach. Crime
prevention through community outreach is often associated with a type of policing called problem
oriented policing (POP). POP is a policing strategy that involves the identification and
comprehension of specific crime issues and how to develop effective response strategies. This type
of policing allows officers to respond to crime in a proactive approach rather than a reactive
approach (Goldstein, 2001, pg. 1). A heavily evaluated program known as Operation Ceasefire is
a prime example of “problem oriented policing which aimed at reducing youth homicide and youth
firearms violence in Boston” (Braga et. al., 2001, pg. 195). “Boston Ceasefire was the first project
documented to involve direct engagement between law enforcement and a pre-identified group of
individuals at high-risk for becoming perpetrators of gun violence, (Fritsche & Cerniglia, 2010,
pg. 8). “The original evaluation of the Boston Ceasefire Model, published in 2001, showed a
6
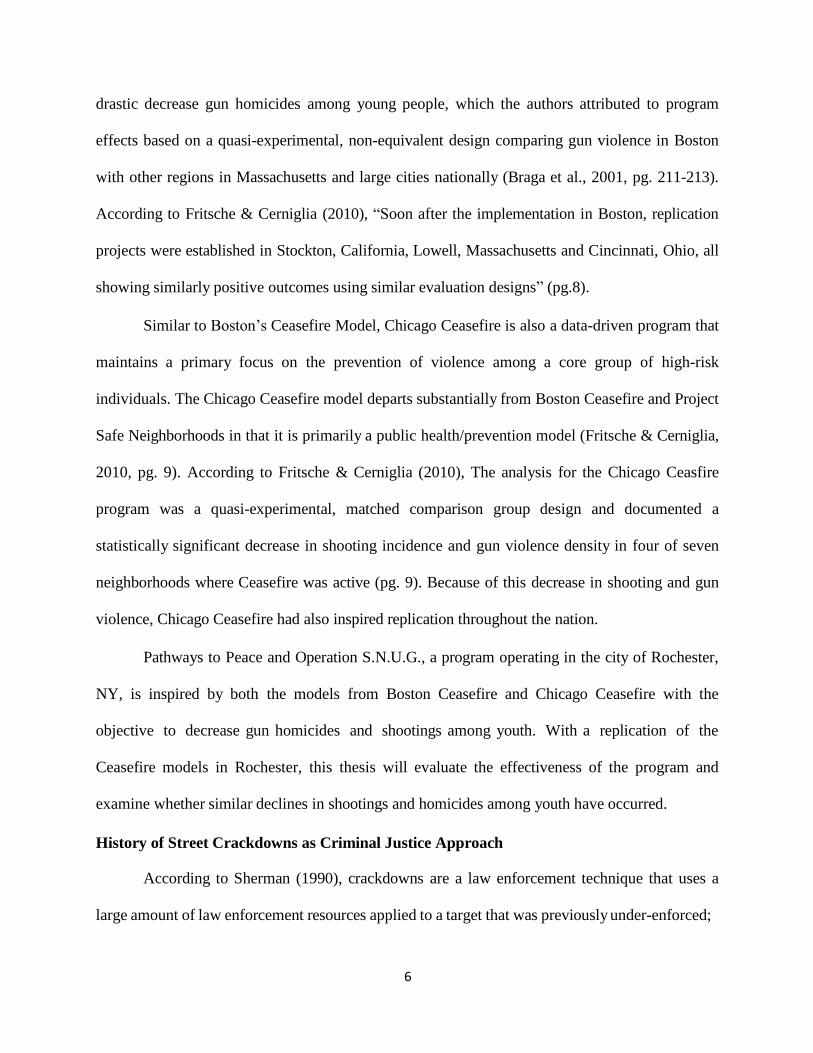
drastic decrease gun homicides among young people, which the authors attributed to program
effects based on a quasi-experimental, non-equivalent design comparing gun violence in Boston
with other regions in Massachusetts and large cities nationally (Braga et al., 2001, pg. 211-213).
According to Fritsche & Cerniglia (2010), “Soon after the implementation in Boston, replication
projects were established in Stockton, California, Lowell, Massachusetts and Cincinnati, Ohio, all
showing similarly positive outcomes using similar evaluation designs” (pg.8).
Similar to Boston’s Ceasefire Model, Chicago Ceasefire is also a data-driven program that
maintains a primary focus on the prevention of violence among a core group of high-risk
individuals. The Chicago Ceasefire model departs substantially from Boston Ceasefire and Project
Safe Neighborhoods in that it is primarily a public health/prevention model (Fritsche & Cerniglia,
2010, pg. 9). According to Fritsche & Cerniglia (2010), The analysis for the Chicago Ceasfire
program was a quasi-experimental, matched comparison group design and documented a
statistically significant decrease in shooting incidence and gun violence density in four of seven
neighborhoods where Ceasefire was active (pg. 9). Because of this decrease in shooting and gun
violence, Chicago Ceasefire had also inspired replication throughout the nation.
Pathways to Peace and Operation S.N.U.G., a program operating in the city of Rochester,
NY, is inspired by both the models from Boston Ceasefire and Chicago Ceasefire with the
objective to decrease gun homicides and shootings among youth. With a replication of the
Ceasefire models in Rochester, this thesis will evaluate the effectiveness of the program and
examine whether similar declines in shootings and homicides among youth have occurred.
History of Street Crackdowns as Criminal Justice Approach
According to Sherman (1990), crackdowns are a law enforcement technique that uses a
large amount of law enforcement resources applied to a target that was previously under-enforced;
7
with an intent to enhance deterrence of misconduct (pg. 2). “One of the most widespread
developments in American policing in the 1980s has been the “crackdown.” After watching public
behavior patterns among immigrant groups become increasingly disorderly, or at least a threat to
the status position of the earlier settlers, city after city in the nineteenth century created a full-time
uniformed police force (Sherman, 1990, pg. 1-2). Sherman stated that law enforcement activity by
independent marshals and constables at the time proved ineffective in decreasing felony arrests;
therefore, police bureaucracies developed a strategy that drastically increase the number of arrests
on minor crimes such as public disorder. Some examples of police crackdowns are 1984 New York
City’s Operation Pressure Point; 1985 Georgetown crackdown on public disorder; and 1986
Washington’s Operation Clean Sweep.
In 1985, the crackdown in Georgetown section of Washington D.C. focused on illegal
parking and disorder. According to Sherman (1990), the police crackdown emerged to control
street crime attracted by the underage drinking that increased due to the district’s low minimum
age for legal beer and wine drinking (pg. 15). The police use several tactics such as publicity to
announce its increased presence in the area, as well as increased vigilance with extensive arrests
for public disorder. Although the effect on crime was never scientifically proven, the overall
perception in the area by local residents was that he neighborhood was safer with less crime. They
also believed that the crackdown was still in effect even though the crackdown decayed a month
earlier (Sherman, 1990, pg. 17).
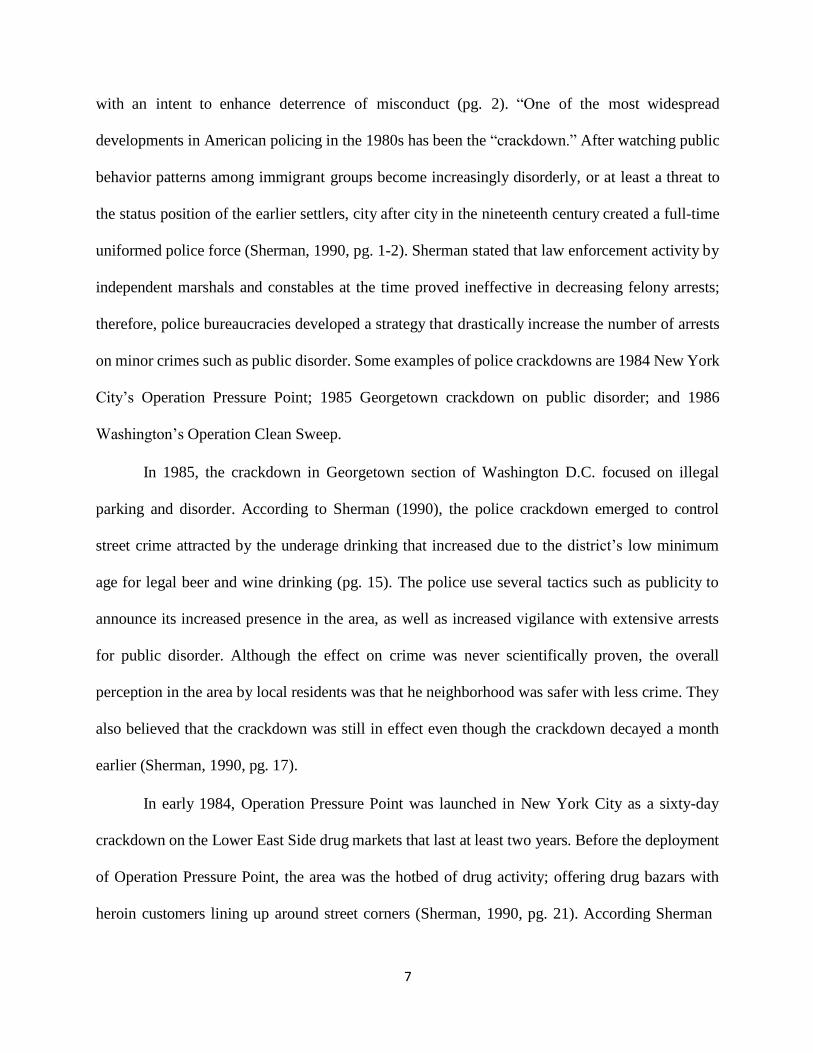
In early 1984, Operation Pressure Point was launched in New York City as a sixty-day
crackdown on the Lower East Side drug markets that last at least two years. Before the deployment
of Operation Pressure Point, the area was the hotbed of drug activity; offering drug bazars with
heroin customers lining up around street corners (Sherman, 1990, pg. 21). According Sherman
8
(1990), “The initial deterrent effect on robbery was a 47 percent reduction in 1984 compared to
1983, and a 62 percent reduction (from thirty-four to thirteen) in homicides during the same period.
This initial effect was maintained for at least the first eight months of 1986, with a 40 percent
reduction in robbery and a 69 percent reduction in homicide compared to the first eight months of
1983” (pg. 21). While the initial deterrent effect seem effective, researchers challenge the long-
term deterrence of the crackdown.
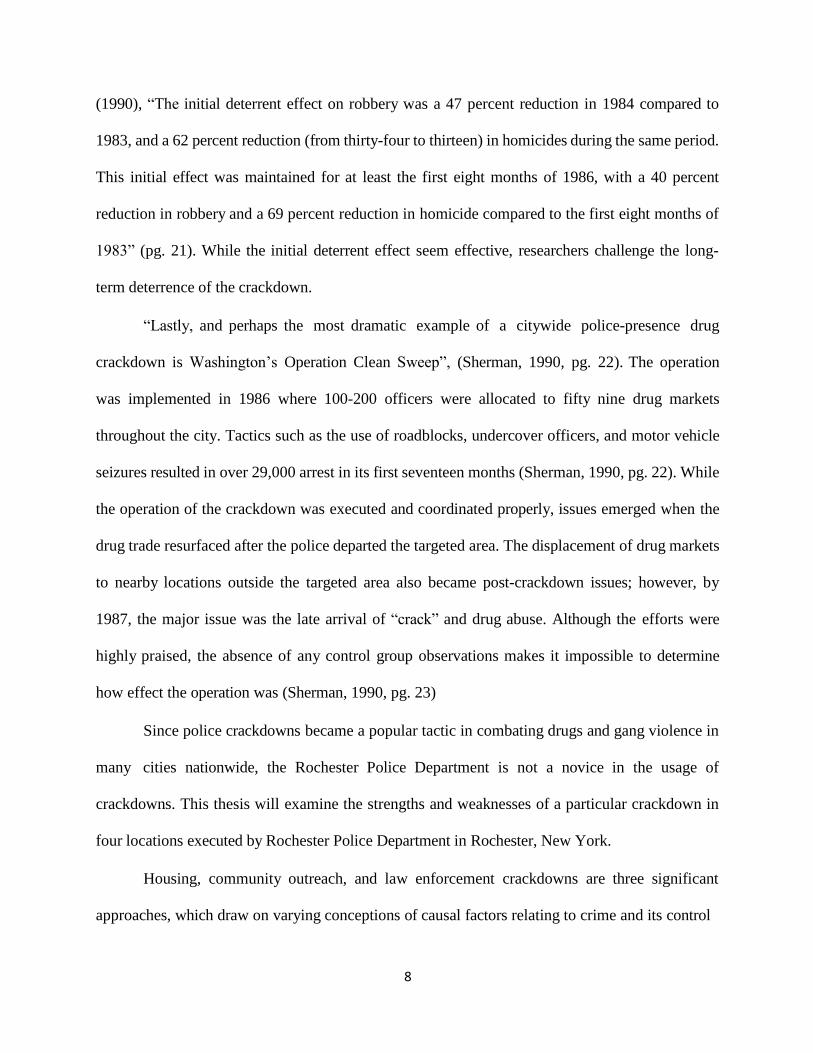
“Lastly, and perhaps the most dramatic example of a citywide police-presence drug
crackdown is Washington’s Operation Clean Sweep”, (Sherman, 1990, pg. 22). The operation
was implemented in 1986 where 100-200 officers were allocated to fifty nine drug markets
throughout the city. Tactics such as the use of roadblocks, undercover officers, and motor vehicle
seizures resulted in over 29,000 arrest in its first seventeen months (Sherman, 1990, pg. 22). While
the operation of the crackdown was executed and coordinated properly, issues emerged when the
drug trade resurfaced after the police departed the targeted area. The displacement of drug markets
to nearby locations outside the targeted area also became post-crackdown issues; however, by
1987, the major issue was the late arrival of “crack” and drug abuse. Although the efforts were
highly praised, the absence of any control group observations makes it impossible to determine
how effect the operation was (Sherman, 1990, pg. 23)
Since police crackdowns became a popular tactic in combating drugs and gang violence in
many cities nationwide, the Rochester Police Department is not a novice in the usage of
crackdowns. This thesis will examine the strengths and weaknesses of a particular crackdown in
four locations executed by Rochester Police Department in Rochester, New York.
Housing, community outreach, and law enforcement crackdowns are three significant
approaches, which draw on varying conceptions of causal factors relating to crime and its control
9
in local communities. Since, these three approaches all have different aspects in theories relating
to community improvement, addressing crime, and using community resources, each is outlined
in studies in the chapters that follow, and the results are summarized and reconsidered with regard
to public policy choices and future directions in chapter 5.
Chapter 2: Housing and Habitat for Humanity
Introduction
Housing and crime are important concepts in the macro-level study of criminal justice.
Housing programs are used throughout urban neighborhoods as part of intervention programs
addressing the issue of poor and unhealthy living conditions. For example, as crime becomes more
noticeable, law-abiding residents may seek assistance or decide to relocate. Therefore, housing
programs may improve living conditions by increasing the stability of neighborhoods. However,
criminologists remain concerned about the effectiveness and efficacy of housing programs as an
intervention to address crime.
This paper addresses several aspects of the relationship between housing and crime. First,
the history, procedures, and organization of a housing program called Habitat for Humanity will
be discussed. Second, there will be case study comparisons of private housing and public housing
with crime. Next, concepts derived from theories such as routine activity and defensible space will
be used to develop hypotheses regarding the relationship between Habitat for Humanity and crime.
Finally, there will be an analysis that will examine the effectiveness of Habitat for Humanity as an
intervention towards decreasing crime and consideration of public policy in light of the results.
History of Habitat for Humanity
Objective
10
Habitat for Humanity (HFH) is a nonprofit global organization created to unite people from
different backgrounds, races, and religions to work together with the goal of eliminating
inadequate living conditions. HFH has built over 350,000 houses worldwide and have expanded
up to 2,100 active affiliates in over 90 countries (Browning, 2006, p. 20; Habitat for Humanity
International Website 2010: http://wwww.habitat.org). In addition to renovating and constructing
homes, HFH relies on volunteer labor, donations, community support and other resources to
eradicate poor living conditions.
History
In 1968, Millard and Linda Fuller, along with Clarence Jordan developed the idea of
partnership housing to address the issue of inadequate housing for the poor. Discussions about the
goals, methods, and funding for HFH arise as they envision a successful project that may expand
internationally. In 1973, the Fullers decided to implement HFH for developing countries such as
one in Mbandaka, Zaire. By 1976, the Fullers returned to the United States and organized a meeting
to expand HFH internationally. This meeting was the base for the future progress and success of
Habitat for Humanity International.
The Levels of Organization
There are three levels of organization for Habitat for Humanity: international regional, and
local. The first level is Habitat for Humanity International (HFHI); their operational headquarters
are located in Americus, Georgia. HFHI’s Board of Directors consisted of 27 active community
leaders and members who form policy and oversee the operations of HFH (2006, p. 23). There are
also other divisions within this organization such as the advisory board and Support Service
division that monitors and regulates the training, administration, communication, and development
necessary in making HFH more effective (Browning, 2006, p. 23).
11
The second level is Habitat for Humanity Regional Centers and Area Offices that closely
supervise other branches worldwide; these branches include regions in North America, Asia,
Europe, Africa, Middle East, and Latin America. In the United States, HFH is divided into five
areas with 2,200 local affiliates that regulate their method of operation to ensure that guidelines
are met (Browning, 2006, p. 24).
The third level of HFH is the more individual affiliates known as local branches. Although
their methods of operation in construction and renovation of homes varies, the main principles,
goals, and guidelines still apply. For example, one local affiliate in a different area may choose to
renovate the whole block or neighborhood, whereas a different local affiliate may choose to
construct or renovate individual houses in different blocks or neighborhoods. Though construction
methods vary across different local affiliates, the methods are regulated by the founding principles
of HFH; that selling homes for profit is prohibited, as well as charging interest on home mortgages.
There are limitations concerning the amount of money spent on a home and the purposes in the
use of accepted government funds. All houses are built by local branches of HFH while being
regulated by regional centers. The international level of HFH, however, provides the necessary
guidelines and principles for all HFH branches to follow.
Flower City Habitat for Humanity (FCHH) is a prime example of a local chapter. This
chapter was created for the city of Rochester and has adapted many different methods of
neighborhood revitalization. These methods range from building individual houses in different
blocks to building cluster of houses within one block.
Flower City Habitat for Humanity
Flower City Habitat for Humanity was founded by Roger and Barbara Cross in 1984. In
1985, the first lady, Roselyn Carter dedicated the first habitat house in Rochester to one family.

12
This developed one of the first community services where neighbors got together to address
poverty issues by rebuilding the community. Since 1984, HFH of Flower City have developed
and renovated over 141 homes in Rochester in response to the poverty of a certain location known
as “The Crescent”. “The Crescent” refers to a small section of Rochester known for high amounts
of homicide and other violent crimes. Eleven percent of the homes that were built during 1990 to
2000 in Rochester are by Habitat for Humanity (Flower City Habitat for Humanity: Website: http://
rochesterhabitat.org/). Flower City Habitat for Humanity (FCHH) aims to decrease poverty and
revitalize troubled neighborhoods throughout the city of Rochester. This organization relies on the
support of thousands of volunteers, faith-based communities, and businesses located throughout
Monroe County (Flower City Habitat for Humanity: Website: http:// rochesterhabitat.org/). FCHH
targets the most troubled areas and select vacant lots to build one and two story houses. FCHH are
rarely involved in foreclosure and demolitions of old or abandoned houses.
One of the most successful projects of large-scale construction by FCHH is a one-way
street called Cuba Place. This project began in 1998 where HFH decided to construct eleven new
homes in Cuba Place, a street that was suffering from open-air drug markets and other crimes.
They also replaced or added new lights, curbs, and sidewalks in an attempt to revitalize the area
while discouraging drug activity. Since then, Flower City of HFH aim their projects at
impoverished and rundown areas, to revitalize the community within those areas and provide
service and shelter to those suffering from poor live-quality conditions.
Neighborhood Selection
For HFH, neighborhood selection is decided by the local chapters due to geographical
preferences. Since FCHH cannot demolish any dilapidated homes and replace them with their new
homes, they generally choose an area with the highest amount of vacant lots. However, FCHH
13
needs permission from the city to build on these lots (Hoffman, Sue, 2011, Personal Comm.). This
is the only authorization FCHH needs to begin their construction and neighborhood revitalization
process.
Construction Methods
HFH emphasizes their methods of construction as ‘simple, decent, and affordable’; this is
the guideline principle used to produce sufficient houses that adapt to the climate, culture, and
community (Habitat for Humanity International Website 2010: http://wwww.habitat.org). The
houses that are built for these low-income families are moderately sized. HFH balances the needs
of the families with the cost and time needed for construction (Browning, 2006, p. 21). In the local
chapter, FCHH previously built two story homes but shifted to building only one-story homes as
a quick and cost efficient method. HFH also has guidelines that dictate the maximum amount of
square feet that can be used; a three-bedroom house may not exceed 1,050 square feet of living
space (Browning, 2006, p. 21; Habitat for Humanity International Website 2010:
http://www.habitat.org). For families who have disabilities, HFH provide additional accessibility
features without the additional cost.
House Payments and Resources
HFH and FCHH rely on a unique method of house payments such ‘sweat equity’ to quicken
the pace of home construction. ‘Sweat equity’ is when a Habitat homebuyer contributes about 450
hours in the construction phase of Habitat houses. The 450 hours in the construction phase consists
of building yours and other HFH participant’s homes. Prior training in home construction are not
required. HFH will provide the training and resources for applicants to complete their sweat equity
requirement. Other contributors involve churches, professionals, and other corporations, such as
Home Depot, who provide valuable tools and equipment (Browning, 2006, p. 21). No-interest
14
loans, low down payments, and ‘sweat equity’ are the unique features HFH offers for
homeownership. Affiliates and their requirements for homeownership varies throughout the nation
ranging from ‘sweat equity’ as sufficient down payment to low down payments from $250-$800
(Browning, 2006, p. 21). According to Browning, this allows the homebuyers to save up funds for
house payments; the amount of these house payments are designed for the homeowners
themselves, thus, making house payments possible (2006, pg. 21). Other affiliates require
minimum closing cost payments. The payments received from the homeowners are used to cover
construction costs and efforts to construct more Habitat houses, therefore, making HFH a non-
profit social-service organization (Habitat for Humanity International Website, 2010:
http://wwww.habitat.org).
In Flower City, Habitat for Humanity offers a variety of ways to assist residents with home
payments. First, FCHH recommends people who are interested in owning homes of FCHH to
attend the homeownerships information meetings held twice a month. In the meeting, they will
receive basic information on FCHH and given the opportunity to fill out an application. FCHH
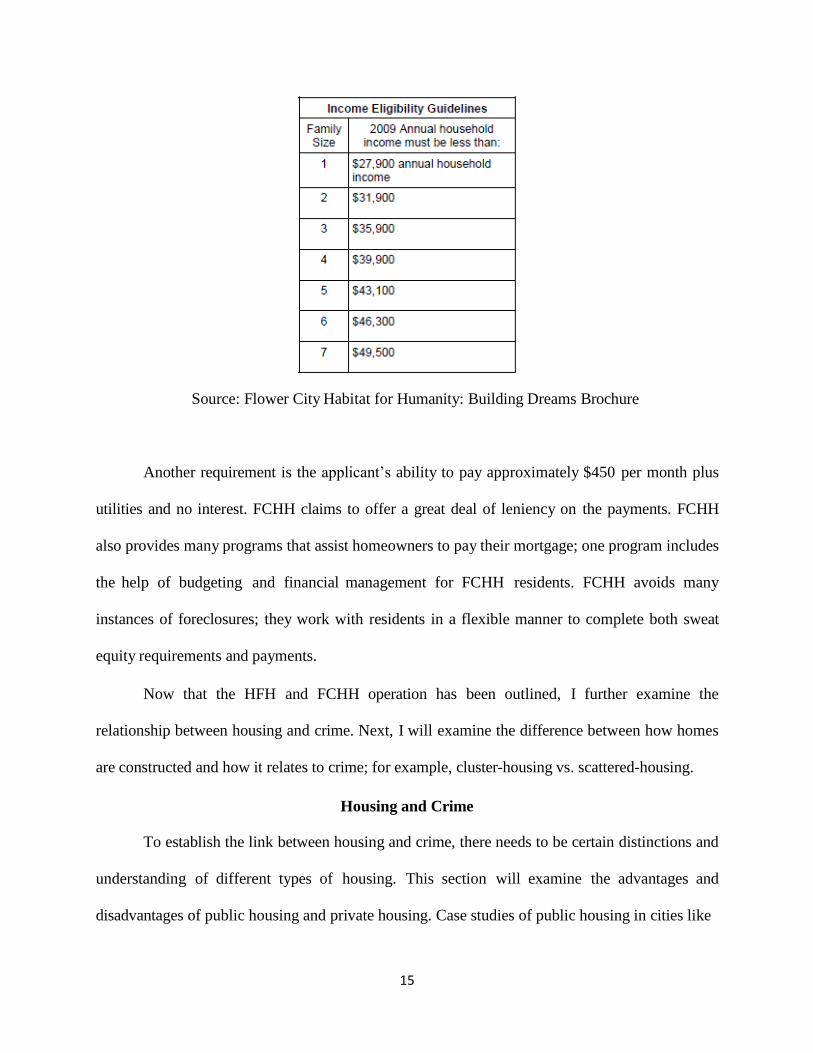
will review these application and determine who’s qualified by looking at three criteria: income,
sweat equity, and monthly payments. Below is the chart of eligible income range by family size.
15
Source: Flower City Habitat for Humanity: Building Dreams Brochure
Another requirement is the applicant’s ability to pay approximately $450 per month plus
utilities and no interest. FCHH claims to offer a great deal of leniency on the payments. FCHH
also provides many programs that assist homeowners to pay their mortgage; one program includes
the help of budgeting and financial management for FCHH residents. FCHH avoids many
instances of foreclosures; they work with residents in a flexible manner to complete both sweat
equity requirements and payments.
Now that the HFH and FCHH operation has been outlined, I further examine the
relationship between housing and crime. Next, I will examine the difference between how homes
are constructed and how it relates to crime; for example, cluster-housing vs. scattered-housing.
Housing and Crime
To establish the link between housing and crime, there needs to be certain distinctions and
understanding of different types of housing. This section will examine the advantages and
disadvantages of public housing and private housing. Case studies of public housing in cities like
16
Chicago, Illinois and Denver, Colorado will show certain disadvantages of public housing while
the case study of private housing in cities such as Wilmington, Delaware, will show advantages of
private housing. First and foremost, public housing and private housing needs to be defined and
compared to understand why these advantages and disadvantages exist.
Public Housing and Private Housing
Public housing can be considered as the rental of a dwelling in a high-rise apartment
complex or single family home. Public housing requires assistance from the federal, state, or local
agencies. An example of public housing would be the project-based Chicago high-rise apartments
consisting of multiple floors and clustering of multiple tenants. Private housing is considered as
private contractors or any programs that act on its own behalf for their residents For example, HFH
would be considered as private housing because they act on their own behalf to assist their residents
with local programs and services. HFH would not be considered as public housing in this study
because it does not rely on any funds from any federal, state, or local agency and that they are
private philanthropists. Finally, HFH are considered as private housing because they offer private
solutions such as ‘sweat equity’ to residents in the neighborhood.
Disadvantages of Public Housing
High-rise apartments as public housing have been the most common solution for low cost
residency for many decades. Moving into the twenty-first century, many researchers have come to
realize the disadvantages of public housing within the community. One of the huge disadvantages
in public housing is the congregation of multiple families. The congregation of families may make
them feel powerless and helpless due to the lack of space and homeownership. This feeling of
helplessness from residence may form low expectations and high neglect towards the area which
may allow criminal behavior to persist in the neighborhood. Also, when multiple families are
17
grouped together, their property is also group together; this can make the targets more appealing
for property crime. With the high density of targets in one area the concentration of poverty, crime
may likely to occur. This will be furthered discussed in the routine activity theory section below.
Case Study in Public Housing: Chicago, IL
The study of public housing in Chicago presents many clear examples of the disadvantages
of high rise public housing such as poor security, low quality housing, neglect of maintenance,
and poor informal social control. According to Popkins et al. (1995), the high rise public housing
in Chicago was developed as a temporary solution for the working class. The construction of these
buildings was intended to be quick, cheap, and closest to the city to provide quick access from
home to work. However, with the change in government policies and income limits, the working
class established themselves elsewhere, leaving the poorest tenants in the area. For these poor
residents, the temporary solution of a home became their long term or permanent residence.
“Conditions in most public housing developments are now substantially worse than they were a
decade ago. In most cities, public housing is completely racially segregated, and the residents are
isolated from the surrounding community” (Popkins et al., 1995, p. 75).
One issue with public housing is how it can create racial boundaries between
neighborhoods. When built in clusters, gangs and violence may also arise. According to Hagedorn
and Rauch (2007), “In the 1950s, Chicago’s mayor Richard J. Daley had refused to build public
housing for the Black population in integrated areas and packed public housing into the ghetto that
“reinforced the city’s racial boundaries” (p. 448). Segregation and racial boundaries can lead to
gangs such as Black Gangster Disciples, a pre-dominantly African American gang in Chicago.
Since gangs became the solution for the sense of belonging and protection by many young adults
and drugs became the source of income for many tenants, violence became the response if
18
aggression was needed to protect the drug offender’s goods. Eventually the occupancy of gangs
and use of drugs will make these public housing structures a hub for drug trafficking and other
crimes (Popkins et al., 1995, p. 75). These crimes further the deterioration of the facility and the
area around it. It also makes it more difficult for law enforcement to intervene and access the high
rise housing for calls for service because of gang territory.
The second issue is if these clusters of public housing are demolished, gangs might be
displaced into other neighborhoods and cause violence to other nearby areas. For example, in
Chicago, when the Black Gangster Disciples’ public housing units were demolished and their top
ranking warlords were arrested, the rest of the gang turned the nearby area into a warzone because
there was no other effective gang to protect that area (Hagedorn and Rauch, 2007, p. 450).
The third disadvantage of public housing is the poor structure of the facility because it
limits the amount of access for law enforcement. When there are multiple floors occupied with
gang members, police are often in serious danger when responding to a call for service in the
building. This danger creates a fear where law enforcement would rather not enter the building or
wait for reinforcements for safer entry into the building.
The fourth disadvantage in public housing is the design. According to Merry (1981), the
interior of the high-rise apartments are poorly designed because the slab walls and secluded areas
make it difficult to monitor all spaces. Corridors, elevators, staircases, and hallways lack visibility
from the outside or appropriate lighting. Merry (1981), states that since neighbors and tenants of
the apartments are more likely to encounter strangers than in smaller, lower buildings, the awful
security design in high-rises make these encounters very dangerous. Even though some elevators,
stairways, and hallways may be equipped with cameras, it may prove useless because it indirectly
responds to the crime and only offers assistance after the crime has been committed.
19
Case Study in Public Housing: Louisville, KY
In another study regarding public housing and crime in Louisville, Kentucky, Suresh and
Vito (2009) explain how poor minorities are trapped in the inner city by real estate professionals
who play as the “gatekeepers” limiting the choices of geographical inhabitation through racial
character (p. 412). The residents of these public housing units are usually “the poorer, younger,
and more likely to be headed by single-female heads of the household” (Popkins et al., 1995, p.
75). Furthermore, the stereotype of poor minorities living in public housing reinforces the idea for
real estate professionals to choose who should reside where. This stereotype and “trapping effect”
deprive minorities and low-income families the ability to move elsewhere other than the city.
Efforts to revitalize public housing often fail due to the lack of acknowledging the appropriate
response to social disorganization, poverty, and racial segregation in the area.
Case Study in Public Housing: Denver, CO
A study by Santiago et al. (2003) determined the correlation between increase in various
types of crime and the development of 38 dispersed public housing units in Denver, Colorado
during 1992-1995. The combination of an econometric model and the pre/ post-test was used to
evaluate the statistical relationship between dispersed housing and crime. The results from the
statistical analysis shows that “dispersed public housing had no correlation with any increase in
reported crime of the post-test; these crimes include violent, property, disorderly conduct, and
criminal mischief” ( Santiago et. al, 2003, p. 2148) . The limits to this study include the lack of
information about the occupants of units and collective efficacy of the area both before and after
the Denver Housing Authority development. “Collective efficacy is defined as mutual trust and
solidarity among neighbors combined with the willingness of local residents to intervene on behalf
of the common good” (Kingston et al., 2009, p. 56). According to Kingston et al (2009),
20
“neighborhoods with weak social networks and low level of collective efficacy often lacks the
resources, social support, and informal social controls that are essential for proper healthy youth
development” (p. 55). Therefore, solid conclusions about causation cannot be made. Even though
the results show no correlation, the information on how the study was conducted should not be
ignored.
Housing Type: Advantages of Private Housing
Private housing offers many amenities such as homeownership and commitment to the
neighborhood that public housing lacks. The availability of lots, however, determines when private
housing can be established in the neighborhood.
As opposed to public housing, some researchers may perceive private housing as
disadvantageous because it requires larger amounts of available lots. While space may be valuable
and costly, space and housing lots are usually not scarce in a poor community. Open lots and
demolition of deteriorating homes often provide open lands for the city to develop further plans
on its use. The Neighborhood Service Center in Rochester shows, “As of April 2010 there were
approximately 1800 vacant lots within the Northeast Quadrant, by far more than any other area
within the city of Rochester. Furthermore there are over 950 vacant buildings, 126 of which are
currently on the City’s Demolition list” (Northeast Quadrant Strategic Plan of Rochester). The
Northeast Quadrant in Rochester primarily comprises of zip code areas 14621 and 14605. In this
case, private housing may be more beneficial because available space is being utilized effectively.
High density of impoverished areas motivate local organizations to take actions to fill
vacant lots. With the increase availability of open lots, the hopes of increased private housing and
homeownership will replace the open grounds filled with loitering and delinquents. Increases in
21
land and homeownership may decrease the density of the impoverish neighborhoods, change crime
rates, and bring stability to the area.
Case Study in Private Housing: Wilmington, DE
Browning (2006) conducted a study by looking at two distinct differences between the two
Habitat for Humanity neighborhoods in Wilmington, Delaware; one area consisted of scattered-
pattern of Habitat homes and the other with clustering of units. The question asked is if the
geographical patterns of home construction within the neighborhood increase social
improvements. The methods of analysis comprise a qualitative approach through interviews along
with the comparison of scatter housing versus dispersed housing. Results in the study show that
areas with dispersed Habitat housing have no effect in lowering crime within or beyond the
neighborhood boundary. In fact, many residents of Habitat for Humanity felt that crime increased
around their property. The area with compact units of Habitat homes generated minor
improvements in the social aspect of the area. The minor improvements are residents’ sense of
safety and homeownership rates but not so much on crime. Although, the clustered placement
method of homes may prove valuable when it comes to residents’ perception, it showed no major
improvement relating to crime beyond the neighborhood’s boundary.
The limitation of this study was the small sample size. With only twenty five households
used in the analysis, the sample size may have disregarded important information. Also, the
amount of years Habitat homeowners lived in that area may have determined their responses in
the interview. A homeowner who lived there for less than 5 years may not know the neighborhood
quite as well. Also, some people choose not to answer questions about how they felt towards the
Habitat for Humanity program.

22
In light of the literature, measuring housing type and geographical patterns are essential in
determining what housing methods are more effective. In general, public housing may cost less
money and space, but creates the likelihood of gangs, drugs, and violence in the dwelling due to
the structure, design, and concentration of people. In addition to gangs, drugs, and violence,
clustered public housing solidifies even more racial segregation and tension. Dispersed public
housing, however, had no correlation with any increase in reported crime.
Private housing may cost more money and space, but depending on whether the housing
units are dispersed or clustered, it may have no effect in decreasing crime or generating minor
improvements in residential safety. Now that we have framed the relationship between housing
and crime, I will examine theories on criminal behavior, such as routine activity theory and rational
choice theory.
Theories
Criminological theories provide a fundamental basis for hypotheses regarding the impact
of private housing, such as Habitat for Humanity construction, on local crime patterns. Although
the hypotheses developed from the theories are not always consistent, it shows that the prediction
of crime prior and after HFH construction is highly dependent upon the theoretical framework..
Routine activities theory (RAT) and defensible space will be examined as the basis of the theories
to determine the impact of HFH. It should be noted that there are many theories, such as social
disorganization theory that can be used in this theoretical framework, however, routine activity
theory will be a simpler fit and provide a more straightforward premise.
Routine Activity
“The rise in crime is often attributed to the increases in those willing to break the law—a
group that Cohen and Felson called “motivated offenders.”(2010, pg. 2). Cohen and Felson (2010),
23
stated that with the presence of a motivated offender, the availability of criminal opportunity
escalates with the availability of an attractive target (e.g., something to steal, a person to rob) and
the lack of guardianship over the target (e.g., a burglar alarm, a burly companion) (pg.2).
Therefore, “the probability of being a victim of crime increase with the convergence in space and
time of three factors, motivated offender, suitable targets, and the absence of capable guardians”,
(Kennedy and Barron, 1993, p. 92 ). However, Kringen and Felson (2014) elaborates on this
routine activities theory by distinguishing guardians, or handlers, who supervise motivated
offenders and guardians who supervise suitable targets. Crime facilitators were also introduced in
the mix such as drugs, alcohol, lock picks, and other tools that may aid criminal activity (pg.4).
Routine Activities of Places
Reynald and Elffers (2009) states that “Places, just like people, have routine activities that
also determine their risk of becoming crime targets. The routine activities of a place can be viewed
as ‘the social organization of behavior at a particular place’, which is affected by the accessibility
of the place and, in turn, affects the efficacy of guardianship therein.” “Routine activities of places,
in combination with defensible space theory, share the same principle that opportunities for crime
are dependent as much on the types of activities that occur in an area as on the environmental
characteristics of a place”, (Reynald and Elffers, 2009, pg.16)
By examining six neighborhoods with variation of low and high-crimes in Atlanta,
Georgia, Massey et al. (1989), hypothesized and concluded that the major connection between
increased property crime and routine activity theory is determined by the increased appearance of
affluence and decrease in defensible space of a neighborhood. He also stated that the increase in
24
property value and residential composition of the neighborhood can also factor in the likelihood
of making a house a suitable target.
In theory, private housing such as Habitat for Humanity increases the property value for
residents because they provide new housing for the neighborhood. If property value increases, it
can potentially increase property crime because these new homes are suitable targets. However,
we must examine the theory of defensible space because the amount of defensible space may
change the direction of this theory.
Defensible Space
Reynald and Elffers (2009), states that the concept of defensible space draws on
accessibility, land-use patterns, and routine activity of place. They reviewed and illuminated Oscar
Newman’s defensible space theory by highlighting territoriality, natural surveillance, and the
image/milieu of the neighborhood. The theory suggests that the increase in territoriality, natural
surveillance, and better image/mileu of the neighborhood will decrease the likelihood of crime.
Decrease in territoriality and natural surveillance means decrease in control and influence in that
area. A good example of poor territoriality is vacant lots. Poor image/milieu of the neighborhood
reflects that area as isolated, dilapidated, and neglected. These factors can lead to the increase of
crime in the neighborhood.
Shu (2000) confronts Oscar Newman’s theory of defensible space by addressing the issue
of “the accessibility of housing layout (spatial configuration of open spaces) and the relative
vulnerability of property crimes, such as burglary, vandalism, and car crimes” (pg. 1). He
hypothesized that property crime increases due to “unconstitutedness, global segregation, fewer
line neighbors, and cul-de-sac networks, formed by cul-de-sac carriageways because it leads to
spatially broken-up areas. He asserts that “constitutedness, higher line neighbors, and cul-de-sac
25
networks with many front entrances of line neighbors facing each other will have a decrease in
property crime” (pg. 11).
To link the defensible space theory with private housing and Habitat for Humanity, it can
be theorized that private housing may increase territoriality and natural surveillance by increasing
the amount of homeowners in the area. The more homeowners there are in the area, the more
capable guardians are available consistent with Routine Activities Theory. Thus, the HFH
environment may make Routine Activity Theory’s protective mechanism of guardianship more
effective.
Private housing also improves the image/milieu of the area because the old dilapidated
homes are replace by new ones. However, if these new houses are built in cul-de-sac networks and
segregated areas with low line of neighbors or broken-up area, it can potential increase property
crimes.
Hypothesis
Private housing such as Habitat for Humanity increases property value; however, it also
increases defensible space for the specific lots available in the area. They often build in networks
and streets that have homes facing each other. Depending on if Habitat for Humanity build their
new homes in a clustered method or a scattered method mentioned in the Housing and Crime
section of this paper, we can hypothesize:
H0: There is no correlation
H1: Clusters of private homes increases violent, property, and disorderly offenses
The reason why this hypothesis can be stated is because of the routine activity theory. Since
new homes have higher property value, a cluster of new houses can provide property offenders the
“suitable target” because all the suitable targets are grouped together.
26
Another explanation for the increase in property crime is that, “As the number of people in
a social space increases, so does the potential for competition, conflict, and disaffection, all of
which may lead to crime and delinquency. This explains that deprivation causes people to be
desperate and motivates them to seek fulfillment of their needs and aspirations outside the lawful
order” (Wells & Weisheit, 2004, p. 4).
H0: There is no correlation
H2 : Cluster of private houses decrease violent, property, and disorderly offense
The reason why this hypothesis can be stated is because of the defensible space theory.
Clusters of private homes can revitalize the whole neighborhood by providing the entire area with
improved territoriality, natural surveillance, and image/mileu. Because private houses are built in
clusters, this eliminates the possibility of vacant lots and increases the amount of homeowners in
the area. If everyone owns property, are content, and are not deprived of new housing, then there
may be a decrease in crime.
H0: There is no correlation
H3 : Scattered private houses increases violent, property, and disorderly offense
The reason why this hypothesis can be stated is because of defensible space theory.
Although private housing improves territoriality, natural surveillance, and image/milieu, these
factors only apply to that specific lot where the house was constructed because of the scattered-
housing method. Old dilapidated houses and vacant lots in the same neighborhood or street will
still attract crime because it has poor territoriality, natural surveillance, and image/mileu. The new
property now attracts property criminals because it is a suitable target and the dilapidated areas
surrounds it.
Analysis
27
Variables
The independent variable is Habitat for Humanity and dependent variable is property
crime. The type of crime being used for the study are property crime and violent crime. Property
crime used in this study includes robberies, burglaries, motor vehicle thefts, and grand larcenies.
Violent crime includes simple assaults, aggravated assaults, homicides, and rapes. Property crime
and violent crime are being used because it is highly correlated to housing through routine activity
theory and defensible space.
Data collection
Crime data, demographic information, and the intervention method (time of FCHH home
construction) are the key elements in this study. Property crime, violent crime, and disorderly
crime will be used was provided by Monroe Crime Analysis Center from the Rochester Police
Department. The intervention method used in the data analysis are 2005 Flower City Habitat
homes. The use of 2005 FCHH homes allow the study to examine years of crime before and after
the intervention phase. This intervention period will allow the study to be flexible in examining
how many years of crime should be used. Three zip code areas that contain Flower City Habitat
for Humanity’s (FCHH) homes will be evaluated in this study; these zip code areas are 14611,
14605, and 14609. FCHH constructed four new homes in 14611, one in 14605, and two in 14609;
a total of seven new homes were constructed in 2005. The addresses of all FCHH homes are
provided on the FCHH website. Areas around randomly sampled control houses will also be used
in the study for comparison with areas around FCHH homes. Random sample houses are selected
randomly in the same zip code area with FCHH homes.
Methods and Testing
28
The main analysis is to compare the amount of property and violent crimes within a 1000ft
buffer distance of random sample housing to Habitat homes to show if FCHH have an effect in the
neighborhood. Three zip codes will be used because it is necessary to examine more than one area
for an effective analysis. The unique feature in the study is the different construction methods of
FCHH in the three zip code areas; 14611 contains 4 Habitat homes in a clustered pattern; 14605
contains 2 Habitat homes that are relatively dispersed, and 14609 contains only 1 Habitat home.
The comparison of crime in three zip code areas may show which method of FCHH construction
and housing pattern is more effective in impacting the neighborhood. The use of multiple random
sample houses and Habitat houses in different locations within three different zip code areas will
offer flexibility in choosing variables for comparison. The other aspect of the analysis is the use
of pre-test post-test. Three years of Part 1 crime before and after the intervention period will be
evaluated to see if there was any increase or decrease. Three years pre-test and three years post-
test were chosen because it is adequate to show an accurate time frame of crime trends around
FCHH homes due to the relative infrequent nature of crime as measured in small areas, such as
this examination This will show if FCHH was successful or unsuccessful in decreasing crime.
ArcGIS was utilized to map out the addresses of crime location, HFH homes, random
sample homes, census block boundaries, zip code boundaries, and buffered zones. Buffered zones
are areas within a circular boundary with the target at its midpoint. In the maps, the midpoint are
Habitat homes and the circular boundaries created is the 1,000ft buffers. A 1,000ft buffer is being
used to measure where the impact of crime will dissipate from if a crime occurs within a close
proximity of the midpoint.
Below are maps of zip code area 14605, 14609, and 14611. It presents a visual image that
will more clearly illustrate the data setup. The yellow triangles represent Habitat for Humanity
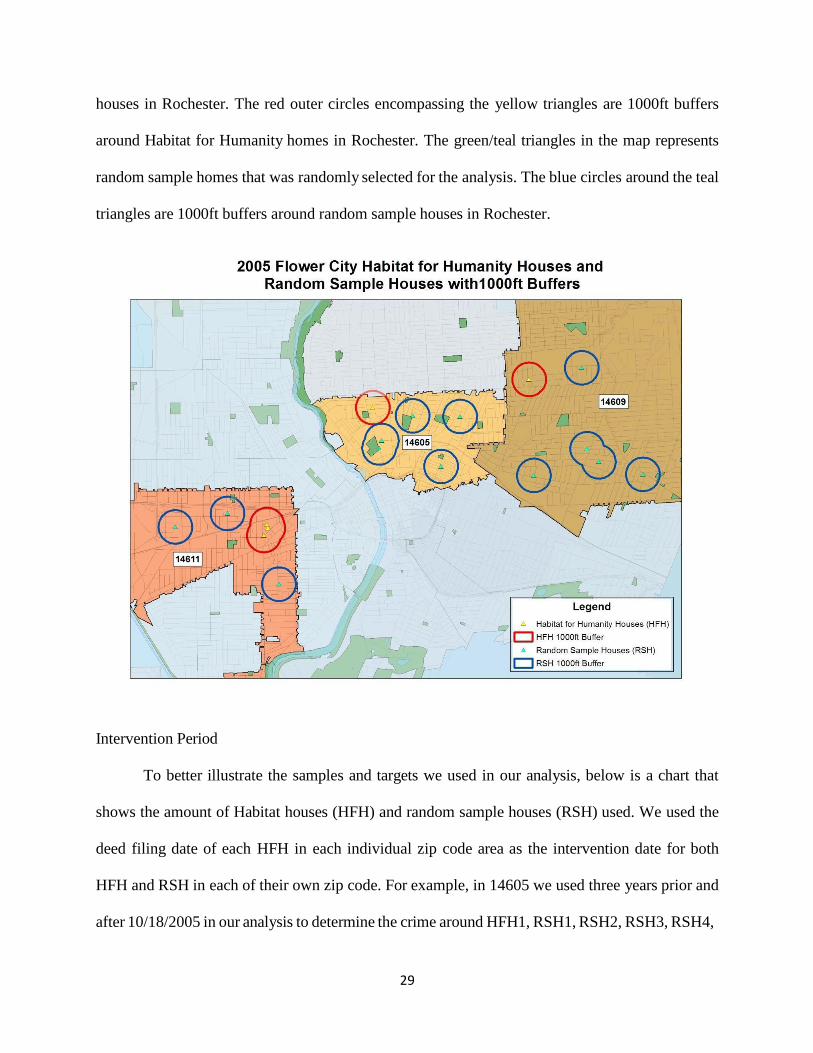
29
houses in Rochester. The red outer circles encompassing the yellow triangles are 1000ft buffers
around Habitat for Humanity homes in Rochester. The green/teal triangles in the map represents
random sample homes that was randomly selected for the analysis. The blue circles around the teal
triangles are 1000ft buffers around random sample houses in Rochester.
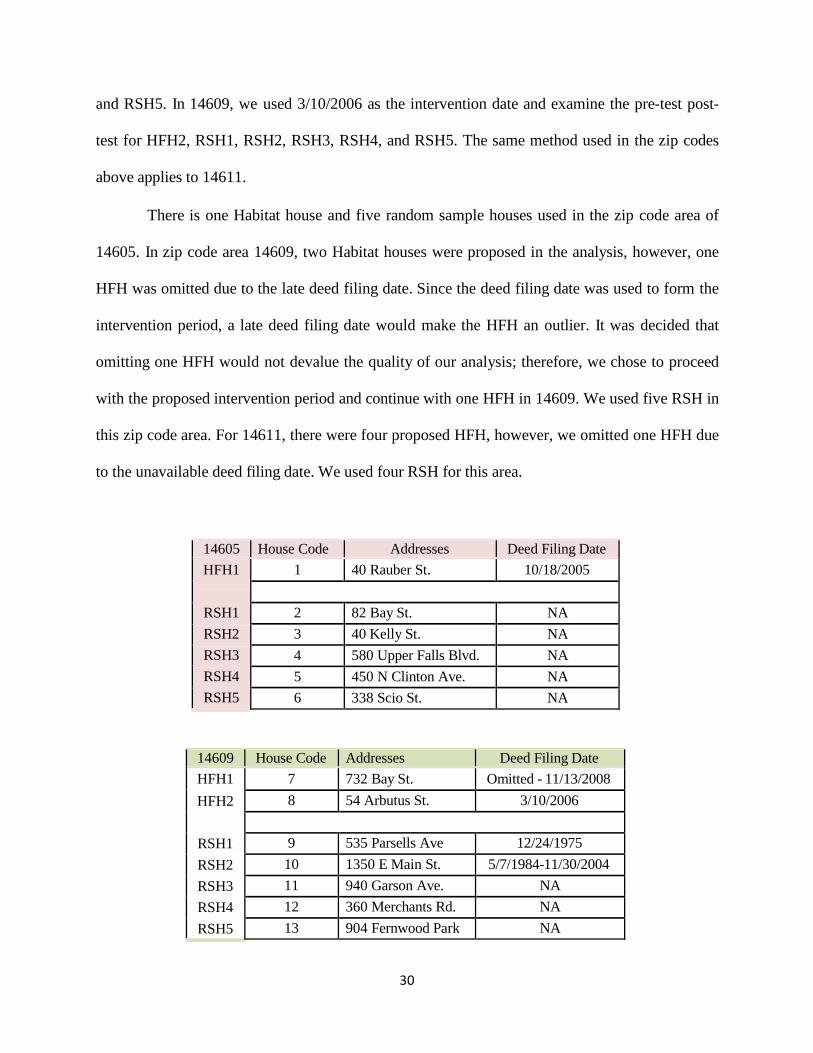
Intervention Period
To better illustrate the samples and targets we used in our analysis, below is a chart that
shows the amount of Habitat houses (HFH) and random sample houses (RSH) used. We used the
deed filing date of each HFH in each individual zip code area as the intervention date for both
HFH and RSH in each of their own zip code. For example, in 14605 we used three years prior and
after 10/18/2005 in our analysis to determine the crime around HFH1, RSH1, RSH2, RSH3, RSH4,
30
and RSH5. In 14609, we used 3/10/2006 as the intervention date and examine the pre-test post-
test for HFH2, RSH1, RSH2, RSH3, RSH4, and RSH5. The same method used in the zip codes
above applies to 14611.
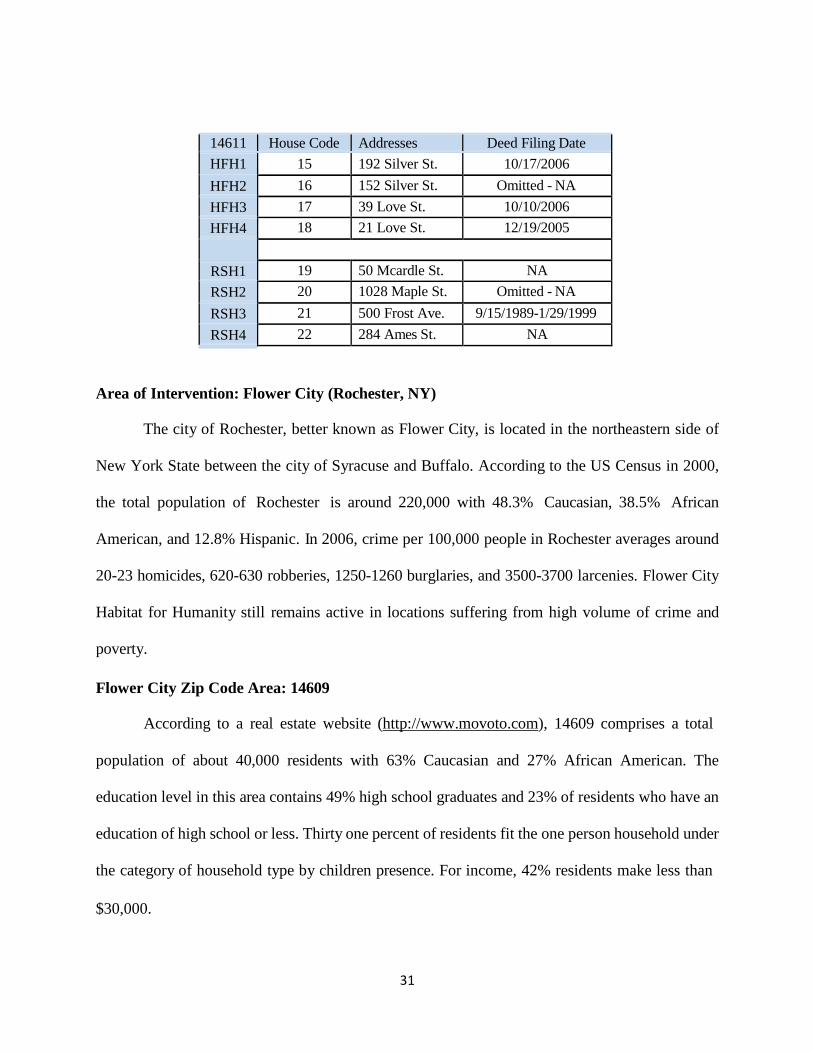
There is one Habitat house and five random sample houses used in the zip code area of
14605. In zip code area 14609, two Habitat houses were proposed in the analysis, however, one
HFH was omitted due to the late deed filing date. Since the deed filing date was used to form the
intervention period, a late deed filing date would make the HFH an outlier. It was decided that
omitting one HFH would not devalue the quality of our analysis; therefore, we chose to proceed
with the proposed intervention period and continue with one HFH in 14609. We used five RSH in
this zip code area. For 14611, there were four proposed HFH, however, we omitted one HFH due
to the unavailable deed filing date. We used four RSH for this area.
14605 House Code Addresses Deed Filing Date
HFH1
RSH1
RSH2
RSH3
RSH4
RSH5
1 40 Rauber St. 10/18/2005
2 82 Bay St. NA
3 40 Kelly St. NA
4 580 Upper Falls Blvd. NA
5 450 N Clinton Ave. NA
6 338 Scio St. NA
14609 House Code Addresses Deed Filing Date
HFH1 7 732 Bay St. Omitted - 11/13/2008
HFH2 8 54 Arbutus St. 3/10/2006
RSH1
9 535 Parsells Ave 12/24/1975
RSH2 10 1350 E Main St. 5/7/1984-11/30/2004
RSH3 11 940 Garson Ave. NA
RSH4 12 360 Merchants Rd. NA
RSH5 13 904 Fernwood Park NA
31
14611 House Code Addresses Deed Filing Date
HFH1 15 192 Silver St. 10/17/2006
HFH2 16 152 Silver St. Omitted - NA
HFH3 17 39 Love St. 10/10/2006
HFH4 18 21 Love St. 12/19/2005
RSH1
19 50 Mcardle St. NA
RSH2 20 1028 Maple St. Omitted - NA
RSH3 21 500 Frost Ave. 9/15/1989-1/29/1999
RSH4 22 284 Ames St. NA
Area of Intervention: Flower City (Rochester, NY)
The city of Rochester, better known as Flower City, is located in the northeastern side of
New York State between the city of Syracuse and Buffalo. According to the US Census in 2000,
the total population of Rochester is around 220,000 with 48.3% Caucasian, 38.5% African
American, and 12.8% Hispanic. In 2006, crime per 100,000 people in Rochester averages around
20-23 homicides, 620-630 robberies, 1250-1260 burglaries, and 3500-3700 larcenies. Flower City
Habitat for Humanity still remains active in locations suffering from high volume of crime and
poverty.
Flower City Zip Code Area: 14609
According to a real estate website (http://www.movoto.com), 14609 comprises a total
population of about 40,000 residents with 63% Caucasian and 27% African American. The
education level in this area contains 49% high school graduates and 23% of residents who have an
education of high school or less. Thirty one percent of residents fit the one person household under
the category of household type by children presence. For income, 42% residents make less than
$30,000.
32
Flower City Zip Code Area: 14605
According to a real estate website (http://www.movoto.com), 14605 comprises a total
population of about 14,000 residents with 17% Caucasian and 59% African American. The
education level in this area contains 41% high school graduates and 48% of residents who have an
education of high school or less. Twenty eight percent of residents fit the one person household
under the category of household type by children presence. For income, 74% residents make less
than $30,000.
Flower City Zip Code Area: 14611
According to a real estate website (http://www.movoto.com), 14611 comprises a total
population of about 19,000 residents with 23% Caucasian and 69% African American. The
education level in this area contains 50% high school graduates and 35% of residents who have an
education of high school or less. Thirty three percent of residents fit the one person household
under the category of household type by children presence. For income, 64% residents make less
than $30,000.
Results
Violent Crimes
A standard T-test was used to determine if the increases or decreases in violent crime in
each of the three zip codes are statistically significant. Shown in the chart below, the color blue
with a minus symbol under "significant" shows a decrease in violent crime while the color red with
the plus symbol shows an increase in violent crime. The color gray with no symbols shows no
statistical significance.
The only results that show statistical significance is the decrease in violent crime in the
area around one random sample house (RSH5) in 14605; the increase in violent crime in the area
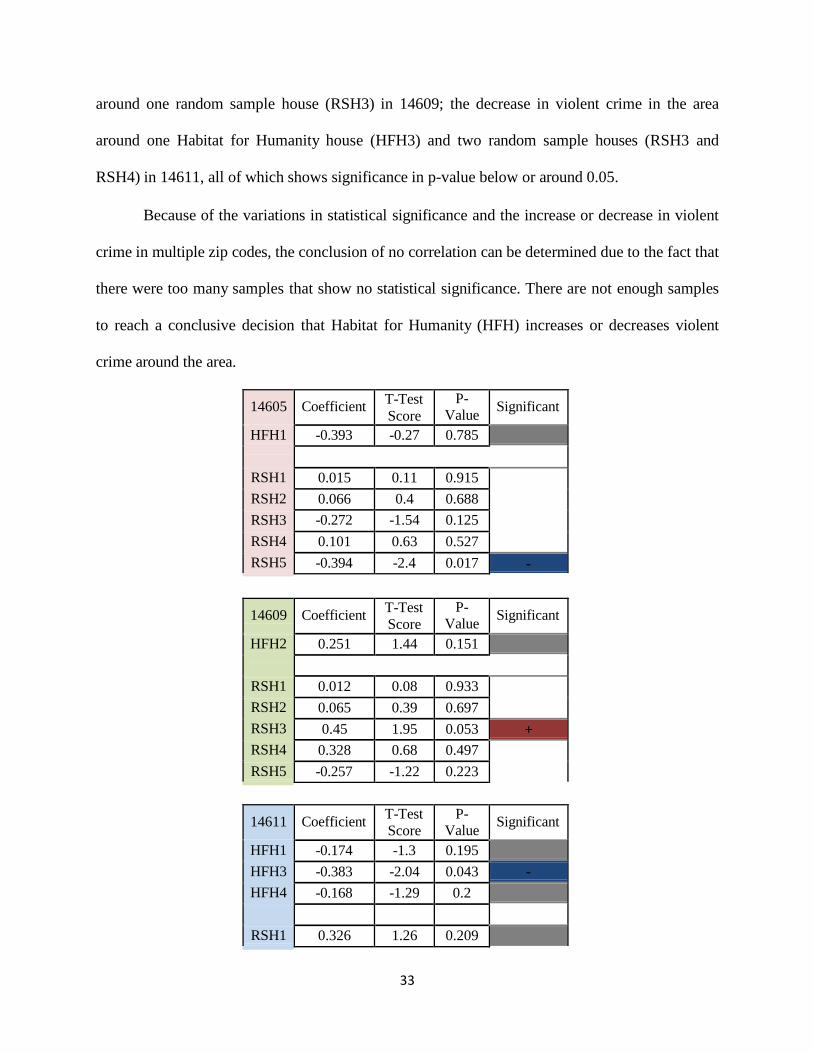
33
around one random sample house (RSH3) in 14609; the decrease in violent crime in the area
around one Habitat for Humanity house (HFH3) and two random sample houses (RSH3 and
RSH4) in 14611, all of which shows significance in p-value below or around 0.05.
Because of the variations in statistical significance and the increase or decrease in violent
crime in multiple zip codes, the conclusion of no correlation can be determined due to the fact that
there were too many samples that show no statistical significance. There are not enough samples
to reach a conclusive decision that Habitat for Humanity (HFH) increases or decreases violent
crime around the area.
14605 Coefficient T-Test
Score
P- Value
Significant
HFH1
RSH1
RSH2
RSH3
RSH4
RSH5
-0.393 -0.27 0.785
0.015 0.11 0.915
0.066 0.4 0.688
-0.272 -1.54 0.125
0.101 0.63 0.527
-0.394 -2.4 0.017 -
14609 Coefficient T-Test
Score
P- Value
Significant
HFH2
RSH1
RSH2
RSH3
RSH4
RSH5
0.251 1.44 0.151
0.012 0.08 0.933
0.065 0.39 0.697
0.45 1.95 0.053 +
0.328 0.68 0.497
-0.257 -1.22 0.223
14611 Coefficient T-Test
Score
P- Value
Significant
HFH1
HFH3
HFH4
RSH1
-0.174 -1.3 0.195
-0.383 -2.04 0.043 -
-0.168 -1.29 0.2
0.326 1.26 0.209
34
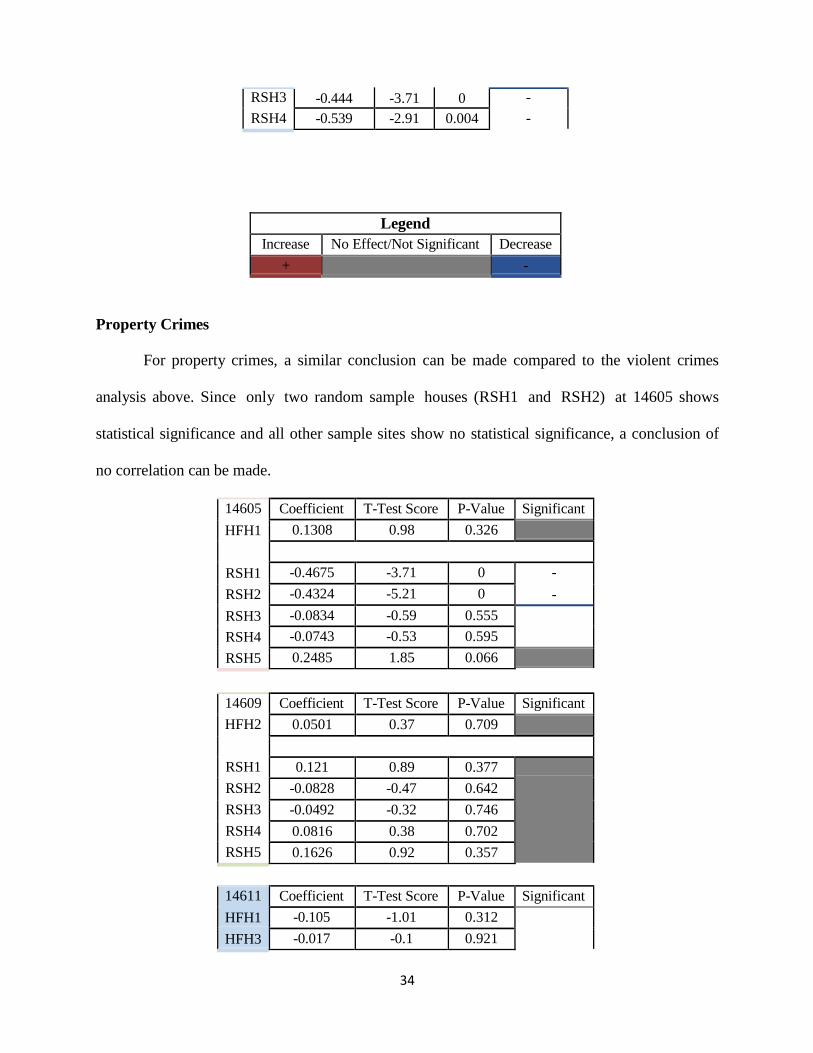
RSH3
RSH4
-0.444 -3.71 0 -
- -0.539 -2.91 0.004
Legend
Increase No Effect/Not Significant Decrease
+ -
Property Crimes
For property crimes, a similar conclusion can be made compared to the violent crimes
analysis above. Since only two random sample houses (RSH1 and RSH2) at 14605 shows
statistical significance and all other sample sites show no statistical significance, a conclusion of
no correlation can be made.
14605 Coefficient T-Test Score P-Value Significant
HFH1 0.1308 0.98 0.326
RSH1
-0.4675 -3.71 0 -
RSH2 -0.4324 -5.21 0 -
RSH3 -0.0834 -0.59 0.555
RSH4 -0.0743 -0.53 0.595
RSH5 0.2485 1.85 0.066
14609
HFH2
RSH1
RSH2
RSH3
RSH4
RSH5
Coefficient T-Test Score P-Value Significant
0.0501 0.37 0.709
0.121 0.89 0.377
-0.0828 -0.47 0.642
-0.0492 -0.32 0.746
0.0816 0.38 0.702
0.1626 0.92 0.357
14611
HFH1
HFH3
Coefficient T-Test Score P-Value Significant
-0.105 -1.01 0.312
-0.017 -0.1 0.921

35
HFH4 0.013 0.11 0.909
RSH1
RSH3
RSH4
-0.283 -1.5 0.134
-0.22 -1.62 0.108
0.029 0.19 0.852
Legend
Increase No Effect/Not Significant Decrease
+ -
Conclusion
Since the impact of housing from Habitat for Humanity show no correlation in decreasing
crime within the vicinity of the project area, it doesn't necessarily mean that housing is not effective
in improving quality of life. It does make housing more affordable for low income families and
brings economic advantages within that community. New housing may also improve the image of
the area; however a new independent study should closely examine this theory and study if Habitat
for Humanity (HFH) houses that were built in a clustered fashion in multiple zip codes are more
effective.
One might argue that the cluster of Habitat for Humanity (HFH) houses built in 14611
decrease violent crime because there were three samples that show statistical significance.
However, this is inconclusive due to the fact that there isn't another sample from another zip code
that can be compared with 14611. Another study in different cities is suggested to arrive at a
conclusion whether clustered-built housing is effective at decreasing violent crime.
Overall, the use of G.I.S. and crime analysis to examine the impact housing have on crime
shows it’s an effective tool that uses geography in evaluating the causation of intervention and the
area where crime occurs. It also demonstrates the spatial factors that attribute to the effectiveness
36
of scattered versus clustered housing. For example, we can quickly see that 14611 have clusters of
HFH houses versus 14605 and 14609 which has scattered houses.
Since Habitat for Humanity show no correlation in decreasing crime, there are other
approaches such as community outreach that can be evaluated to determine its effectiveness in
combating crime. Operation SNUG is one of the outreach programs in New York State designated
to targeted juvenile delinquency and gang violence through the use of non-profit organizations to
prevent crime
Chapter 3: Community Outreach and Operation SNUG
Operation SNUG
Operation S.N.U.G. (Stop, Never Use Guns) is modeled after the highly successful Cease
Fire Gun Violence Prevention Model currently used in Chicago. That program directs targeted
outreach and prevention efforts to “high risk” communities, and works through existing and
experienced community-based organizations. Through coordinated efforts between police,
counselors, and community outreach specialists, this model has helped cut violence in Chicago,
and has reduced the risk of “retaliation” murders, and helped students remain in schools and find
jobs as they detach from gang life. According to Skogan et al. (2008), Cease Fire’s interventions
are “theory driven” and is built upon a coherent theory of behavior that emphasizes norms, risks,
and choices (pg.1-1). For operations in client or community outreach, possibly the most successful
elements of the program was identifying and providing counseling and services to individual
clients (Skogan et al., 2008, pg. ES9). Cease Fire will serve as a voluntary advisory to Operation
SNUG-qualified programs.
37
Operation S.N.U.G is statewide anti-violence initiative that works with local civic,
religious and law enforcement officials to get illegal guns off the streets and to reduce killings and
violence. Operation SNUG was born out of gun violence in Senator Malcolm A. Smith’s
community when, within a three-day span in May of 2008, the Far Rockaway Peninsula became a
violent battleground with five men shot and two teenagers killed. Following these shootings, an
initial “summit” of elected officials was held, led by Senators Smith, Eric Adams, Bill Perkins,
Congressman Charles Rangel, Assemblyman Darryl Towns, and Brooklyn District Attorney
Charles Hynes. Operation SNUG stands for:
S: Street intervention and stopping the violence
• violence interrupters and outreach to high-risk youth
• support for and coordination with police and law enforcement
• clearly communicating community values against shootings and violence
• engaging schools and educators as part of the solution
N: National, state and local funding support
• funding for all alternatives
• legislation to help implement solutions
• public and private support for intervention and prevention as part of the
response
U: Use of celebrities and centers
• development of a comprehensive public relations effort, including celebrity
PSAs and materials
• reopening and revitalization of existing community centers, creation of new
bunkers and community “safe haven” storefronts for youth
38
G: Gangs, guns, gainful employment
• real-world gang awareness and prevention initiatives
• new efforts to stop the spread of illegal guns, including new law enforcement
efforts targeting “middlemen” and gun-running
• connections to employment and economic alternatives
There are 10 Operation SNUG programs across New York State:
Operation SNUG Albany- University of Albany School of Social Welfare / Trinity
Alliance
Operation SNUG Buffalo- Community Action Organization of Erie County
Operation SNUG Brooklyn - Man Up!
Operation SNUG Harlem - New York City Mission Society
Operation SNUG Mt. Vernon - Ujamaa Community Development Corp.
Operation SNUG Niagara Falls- People and Possibilities
Operation SNUG Queens - King of Kings Foundation
Operation SNUG Rochester: Pathways to Peace
Operation SNUG Syracuse- New Justice Services
Operation SNUG Yonkers - Yonkers YMCA.
*Information gathered was provided by Malcolm A. Smith on
http://www.nysenate.gov/press-release/senators-malcolm-smith-gustavo-rivera-and-rev-
al-sharpton-joined-community-and-civic-l
Pathways to Peace – Rochester, NY
Pathways to Peace (PTP) is street level team of outreach workers in Rochester which
guides young city residents toward an array of community resources to prevent youth violence and
39
gang involvement. Inspired by the famous Boston’s Operation Night Light, Pathways to Peace
emerged into the community due to the increased numbers of youth who are resorting to violence
as a means to obtain their goals. The City recognizes a critical need to provide them with
nonviolent alternatives. Pathways to Peace was initiated as part of a comprehensive effort to
improve public safety. The PTP team reaches out into targeted neighborhoods to assess the needs
of youth, network with all available resources and link at risk youth to appropriate services.
Pathways mainly focuses on various sections of the city that requires youth-related dispute
mediation, intervention, gang-involvement, violence prevention. The PTP’s primary goal is
reducing youth related violence.
In collaboration with police, counselors, and other community organizations, Pathways to
Peace was granted funding to inform awareness of illegal gun possession and protect at-risk
Rochester youth from gun violence. Through the use of street-team patrols, neighborhood
broadcasting, and other various methods of gun prevention awareness, Pathways to Peace and
other community organizations hope that Operation SNUG will decrease youth-related gun
violence through Differential Association theory.
Theory
Differential Association
In criminology, Differential Association theory emphasizes the connection between crime,
behavior, and social interaction. Edwin Sutherland, one of the most influential criminologists and
sociologists, believed that criminal behavior and motivation for crime are learned through
interaction, communication, and expression of general needs (Williams & McShane, 2010).
Sutherland’s theory excludes certain types of interaction and communication when it comes to
learning criminal behavior. He states that a relationship between agents must exist and that
40
criminal behavior cannot be completely accomplished through entertainment; for example,
watching television or reading newspapers. However, the learning of noncriminal behavior applies
in the same way. Pathways to Peace and Operation SNUG argue that techniques such as social
interaction and communication will motivate juveniles and other youths to learn noncriminal
behavior; therefore, leading youths away from the use of violence and firearms.
Similar to Differential Association theory, Pathways to Peace and Operation SNUG have
essential components in motivating youths into noncriminal behavior. These components include
outreach to high-risk youths, development of relationship with the community, and gang violence
awareness. The implementation of these components hopes to build relationship with youths and
create role models for these youths to look up to. As important as role models are to youths, we
assume that all youths are affected by Differential Association theory. The problem is that we
assume all juveniles learn criminal behavior through social interaction and communication,
therefore, they are also able to learn noncriminal behavior through different sets of social
interaction and communication. Another problem is the level of relationship between two agents
determines the level of behavior learned. For example, a youth will learn more behavior from
whoever he or she is closest to. In order for Pathways to Peace and Operation SNUG to be
successful in connecting with the youths, they will have to be closely attached to the youths so that
they are able to determine them as appropriate role models.
Analysis
The analysis in this report will examine the rate of shootings, robberies, and homicides
surrounding outreach areas, patrol service areas, and zip code areas before and after the
implementation of S.N.U.G. The objective of this analysis is to determine if our actions to
intervene will likely decrease gun-related crimes in the “hot” areas of Rochester. The “hot” areas

41
will be further discussed in the “Location” section of this chapter. The first objective was to
examine the numbers of shootings, robberies, and homicides in the targeted outreach areas of
SNUG. After compiling the gun-related crimes in the outreach areas, the second objective was to
determine the number of gun-related offenses in the patrol service areas and zip code areas
surrounding the targeted outreach areas. After determining the number of gun-related incidents in
the targeted outreach areas, patrol service areas, and zip code areas, we are then able to examine
the relationship between crime rates in the three types of areas.
Since the pre-test post-test method was used in the analysis, 3 years and 3 months (total of
170 weeks) was determined as the appropriate time span for analysis. Time intervals of 2 years
and 8 months (139 weeks) before and 3 months (13 weeks) after the date of the intervention were
used. A total of 4 months (18 weeks) was the time span of SNUG implementation. Only 13 weeks
of post-test was used in the analysis because of possible diminishing effectiveness from
intervention. Since time series data are being used on relatively rare events, an autoregressive
Poisson model was used to correlate weekly crimes in the pretest and posttest phase of the analysis.
The autoregressive Poisson (ARPois) relates the probability of random or rare events, such
as crime, occurring in an interval of time and the probability is dependent on the length of interval.
For example, if homicides at a certain location occurs once or twice but occasionally occurs three
or more times, ARPois will show what is the probability that homicide will occur in the next time
period. The regression model takes into account that there is a trend and works to remove that
trend so that we can contrast pre-intervention and post-intervention. In distinction, a normal
distribution was not used because its assumptions do not fit the rare occurring crime data as well
as the Poisson distribution.
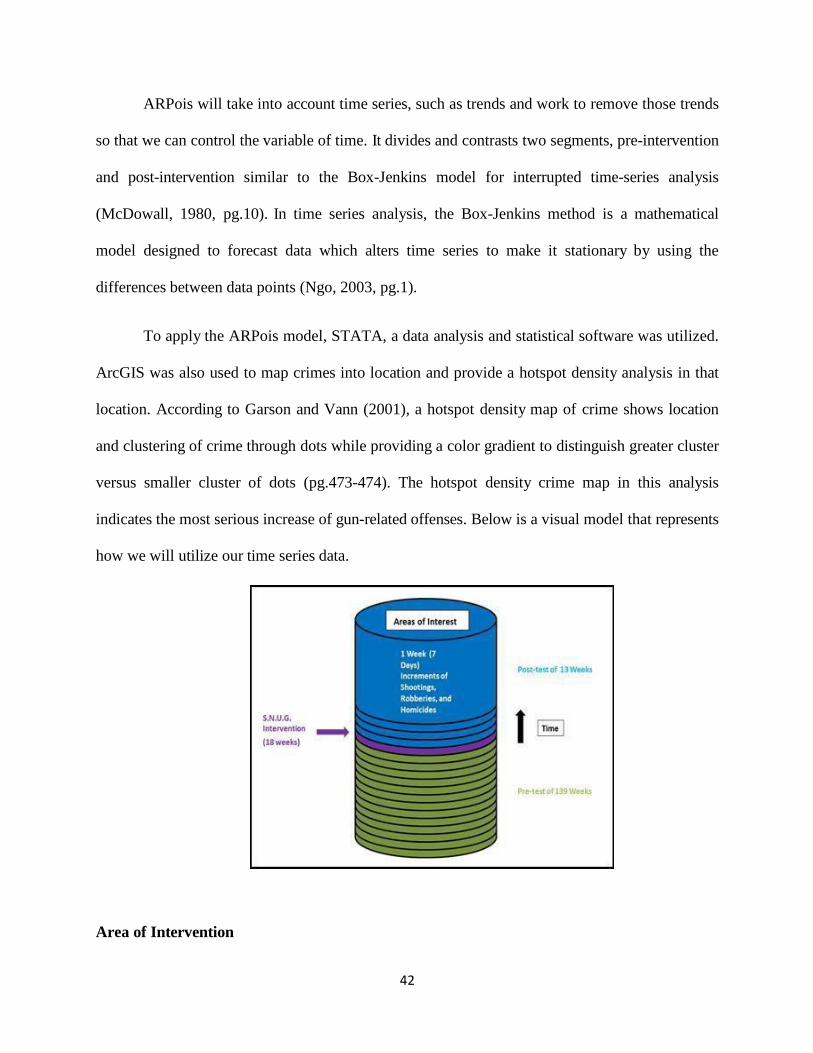
42
ARPois will take into account time series, such as trends and work to remove those trends
so that we can control the variable of time. It divides and contrasts two segments, pre-intervention
and post-intervention similar to the Box-Jenkins model for interrupted time-series analysis
(McDowall, 1980, pg.10). In time series analysis, the Box-Jenkins method is a mathematical
model designed to forecast data which alters time series to make it stationary by using the
differences between data points (Ngo, 2003, pg.1).
To apply the ARPois model, STATA, a data analysis and statistical software was utilized.
ArcGIS was also used to map crimes into location and provide a hotspot density analysis in that
location. According to Garson and Vann (2001), a hotspot density map of crime shows location
and clustering of crime through dots while providing a color gradient to distinguish greater cluster
versus smaller cluster of dots (pg.473-474). The hotspot density crime map in this analysis
indicates the most serious increase of gun-related offenses. Below is a visual model that represents
how we will utilize our time series data.
Area of Intervention

43
Pathways to Peace utilizes Operation SNUG in three distinct locations in the northern
section of Rochester. Three outreach areas were determined as the appropriate location to
implement SNUG and street-level team patrols. The targeted outreach areas are marked in the
map below in red lines. The blue lines indicate patrol service areas boundaries that surrounds and
contains these targeted outreach areas. The black lines indicate zip code area boundaries that
surround the patrols service areas and targeted outreach areas. The areas that are light red are areas
of interest in this analysis.
The second map below displays the location of homicides and shootings prior to the SNUG
intervention in the northern section of Rochester. As indicated in the map, the red lines are the
boundaries of targeted outreach areas and the area with light red shading is the area of interest in
this analysis. The blue triangles represents homicides. There were a total of 26 homicides from
January 2008 to August 2010 in the areas of interest. The areas of interest includes zip code areas

44
(14621 & 14613) and patrol service areas (PSA 23, 24, 25, & 44). The yellow to red color schemes
represent the hotspots of shootings in the areas of interest. Yellow is color coded as low increase,
orange as medium increase, and red as high increase. As you can see, the targeted outreach areas
contains many shooting hotspots, therefore, these locations were selected for intervention.
The third map below displays the location of homicides and robberies prior to the SNUG
intervention in the northern section of Rochester. Again, the red lines are the boundaries of targeted
outreach areas and the area with light red shading is the area of interest in this analysis. The blue
triangles represents homicides. The yellow to red color schemes represent the hotspots of robberies
in the areas of interest. Yellow is color coded as low increase, yellow to orange is low to medium
increase, orange as medium increase, orange to red as medium to high increase, and red as high
increase. As can be seen, the targeted outreach areas contains many robbery hotspots. From the
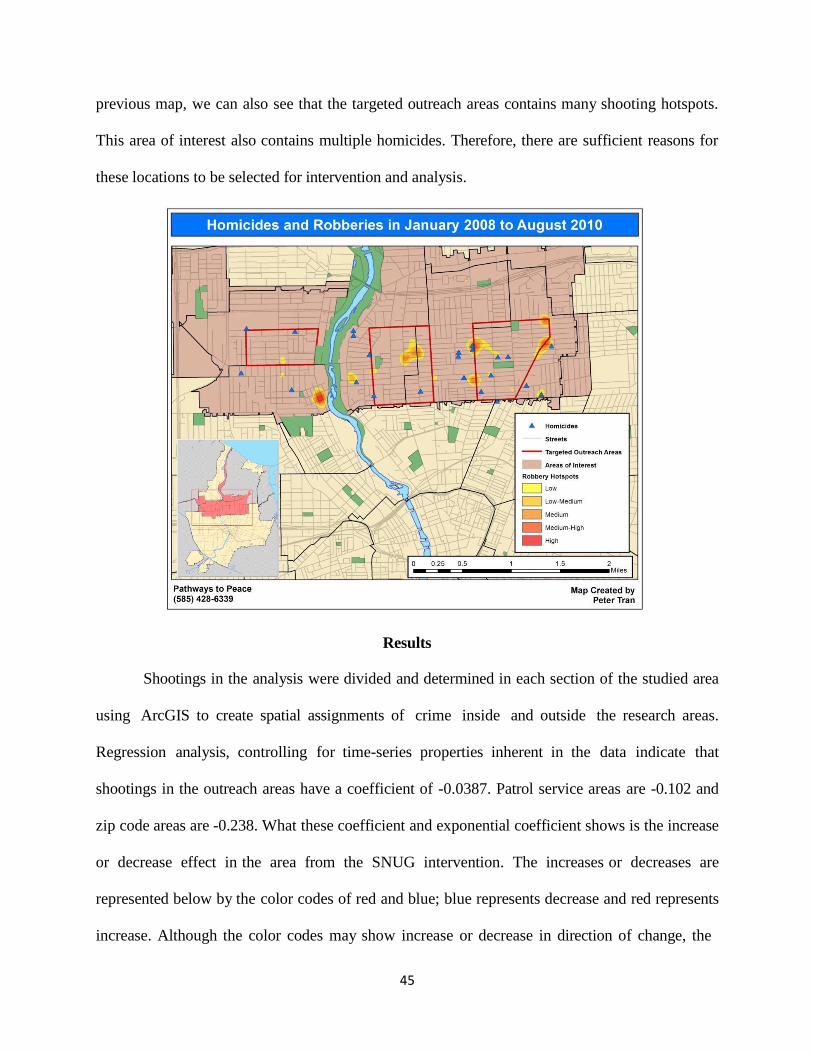
45
previous map, we can also see that the targeted outreach areas contains many shooting hotspots.
This area of interest also contains multiple homicides. Therefore, there are sufficient reasons for
these locations to be selected for intervention and analysis.
Results
Shootings in the analysis were divided and determined in each section of the studied area
using ArcGIS to create spatial assignments of crime inside and outside the research areas.
Regression analysis, controlling for time-series properties inherent in the data indicate that
shootings in the outreach areas have a coefficient of -0.0387. Patrol service areas are -0.102 and
zip code areas are -0.238. What these coefficient and exponential coefficient shows is the increase
or decrease effect in the area from the SNUG intervention. The increases or decreases are
represented below by the color codes of red and blue; blue represents decrease and red represents
increase. Although the color codes may show increase or decrease in direction of change, the

46
numbers below shows that SNUG had little or no effect on the shootings in the outreach areas,
patrol service areas, and zip code areas. Compared to the shootings in the outreach area, the
shootings in the surrounding patrol service areas and zip code areas seem to be lower than the
shootings in the targeted outreach areas. However, we have to keep in mind that these figures are
not statistically significant. This insignificance in variation shows us that the increase or decrease
of these crime are not conclusively correlated to the SNUG intervention.
Outreach Areas -0.038715 0.139883 0.0782945
Patrol Service Areas -0.102631 0.047423 -0.011173
Zip Code Areas -0.238069 -0.03125 -0.09742
Robberies in the analysis seem to have increased a bit in the outreach areas from the table
above. Compared to the robberies in the outreach areas, robberies in the patrol service areas and
zip code areas seem to be somewhat lowered. Again, we have to take into consideration that these
figures are statistically insignificant. The increase or decrease of robberies may not be directly
affected by SNUG and that there may be chances of coincidences or other variables. However, the
expectation from the theory behind implementation would predict some positive (decrease in
crime) effect from SNUG if the program, as implemented, had the theoretical expected effect.
Compared to the shootings and robberies data, homicides in the analysis were intriguing.
From the first observation, we believed that SNUG had a huge impact on decreasing homicides
due to the fact that in the 4 months of the SNUG intervention, we found out that there were no
homicides in the outreach areas. This observation led us to examine the number of homicides in
the areas around the targeted outreach areas such as patrol service areas and zip code areas. We
found out that there were also no homicides in the patrol service areas and zip code areas
surrounding the outreach areas during the 4 months of SNUG intervention. Since the comparison
47
between targeted outreach areas, patrol service areas, and zip code areas may lead us to believe
that SNUG was effective in decreasing homicide, we had to take in to consideration the frequency
of homicides. Although homicides are the most prominent crime because of its nature, it does not
happen often. The pretest phase of approximately 2 and a half years in the analysis shows that
there were only 8 homicides in the targeted outreach areas. With the low frequency of homicides,
we determined that it was necessary to examine the number of weeks in a row without homicides
prior to the SNUG intervention. After examining the number of weeks in a row without homicides
prior SNUG, we found out that there were similar time spans that also had no homicides. Prior to
SNUG, we found that there were some time spans of 20-37 weeks that had no homicides in the
outreach areas. The SNUG operation consisted of 18 weeks without homicides in the outreach
areas. Therefore, it is safe to say that SNUG is unlikely to be a measureable direct cause of decrease
in homicide, but a general decrease due to chance or “homicides at its lows”. It is with appropriate
caution to argue that homicides are so low in frequency that we are unable to definitively analyze
the 18 week impact.
In total, we see that the targeted outreach areas faced a higher amount of total crimes
compared to the surrounding patrol service areas and zip code areas, mainly because of the increase
in robberies. However, it is inconclusive that SNUG had a direct impact on the increase or decrease
in shootings, robberies, and homicides. What can be concluded is the ability to reexamine the
possible strategies of the SNUG intervention.
Conclusion
The possible strategies to improve the SNUG intervention may involve increasing the
duration of intervention, increasing the size of the targeted outreach areas, or consider other
approaches that may have a more direct impact to the community. Another factor to establish is

48
the implementation of SNUG should not be different from the proposed plan. If the implementation
process is divergent from the proposed plan, effectiveness of the SNUG may be questionable. For
example, if the plan was to implement SNUG for18 months, but only 2 months of the original plan
was undertaken, then the program may not yield any measureable impact. More precisely,
implementation of a dosage at very low levels may explain the lack of impact.
As important as it is to have strong communications with the community and form
positive social interactions with the youths, we have to consider additional approaches to improve
the intervention. Social interaction is an important aspect in influencing noncriminal behavior;
however, we need to look at other influences that affect criminal behavior and not just improper
social interaction as the cause. This analysis does not conclude that we should neglect Differential
Association theory, but to consider other theories that may be valuable and contributive for a more
successful intervention. In theory we hope that SNUG is effective in decreasing crime through
gang awareness, outreach to high-risk offenders, and other approaches; however, it is difficult to
measure its impact because the techniques are so abstract. Since the techniques are so abstract,
programs such as SNUG may face implementation failure such as inconsistent training of
community workers. However, in no way should we neglect these methods; yet, we should
embrace these techniques by including more definition, specification, and concrete approaches.
Operation SNUG focuses on so many different approaches that it seems to be overwhelming. With
the focus of gang prevention, gun prevention, employment assistance, and other methods, SNUG
needs a substantial resource base to implement and complete its tasks. The amount of resources
required for SNUG is the collaboration of the entire community and not just law enforcement,
outreach specialists, or individual agents. Clear definition, specification, and concrete approaches
49
will prove valuable in improving the program and lead it one step towards a more successful
direction.
Since the community outreach program, Operation SNUG, shows no direct cause in the
decrease of homicides in the studied area, it is nevertheless important as it shows a unity of multiple
community entities with one specific goal in mind; to recognize and address the violent crime
within the city.
The use of GIS and crime analysis in this section shows that it is an effective tool at
comparing geography size between outreach areas, police service areas, and zip codes; and
indicating the distance between robbery hotspots, shooting hotspots, and homicides to outreach
areas. As illustrated the intended outreach areas coincide with the location of homicides, robbery
hotspots, and shooting hotspots. However, the issue remains on how much of the targeted outreach
area was actually covered since the area is several blocks wide and in multiple zip codes.
The third and last criminal justice approach is one of the oldest form of criminal justice
prevention and intervention method used to address crime. The use of drug raids and crackdowns
are often used to incarcerate and deter criminal behavior within an area. In the next chapter, drug
raids and crackdowns by law enforcement in Rochester, New York will be assessed to determine
if these approaches are effective in addressing crime.
Chapter 4: Rochester Street Corner Crackdown
Introduction
Crackdowns are defined as “abrupt escalations in law enforcement activities that are
intended to increase the perceived or actual threat of apprehension for certain offenses occurring
in certain situations or locations” (Davis and Lurigio, 1996, pg.86). During crackdowns, police
operations are typically highly visible and involve a large number of uniformed and/or
50
undercover officers (Scott, 2002). These operations are often carried out in either zero-tolerance
approach versus sweeps (Gaines and Kappeler, 2011, pg.226). Zero-tolerance is a tactic in which
law enforcement use to enforce all laws to bring stability in the area. Unlike zero-tolerance,
sweeps are conducted by deploying large amount of police officers to make large numbers of
arrests (Gaines and Kappeler, 2011, pg.226). Sweeps generally lasts around a day or two whereas
zero-tolerance may last up to weeks or months (Gaines and Kappeler, 2011, pg.226). In this
report, the effectiveness of the sweep approach in Rochester known as the Rochester Street
Corner Crackdown will be evaluated.
Rochester Safe and Sound
Rochester Safe and Sound (RSS) is an anti-gang initiative from Rochester Police
Department (RPD) designed to address incidents relating to early juvenile crime and gang activity.
RPD’s analysis of the local gang problem indicated that gangs form primarily for the purpose of
street level narcotics sales at the neighborhood-level. During the past three years RPD has taken a
two-pronged approach to deal with the most violent drug markets and gangs. Special Investigations
Sections (SIS) were formed to create long-term covert investigations and short-term approach of
gang suppression. SIS teams were modeled after the successful Street Corner Conspiracy (SCC)
teams utilized by the Chicago Police Department. The SIS teams were split into Eastside Narcotic
Team and Westside Narcotics Team. They are significant in providing accurate Street Corner
Market details. The objectives of these teams were to target well-established gangs and local drug
markets, saturate the area, build connections, and assemble cases for a simultaneous execution of
multiple search warrants and large-scale roundup of suspects. The New York State Police assigned
five (5) investigators and one (1) senior investigator to assist with this initiative. During the past
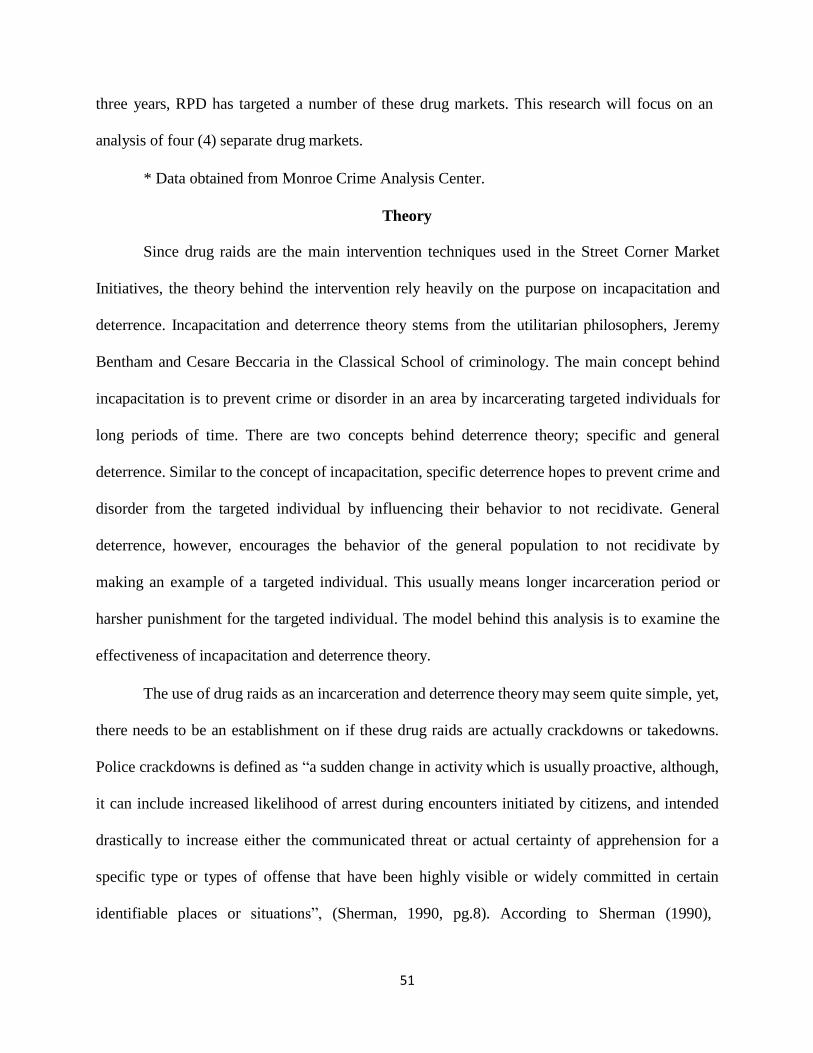
51
three years, RPD has targeted a number of these drug markets. This research will focus on an
analysis of four (4) separate drug markets.
* Data obtained from Monroe Crime Analysis Center.
Theory
Since drug raids are the main intervention techniques used in the Street Corner Market
Initiatives, the theory behind the intervention rely heavily on the purpose on incapacitation and
deterrence. Incapacitation and deterrence theory stems from the utilitarian philosophers, Jeremy
Bentham and Cesare Beccaria in the Classical School of criminology. The main concept behind
incapacitation is to prevent crime or disorder in an area by incarcerating targeted individuals for
long periods of time. There are two concepts behind deterrence theory; specific and general
deterrence. Similar to the concept of incapacitation, specific deterrence hopes to prevent crime and
disorder from the targeted individual by influencing their behavior to not recidivate. General
deterrence, however, encourages the behavior of the general population to not recidivate by
making an example of a targeted individual. This usually means longer incarceration period or
harsher punishment for the targeted individual. The model behind this analysis is to examine the
effectiveness of incapacitation and deterrence theory.
The use of drug raids as an incarceration and deterrence theory may seem quite simple, yet,
there needs to be an establishment on if these drug raids are actually crackdowns or takedowns.
Police crackdowns is defined as “a sudden change in activity which is usually proactive, although,
it can include increased likelihood of arrest during encounters initiated by citizens, and intended
drastically to increase either the communicated threat or actual certainty of apprehension for a
specific type or types of offense that have been highly visible or widely committed in certain
identifiable places or situations”, (Sherman, 1990, pg.8). According to Sherman (1990),

52
crackdowns consists the elements of presence, sanctions, and media threats (pg.8). Presence is the
increase of law enforcement in a particular location or situation. Sanctions is the action in which
law enforcement imply to intervene or disrupt a certain event; for example, roadblock checkpoints,
issuing warnings, and making arrests. Media threats are “announced intentions to increase
sanctioning certainty and are reported to the public such as TV, radio, and billboards”, (Sherman,
1990, pg.8). According to Scott (2004), crackdowns need to be sufficiently strong and long (strong
enough doses of police intervention for long enough periods) in order for it be effective (pg.7).
This “strong and long” factor may hinder the effectiveness of the Rochester Street Corner
Crackdowns since the intervention was a quick sweep.
Analysis
Instead of examining all crime types, the analysis in this paper will examine the rate of
burglaries and robberies surrounding four specific areas before and after a drug/gang intervention.
The objective of this analysis is to determine if the actions to intervene will likely decrease serious
crime incidents in the “hot” areas of Rochester. Burglaries and robberies were specifically chosen
because these crimes are heavily linked to gang crimes and drug offenses. Unlike the previous
report, this report will revisit the Street Corner Market Initiative project by examining crime within
the time span of 4 years instead of 6 months. Time intervals of approximately 3 years (157-175
weeks) before and 1 year (52 weeks) after the date of the drug intervention were used. This wider
range of time period allows us to gather more valuable results and higher accuracy of crime
patterns. Since time series data are being used on data with crime counts, an autoregressive Poisson
model was used to correlate weekly robberies and burglaries in the pretest and posttest phase of
the analysis. To apply the autoregressive Poisson model STATA, a data analysis and statistical
software package was utilized. Buffer distance of a quarter mile was used to provide an appropriate
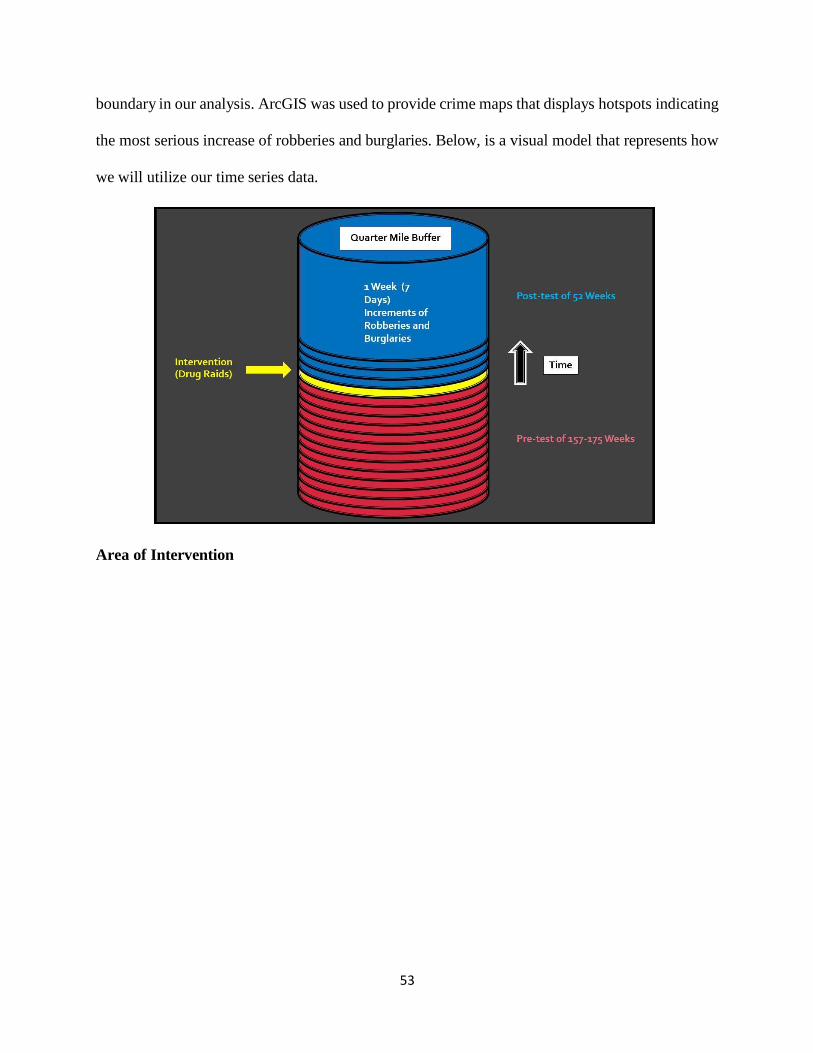
53
boundary in our analysis. ArcGIS was used to provide crime maps that displays hotspots indicating
the most serious increase of robberies and burglaries. Below, is a visual model that represents how
we will utilize our time series data.
Area of Intervention
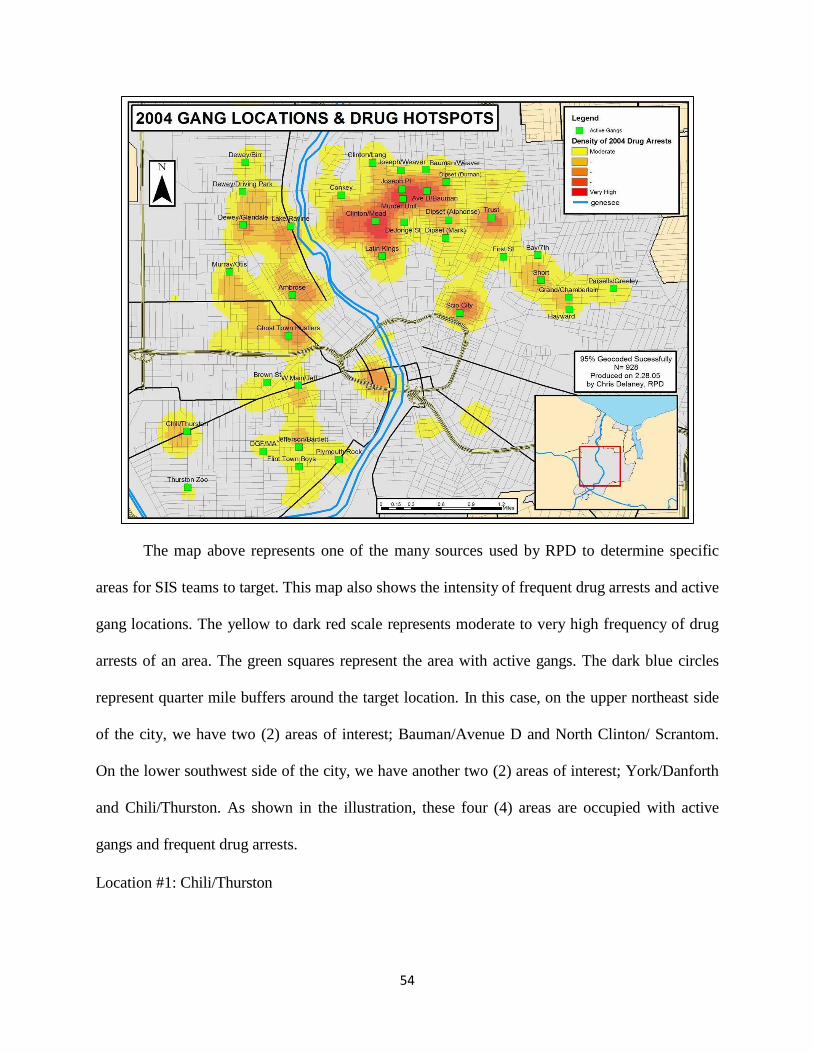
54
The map above represents one of the many sources used by RPD to determine specific
areas for SIS teams to target. This map also shows the intensity of frequent drug arrests and active
gang locations. The yellow to dark red scale represents moderate to very high frequency of drug
arrests of an area. The green squares represent the area with active gangs. The dark blue circles
represent quarter mile buffers around the target location. In this case, on the upper northeast side
of the city, we have two (2) areas of interest; Bauman/Avenue D and North Clinton/ Scrantom.
On the lower southwest side of the city, we have another two (2) areas of interest; York/Danforth
and Chili/Thurston. As shown in the illustration, these four (4) areas are occupied with active
gangs and frequent drug arrests.
Location #1: Chili/Thurston
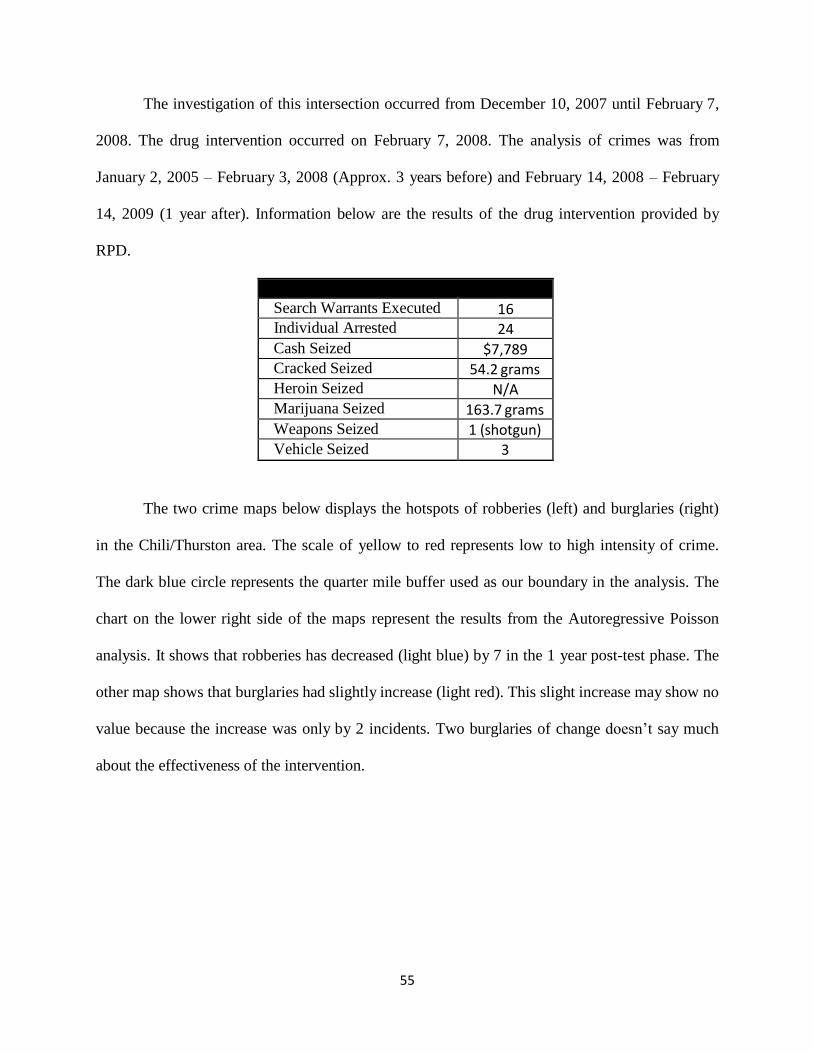
55
The investigation of this intersection occurred from December 10, 2007 until February 7,
2008. The drug intervention occurred on February 7, 2008. The analysis of crimes was from
January 2, 2005 – February 3, 2008 (Approx. 3 years before) and February 14, 2008 – February
14, 2009 (1 year after). Information below are the results of the drug intervention provided by
RPD.
Search Warrants Executed 16 Individual Arrested 24 Cash Seized $7,789 Cracked Seized 54.2 grams Heroin Seized N/A Marijuana Seized 163.7 grams Weapons Seized 1 (shotgun) Vehicle Seized 3
The two crime maps below displays the hotspots of robberies (left) and burglaries (right)
in the Chili/Thurston area. The scale of yellow to red represents low to high intensity of crime.
The dark blue circle represents the quarter mile buffer used as our boundary in the analysis. The
chart on the lower right side of the maps represent the results from the Autoregressive Poisson
analysis. It shows that robberies has decreased (light blue) by 7 in the 1 year post-test phase. The
other map shows that burglaries had slightly increase (light red). This slight increase may show no
value because the increase was only by 2 incidents. Two burglaries of change doesn’t say much
about the effectiveness of the intervention.
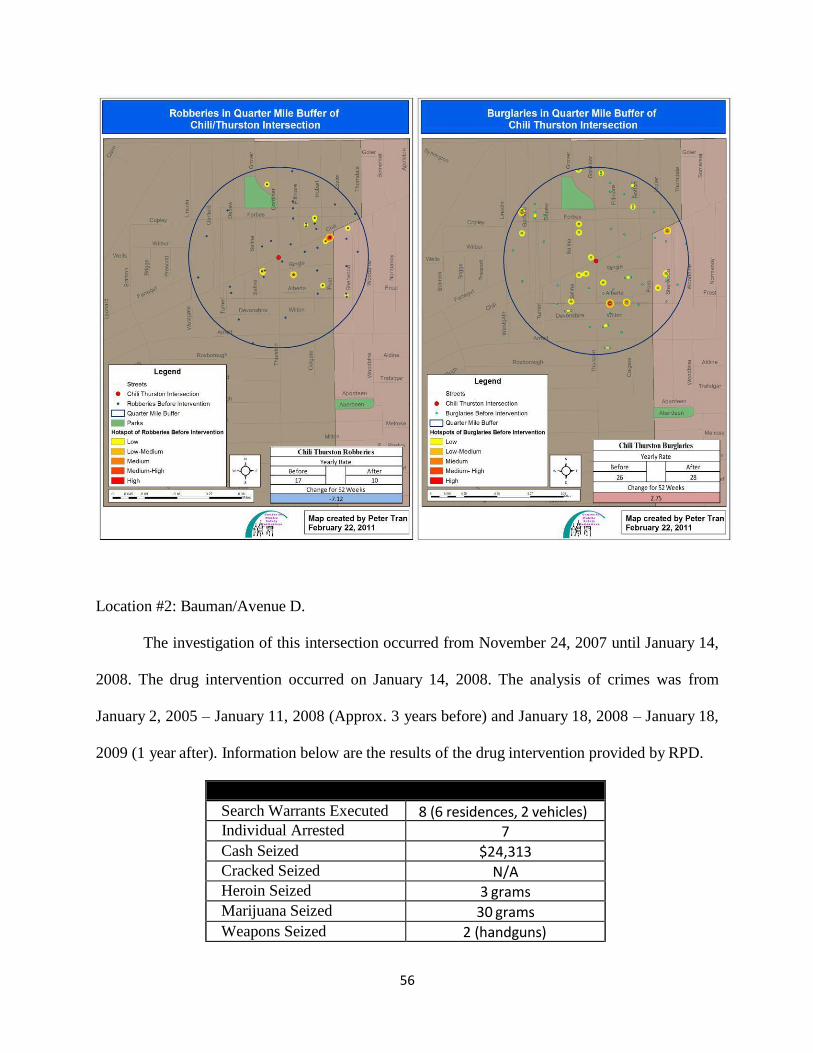
56
Location #2: Bauman/Avenue D.
The investigation of this intersection occurred from November 24, 2007 until January 14,
2008. The drug intervention occurred on January 14, 2008. The analysis of crimes was from
January 2, 2005 – January 11, 2008 (Approx. 3 years before) and January 18, 2008 – January 18,
2009 (1 year after). Information below are the results of the drug intervention provided by RPD.
Search Warrants Executed 8 (6 residences, 2 vehicles) Individual Arrested 7 Cash Seized $24,313 Cracked Seized N/A Heroin Seized 3 grams Marijuana Seized 30 grams Weapons Seized 2 (handguns)

57
Vehicle Seized N/A
The two crime maps below displays the hotspots of robberies (left) and burglaries (right)
in the Bauman/Avenue D area. It shows that robberies had decreased (blue) by 7 in the 1 year post-
test phase. The second map shows that burglaries had also decreased by 7 (blue).
Location# 3: North Clinton/Scrantom
The investigation of this area occurred from March 14, 2008 until May 21, 2008. The drug
intervention occurred on May 20, 2008. The analysis of crimes was from January 2, 2005 – May
17, 2008 (Approx. 3 years before) and May 26, 2008 – May 26, 2008 (1 year after). Information
below is the results of the drug intervention provided by RPD.
Search Warrants Executed 9
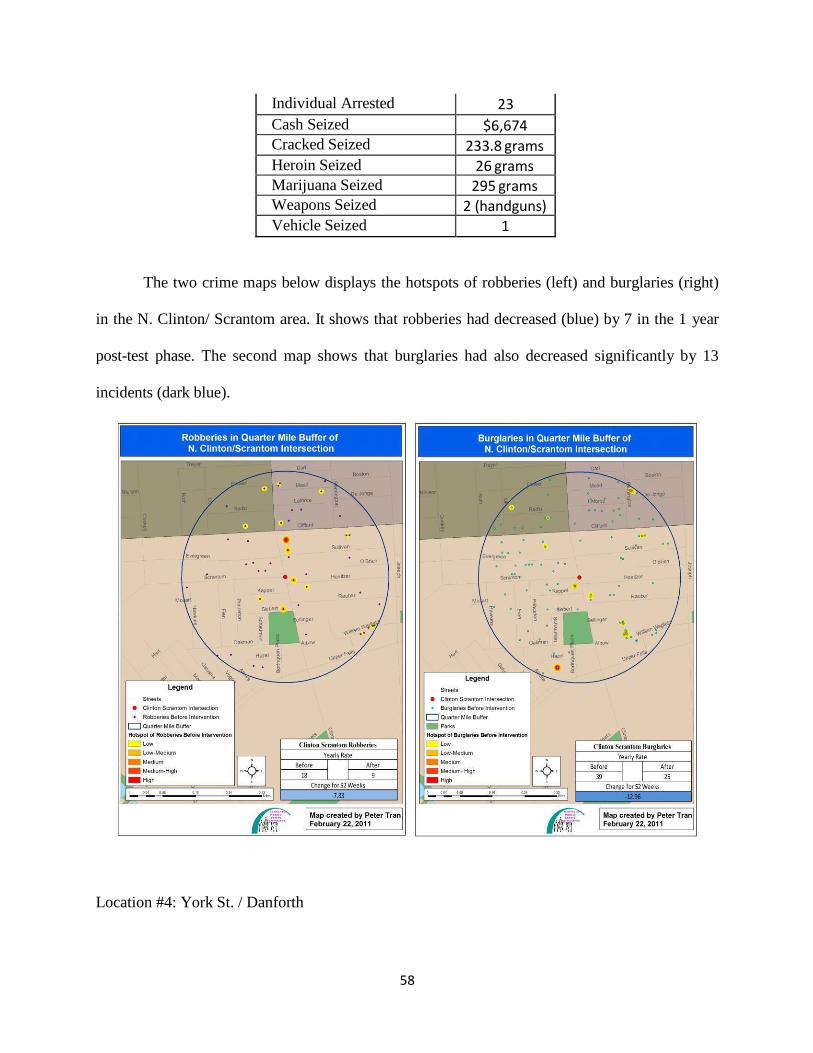
58
Individual Arrested 23
Cash Seized $6,674 Cracked Seized 233.8 grams Heroin Seized 26 grams Marijuana Seized 295 grams Weapons Seized 2 (handguns) Vehicle Seized 1
The two crime maps below displays the hotspots of robberies (left) and burglaries (right)
in the N. Clinton/ Scrantom area. It shows that robberies had decreased (blue) by 7 in the 1 year
post-test phase. The second map shows that burglaries had also decreased significantly by 13
incidents (dark blue).
Location #4: York St. / Danforth
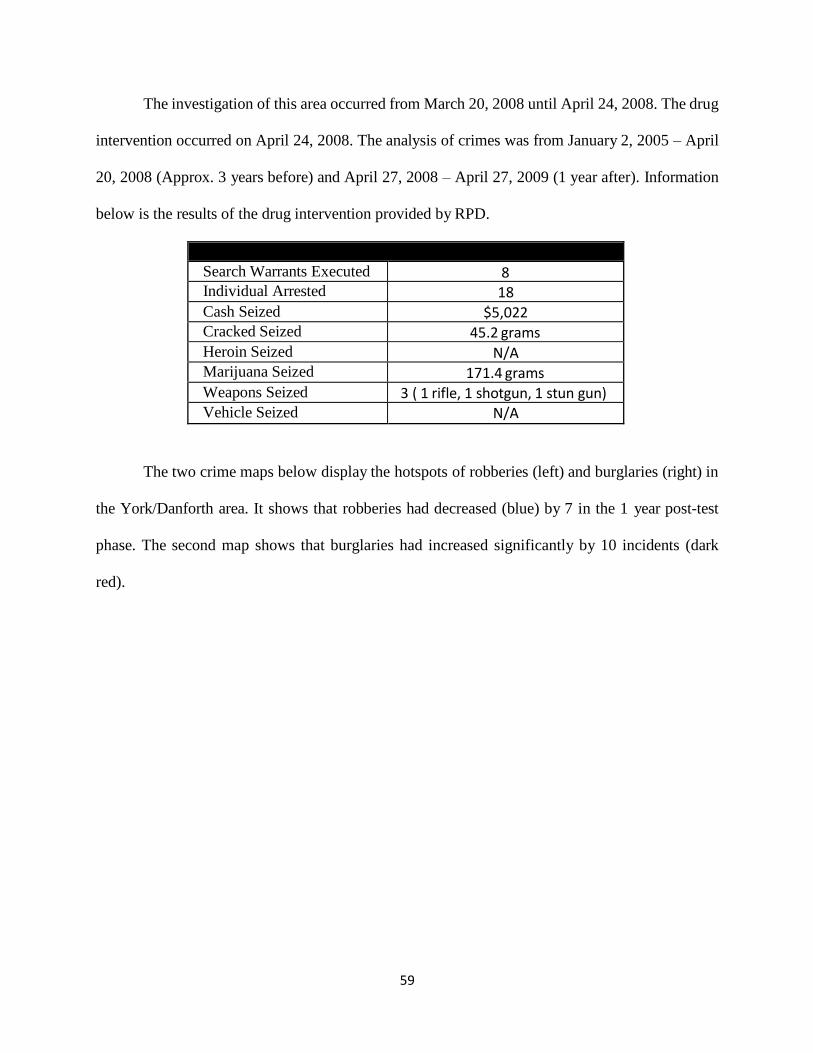
59
The investigation of this area occurred from March 20, 2008 until April 24, 2008. The drug
intervention occurred on April 24, 2008. The analysis of crimes was from January 2, 2005 – April
20, 2008 (Approx. 3 years before) and April 27, 2008 – April 27, 2009 (1 year after). Information
below is the results of the drug intervention provided by RPD.
Search Warrants Executed 8 Individual Arrested 18 Cash Seized $5,022 Cracked Seized 45.2 grams Heroin Seized N/A Marijuana Seized 171.4 grams Weapons Seized 3 ( 1 rifle, 1 shotgun, 1 stun gun) Vehicle Seized N/A
The two crime maps below display the hotspots of robberies (left) and burglaries (right) in
the York/Danforth area. It shows that robberies had decreased (blue) by 7 in the 1 year post-test
phase. The second map shows that burglaries had increased significantly by 10 incidents (dark
red).
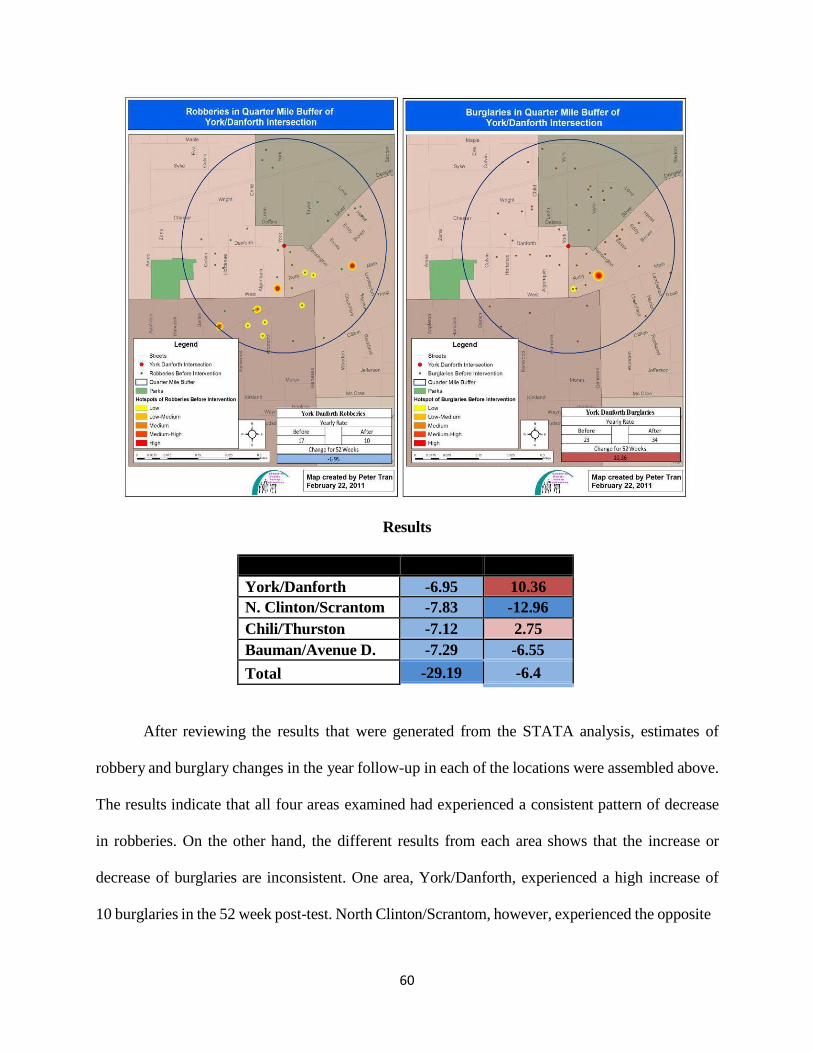
60
Results
York/Danforth -6.95 10.36
N. Clinton/Scrantom -7.83 -12.96
Chili/Thurston -7.12 2.75
Bauman/Avenue D. -7.29 -6.55
Total -29.19 -6.4
After reviewing the results that were generated from the STATA analysis, estimates of
robbery and burglary changes in the year follow-up in each of the locations were assembled above.
The results indicate that all four areas examined had experienced a consistent pattern of decrease
in robberies. On the other hand, the different results from each area shows that the increase or
decrease of burglaries are inconsistent. One area, York/Danforth, experienced a high increase of
10 burglaries in the 52 week post-test. North Clinton/Scrantom, however, experienced the opposite
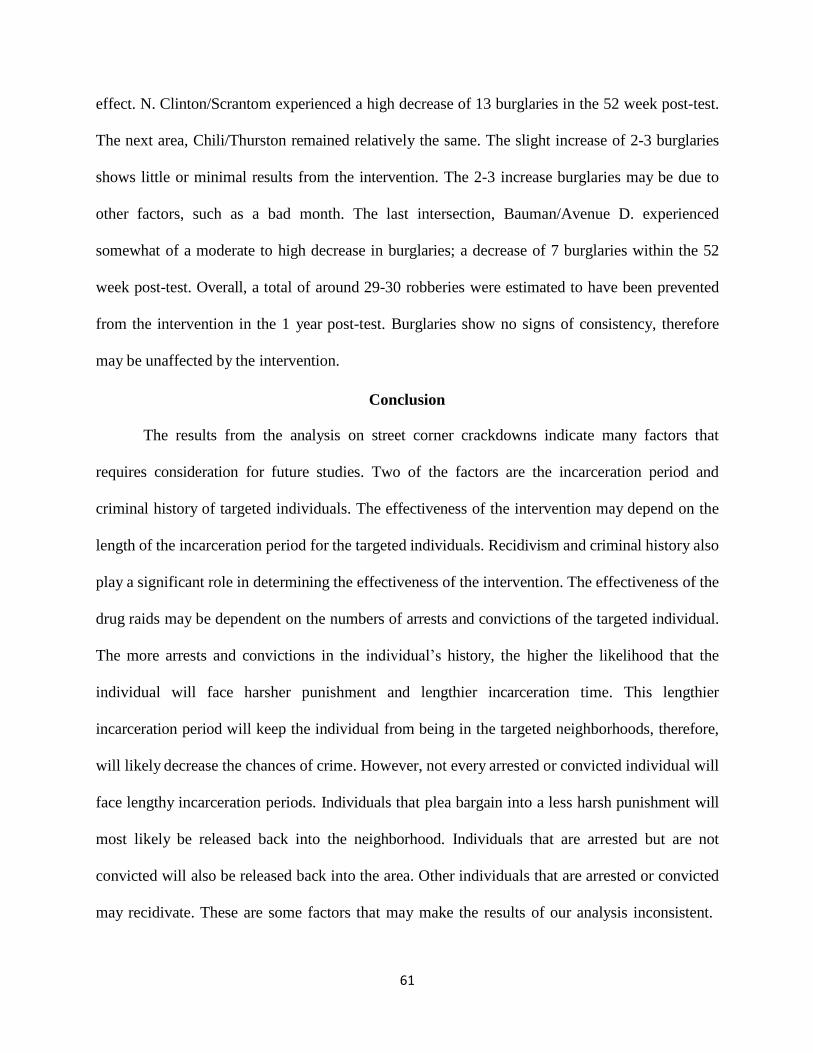
61
effect. N. Clinton/Scrantom experienced a high decrease of 13 burglaries in the 52 week post-test.
The next area, Chili/Thurston remained relatively the same. The slight increase of 2-3 burglaries
shows little or minimal results from the intervention. The 2-3 increase burglaries may be due to
other factors, such as a bad month. The last intersection, Bauman/Avenue D. experienced
somewhat of a moderate to high decrease in burglaries; a decrease of 7 burglaries within the 52
week post-test. Overall, a total of around 29-30 robberies were estimated to have been prevented
from the intervention in the 1 year post-test. Burglaries show no signs of consistency, therefore
may be unaffected by the intervention.
Conclusion
The results from the analysis on street corner crackdowns indicate many factors that
requires consideration for future studies. Two of the factors are the incarceration period and
criminal history of targeted individuals. The effectiveness of the intervention may depend on the
length of the incarceration period for the targeted individuals. Recidivism and criminal history also
play a significant role in determining the effectiveness of the intervention. The effectiveness of the
drug raids may be dependent on the numbers of arrests and convictions of the targeted individual.
The more arrests and convictions in the individual’s history, the higher the likelihood that the
individual will face harsher punishment and lengthier incarceration time. This lengthier
incarceration period will keep the individual from being in the targeted neighborhoods, therefore,
will likely decrease the chances of crime. However, not every arrested or convicted individual will
face lengthy incarceration periods. Individuals that plea bargain into a less harsh punishment will
most likely be released back into the neighborhood. Individuals that are arrested but are not
convicted will also be released back into the area. Other individuals that are arrested or convicted
may recidivate. These are some factors that may make the results of our analysis inconsistent.
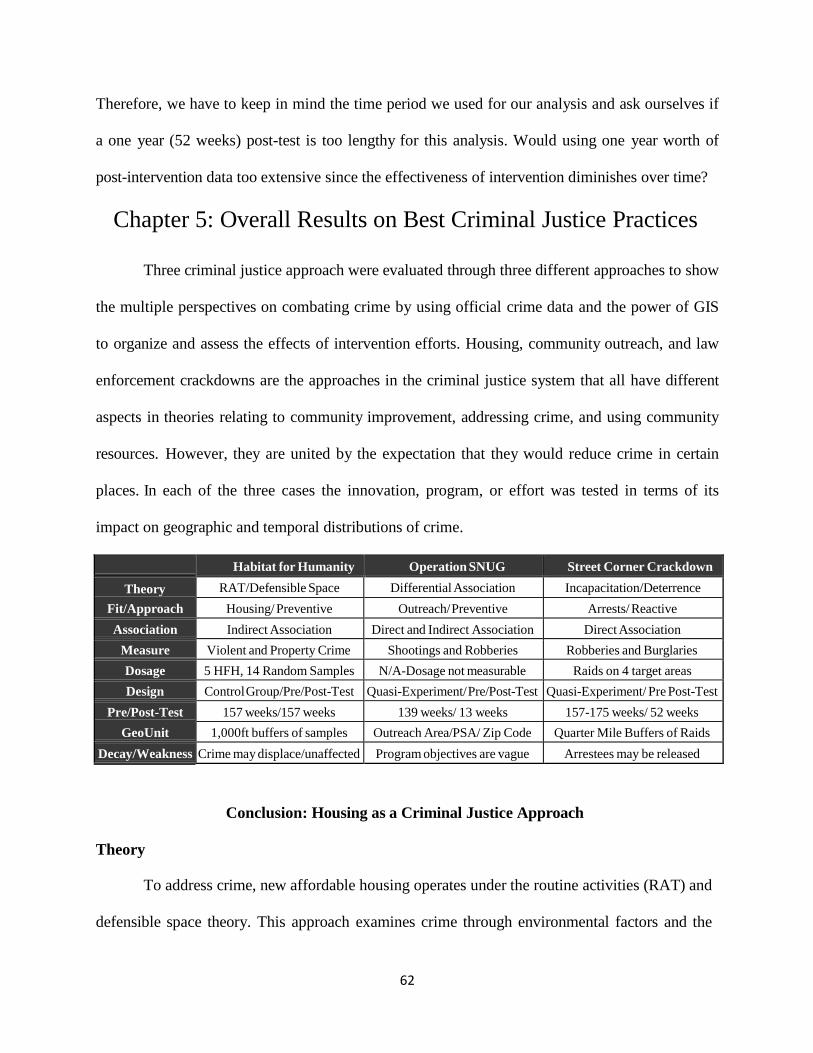
62
Therefore, we have to keep in mind the time period we used for our analysis and ask ourselves if
a one year (52 weeks) post-test is too lengthy for this analysis. Would using one year worth of
post-intervention data too extensive since the effectiveness of intervention diminishes over time?
Chapter 5: Overall Results on Best Criminal Justice Practices
Three criminal justice approach were evaluated through three different approaches to show
the multiple perspectives on combating crime by using official crime data and the power of GIS
to organize and assess the effects of intervention efforts. Housing, community outreach, and law
enforcement crackdowns are the approaches in the criminal justice system that all have different
aspects in theories relating to community improvement, addressing crime, and using community
resources. However, they are united by the expectation that they would reduce crime in certain
places. In each of the three cases the innovation, program, or effort was tested in terms of its
impact on geographic and temporal distributions of crime.
Habitat for Humanity Operation SNUG Street Corner Crackdown
Theory RAT/Defensible Space Differential Association Incapacitation/Deterrence
Fit/Approach Housing/ Preventive Outreach/ Preventive Arrests/ Reactive
Association Indirect Association Direct and Indirect Association Direct Association
Measure Violent and Property Crime Shootings and Robberies Robberies and Burglaries
Dosage 5 HFH, 14 Random Samples N/A-Dosage not measurable Raids on 4 target areas
Design Control Group/Pre/Post-Test Quasi-Experiment/ Pre/Post-Test Quasi-Experiment/ Pre Post-Test
Pre/Post-Test 157 weeks/157 weeks 139 weeks/ 13 weeks 157-175 weeks/ 52 weeks
GeoUnit 1,000ft buffers of samples Outreach Area/PSA/ Zip Code Quarter Mile Buffers of Raids
Decay/Weakness Crime may displace/unaffected Program objectives are vague Arrestees may be released
Conclusion: Housing as a Criminal Justice Approach
Theory
To address crime, new affordable housing operates under the routine activities (RAT) and
defensible space theory. This approach examines crime through environmental factors and the
63
opportunity for criminal behavior; establishing a relationship that housing provides suitable
guardians and ownership property that deter criminal activity in the vicinity. However, there may
be many factors that are assumed in this routine activities theory. For example, there may be an
assumption that all new home owners are responsible and will report all criminal activity in the
area. There may be an assumption that the distance in which new housing has an effect on crime
may extend several blocks within the community as compared to one block. These factors should
be evaluated to address the limitation of housing and its effect on crime
Fit/ Approach Type
The use of housing to address crime within an area is a preventive measure; a technique
used to prevent crime from occurring instead of implementing an action plan to address current
crime issues. In other words, the independent variable is housing and dependent variable is crime.
Association with Crime
Based on RAT and defensible space, housing is considered an indirect association with
crime due to the fact that it falls heavily on available guardians and suitable targets. In other words,
housing effects those who are willing to deter or respond to criminal behavior (suitable guardians);
therefore effecting the outcome of crime. The association with housing and crime is determined
by the outcome of the third party; the environment, suitable guardians and available targets.
Measure and Dosage
Since housing is a general criminal justice approach that does not target any specific crime,
but effects all crime types, violent and property crimes were used as measurements in the analysis.
The use of violent crimes and property crimes as a measurement did not become an issue; however,
the comparison between Habitat for Humanity houses (HFH) and random sample houses (RSH)
did become troublesome. Since some Habitat for Humanity houses (HFH) were constructed and
64
completed in different time frames, HFH houses that had a deed filing date distant from 2005, the
intervention date, had to be omitted. To remain consistent in the usage of measurements, random
sample houses (RSH) with an unavailable deed filing date was also omitted. Because of the
omission of certain HFH and RSH, limited number of samples may be the cause of the inconclusive
results. I think here you might also contrast density of HFH – standalone vs. cluster, no? Might
this be a place where more research is needed?
Design/ Pre-Tests Post-Tests
Out of the three criminal justice approaches analyzed, housing with Habitat for Humanity
had the strongest design. Besides the pre-test post-test, the areas surrounding Habitat for Humanity
houses were control groups or treated areas that were compared to random samples without any
treatment. Unlike the community outreach and street corner crackdowns analysis, the random
samples in comparison to the control group allows us to see if housing, specifically Habitat for
Humanity, had any effect on crime. With both the pre-test post-test analysis and the control group
experiment, we can factor each criteria such as time, area, and dosage of intervention.
A pre-test post-test of 157 weeks before and 157 weeks after the intervention date was used
because it allows us to collect more crime data in the area for the analysis and that housing is
considered as a long-term crime prevention due to the enormous amount of effort in construction
these homes. Another criteria to take into consideration is the fact that these homes are constructed
through a long time frame and requires massive amount of contribution which takes time. Since
the HFH houses were not constructed all at the same time, nor were they completed all at the same
time, 3 years before and 3 years after allows us greater flexibility to include HFH houses completed
in the beginning or end of 2005. It also allow us to use a greater number of crime data or sample
observations so that we can better determine the correlation of specific low occurring crimes to

65
housing; for example, there are many weeks that homicides remain zeroes. Because of homicides
are uncommon occurrences, we still would like to include homicides as part of the violent crimes
data that was analyzed in the study. Determining the timeframe for the pre-test post-test analysis
was one of the most challenging tasks in the study. The reason is because we just could not
determine whether or when the effects of housing dissipate. The question is does the effect of
housing on crime begin to dissipate 1, 2, 3 or more years from the intervention date?
Geographic Unit
The second the most challenging task in analyzing all three criminal justice approaches
was to determine the appropriate distance or proximity in which housing and its effect on crime
will dissipate. Since there is no clear boundary of when the crime prevention effects begin to decay,
a theoretical judgment was determined by asserting that the areas closest to the Habitat for
Humanity (HFH) houses will experience the peak effectiveness of the intervention. As the location
becomes farther from the HFH houses, we assume that the effectiveness dissipate gradually. To
set a boundary, we determined that 1,000 ft., which is about 3 blocks away from the HFH houses,
is the best measurement used to determine where crime prevention effectiveness begins to decay.
The assumption is that a boundary under 1,000 ft. from the HFH houses will neglect crime beyond
that boundary which may be effected from housing; anything over 1,000 ft. may not be potentially
effected by housing. Now this does not factor in other criteria such as vacated lots surrounding
HFH houses, which may negate the effectiveness of housing. For clustered housing or multiple
HFH houses constructed adjacent to each other, the theory is that buffers or boundaries of crime
prevention effectiveness from HFH houses may overlap each other, which may produce greater
effects.
Decay/ Weakness
66
Criminal justice approaches often have a time period of dissipation where the effects from
the intervention gradually decreases. As explained in the previous sections, the question remains
when (how long was the intervention effective) and where (how far does the intervention begin to
not effect crime). These issues generate certain weaknesses in the study. One of weaknesses is
that, in the study, GIS neglects to include special geographical conditions that may negate the
impact of housing and contradict the idea that closer proximity to the intervention area will show
more effect on crime. For example, a drug market across the street or around the block from a HFH
house may negate the effectiveness of housing. Another issue with some of these areas are that
there are many vacant lots that surround HFH houses that generate escape routes or loitering areas
for criminals. Gangs and gang violence also reside in these areas which may make HFH houses
ineffective.
Another weakness in the study is the limited number of HFH houses available to compare
with random samples. More HFH houses would allow us to examine more intervention groups that
may show some significance in the study. Lastly, this analysis does not examine the displacement
of crime from HFH houses. Question remains that if criminals are driven out from the nearby
location because the environment is altered, if not arrested, where are they being displaced?
Overall, Habitat for Humanity plays a huge role improving the city and despite the
weaknesses of this study, it can be concluded that the use of private housing is not the best tool in
combating crime. It is the best tool to combat poor living conditions; however, if we examine and
modify the way housing is being implemented, it has the potential to be aligned with theories
indicating they may have a role in addressing crime.
Conclusion: Community Outreach as a Criminal Justice Approach
Theory
67
Community outreach and Operation SNUG operates under the differential association
theory; which is emphasizes the importance of proper social interaction and role modeling for
community members, especially youth. The issue with this theory is that it is assuming that the
target or youth remains interested in having a role model and wishes to connect with someone. It
also assumes that the youth acknowledges the problems and consequences that follow criminal
behavior. However, youths who joined gangs because of their family member’s association with a
gang is a prime example of what differential association theory tries to define.
Fit/ Approach Type
The use of community outreach to address crime can be a preventive and reactive approach
depending on the goal and intent of the program; however, most of the time, it can be considered
as more of preventive approach. Preventive approaches constitute techniques used to prevent
crime from occurring whereas reactive approaches are used to address current and active crime
issues. Because of unclear goals of Operation SNUG, it can be both preventive and reactive
because it was created to address the current issue of gang violence and juvenile delinquency
through street intervention within the area, as well as to prevent further violent crimes in the future.
Depending on the actions implemented in Operation S.N.U.G., actions such as street intervention
and responding to juveniles referrals from police are more reactive approaches. The approach is
reactive because crime needs to be present, or at least likely in the near term, in order to conduct
street intervention or respond to juvenile referrals. However, actions such as teaching gang
awareness through classroom presentations or using celebrities as role models should be classified
as preventive approaches because crime is not required for the teachings to be implemented. This
preventive approach is similar to a program called Drug Abuse Resistance Education (D.A.R.E)
which was deployed countrywide to educate children about the harmful effects of drugs and to
68
teach them good decision-making skills. Some of the targeted audience has never heard or
experienced drugs since they are only young children.
Association with Crime
Operation SNUG may be regarded as a direct association with crime because unlike Habitat
for Humanity, its first objective is to decrease criminal behavior amongst youths and lower crime
in the neighborhood. For example, an individual who was arrested but referred to Pathways to
Peace to assist in examining social issues that causes criminal behavior would be a direct
association. Unlike housing which requires a third party to effect crime, community outreach and
Operation SNUG is directly addressing the issue by intervening with delinquent youth.
Measure and Dosage
One of the most challenging aspects of this study is the dosage of community outreach by
Operation SNUG and Pathways to Peace. While it is not difficult to determine what crimes will be
focused on by community outreach, measuring dosage of intervention requires the agency staff to
keep track of specific details on program activities. For example, daily patrols by street workers
to prevent youth from skipping schools or frequent meetings with parents to better monitor youth’s
involvement in delinquent activities should be recorded. Not only should these activities be
documented but the numbers of kids skipping school that were brought back to school by street
workers or the qualitative assessment on why parents do not have time to monitor their kids should
be recorded. These are prime examples that can be valuable data in determining if the program is
truly effective. The issue is that many of these programs and operations do not document their
activities because there is no clear approach or guidelines to systematically capture the dosage and
nature of interventions.
69
A second example would be the use of gang and guns awareness presentation by
community outreach workers to provide youths an insight on the consequences of joining a gang
or carrying an illegal firearm. If this awareness presentation was not measured for success, how
will it be determined if the task if effective or not? A simple recommendation would be to develop
and administer a survey for the presentation attendees and gather their insight on what was being
presented. Was it helpful? Was it not? It can be assumed that if a youth from the presentation
attendance list did get arrested for gang crimes, that the presentation was not effective toward that
individual.
Finally, the establishment of concrete and definitive approaches with extensive training for
all community outreach personnel are key factors in the success of the program. In collaboration
with specific approaches and extensive training, law enforcement and the entire community will
need to be involved in a combined effort to address crime. Thus the limits of GIS as a tool is
limited to the extent one does not measure the dosage of policy change or program implementation
explicitly (Blumstein, 2013, pg.3). For example, the complexity of policy and programs shift with
the shape and movement of demographics, drug markets, gun control, education, and other factors
that limit the analysis; this is something GIS cannot measure or calculate. Crime analysis and GIS
are also heavily dependent on financial resources on the department, work time, and training
(Boba, 2005, pg.54).
Design/ Pre-Tests Post-Tests
Another challenge to this study is establishing what research method would be appropriate
to determine the effectiveness of Operation SNUG. A quasi-experimental design was chosen for
this study because the dosage and origin of intervention were not entirely recorded. A quasi-
70
experimental design allows us to compare the crimes within the targeted outreach area, police
service area surrounding the targeted outreach area, and the zip codes area that surrounds the police
service area. This allows us to look at several things; the distance in which the targeted outreach
area or intervention may have an impact on the surrounding neighborhood and if the effects
extends beyond the boundaries of areas such as police service area and zip code area. It also shows
how the targeted outreach areas are doing in terms of shootings and robberies in comparison to the
overall police service area and zip code area. If the crimes decreased in the targeted outreach area
but have stayed the same or increased in the police service area or zip code area, then we can
determine that the program may have some effectiveness in achieving its objective.
Similar to the Habitat for Humanity and housing analysis, a pre-test post-test was done so
we can take into account time series and examine the longevity of the program’s effectiveness.
The difference between the community outreach analysis versus the housing analysis is that the
community outreach analysis used a pre-test of 139 weeks and a post-test of 13 weeks. The reason
for 139 weeks is so that we can collect enough crime data for the area to execute an effective time
series analysis. Thirteen weeks was chosen precisely because the program’s execution seems to be
abstract and unclear which may prove to be a more of a short-term effect even though the intention
of the program is long-term the impact is likely to quickly decay unlike the habitat houses, which
at least have structural longevity.
Geographical Unit
Similar to the effects of housing, community outreach has no clear boundaries on where
the effects end. With just an estimated location of where the patrol routes used by community
outreach workers, measuring and comparing community outreach proves difficult. Examining
71
shootings and robberies between outreach area, patrol service area, and zip code area may solve
this issue by showing the increase or decrease of crime as the examined area expands.
Decay/ Weakness
Similar to housing, there are many factors that may determine the inconclusive impact that
community outreach programs such as Operation SNUG, have on crime. One factor is the abstract
techniques in community intervention program. Without consistent outreach methods used
between outreach workers, it is difficult to measure what method works and what does not. Decay
of effectiveness may also occur rapidly if youths do not associate or connect themselves with
outreach workers. How many youths can connect with these role models or outreach workers? If
they connect with them, what are they thinking? Would this outreach program deemed as a failure
if a youth recidivates 5 years later as oppose to 2 years. These are the attributes that are not
accounted for in this study.
Conclusion: Crackdowns as a Criminal Justice Approach
Theory
Crackdowns which operates on an incapacitation and deterrence theory aims to decrease
crime through targeting individuals who disrupt neighborhood stability by incarceration.
Incarceration has been the oldest technique in preventing crime and bringing those accountable
responsible for their actions. By removing the delinquent individual or individuals, two effects are
assumed: 1) If the criminal element caused by the targeted individual is removed from the area,
then crime will decrease or be terminated; 2) The targeted individual being incarcerated serves as
an example to other individuals that the repercussions of non-law abiding behavior exists and will
be enforced. There are some limitations to incapacitation and deterrence theory. The theories do
72
not take into account certain circumstances such as gang affiliation. For example, if a group of
gang members in a specific location were targeted, arrested, and incarcerated, other gangs may try
to claim that territory. In this case, the incarceration and deterrence theory had no effect because
other gangs will just replace the incarcerated gang and the criminal activity persists. Because there
are no entity or gangs in control of the targeted area due to arrests, rival gangs may wreak havoc
and cause violence to claim the now available territory, eliminating any gains in crime reduction.
Fit/ Approach Type
Although the intent of crackdowns is to prevent further criminal activity, the methods in
which crackdowns are deployed are reactive. Crackdowns can only be deployed when there are
current and active criminal activities in the location otherwise there would be no one to arrest.
Unlike crackdowns, housing is a preventive approach because houses can be constructed without
the presence of crime. Crackdowns however, require an individual who conducts criminal
activities so that an arrest can be made, incarceration can be implemented, and an entity to impose
punishment on so that deterrence can yield an effect.
Association with Crime
Unlike housing, crackdowns are directly associated with crime because it personally targets
the individuals responsible for criminal activity in the intervention area without depending on any
third party. Housing doesn’t guarantee that homeowners will respond to criminal behavior whereas
law enforcement are required to do so in crackdowns. Focusing on, arresting, and incarcerating an
individual while imposing a direct statement to other possible criminals that criminal behavior will
not be tolerated is surely a direct association with crime. Similar to community outreach, the
primary goal of crackdowns is also decrease crime whereas housing’s primary goal is to improve
living conditions.
73
Measure and Dosage
Measurement and dosage for crackdowns requires police data on number of officers
present at the crackdown, numbers of arrest, and most importantly the duration of officers’
presence in the intervention area. Since crackdowns are generally quick sweeps, duration of police
presence is often short. This often cause challenges in this study because police presence is not
accounted for and there is an assumption that police presence dissipated in an unknown time frame.
Design/ Pre-Tests Post-Tests
Another challenge for the pre-test post-test design in this crackdown study is determining
the appropriate timeframe for analysis. Since crackdowns are quick sweeps where arrests generally
take place within the same week, 3 years pre-test and 1 year post-test seems to be the most
appropriate timeframe for analysis. Three years of pre-test data gives us a large enough dataset to
examine and determine any pattern or correlation between the intervention and the area. One year
post-test is determined as the appropriate timeframe for a follow-up to see if crime decreased. The
theory behind using the one year post-test is that police presence may dissipate in the area within
one year after the intervention date.
Geographical Unit
Similar to the effects of housing and community outreach, crackdowns have no clear
boundaries on where the effects end. Because of the nature of quick sweeps and the consolidation
of police presence in one precise location, there is an assumption that the effects of intervention
will not extend beyond a quarter mile buffer.
There may be other factors that may affect the results of this study that cannot be avoided.
For example, police patrols in police service areas, or PSAs, may increase after the intervention
74
date. In this scenario, the decrease in crime in the intervention area may be attributed to the police
patrol presence after the intervention and not during the crackdown.
Decay/ Weakness
Since law enforcement is one of the key players in the community, incarceration and
deterrence through drug raids and crackdowns are one of the main tasks operated by local law
enforcement. Although the general idea of removing criminal behavior from the community
through imprisonment is logical, there are some disadvantages and inconsistencies. One issue of
the crackdown and drug raid approach is that is relies heavily on number of arrests and lengthy
sentences to keep non law-abiding citizens from reentering the community. This all depends on
the criminal history of the arrestee and their likelihood to recidivate prior to their release from
imprisonment. However, the downfall of this deterrence through incapacitation theory is the plea
bargaining process where arrestees are able to plea for a lesser punishment; thus, reentering the
community in an earlier time frame. Individuals that are arrested but are not convicted will also be
released back into the area. Other individuals that are arrested or convicted may recidivate.
Nevertheless, drug enforcement is a substantial element in the police’s arsenal in combating crime.
Conclusion
In spite of all the disadvantages to housing, community outreach, and drug crackdowns,
these approaches are nevertheless significant criminal justice approaches that should not be
neglected. One common goal that these three criminal justice approaches provide is the unification
of the community as a whole to recognize and address the issue of crime. Without unification of
the community and recognizing that there is a crime problem, the stability and safety of the
community would be in jeopardy. Community unification with the combined efforts of all three
criminal justice approaches implemented at the same time may prove a lot more effective in

75
combating crime. However, further research should be conducted to establish the relative
effectiveness of the combined efforts of all three criminal justice approach.
As noted in the discussions above, the proximity of interventions to crime appears to have some
relationship to the immediate and detectable impacts. More precisely, the police led effort
involving crackdowns did appear to have an immediate and modest impact, whereas the more
distant interventions in SNUG and HFH did not have clearly detectable impacts. This could be
related to their tangential or indirect relationship to crime or perhaps with the longer time horizon
needed for community and personal intervention efforts such as housing improvements.
Alternatively, the theoretical linkages in both SNUG and HFH could be made more explicit and
aligned with criminological theory if both aim to have direct impacts on community safety and
crime.
76
Bibliography
Blumstein, A. (2013). Linking Evidence and Criminal Justice Policy.
American Society of Criminology. 12(4), 1-10
Boba, R. (2005). Crime Analysis and Crime Mapping.
Thousand Oaks, California: Sage.
Browning, L.L. (2006). Self Help Housing: The Geographic Impact of Habitat for Humanity Projects in
Wilmington, Delaware. Master’s Abstract International, 45(1), 140. (UMI No. 1437436)
Retrieved April 13, 2010.
Braga, A.A., Kennedy, D.M., Waring E.J., Piehl, A.M. (2001). Problem-Oriented Policing, Deterrence, and Youth
Violence: An Evaluation of Boston’s Operation Ceasefire.Journal of Research in Crime and Deliquency,
38(3), 195-225
Cohen, L.E., Felson, M.K. (2010). Routine Activity Theory.
Encyclopedia of Criminological Theory. 187-193.
Davis, R. and A. Lurigio (1996). Fighting Back: Neighborhood Antidrug Strategies.
Thousand Oaks, California: Sage.
Gaines, L.K. and Kappeler, V.E. (2011). Police in America
Routledge; 7 edition
Goldstein, H. (2001). Excellence in Problem-Oriented Policing.
Police Executive Research Forum. 1-65
Goldstein, H. (2003). On Further Developing Problem Oriented Policing: The Most Critical Need, The Major
Impediments, and a Proposal. Crime Prevention Studies. 15(1), 13-47
Flower City Habitat for Humanity Website. Viewed on April 14, 2010
Internet: http:// rochesterhabitat.org.
Picard-Fritsche,S., Cerniglia, L. (2010). Testing a Public Health Approach to Gun Violence. An Evaluation of
Crown Heights Save Our Streets, a Replication of the Cure Violence Model. Center for Court Innovation.
1-42
Habitat for Humanity International Website (2010). Viewed on April 13, 2010.
Internet: http://www.habitat.org.
77
Hagedorn, J., Rauch, B. (2007). Housing, Gangs, and Homicide: What We Can Learn from Chicago.
Urban Affairs Review. 42(4), 435-456
Hunt,D.B. (2001). What Went Wrong with Public Housing in Chicago? A History of the Robert Taylor Homes.
Journal of the Illinois State Historical Society.94 (1), 96-123
Kennedy, L.W. & Baron, S.W. (1993). Routine Activities and a Subculture of Violence: A Study of
Violence on the Street. Journal of Research in Crime and Delinquency. 30(1), 88-112
Koller, J.E., Stanley, V.J. (2008). Fostering Family and Community Success: Results of a 2008 Survey of Habitat
homeowners in Rochester, N.Y. Flower City Habitat for Humanity., New York.
Kringen, J.A., Felson, M. (2014) Routine Activities Approach.
Encyclopedia of Criminology and Criminal Justice. pp 4544-4551
Massey, J., Krohn, M.D., Bonati, L.M. (1989). Property Crime and the Routine Activities of Individuals
Crime and Delinquency. 26(4), 378-400
Merry, S. E. (1981). Defensible Space Undefended: Social Factors in Crime Control through Environmental
Design. Urban Affairs Review. 16(4), 397-422
Ngo, T.H.D. (2013). The Box-Jenkins Methodology for Time Series Model.
SAS Global Forum 2013. 454, 1-11
Popkin, S.J., Olson, L.M., Lurigio, A.J., Gwiasda, V.E., Carter, R.G. (1995). Sweeping Out Drugs and Crime:
Residents' Views of the Chicago Housing Authority's Public Housing Drug Elimination Program. Crime &
Delinquency. 41(1), 73-99
Poplin, S.J., Rich, M.J., Hendey, L., Hayes, C., Parilla, J., Galster, G. (2012). Public Housing Transformation and
Crime: Making the Case for Responsible Relocation. A Journal of Policy Development and Research.
14(3), 137-160
Reynald, D.M., Elffers, H. (2009). The Future of Newman's Defensible Space Theory: Linking Defensible Space
and the Routine Activities of Place. European Journal of Criminology. 6(1), 25-46
Santiago, A.M., Galster, G.C., Pettit, K.L.S. (2003). Neighbourhood Crime and Scattered-site Public
Housing. Urban Studies. 40(11), 2147-2163
Scott, M. S. (2002). Benefits and Consequences of Police Crackdowns: Washington, D.C.: U.S.
Department of Justice Office of Community Oriented Policing Services
78
Shu, S.C.F. (1999). Housing Layout and Crime Vulnerability.
Space Syntax Second International Symposium
Sherman L.W. (1993) Preventing Crime: What Works, What Doesn’t, What’s Promising- Chapter Three:
Communities and Crime Prevention. National Criminal Justice Reference Service
Skogan, W.G., Hartnett, S.M., Bump, N., Dubois, J. (2009). Evaluation of CeaseFire-Chicago
National Institute of Justice.
Smith, M.A. (2011) Senators Malcolm A. Smith; Gustavo Rivera and Rev. Al Sharpton Joined Community and
Civic Leaders for Don’t Shoot N.Y. March and Rally. Gun Control. Retrieved from
http://www.nysenate.gov/press-release/senators-malcolm-smith-gustavo-rivera-and-rev-al-sharpton-joined-
community-and-civic-l
Smith, M.R. (2001). Police-Led Crackdowns and Cleanups: An Evaluation of a Crime Control Initiative in
Richmond, Virginia. Crime & Delinquency. 47(1). 60-83
Suresh, G., Vito,G. (2009) Homicide Patterns and Public Housing: The Case of Louisville, KY (1989-2007).
Homicide Studies. 13 (4) 411– 433
Vann, I.R., Garson, G.D. (2001). Crime Mapping and Its Extension to Social Science Analysis.
Social Science Computer Review. 19(4), 471-479
White, G.F. (2001). Home Ownership: Crime and the Tipping and Trapping Processes.
Environment and Behavior. 33(3), 325-342
Williams, F. P. & McShane M.D. (2010) Criminological Theory. 5th Ed. NJ: Pearson.
Top Related