


Languages
Pages
Legal


Using the SDA on the Web
Ed Nelson, CSU Fresno
Social Science Research and Instructional Council

Survey Documentation and Analysis (SDA) Program
Written at UC Berkeley Used by ICPSR and others-- referred to as
DAS (Data Analysis System) Data files must be converted to SDA format
before use. ICPSR has converted a number of data sets in their topical archives into SDA format and are converting more.

Sources of Data at ICPSR (http://www.icpsr.umich.edu)
ICPSR topical archives– National Archive of Computerized Data on Aging
(NACDA)– National Archive of Criminal Justice Data (NACJD)– International Archive of Education Data– Substance Abuse and Mental Health Data Archive
(SAMHSA) General Social Survey National Election Study

General Procedure
Select study Open window to browse codebook Select what you want to do Click on START
What Can You Do?
Browse codebook Subset data Download data and documentation Run statistical procedures

Statistical Procedures
Frequencies Crosstabs Comparison of means Comparison of correlations
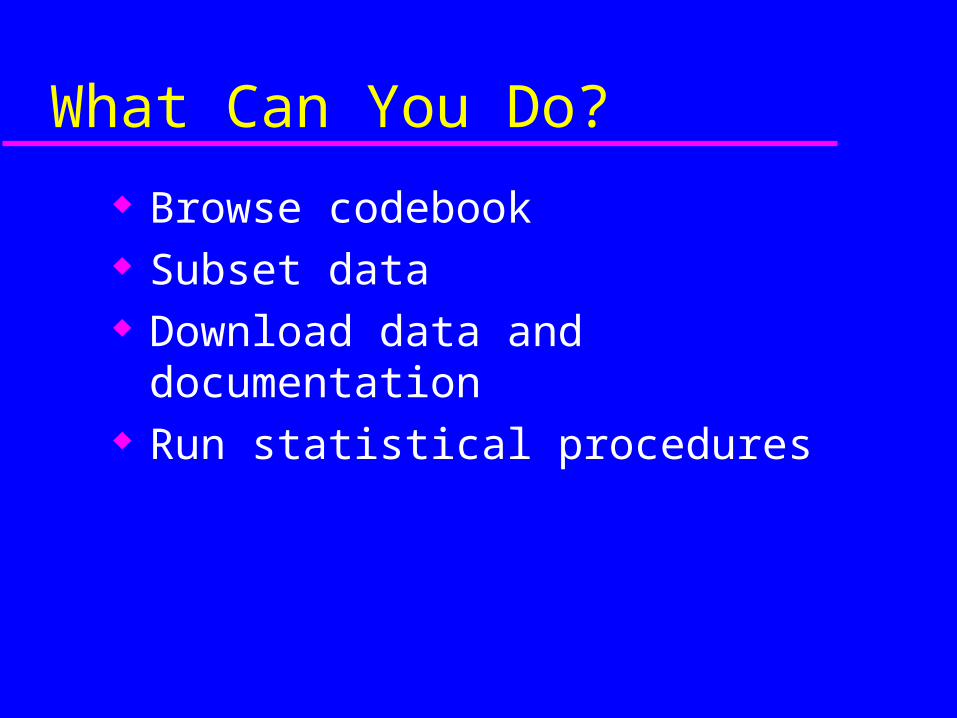
What Else Can You Do?
Recode (temporarily) Use control variables Use filter variables Use weight variable

Documentation and Data
Codebook (ASCII/PDF) SPSS/SAS/Stata syntax Data file
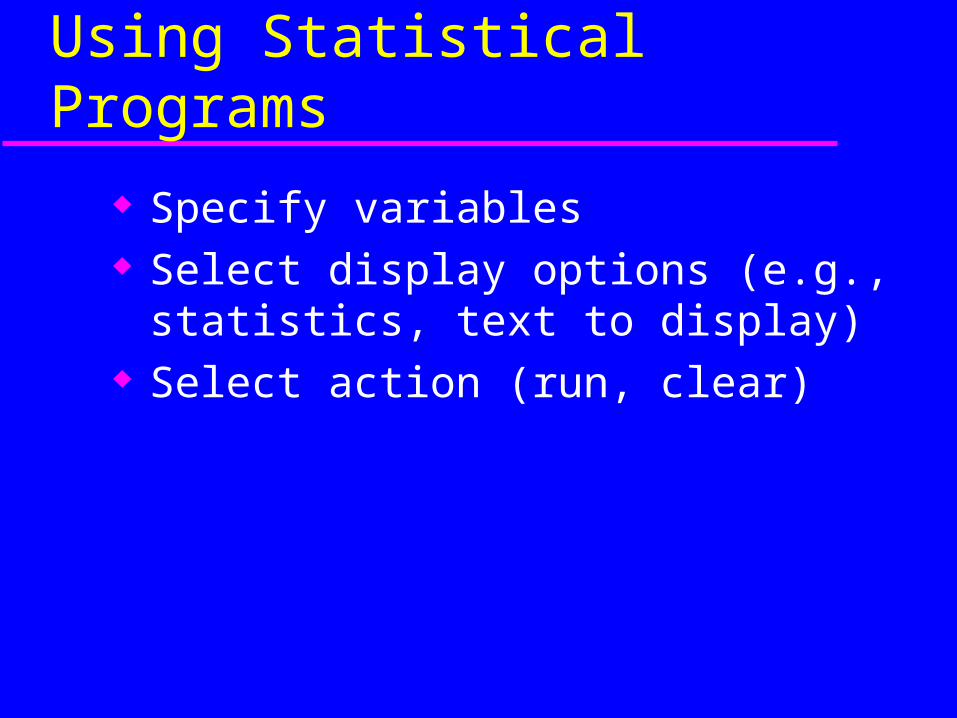
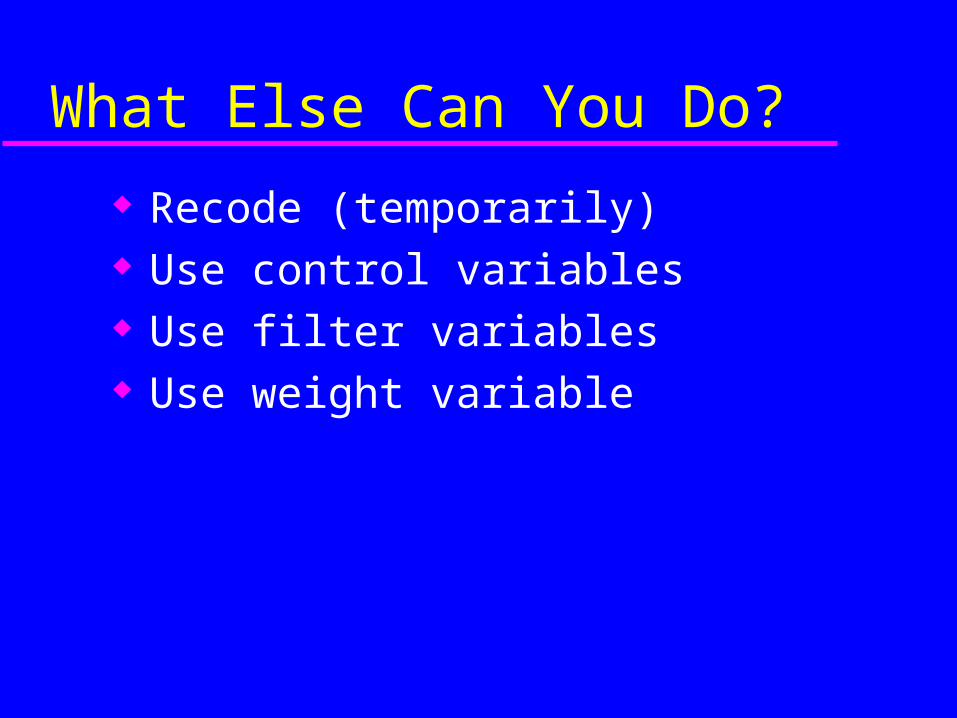
Using Statistical Programs
Specify variables Select display options (e.g., statistics, text
to display) Select action (run, clear)

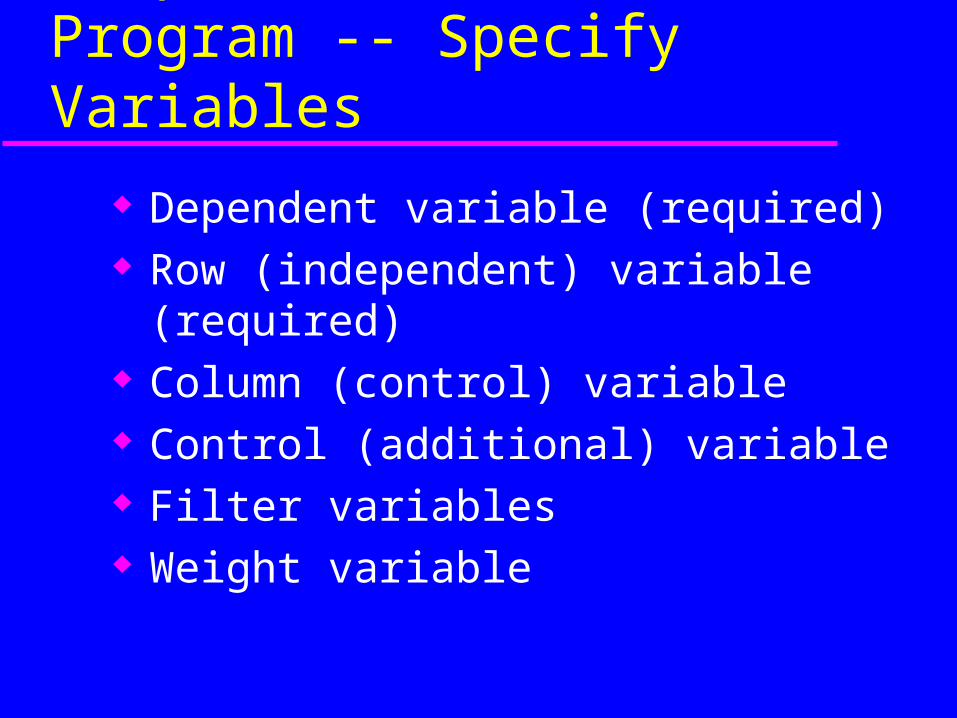
Frequencies Program -- Specify Variables
Row variable (required) Filter variables Weight variable
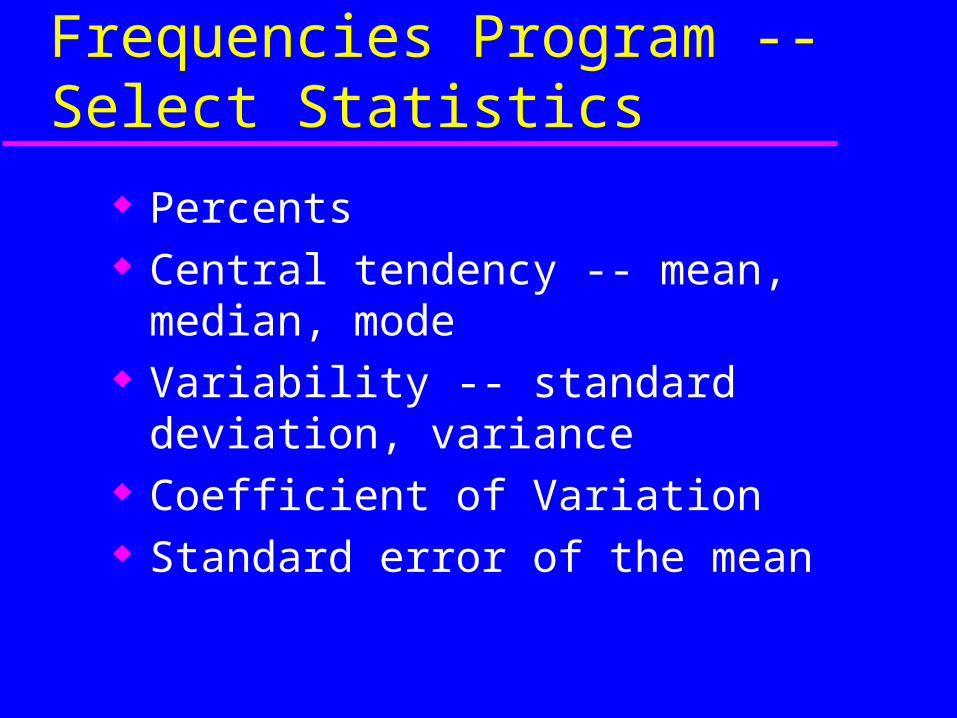
Frequencies Program -- Select Statistics
Percents Central tendency -- mean, median, mode Variability -- standard deviation, variance Coefficient of Variation Standard error of the mean

Example: Monitoring the Future
Explores values, behavior, and lifestyles of American youth
Focus on drug use 1975 to present Investigators: Jerald G. Bachman, Lloyd D.
Johnson, and Patrick M. O’Malley, University of Michigan, Institute for Social Research

Monitoring the Future -- Study Design
Self-administered questionnaire 8th, 10th, and 12th graders Multistage area probability sample Students randomly assigned to one of six
questionnaires Core questions -- demographics and drug
use
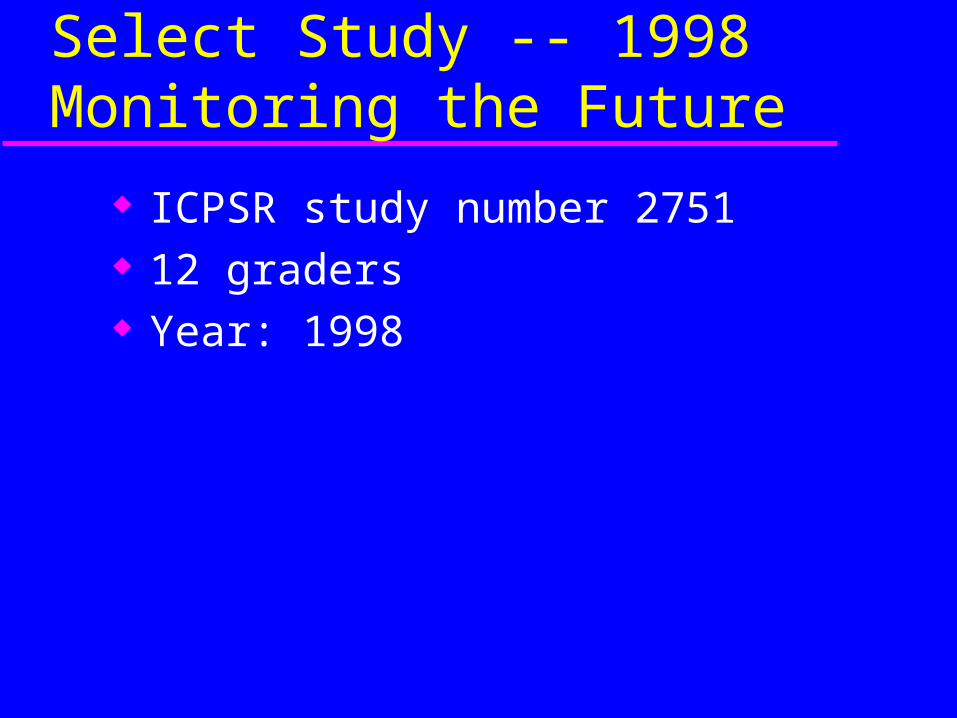
Select Study -- 1998 Monitoring the Future
ICPSR study number 2751 12 graders Year: 1998

Monitoring the Future -- Variables of Interest
Demographics: V150 (sex), V151 (race) V163 (father’s educational level), V164 (mother’s educational level)
Religious variables: V169 (attend religious services), V170 (importance of religion)
Educational aspirations: V183 (attend four-year college) Recreation: V194 (# of times go out per week), V195 (#
of dates per week) Drug use: V103 to V108 (alcohol), V112 to V114
(Marijuana), V124 to V126 (Cocaine)

Monitoring the Future -- Frequencies
Alcohol use (V107--number of times drank alcohol enough to feel pretty high)
Importance of religion in life (V170)

Crosstabs Program -- Specify Variables
Dependent variable -- row variable (required)
Independent variable -- column variable (required)
Control variables Filter variables Weight variable

Crosstabs Program -- Select Statistics
Percents -- vertical (row), horizontal (column), total
Chi square (Pearson’s, Likelihood Ratio) Eta Gamma Tau-b and Tau-c Somer’s d
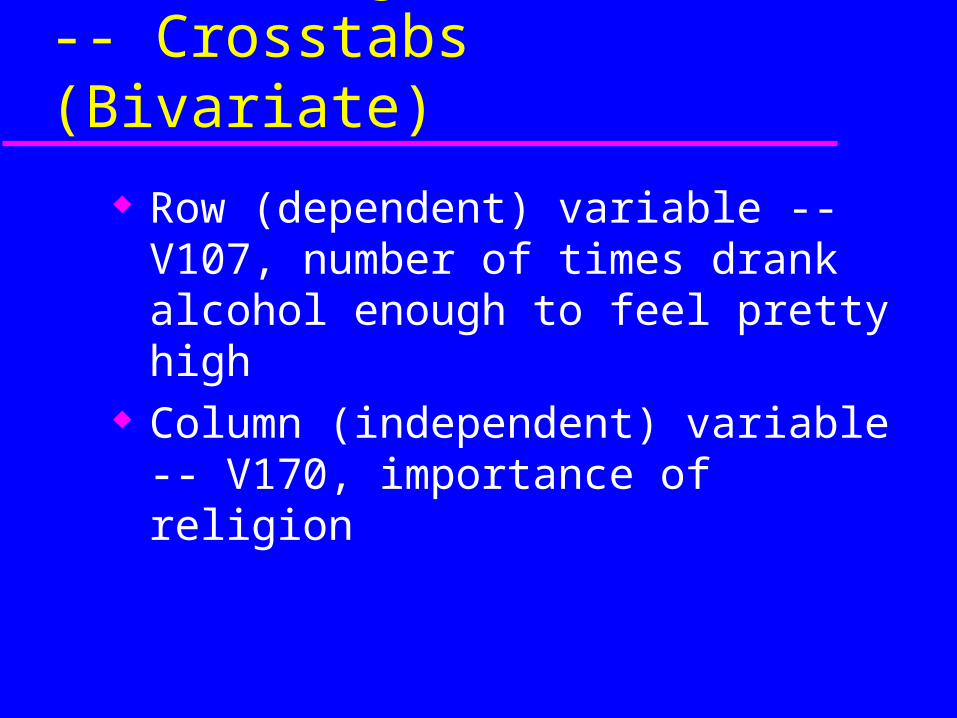
Monitoring the Future -- Crosstabs (Bivariate)
Row (dependent) variable -- V107, number of times drank alcohol enough to feel pretty high
Column (independent) variable -- V170, importance of religion

Recoding (temporarily) Let’s start by recoding the number of times the
respondent drank alcohol enough to feel pretty high into two categories--none or few (1-2) and half or more (3-5)
V107 (r: 1-2 “few or none”; 3-5 “half or more”)– Semicolon separates recodes
– Assigns values of 1, 2, etc.
– Value labels can be inserted within quotes
Missing data -- anything not recoded is treated as missing data

Monitoring the Future -- Crosstabs (Multivariate)
Now that we have run the two-variable crosstab, let’s add a control variable.
We’ll add the variable sex (V150) as the control variable.
Comparison of Means Program -- Specify Variables
Dependent variable (required) Row (independent) variable (required) Column (control) variable Control (additional) variable Filter variables Weight variable

Comparison of Means Program -- Select Statistics
Mean of dependent variable Difference from overall mean Standard deviation Number of cases, weighted number of cases Standard errors and confidence intervals

Comparison of Means Program -- Select Statistics (Advanced)
Complex samples– Standard errors– Design effect– RHO statistic
ANOVA
Monitoring the Future -- Comparison of Means
Compute the mean use of Marijuana over the respondent’s lifetime by the number of times the respondent goes out in a week
Dependent variable is V112 (use of Marijuana over one’s lifetime)
Row (independent) variable is V194 (number of times goes out in a week)
Column (control) variable is V150 (sex)
Filter Variables Can also use filter variables to select particular cases Variable name (____; ____; ___)
– Where _____ stands for a range of values or a particular value
– E.g., sex (1)– E.g., age (65-89)
Using more than one filter variable– E.g., sex (1), age (65-89) to select all those who are 1 on sex
and age 65 to 89– Joins the two variables with an AND

Subsetting Data Sets
Select the files you want to construct– Data file (ASCII)
– Codebook (ASCII)
– Data definitions for SPSS or STATA or SAS
Select the cases to include (leave blank if you want all the cases)
Select the variables to include
Top Related