


Languages
Pages
Legal


Using Phytometers to Study the
Effects of Plants Diversity on Ecosystem Functioning
Dissertation
zur
Erlangung der naturwissenschaftlichen Doktorwürde
(Dr. sc. nat.)
vorgelegt der
Mathematisch-naturwissenschaftlichen Fakultät
der
Universität Zürich
von
PETER NJOROGE MWANGI
aus
KENYA
Promotionskomitee
Prof. Dr. BERNHARD SCHMID (Leitung der Dissertation)
Prof. Dr. ANDREW HECTOR
Prof. Dr. WOLFGANG W. WEISSER
Dr. MICHAEL SCHERER-LORENZEN
Zürich, 2006

Die vorliegende Arbeit wurde von der Mathematisch-naturwissenschaftlichen Fakultät der Universität Zürich im November 2006 als Dissertation angenommen.

Table of Contents Chapter 1 General introduction 1
Chapter 2 Effects of diversity on growth and survival of individual plant 11
Chapter 3 Niche pre-emption increases with species richness in
experimental plant communities 39
Chapter 4 Removing aboveground competition does not reduce
negative biodiversity effects on Knautia arvensis transplants 73
Chapter 5 Positive interactions between nitrogen-fixing legumes andfour
different neighbouring species in a biodiversity experiment 101
Chapter 6 Summary 143
Zusammenfassung 149
Appendices 155
Acknowledgements 157
Curriculum vitae 159


C h a p t e r 1
General Introduction


General Introduction
Background
Until recently, ecologists have been taking biodiversity as a function of abiotic factors.
In plant communities, productivity obviously increases with soil fertility but the latter
reduces biodiversity. This has sometimes been used to suggest that a decline in
biodiversity might increase biotic productivity. Such simple relations are however very
rare in ecology and would have contradicted for example Darwin’s (1859) observation
that “If a plot of ground be sown with one species of grass, a similar plot be sown with
several distinct genera of grasses, a greater number of plants and greater weight of dry
herbage can be raised in the latter than the former case.” Furthermore, field
observations suggested that diversity begets stability and fuller exploitation of resources
because of temporal and spatial disparities in resource acquisition among species (e.g.
Elton, 1958; MacArthur, 1970; McNaughton, 1993). However, it is still unclear whether
biodiversity is more important as a dependent or an independent variable; and hence,
what the consequences of declining biodiversity could be. Schulze and Mooney (1993)
underscored the previously often ignored possibility that biodiversity may feed back on
ecosystem processes. This ignited a series of experimental studies mainly with plant
communities with diversity as independent and biotic productivity as dependent variable
(Naeem et al., 1996; Tilman, 1997; Hector et al., 1999; Roscher et al., 2005). The basic
tenet in this work is that if biodiversity affects the means through which energy enters
into an ecosystem (i.e. productivity), then it is likely that changes in biodiversity have
impacts on other ecosystem processes such as nutrients cycling.
It is clear from most of the previous studies that productivity of a plant
community does indeed increase with increasing diversity (synthesis by Hooper et al.,
2005). Following the work of MacArthur (1970) on niche differences, complementarity
3
Chapter 1
in resource use is one of the mechanisms that may cause high productivity in
communities that are more diverse (Hector, 1998; Hooper, 1998). This mechanism
supposes that individual plants benefit from increasing diversity because of progressive
replacements of conspecific neighbors by other species, thereby decreasing competition
for resources. An alternative hypothesis is the increasing probability of finding a more
productive species in communities with a higher number of species, commonly known
as sampling effect (Aarssen, 1997; Huston, 1997). In this case, a single or few species
drive biodiversity effects without other species in a community necessarily benefiting
from the declining niche overlap among neighbors. Most often, the two mechanisms
may occur simultaneously but with different magnitude (e.g. Hector et al., 2002;
Roscher et al., 2005).
What did not become clear from the previous studies was how changes in plant
diversity may affect a single species or a single individual plant. Positive, neutral and
negative responses of individual species have been reported (Naeem et al., 1996;
Tilman et al., 1997; Hector et al., 1999; van Ruijven & Berendse, 2003;
Dimitrakopoulos & Schmid, 2004). For example, in the study of Naeem et al. (1996),
despite positive relationship between community productivity and species richness,
eight of 16 species were negatively affected by increasing species richness (7
significantly) and only three of the remaining showed a significant increase.
Additionally, in field studies the average individual plant biomass is often derived from
the ratio of species-specific productivity to number of seeds sown (i.e. biomass per seed
sown). This approach can be erroneous if plant density changes with species richness
(Kennedy et al., 2002; Valone & Hoffman, 2002). It is therefore necessary to assess
4

General Introduction
performance of individual plants in field conditions to confirm whether the proposed
mechanism operates at the level of individual plants as supposed by the hypothesis.
High productivity, whether by complementarity or by the sampling mechanism,
often corresponds to better exploitation of resources in a species-rich community. One
can therefore hypothesize that any newly arriving species would find it increasingly
hard to establish in communities that are more diverse. Previous support of the theory
that diversity enhances invasion resistance comes from studies that use invasive species,
which are often added as seeds. In this case, it is not possible to distinguish the effect of
the host community (invasion resistance) and effect of the invader (invasiveness). By
using native species as test invaders, one can attribute the results to invasion resistance
alone.
With this background, the work in this thesis was intended to explore, whether
changing plant diversity affects performance of individual plants under a given set of
environmental conditions. The broader motivation was to establish the ecological
consequences of changing plant diversity on individual plants. The experiments were
carried out in a grassland biodiversity experiment in Jena, Germany. In one case, the
performance of individuals of selected plant species that were part of the experimental
communities was monitored. In another case, the performance of individuals that were
transplanted into the experimental communities was monitored.
Scope of Jena Experiment
This work is part of “The Jena experiment”, an integrated biodiversity project focusing
on the effects of plant diversity on element cycles, multi-trophic interactions and plant
5
Chapter 1
population processes (Roscher et al., 2004). Overall, the experiment seeks to address
some issues raised in response to findings of the first generation of biodiversity
experiments (e.g. Cedar Creek, Tilman et al., 2001; BIODEPTH, Hector et al., 1999).
The unique aspects of The Jena Experiment include nesting of diverse sub-experiments
into species diversity plots, investigation of carbon storage and studies of element
cycles and trophic interactions. The design is more balanced in terms of functional
groups and species richness gradients than in previous experiments (Roscher et al.,
2004).
The experiment was established in spring 2002 on approximately 10-ha of
former agricultural land in a river floodplain. The field site was divided into four blocks
because of a gradient of soil characteristics, perpendicular to the river (Appendix 1). A
pool of 60 grassland species that naturally occur in similar terrain of the region was
used to create experimental communities (Appendix 2). The species were divided into
four functional groups, namely grasses, small-herbs, tall-herbs and legumes, by an
ordination procedure based on 17 functional and architectural traits. Experimental
communities of monocultures, 2-, 4-, 8- and 16-species mixtures were created by
random selection (with replacement) and established in plots of 20 x 20 m at a total
density of 1000 viable seeds per square meter (Roscher et al., 2004). In addition, four
plots were seeded with all 60 species, four left bare and natural succession allowed in
four plots with two of these subjected to regular mowing. In order to test specific
hypotheses, 390 small-area plots (3.5 m x 3.5 m) were also set-up. Seventy-eight of
these smaller plots were replicates of the main plots but with nested density and
evenness treatments, 206 comprised mixtures that were created from nine potentially
dominant species, and the rest were monocultures of other species. In the experiment
6

General Introduction
with dominant species, each species occurred in all diversity levels in equal frequency
making it possible to assess performance of a single species across the full diversity
gradient. Diversity treatments included monocultures and mixtures of 2, 3, 4, 6 and 9
species (for full description of the design see Roscher et al., 2004).
Thesis Outline
Like in previous studies, community productivity was positively related to species
richness in The Jena Experiment (Roscher et al., 2005). This relationship was even
stronger in the experiment with dominant species where I assessed performance of
individuals of four species out of the nine used in this sub-experiment. In general, both
complementarity and sampling effects contributed to the overall net biodiversity effects.
It was therefore probable that individual plants of the resident species benefited from
increasing plant diversity. Conversely, one would expect that newly introduced species
find it hard to establish in species-rich communities because the resident species already
occupy most of the niche space and are using most of the resources. I transplanted four
species into plots of the main experiment to address this second question.
Chapter 2 reports the effects of species richness on individuals of selected
species in communities where total productivity increases with species richness. I
sought to determine whether diversity benefits individual plants as predicted by niche
complementarity and facilitation hypotheses.
In chapter 3, I use native species to examine how diversity influences invasion
in plant communities. Using native species as test invaders controlled for potential
interaction between the invading species and diversity of the resident community. In
7

Chapter 1
this case, the response of the test invaders can be fully attributed to diversity of the host
communities.
As a follow-up of chapter 3, the experiment reported in chapter 4 sought to
establish the relative contribution of aboveground competition to invasion resistance. I
compared the performance of individuals of one of the test invader species in full
competition and with aboveground competition removed.
Lastly, in chapter 5 we used the test invaders as phytometers to investigate
positive interactions between particular species and legumes across a gradient of plant
diversity. We assessed δ15N ratios, nitrogen concentration and nitrogen content in
tissues of the test invaders. Comparing the δ15N ratios in transplants growing in
assemblages with and without legumes should reveal nitrogen transfer from legumes,
thus confirming facilitation.
References
Aarssen, L.W. (1997) High productivity in grassland ecosystems: effected by species
diversity or productive species? Oikos, 80, 183-184.
Darwin, C. (1859) On the origin of species by means of natural selection, 6th edition,
New York.
Dimitrakopoulos, P.G. & Schmid, B. (2004) Biodiversity effects increase linearly with
biotope space. Ecology Letters, 7, 574-583.
Elton, C.S. (1958) The ecology of invasions by animals and plants. Methuen, London,
UK.
Hector, A. (1998) The effect of diversity on productivity: detecting the role of species
complementarity. Oikos, 82, 597-599.
Hector, A., Bazeley-White, E., Loreau, M., Otway, S., & Schmid, B. (2002)
Overyielding in grassland communities: testing the sampling effect hypothesis
with replicated biodiversity experiments. Ecology Letters, 5, 502-511.
8

General Introduction
Hector, A., Schmid, B., Beierkuhnlein, C., Caldeira, M.C., Diemer, M.,
Dimitrakopoulos, P.G., Finn, J.A., Freitas, H., Giller, P.S., Good, J., Harris, R.,
Hogberg, P., Huss-Danell, K., Joshi, J., Jumpponen, A., Korner, C., Leadley,
P.W., Loreau, M., Minns, A., Mulder, C.P.H., O'Donovan, G., Otway, S.J.,
Pereira, J.S., Prinz, A., Read, D.J., Scherer-Lorenzen, M., Schulze, E.D.,
Siamantziouras, A.S.D., Spehn, E.M., Terry, A.C., Troumbis, A.Y., Woodward,
F.I., Yachi, S., & Lawton, J.H. (1999) Plant diversity and productivity
experiments in European grasslands. Science, 286, 1123-1127.
Hooper, D.U. (1998) The role of complementarity and competition in ecosystem
responses to variation in plant diversity. Ecology, 79, 704-719.
Hooper, D.U., Chapin, F.S., Ewel, J.J., Hector, A., Inchausti, P., Lavorel, S., Lawton,
J.H., Lodge, D.M., Loreau, M., Naeem, S., Schmid, B., Setala, H., Symstad,
A.J., Vandermeer, J., & Wardle, D.A. (2005) Effects of biodiversity on
ecosystem functioning: A consensus of current knowledge. Ecological
Monographs, 75, 3-35.
Huston, M.A. (1997) Hidden treatments in ecological experiments: Re-evaluating the
ecosystem function of biodiversity. Oecologia, 110, 449-460.
Kennedy, T.A., Naeem, S., Howe, K.M., Knops, J.M.H., Tilman, D., & Reich, P. (2002)
Biodiversity as a barrier to ecological invasion. Nature, 417, 636-638.
MacArthur, R. (1970) Species-packing and competitive equilibrium for many species.
Theoretical Population Biology, 1, 1-11.
McNaughton, S.J. (1993). Biodiversity and function of grazing ecosystems: the
Serengeti. In Biodiversity and Ecosystem Function (eds E.-D. Schulze & H.A.
Mooney), pp. 361-383. Springer-Verlag, Berlin.
Naeem, S., Hakansson, K., Lawton, J.H., Crawley, M.J., & Thompson, L.J. (1996)
Biodiversity and plant productivity in a model assemblage of plant species.
Oikos, 76, 259-264.
Roscher, C., Schumacher, J., Baade, J., Wilcke, W., Gleixner, G., Weisser, W.W.,
Schmid & Schulze, E.-D. (2004) The role of biodiversity for element cycling
and trophic interactions: an experimental approach in a grassland community.
Basic and Applied Ecology, 5, 107-121.
9
Chapter 1
Roscher, C., Temperton, V.M., Scherer-Lorenzen, M., Schmitz, M., Schumacher, J.,
Schmid, B., Buchmann, N., Weisser, W.W., & Schulze, E.D. (2005)
Overyielding in experimental grassland communities - irrespective of species
pool or spatial scale. Ecology Letters, 8, 419-429.
Schulze, E.-D. & Mooney, H.A. (1993) Biodiversity and Ecosystem Function Springer-
Verlag, New York.
Tilman, D. (1997) Community invasibility, recruitment limitation, and grassland
biodiversity. Ecology, 78, 81-92.
Tilman, D., Knops, J., Wedin, D., Reich, P., Ritchie, M., & Siemann, E. (1997) The
influence of functional diversity and composition on ecosystem processes.
Science, 277, 1300-1302.
Tilman, D., Reich, P.B., Knops, J., Wedin, D., Mielke, T., & Lehman, C. (2001)
Diversity and productivity in a long-term grassland experiment. Science, 294,
843-845.
Valone, T.J. & Hoffman, C.D. (2002) Effects of regional pool size on local diversity in
small-scale annual plant communities. Ecology Letters, 5, 477-480.
van Ruijven, J. & Berendse, F. (2003) Positive effects of plant species diversity on
productivity in the absence of legumes. Ecology Letters, 6, 170-175.
10

C h a p t e r 2
Effects of diversity on growth and survival of individual plants
Manuscript
Together with M. Schmitz, M. Scherer-Lorenzen, C. Roscher, W.W. Weisser, B. Schmid


Diversity and individual plants
Abstract
The positive relationship between plant diversity and total community productivity
suggests that individual plants are on average bigger in communities that are more
diverse. However, the biomass of any species, corrected for sowing proportion, may
increase with species richness both because more individuals establish or because the
average individual gets bigger. We therefore studied the response of the four species
Dactylis glomerata, Phleum pratense, Geranium pratense and Trifolium pratense to
species richness at both the level of the entire population and the level of marked
individuals. Experimental plant communities of 1, 2, 3, 4, 6 or 9 species were created
from a pool of nine species. We used aboveground biomass, number of ramets, height
and survival of individual plants to assess the performance of the four test species. The
competitively superior grass species Arrhenatherum elatius negatively affected the
performance of all test species except the legume T. pratense. Within experimental
communities with or without A. elatius, marked individuals of D. glomerata responded
positively, of T. pratense and P. pratense did not respond, and of G. pratense responded
negatively to increasing species richness. Mortality of marked individuals decreased
with species richness in D. glomerata and T. pratense, indicating that these two species
also responded positively to species richness at the population level, producing more
individuals per seed sown in species-rich plots. The two components, size and number
of individuals, combined to positive population-level biomass responses of D.
glomerata, whereas population-level responses remained neutral for T. pratense and P.
pratense and negative for G. pratense. This reflects a transitive sequence of competitive
abilities between the four test species. For the strongest competitor among them, D.
glomerata, we could demonstrate a negative feed-back on its neighborhood in the
13

Chapter 2
species-rich communities, leading to loss of correlation between local richness, local
biomass, and performance of D. glomerata. These results demonstrate the subtlety of
species-specific interactions leading to community-level biodiversity effects.
Keywords:
Biodiversity experiment, competition, individual- and population-level responses,
neighborhood, species-richness effects, test plant species
14

Diversity and individual plants
Introduction
Experimental evidence shows that plant communities that are more diverse are more
productive than less diverse counterparts (e.g. Tilman et al. 1997b; Hector et al. 1999;
Tilman et al. 2001). This suggests that, on average, individuals surrounded by
heterospecific neighbors outperform individuals surrounded by conspecifics; a
phenomenon know as overyielding (Harper 1977; Tilman et al. 1996). Overyielding can
occur because of complementary resource use or facilitation between species in
mixtures. For example, individuals of a deep-rooting species have fewer neighbors
sharing resources deep in the soil when in a mixture with a shallow-rooting species; or
individuals of a non-legume species can take up nitrogen fixed by neighboring legume
individuals when growing together (Vandermeer 1989). Niche complementarity may
also involve differences in form and timing of resource uptake among species, allowing
for chemical and temporal resource partitioning (Hooper 1998; McKane et al. 2002).
The analysis of this phenomenon and its potential application to intercropping in
agriculture has a long history in two-species mixtures (de Wit et al. 1966; Harper 1977;
Vandermeer 1989). However, only with the recent biodiversity experiments the
extension to more than two or three species has been attempted (Tilman et al. 1997b;
Hooper 1998; Loreau & Hector 2001).
Unlike studies with two species, multi-species biodiversity experiments are more
difficult to interpret because there could be many potential mechanisms leading to
overyielding of the plant community as a whole. For example, in addition to
complementary resource use there could be a sampling effect related to the increased
chances of finding a highly productive species in species-rich communities (Aarssen
1997; Huston 1997). Furthermore, even in an overyielding mixture there could be some
15
Chapter 2
species pairs with complementary or facilitative interactions, and others where one
member grows at the expense of the other. To better understand the mechanisms leading
to overyielding, it is therefore necessary to study the effects of species richness and
more generally of plant diversity (i.e. including effects of species compositions) on the
performance of individual species and even individual plants (Naeem et al. 1996;
Dimitrakopoulos & Schmid 2004). In previous experiments, which have done the first
of these two things, positive responses to increasing species richness have been found
for some species but not others (Naeem et al. 1996; Tilman et al. 1997a; Hector et al.
1999; van Ruijven & Berendse 2003; Dimitrakopoulos & Schmid 2004). However,
because in these analyses the species responses were expressed per individual sown or
planted, they reflected population-level responses: a positive response to species
richness could have occurred because more individuals established or because the
established individuals were bigger in species-rich than in species-poor communities. In
some cases, diversity has indeed been shown to enhance total community density
(Kennedy et al. 2002) or population size of individual species (Valone & Hoffman
2002).
In the current study, we analyzed the response to increasing species richness in
four test species at both the population and the individual level. We measured the
performance of marked individuals of these species and of the surrounding community
in experimental grassland plots established from a pool of nine potentially dominant
species. Following an old quest (Harper 1967), our goal was to establish the missing
links between the aggregated measures of community and species productivity and the
performance of individual plants in biodiversity experiments, at least for four species
representing the three functional groups grasses, legumes and tall herbs (Roscher et al.
16

Diversity and individual plants
2004). Specifically we addressed the following questions: (a) is increasing community
productivity with increasing species richness paralleled by increasing average size of
individuals of the different species; (b) is increasing community productivity with
increasing species richness paralleled by increasing community density, i.e. increasing
establishment success of the different species; (c) how does the presence or absence of
particular species in experimental plots affect the responses of the test species at
population and individual level?
Material and methods
Experimental site and design
This study was carried out on plots of a large-scale grassland biodiversity experiment in
Jena, Germany (“The Jena Experiment”, http://www.the-jena-experiment.de). The
experiment was set up in spring 2002 on former agricultural land in the flood plain of
the river Saale (Roscher et al. 2004). The site was divided into four blocks following a
gradient in soil characteristics perpendicular to the river Saale. Experimental
communities were established from a pool of nine potentially dominant species, which
nevertheless varied considerably in monoculture yields. They included five grasses,
Alopeculus pratense L., Arrhenatherum elatius L., Dactylis glomerata L., Phleum
pratense L. and Poa trivialis L., two non-legume herbs, Anthriscus sylvestris L. and
Geranium pratense L., and two legumes, Trifolium pratense L. and Trifolium repens L.
Monocultures and 2-, 3-, 4-, 6- or 9-species mixtures were created, with each species
occurring in eight different mixtures per richness level > 1. Each monoculture and each
mixture was replicated in two plots (Table 2.1). It was therefore possible to evaluate the
17

Chapter 2
performance of a single species across the full species richness gradient (n = 74 plots
per species). The plots measuring 3.5 × 3.5 m were seeded at a total density of 1000
viable seeds per square meter. We maintained the initial species richness in the plots by
removing unsown plants in April and July each year and the plots were mown at the end
of May and August each year.
Table 2.1 Number of plots for each of four test species and total number of plots at each species richness level in the experiment (plots with more than one test species could be used in more than one separate analysis of test species; see also Fig. 2.3).
Species richness Species composition
(= mixture term)
Number of different mixtures
per test species
Number of plots per test
species
Total number of plots per
richness level
1 Monoculture, i 1 2 18
2 i + 1 other species 8 16 72
3 i + 2 other species 8 16 48
4 i + 3 other species 8 16 36
6 i + 5 other species 8 16 24
9 i + 8 other species 1 21 8
34 68 206 1 Each test species was marked only in 2 of the 8 highest-richness plots. Thus, at this richness level, plots were never used for more than one target species at the same time.
Target species and data collection
We chose four of the nine species, D. glomerata, P. pratense, T. pratense, G. pratense,
as our target species. We avoided A. elatius because of its high competitive dominance,
A. pratense, P. trivialis and T. repens because of their stoloniferous growth form, which
would have made it hard to distinguish individuals, and A. sylvestris because of its
initial poor establishment. Between 23 and 30 July 2002, 2 months after sowing, ten
18

Diversity and individual plants
individuals of each target species were marked in each experimental plot where they
occurred. For each species, individuals nearest to 30-cm interval marks along a line 30
cm parallel to one edge of the plot were tagged with a white plastic label fixed next to
the plant. Each label was numbered to ease identification during data collection. Fewer
than ten individuals per plot were marked in G. pratense, which had poorly germinated.
Before mowing at the end of August 2002, we measured the height and counted the
number of ramets (number of leaves in G. pratense) of all marked individuals. Then we
cut them at 3 cm from the ground and determined the dry mass of the aboveground plant
parts. Except for G. pratense, where not enough individuals re-established, the marked
plants were censured early in spring 2003 and after every succeeding mowing in 2003
and 2004 to monitor their mortality, without further harvesting.
Between 26 May and 4 June of the following year, 2003, we marked five new
plants of each target species. We again recorded their height and number of ramets at
the peak of each growing season and cut the plants at 3 cm above the ground to
determine their average aboveground biomass, pooling individuals of the same species
per plot.
Species-specific and community measurements
During each growing season, community and species-specific aboveground biomass
was determined in a randomly selected 20 x 50 cm (0.1 m2) area in each of the 206
plots. In the present study, we are using the biomass harvests from spring 2003 and
spring 2004 to assess biodiversity effects on population and community levels. For the
analysis, species-specific biomass values were multiplied by species richness to correct
for the decreasing proportion with increasing species richness and to make the values
19

Chapter 2
qualitatively comparable with whole-plot community biomass. We refer to this
corrected biomass as a population-level variable. We also recoded the canopy height
before each harvest in August 2002, 2003 and 2004 and in May 2004. In addition, we
estimated the total density of plants by counting the number of rooted individuals in an
area of 10 x 100 cm after the spring mowing in 2003.
Dactylis glomerata neighborhood
Between 24 May and 4 June 2004, for each plant of D. glomerata marked in spring
2003, we in addition counted the number of ramets of each neighboring species within a
radius of 12.5 cm to determine neighborhood density and diversity. Comparable studies
suggest that this neighborhood size is adequate for neighborhood analysis (e.g. Kennedy
et al. 2002). Subsequently, we harvested the aboveground biomass of this neighborhood
at 3 cm above the ground (harvested area per plot = 0.245m2), separated the material
into species and determined their biomass.
Statistical analysis
We analyzed plot means of the variables measured on the marked individuals of the test
species and of the population and the community variables with general linear models
using sequential sums of squares (Schmid et al. 2002). The mortality rate of the marked
individuals was analyzed with a generalized linear model, using binomial errors and a
complementary log-log link (Egli & Schmid 2001). We used the number of plants that
died in each time interval as the response variable. Biomass data were log-transformed
before analysis to improve the normality of residuals.
20

Diversity and individual plants
Our initial statistical model included block, sown species richness, species
composition (= mixture), plot and census in a repeated-measures approach. However,
when we found a strong contrast for the presence or absence of the highly competitive
A. elatius in mixtures (explaining most of the species composition = mixture effects),
we removed the effect of this species before analyzing effects of species richness in
subsequent analyses. Because there was no interaction between species richness and
census, we only report mortality results for the July 2002 cohort. The hierarchical nature
of our design required that we use several error terms for testing the significance of
terms: block and mixture were tested against plot, presence of A. elatius and species
richness against mixture and the remaining terms were tested against the residuals. We
partitioned species richness into either a log-linear or a linear contrast and
corresponding deviations, as is usually done in the analysis of biodiversity experiments
(Schmid et al. 2002). We then selected the contrast that had a higher sum of squares for
the particular variable; if the deviation was small, we pooled it with the mixture term.
Most interactions had P values > 0.1; hence, they are not reported here. All analyses
were calculated with the software product Genstat 6th Edition, Release 6.2 (Payne et al.
2002).
Results
Effects of diversity on the entire community and on the populations of the test species
In the community-level analysis of all 206 plots, peak community aboveground biomass
increased linearly with the logarithm of species richness (Table 2.2, Fig. 2.1a). This was
paralleled by an increase in canopy height (log-species richness: F1,94 = 27.91, P <
21

Chapter 2
0.001). Communities in which A. elatius was present on average had a higher biomass
than plots without this grass species (Table 2.2, Fig. 2.1a). Only at high richness levels
(4 or 6 species) the presence of A. elatius was no longer “necessary” to reach high yield,
which was reflected in a significant interaction of the presence of A. elatius and the
logarithm of species richness (Table 2.2, Fig. 2.1a). The community biomass also varied
considerably among different species composition and between the two years, and the
effect of species richness was weaker in 2004 than in 2003 (Table 2.2).
Table 2.2 Summary analyses of variance of spring 2003 and spring 2004 aboveground biomass of the test species (population-level, n = 68) and the entire community (n = 206) showing F and P values. Population-level data were obtained by multiplying component yields of species with species richness to correct for decreasing sowing proportions with increasing richness level. Log-SR is the logarithm of species richness.
D. glomerata P. pratense T. pratense G. pratense Community Source of variation d.f. F P F P F P F P F P Block 3 8.24 <0.001 1.15 0.341 3.38 0.028 3.38 0.029 9.71 <0.001Presence of A. elatius 1 59.93 <0.001 15.81 <0.001 7.02 0.013 10.31 0.003 54.11 <0.001Log-SR 1 32.86 <0.001 2.32 0.138 0.59 0.447 8.91 0.006 23.89 <0.001Pres. A. e. x Log-SR 1 4.08 0.052 0.02 0.899 0.01 0.940 2.74 0.109 12.41 0.001Mixture 31 0.70 0.847 5.15 <0.001 1.04 0.448 2.82 0.002 2.10 <0.001Plot 36 1.72 0.026 0.73 0.849 1.68 0.031 0.91 0.605 0.76 0.944
Year 1 15.45 <0.001 68.24 <0.001 18.43 <0.001 2.91 0.093 120.7
2 <0.001Log-SR x Year 1 0.21 0.648 3.11 0.082 3.78 0.056 3.41 0.070 18.23 <0.001
The population-level analyses showed that, species richness had a positive effect
on biomass (corrected for sowing proportion) in D. glomerata, no significant effect in P.
pratense and T. pratense and a negative effect in G. pratense (Table 2.2, Fig. 2.1b-e).
The presence of A. elatius in mixtures reduced the biomass of all four target species
while further effects of particular species compositions were relatively small (Table
2.2).
22

Diversity and individual plants
664 643 443 43 4 64433 4322 322 62 32 33222 422222 311 3 6 9
Abo
vegr
ound
bio
mas
s [g
m-2
]
0200400600800
100012001400
Species richness [log]
664 643 443 43 4 64433 4322 322 62 32 33222 422222 311 3 6 9
0
100
200
300
4000
500
1000
1500
2000
2500
3000
3500
0
500
1000
1500
2000b c
e
0
200
400
600
800
1000a
d
Figure 2.1 Average (spring 2003 and spring 2004) aboveground biomass of the entire community (a; n = 206) and of populations of the test species (a) D. glomerata, (b) P. pratense, (c) T. pratense, (d) G. pretense (all n = 68) as a function of the logarithm of species richness. The observed values for the species were multiplied by the corresponding richness level to correct for decreasing sowing proportions with increasing richness. Plots with A. elatius are shown with filled circles and continuous lines; plots without A. elatius with open circles and broken lines.
Total community density of plants in spring 2003 (n = 206) was slightly higher
in plots with A. elatius (F1,96 = 3.81, P = 0.054) and tended to increase with the
23

Chapter 2
logarithm of species richness (F1,96 = 3.67, P = 0.058). The low significances for these
trends were due to the large and significant variation in the corresponding error term,
i.e. differences between particular species compositions within richness levels (F96,103 =
2.60, P < 0.001). Community density ranged from less than 100 plants / m2 in mixtures
without grasses to over 500 plants / m2 in mixtures containing only grasses. As a
covariate, community density did not explain a significant amount of variation in
community biomass nor in the biomass of any of the test species.
The presumed gradient in soil characteristics (block effect) had significant effect
on the community and population biomass of the test species except P. pratense,
indicating the importance of environmental heterogeneity. Plants biomass decreased
with distance from the river.
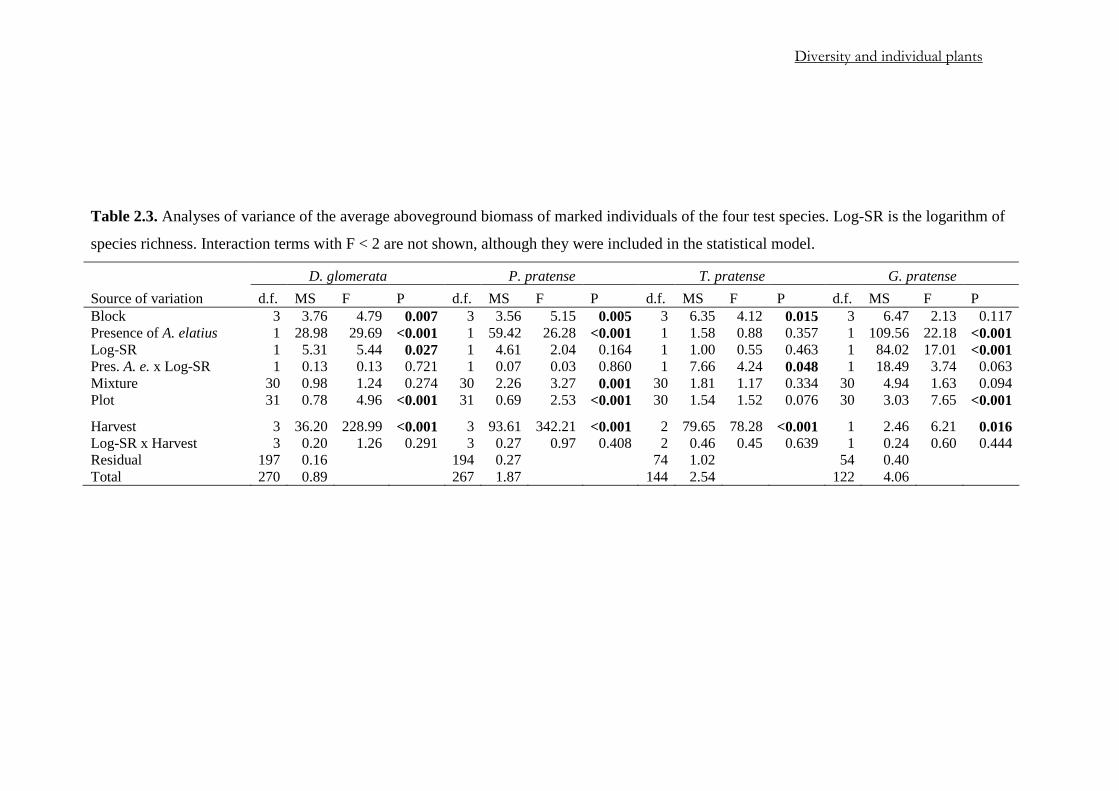
Effect of diversity on individuals of the test species
When the competitively strong grass A. elatius was present in a mixture, it strongly
reduced the biomass of marked individuals of all test species except T. pratense (Table
2.3, Fig. 2.2). The size reduction was 41% in D. glomerata, 20% in P. pratense and
53% in G. pratense. Similarly, the presence of A. elatius in mixtures had negative
effects on the number of shoots (leaves in G. pratense) and the height of marked
individuals of all target species except T. pratense. In D. glomerata, the number of
shoots declined by 33% (F1,30 = 21.57, P < 0.001) and the height by 9% (F1,30 = 7.88, P
= 0.009), in P. pratense the number of shoots declined by 5.4% (F1,30 = 16.57, P <
0.001) and the height 4% (F1,30 = 4.42, P = 0.044) and in G. pratense the number of
leaves declined by 26% (F1,30 = 7.03, P = 0.013).
24
Diversity and individual plants
Table 2.3. Analyses of variance of the average aboveground biomass of marked individuals of the four test species. Log-SR is the logarithm of
species richness. Interaction terms with F < 2 are not shown, although they were included in the statistical model.
D. glomerata P. pratense T. pratense G. pratense Source of variation d.f. MS F P d.f. MS F P d.f. MS F P d.f. MS F P Block 3 3.76 4.79 0.007 3 3.56 5.15 0.005 3 6.35 4.12 0.015 3 6.47 2.13 0.117 Presence of A. elatius 1 28.98 29.69 <0.001 1 59.42 26.28 <0.001 1 1.58 0.88 0.357 1 109.56 22.18 <0.001 Log-SR 1 5.31 5.44 0.027 1 4.61 2.04 0.164 1 1.00 0.55 0.463 1 84.02 17.01 <0.001 Pres. A. e. x Log-SR 1 0.13 0.13 0.721 1 0.07 0.03 0.860 1 7.66 4.24 0.048 1 18.49 3.74 0.063 Mixture 30 0.98 1.24 0.274 30 2.26 3.27 0.001 30 1.81 1.17 0.334 30 4.94 1.63 0.094 Plot 31 0.78 4.96 <0.001 31 0.69 2.53 <0.001 30 1.54 1.52 0.076 30 3.03 7.65 <0.001
Harvest 3 36.20 228.99 <0.001 3 93.61 342.21 <0.001 2 79.65 78.28 <0.001 1 2.46 6.21 0.016 Log-SR x Harvest 3 0.20 1.26 0.291 3 0.27 0.97 0.408 2 0.46 0.45 0.639 1 0.24 0.60 0.444 Residual 197 0.16 194 0.27 74 1.02 54 0.40 Total 270 0.89 267 1.87 144 2.54 122 4.06

Chapter 2
3 632 32 42 3 4 62 33 432 4 61 4 622 333 42 422 42 4221 2 3 663 4 902468101214
Sown species richness [log]
3 632 32 42 3 4 62 33 432 4 61 4 622 333 42 422 42 4221 2 3 663 4 9
Mea
n pl
ant b
iom
ass [
g]
0
2
4
6
8
10c d
Mea
n pl
ant b
iom
ass [
g]
0
2
4
6
8
10b
0
2
4
6
8
10a
Figure 2.2 Average (2003 and 2004) aboveground biomass of marked individuals of the test species (a) D. glomerata (four harvests), (b) P. pratense (four harvests), (c) T. pratense (three harvests) and (d) G. pratense (three harvests) as a function of the logarithm of species richness. Plots with A. elatius are shown with filled circles and continuous lines; plots without A. elatius with open circles and broken lines. Note that the points are staggered along the x-axis for clarity and that few of the marked individuals of G. pratense survived in plots with A. elatius.
After factoring out the effects of A. elatius, species richness had positive effects
on individual biomass in D. glomerata and negative effects in G. pratense (Table 2.3,
Fig. 2.2). In addition, the negative effect of species richness on G. pratense was stronger
in the absence than in the presence of A. elatius but not statistically significant because
of high mortality of this test species in communities with in A. elatius (Table 2.3, Fig.
2.2). The biomass of marked individuals of the other two test species was not influenced
by species richness, which corresponds to their non-significant responses to species
richness at the population-level (see above). There was, however, a significant
26

Diversity and individual plants
interaction effect of species richness and presence of A. elatius on biomass of T.
pratense (Table 2.3, Fig. 2.2).
Species richness had no effect on the number of modules (shoots) on the marked
individuals of the test species except G. pratense where number of leaves declined with
increasing species richness. However, individuals of P. pratense were taller in species-
rich mixtures (F1,30 = 9.08, P = 0.005), whereas those of G. pratense were taller in
species-poor mixtures (F1,30 = 8.46, P = 0.007). Furthermore, species composition had a
strong influence on biomass of marked individuals of P. pratense (mixture term in
Table 2.3) and height and number of modules in marked individuals of P. pratense
(shoots) and G. pratense (leaves).
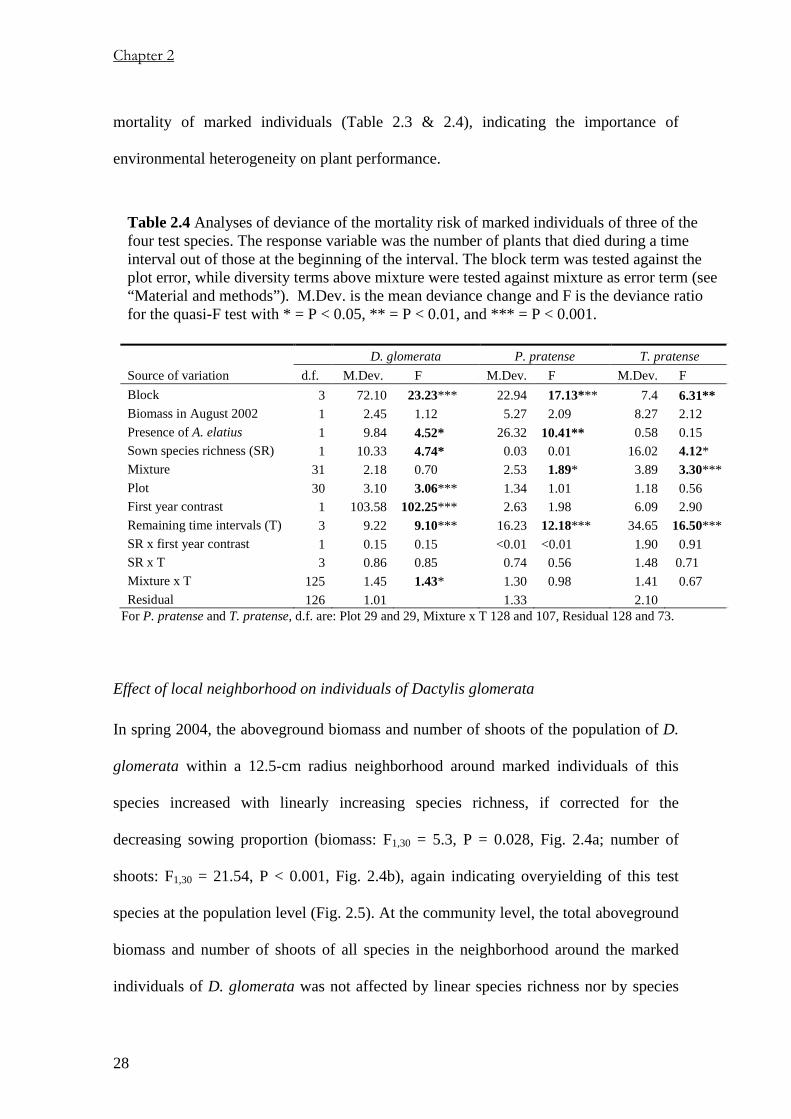
Rates of mortality of marked individuals within the first year were 82%, 49%
and 40% for T. pratense, D. glomerata and P. pratense, respectively, and then declined
considerably in the second year (first year contrast and remaining time intervals in
Table 2.4, Fig. 2.3). The presence of A. elatius in mixtures increased the risk of
mortality of the two grass test species (Table 2.4) but not of T. pratense, perhaps due to
a legume-grass complementarity in the latter. Increasing species richness (in this case
using the linear rather than the log-linear contrast) reduced the risk of mortality of D.
glomerata and T. pratense individuals after taking into account the effect of A. elatius.
Furthermore, mortality risk in P. pratense and T. pratense, but not in D. glomerata, was
significantly affected by particular species compositions. For example, mortality of P.
pratense individuals was particularly high in mixtures containing Poa trivialis.
As in the community- and population-level variables, the presumed gradient in
soil characteristics (block effect) had a significant effect on the performance and
27
Chapter 2
mortality of marked individuals (Table 2.3 & 2.4), indicating the importance of
environmental heterogeneity on plant performance.
Table 2.4 Analyses of deviance of the mortality risk of marked individuals of three of the four test species. The response variable was the number of plants that died during a time interval out of those at the beginning of the interval. The block term was tested against the plot error, while diversity terms above mixture were tested against mixture as error term (see “Material and methods”). M.Dev. is the mean deviance change and F is the deviance ratio for the quasi-F test with * = P < 0.05, ** = P < 0.01, and *** = P < 0.001.
D. glomerata P. pratense T. pratense Source of variation d.f. M.Dev. F M.Dev. F M.Dev. F Block 3 72.10 23.23*** 22.94 17.13*** 7.4 6.31** Biomass in August 2002 1 2.45 1.12 5.27 2.09 8.27 2.12 Presence of A. elatius 1 9.84 4.52* 26.32 10.41** 0.58 0.15 Sown species richness (SR) 1 10.33 4.74* 0.03 0.01 16.02 4.12*
Mixture 31 2.18 0.70 2.53 1.89* 3.89 3.30***Plot 30 3.10 3.06*** 1.34 1.01 1.18 0.56 First year contrast 1 103.58 102.25*** 2.63 1.98 6.09 2.90 Remaining time intervals (T) 3 9.22 9.10*** 16.23 12.18*** 34.65 16.50***SR x first year contrast 1 0.15 0.15 <0.01 <0.01 1.90 0.91 SR x T 3 0.86 0.85 0.74 0.56 1.48 0.71 Mixture x T 125 1.45 1.43* 1.30 0.98 1.41 0.67 Residual 126 1.01 1.33 2.10
For P. pratense and T. pratense, d.f. are: Plot 29 and 29, Mixture x T 128 and 107, Residual 128 and 73.
Effect of local neighborhood on individuals of Dactylis glomerata
In spring 2004, the aboveground biomass and number of shoots of the population of D.
glomerata within a 12.5-cm radius neighborhood around marked individuals of this
species increased with linearly increasing species richness, if corrected for the
decreasing sowing proportion (biomass: F1,30 = 5.3, P = 0.028, Fig. 2.4a; number of
shoots: F1,30 = 21.54, P < 0.001, Fig. 2.4b), again indicating overyielding of this test
species at the population level (Fig. 2.5). At the community level, the total aboveground
biomass and number of shoots of all species in the neighborhood around the marked
individuals of D. glomerata was not affected by linear species richness nor by species
28

Diversity and individual plants
composition, although the number of species in this local area correlated well with sown
species richness (r2 = 0.79, F1,28 = 118.9, P < 0.001).
Months after marking
2 9 12 15 21 252 9 12 15 21 252 9 12 15 21 25
0
2
4
6
8
10123469
2
4
6
8
10
2
4
6
8
10
D. glomerata
P. pratense
T. pratenseMea
n nu
mbe
r of s
urvi
ving
phy
tom
eter
s
Figure 2.3 Average survivorship curves of ten individual per plot per test species marked in July 2002 and monitored at different time intervals until August 2004. Note since too few individuals of the forth test species, G. pratense were there by the second census this species was not included in this analysis.
29

Chapter 2
As covariates, these neighborhood attributes (community-level) had no effect on the
performance of marked individuals of D. glomerata and did not change the pattern of
effects of diversity treatments on the biomass of these individuals, i.e. effects of the
presence or absence of A. elatius (F1,31 = 55.92, P < 0.001) and species richness (linear
contrast F1,31 = 4.7, P = 0.038) remained significant (Fig. 2.4c). The number of shoots
per marked individual of D. glomerata was also still negatively affected by presence of
A. elatius (F1,31 = 20.0, P < 0.001) after correcting for neighborhood attributes but not
affected by species richness (linear contrast F1,31 = 1.53, P > 0.1) (Fig. 2.4d).
Popu
latio
n bi
omas
s [g]
*
0
30
60
90
120
150a
Popu
latio
n sh
oots
*
0
50
100
150
200
250
300b
3 632 32 42 3 4 62 33 432 4 61 4 622 333 42 422 42 4221 2 3 663 4 9
Shoo
ts p
er p
lant
0
5
10
15
20
25
30d
Sown species richness
3 632 32 42 3 4 62 33 432 4 61 4 622 333 42 422 42 4221 2 3 663 4 9
Mea
n pl
ant b
iom
ass (
g m
-2)
0
3
6
9
12
15
18
c
Figure 2.4 Comparison of effects of sown species richness on the individuals-level performance measures (c) plant biomass and (d) number of shoots of marked individuals of D. glomerata and the population-level performance measures (a) biomass and (b) number of shoots of D. glomerata within a 12.5-cm radius neighborhood (*) of the marked individuals in spring 2004. Plots with A. elatius are shown with filled circles and continuous lines; plots without A. elatius with open circles and broken lines.
30
Diversity and individual plants
Discussion
Effects of diversity on the entire community and on populations of the test species
As in many other biodiversity experiments (Hooper et al. 2005), a positive relationship
between species richness and community biomass has been found in the experiment at
Jena (Germany) using a pool of nine dominant species (Roscher et al. 2005). In our
present study, we could test if this community-level response was paralleled by
population- and individual-level responses in four members of the species pool. In the
previous biodiversity experiments population-level responses varied between species,
with some species contributing more than others to the community-level response and
some species even responding negatively to increasing species richness (Naeem et al.
1996; Tilman et al. 1997a; Hector et al. 1999; van Ruijven & Berendse 2003). We
found all these types of responses among our four test species: the grass D. glomerata
increased its biomass per seed sown with increasing species richness, the grass P.
pratense and the legume T. pratense did not respond significantly and the herb G.
pratense showed a decreasing response. These differences can be interpreted to be a
consequence of decreasing competitiveness between the four test species and the other
species in the pool.
The most competitive species in the pool, the grass A. elatius, which was not
included as test species, contributed so strongly to community biomass that we had to
analyze the species richness effects within two groups of communities, with or without
A. elatius. The presence of A. elatius in mixtures had a negative effect on the two grass
test species and on G. pratense, but not on the legume T. pratense. Again, this result can
be interpreted by competitive inferiority of three of the test species relative to the most
competitive species of the pool. Presumably, the legume species could avoid
31

Chapter 2
competitive suppression by this grass species due to its capability to fix atmospheric
nitrogen, while the grasses themselves could not do so (Fargione et al. 2003).
Sown species richness
33 6632 32 944 62 632 4 632 3 43 6432 4 61 664 6622 6332 3 42 43 442 3 962 42 4221 2 3 44 663 64
Den
sity
[Sho
ots m
-2]
0
500
1000
1500
Prod
uctiv
ity [g
m-2
]
0
200
400
600
800
1000
Figure 2.5 Effects of species richness on aboveground biomass (upper panel) and density of shoots (lower panel) of D. glomerata populations in local neighborhoods of marked individuals of this species in spring 2004 (excluding marked individual and not corrected for decreasing sowing proportions with increasing sown species richness). Filled symbols: expected yield value (i.e. yield in monoculture divided the number of species in the mixture), open symbols: observed yield values. Open symbols above the line connecting expected yield values indicate overyielding.
The weak competitive ability of the herb G. pratense both in relation to the
presence of A. elatius and to increasing species richness in mixtures might have been
due to its late germination. Watkinson (1997) asserts that plants germinating even ten
days late may achieve negligible biomass in competition with neighbors. Fridley (2003)
took into account differences in time of germination in the analysis of his biodiversity
experiment. In the present study, we could not do this. Instead, we marked individual
plants of G. pratense and the other test species to follow more closely their fate as a
population in the different experimental communities.
32

Diversity and individual plants
Effects of sown diversity on individuals of the target species
The marking of individuals allowed us to investigate if the population-level responses of
the four test species were due to differential establishment after sowing, i.e. different
numbers of individuals in the populations, or to differential growth of individuals.
Previous studies had to assume that establishment probability did not change between
species richness levels to infer individual-level responses. While this may be the case if
individual seedlings are planted and mortality is zero (e.g. Dimitrakopoulos & Schmid
2004), it may be less likely in biodiversity experiments which are set up by sowing
seeds. Indeed, there are indications that community density of plants can increase with
sown species richness (Kennedy et al. 2002; Schmitz et al., unpublished data).
Marked individuals of two of our test species, D. glomerata and T. pratense, did
have a decreased mortality risk in species-rich communities; and this should have led to
increased numbers of established individuals per seed sown. However, we could not
find a significant decrease in mortality risk in the other two test species (for G. pratense
there were not enough individuals for a statistical test). This suggests that the first two
species might have responded more strongly to their own sowing density, which
decreased with increasing species richness, whereas the other two responded more
strongly to the overall sowing density, which remained constant across richness levels.
Alternatively, D. glomerata and T. pratense individuals might have perceived low
effective density in mixtures while the other two perceived higher effective density in
mixtures despite constant sowing density (Connolly, 1986). The differential mortality
responses between species resulted in a slight increase of total community density
(established individuals) with increasing species richness. It is well known that
mortality and individual size are density-dependent attributes in mono-specific plant
33

Chapter 2
stands (Watkinson 1997); however, it is less clear how these effects operate in mixed
stands.
With regard to response of the marked individuals to increasing species richness
(and thus decreasing within-species density), plant biomass in D. glomerata increased
and subsequently the population-level biomass, plant height in P. pratense increased but
there was no response in T. pratense. The latter two species also showed no response at
the population-level. On the other hand, plant biomass, height and number of leaves in
G. pratense decreased, corresponding to population-level response. Thus, it appears that
in all our test species population responses were more or less paralleled by individual
responses. Nevertheless, at the same time there was also a “pure” population-level
component, reflected in the decreased mortality risk with increasing species richness for
D. glomerata. The effects of species richness and that of the presence of the strongest
competitor, A. elatius, in our experimental communities seemed to be absorbed by the
test plants in a balanced way: they adjusted numbers and sizes of individuals within
their populations in a parallel manner.
Again, the different responses of the four test species at the individual level can
be interpreted by a transitive ranking in competitive ability in the order D. glomerata >
T. pratense and P. pratense > G. pratense. It then follows that for D. glomerata an
increase in the frequency of interspecific neighbors with increasing species richness
reduced competition for marked individuals, whereas for T. pratense and P. pratense
inter- and intraspecific neighbors had about equal effects and for marked individuals of
G. pratense interspecific neighbors were more detrimental than intraspecific neighbors
were. Consequently, and as demonstrated in a competition experiment by Stoll & Prati
(2001), weak competitors such as G. pratense may best establish and grow in
34

Diversity and individual plants
monospecific patches and therefore benefit from aggregated species distributions,
whereas the opposite should be the case for strong competitors such as D. glomerata
and A. elatius. These species should do best in regular mixtures, and indeed the latter
seems to benefit strongly when grown in species-rich mixtures (Roscher et al.,
unpublished data).
Effects of local neighborhood on individuals of Dactylis glomerata
To test the effects of local neighborhood rather than plot-wide, “global” neighborhood
at least in the one test species that benefited most from a replacement of intraspecific by
interspecific neighbors, we determined the richness, the number and the biomass of
neighbors within circles of 12.5 cm radius around marked individuals of D. glomerata.
Neither local species richness nor local community density around the marked
individuals correlated significantly with their biomass, whereas increasing sown
(global) richness not only increased the biomass of the marked individuals (see above)
but also the biomass and number of shoots of the D. glomerata population and the
biomass of the other D. glomerata individuals in the neighborhood of the marked
individuals (see Fig. 2.4). Furthermore, there was no significant “local” relationship
between community biomass and realized species richness in the neighborhood of
marked individuals of D. glomerata. This indicates that the marked and neighboring
individuals of this species had themselves had an influence on their neighborhood
community: the performance of D. glomerata was high in plot with high sown (global)
richness. This might have had a negative effect on other species in the neighborhood
reducing thus the neighborhood biomass (i.e. excluding biomass of the marked
35

Chapter 2
individual) and therefore depressing the effect of realized species on the neighborhood
community biomass.
Conclusions
Our results show a good correlation between performance of individual plants and their
respective populations. This supports previous studies that inferred performance of
individual plants from species-specific biomass (e.g. Tilman et al. 1997a; Hector et al.
1999). In addition, our results show that population biomass is not only due to increased
individual size but also to increased numbers of individuals per seed sown, i.e. to
demographic processes. Both the growth of individuals and population size are
regulated and limited by availability of resources (Watkinson 1997). Diversity effects
on resources available to individuals also benefit the species populations as a whole and
subsequently the entire community.
Acknowledgement
We thank Christina Fischer, Anne Froehlich, and Anja Dassler for their assistance in the
field and lab. We are also grateful to Jens Schumacher for coordination of the main
project and numerous students and gardeners who assisted in weeding campaigns. This
research was supported by grants from the German Science Foundation (grant no. FOR
456 - WE 2618/6-1 to WWW and BS) and the Swiss National Science Foundation
(grant no. 31–65224.01 to BS) and by the Friedrich-Schiller-University of Jena and the
Max-Planck-Institute for Biogeochemistry, Jena.
36

Diversity and individual plants
References
Aarssen L.W. (1997) High productivity in grassland ecosystems: effected by species
diversity or productive species? Oikos, 80, 183-184
Connolly J. (1986) On Difficulties with Replacement-Series Methodology in Mixture Experiments. Journal of Applied Ecology, 23, 125-137
de Wit C.T., Tow P.G. & Ennik G.C. (1966) Competition between legumes and grasses. Versl. Landbouwk Onderz, 687, 3-30
Dimitrakopoulos P.G. & Schmid B. (2004) Biodiversity effects increase linearly with biotope space. Ecology Letters, 7, 574-583
Egli P. & Schmid B. (2001) The analysis of complex leaf survival data. Basic and Applied Ecology, 2, 223-231
Fargione J., Brown C.S. & Tilman D. (2003) Community assembly and invasion: An experimental test of neutral versus niche processes. Proceedings of the National Academy of Sciences of the United States of America, 100, 8916-8920
Fridley J.D. (2003) Diversity effects on production in different light and fertility environments: an experiment with communities of annual plants. Journal of Ecology, 91, 396-406
Harper J.L. (1967) A Darwinian approach to plant ecology. Journal of Ecology, 55, 247-270
Harper J.L. (1977) Population biology of plants. Academic Press, London.
Hector A., Schmid B., Beierkuhnlein C., Caldeira M.C., Diemer M., Dimitrakopoulos P.G., Finn J.A., Freitas H., Giller P.S., Good J., Harris R., Hogberg P., Huss-Danell K., Joshi J., Jumpponen A., Korner C., Leadley P.W., Loreau M., Minns A., Mulder C.P.H., O'Donovan G., Otway S.J., Pereira J.S., Prinz A., Read D.J., Scherer-Lorenzen M., Schulze E.D., Siamantziouras A.S.D., Spehn E.M., Terry A.C., Troumbis A.Y., Woodward F.I., Yachi S. & Lawton J.H. (1999) Plant diversity and productivity experiments in European grasslands. Science, 286, 1123-1127
Hooper D.U. (1998) The role of complementarity and competition in ecosystem responses to variation in plant diversity. Ecology, 79, 704-719
Hooper D.U., Chapin F.S., Ewel J.J., Hector A., Inchausti P., Lavorel S., Lawton J.H., Lodge D.M., Loreau M., Naeem S., Schmid B., Setala H., Symstad A.J., Vandermeer J. & Wardle D.A. (2005) Effects of biodiversity on ecosystem functioning: A consensus of current knowledge. Ecological Monographs, 75, 3-35
Huston M.A. (1997) Hidden treatments in ecological experiments: Re-evaluating the ecosystem function of biodiversity. Oecologia, 110, 449-460
Kennedy T.A., Naeem S., Howe K.M., Knops J.M.H., Tilman D. & Reich P. (2002) Biodiversity as a barrier to ecological invasion. Nature, 417, 636-638
Loreau M. & Hector A. (2001) Partitioning selection and complementarity in biodiversity experiments. Nature, 412, 72-76
37

Chapter 2
McKane R.B., Johnson L.C., Shaver G.R., Nadelhoffer K.J., Rastetter E.B., Fry B., Giblin A.E., Kielland K., Kwiatkowski B.L., Laundre J.A. & Murray G. (2002) Resource-based niches provide a basis for plant species diversity and dominance in arctic tundra. Nature, 415, 68-71
Naeem S., Hakansson K., Lawton J.H., Crawley M.J. & Thompson L.J. (1996) Biodiversity and plant productivity in a model assemblage of plant species. Oikos, 76, 259-264
Payne R.W., Baird D.B., Gilmour A.R., Harding S.A., Lane P.W., Murray D.A., Soutar D.M., Thompson R., Todd A.D., Tunicliffe Wilson G., Webstar R. & Welham S.J. (2002) GenStat Release 6.1 Reference Manual. VSN International, Wilkinson House, Jordan Hill Road, Oxford, UK.
Roscher C., Schumacher J., Baade J., Wilcke W., Gleixner G., Weisser W.W. Schmid B. & Schulze E.-D. (2004) The role of biodiversity for element cycling and trophic interactions: an experimental approach in a grassland community. Basic and Applied Ecology, 5, 107-121
Roscher, C., Temperton, V.M., Scherer-Lorenzen, M., Schmitz, M., Schumacher, J., Schmid, B., Buchmann, N., Weisser, W.W., & Schulze, E.D. (2005) Overyielding in experimental grassland communities - irrespective of species pool or spatial scale. Ecology Letters, 8, 419-429.
Schmid B., Hector A., Huston M.A., Inchausti P., Nijs I., Leadley P.W. & Tilman D. (2002) The design and analysis of biodiversity experiments. In: Biodiversity and Ecosystem Functioning. Synthesis and Perspectives (eds. Loreau M, Naeem S & Inchausti P), pp. 61-75. Oxford University Press, Oxford, UK
Stoll P. & Prati D. (2001) Intraspecific aggregation alters competitive interactions in experimental plant communities. Ecology, 82, 319-327
Tilman D., Knops J., Wedin D., Reich P., Ritchie M. & Siemann E. (1997a) The influence of functional diversity and composition on ecosystem processes. Science, 277, 1300-1302
Tilman D., Lehman C.L. & Thomson K.T. (1997b) Plant diversity and ecosystem productivity: Theoretical considerations. Proceedings of the National Academy of Sciences of the United States of America, 94, 1857-1861
Tilman D., Reich P.B., Knops J., Wedin D., Mielke T. & Lehman C. (2001) Diversity and productivity in a long-term grassland experiment. Science, 294, 843-845
Tilman D., Wedin D. & Knops J. (1996) Productivity and sustainability influenced by biodiversity in grassland ecosystems. Nature, 379, 718-720
Valone T.J. & Hoffman C.D. (2002) Effects of regional pool size on local diversity in small-scale annual plant communities. Ecology Letters, 5, 477-480
van Ruijven J. & Berendse F. (2003) Positive effects of plant species diversity on productivity in the absence of legumes. Ecology Letters, 6, 170-175
Vandermeer J.H. (1989) The Ecology of Intercropping. 1st edn. Cambridge University Press, Cambridge.
Watkinson A.R. (1997) Plant population dynamics. In: Plant ecology (ed. Crawley MJ), pp. 359-400. University Press, Cambridge
38
C h a p t e r 3
Niche pre-emption increases with species richness in experimental
plant communities
Journal of Ecology 95/1: 65-78, 2007
Together with M. Schmitz, C. Scherber, C. Roscher, J. Schumacher, M. Scherer-Lorenzen, W.W. Weisser, B. Schmid


Plants Diversity Pre-empts Niche for Invaders
Abstract
In plant communities, invasion resistance may increase with diversity because empty
niche space decreases simultaneously. However, it is not clear if this only applies to
exotic species or also to native species arriving at a site with few other native species
during community assembly. We tested the latter by transplanting four native species
into experimental grassland communities varying in species richness form 1–16 (–60)
species. In addition, we tested the hypothesis that invasion is less successful if the
invading species belongs to a functional group that is already present in the community.
The test invaders included a grass species (Festuca pratensis, FP), a short (Plantago
lanceolata, PL) and a tall herb species (Knautia arvensis, KA), and a legume species
(Trifolium pratense, TP). The same four functional groups also occurred alone or in all
possible combinations in the different experimental communities. The overall
performance of the transplants was negatively related to the logarithm of the species
richness of host communities. Plant biomass declined by 58%, 90%, 84% and 62% in
FP, PL, KA and TP, respectively, from monocultures to 16-species mixtures, indicating
lower invasiveness of the two herbs than of the grass and the legume. Resident grasses
showed a strong negative effect on the performance of all test invaders, whereas
resident small and tall herbs had neutral, and resident legumes had positive effects. The
case of the legumes indicates that contributions to invasion resistance need not parallel
invasiveness. Communities containing resident species of only one functional group
were most inhibitive to transplants of the same functional group. These results indicate
that invasion resistance of experimental plant communities is related to the degree of
niche overlap between resident species and invaders. This niche overlap can be high due
to generally low amounts of empty niche space in species-rich resident communities or
41
Chapter 3
due to the occurrence of the same functional group as the one of the invader in the
resident community. Stronger within- than between-functional-group invasion
resistance may be the key mechanism underlying diversity effects on invasion resistance
in grassland and other ecosystems at large.
Key words:
diversity effects; invasion resistance; invasiveness; niche overlap; phytometers; plant
functional groups; The Jena Experiment
42

Plants Diversity Pre-empts Niche for Invaders
Introduction
Understanding the mechanisms behind the relationship between resident species
richness and the establishment of non-resident species (i.e. invaders in the broad sense)
in natural communities is a major goal in ecology. This relationship has potential
applications in conservation, restoration and prediction of community invasion
resistance. Elton (1958) and Levine & D'Antonio (1999) provide evidence for a
generally negative relationship between diversity and the likelihood that an intruder will
be able to establish itself in a community. Such relationships have been found in a large
number of experimental studies using temperate plant communities (Tilman, 1997;
Knops et al., 1999; Joshi et al., 2000; Naeem et al., 2000; Prieur-Richard et al., 2000;
Diemer & Schmid, 2001; Kennedy et al., 2002; Pfisterer et al., 2004). In contrast,
observational studies, which necessarily assess invasion by exotic invaders, often report
higher numbers of invading species in species-rich than in species-poor plant
communities (Stohlgren et al., 1999; Stadler et al., 2000; Pysek et al., 2002; Stohlgren
et al., 2002), though Stohlgren et al. (1999) found the opposite at one site in their study.
The results of observational studies may be attributed to uncontrolled extrinsic factors,
whose effect on native and exotic species is the same (Stohlgren et al., 1999; Levine,
2000; Shea & Chesson, 2002). Additionally, observational studies mostly analyse the
number of invading species (e.g. Stohlgren et al., 1999; Meiners et al., 2004) whereas
many experimental studies also assess the performance of particular invaders (see e.g.
Prieur-Richard et al., 2000; Diemer & Schmid, 2001; Hector et al., 2001).
In most cases, species richness is the only component of diversity manipulated in
experimental studies (e.g. Prieur-Richard et al., 2000; Troumbis et al., 2002), though
some studies have demonstrated the importance of functional diversity in competitive
43

Chapter 3
suppression of invaders (Crawley et al., 1999; Hector et al., 2001; Prieur-Richard et al.,
2002; Xu et al., 2004; Fargione & Tilman, 2005). Functional groups are sets of species
(not necessarily taxonomic) that show close similarities in traits related to ecosystem
functioning, e.g. traits related to resource uptake and biomass production. Increasing
evidence suggests that the influence of functional diversity in a community might be
more important than pure species richness (Diaz & Cabido, 2001; Garnier et al., 2004;
Heemsbergen et al., 2004; Petchey et al., 2004).
It is supposed that empty niche space (Hutchinson, 1957) declines with increasing
species richness in a community (MacArthur, 1970). As a consequence, species-rich
communities can utilize the total resources available in a biotope more completely than
do species-poor communities (e.g. Scherer-Lorenzen et al., 2003; Dimitrakopoulos &
Schmid, 2004), thereby pre-empting resources for potential invaders (Tilman, 1999;
Hector et al., 2001; Fargione et al., 2003). This effect occurs because, generally, an
increase in species richness should also increase functional richness, suggesting that the
number of functional groups in an experimental community may be a good predictor of
these diversity effects. Conversely, the effect should be minimal if species richness is
increased without increasing the number of functional groups at the same time. In
addition, a community should be more resistant to invaders belonging to functional
groups already present among the resident species (e.g. Fargione et al., 2003; Turnbull
et al., 2005).
In most cases, invasion studies compare a set of species used as test invaders with
a separate set of species used as residents of host communities (Tilman, 1997; Knops et
al., 1999; Hector et al., 2001; Prieur-Richard et al., 2002; Fargione et al., 2003;
Pfisterer et al., 2004, but see Turnbull et al. 2005). This approach mimics biological
44

Plants Diversity Pre-empts Niche for Invaders
invasions into communities by exotic species. For example, the average competitive
ability of exotic invaders may change with diversity (e.g. Bossdorf et al., 2004; Colautti
et al., 2004; e.g. Vila & Weiner, 2004; Hierro et al., 2005). Here we do not analyze
exotic species invasions but rather invasion as a process of community assembly within
a pool of native species. In this case, because the host communities and invaders belong
to the same species pool, it is possible to distinguish between the invasiveness of a
particular species or functional group as an invader and its contribution to invasion
resistance of the host community within the same experiment.
Using this approach, we selected four native species representative of four
functional groups used in a biodiversity experiment as test invaders or “phytometers”.
Specifically, we wanted to find out: (a) if increasing species richness or number of
functional groups in plant communities suppresses the performance of invaders; (b)
whether the presence of a particular functional group in a host community enhances
suppression of the test invaders; and (c) whether the test invaders are most suppressed
by host communities containing species belonging to the same functional group.
Material and methods
Our study was part of a large biodiversity experiment, The Jena Experiment in Germany
(50o55’ N, 11o35’ E, 130 m altitude). This experiment was established in May 2002 on
a former agricultural field in the flood plain of the Saale river (Roscher et al., 2004).
Plant communities were assembled by constrained random selection from a pool of 60
species typical to Central European mesophilic grasslands. The species were
categorized into the four functional groups: grasses (16 species), small herbs (12
species), tall herbs (20 species), and legumes (12 species), based on multivariate
45

Chapter 3
analyses of their traits (Roscher et al., 2004). Analyzed traits included growth form (6
binary traits), lateral clonal spread, height of vegetative and flowering plant, leaf size,
depth and type of root system, life cycle, seasonality of foliage, onset and duration of
flowering and nitrogen fixation. Seventy-eight plots, each measuring 20 x 20 m, were
sown with 1, 2, 4, 8, or 16 species. A factorial design was formed with all possible
species richness x functional group richness mixtures. At each level of species richness,
16 replicate mixtures with different species composition were established, except at the
highest level with 14 replicates only. Four additional large plots contained mixtures of
all 60 species in the pool. The field was partitioned into four blocks following a gradient
in soil characteristics perpendicular to the river (Roscher et al., 2004). The plots were
mowed twice a year (June, September), as is typical for this type of grassland
ecosystem, and weeded twice a year to maintain the original species composition.
Mowing and weeding were done block-wise such that these management effects could
be accounted for with the block term in statistical analysis.
Our test invaders were pre-grown phytometer individuals of four species that
also occurred in a large number of experimental communities as resident species.
Clements and Goldsmith (1924) introduced the term “phytometer” for test plants that
were used to measure environmental factors. Each of the four species belonged to a
functional group used in the experiment: Festuca pratensis Huds. (grass), Plantago
lanceolata L. (small herb), Knautia arvensis L. (tall herb) and Trifolium pratense L.
(legume). They are all perennial plant species, form clearly defined compact individuals
and are relatively easy to transplant.
In mid-March 2003, we germinated the phytometers on moist filter paper in a
greenhouse. Individual seedlings were planted in 132-cm3 cells of potting trays filled
46

Plants Diversity Pre-empts Niche for Invaders
with a soil-compost-perlite mixture (3:2:1 in terms of volumes), and were exposed to a
14-h light regime with 22oC day temperature and 15oC night temperatures. In mid-April
2003, most of the plants had 4–7 leaves. We placed them outside the greenhouse for
hardening and one week later transplanted them into the experimental communities.
Five phytometer individuals of each test species were randomly allocated to positions at
28-cm intervals in a 2 x 2-m subplot within each large plot and the initial size
determined by counting their number of leaves and number of ramets (the latter only for
F. pratense and T. pratense). Transplanted phytometers were marked by fixing
numbered plastic labels next to the plants to ease identification during data collection.
In mid-August, in addition to counting the number of leaves, we measured the
maximum height of the phytometers. For T. pratense and F. pratensis, we also counted
the number of ramets as before. We calculated the relative growth rate of the transplants
using the formula
( ) ,/lnln 12 dllRGR tt −=
where is the mean number of leaves in August, is the mean number of leaves in
April and is the length of time interval in days (Harper, 1977). As a measure of plant
fitness, in August, we also counted the number of inflorescences of P. lanceolata and T.
pratense transplants. No individuals of F. pratensis or K. arvensis were flowering at this
time. In the last week of August 2003, shortly before mowing, transplants were cut at 3
cm above the ground and dried at 70
lt2 l t 1
d
oC for at least 48 h to determine the average
biomass of each transplant species per plot. In early June 2004, we once again measured
the height of the transplants, counted the number of inflorescences in P. lanceolata and
T. pratense, which were flowering at this time, and harvested the transplants per species
per plot to determine the average aboveground biomass as described above.
47
Chapter 3
Before each harvest, we determined the leaf area index (LAI) of the resident
community in an undisturbed area next to the phytometers using an LAI-2000 Plant
Canopy Analyzer (LI-COR Inc., Lincoln, Nebraska, USA).
Statistical analysis
We used general linear models with sequential sum of squares (Type I) for data analysis
using Genstat 6th Edition, Release 6.2. (Payne et al., 2002). Since individual plants
were pseudo-replicates within plots, we analysed means of the response variables plant
biomass, plant height, number of leaves and relative growth rate. The data were
transformed if residuals showed deviation from the normal distribution. According to
the experimental design, the analysis of variance (ANOVA) model consisted of the
terms block, sown species richness (partitioned into log-linear contrast and deviation
from log-linear contrast), functional group richness, species composition, phytometer
species and phytometer species x diversity interactions. Separate contrasts for the
presence/absence of each functional group and their interactions with species richness
were tested in alternative models. Similarly, separate contrasts were made to compare
each phytometer species and its interactions with diversity terms against the other three
phytometer species. The diversity terms (species richness, functional group richness,
presence of particular functional groups) had to be tested at the between-plot level
(Error = composition) whereas phytometer terms and their interactions with diversity
terms could be tested at the within-plot level (Schmid et al., 2002). We also analysed
the data of each phytometer species separately. To determine if the effect of diversity
terms was related to a change in the leaf-area index (LAI) of the community we did
48

Plants Diversity Pre-empts Niche for Invaders
post-hoc analyses with LAI as a covariate. In addition, LAI was tested as a dependent
variable itself, using the between-plot ANOVA as explained above.
To test if the phytometer species were more affected by their own than by other
functional groups, we used a reduced data set of communities with only one functional
group (n = 34 plots). To do this, the resident x transplant functional group interaction
was decomposed into a “home versus away” contrast and remainder (taking all “away”
treatment combinations together; see Table 3.3). To illustrate the home versus away
contrast we use an equivalent of the relative-neighbour-effect of (Markham & Chanway,
1996), using the formula (Ph-Pa) / max(Ph, Pa). Here, Ph is the performance (e.g.
biomass) of phytometers in communities with their own functional group (home), Pa the
performance in communities with other functional groups (away) and max(Ph, Pa) is the
larger of the two.
Results
Effects of species richness and functional richness
Except for plant height in P. lanceolata and K. arvensis, the measured
morphological variables of phytometers were highly correlated with their aboveground
biomass (Table 3.1), indicating that the latter is a good measure of overall phytometer
performance.
At the first harvest in summer 2003, i.e. 4 months after transplanting, the
performance of phytometer individuals was negatively related to the logarithm of sown
species richness (reduced number of leaves or number of ramets, reduced biomass and
reduced growth rate, Fig. 3.1a, c, d and Table 3.2a). The height of the phytometers was,
however, not affected and even increased with the logarithm of species richness in one
49

Chapter 3
of the phytometer species (F. pratensis; F1,70 = 9.30, p < 0.01 in separate analysis),
suggesting a typical allometric response to increased competition for light (etiolation);
i.e. a faster increase in height, independent of size (Fig. 3.1b, Table 3.2a; see also lower
correlations of plant height than of other variables with biomass in Table 3.1). The
length of the leaves in F. pratensis also increased with increasing species richness (F1,73
= 15.64, p < 0.001). The influence of resident species richness on phytometer
performance varied among phytometer species; the herbs (P. lanceolata and K.
arvensis) were more strongly affected than the grass (F. pratensis) and the legume (T.
pratense) (see species richness x phytometer species (PS) interaction in Table 3.2a). The
negative effect of species richness on phytometer aboveground biomass was still
significant in spring 2004 (F1,73 = 27.80, p < 0.001, Fig. 3.2b), but again plant height
was not affected by species richness (F1,73 = 1.19, p < 0.172, Fig. 3.2a).
Table 3.1 Partial correlation of phytometer vegetative and reproductive traits measured in summer 2003 with aboveground biomass harvested at the same time. Significance levels are, * P<0.05; ** P<0.01; ** P<0.001
Plant Trait F. pratense (N=71)
P. lanceolata (N=78)
K. arvensis (N=76)
T. pratense (N=68)
Number of leaves 0.919*** 0.887*** 0.855*** 0.776***
Number of ramets 0.904*** - - 0.866***
Height 0.467*** 0.128ns 0.228* 0.415***
Number of flowers - 0.974*** - 0.938***
Relative growth rate 0.804*** 0.610** 0.720*** 0.680***
50
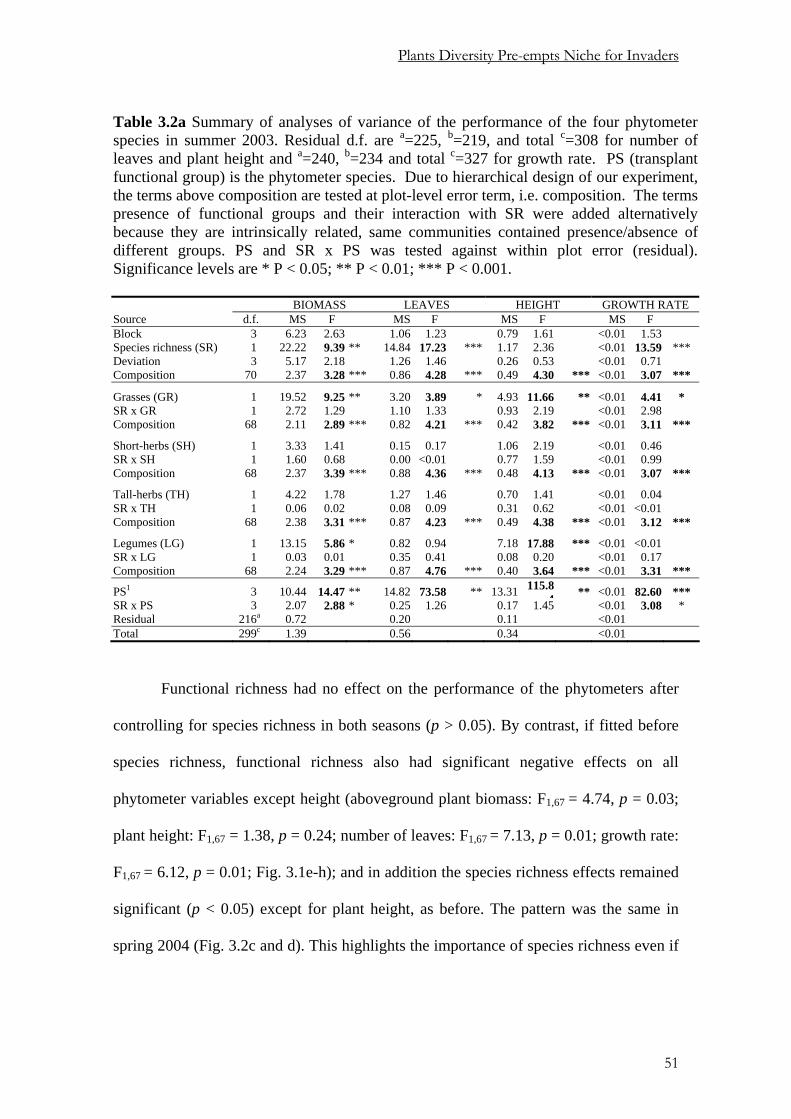
Plants Diversity Pre-empts Niche for Invaders
Table 3.2a Summary of analyses of variance of the performance of the four phytometer species in summer 2003. Residual d.f. are a=225, b=219, and total c=308 for number of leaves and plant height and a=240, b=234 and total c=327 for growth rate. PS (transplant functional group) is the phytometer species. Due to hierarchical design of our experiment, the terms above composition are tested at plot-level error term, i.e. composition. The terms presence of functional groups and their interaction with SR were added alternatively because they are intrinsically related, same communities contained presence/absence of different groups. PS and SR x PS was tested against within plot error (residual). Significance levels are * P < 0.05; ** P < 0.01; *** P < 0.001. BIOMASS LEAVES HEIGHT GROWTH RATE Source d.f. MS F MS F MS F MS F Block 3 6.23 2.63 1.06 1.23 0.79 1.61 <0.01 1.53 Species richness (SR) 1 22.22 9.39 ** 14.84 17.23 *** 1.17 2.36 <0.01 13.59 *** Deviation 3 5.17 2.18 1.26 1.46 0.26 0.53 <0.01 0.71 Composition 70 2.37 3.28 *** 0.86 4.28 *** 0.49 4.30 *** <0.01 3.07 ***
Grasses (GR) 1 19.52 9.25 ** 3.20 3.89 * 4.93 11.66 ** <0.01 4.41 * SR x GR 1 2.72 1.29 1.10 1.33 0.93 2.19 <0.01 2.98 Composition 68 2.11 2.89 *** 0.82 4.21 *** 0.42 3.82 *** <0.01 3.11 ***
Short-herbs (SH) 1 3.33 1.41 0.15 0.17 1.06 2.19 <0.01 0.46 SR x SH 1 1.60 0.68 0.00 <0.01 0.77 1.59 <0.01 0.99 Composition 68 2.37 3.39 *** 0.88 4.36 *** 0.48 4.13 *** <0.01 3.07 ***
Tall-herbs (TH) 1 4.22 1.78 1.27 1.46 0.70 1.41 <0.01 0.04 SR x TH 1 0.06 0.02 0.08 0.09 0.31 0.62 <0.01 <0.01 Composition 68 2.38 3.31 *** 0.87 4.23 *** 0.49 4.38 *** <0.01 3.12 ***
Legumes (LG) 1 13.15 5.86 * 0.82 0.94 7.18 17.88 *** <0.01 <0.01 SR x LG 1 0.03 0.01 0.35 0.41 0.08 0.20 <0.01 0.17 Composition 68 2.24 3.29 *** 0.87 4.76 *** 0.40 3.64 *** <0.01 3.31 ***
PS1 3 10.44 14.47 ** 14.82 73.58 ** 13.31 115.84 ** <0.01 82.60 ***
SR x PS 3 2.07 2.88 * 0.25 1.26 0.17 1.45 <0.01 3.08 * Residual 216a 0.72 0.20 0.11 <0.01 Total 299c 1.39 0.56 0.34 <0.01
Functional richness had no effect on the performance of the phytometers after
controlling for species richness in both seasons (p > 0.05). By contrast, if fitted before
species richness, functional richness also had significant negative effects on all
phytometer variables except height (aboveground plant biomass: F1,67 = 4.74, p = 0.03;
plant height: F1,67 = 1.38, p = 0.24; number of leaves: F1,67 = 7.13, p = 0.01; growth rate:
F1,67 = 6.12, p = 0.01; Fig. 3.1e-h); and in addition the species richness effects remained
significant (p < 0.05) except for plant height, as before. The pattern was the same in
spring 2004 (Fig. 3.2c and d). This highlights the importance of species richness even if
51
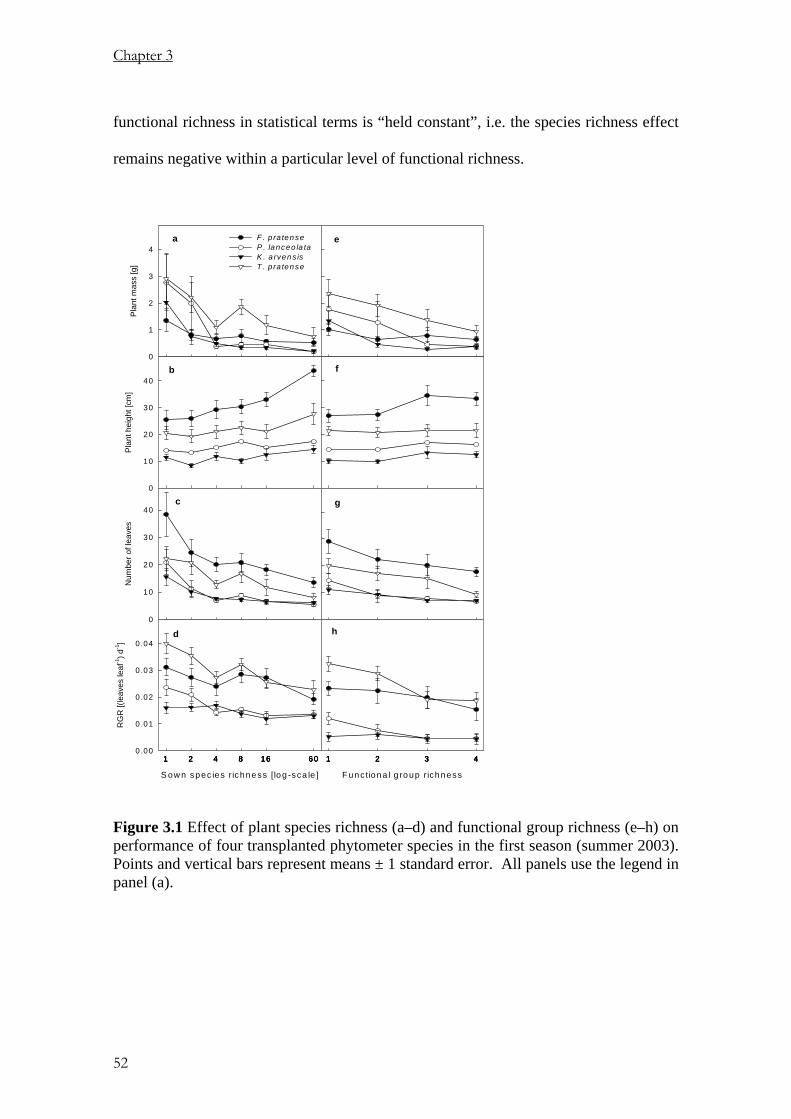
Chapter 3
functional richness in statistical terms is “held constant”, i.e. the species richness effect
remains negative within a particular level of functional richness.
Pla
nt m
ass
[g]
0
1
2
3
4F . p ra tenseP . lanceo la taK . a rvens isT . p ra tense
a
Pla
nt h
eigh
t [cm
]
0
10
20
30
40
Num
ber o
f lea
ves
0
10
20
30
40
S ow n spec ies r ichness [log -sca le ]
1 2 4 8 16 601 2 4 8 16 601 2 4 8 16 601 2 4 8 16 60
RG
R [(
leav
es le
af-1
) d-1
]
0 .00
0 .01
0 .02
0 .03
0 .04
b
c
d
e
F unc tiona l g roup r ichness
1 2 3 41 2 3 41 2 3 41 2 3 4
f
g
h
Figure 3.1 Effect of plant species richness (a–d) and functional group richness (e–h) on performance of four transplanted phytometer species in the first season (summer 2003). Points and vertical bars represent means ± 1 standard error. All panels use the legend in panel (a).
52
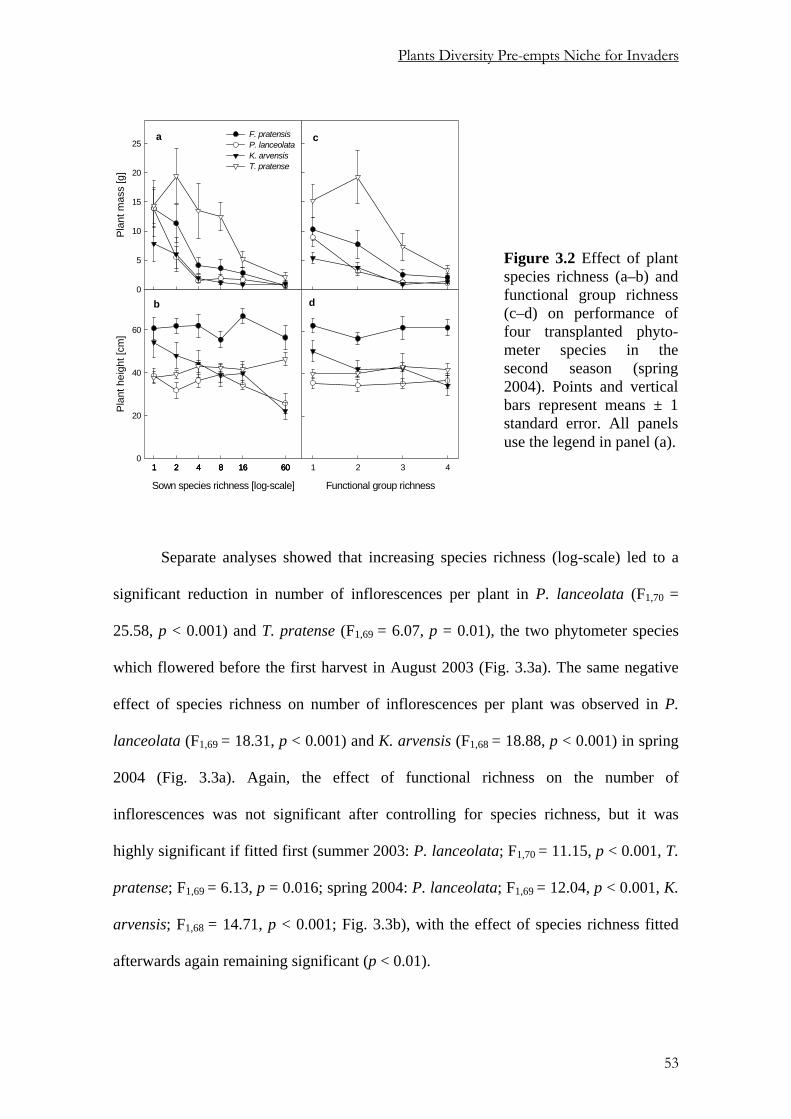
Plants Diversity Pre-empts Niche for Invaders
Functional group richness
1 2 3 4
Sown species richness [log-scale]
1 2 4 8 16 601 2 4 8 16 601 2 4 8 16 60
Pla
nt h
eigh
t [cm
]
0
20
40
60
F. pratenseP. lanceolataK. arvensisT. pratense
Pla
nt m
ass
[g]
0
5
10
15
20
25F. pratensisP. lanceolataK. arvensisT. pratense
c
d
a
b
Figure 3.2 Effect of plant species richness (a–b) and functional group richness (c–d) on performance of four transplanted phyto-meter species in the second season (spring 2004). Points and vertical bars represent means ± 1 standard error. All panels use the legend in panel (a).
Separate analyses showed that increasing species richness (log-scale) led to a
significant reduction in number of inflorescences per plant in P. lanceolata (F1,70 =
25.58, p < 0.001) and T. pratense (F1,69 = 6.07, p = 0.01), the two phytometer species
which flowered before the first harvest in August 2003 (Fig. 3.3a). The same negative
effect of species richness on number of inflorescences per plant was observed in P.
lanceolata (F1,69 = 18.31, p < 0.001) and K. arvensis (F1,68 = 18.88, p < 0.001) in spring
2004 (Fig. 3.3a). Again, the effect of functional richness on the number of
inflorescences was not significant after controlling for species richness, but it was
highly significant if fitted first (summer 2003: P. lanceolata; F1,70 = 11.15, p < 0.001, T.
pratense; F1,69 = 6.13, p = 0.016; spring 2004: P. lanceolata; F1,69 = 12.04, p < 0.001, K.
arvensis; F1,68 = 14.71, p < 0.001; Fig. 3.3b), with the effect of species richness fitted
afterwards again remaining significant (p < 0.01).
53
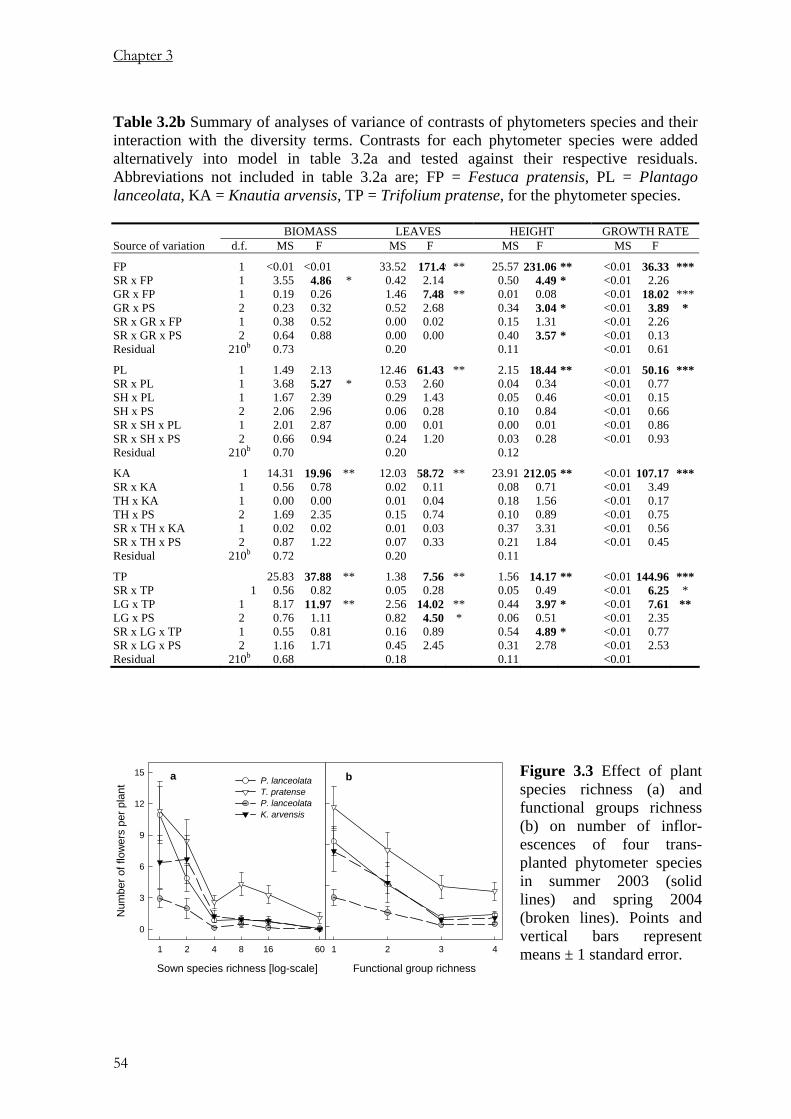
Chapter 3
Table 3.2b Summary of analyses of variance of contrasts of phytometers species and their interaction with the diversity terms. Contrasts for each phytometer species were added alternatively into model in table 3.2a and tested against their respective residuals. Abbreviations not included in table 3.2a are; FP = Festuca pratensis, PL = Plantago lanceolata, KA = Knautia arvensis, TP = Trifolium pratense, for the phytometer species. BIOMASS LEAVES HEIGHT GROWTH RATE Source of variation d.f. MS F MS F MS F MS F
FP 1 <0.01 <0.01 33.52 171.49 ** 25.57 231.06 ** <0.01 36.33 ***SR x FP 1 3.55 4.86 * 0.42 2.14 0.50 4.49 * <0.01 2.26 GR x FP 1 0.19 0.26 1.46 7.48 ** 0.01 0.08 <0.01 18.02 ***GR x PS 2 0.23 0.32 0.52 2.68 0.34 3.04 * <0.01 3.89 * SR x GR x FP 1 0.38 0.52 0.00 0.02 0.15 1.31 <0.01 2.26 SR x GR x PS 2 0.64 0.88 0.00 0.00 0.40 3.57 * <0.01 0.13 Residual 210b 0.73 0.20 0.11 <0.01 0.61
PL 1 1.49 2.13 12.46 61.43 ** 2.15 18.44 ** <0.01 50.16 ***SR x PL 1 3.68 5.27 * 0.53 2.60 0.04 0.34 <0.01 0.77 SH x PL 1 1.67 2.39 0.29 1.43 0.05 0.46 <0.01 0.15 SH x PS 2 2.06 2.96 0.06 0.28 0.10 0.84 <0.01 0.66 SR x SH x PL 1 2.01 2.87 0.00 0.01 0.00 0.01 <0.01 0.86 SR x SH x PS 2 0.66 0.94 0.24 1.20 0.03 0.28 <0.01 0.93 Residual 210b 0.70 0.20 0.12
KA 1 14.31 19.96 ** 12.03 58.72 ** 23.91 212.05 ** <0.01 107.17 ***SR x KA 1 0.56 0.78 0.02 0.11 0.08 0.71 <0.01 3.49 TH x KA 1 0.00 0.00 0.01 0.04 0.18 1.56 <0.01 0.17 TH x PS 2 1.69 2.35 0.15 0.74 0.10 0.89 <0.01 0.75 SR x TH x KA 1 0.02 0.02 0.01 0.03 0.37 3.31 <0.01 0.56 SR x TH x PS 2 0.87 1.22 0.07 0.33 0.21 1.84 <0.01 0.45 Residual 210b 0.72 0.20 0.11
TP 25.83 37.88 ** 1.38 7.56 ** 1.56 14.17 ** <0.01 144.96 ***SR x TP 1 0.56 0.82 0.05 0.28 0.05 0.49 <0.01 6.25 * LG x TP 1 8.17 11.97 ** 2.56 14.02 ** 0.44 3.97 * <0.01 7.61 ** LG x PS 2 0.76 1.11 0.82 4.50 * 0.06 0.51 <0.01 2.35 SR x LG x TP 1 0.55 0.81 0.16 0.89 0.54 4.89 * <0.01 0.77 SR x LG x PS 2 1.16 1.71 0.45 2.45 0.31 2.78 <0.01 2.53 Residual 210b 0.68 0.18 0.11 <0.01
Sown species richness [log-scale]
1 2 4 8 16 60
Num
ber o
f flo
wer
s pe
r pla
nt
0
3
6
9
12
15P. lanceolataT. pratenseP. lanceolataK. arvensis
Functional group richness
1 2 3 4
a b
54
Figure 3.3 Effect of plant species richness (a) and functional groups richness (b) on number of inflor-escences of four trans-planted phytometer species in summer 2003 (solid lines) and spring 2004 (broken lines). Points and vertical bars represent means ± 1 standard error.

Plants Diversity Pre-empts Niche for Invaders
Effects of the presence of particular functional groups
The presence of grasses or legumes in the host communities had significant overall
effects on phytometers, but this was not the case for the other two functional groups
(Table 3.2a). Grasses significantly reduced number of modules (number of leaves or
number of ramets), aboveground biomass, and growth rate of all the phytometer species
(Table 3.2a) as well as number of inflorescences in P. lanceolata in summer 2003 (F1,68
= 5.66, p = 0.02) and spring 2004 (F1,67 = 7.56, p = 0.008). For example, in summer
2003, the average biomass of an individual phytometer (all species together) was 0.8 g
in plots with grasses compared to 1.9 g in plots without grasses (Fig. 3.4). In spring
2004, the figures were 3.5 g and 10.8 g for plots with and without grasses respectively.
The presence of legumes had an overall significantly positive effect on the performance
of the phytometer species (Table 3.2a, Fig. 3.4 and 3.5). Separate analysis for each
phytometer, however, revealed that the presence of legumes actually reduced
aboveground biomass of the legume phytometer, T. pratense, at least in the spring 2004
(F1,61 = 8.97, p = 0.004). The negative effect of legume presence on the legume
phytometer as opposed to a positive effect on the other phytometers is also evident in
the significant contrast interaction legume presence x T. pratense (LG x TP in Table
3.2b) and when inspecting the last rows in figure 3.4 and figure 3.5.
There were no significant interactions between species richness and the presence
of particular functional groups in the communities on phytometer performance. We
mention this explicitly because such interactions might be expected if the sown
proportion of a functional group would influence invasion resistance; where present, the
proportion of a functional group decreases with increasing species richness.
55

Chapter 3
X Data
1 2 4 8 16 601 2 4 8 16 601 2 4 8 16 601 2 4 8 16 60
0
1
2
3
4
X Data
1 2 4 8 16 601 2 4 8 16 601 2 4 8 16 601 2 4 8 16 60
0
1
2
3
4
X Data
1 2 4 8 16 601 2 4 8 16 601 2 4 8 16 601 2 4 8 16 60
0
1
2
3
4
1 2 4 8 16 601 2 4 8 16 601 2 4 8 16 601 2 4 8 16 600
1
2
3
4
X Data
1 2 4 8 16 601 2 4 8 16 601 2 4 8 16 601 2 4 8 16 60
X Data
1 2 4 8 16 601 2 4 8 16 601 2 4 8 16 601 2 4 8 16 60
X Data
1 2 4 8 16 601 2 4 8 16 601 2 4 8 16 601 2 4 8 16 60
1 2 4 8 16 601 2 4 8 16 601 2 4 8 16 601 2 4 8 16 60
X Data
1 2 4 8 16 601 2 4 8 16 601 2 4 8 16 601 2 4 8 16 60
X Data
1 2 4 8 16 60
X Data
1 2 4 8 16 601 2 4 8 16 601 2 4 8 16 601 2 4 8 16 60
1 2 4 8 16 601 2 4 8 16 601 2 4 8 16 601 2 4 8 16 60
X Data
1 2 4 8 16 601 2 4 8 16 601 2 4 8 16 601 2 4 8 16 60
X Data
1 2 4 8 16 601 2 4 8 16 601 2 4 8 16 601 2 4 8 16 60
X Data
1 2 4 8 16 601 2 4 8 16 601 2 4 8 16 601 2 4 8 16 60
1 2 4 8 16 601 2 4 8 16 601 2 4 8 16 601 2 4 8 16 60
Sown species richness [log-scale]
Mea
n m
ass
of th
e ph
ytom
eter
[g]
F. pratense P. lanceolata K. arvensis T. pratense
Gra
sses
Smal
l her
bsTa
ll he
rbs
Legu
mes
Figure 3.4 Effect of plant species richness and presence/absence of different functional groups on biomass of four transplanted phytometer species in the first season (summer 2003). Columns represent phytometers species F. pratensis, P. lanceolata, K. arvensis and T. pratense from left to right and rows represent presence/absence of grasses, small-herbs, tall-herbs and legumes from top to bottom. Closed and open symbols indicate, respective-ly, presence and absence of the corresponding functional groups in the resident communi-ties. For example, the second panel in the first row shows the response of P. lanceolata to species richness in the plots containing grasses (closed symbols) and in plots without grasses (open symbols). Points and vertical bars represent means ± 1 standard error.
In both seasons, the leaf area index (LAI) of the resident community increased
with the logarithm of species richness (August 2003: F1,68 = 6.42, p = 0.014, May 2004:
F1,70 = 6.70, p = 0.012) but was not affected by functional richness. Although there was
56

Plants Diversity Pre-empts Niche for Invaders
no effect of the presence of any functional group on LAI in August 2003, in May 2004,
LAI was high in mixtures containing legumes (F1,68 = 28.01, p < 0.001) and low in
mixtures containing small herbs (F1,68 = 6.52, p < 0.013). This suggests that
belowground competition may be responsible for the observed high suppression of
phytometers in communities containing grasses. As a covariate, in August 2003, LAI
had significant negative effects on number of leaves and growth rate, positive effects on
plant height (P < 0.05) but neutral effects on biomass of the phytometers. In May 2004
however, LAI had negative effects on aboveground biomass, plant height, and number
of ramets of the phytometers (P < 0.05). However, where present, the effects of LAI did
not explain the significant effects of species richness; that is, species richness effects
remained significant after controlling for the effect of LAI.
Effects of the functional group of the phytometer species
As suggested by hypothesis (c) in the Introduction, comparing the suppression of
invaders by communities containing different functional groups is not the same as
looking at the performance of invaders belonging to different functional groups. In the
first case (hypotheses (a) and (b) in the Introduction), the panels in Fig. 3.4 and Fig. 3.5
are compared row-wise, in the second case they are compared column-wise. If the two
approaches are combined, the performance of particular phytometer species in
assemblages containing only species of its functional group can be compared with its
performance in assemblages containing only the other functional groups (–1 diagonal in
Fig. 3.4 and Fig. 3.5). We refer to this as a “home-vs.-away” contrast (see e.g. Joshi et
al., 2001; Turnbull et al., 2005), for which hypothesis (c) predicts a particularly strong
negative effect.
57
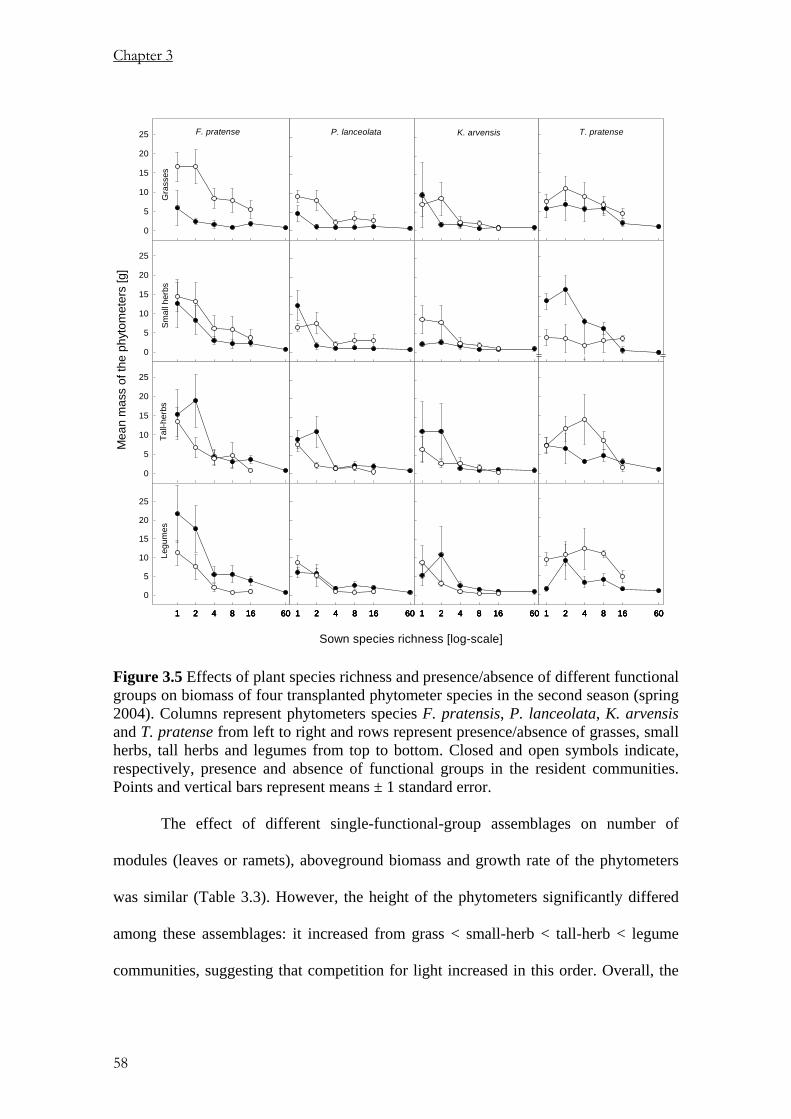
Chapter 3
0
5
10
15
20
25
0
5
10
15
20
25
0
5
10
15
20
25
1 2 4 8 16 601 2 4 8 16 601 2 4 8 16 601 2 4 8 16 60
0
5
10
15
20
25
1 2 4 8 16 601 2 4 8 16 601 2 4 8 16 601 2 4 8 16 60 1 2 4 8 16 601 2 4 8 16 601 2 4 8 16 601 2 4 8 16 60 1 2 4 8 16 601 2 4 8 16 601 2 4 8 16 601 2 4 8 16 60
Sown species richness [log-scale]
Mea
n m
ass
of th
e ph
ytom
eter
s [g
]F. pratense P. lanceolata K. arvensis T. pratense
Gra
sses
Smal
l her
bsTa
ll-he
rbs
Legu
mes
Figure 3.5 Effects of plant species richness and presence/absence of different functional groups on biomass of four transplanted phytometer species in the second season (spring 2004). Columns represent phytometers species F. pratensis, P. lanceolata, K. arvensis and T. pratense from left to right and rows represent presence/absence of grasses, small herbs, tall herbs and legumes from top to bottom. Closed and open symbols indicate, respectively, presence and absence of functional groups in the resident communities. Points and vertical bars represent means ± 1 standard error.
The effect of different single-functional-group assemblages on number of
modules (leaves or ramets), aboveground biomass and growth rate of the phytometers
was similar (Table 3.3). However, the height of the phytometers significantly differed
among these assemblages: it increased from grass < small-herb < tall-herb < legume
communities, suggesting that competition for light increased in this order. Overall, the
58

Plants Diversity Pre-empts Niche for Invaders
two herbaceous phytometer species were least affected by differences between these
one functional group assemblages, whereas the grass (F. pratensis) and the legume (T.
pratense) phytometer were more affected by these differences. This is evident in Fig.
3.5 by comparing differences between open and filled symbols in monocultures. A
contrast between monocultures versus multi-species assemblages containing one
functional group showed that the number of modules (leaves or ramets), aboveground
biomass and growth rate of the phytometers was significantly lower in the latter (Table
3.3). This reinforces the statistical observation made above, that competitive
suppression increases with species richness of a community even if functional richness
is held constant, in this case at the lowest level. The home-disadvantage was similar in
mono-specific and multi-species single-functional-group assemblages (interaction home
x mono not significant in Table 3.3).
Table 3.3 Summary of analyses of variance of summer 2003 data for home-vs.-away
effect on the four phytometer species using plots with resident communities consisting of
species from only one functional group. Significance levels are * P < 0.05; ** P < 0.01;
*** P < 0.001.
Biomass Leaves Height Source d.f. MS F MS F MS F Block 3 11.63 4.09* 2.33 2.08 553.61 8.43 Resident Functional Group (RFG) 3 3.11 1.09 0.26 0.23 962.34 14.66***Monoculture vs. Mixture (Mono) 1 22.02 7.75* 9.16 8.19** 49.64 0.76 RFG x Mono 3 0.53 0.19 0.06 0.06 6.44 0.10 Composition 23 2.84 4.19*** 1.12 5.61*** 65.66 1.68*
Phytometer species (PS) 3 3.36 4.95** 5.99 30.08*** 1818.79 46.65***Home vs. Away (RFG x PS main diag.) 1 4.25 6.26* 1.59 7.98** 169.93 4.36* RFG x PS (residual interact.) 8 0.84 1.24 0.22 1.13 191.49 4.91***Phytometer species x Mono 3 2.47 3.64* 0.28 1.40 42.37 1.09 Home vs. Away x Mono 1 0.19 0.28 0.38 1.89 8.51 0.22 Residual 79 0.68 0.20 38.99 Total 128 1.68 0.63 128.91
59

Chapter 3
-1 .0 -0 .5 0 .0 0 .5 1 .0
b io m a s sh e ig h tle a ve sR G R
GR
SH
TH
LG
GR
SH
TH
LG
GR
SH
TH
LG
GR
SH
TH
LG
F. p
rate
nse
K. a
rven
sis
Relative neighbour effectR
esid
ent f
unct
iona
l gro
up
P. la
nceo
lata
T. p
rate
nse
-1 .0 -0 .5 0 .0 0 .5 1 .0
b io m a s sh e ig h tle a ve sR G R
GR
SH
TH
LG
GR
SH
TH
LG
GR
SH
TH
LG
GR
SH
TH
LG
F. p
rate
nse
K. a
rven
sis
Relative neighbour effectR
esid
ent f
unct
iona
l gro
up
P. la
nceo
lata
T. p
rate
nse
Figure 3.6 Performance of
phytometers transplanted into
single-functional-group assembl-
ages of grasses (GR), small herbs
(SH), tall herbs (TH) and legumes
(LG) relative to performance in
mono-functional group assem-
blages of their own functional
group. Negative values indicate
negative “home” effects, i.e. that
resident species belonging to a
functional group different from
that of the phytometer were less
inhibitive, while positive values
indicate positive home effects.
Except for plant height, the home vs. away contrast almost fully explained the
resident functional group x phytometer species interactions (Table 3.3). That is, as
predicted, the phytometers had significantly lower performance when transplanted into
assemblages consisting of the same rather than a different functional group (the effects
of home-functional groups were stronger than of away-functional group, i.e. negative
bars in Fig. 3.6). The significant residual RFG x PS interaction for plant height indicates
that the home effect on plant height is not as clear-cut; for example, F. pratense
phytometers were taller in non-grass single function group assemblage whereas T.
60
Plants Diversity Pre-empts Niche for Invaders
pratense phytometers were shorter in non-legume single functional group assemblages
(Fig. 3.6). The four-phytometer species responded differently to mono-specific versus
multi-species single-functional-group assemblages (Table 3.3): the biomass of P.
lanceolata declined from 5.3 g in mono-specific to 0.9 g in multi-species single-
functional-group assemblages whereas the other three-phytometer species showed little
reduction in aboveground biomass. For two phytometer species that also occurred as
monocultures, P. lanceolata was greatly suppressed by its own monoculture in both
seasons. It attained less than 1.5 g in its own monoculture in both seasons compared to
an average of 5.6 g and 14.7 g in other monocultures in summer 2003 and spring 2004
respectively. By contrast, F. pratense performed well in its own monocultures
especially in 2004 (i.e. 19.6 g in its own and 13.5 g in others).
Discussion
Effects of species richness and functional richness
By introducing young plants of native species as test invaders into host communities we
have shown that plant diversity enhances competitive suppression of newly arriving
individuals during the invasion process. This supports the proposition that species-rich
communities contain less empty niches that can be occupied by extra individuals. The
performance of the test invaders in our experiment was linearly related to the logarithm
of species richness. This indicates an attenuation of invasion resistance in more diverse
host communities, probably due to increased niche overlap among resident species. It is
conceivable that stronger invasion resistance could have been observed if we had
introduced seeds (see e.g. Symstad, 2000; Dukes, 2001) instead of young plants, but
then we would have confounded requirements for empty germination niches with those
61
Chapter 3
for growing plants. Our results agree with several previous findings referring to
invasions by non-native species (e.g. Levine, 2000; Prieur-Richard et al., 2002). With
one of the most balanced designs in terms of species and functional diversity achieved
so far in biodiversity experiments (Roscher et al., 2004), our results show that in
contrast to previous suggestions (Diaz & Cabido, 2001) species richness was a better
predictor of invasion resistance than was functional group richness.
Since functional groups are aggregations of species, three observations (that can
apply in natural communities) may explain why the effect of species richness in this
study was stronger than that of functional group richness. First, aggregating several
species into few functional groups makes species richness have a wider range (1–60
species) than functional richness (1–4 functional groups). Second, differential effects of
functional richness on different phytometer species leads to an averaging of the overall
effect of functional richness in a balanced design, where each functional group is
represented equally among the four phytometer species and among the resident plant
communities. A case in point is the positive effect of resident legumes on non-legume
test-invaders and the negative effect on the legume test-invader. Third, contrasting
effects of different functional groups on resources may weaken the overall effect of
functional group richness. For example, while legumes enrich soil with nitrogen, grasses
deplete this resource (Tilman et al., 1997; Scherer-Lorenzen et al., 2003). These
counteracting effects of functional groups on resource pre-emption weaken the overall
effect of functional group richness on suppression of test-invaders, supporting resource
pre-emption as one mechanism of invasion resistance in plant communities.
Nonetheless, as in the study by Symstad (2000), using seeds instead of
transplants as invaders, functional group richness can enhance invasion resistance, if
62

Plants Diversity Pre-empts Niche for Invaders
considered alone. Interestingly, Symstad (2000) could not attribute increased invasion
resistance by functionally rich communities to resource pre-emption, which indicates
that in her case perhaps specific requirements for germination played an important role.
Our study showed that pure grass mixtures can be most resistant to invasion after
germination, underlying the importance of traits of specific groups (see next section). It
remains debatable, of course, if the a priori definitions of functional groups that we
adopted in The Jena Experiment are adequate to understand the relationship between
functional diversity and invasion resistance. Nevertheless, the fact that species richness
log-linearly increased invasion resistance even within plant assemblages consisting of a
single functional group further exemplifies the importance of species richness as a
driver in this particular case of an ecosystem function.
Effects of the presence of particular functional groups
The negative, positive and neutral effect of legumes, grasses and herbs, respectively, on
invasion resistance in our study reflects their known patterns of resource use (Fargione
et al., 2003; Fargione & Tilman, 2005) and fits with a general theory of invasibility of
Davis et al. (2000). In our experiment, better performance of the phytometers in
communities with legumes corresponded with findings that they actually benefited from
nitrogen fixed by legumes (Temperton et al., submitted). It is well documented that
legumes, by adding nitrogen to the soil, can promote invasion in nitrogen-limited
environments (Yelenik et al., 2004 and reference therein). By actively fixing
atmospheric nitrogen, legumes do not rely on soil-nitrogen pools. Thus, a related effect
of legumes is the reduction of competition for soil nitrogen. Some previous studies,
however, have reported increased invasion resistance due to presence of legumes
63

Chapter 3
(Hector et al., 2001; Fargione et al., 2003). It is notable that positive effects of legumes
usually correlate with their effect on belowground resources, mainly soil nitrogen
(Maron & Connors, 1996; Prieur-Richard et al., 2002) while their negative effects
usually correlate with their effect on aboveground resources (Hector et al., 2001;
Fargione et al., 2003). Thus, in general legumes may enhance invasion resistance in
fertile soils but promote invasion in poor soils. In addition, legumes may have a
stronger potential than grasses and herbs to differentially affect different invaders.
Notably, as mentioned above, they can have negative effects on other legumes even
when they have positive effects on other species.
Suppression of all phytometers was particularly strong in resident communities
containing grasses. Due to their extensive root systems, grasses are efficient in taking up
resources from the upper soil layers (Fargione et al., 2003), thereby diminishing
resources for potential invaders. Other studies have also reported grasses as a keystone
functional group reducing the success of invaders (Crawley et al., 1999; Dukes, 2002;
Prieur-Richard et al., 2002). Crawley et al. (1999) found that an assembly of 80
herbaceous species was more vulnerable to invasion than were assemblies composed of
1–4 grass species. A weak effect of grasses on LAI did not explain the strong negative
effect of their presence on invasion resistance, suggesting that their contribution to
invasion resistance is mainly through their effect on belowground resources. From these
results we can conclude that with regard to functional diversity, functional group
identity may be more important than pure number of functional groups (Schmid et al.,
2002). This was also observed in the same experiment by Scherber et al. (2006),
investigating herbivory on a different phytometer species, Rumex acetosa.
64

Plants Diversity Pre-empts Niche for Invaders
Effects of the functional group of the phytometer species and niche pre-emption within
functional groups as major mechanism of invasion resistance
With regard to the identity of the invader, experimental communities were particularly
resistant to a phytometer species if they contained species belonging to the same
functional group. For example, although non-legume herbs had no effect on invasion
resistance in general, their presence in the resident communities enhanced suppression
of their respective phytometers. Likewise, despite notable facilitation by legumes,
communities containing only this functional group strongly inhibited the legume test
invader, T. pratense. Our results and a previous observation that legume monocultures
were most resistant to invasion by legumes (Turnbull et al., 2005) indicate that resident
legumes also pre-empt other resources that limit legumes, most likely phosphorus, water
and light (Vitousek & Howarth, 1991). This is consistent with high niche overlap along
several resource-use axes between resident and invading legumes, and further supports
niche pre-emption as a mechanism of invasion resistance. Thus, high niche overlap
between newly arriving individuals and resident species can reduce chances of an
invasion, rate of colonisation or even success of restoration. This corresponds to
findings of Fargione et al. (2003) in a seed addition experiment, where they concluded
that high invasion resistance was due to similar patterns of resource use between the
resident species and the invaders. Xu et al. (2004) also found that the presence of a
functionally similar herb in a resident community increased resistance to invasion by
Alligator weed (Alternanthera philoxeroides), which was also attributed to niche
overlap.
Finally, it should be mentioned that alternative hypotheses may also be
consistent with the result of stronger within- than between-functional-group invasion
65

Chapter 3
resistance (Fukami et al., 2005; Britton-Simmons, 2006). Namely, the presence of a
species in a community might build up pathogens, parasites, or herbivores that have
negative impacts on invaders from the same functional group (Wardle et al., 2004;
Bartelt-Ryser et al., 2005). It is conceivable that such effects are particularly important
during the early phases of the life cycle of invaders, e.g. during germination. However,
in this study we could not test this because we introduced our test invaders as young
plants rather than seeds into the communities.
This study confirms that, first, communities that are more diverse confer high
resistance to invasion independent of invasiveness of the introduced species. Secondly,
presence of grasses enhances invasion resistance while legumes may promote invasion
due to their influence on nitrogen dynamics. Thirdly, communities are more resistant to
invaders belonging to functional groups already present among the resident species.
Although these results pertain to grassland ecosystems which are regularly “disturbed”
by mowing, similar mechanisms may play a role in other terrestrial and in aquatic
ecosystems where species richness has been shown to increase invasion resistance (see
review of Balvanera et al., in press). However, to our knowledge this has not been
investigated in such a systematic way as we did here in grassland systems.
Acknowledgement
We are grateful to the gardeners and numerous helpers who assisted in weeding and
maintenance of experimental plots. Thanks to Christina Fischer, Anne Froehlich and
Anja Dassler for their assistance in the field and lab. Ernst-Detlef Schulze guided the
development of the Jena Experiment and of this project. This research was supported by
grants from the German Science Foundation (grant no. FOR 456 - WE 2618/6-1 to
66

Plants Diversity Pre-empts Niche for Invaders
WWW and BS) and the Swiss National Science Foundation (grant no. 31–65224.01 to
BS) and by the Friedrich-Schiller-University of Jena and the Max-Planck-Institute for
Biogeochemistry, Jena.
References
Bartelt-Ryser, J., Joshi, J., Schmid, B., Brandl, H., & Balser, T. (2005). Soil feedbacks of plant diversity on soil microbial communities and subsequent plant growth. Perspectives in Plant Ecology, Evolution and Systematics, 7, 27-49.
Balvanera, P., Pfisterer, A.B., Buchmann, N., He, J.-S., Nakashizuka, T., Raffaelli, D., & Schmid, B. (2006). Quantifying the evidence for biodiversity effects on ecosystem functioning and services. Ecology Letters, 9, 1146-1156.
Bossdorf, O., Prati, D., Auge, H., & Schmid, B. (2004) Reduced competitive ability in an invasive plant. Ecology Letters, 7, 346-353.
Britton-Simmons, K.H. (2006) Functional group diversity, resource preemption and the genesis of invasion resistance in a community of marine algae. Oikos, 113, 395-401.
Colautti, R.I., Ricciardi, A., Grigorovich, I.A., & MacIsaac, H.J. (2004) Is invasion success explained by the enemy release hypothesis? Ecology Letters, 7, 721-733.
Clements, F.E. & Goldsmith, G.W. (1924). The phytometer method in ecology: the plant and community as instruments. Publications of the Carnegie Institution, Washington DC, 1-356.
Crawley, M.J., Brown, S.L., Heard, M.S., & Edwards, G.R. (1999) Invasion-resistance in experimental grassland communities: species richness or species identity? Ecology Letters, 2, 140-148.
Davis, M.A., Grime, J.P., & Thompson, K. (2000). Fluctuating resources in plant communities: a general theory of invasibility. Journal of Ecology, 88, 528-534.
Diaz, S. & Cabido, M. (2001) Vive la difference: plant functional diversity matters to ecosystem processes. Trends in Ecology & Evolution, 16, 646-655.
Diemer, M. & Schmid, B. (2001) Effects of biodiversity loss and disturbance on the survival and performance of two Ranunculus species with differing clonal architectures. Ecography, 24, 59-67.
Dimitrakopoulos, P.G. & Schmid, B. (2004) Biodiversity effects increase linearly with biotope space. Ecology Letters, 7, 574-583.
67

Chapter 3
Dukes, J.S. (2001) Biodiversity and invasibility in grassland microcosms. Oecologia, 126, 563-568.
Dukes, J.S. (2002) Species composition and diversity affect grassland susceptibility and response to invasion. Ecological Applications, 12, 602-617.
Elton, C.S. (1958) The ecology of invasions by animals and plants. Methuen, London, UK.
Fargione, J., Brown, C.S., & Tilman, D. (2003) Community assembly and invasion: An experimental test of neutral versus niche processes. Proceedings of the National Academy of Sciences of the United States of America, 100, 8916-8920.
Fargione, J.E. & Tilman, D. (2005) Diversity decreases invasion via both sampling and complementarity effects. Ecology Letters, 8, 604-611.
Fukami, T., Bezemer, T.M., Mortimer, S.R. & van der Putten, W.H. (2005). Species divergence and trait convergence in experimental plant community assembly. Ecology Letters, 8, 1283-1290.
Garnier, E., Cortez, J., Billes, G., Navas, M.L., Roumet, C., Debussche, M., Laurent, G., Blanchard, A., Aubry, D., Bellmann, A., Neill, C., & Toussaint, J.P. (2004) Plant functional markers capture ecosystem properties during secondary succession. Ecology, 85, 2630-2637.
Harper, J.L. (1977) Population biology of plants Academic Press, London.
Hector, A., Dobson, K., Minns, A., Bazeley-White, E., & Lawton, J.H. (2001) Community diversity and invasion resistance: An experimental test in a grassland ecosystem and a review of comparable studies. Ecological Research, 16, 819-831.
Heemsbergen, D.A., Berg, M.P., Loreau, M., van Haj, J.R., Faber, J.H., & Verhoef, H.A. (2004) Biodiversity effects on soil processes explained by interspecific functional dissimilarity. Science, 306, 1019-1020.
Hierro, J.L., Maron, J.L., & Callaway, R.M. (2005) A biogeographical approach to plant invasions: the importance of studying exotics in their introduced and native range. Journal of Ecology, 93, 5-15.
Hutchinson, G.E. (1957) Population Studies - Animal Ecology and Demography - Concluding Remarks. Cold Spring Harbor Symposia on Quantitative Biology, 22, 415-427.
Joshi, J., Matthies, D., & Schmid, B. (2000) Root hemiparasites and plant diversity in experimental grassland communities. Journal of Ecology, 88, 634-644.
Joshi, J., Schmid, B., Caldeira, M.C., Dimitrakopoulos, P.G., Good, J., Harris, R., Hector, A., Huss-Danell, K., Jumpponen, A., Minns, A., Mulder, C.P.H., Pereira, J.S.,
68

Plants Diversity Pre-empts Niche for Invaders
Prinz, A., Scherer-Lorenzen, M., Terry, A.C., Troumbis, A.Y., & Lawton, J.H. (2001) Local adaptation enhances performance of common plant species. Ecology Letters, 4, 536-544.
Kennedy, T.A., Naeem, S., Howe, K.M., Knops, J.M.H., Tilman, D., & Reich, P. (2002) Biodiversity as a barrier to ecological invasion. Nature, 417, 636-638.
Knops, J.M.H., Tilman, D., Haddad, N.M., Naeem, S., Mitchell, C.E., Haarstad, J., Ritchie, M.E., Howe, K.M., Reich, P.B., Siemann, E., & Groth, J. (1999) Effects of plant species richness on invasion dynamics, disease outbreaks, insect abundances and diversity. Ecology Letters, 2, 286-293.
Levine, J.M. (2000) Species diversity and biological invasions: Relating local process to community pattern. Science, 288, 852-854.
Levine, J.M. & D'Antonio, C.M. (1999) Elton revisited: a review of evidence linking diversity and invasibility. Oikos, 87, 15-26.
MacArthur, R. (1970) Species-packing and competitive equilibrium for many species. Theor. Popul. Biol., 1, 1-11.
Markham, J.H. & Chanway, C.P. (1996) Measuring plant neighbour effects. Functional Ecology, 10, 548-549.
Maron, J.L. & Connors, P.G. (1996) A native nitrogen-fixing shrub facilitates weed invasion. Oecologia, 105, 302–312.
Meiners, S.J., Cadenasso, M.L., & Pickett, S.T.A. (2004) Beyond biodiversity: individualistic controls of invasion in a self-assembled community. Ecology Letters, 7, 121-126.
Naeem, S., Knops, J.M.H., Tilman, D., Howe, K.M., Kennedy, T., & Gale, S. (2000) Plant diversity increases resistance to invasion in the absence of covarying extrinsic factors. Oikos, 91, 97-108.
Payne, R.W., Baird, D.B., Gilmour, A.R., Harding, S.A., Lane, P.W., Murray, D.A., Soutar, D.M., Thompson, R., Todd, A.D., Tunicliffe Wilson, G., Webstar, R., & Welham, S.J. (2002) GenStat Release 6.1 Reference Manual VSN International, Wilkinson House, Jordan Hill Road, Oxford, UK.
Petchey, O.L., Hector, A., & Gaston, K.J. (2004) How do different measures of functional diversity perform? Ecology, 85, 847-857.
Pfisterer, A.B., Joshi, J., Schmid, B., & Fischer, M. (2004) Rapid decay of diversity-productivity relationships after invasion of experimental plant communities. Basic and Applied Ecology, 5, 5-14.
69

Chapter 3
Prieur-Richard, A.-H., Lavorel, S., Dos Santos, A., & Grigulis, K. (2002) Mechanisms of resistance of Mediterranean annual communities to invasion by Conyza bonariensis: effects of native functional composition. Oikos, 99, 338-346.
Prieur-Richard, A.H., Lavorel, S., Grigulis, K., & Dos Santos, A. (2000) Plant community diversity and invasibility by exotics: invasion of Mediterranean old fields by Conyza bonariensis and Conyza canadensis. Ecology Letters, 3, 412-422.
Pysek, P., Jarosik, V., & Kucera, T. (2002) Patterns of invasion in temperate nature reserves. Biological Conservation, 104, 13-24.
Roscher, C., Schumacher, J., Baade, J., Wilcke, W., Gleixner, G., Weisser, W.W., & al., e. (2004) The role of biodiversity for element cycling and trophic interactions: an experimental approach in a grassland community. Basic and Applied Ecology, 5, 107-121.
Roscher, C., Temperton, V.M., Scherer-Lorenzen, M., Schmitz, M., Schumacher, J., Schmid, B., Buchmann, N., Weisser, W.W., & Schulze, E.D. (2005) Overyielding in experimental grassland communities - irrespective of species pool or spatial scale. Ecology Letters, 8, 419-429.
Scherber, C., Milcu, A., Partsch, S., Scheu, S. & Weisser, W.W. (2006) The effects of plant diversity and insect herbivory on performance of individual plant species in experimental grassland. Journal of Ecology, Online Early, doi:10.1111/j.1365-2745.2006.01144.
Scherer-Lorenzen, M., Palmborg, C., Prinz, A., & Schulze, E.D. (2003) The role of plant diversity and composition for nitrate leaching in grasslands. Ecology, 84, 1539-1552.
Schmid, B., Hector, A., Huston, M.A., Inchausti, P., Nijs, I., Leadley, P.W., & Tilman, D. (2002). The design and analysis of biodiversity experiments. In Biodiversity and Ecosystem Functioning. Synthesis and Perspectives (eds M. Loreau, S. Naeem & P. Inchausti), pp. 61-75. Oxford University Press, Oxford, UK.
Shea, K. & Chesson, P. (2002) Community ecology theory as a framework for biological invasions. Trends in Ecology & Evolution, 17, 170-176.
Stadler, J., Trefflich, A., Klotz, S., & Brandl, R. (2000) Exotic plant species invade diversity hot spots: the alien flora of northwestern Kenya. Ecography, 23, 169-176.
Stohlgren, T.J., Binkley, D., Chong, G.W., Kalkhan, M.A., Schell, L.D., Bull, K.A., Otsuki, Y., Newman, G., Bashkin, M., & Son, Y. (1999) Exotic plant species invade hot spots of native plant diversity. Ecological Monographs, 69, 25-46.
70

Plants Diversity Pre-empts Niche for Invaders
Stohlgren, T.J., Chong, G.W., Schell, L.D., Rimar, K.A., Otsuki, Y., Lee, M., Kalkhan, M.A., & Villa, C.A. (2002) Assessing vulnerability to invasion by nonnative plant species at multiple spatial scales. Environmental Management, 29, 566-577.
Symstad, A.J. (2000) A test of the effects of functional group richness and composition on grassland invasibility. Ecology, 81, 99-109.
Tilman, D. (1997) Community invasibility, recruitment limitation, and grassland biodiversity. Ecology, 78, 81-92.
Tilman, D. (1999) The ecological consequences of changes in biodiversity: A search for general principles. Ecology, 80, 1455-1474.
Tilman, D., Knops, J., Wedin, D., Reich, P., Ritchie, M., & Siemann, E. (1997) The influence of functional diversity and composition on ecosystem processes. Science, 277, 1300-1302.
Troumbis, A.Y., Galanidis, A., & Kokkoris, G.D. (2002) Components of short-term invasibility in experimental Mediterranean grasslands. Oikos, 98, 239-250.
Turnbull, L.A., Rahm, S., Baudois, O., Eichenberger-Glinz, S., Wacker, L., & Schmid, B. (2005) Experimental invasion by legumes reveals non-random assembly rules in grassland communities. Journal of Ecology, 93, 1062-1070.
Vila, M. & Weiner, J. (2004) Are invasive plant species better competitors than native plant species? evidence from pair-wise experiments. Oikos, 105, 229-238.
Vitousek, P.M. & Howarth, R.W. (1991) Nitrogen limitation on land and in the sea: How can it occur? Biogeochemistry, 13, 87-115.
Wardle, D.A., Bardgett, R.D., Klironomos, J.N., Setala, H., van der Putten, W.H., Wall, D.H. (2004). Ecological linkages between aboveground and belowground biota. Science, 304, 1629-1633.
Xu, K., Ye, W., Cao, H., Deng, X., Yang, Q., & Y., Z. (2004) The role of diversity and functional traits of species in community invasibility. Botanical Bulletin of Academia Sinica, 45, 149 - 157.
Yelenik, S.G., Stock, W.D., & Richardson, D.M. (2004) Ecosystem Level Impacts of Invasive Acacia saligna in the South African Fynbos. Restoration Ecology, 12, 44-51.
71
C h a p t e r 4
Removing aboveground competition does not reduce negative
biodiversity effects on Knautia arvensis transplants
Manuscript
Together with M. Schmitz, M. Scherer-Lorenzen, W.W. Weisser, B. Schmid


Aboveground Biodiversity Effects on Knautia arvensis
Abstract
Newly arriving plants are more competitively suppressed in plant communities that are
more diverse because they use resources more exhaustively than species-poor
communities do. However, the relative contributions of root and shoot competition in this
process are still unknown. We compared the performance of Knautia arvensis transplants
growing in full competition and with shoots of neighbours tied back to determine the
relative strength of aboveground competition in suppressing this test invader without the
confounding effect of shading. Knautia could grow in all the studied communities if
seeded at the same time as all other species. Aboveground biomass, height, leaf mass per
area (LMA) and flowering of transplanted individuals of K. arvensis decreased with
increasing species richness of the host community. Removing the aboveground
competition did not reduce the suppressive effects of species richness on the transplants
biomass, suggesting that the species richness effect was mainly through belowground
competition. The transplants with aboveground competition were taller and had lower
LMA than those without aboveground competition and this shade-avoidance strategy
allowed them to maintain the same biomass. The transplants with removed shading had a
lower (54.2) LMA than plants grown in monocultures (63.6). In addition to species
richness, the presence of grasses in a plant community further reduced the biomass of
transplants of K. arvensis, whereas the presence of legumes increased it and the presence
of non-legume forbs had a neutral effect. Our results suggest that root competition, in
particular by grasses, can render species-rich host communities more competitive
suppressive to newly arriving species, thus enhancing community invasion resistance.
75

Chapter 4
Keywords:
Competitive suppression, grasses, herbs, invasion resistance, legumes, shoots-exclusion,
species richness, transplant performance
76

Aboveground Biodiversity Effects on Knautia arvensis
Introduction
Increasing evidence shows that the chances of establishment of newly arriving plants in
grassland communities decreases with increasing plant diversity (e.g. Burke & Grime
1996; Tilman 1997; Crawley et al. 1999; Hector et al. 2001; van Ruijven et al. 2003;
Fargione & Tilman 2005). Several authors attribute this phenomenon to more efficient
exploitation of resources by diverse than by species-poor communities (Tilman et al.
1996; Hooper 1998; Tilman 1999; Naeem et al. 2000; Spehn et al. 2000; Loreau &
Hector 2001; Symstad & Tilman 2001; Fridley 2003; Scherer-Lorenzen et al. 2003).
Newly arriving plants therefore find progressively fewer “empty” niches as plant diversity
increases (Elton 1958; Levine & D'Antonio 1999) and at local scale, communities become
saturated with species (Cornell & Lawton 1992). For similar reasons, the presence of
particular plant functional groups can affect the success of species additions to plant
communities (Fargione et al. 2003, Mwangi et al. submitted). However, there are also
species-poor communities, which are not invaded, and this requires additional
mechanisms of invasion-avoidance, besides species richness.
Diversity-invasion resistance relationship is often explained by the relationship
between the remaining below- or aboveground resources and biomass or number of
invading species or individuals. In most cases, however, belowground and aboveground
plant interactions are not experimentally separated in diversity-invasion resistance studies.
Increasing species richness may differentially affect above- and belowground biomass
production (see e.g. Spehn et al. 2005), which mediates the effects of plant diversity,
consequently, the corresponding competition effects due to diversity or growing capacity
of specific species. The magnitude of aboveground and belowground competition can
77

Chapter 4
also vary differentially along biotic environmental gradients (see reviews by Wilson 1988;
McPhee & Aarssen 2001).
Aboveground disturbance can reduce the suppression of invaders by diverse
communities especially in the recruitment stage (Hobbs & Huenneke 1992; Burke &
Grime 1996; Levine 2000; Diemer & Schmid 2001; Gross et al. 2005), which is
particularly susceptible to aboveground space and light limitation. In contrast, after initial
establishment the growth of a newly added individual in a plant community may no
longer be suppressed by aboveground competition. We tested this in experimental plant
communities ranging from 1–16 (60) species to which we added transplants of a
phytometer species, Knautia arvensis. Once the phytometers had established, we reduced
aboveground competition around half of them by tying back any shading tiller of the
neighbours and compared their growth and aboveground biomass with the controls still
experiencing full above- and belowground competition. We tested the following specific
hypotheses:
a) suppression of K. arvensis transplants increases with increasing diversity of the
plant community,
b) in addition to diversity, the presence of particular functional groups can negatively
(grasses) or positively (legumes) affect the growth of transplants,
c) the suppression of K. arvensis transplants can be reduced by reducing
aboveground competition,
d) some monocultures are particularly suppressive to the test invader,
e) morphological plasticity in response to aboveground competition may explain the
response observed in (c).
Like in most previous similar studies, we could only assess the aboveground performance
of the test invader. In many cases, shoot biomass is a good predictor of overall plant
78

Aboveground Biodiversity Effects on Knautia arvensis
performance (Howard & Goldberg 2001) although there are pros and cons when used
across an environmental gradient (Cahill 2002b). In plants, morphological plasticity in
response to aboveground competition is a well-documented phenomenon (e.g. Huber
1996, Huber et al. 1998). To assess such morphological responses, we measured plant
height, leaf mass per area, leaf nitrogen concentration and the probability to bolt (produce
stems) or flower on our transplants.
Materials and methods
This study was carried out in a grassland biodiversity experiment that was established in
spring 2002 in Jena, Germany (50o 55’ N, 11o35’ E, 130m altitude, “The Jena
Experiment”, http://www.the-jena-experiment.de). The field site lies in the flood plain of
the river Saale and it was formerly used for agricultural production (Roscher et al. 2004).
Due to a gradient in soil characteristics, the field site was divided into four blocks,
perpendicular to the river. Plant assemblies with 1, 2, 4, 8 and 16 species were formed by
independent random draws with replacement from a pool of 60 naturally co-occurring
central European grassland species. In addition, four plots were sown with all the 60
species. The assemblies were established on 20 x 20-m plots at a sowing density of 1000
viable seeds per square metre. There were 16 replicates with different species composition
at each richness level, except at the 16-species richness level with only 14 replicates. The
plant species were classified into four functional groups: grasses (16 species), small herbs
(12 species), tall herbs (20 species) and legumes (12 species) based on multivariate
analysis of species traits related to ecosystem functioning (Roscher et al. 2004). In
addition, to the gradient in species richness, the number of plant functional groups was
also manipulated, with 1, 2, 3, and 4 groups. Species that were not sown on a given plot
79

Chapter 4
and other weeds were removed by manual cutting at ground level to maintain the
designed species richness and composition treatments. At the end of May and August
each year, the plots were mown and plant materials removed to mimic usual pasture
management. Plots did not receive any fertilization.
In April 2003, we transplanted pre-grown Knautia arvensis L. as test invaders into
the experimental plots. Knautia arvensis is a perennial herb native to Eurasia, occurring in
natural and semi-natural grasslands. It is invasive in other parts of the world like North
America and Canada. It has a well-developed taproot, opposite feather-shaped leaves and
it can attain a height > 1 m, and therefore falls into our functional group of tall herbs in
this experiment (Roscher et al. 2004).
In each experimental plot, we planted five randomly selected plants in a row at
28-cm intervals in a 2 x 2-m subplot of the main plot. The plants were initially grown in a
glasshouse for one month and hardened at the field site for one week before transplanting.
In August 2003, we counted the number of leaves of each plant and harvested the
aboveground parts before routine mowing of the experimental plots. Since the plant
aboveground biomass was strongly correlated with number of leaves per plant in August
2003 (r2=0.86, n=76, p<0.001), we used the latter as a surrogate of size before application
of the shoots exclusion treatment.
Exclusion treatment
Before the start of the second growing season of the transplants in April 2004, we reduced
the aboveground competition around two randomly selected but adjacent K. arvensis
transplants with a neighbouring shoot exclusion treatment. Two other transplants were
used as controls (although sometimes the fifth plant was present, it was not considered for
this study). Exclusion of shoots of the neighbours was achieved by installing a 30 x 60-cm
80

Aboveground Biodiversity Effects on Knautia arvensis
wire-mesh (mesh size 1 x 1 cm) with two holes that were 28 cm apart (i.e. the distance
between two adjacent transplants) to allow unhindered growth of the target K. arvensis
transplants. The wire-mesh was secured with two nails at about 5 cm above the ground
and slightly raised on the sides to allow otherwise free growth of the neighbours that were
tied back. Shoots of the neighbouring plants that would grow through the wire-mesh were
pulled back under the wire mesh at weekly intervals. This exclusion treatment was nested
within plots. The between-plot treatments included species richness, functional group
richness and presence/absence of the four particular functional groups in the experimental
assemblages (Roscher et al. 2004).
In the last week of May 2004, at the peak of growth, the leaf area index (LAI)
between the treatment and control transplant pairs was measured by taking one
measurement above the vegetation and three measurements on the ground using the LAI-
2000 Plant Canopy Analyser (LI-COR Inc., Lincoln, Nebraska, USA). The LAI data were
recomputed with FV200 Software (LI-COR Inc.) to restrict the measure to a 46-degree
cone (two centre rings). This was considered the optimal size that did not extend beyond
the exclusion area around the transplanted K. arvensis test individuals.
We then measured the height, noted whether the transplant had flowered and
randomly harvested ten mature leaves from each pair of transplants. The leaves were
transported to the lab in a cool-box where total leaf area was measured using the LI-3100
area meter (LI-COR Inc., Lincoln, Nebraska, USA). At the same time, the pairs of
transplants were harvested and separated into stems and leaves (including the leaf
samples) and then dried to a constant weight at 70 °C for biomass. We computed leaf
mass per area (LMA) by dividing the total leaf mass by the total leaf area of each ten-leaf
sample. The leaf samples were also analysed for nitrogen content.
81
Chapter 4
Statistical analysis
We used analysis of variance (ANOVA) to test treatment effects on aboveground plant
biomass, plant height, LMA and leaf nitrogen concentration (% of dry mass) of
transplants and analysis of deviance (ANDEV) to test treatment effects on bolting and
flowering probability of transplants. ANOVAs and ANDEVs were calculated with
generalized linear models (Genstat 6 statistical software release 6.2, Payne et al. 2002).
Test statistics were F-values (variance ratios) or quasi F-values (deviance ratios). Plant
height and flowering probability were measured on individual transplants, all other
variables were measured on pairs of transplants (and divided by two to obtain mean
values for individuals).
Because of hierarchical block / plot / plant pair / plant individual design, the
treatment terms in our statistical model were tested at different error strata (Schmid et al.
2002). Sown and realized diversity levels were very closely correlated in our experiment
(Roscher et al. 2004) and we therefore used sown species richness and sown functional
group richness to analyse diversity effects. These richness terms, each partitioned into
linear contrast and deviation, were tested against plots, which represented different
species compositions within richness levels. Contrasts for the presence vs. absence of
each of the four functional groups and their interaction with linear species richness were
fitted in turn in separate analysis runs. These contrasts were also tested at the plot stratum.
The removal of aboveground competition vs. control was tested against the plant pairs as
a split-plot treatment. The removal x species richness interaction, decomposed into linear
contrast and deviation interaction was also tested at the plant pairs stratum. In addition,
the interaction between removal and the contrast for the presence vs. absence of grasses in
plant communities was fitted at this stratum. Finally, we used the community leaf area
82

Aboveground Biodiversity Effects on Knautia arvensis
index (LAI) and the size of transplant before the exclusion treatment as covariates to see
if this could explain any of the other effects, that is, if for example increased species
richness suppressed the test invader via an increased LAI.
Results
Effects of diversity
Increasing species richness had a strong negative effect on the aboveground biomass of K.
arvensis transplants. On average, the transplants were over eight times heavier in
monocultures (8.5g, s.e. 2.4) than in 16-species mixtures (1.0g, s.e. 0.32) (Fig. 4.1, Table
4.1). Similarly, the leaf mass per area (LMA) was negatively affected by increasing
species richness (Fig. 4.1, Table 4.1). The transplants also showed a slight but non-
significant decrease in height with increasing species richness. These responses of the
transplants correlate negatively with a general increase in the leaf area index (LAI) of
their neighbours with increasing species richness (Fig. 4.2, see details below), indicating
that diverse host communities had a more complete aboveground space filling than did
species-poor host communities. Nevertheless, transplants in Festuca pratensis, Festuca
rubra, Lathyurus pratensis, Gallium mollugo and Veronica chamaedrys monocultures
weighed less than 1g on average, whereas those in Cynosurus cristatus, Bellis perennis,
and Geranium pratense monocultures weighed over 35g on average. The richness of plant
functional groups had no influence on any of the measured variables of the transplants (P
> 0.05). However, transplant biomass, height, LMA and probability to bolt or flower
varied strongly between different species compositions within species richness levels.
The presence of small or tall herbs had no effect on aboveground biomass and
plant height of the K. arvensis transplants whereas the presence of legumes had a positive
83

Chapter 4
Pla
nt b
iom
ass
[g]
0
2
4
6
8
1 0
1 2
1 4P
lant
hei
ght [
cm]
0
2 0
4 0
6 0
S o w n s p e c ie s r i c h n e s s
1 2 4 8 1 6 6 0
Leaf
mas
s pe
r are
a [g
m-2
]
0
2 0
4 0
6 0
8 0
a
b
c
effect on aboveground biomass (F1, 68 = 8.66, P = 0.00
0.002) of the transplants. The presence of grasses had sig
biomass (F1, 68 = 9.90, P = 0.002) and height (F1, 69 = 7.2
4.3). On average, transplants in plots with grasses weigh
in plots without grasses. The LMA of transplants was
grasses, tall herbs or legumes (P > 0.05), but transplan
significantly lower LMA than transplants in plots witho
0.040).
84
Figure 4.1 Effect of plant
species richness on a) above-
ground plant biomass, b) plant
height, and c) leaf mass per
area of K. arvensis transplants
with aboveground competition
(filled bars) and without (open
bars) aboveground competi-
tion. Means + 1 s.e. are
shown.
4) and height (F1, 69 = 9.93, P =
nificant negative effects on both
5, P = 0.009) of transplants (Fig.
ed only 1.7 g compared to 6.0 g
not affected by the presence of
ts in plots with small herbs had
ut small herbs (F1, 68 = 4.38, P =

Aboveground Biodiversity Effects on Knautia arvensis
Table 4.1 Summary of analyses of variance using a general linear model for aboveground plant biomass, leaf mass per area, leaf nitrogen concentration and plant height of K. arvensis transplants. Significant values (P < 0.05) are in bold. §Residual d.f. for leaf mass per area, leaf nitrogen concentration and height are 70, 65 and 217 respectively because of some missing values and height data was per plant.
Plant biomass Leaf Mass per Area Leaf Nitrogen
Concentration Plant Height
Source of variation d.f. MS F p-value MS F p-value MS F p-value MS F p-value Between plots Block 3 9.72 3.692 0.016 1287.22 6.820 <.001 0.5601 1.127 0.344 3426.3 2.234 0.092 Species richness (linear-SR; log) 1 64.35 24.429 <.001 5324.30 28.211 <.001 0.8423 1.694 0.197 12521.4 8.165 0.006 Deviation from linear-SR 4 1.59 0.602 0.663 267.82 1.419 0.237 0.3779 0.760 0.555 560.6 0.366 0.832 Functional richness (linear-FG) 1 0.12 0.044 0.834 19.49 0.103 0.749 0.2207 0.444 0.507 52.0 0.034 0.854 Deviation from linear-FG 2 0.41 0.156 0.855 222.89 1.181 0.313 0.0249 0.050 0.951 151.1 0.099 0.906 Composition 69 2.63 4.540 <.001 188.73 2.830 <.001 0.4971 1.230 0.197 1533.5 3.671 <.001
Within plots Exclusion 1 1.08 1.850 0.178 852.85 12.81 <.001 0.2124 0.53 0.470 3084.0 7.383 0.008 Exclusion x linear-SR 1 0.02 0.030 0.865 239.13 3.59 0.062 0.0842 0.21 0.649 449.6 1.076 0.303 Exclusion x Dev-from linear-SR 4 0.29 0.490 0.740 64.91 0.98 0.427 0.0804 0.20 0.938 28.2 0.068 0.991 Residual 72 0.58 66.57 0.4030 365.5

Chapter 4
Sown species richness [log-scale]
168842 16211 1684 81 221 4 164 6042 611 42 4 1681 81 4 8 1622 8 161 2 4 881 82 1641 4 60161 2 82 164 16 60161 4 84 81 8411 22 82 16162 4
Le
af a
rea
inde
x [m
2 m-2
]
0
2
4
6
8
0
Increasing species richness also red
(produce stems) and to flower (Table 4.2
number of flowers was strongly correlated w
probability of the transplants to bolt was als
= 6.51, P = 0.013) and high in plots with l
Concentration of nitrogen in the leaves
communities with grasses (1.86% compared
= 12.169, P = 0.001) or small herbs (1.87%
0.001) and increased in plots with legume
43.20, P < 0.001).
Effects of removal of aboveground competi
The LAI measured in the host community b
with aboveground competition) increased wi
0.025). Furthermore, it was higher in commun
< 0.001), whereas presence of grasses or herb
86
Figure 4.2 Interaction between plantspecies richness and removal ofaboveground competition on leaf areaindex measured next to K. arvensistransplants. Closed symbols and solid lineindicate LAI with abovegroundcompetition; open symbols and brokenline indicate LAI without abovegroundcompetition. Note the symbols are slightlystaggered along the x-axis for clarity.
uced the probability of the transplants to bolt
and Figure 4.4), and as expected, the mean
ith plant biomass (r2 = 0.76, P < 0.001). The
o low in plots with grasses (deviance ratio1, 68
egumes (deviance ratio1, 68 = 3.93, P = 0.05).
of transplants was significantly lower in
with 2.23% N in all other communities, F1, 68
compared with 2.18% N, F1, 68 = 4.56, P =
s (2.30% compared with 1.83% N, F1, 68 =
tion
etween the unmanipulated two transplants (i.e.
th species richness (Fig. 4.2; F1,73 = 5.21, P =
ities with than without legumes (F1,69 = 16.14, P
aceous species had no significant effect on the

Aboveground Biodiversity Effects on Knautia arvensis
LAI. In contrast, the LAI of the host communities between the two transplants were
aboveground competition was reduced, was markedly reduced (F1,73 = 283.42, P < 0.001) and
this reduction was stronger in species-rich communities (Fig. 4.2; flat slope of species
richness against LAI where aboveground competition was removed: F1, 70 = 3.86, P = 0.053).
This shows that the exclusion treatment effectively reduced aboveground light competition.
Table 4.2 Analysis of deviance of probability of K. arvensis transplants to bolt and to flower. The mean deviance (m.dev.), the deviance ratios for the quasi-F test and the level of significance are shown, where *** p < 0.001, * p < 0.05 and σ p < 0.1. Residual d.f. for probability to flower is 217 because probability to flower was assessed at individual level.
Probability to bolt Probability to flower Source d.f. m. dev dev. Ratios P m. dev. dev. ratios P Between plots Block 3 1.999 1.018 2.661 2.81 * Species richness (linear-SR; log) 1 7.472 3.802 σ 20.460 21.63 *** Deviation from linear-SR 4 1.260 0.641 0.700 0.74 Functional richness (linear-FG) 1 0.055 0.028 0.057 0.06 Deviation from linear-FG 2 0.933 0.475 0.704 0.74 Composition 70 1.965 1.970 *** 2.471 2.61 *** Within plots Exclusion 1 0.401 0.400 0.198 0.21 Exclusion x linear-SR 1 2.381 2.380 1.223 1.29 Exclusion x Dev-from linear-SR 4 1.554 1.550 1.232 1.30 Residual 70 0.946
Despite this reduction of aboveground competition, the biomass of the transplants
still declined with increasing species richness (Fig. 4.2a, non-significant interaction
between the exclusion treatment and species richness in Table 4.1). Exclusion of the
shoots of the neighbours also did not affect the probability of the transplants to bolt and to
flower (Table 4.2) or their leaf nitrogen concentration (Table 4.1). There was a slight but
non-significant indication that transplants in plots without grasses had slightly more
87

Chapter 4
aboveground biomass when aboveground competition was reduced, whereas transplants
in plots with grasses did not show such a response (Fig. 3).
without grasses with g
Pla
nt b
iom
ass
[g]
0
2
4
6
8
10
Figure 4.3 Aboveground plant biomass (mean + 1 s.communities with and without grasses, with abovegrouwithout (open bars) aboveground competition.
Sown species richne
1 2 4 8 16
Mea
n nu
mbe
r of f
low
ers
0
3
6
9
12
Figure 4.4 Effect of species richness on mean number oftransplants (mean + 1 s.e.) with aboveground competitiobars) aboveground competition.
88
rasses
e.) of K. arvensis transplants in nd competition (filled bars) and
ss
60
flowers in K. arvensis n (filled bars) and without (open
Aboveground Biodiversity Effects on Knautia arvensis
Removal of aboveground competition revealed a typical morphological response
to increased light availability; transplants were significantly shorter and had higher LMA
than in the more shaded control treatment (Fig. 4.1b–c, Table 4.1). Nevertheless, there
was no significant interaction between the removal of aboveground competition and
species richness on these morphological variables.
To test if the effect of plant diversity on K. arvensis transplants was related to a
changed light environment, i.e. aboveground resource use, we added the LAI as a
covariate to our statistical model. However, LAI had no effect on transplant biomass (F1,
69 = 2.10, P = 0.15) and the species richness effect remained significant. The effect of LAI
on the transplant LMA was significant (F1,69=21.7, P < 0.001) thereby explaining part of
the effects due to species richness and all the effect of removal of aboveground
competition. LAI had no effect on the height of transplants, which was still significantly
reduced by removal of aboveground competition, suggesting that this response was likely
due to light quality (red/far red ratios) rather than light quantity. Leaf nitrogen
concentration decreased with increasing LAI (F1,70 = 11.67, P < 0.001; Fig. 4.5) as
expected from theory (Egli & Schmid 2000). However, the effect of removal of
aboveground competition remained significant (F1, 151 = 4.36, P = 0.041), indicating that
leaf nitrogen concentration of transplants were also influenced by other factors related to
shoot competition, besides LAI.
89

Chapter 4
Sown species richness
1 2 4 8 16 60
Nitr
ogen
con
cent
ratio
n in
leav
es [%
]
0.0
0.5
1.0
1.5
2.0
2.5
3.0
Figure 4.5 Effect of plant species richness on nitrogen concentration in the leaves of K. arvensis transplants with (filled bars) and without (open bars) aboveground competition.
Discussion
We investigated the performance of a plant species inserted into a fully established
community from which it has been absent before. Our test species, Knautia arvensis, is
not an exotic, but native species at our site, so that the term “invader” is here used in its
widest sense, referring to “species invasions” rather than “invasive species”. On first
principles and as a null model, it seems reasonable to assume that the same mechanisms
may allow successful establishment in plant communities of individuals of (i.e. invasion)
both native or exotic species (Scherer-Lorenzen et al. 2007). Furthermore, we believe that
using native species as test-invaders is more appropriate to understand community
invasion resistance, because it avoids possible confounding effects of general and
potential specific invasion mechanisms which might occur with exotics representing a
biased selection of all potential invaders (Hierro et al. 2005; Mwangi et al. submitted).
90

Aboveground Biodiversity Effects on Knautia arvensis
Caveats
In our manipulation, we assumed that the main effect of bending down the neighbours of
the transplants was a reduction in aboveground competition rather than affecting other
aboveground interactions among plants, or between plants and other organisms. For
example, differential herbivory among transplants with and without aboveground
competition was unlikely because herbivory on K. arvensis in the same communities was
very low (Scherber et al unpubl.). In addition, it is unlikely there was a difference in
shoot-root ratio among the bent and intact neighbours, which might have reduced the
positive effects on transplants without aboveground neighbours. We think that such
effects are unlikely, because the bent-down neighbours were still green and growing
during the full course of the experiment. Furthermore, a reduced investment in
aboveground parts would reduce carbon uptake and eventually lead to reduced
belowground biomass.
Effects of diversity
Our results are in line with previous findings indicating that plant diversity can increase
(e.g. Knops et al. 1999; Levine 2000; Naeem et al. 2000; Spehn et al. 2000; Symstad
2000; Hector et al. 2001; e.g. Kennedy et al. 2002; Prieur-Richard et al. 2002; van
Ruijven et al. 2003) and presence of grasses further enhance community invasion
resistance (Crawley et al. 1999). Presence of legumes, on the other hand, can promote the
growth of individuals added to a community because they fix atmospheric nitrogen and
can thereby facilitate nitrogen uptake of other plants (Palmer & Maurer 1997; Prieur-
Richard et al. 2002; Mwangi et al. in press). Only if legumes themselves are added to a
community already containing legumes there usually is a negative effect on the invaders
91
Chapter 4
(Fargione et al. 2003; Turnbull et al. 2005; Mwangi et al. in press). In our experiment, the
non-leguminous test invader K. arvensis benefited from the presence of legumes in the
plant communities. Nevertheless, Lathyrus pratensis and Trifolium repens monocultures
were particularly suppressive to this test invader. Its is not clear why these legumes have
strong negative effect on the test invader but it might be because they have a prostrate
growth form unlike most other legumes in our communities.
Interestingly, the negative effects of plant diversity on the biomass of our test
invader could not be explained by a diversity-related increase in LAI. The transplants did
react to increasing LAI by increased plant height and reduced LMA, which can be
interpreted as a typical shade-response (Huber 1996), although their aboveground
biomass was unaffected. This suggests that the effect of plant diversity on the transplants
was not through light quantity but possibly though light quality and other factors. Three-
dimensional space filling is often suggested as a driver of invasibility (Knops et al. 1999;
Naeem et al. 2000; Prieur-Richard et al. 2002) in studies that focus mainly on the
recruitment stage, using seed-addition experiments. It is conceivable that once a newly
added individual is established in a plant community, aboveground plant diversity effects
are not so strong anymore and competition shifts from above to belowground (Wilson
1988; Casper & Jackson 1997; Cahill 1999). To test if there were some effects of
aboveground competition in our study system, we applied the shoot exclusion treatment
whose results are discussed below.
Our results do not support the theoretical prediction that presence of functionally
similar species enhances invasion resistance: the presence of tall herbs in a plant
community did not have an additional negative effect on Knautia transplants. However,
our results do agree with previous findings that grasses confer high competitive
92

Aboveground Biodiversity Effects on Knautia arvensis
suppression of invaders (e.g. Crawley et al. 1999; Prieur-Richard et al. 2002; Fargione &
Tilman 2005). We tentatively attribute this negative effect of grasses to depletion of soil
resources, because transplants in plots with grasses had significantly lower nitrogen
concentration in their leaves and because the presence of grasses did not increase the LAI
and thus might have little effect on aboveground light competition.
Effects of removal of aboveground competition
Increased aboveground competition in more diverse plant communities may be important
to suppress incoming plant individuals at early stages of their life cycle. Germination and
seedling stages, which are mainly assessed in invasion studies, are particularly vulnerable
to shading and space limitation. Disturbance that reduces aboveground competition and
opens up space for recruitment is a major cause of invasion (Hobbs & Huenneke 1992;
Burke & Grime 1996; Levine & D'Antonio 1999). It has therefore been suggested, that
increased aboveground competition may play the major role in biodiversity-related
invasion resistance (e.g. Naeem et al. 2000; Hector et al. 2001). This hypothesis can be
tested by reducing aboveground competition in a biodiversity experiment, which we have
done here for the first time.
In contrast to the suggestions, our results show that reducing aboveground
competition does not reduce negative biodiversity effects on established plants of the test
invader Knautia arvensis. We attribute this to a potential shift from above- to
belowground competition in “control test invaders” as they become established and
efficiently compete for light. Although light is a highly pre-emptable resource, plants
usually have a great potential to respond to reduced light intensity by physiological
responses leading to morphological plasticity such as elongation of internodes and
93

Chapter 4
petioles or reducing LMA, allowing them to partly escape or avoid negative effects of
shade (e.g. Schmid & Bazzaz 1994; Huber 1996). This was obviously the case with the
established transplants of K. arvensis in our experiment.
The persistence of negative effects of plant diversity on the performance of
established K. arvensis transplants even after removal of aboveground competition
suggests that belowground competition is an important driver of community invasion
resistance. The most likely explanation for this type of invasion resistance is increased
belowground resource pre-emption rather than recruitment limitation as in seed addition
studies. Several competition studies with established plants found a predominance of root
competition over shoot competition (Wilson 1988; Wilson & Tilman 1995; Cahill 1999,
2003) and total competition shifts from above to belowground with decreasing soil
fertility (Wilson & Tilman 1995; Casper & Jackson 1997; Cahill 1999, 2002a). Following
four consecutive seasons of mowing and removal of plant material without fertilization in
our experimental plots, soil resources were depleted to a greater extent in communities
that were more diverse (Oelmann, unpublished data). This and the cumulative effect of
roots (not harvested in contrast to shoots) may have intensified the magnitude of
belowground competition relative to aboveground competition. In addition, removal of
aboveground competition did not reduce the strong negative effect on the performance of
K. arvensis transplants of the presence of grasses in a community. This suggests that the
strong negative effect of grasses is not from aboveground competition; rather
neighbouring grass shoots seem to be slightly facilitative. Grasses have slender and
mostly erect leaves with relatively lesser shading, so the strong effect of grasses might
have been due to their extensive root network that makes them efficient resource users
(Craine et al. 2002; Fargione et al. 2003).
94

Aboveground Biodiversity Effects on Knautia arvensis
Morphological plasticity and changes in allocation of resources (allometry) along
an environmental gradient are common phenomena in plant competition (Tilman 1988).
K. arvensis showed a typical morphological response to aboveground competition: tall
plants with thin leaves. Low leaf:stem ratio in transplants with full competition indicates
an allometric response; that is, more allocation to stems allowing plants to position leaves
higher in the canopy, which then leads to increased plant height. As such, the transplants
could cope with aboveground but not with belowground competition. This suggests that
mere observation of increased aboveground space filling and light interception with
increasing diversity does not necessarily lead to increased competitiveness as reported
before in some diversity–invasion studies (e.g. Fargione, et al. 2003). Our results show
that belowground competition, especially from grasses, can promote invasion resistance
of species-rich communities.
Acknowledgement
Words of thanks go to the team that kept the Jena experiment going especially, Christiane
Roscher who foresaw maintenance of the field site. To gardeners and numerous student
helpers, thanks for your input during weeding and mowing. Christina Fischer, Anja
Dassler and Anne Floelich helped with field and lab work, thanks. This research was
supported by grants from the German Science Foundation (grant no. FOR 456 - WE
2618/6-1 to WWW and BS) and the Swiss National Science Foundation (grant no. 31–
65224.01 to BS) and by the Friedrich-Schiller-University of Jena and the Max-Planck-
Institute for Biogeochemistry, Jena.
95

Chapter 4
References
Burke M.J.W. & Grime J.P. (1996) An experimental study of plant community
invasibility. Ecology, 77, 776-790
Cahill J.F. (1999) Fertilization effects on interactions between above- and belowground competition in an old field. Ecology, 80, 466-480
Cahill J.F. (2002a) Interactions between root and shoot competition vary among species. Oikos, 99, 101-112
Cahill J.F. (2002b) What evidence is necessary in studies which separate root and shoot competition along productivity gradients? Journal of Ecology, 90, 201-205
Cahill J.F. (2003) Neighbourhood-scale diversity, composition and root crowding do not alter competition during drought in a native grassland. Ecology Letters, 6, 599-603
Casper B.B. & Jackson R.B. (1997) Plant competition underground. Annual Review of Ecology and Systematics, 28, 545-570
Cornell H.V. & Lawton J.H. (1992) Species interactions, local and regional processes, and limits to the richness of ecological communities - a theoretical perspective. Journal of Animal Ecology, 61, 1-12
Craine J.M., Tilman D., Wedin D., Reich P., Tjoelker M. & Knops J. (2002) Functional traits, productivity and effects on nitrogen cycling of 33 grassland species. Functional Ecology, 16, 563-574
Crawley M.J., Brown S.L., Heard M.S. & Edwards G.R. (1999) Invasion-resistance in experimental grassland communities: species richness or species identity? Ecology Letters, 2, 140-148
Diemer M. & Schmid B. (2001) Effects of biodiversity loss and disturbance on the survival and performance of two Ranunculus species with differing clonal architectures. Ecography, 24, 59-67
Donald C.M. (1958) The interaction of competition for light and for nutrients. Australian Journal of Agricultural Research, 9, 421-435
Egli P. & Schmid B. (2000) Seasonal dynamics of biomass and nitrogen in canopies of Solidago altissima and effects of a yearly mowing treatment. Acta Oecologica, 21, 63-77
Elton C.S. (1958) The ecology of invasions by animals and plants. Methuen, London, UK.
96

Aboveground Biodiversity Effects on Knautia arvensis
Fargione J., Brown C.S. & Tilman D. (2003) Community assembly and invasion: An experimental test of neutral versus niche processes. Proceedings of the National Academy of Sciences of the United States of America, 100, 8916-8920
Fargione J.E. & Tilman D. (2005) Diversity decreases invasion via both sampling and complementarity effects. Ecology Letters, 8, 604-611
Fridley J.D. (2003) Diversity effects on production in different light and fertility environments: an experiment with communities of annual plants. Journal of Ecology, 91, 396-406
Gross K.L., Mittelbach G.G. & Reynolds H.L. (2005) Grassland invasibility and diversity: Responses to nutrients, seed input, and disturbance. Ecology, 86, 476-486
Hector A., Dobson K., Minns A., Bazeley-White E. & Lawton J.H. (2001) Community diversity and invasion resistance: An experimental test in a grassland ecosystem and a review of comparable studies. Ecological Research, 16, 819-831
Hierro J.L., Maron J.L. & Callaway R.M. (2005) A biogeographical approach to plant invasions: the importance of studying exotics in their introduced and native range. Journal of Ecology, 93, 5-15
Hobbs R.J. & Huenneke L.F. (1992) Disturbance, Diversity, and Invasion - Implications for Conservations. Conservation Biology, 6, 324-337
Hooper D.U. (1998) The role of complementarity and competition in ecosystem responses to variation in plant diversity. Ecology, 79, 704-719
Howard T.G. & Goldberg D.E. (2001) Competitive response hierarchies for germination, growth, and survival and their influence on abundance. Ecology, 82, 979-990
Huber H. (1996) Plasticity of internodes and petioles in prostrate and erect Potentilla species. Functional Ecology, 10, 401-409
Huber H., Fijan A. & During H.J. (1998) A comparative study of spacer plasticity in erect and stoloniferous herbs. Oikos, 81, 576-586
Kennedy T.A., Naeem S., Howe K.M., Knops J.M.H., Tilman D. & Reich P. (2002) Biodiversity as a barrier to ecological invasion. Nature, 417, 636-638
Knops J.M.H., Tilman D., Haddad N.M., Naeem S., Mitchell C.E., Haarstad J., Ritchie M.E., Howe K.M., Reich P.B., Siemann E. & Groth J. (1999) Effects of plant species richness on invasion dynamics, disease outbreaks, insect abundances and diversity. Ecology Letters, 2, 286-293
Levine J.M. (2000) Species diversity and biological invasions: Relating local process to community pattern. Science, 288, 852-854
97

Chapter 4
Levine J.M. & D'Antonio C.M. (1999) Elton revisited: a review of evidence linking diversity and invasibility. Oikos, 87, 15-26
Loreau M. & Hector A. (2001) Partitioning selection and complementarity in biodiversity experiments. Nature, 412, 72-76
McPhee C.S. & Aarssen L.W. (2001) The separation of above- and below-ground competition in plants - A review and critique of methodology. Plant Ecology, 152, 119-136
Naeem S., Knops J.M.H., Tilman D., Howe K.M., Kennedy T. & Gale S. (2000) Plant diversity increases resistance to invasion in the absence of covarying extrinsic factors. Oikos, 91, 97-108
Palmer M.W. & Maurer T.A. (1997) Does diversity beget diversity? A case study of crops and weeds. Journal of Vegetation Science, 8, 235-240
Payne R.W., Baird D.B., Gilmour A.R., Harding S.A., Lane P.W., Murray D.A., Soutar D.M., Thompson R., Todd A.D., Tunicliffe Wilson G., Webstar R. & Welham S.J. (2002) GenStat Release 6.1 Reference Manual. VSN International, Wilkinson House, Jordan Hill Road, Oxford, UK.
Prieur-Richard A.-H., Lavorel S., Dos Santos A. & Grigulis K. (2002) Mechanisms of resistance of Mediterranean annual communities to invasion by Conyza bonariensis: effects of native functional composition. Oikos, 99, 338-346
Roscher C., Schumacher J., Baade J., Wilcke W., Gleixner G., Weisser W.W., Schmid B. & Schulze E.D. (2004) The role of biodiversity for element cycling and trophic interactions: an experimental approach in a grassland community. Basic Applied Ecology, 5, 107-121
Scherer-Lorenzen M., Palmborg C., Prinz A. & Schulze E.D. (2003) The role of plant diversity and composition for nitrate leaching in grasslands. Ecology, 84, 1539-1552
Scherer-Lorenzen M., Olde Venterink, H. & Buschmann, H. (2007) Nitrogen enrichment and plant invasions: The importance of nitrogen fixing plants and anthropogenic eutrophication. In: Nentwig, W. (ed) Biological invasions. Ecological Studies. Springer, Berlin, Heidelberg. In press.
Schmid B. & Bazzaz F.A. (1994) Crown construction, leaf dynamics, and carbon gain in two perennials with contrasting architecture. Ecological Monographs, 64, 177-203
Schmid B., Hector A., Huston M., Inchausti P., Nijs I., Leadley P., Tilman D. (2002) The design and analysis of biodiversity experiments. In: Biodiversity and ecosystem functioning: synthesis and perspectives, p. 61-75. Oxford University Press, Oxford, UK
98

Aboveground Biodiversity Effects on Knautia arvensis
Spehn E.M., Joshi J., Schmid B., Diemer M. & Körner C. (2000) Above-ground resource use increases with plant species richness in experimental grassland ecosystems. Functional Ecology, 14, 326-337
Symstad A.J. (2000) A test of the effects of functional group richness and composition on grassland invasibility. Ecology, 81, 99-109
Symstad A.J. & Tilman D. (2001) Diversity loss, recruitment limitation, and ecosystem functioning: lessons learned from a removal experiment. Oikos, 92, 424-435
Tilman D. (1988) Mechanisms of competition for nutrients and light. In: Plant Strategies and the Dynamics and Structure of Plant Communities, p. 52–97. Princeton University Press, Princeton, NJ
Tilman D. (1997) Community invasibility, recruitment limitation, and grassland biodiversity. Ecology, 78, 81-92
Tilman D. (1999) The ecological consequences of changes in biodiversity: A search for general principles. Ecology, 80, 1455-1474
Tilman D., Wedin D. & Knops J. (1996) Productivity and sustainability influenced by biodiversity in grassland ecosystems. Nature, 379, 718-720
Turnbull L.A., Rahm S., Baudois O., Eichenberger-Glinz S., Wacker L. & Schmid B. (2005) Experimental invasion by legumes reveals non-random assembly rules in grassland communities. Journal of Ecology, 93, 1062-1070
van Ruijven J., De Deyn G.B. & Berendse F. (2003) Diversity reduces invasibility in experimental plant communities: the role of plant species. Ecology Letters, 6, 910-918
Wilson J.B. (1988) Shoot competition and root competition. Journal of Applied Ecology, 25, 279-296
Wilson S.D. & Tilman D. (1995) Competitive responses of 8 old-field plant-species in 4 environments. Ecology, 76, 1169-1180
99
C h a p t e r 5
Positive interactions between nitrogen-fixing legumes and four different
neighbouring species in a biodiversity experiment
Oecologia 151/2: 190-205, 2007
Together with V.M. Temperton, M. Scherer-Lorenzen, B. Schmid, N. Buchmann

Legumes and Neighbouring Species in a Plant Diversity Experiment
Abstract
The importance of facilitative processes due to the presence of nitrogen fixing legumes
in temperate grasslands is a contentious issue in biodiversity experiments. Despite a
multitude of studies of fertilization effects of legumes on associated non-fixers in
agricultural systems, we know little about the dynamics in more diverse systems. We
hypothesised that the identity of target plant species (phytometers) and the diversity of
neighbouring plant species would affect the magnitude of such positive species
interactions. We therefore sampled aboveground tissues of phytometers planted into all
plots of a grassland biodiversity–ecosystem functioning experiment and analysed their
N concentration, δ15N values and biomass. The four phytometer species (Festuca
pratensis, Plantago lanceolata, Knautia arvensis and Trifolium pratensis) each
belonged to one of the four plant functional groups used in the experiment and allowed
the assessment of effects of diversity on N dynamics in individual species. We found
significantly lower δ15N values and higher N concentrations and N content (amount of
N per plant) in phytometer species growing with legumes, indicating a facilitative role
of legumes in these grassland ecosystems. Our data suggest that the main driving force
behind these facilitative interactions in plots containing legumes was reduced
competition for soil nitrate (“nitrate sparing”), with apparent N transfer playing a
secondary role. Interestingly, species richness (and to a lesser extent functional group
number) significantly decreased δ15N values, N concentrations and N content
irrespective of any legume effect. Possible mechanisms behind this effect, such as
increased N mineralisation and nitrate uptake in more diverse plots, now need further
investigation. The magnitude of positive interactions depended on the identity of the
phytometer species. Evidence for increased N uptake in communities containing
103
Chapter 5
legumes was found in all three non-legume phytometer species, with a subsequent
strong increase in biomass in the grass Festuca pratensis across all diversity levels, and
a lesser biomass gain in Plantago lanceolata and Knautia arvensis. In contrast, the
legume phytometer species Trifolium pratense was negatively affected when other
legumes were present in their host communities across all diversity levels.
Keywords: facilitation, nitrogen, δ15N value, stable isotopes, The Jena Experiment
104
Legumes and Neighbouring Species in a Plant Diversity Experiment
Introduction
The ability to fix atmospheric nitrogen is a key trait of most legume species in grassland
or agricultural systems (Mosier 2002) and there can be multiple benefits for non-fixing
plants species growing near N2-fixers. N2-fixers often have high tissue concentrations of
N, which is released into the soil when plant parts die back, decompose and are
mineralised (Tomm et al. 1995). Alternatively, N can be transferred more directly via
root exudation and mycorrhizal links between different plants (McKey 1994, Uselmann
et al. 1999, Shen and Chu 2004, Govindarajulu et al. 2005, Paynel et al. 2001). Non-
fixing plant species, growing either in the vicinity of the N2-fixers or growing on the
same site after N2-fixers have grown there, can take up this N and benefit from it, the
process representing a model case for facilitation between species (Connell and Slatyer
1977, Bertness and Callaway 1994). Furthermore, soil N not taken up by the legumes
due to N2-fixation (spared N) also contributes to facilitative interactions with non N2-
fixing neighbours. Since legume species influence N dynamics of temperate European
grasslands, their potential for improving the quantity and quality of agricultural fodder
has been extensively studied (Vandermeer 1989, Hatch and Murray 1994, Murray and
Clements 1998, Paynel et al. 2001).
In experiments looking at the effect of plant species loss on ecosystem
processes, legume species have also been found to play a key role in influencing
ecosystem N dynamics (Mulder et al. 2002, Spehn et al. 2002, Scherer-Lorenzen et al.
2003, Lambers et al. 2004, Palmborg et al. 2005) and community productivity (e.g.
Tilman et al. 1997, Hector et al. 1999, Hooper and Vitousek 1997, Spehn et al. 2005) of
the grassland ecosystems involved. As potential underlying mechanisms for positive
diversity effects on biomass production, niche complementarity and also facilitation due
105

Chapter 5
to N2-fixers have been suggested (Loreau and Hector 2001, Roscher et al. 2005, Spehn
et al. 2005, but see van Ruijven and Berendse 2003 for an example of positive diversity
effects without legumes). However, in many of these experiments, diverse species
mixtures always included legume species, so it has been argued that a major part of the
positive diversity–productivity relationship can be attributed to the presence or absence
of N2-fixing legumes (an example of the sampling effect, Huston et al. 2000). One of
the issues making a clear separation between effects of species richness and legume
presence on ecosystem processes difficult, is that as species richness increases so does
the probability of including a legume species in the mixture. On the other hand, as
species richness increases the relative proportion of legume species (in plots with
legumes) tends to decrease.
A current focus of biodiversity–ecosystem functioning experiments, therefore, is
on the mechanisms behind the positive biodiversity effects on ecosystem primary
productivity and how they change with time. Previous results suggest that several
processes may be working at the same time to produce these positive biodiversity
effects (Hector et al 2002, Roscher et al. 2005): the processes of niche complementarity
and facilitation and a process known as the sampling (or selection effect). With niche
complementarity and facilitation, trait differences among different species lead to more
complete resource uptake from the environment, such that higher plant productivity (at
community level) can be achieved by more diverse communities (Hector 1998, Tilman
et al. 1997, Tilman 1999, Roscher et al. 2005, Spehn et al. 2005). In contrast, sampling
effects occur because of the increasing chance of including certain key species or
functional groups (e.g. legumes) with increasing community diversity in experiments
using the random sampling with replacement method (Huston 1997, Wardle 1999).
106
Legumes and Neighbouring Species in a Plant Diversity Experiment
Although methods have been developed to separate the sampling effect from
complementarity and facilitation effects (Loreau and Hector 2001, Fridley 2001, Fox
2005), it is much harder to assess the relative roles of these latter two. Investigating
facilitative processes more directly should thus help to elucidate the relative role of N2-
fixers in the higher productivity found in more diverse systems and will enable a better
separation of facilitative from other complementarity effects in biodiversity
experiments.
Since the potential of legumes to fix nitrogen can differ considerably (Carlsson
and Huss-Danell 2003), both among species and under different environmental
conditions (Sanford et al. 1995), the benefit to a neighbouring non-fixing plant will
depend both on the capacity of the legume to fix nitrogen, and on the capacity of the
non-fixing plant to benefit and gain a fitness advantage from the extra N input from its
neighbour. Conversely, legume species can also negatively affect the neighbours via
competition for other resources such as water and light (Tilman et al. 1997, Fargione et
al. 2003). Because in a more diverse community more other non-legume species will
compete for the nitrogen fixed by legumes the facilitative effect on a particular target
species may be lower than in a less diverse community. We also know very little about
the relative magnitude of N transfer during facilitation to plant species of different
functional groups and its consequence for community structure and species abundances.
Although low-diversity agricultural mixtures have been well studied (Sanford et al.
1995, Paynel et al. 2001, Høgh-Jensen and Schoerring 2000) facilitative effects in more
natural systems, over a whole gradient of plant diversity, have received a lot less
attention. The design of biodiversity experiments differs quite considerably from field
agricultural experiments in that species mixtures are chosen at random from a specific
107

Chapter 5
species pool, and many different mixtures representing a long gradient in species and
functional group richness are investigated (Schmid et al. 2002). It is therefore to be
expected that these systems representing a higher diversity gradient (including many
plots without legumes) may show different N dynamics than those found in agricultural
studies, which usually focus on specific low diversity mixtures of agricultural interest.
The main drivers behind facilitative N dynamics in more complex ecosystems still
remain to be elucidated. For example, Thomas and Bowman (1998) found decreased
abundance of graminoids (versus forbs) when growing near Trifolium in alpine tundra,
whereas results from a more species-rich temperate ecosystem indicate that grasses
benefit more than forbs from growing in legume associations (Sanford et al. 1995,
Oelmann et al. submitted), at least at the plant community level.
To investigate the importance of facilitative processes related to N2-fixation
within plant communities of different species richness, we used a biodiversity–
ecosystem functioning experiment that showed a positive diversity–productivity
relationship (see Roscher et al. 2005) to test the following hypotheses:
1) Non-legume plants growing with legume neighbours will have lower δ15N
values and increased N concentrations and N contents compared to those
growing without legume neighbours;
2) Apparent transfer of fixed N2 from legumes to other species depends on the
species richness of the plant neighbourhood;
3) Four plant species representing four functional groups will respond differently to
legume neighbours in terms of extra N acquired; a grass species will benefit
more from legume presence than other non-fixers, due to a larger and more
108

Legumes and Neighbouring Species in a Plant Diversity Experiment
effective root system, whereas a legume species will react neutrally to the
presence of other legumes;
4) Any extra acquired N will lead to growth and hence fitness stimulation in the
species involved.
To address these hypotheses, we used a phytometer approach (Mwangi et al 2006) with
four transplanted species representing the four different functional groups (grasses,
small herbs, tall herbs, legumes) of a biodiversity experiment in Jena, Germany.
Evidence for facilitation related to N2-fixation was investigated using the natural
abundance δ15N technique (Shearer and Kohl 1988, Högberg 1997) over two
consecutive growing seasons. Apparent transfer of N can be assessed because N2 fixed
by legumes carries an isotopic signature of δ15N closer to the atmospheric δ15N
signature (zero ‰) than N taken up from the soil (often positive δ15N values).
Consequently, δ15N values in neighbours of N2-fixers that are closer to zero (compared
to those growing without legume neighbours) indicate that some transfer has probably
taken place. Since phytometers growing with legumes may also benefit from soil
nitrogen unexploited by legumes, differences in plant nitrogen status (N concentration,
N content) together with the δ15N signal in plant tissues indicate changes in N dynamics
of the communities involved. In addition, relating N concentrations to N content in
plants, one can assess whether any extra N uptake by phytometers growing with
legumes resulted in a fitness (biomass) advantage. This assessment of the fitness
consequences of N transfer and extra available N in legume plots was not previously
possible in biodiversity experiments, since particular plant species occurred only in
some of the randomly assembled plant communities. Only a phytometer approach as
109
Chapter 5
used in the present study enables the investigation of the dynamics of N uptake and
transfer to target species across the full experimental species richness gradient in such
experiments.
Materials and methods
Experimental design
Our study was carried out as part of a larger biodiversity–ecosystem functioning
experiment (“The Jena Experiment” http://www.the-jena-experiment.de) in Jena,
Germany (Roscher et al. 2004). The experiment was set up in May 2002 on the outskirts
of the town of Jena (50°55’ N, 11°35’ E; 130 m above sea level). The site lies in the
floodplain of the river Saale, and was planted with vegetables and wheat for 40 years
prior to the experiment. The area around Jena has a mean annual air temperature of 9.3
°C and mean annual precipitation of 587 mm (Kluge and Müller-Westermeier 2000).
Due to flooding dynamics, the soil texture ranges from sandy loam near the river to silty
clay with increasing distance from the river. Because of this gradient in soil
characteristics, the site was divided into four blocks perpendicular to the river and
diversity treatments were equally distributed among blocks.
Experimental communities were established in 82 large plots of 20 x 20 m with
a gradient of species richness (1, 2, 4, 8, 16, 60 species) and functional group richness
(1, 2, 3, 4 groups). The species were taken from a pool of 60 species that are typical to
Central European mesophilic Molinio-Arrhenatheretum meadows (Ellenberg, 1996).
The species from the 60-species pool were categorised into four functional groups:
grasses (16 species), small herbs (12 species), tall herbs (20 species), and legumes (12
species) by multivariate analysis using ecological and morphological traits (see Roscher
110

Legumes and Neighbouring Species in a Plant Diversity Experiment
et al. 2004 for details). The mixtures were created by random selection (with
replacement) producing a near orthogonal design, with 16 replicates per species richness
level (Table 5.1) except for the 16-species (14 replicates) and 60-species richness level
(4 replicates). We define mixture here as both multi-species and monoculture plots, for
purposes of ease of language. It is important to note that the design of The Jena
Experiment varies species richness and number of functional groups in an almost full
factorial way – with obvious limitations at low diversities (it is not possible to have
more functional groups than species) and at very high diversities due to the limited
number of species per functional group within the regional species pool. Thus, up to the
16-species level, there are communities with and without legumes. For more details on
the design, field site and exact species mixtures see Roscher et al. (2004).
Table 5.1 The replication of plant diversity treatments (species richness and functional group number) within The Jena Experiment‘s main experiment large plots, showing the number of different mixtures per treatment (in bold print). Species richness 1 2 4 8 16 60
No. of plots
1 16 8 4 4 2 34 2 8 4 4 4 20 3 4 4 4 12
Func
tiona
l gr
oups
4 4 4 4 4 16 No. of plots 16 16 16 16 14 4 82 This provided a gradient of both plant species and functional richness. All functional groups at a given functional group richness level are generally sown in the same proportion, e.g. 50:50% in 2 FG plots, 33:33:33 % in 3 FG plots. There are exceptions to this, however, e.g. in 8 species and 3 FG plots, where sown legume proportion varies from zero through 0.25 to 0.275 percent. The four phytometer species were planted into every single plot of the experiment after establishment of the mixtures, thus allowing the investigation of diversity treatment effects on individual species.
111
Chapter 5
All plots were mown twice a year in early June and early September
corresponding to the typical management regime for extensive meadows in the region.
Plots were weeded regularly during the growing season to maintain the sown species
compositions. Weeds were cut out at ground level to avoid disturbing the soil. Mowing
and weeding were done on a per block basis such that time differences could be taken
into account by the block effect in the analysis. Plots were not fertilized during the
experimental period.
Assessing the effect of diversity on individual species using transplanted phytometers
Because biodiversity experiments manipulate species and functional group richness as
well as species composition, each particular species will only occur in a subset of
experimental treatment plots. It is therefore difficult to assess the effects of these
diversity treatments on a particular species. For this reason, we selected four species
representative of the four functional groups and transplanted them as “phytometers” into
each experimental plot in the second year of the experiment (2003). We define
“phytometer” here as plant individuals transplanted into every plot of an already
established experiment (Clements and Goldsmith 1924, Mwangi et al. 2006). The four
species, Festuca pratensis Huds. (grass), Plantago lanceolata L. (small herb), Knautia
arvensis L. (tall herb) and Trifolium pratense L. (legume) are all perennial and were
chosen as representatives of their functional groups because of their high relative
abundance in the surrounding Arrhenatherum grasslands. Individuals of the four
phytometer species were pre-grown in potting trays filled with soil from the
experimental site in a greenhouse for one month and transplanted into each large 20 x
20 m plot of the experiment in mid April 2003 at the phenological stage of 4–7 leaves.
112

Legumes and Neighbouring Species in a Plant Diversity Experiment
Five randomly selected plants of each species were planted in lines forming a square of
four species at distances of 28 cm intervals in a 2 x 2 m subplot within each plot. In
total, 1640 individuals were transplanted into the 82 plots.
Plant Sampling
In the last week of August 2003, before the second mowing, the phytometer transplants
were harvested at 5 cm above the ground. Five individuals of each species from each
plot were pooled and dried at 70o C to constant weight to determine aboveground
biomass (Mwangi et al. 2006). Transplants of T. pratense and P. lanceolata had reached
the reproductive stage at this point. The dried plant material was ground with a ball mill
prior to chemical analysis. In the following year (2004), we sampled ten fully open
leaves without petioles of each transplanted species (two leaves per individual) in each
plot before the first mowing. In P. lanceolata, which has a rosette growth form, we cut
off leaves at about 3 cm from the base.
Stable isotope analysis and N content calculation
For determination of isotope ratios and N concentrations, 3.5 ± 0.2 mg of dried and
finely ground plant material per species per plot were weighed into tin capsules for
analysis. Samples were analysed using an elemental analyser (EA 1100 CE, Milan)
coupled through continuous flow with an isotope-ratio mass spectrometer (IRMS Delta
C prototype refurbished to comply with specifications for a Delta+, Finnigan MAT).
Sample ratios of 15N/14N are reported relative to the international standard for
atmospheric nitrogen (calibration with IAEA-N1 0.43 ‰ compared to atmospheric N2).
Sample δ15N values were calculated using the standard delta notation as follows:
113
Chapter 5
δ15N = (Rsample / Rstandard − 1) ×103,
where R represents the ratio of 15N/14N isotopes. N concentrations per species per plot
(%N) were also provided by the EA-IRMS analysis. The amount of N in the
aboveground tissues of five sampled plants per plot was calculated by multiplying the
dry mass of plant material by the corresponding nitrogen concentrations.
Possible limitations of the δ15N natural abundance method for assessing N transfer
Although the δ15N natural abundance method has been frequently used to quantify the
amount of N derived from symbiotic fixation and the transfer of fixed N to non-fixing
neighbours (e.g. Høgh-Jensen and Schjoerring 1994), we refrained from aiming at a
quantification of these processes due to several limitations of the method (Handley and
Scrimgeour 1997, Högberg 1997, Gehring and Vlek 2004). Even the interpretation of
qualitative evidence of N transfer has some limitations and is based on several
assumptions that we could not test empirically within this study. 1) Since non-fixing
species acquire N from several sources, their δ15N signal will not only depend on the
δ15N signal of the neighbouring legumes, but additionally on several other factors, such
as the δ15N signal of soil organic matter and the amount of N mineralised from this soil
organic matter and fractionation during this process.
In this study, we accounted for the spatial heterogeneity of bulk soil isotopic
signals by assessing the effect of experimental blocks on δ15N signals prior to fitting
legume and diversity effects in the ANOVA model. Furthermore, we assumed any
potential fractionation across the study site to be the same. 2) Soil δ15N usually shows
vertical gradients within the soil profile due to fractionation against δ15N during the
114

Legumes and Neighbouring Species in a Plant Diversity Experiment
mineralization–plant uptake pathway (Högberg 1997), and differential input of legume
leaf or root litter at different depths. Differences in rooting depth among several receiver
plants may thus lead to N uptake from differently labelled soil. However, we expect
these differences to be rather small, as the field site was ploughed for 40 years before
the onset of the experiment.
3) Finally, the process of N transfer itself may result in an enrichment of 15N due to
fractionation processes, but this should not differ among plant species (Högberg 1997).
Therefore, in our experiment, the effect of legumes may be considered an integrative
effect of several factors that are influenced by legumes to various degrees. However,
combining δ15N signals with N concentrations within plant tissues, as recommended by
Högberg (1997), provides a good tool to assess facilitative processes between different
diversity treatments.
Testing the relationship between leaf and whole-aboveground-plant δ15N
In a separate measuring campaign, both whole aboveground plants and leaves of the
experimental plant communities (excluding the phytometer plants) were harvested and
analysed for δ15N. These data were used to test for any differences between leaf and
whole plant δ15N, since for logistical reasons the 2003 phytometers harvest consisted of
whole plants, but in May 2004 only of leaves. A comparison of community δ15N per
plot with leaf δ15N per plot found that the two parameters correlate very closely, with
leaf δ15N values generally being slightly higher compared to whole-aboveground-plant
δ15N (δleaf = 0.794 δwhole plt + 0.421; r2 = 0.917, p < 0.0001, n = 28). We therefore used
both δ15N data sets, without any correction, in the overall analysis over two growing
seasons.
115
Chapter 5
Statistical Analysis
The Jena Experiment has a factorial design with different levels of species and
functional group richness as factors. Nevertheless, the design is not entirely balanced
because the two factors depend on each other (e.g. it is impossible to have a plot with
two functional groups but only one species). The design allows one, however, to assess
the influence of different factors on a response variable in an analysis of variance with
sequential sum of squares (Schmid et al. 2002). The analysis done here forms a split-
plot factorial experiment with phytometer species nested within the main factorial
design of The Jena Experiment. In all analyses, we fitted block first to remove
variability due to spatial differences and then tested for the effects of the diversity
treatments. By altering the order in which the diversity treatments were fitted we
assessed the explanatory power of species and functional group richness ignoring or
eliminating each other (Schmid et al. 2002). The design also allowed us to test for the
effects of the presence (or absence) or the relative abundance of legumes (or other
functional groups) in an experimental community on the response variables. In
summary, the statistical design of this experiment tried to reduce confounding effects of
species richness and legume presence or abundance in the experimental communities as
much as possible. To account for differences between the two harvest times, we used
repeated-measures ANOVA (using Genstat 6th Edition, Release 6.2. 2002).
Homoscedasticity and normality were evaluated by plotting residuals and using
Levene’s test. All data fulfilled the assumptions of normality and homogeneity of
variance.
116

Legumes and Neighbouring Species in a Plant Diversity Experiment
The full ANOVA model used to analyse δ15N, N concentration and N contents is shown
in Table 5.2. As facilitation due to presence of legumes was of particular interest in this
study, we also carried out analyses with the presence or absence or the relative
abundance of legumes in an experimental community fitted before species richness or
functional group number, to test for the different effects of this particular functional
group regardless of diversity treatments. To determine the relative abundance of
legumes we calculated their biomass proportion in mixtures at harvest. The interaction
terms ‘species richness x legume presence’ (SR x LG) (Table 5.2) and functional group
number x legume presence (FG x LG) were also fitted into the model.
According to the hierarchical structure of our experiment, error terms were
mixture (MI), mixtures x phytometer species interaction (MI x PhS), mixtures x year
interaction (MI x YR) and mixtures x phytometer species x year interaction (residual).
Finally, we decomposed the phytometer species terms into a contrast of each against the
others to test the particular differences among the transplant species. Species and
functional group richness were also separated into linear contrast and deviations from
linear terms to assess the functional relation between diversity treatments and response.
Results
Evidence for N2-fixation
The legume species in the experimental mixtures had significantly lower δ15N values
and significantly higher N concentrations than non-legume herbs and grasses growing in
mixtures without legumes (Fig. 5.1, non-phytometer species). This clear separation of
both groups, together with the δ15N signal of the legumes around 0 ‰, is a clear
indication that all legumes were actively fixing nitrogen (Högberg 1997). Thus, we can
117

Chapter 5
assume that non-fixing phytometers growing in mixtures with legumes could potentially
benefit from this additional N supply. Trifolium pratense, the only legume phytometer
species was clearly different from the other three, confirming that it was also actively
fixing N2 (Fig. 5.1, Phytometer species).
-2
0
2
4
6
8
N concentration (%)1 2 3 4 5 6
δ15N
(‰)
-2
0
2
4
6
8
Non-phytometer species
Phytometer species
δ15N: *** %N: ***
δ15N: *** %N: ***
May 2004
Figure 5.1 Top panel: The relationship between N concentration and δ15N values in
leaves of legumes (closed symbols) and non-legume species (open symbols) of all
species sown in mixtures (i.e. non-phytometer species), in May 2004. Plants were
sampled from mixtures with 1, 4 and 16 species only. Lower panel: The same
relationship shown for the four phytometer species Festuca pratensis, Plantago
lanceolata, Knautia arvensis (open symbols), and Trifolium pratense (closed symbols)
in May 2004. Data of non-legume phytometers are from plots without neighbouring
legumes only. ***: P < 0.001, two-tailed t-test.
118

Legumes and Neighbouring Species in a Plant Diversity Experiment
Effects of legume presence and abundance
The first hypothesis that non-legume phytometer species growing with legume
neighbours will have lower δ15N values and higher tissue N concentrations and pools
than those growing without legume neighbours was partly confirmed by our data. In an
overall analysis of the data from both years (using repeated measures ANOVA; Table
5.2; Figs. 5.2 and 5.3) we found a clear positive effect of legume presence on N
concentration in all phytometers. This effect was found irrespective of whether legume
presence was fitted before (F1,68 = 25.25, P < 0.0001) or after (Table 5.2) species
richness. In contrast, legume presence had no significant effect on δ15N values and N
contents when fitted after species richness (Table 5.2), yet this effect was significant
when fitted before species richness (δ15N: F1,68 = 10.01, P = 0.002; N content: F1,68 =
4.40, P = 0.04). The effect of legume presence on N concentrations and N content in
phytometer tissues was higher in May 2004 than in August 2003 (Table 5.2). N
concentrations were 2–3 % in August 2003 compared to 2–5 % in May 2004, and
maximum N contents in August 2003 were 100 mg per g of plant material, compared
with 1200 mg per g in May 2004. In contrast, there was no significant difference in δ15N
values in phytometers between the two harvests.
The relative abundance of legumes in mixtures also had a significant effect on
both N concentrations (F1,68 = 61.95, P < 0.0001) and δ15N values of phytometer species
(F1,68 = 7.42, P = 0.008) over the two years when fitted before the diversity treatments,
although a significant relative abundance of legumes x year interaction indicated that
this differed among years (F 1,70 = 7.62, P = 0.007 for N %; F 1,70 = 5.502, P = 0.022 for
δ15N). No significant interactions between species / functional group richness and
relative abundance of legumes were found on either δ15N values, N concentration or N
contents (P = 0.642, P = 0.988, and P = 0.375, respectively).
119

Table 5.2 The effects of species richness, presence of legumes and time (year) on concentration of nitrogen in tissues, δ15N ratios and N content in the phytometer species, using a repeated measures ANOVA (Type 1) for a split plot design (i.e. the phytometer species are nested within each plot). Degrees of freedom (d.f.), mean squares (M.S.), F ratios and P-values are provided for each fitted term in the hierarchical model; (P-values < 0.05 printed in bold face). N concentration (%) δ15N values N content
Source of variation Error term d.f. M.S. F-ratio P-value. d.f. M.S. F-ratio P-value d.f. M.S. F-ratio P-value
Between Subject Factors Block MI 3 0.528 1.037 0.382 3 9.912 3.672 0.016 3 149,083 1.635 0.189Mono. vs. mixtures (MO) MI 1 3.374 6.627 0.012 1 29.045 10.761 0.002 1 957,923 10.505 0.002Spp. richn. (log-linear; SR) MI 1 0.468 0.919 0.341 1 28.035 10.387 0.002 1 468,074 5.133 0.026Legume presence (LG) MI 1 18.226 35.801 0.000 1 7.281 2.698 0.105 1 40,723 0.447 0.506MO x LG MI 1 0.316 0.621 0.433 1 11.793 4.369 0.040 1 33,040 0.362 0.549SR x LG MI 1 0.750 1.474 0.229 1 0.004 0.001 0.971 1 36,146 0.396 0.531Mixture (MI) MI x PhS 73 0.509 2.646 0.000 73 2.699 4.853 0.000 73 91,184 2.076 0.000
Within Subject Factors Phytometer species (PhS) MI x PhS 3 73.268 380.810 0.000 3 376.057 676.240 0.000 3 1,572,390 35.805 0.000MO x PhS MI x PhS 3 0.568 2.952 0.034 3 3.625 6.519 0.000 3 57,925 1.319 0.269SR x PhS MI x PhS 3 0.492 2.555 0.056 3 0.779 1.402 0.243 3 49,876 1.136 0.336LG x PhS MI x PhS 3 0.250 1.300 0.275 3 3.870 6.960 0.000 3 405,066 9.224 0.000MO x LG x PhS MI x PhS 3 0.073 0.381 0.767 3 3.566 6.412 0.000 3 96,152 2.190 0.090SR x LG x PhS MI x PhS 3 0.114 0.594 0.620 3 0.116 0.208 0.891 3 7,767 0.177 0.912MI x PhS Residual 214 0.192 1.428 0.005 214 0.556 1.389 0.008 213 43,915 0.828 0.915
Repeated Measures Year (YR) MI x YR 1 17.457 76.130 0.000 1 1.593 1.929 0.169 1 5,036,954 79.182 0.000MO x YR MI x YR 1 0.433 1.888 0.174 1 1.455 1.761 0.188 1 350,647 5.512 0.022SR x YR MI x YR 1 0.193 0.840 0.362 1 0.107 0.130 0.720 1 336,628 5.292 0.024LG x YR MI x YR 1 0.375 1.633 0.205 1 0.546 0.661 0.419 1 39,624 0.623 0.432MI x YR Residual 75 0.229 1.702 0.002 75 0.826 2.063 0.000 75 63,612 1.200 0.163PhS x YR Residual 3 23.408 173.776 0.000 3 9.412 23.513 0.000 3 1,271,104 23.977 0.000MO x PhS x YR Residual 3 0.341 2.535 0.058 3 1.569 3.919 0.010 3 86,491 1.632 0.184SR x PhS x YR Residual 3 0.298 2.215 0.088 3 0.517 1.291 0.279 3 78,351 1.478 0.222

Legumes and Neighbouring Species in a Plant Diversity Experiment
For 2004, we analyzed the role of the relative abundance of legumes on plant nitrogen
patterns in those communities that contained legumes, because legume abundance is
often mentioned as an important covariate that is confounded with effects of plant
diversity in cases where the proportion of legumes increases with increasing diversity
(e.g. Huston et al. 2000). Relative legume abundance had no effect on δ15N values for
either non-legume phytometers or Trifolium, (and also no effect on tissue N
concentration and N content per plant for the latter; Fig. 5.4, Table 5.3). In contrast,
both N concentration and N content substantially increased with relative legume
abundance in non-fixing species (Fig. 5.4, Table 5.3).
Table 5.3 Linear regression analysis for dependence of δ15N values, N concentration and N content (log) on legume proportion within those mixtures that contained legumes. Data from the harvest in May 2004. See figure 5.4 for data. Species δ15N N concentration
(%)
N content (log)
(mg plant-1)
Biomass (log)
(g plant-1)
P r2 P r2 P r2 P r2
Festuca pratensis 0.185 0.06 < 0.001 0.39 0.027 0.17 0.009 0.16
Plantago lanceolata 0.598 < 0.01 < 0.001 0.54 0.001 0.25 0.016 0.13
Knautia arvensis 0.471 0.01 0.002 0.23 0.047 0.10 0.120 0.06
Trifolium pratense 0.413 0.02 0.101 0.07 0.123 0.06 0.102 0.07
121

Chapter 5
Figure 5.2 Effect of plant species richness and presence of legumes on a) δ15N values, b) nitrogen concentration, c) N content, and d plant biomass in August 2003 for the four phytometer species. Biomass data are the aboveground biomass. Open symbols are plots without any legume species, closed symbols are plots with legume species present. Values are means with standard error.
122

Legumes and Neighbouring Species in a Plant Diversity Experiment
Figure 5.3 Effect of plant species richness and presence of legumes on a) δ15N values, b) nitrogen concentration, c) N content, and d plant biomass in May 2004 for the four phytometer species. Biomass data are the aboveground biomass. Open symbols are plots without any legume species, closed symbols are plots with legume species present. Values are means with standard error. Effects of plant diversity
Species richness had a significantly linear and negative effect on δ15N values, N
concentration, and N content in phytometer tissue; this was independent of legume
presence for δ15N values and N contents (see Figs. 5.2 and 5.3, and realised legume
123

Chapter 5
abundance across the species richness treatments (Table 5.4). This diversity effect was
due to a significant contrast between monocultures and mixtures for N concentration,
whereas for δ15N values and N contents both monoculture vs. mixture contrast and log-
linear species richness contrast were significant (Table 5.2). The number of functional
groups in the surrounding plant mixture had no effect, however, on either N
concentration, N pools or δ15N values of the phytometers after controlling for the
species richness effect. When fitted before species richness, however, the number of
functional groups had a significant effect on δ15N and N content (F3, 65, = 2.19, P =
0.004; F3, 65 = 4.75, P = 0.005; respectively) but not on N concentrations. Species
composition (mixture term) had a significant effect on N concentration, N content and
δ15N values in phytometer tissues. Interaction effects between species richness and
phytometer species identity on δ15N values and N concentration were due to differences
between monocultures and mixtures (see monoculture vs. mixtures x phytometer species
contrast: MO x PhS in Table 5.2).
Responses of different phytometer species
The four phytometer species clearly differed in N concentrations, N content and δ15N
values (Figs. 5.2, 5.3, 5.4 and Table 5.2). The four phytometer species also differed in
their responses to legume presence with regard to tissue N concentrations and N
contents (see significant interaction between legume presence and phytometer species
for δ15N values and N content in Table 5.2). At first sight, this is not surprising, since
one of the phytometer species was a legume itself, and will per se have lower δ15N
values and higher N concentrations in its tissues than the other three species if it is
fixing atmospheric N2. When the difference between Trifolium and the other phytometer
124

Legumes and Neighbouring Species in a Plant Diversity Experiment
species was removed (with a contrast Trifolium vs. other phytometers), however,
significant differences between these other three were still found (P < 0.001 for
subsequent contrast phytometer identity concerning the remaining three phytometer
species). That is, subtle differences in apparent N transfer to different non-N2-fixing
phytometers also occurred: Figs. 5.2 and 5.3 show that Plantago lanceolata
phytometers growing in two-species mixtures responded less strongly to legume
presence than did the other two non-fixing species. Finally, contrasts between the grass
phytometer species and the other two non-fixing phytometers were also all highly
significant (P < 0.001).
Growth responses
Since we found evidence for increased N nutrition of non-legume phytometer species
growing with legumes and that this was modulated by species richness (monocultures
vs. mixtures), we assessed a posteriori whether this extra N was effectively invested
into new growth (see Hypothesis 4 in Introduction). Figure 5.5 shows a “Timmer
diagram” of N concentrations versus N content (Timmer and Morrow 1984) for each
species richness level and split into the difference between legume and non-legume
plots in May 2004. Clear evidence for growth stimulation due to legume neighbours (as
indicated by crossing the isolines on the background, towards higher biomass values
when moving from a non-legume to a legume neighbourhood) was found for Festuca
pratensis and Knautia arvensis, except in monocultures for the latter species. Plantago
lanceolata also showed some positive response in high-diversity communities, but it
was suppressed in growth when growing in legume monocultures. Similarily, Trifolium
pratense showed a strong reduction in growth at almost constant N concentrations (%)
when growing in plots with other legumes present.
125

Chapter 5
Figure 5.4 Influence of relative
abundance of legumes on a) δ15N
values, b) nitrogen concentration,
and c) N content (log-scale) of the
phytometer species in mixtures
containing legumes in May 2004.
Open symbols are non-legume
phytometers, closed symbols re-
present the legume phytometer.
Lines for significant regressions
are shown only (see Table 5.3 for
statistics). Circles and solid line:
Festuca pratensis, squares and
dashed line: Plantago lanceolata,
triangles and dotted line: Knautia
arvensis.
126

Legumes and Neighbouring Species in a Plant Diversity Experiment
0
200
400
600
800
1000
N c
onte
nt (m
g pl
ant-1
)
0
100
200
300
0
50
100
150
200
250
N concentration
N c
onte
nt
N concentration (mg g-1)10 20 30 40 50
0
200
400
600
800
1000
neutral
increase
decrease
Dry weight
Festuca
Plantago
Knautia
Trifolium
1
10
2040
1
5
10
1
2.5
510
1
10
2040
15
++
+
May 2004
Figure 5.5 “Timmer diagrams” (Timmer and
Morrow 1984) showing the change in the
relationship between N concentration and N
content when a phytometer species was
growing with and without legumes
neighbours in May 2004. Values are means
(no standard error bars provided to simplify
diagram) per species richness treatment, and
the two mean values are linked by a straight
line to help visualise the changes between
mixtures without legumes (open symbols)
and those with legumes (closed symbols).
Biomass isolines (dashed lines, numbers
attached indicate dry weight (in g) are
presented as a visual aid so that one can read
off the graph whether changes in N
concentration and N content were
accompanied by an increase, decrease or no
change in biomass (i.e. fitness). Top panel:
conceptual example of potential
hypothesised changes. Lower panels: the
relationship for the four phytometer species.
Filled circles: monocultures, filled squares:
two-species mixtures, filled diamonds: four-
species mixtures, filled inverted triangles:
eight-species mixtures, filled triangles: 16-
species mixtures.
127

Chapter 5
Table 5.4: Mean percentage of sown legume species per plot for each diversity treatment, in all plots and in just those plots containing legumes (bold). Species richness 1 2 4 8 16 60
No. of plots
1 25.0 100.0
25.0 100.0
25.0 100.0
25.0 100.0
0.0 34 8
2 25.0 50.0
25.0 50.0
25.0 50.0
25.0 50.0
20 10
3 25.0 33.3
25.0 33.3
25.0 33.3
12 9
Func
tiona
l gro
ups
4 25.0 25.0
25.0 25.0
25.0 25.0
20.0 20.0
16 16
Average Sown
25.0 100.0
25.0 66.6
25.0 40.0
25.0 40.0
18.75 33.3
20.0 20.0
82 43
Average Realized
25.8 100.0
19.1 51.1
24.2 38.7
23.4 37.4
29.6 46.0
27.4 27.4
Values pertain to sown legume proportions except for the final line of the table, which relates to realized legume proportions over the two years of the study.
Discussion
Our hypotheses on the importance of facilitative effects between N2-fixing legumes and
neighbouring non-fixers rest on the assumption that nitrogen is a limiting resource for
plant growth. Previous work in The Jena Experiment (Oelmann et al. submitted)
established that N is a primary limiting nutrient in our meadow based on measurements
of extractable mineral nitrogen. Additionally, in summer 2003 N:P ratios measured in
aboveground tissues of plants were in the range of 5.9–9.5, well below the critical value
of 16 for P limitation (Wassen et al. 2005). Finally, N-export by biomass harvests
amounts to approximately 150 kg N ha-1 yr-1 (Scherer-Lorenzen, unpublished data)
which is higher than mineral N production via mineralization or input through N-
deposition. Given the fact that N is a limiting nutrient in The Jena Experiment, any
128

Legumes and Neighbouring Species in a Plant Diversity Experiment
additional N input by symbiotic fixation may thus potentially lead to a substantial
facilitative fertilization effect.
Effects of neighbour diversity on N dynamics
The results of our study focussing on four different phytometer species growing within
a biodiversity experiment clearly indicate that legumes were fixing atmospheric N2 and
that non-legume phytometers benefited from increased N uptake when growing with
legume neighbours. The main diversity effect was found both between monocultures
and mixtures (for all N variables) but also amongst more diverse plots (for δ15N and N
content). It appears that, although functional group richness had some influence on δ15N
and N content in general, number of functional groups within a species richness level
was not important. Conversely, species richness within a functional group (as well as in
general terms) had a strong influence on δ15N and N content. A similar result was
obtained for other phytometer traits (Mwangi et al.2006). To help clarify the results
from our relatively complex study, we first discuss differences between plots containing
legumes or not (the legume effect), and then look at species richness effects within these
two sets of plots.
Our results show that δ15N values decreased, while tissue N concentrations and
N contents within phytometer species increased when these species had legumes as
neighbours, supporting earlier studies. In essence, the improved nutritional status of the
phytometers may be due to several processes: (i) uptake of previously fixed N2 through
mineralization of legume tissue (ii) direct N transfer via interconnected mycorrhizal
hyphae or rhizodeposition, or (iii) increased uptake of soil N that is not used by legumes
because they rely more on atmospheric N2 and are inefficient in capturing soil N (Chu et
129

Chapter 5
al. 2004, Scherer-Lorenzen et al. 2003, Kahmen et al. 2006). Nevertheless, our data do
suggest which of these processes may have played a main role and which a more
supporting role in the facilitative interactions. Figure 5.4 shows that a strong effect of
increasing realised legume proportion occurred in relation to plant N content and
concentration but not in relation to δ15N signal in plants. Had the apparent N transfer
from legumes and non-legumes been the main mechanism of facilitation, we would
have expected the δ15N signal to be more significantly affected by legume presence and
abundance than was actually the case. This leaves us with the alternative explanation
that non-legume species benefited most from the so-called “sparing of N” (i.e. increased
availability of soil N since the legumes relied more on atmospheric N sources than soil
N). The lower δ15N values in phytometers growing with legumes, however, suggest that
the phytometers did receive some of their N from previously fixed atmospheric N2. Data
from agricultural studies show that the proportion of N transferred from legumes to
receiver plants may add up to 40% of total N in mixed pastures (Ledgard and Giller
1995). In our study, however, it seems that N transfer played a subordinate role
compared to N sparing, although a clear separation and quantification of these processes
remains challenging.
We could show for the first time that δ15N values, tissue N concentrations and N
contents within individual plant species were negatively modulated by the diversity of
the surrounding neighbourhood. This effect was found even when the legume effect was
first removed from the data by using legume presence or abundance as a covariate.
Table 5.4 shows that the proportional abundance of legumes did not in fact differ
substantially across the species richness treatments. Even when assessing only those
plots containing legumes, the proportional abundance of legumes realised (Table 5.4,
130

Legumes and Neighbouring Species in a Plant Diversity Experiment
derived from harvest biomass) did not form a steep gradient which changed in unison
with the species richness gradient. In addition, if the abundance of legumes realised did
actually have confounding effects with species richness on the δ15N signal, then one
would have expected that decreasing legume abundance with increasing species
richness should result in higher δ15N signals. Our results show the opposite: in plots
with and without legumes, the δ15N signal in the phytometers was lower in the more
diverse plots. A possible mechanism behind this overall effect could be that the many
plant species (differing in their traits) in more species-rich systems are better able to
take up the available soil resources (the so-called complementarity effect) (Mulder et al.
2002; Spehn et al. 2002; Palmborg et al. 2005). A consequence of this improved
nutrient acquisition could be changes in N mineralisation rates (Palmborg et al. 2005)
and improved carbon sequestration in the soil (S. Steinbeiss, personal
communication).Changes in N mineralisation rates, in turn, may lead to changes in δ15N
signal in soil and plant N pools (Högberg 1997), with plant nitrate uptake fractionating
slightly against the heavier isotope, producing lower δ15N signals in plants. Such
processes may account for the lower δ15N signals found in phytometers growing in more
diverse communities, irrespective of legume presence.
Given our current evidence for more positive interactions in the more diverse
plant communities, it is perhaps surprising to see that the gain in N content or biomass
was not as large as might be expected (Fig. 5.5) compared to biomass overyielding
results found at the plant community scale (Roscher et al.2005). Our phytometer results
relate to effects of diversity on single species and their populations, whereas reported
complementarity or sampling effects on biomass or nutrient acquisition usually relate to
the whole community level. Diversity seems to stabilize community and ecosystem
131
Chapter 5
processes but not necessarily population processes (Tilman 1996). Further investigation
of the mechanisms behind this species richness effect (irrespective of legume presence)
on δ15N, N concentrations and N contents is now needed, taking possible
complementarity and sampling effects at both the population and community levels into
account.
Apparent N transfer affected by identity of the receiving species
We found that all three non-legume phytometer species benefited in terms of increased
N uptake when growing in association with legumes across all diversity levels (with a
few exceptions), but their response different considerably. We hypothesised that the
grass species would benefit the most from N transfer from legume species, and this was
indeed the case, and is consistent with observations made in low-diversity agricultural
ecosystems (Sanford et al. 1995, Carlsson and Huss-Danell 2003, Xiao et al. 2004). A
likely reason for indirect grass stimulation of N2-fixation might be depletion of soil N
by the grass, which would reduce nitrate inhibition by nitrate and nodule function, and
increase the dependence of legumes on fixed N (Brophy et al. 1987, Sanford et al.
1995). Alternatively, the “nitrate sparing” found in soils with legumes (Chu et al. 2004,
Scherer-Lorenzen et al. 2003) could be better exploited by the grasses with their
extensive nitrophilic root system as highly efficient short-term soil N foragers. This
more efficient exploitation of soil mineral N sources by grasses compared to herbs or
legumes was recently reported by Kahmen et al. (2006) in managed temperate
grasslands in Thuringia, Germany, using δ15N labelling experiments. Our findings are
also in agreement with evidence at the plant community level, where grass species in
The Jena Experiment benefited more than herb species from growing in mixtures with
132

Legumes and Neighbouring Species in a Plant Diversity Experiment
legume species, and where presence and abundance of legumes caused slightly higher,
and presence of grasses slightly lower nitrate availability in the soil (Oelmann Y et al.,
Soil and plant nitrogen pools as related to plant diversity in an experimental grassland,
submitted to Soil Sci Soc Am J). Spehn et al. (2002) found, in a similar biodiversity
experiment, that the extent of N transfer to non-fixers varied depending both on the
particular legume species and the particular non-legume species taking up the N. All
four phytometer species are known to form symbioses with arbuscular mycorrhizae
(Harley and Harley 1986) and probably do so in The Jena Experiment (Carsten Renker,
personal communication), such that any apparent N transfer differences due to lack of
mycorrhizal association can probably be ruled out.
Although we cannot infer the main mechanism behind the species-specific
response to extra N uptake and apparent N transfer (whether due to differences in root
exudation, mycorrhizal transfer or plant tissue decomposition or N mineralisation rates),
we can assess whether the improved nutrient status of plants growing with legume
neighbours actually produced a growth (fitness) advantage in the phytometers
concerned. We define “fitness advantage” here as increased biomass production, since
biomass is known to be positively correlated with the reproductive output of plants and
is a measure of integrated plant performance. By plotting plant N concentration against
N content on a background of biomass isolines (Fig. 5.5) for the May 2004 harvest, we
assessed whether extra N transferred from legumes to phytometers caused a
concomitant increase in biomass. Figure 5.5 shows the different fitness responses of a
phytometer species to legume neighbours that are possible in theory. If the data line (in
bold) moved along the biomass isoline, then fitness was maintained in the new situation.
If the bold line moved from a lower biomass isoline to a higher one, then fitness
133
Chapter 5
increased. The data from May 2004 indicate that all three non-legume phytometer
species generally increased their fitness when growing with legumes, especially the
grass Festuca pratensis. Plantago lanceolata phytometers growing in monocultures
formed the exception, with a decrease in fitness in legume plots despite increased N
concentrations. A possible explanation could be that Plantago, being a rosette species,
suffered particularly from competitive shading effects of one (dominant) legume
neighbour and was not able to derive a large compensatory advantage from extra N
availability.
Not surprisingly, the legume phytometer Trifolium did not derive any fitness
advantage from growing near other legume neighbours, in fact its fitness was reduced.
In this species, an increase in N concentration did not lead to a fitness advantage. This is
consistent with findings of a recent study by Turnbull et al. (2005), who found that
experimental legume monocultures were more resistant to invasion by legumes than
monocultures of non-legume herbs.
Conclusions
We provide clear evidence for facilitative interactions between legumes and non-legume
neighbours in a biodiversity experiment in temperate grassland. In addition, we found
that species richness generally decreased δ15N values and N concentrations in
phytometer species, and that this effect occurred irrespective of legume presence. This
species richness effect was only partly due to a possible confounding factor of changing
legume abundance with changes in species richness. Further investigation of this species
richness effect on δ15N values and N concentrations, which may be linked to changes in
mineralisation rates, is now needed. Positive interactions in mixtures with legumes
134

Legumes and Neighbouring Species in a Plant Diversity Experiment
seemed to be mainly linked to stimulated phytometer uptake of soil N not used by
legumes (nitrate sparing) but also to a lesser extent to apparent N transfer from legumes.
This suggests that both direct facilitative (N transfer) effects as well as other
complementarity effects (improved resource use in more diverse systems with a variety
of plant traits) played an important role in the plant communities investigated. A
hierarchical partitioning of these underlying mechanisms could be one of the next steps
in biodiversity-ecosystem functioning research. The magnitude of the positive response
to legume neighbours differed between phytometer species, with the grass Festuca
pratensis benefiting the most. All three non-legume phytometer species were able to
gain a fitness advantage in mixtures with legumes, whereas the legume phytometer
reacted negatively to legume neighbours. Thus, trait differences between species, e.g.
related to belowground foraging for resources, are important for understanding positive
interactions among legume and non-legume species and its effect on community
dynamics and ecological processes.
Acknowledgements
We thank the people who helped design and set up The Jena Experiment, especially Ernst-
Detlef Schulze, Christiane Roscher, Wolfgang Weisser and Jens Schumacher, and those who
helped with the management of the experiment in the first 3 years: the gardeners Steffen
Eismann, Silvia Junghans, Heike Scheffler and Ulrike Wehmeier, and many student helpers,
especially Manuela Bärwolff, Carsten Möller, Katja Würfel and Christina Fischer, assisting in
the plant sample preparation for isotope analysis. Thanks also to all the helpers during the
weeding campaigns; and to Andy Hector for statistical discussions. At the Max Planck
Institute for Biogeochemistry, special thanks go to Willi Brandt and Heike Geilmann in the
135

Chapter 5
isolab for the stable isotope analyses. The Jena Experiment is funded by the Deutsche
Forschungsgemeinschaft (DFG, FOR 456), with additional support from the Friedrich
Schiller University of Jena and the Max Planck Society.
References
Bertness MD, Callaway HS (1994) Physical stress and positive associations among marsh plants. American Naturalist 144:363-372
Brophy LS, Heichel GH, Russelle MP (1987) Nitrogen transfer from forage legumes to grass in a systematic planting design. Crop Science 27:753-758
Carlsson G, Huss-Danell K (2003) Nitrogen fixation in perennial forage legumes in the field. Plant Soil 253:353-372
Chu GX, Shen QR, Cao KL (2004) Nitrogen fixation and N transfer from peanut to rice cultivated in aerobic soil in an intercropping system and its effect on soil N fertility. Plant Soil 263:17-27
Connell JH, Slatyer RO (1977) Mechanisms of succession in natural communities and their role in community stability and organization. American Naturalist 111:1119-1144
Ellenberg H (1996) Die Vegetation Mitteleuropas mit den Alpen in ökologischer, dynamischer und historischer Sicht, 5. edn. Ulmer, Stuttgart
Fargione J, Brown CS, Tilman D (2003) Community assembly and invasion: An experimental test of neutral versus niche processes. Proceedings of National Academy of Sciences 100:8916-8920
Fox JW (2005) Interpreting the ‘selection effect’ of biodiversity on ecosystem function. Ecology Letters 8:846-856
Fridley JD (2001) The influence of species diversity on ecosystem productivity: how, where, and why? Oikos 93:514-526
Gehring C, Vlek PLG (2004) Limitations of the 15N natural abundance method for estimating biological nitrogen fixation in Amazonian forest legumes. Basic Applied Ecology 5:567-580
Govindarajulu M, Pfeffer PE, Abubaker J, Douds DD, Allen JW, Bücking H, Lammers PJ, Shacher-Hill Y (2005) Nitrogen transfer in the arbuscular mycorrhizal symbiosis. Nature 435:819-823
136
Legumes and Neighbouring Species in a Plant Diversity Experiment
Handley LL, Scrimegeour CM (1997) Terrestrial plant ecology and 15N natural abundance: the present limits to interpretation for uncultivated systems with original data from a Scottish old field. Advance Ecological Restoration 27:132-212
Harley JL, Harley EL (1986) A Check-List of Mycorrhiza in The British Flora. New Phytology 105:1-102
Hatch DJ, Murray PJ (1994) Transfer of nitrogen from damaged roots of white clover (Trifolium repens L.) to closely associated roots of intact perennial ryegrass (Lolium perene L.). Plant Soil 166:181-185
Hector A (1998) The effect of diversity on productivity: detecting the role of species complementarity. Oikos 82:597-599
Hector A, Schmid B, Beierkuhnlein C, Caldeira MC, Diemer M, Dimitrakopoulos PG, Finn J, Freitas H, Giller PS, Good J, Harris R, Högberg P, Huss-Danell K, Joshi J, Jumpponen A, Körner C, Leadley PW, Loreau M, Minns A, Mulder CPH, O’Donovan G, Otway SJ, Pereira JS, Prinz A, Read DJ, Scherer-Lorenzen M, Schulze E-D, Siamantziouras A-SD, Spehn E, Terry AC, Troumbis AY, Woodward FI, Yachi S, Lawton JH (1999) Plant diversity and productivity experiments in European grasslands. Science 286:1123-1127
Hector A, Bazeley-White E, Loreau M, Otway S, & Schmid B (2002). Overyielding in grassland communities: testing the sampling effect hypothesis with replicated biodiversity experiments. Ecol Letters 5:502-511
Hooper DU, Vitousek PM (1997) The effects of plant composition and diversity on ecosystem processes. Science 277:1302-1305
Högberg P (1997) Tansley review No 95- N15 natural abundance in soil-plant systems. New Phytology 137:179-203
Høgh-Jensen H, Schjoerring JK (1994) Measurement of biological dinitrogen fixation in grassland: Comparison of the enriched 15N dilution and the natural 15N abundance methods at different nitrogen application rates and defoliation frequencies. Plant Soil 166:153-163
Høgh-Jensen H, Schjoerring JK (2000) Below-ground nitrogen transfer between different grassland species: Direct quantification by N-15 leaf feeding compared with indirect dilution of soil N-15. Plant Soil 227:171-183
Huston MA (1997) Hidden treatments in ecological experiments: Re-evaluating the ecosystem function of biodiversity. Oecologia 110:449-460
137
Chapter 5
Huston MA, Aarssen LW, Austin MP, Cade BS, Fridley JD, Garnier E, Grime JP, Hodgson J, Lauenroth WK, Thompson K, Vandermeer JH, Wardle DA (2000) No consistent effect of plant diversity on productivity. Science 289:1255
Kahmen A, Renker C, Unsicker S, Buchmann N (2006) Niche complementarity for nitrogen use in grasslands- an explanation for the biodiversity and ecosystem functioning relationship in grasslands? Ecology
Kluge G, Müller-Westermeier G (2000) Das Klima ausgewählter Orte der Bundesrepublik Deutschland: Jena. Berichte Deutsch Wetterd 213.
Lambers, JHR, Harpole WS, Tilman D, Knops J, Reich PB (2004) Mechanisms responsible for the positive diversity-productivity relationship in Minnesota grasslands. Ecology Letters 7:661-668
Ledgard SF, Giller KE (1995) Atmospheric N2 fixation as an alternative N source. In: Bacon PE (ed) Nitrogen fertilization in the environment. Marcel Dekker, New York, Basel, Hong Kong, pp 443-486
Loreau M, Hector A (2001) Partitioning selection and complementarity in biodiversity experiments. Nature 412:72-76
McKey D (1994) Legumes and Nitrogen: the evolutionary ecology of a Nitrogen-demanding lifestyle. In: Sprent JI, McKey D (eds) Advances in Legume Systematics 5: The Nitrogen Factor. Royal Botanic Gardens, Kew, pp 211-228
Mosier AR (2002) Environmental challenges associated with needed increases in global nitrogen fixation. Nutrient Cycling in Agroecosystems 63:101-116
Mulder CPH, Jumpponen A, Högberg P, Huss-Danell K (2002) How plant diversity and legumes affect nitrogen dynamics in experimental grassland communities. Oecologia 133:412-421
Murray PJ, Clements RO (1998) Transfer of nitrogen between clover and wheat: Effects of root herbivory. European Journal of Soil Biology 34:25-30
Mwangi PN, Schmitz M, Scherber C, Roscher C, Schumacher J, Scherer-Lorenzen M, Weisser WW, Schmid B (2006) Niche pre-emption increases with species richness in experimental plant communities. J Ecol (in press)
Palmborg C, Scherer-Lorenzen M, Jumpponen A, Carlsson G, Huss-Danell K & Högberg P (2005) Inorganic soil nitrogen under grassland plant communities of different species composition and diversity. Oikos 110:271-282
138

Legumes and Neighbouring Species in a Plant Diversity Experiment
Paynel F, Murray PJ, Cliquet JB (2001) Root exudates: a pathway for short-term N transfer from clover and ryegrass. Plant Soil 229:235-243
Pate JS (1976) Physiology of the reaction of nodulated legumes to the environment. In: Nutman PS (ed) Symbiotic nitrogen fixation in plants. Cambridge University Press, Cambridge, pp 335-360
Roscher C, Schumacher J, Baade J, Wilcke W, Gleixner G, Weisser WW, Schmid B, Schulze E-D (2004) The role of biodiversity for element cycling and trophic interactions: an experimental approach in a grassland community. Basic Applied Ecology 5:107-121
Roscher C, Temperton VM, Scherer-Lorenzen M, Schmitz M, Schumacher J, Schmid B, Buchmann N, Weisser WW, Schulze ED (2005) Overyielding in experimental grassland communities - irrespective of species pool or spatial scale. Ecology Letters 8:419-429
Sanford P, Pate JS, Unkovitch MJ, Thompson AN (1995) Nitrogen fixation in grazed and ungrazed subterranean clover pasture in south west Australia assessed by the 15N natural abundance technique. Austral Journal of Agricultural Restoration 46:1427-1443
Scherer-Lorenzen M, Palmborg C, Prinz A, Schulze E-D (2003) The role of plant diversity for nitrate leaching in grasslands. Ecology 84:1539-1552
Schmid B, Hector A, Huston MA, Inchausti P, Nijs I, Leadley PW, Tilman D (2002) The design and analysis of biodiversity experiments. In: Loreau M, Naeem S, Inchausti, P (eds) Biodiversity and Ecosystem Functioning – Synthesis and Perspective. Oxford University Press, Oxford, pp 61-75
Shearer G, Kohl DH (1988) Estimates of N2 fixation in ecosystems: the need for and basis of the 15N natural abundance method. In: Rundel PW, Ehleringer JR, Nagy KA (eds) Stable isotopes in ecological research. Springer, Heidelberg New York, pp 324-374
Shen QR, Chu GX (2004) Bi-directional transfer in an intercropping system of peanut with rice cultivated in aerobic soil. Biology and Fertility of Soils 40(2):81-87
Spehn EM, Scherer-Lorenzen M, Schmid B, Hector A, Caldeira MC, Dimitrakopoulos PG, Finn JA, Jumpponen A, O´Donnavan G, Pereira JS, Schulze E-D, Troumbis AY, Körner C (2002) The role of legumes as a component of biodiversity in a cross-European study of grassland biomass nitrogen. Oikos 98:205-218
139

Chapter 5
Spehn EM, Hector A., Joshi J, Scherer-Lorenzen M, Schmid B, Bazeley-White E, Beierkuhnlein C, Caldeira MC, Diemer M, Dimitrakopoulos PG, Finn J, Freitas H, Giller PS, Good J, Harris R, Högberg P, Huss-Danell K, Jumpponen A, Koricheva J, Leadley PW, Loreau M, Minns A, Mulder CPH, O’Donovan G, Otway SJ, Palmborg C, Pereira JS, Pfisterer AB, Prinz A, Read DJ, Schulze E-D, Siamantziouras A-SD, Terry AC, Troumbis AY, Woodward FI, Yachi S, Lawton JH (2005) Ecosystem effects of biodiversity manipulations in European grasslands. Ecological Monographs 75:27-63
Thomas BD, Bowman WD (1998) The influence of N-2 fixing Trifolium on plant species composition and biomass production in alpine tundra. Oecologia 115:26-31
Tilman D, Knops J, Wedin D, Reich P, Ritchie M, Siemann E (1997) The influence of functional diversity and composition on ecosystem processes. Science 277:1300-1302
Tilman D (1999) The ecological consequences of changes in biodiversity: a search for general principles. Ecology 80:1455-1475
Timmer VR, Morrow LD (1984) Predicting fertilizer growth response and nutrient status of jack pine by foliar diagnosis. In: Stone EL (ed) Forest soils and treatment impacts. The University of Tennesse, Knoxville, pp 335-351
Tomm GO, Walley Fl, van Kessel C, Slinkard AE (1995) Nitrogen cycling in an alfalfa and brome-grass sward via litter-fall and harvest losses. Agronomy Journal 87:1078-1085
Turnbull LA, Rahm S, Baudois O, Eichenberger-Glinz S, Wacker L, Schmid B (2005) Experimental invasion by legumes reveals non-random assembly rules in grassland communities. Journal of Ecology 93:1062-1070
Uselmann SM, Qualls RG, Thomas RB (1999) A test of a potential short cut in the nitrogen cycle: The role of exudation of symbiotically fixed nitrogen from the roots of an N-fixing tree and the effects of increased atmospheric CO2 and temperature. Plant Soil 212:21-32
Vandermeer JH (1989) The ecology of intercropping. Cambridge University Press, Cambridge
Van Ruijven J, Berendse F (2003) Positive effects of plant species diversity on productivity in the absence of legumes. Ecology Letters 6:170-175
Wardle D (1999) Is “sampling effect” a problem for experiments investigating biodiversity-ecosystem function relationships? Oikos 87:403-407
140

Legumes and Neighbouring Species in a Plant Diversity Experiment
Wassen MJ, Venterink HO, Lapshina ED, Tanneberger F (2005) Endangered plants persist under phosphorus limitation. Nature 437:547-550
Xiao YB, Li L, Zhang FS (2004) Effect of root contact on interspecific competition and N transfer between wheat and faba bean using direct and indirect N-15 techniques. Plant Soil 262:45-54
141

C h a p t e r 6
Summary


Summary
Summary
Scientists believe we are already in the sixth extinction crisis, which unlike the past mass
extinction episodes is driven by human activities. Conservative estimates by the IUCN1
predict a loss of over four plant species per year worldwide. Other reports show that 22–
47% of all plant species are threatened with extinction2. In addition to efforts in reducing
human-induced rates of extinction, there is a great need to understand the possible
consequences of this loss of biodiversity. This requires an integrated approach involving
different disciplines, commensurate with the complexity of ecosystems.
The Jena Experiment in Jena Germany is one of such initiatives, which broadly
seeks to determine the effect of changes in plant diversity on multi-trophic interactions,
productivity, soil diversity, nutrients cycling, hydrology and plant population dynamics.
This thesis is a product of the plant population dynamics sub-project of The Jena
Experiment. On one hand, I sought to determine how local changes in plant diversity affect
the remaining plant species. On the other hand, I wanted to determine how such changes
influence the possibility of introduced species to establish. The second question also
enabled me to evaluate how changes in plant diversity influence complementary and
facilitative interactions between host community and introduced species.
In terms of community productivity, The Jena Experiment confirmed previous
findings that loss of species reduces aboveground biomass. This suggests that loss of
species may reduce carbon fixed from the atmosphere, thus less energy would enter into
the system to support higher trophic levels. In chapter 2 of this thesis, I show how this
reduced primary productivity of the system is manifested in individual plants of a set of
test species. I hypothesized that individual plants are bigger in species-rich communities 1 The World Conservation Union (www.iucn.org) 2 Pitman N.C.A., Jorgensen P.M., Williams R.S.R., Leon-Yanez S. & Valencia R. (2002) Extinction-rate estimates for a modern neotropical flora. Conservation Biology, 16, 1427-1431
145
Chapter 6
because there are fewer neighbors of the same species, resulting in the observed increase in
community productivity. However, despite the positive relationship between species
richness and community productivity, the effect on individuals of the four test species that
I evaluated varied greatly. Increasing species richness had positive effects on the biomass
of individuals of D. glomerata, neutral effects on the biomass of individuals of P. pratense
and T. pratense and negative effects on the biomass of individuals of G. pratense. This
corresponded well with the effects of species richness on the population-level biomass in
these species. Mortality of individuals of D. glomerata and T. pratense declined with
increasing species richness leading to significantly increased numbers of individuals per
seed sown in D. glomerata. This indicated that the positive effect of species richness on
biomass of the entire population of D. glomerata was due both to increased numbers and
sizes of individuals. The competitively superior Arrhenatherum elatius had a negative
effect on the performance of individuals and population of the grass species, thus reducing
the positive effects of diversity on these species. The results of this chapter show that
individual species respond differentially to changes in species richness.
Understanding factors influencing invasibility of a plant community is a major goal
in ecology. This is because invasion can negatively affect the integrity of an ecosystem.
Using native species as test invaders to avoid confounding effects of invasiveness of exotic
species, in chapters 3 and 4 I report that plant diversity does indeed increase invasion
resistance. Species richness enhances invasion resistance more strongly than does
functional-group richness. In general, the presence of grasses increased invasion resistance
of experimental communities, whereas herbs had neutral and legumes had positive effects.
In addition, communities containing species of the same functional group as introduced
species were most inhibitive to these test invaders, demonstrating that high niche overlap
between native and introduced species enhances invasion resistance. To test if invasion
146
Summary
resistance was due to above- or belowground interactions between the host community and
introduced species, in chapter 4 I report results from an experiment in which I removed
aboveground competition by neighbors around test invaders. I could thus demonstrate that
belowground interactions were more important for invasion resistance than aboveground
interactions: removing aboveground competition did not reduce the negative effects of
species richness on the biomass of the test invader, K. arvensis. Furthermore, removal of
aboveground competition revealed the typical shade-avoidance response of increased
height growth and reduced leaf mass per area in the test species. In conclusion, root
competition, especially by grasses, can render species-rich host communities highly
suppressive of invaders, thus enhancing the invasion resistance of a host community.
It is well known that nitrogen-fixing legumes associated with other plants can
increase yield in simplified agricultural systems. In chapter 5, we used the transplant
approach to test if legumes have similarly beneficial effects in systems that are more
diverse. We found that plants growing in communities with legumes had lower δ15N values
than communities without legumes, an indication that atmospheric nitrogen fixed by
legumes “fertilized” the entire community. This was also reflected in higher nitrogen
contents and concentrations in the transplanted “phytometer” individuals. However,
species richness and to a lesser extent functional group richness of communities reduced
the facilitative effects of legume presence. These negative effects of diversity on
facilitation were partly due to decreasing legume abundance with increasing species
richness. The transplanted phytometers of the four test species benefited differentially from
the presence of legumes: increased N uptake was found in the three non-legume test
species, with a subsequent increase in biomass only in the one grass test species; the
legume test species Trifolium pratense was negatively affected by the presence of other
legumes in the experimental communities.
147
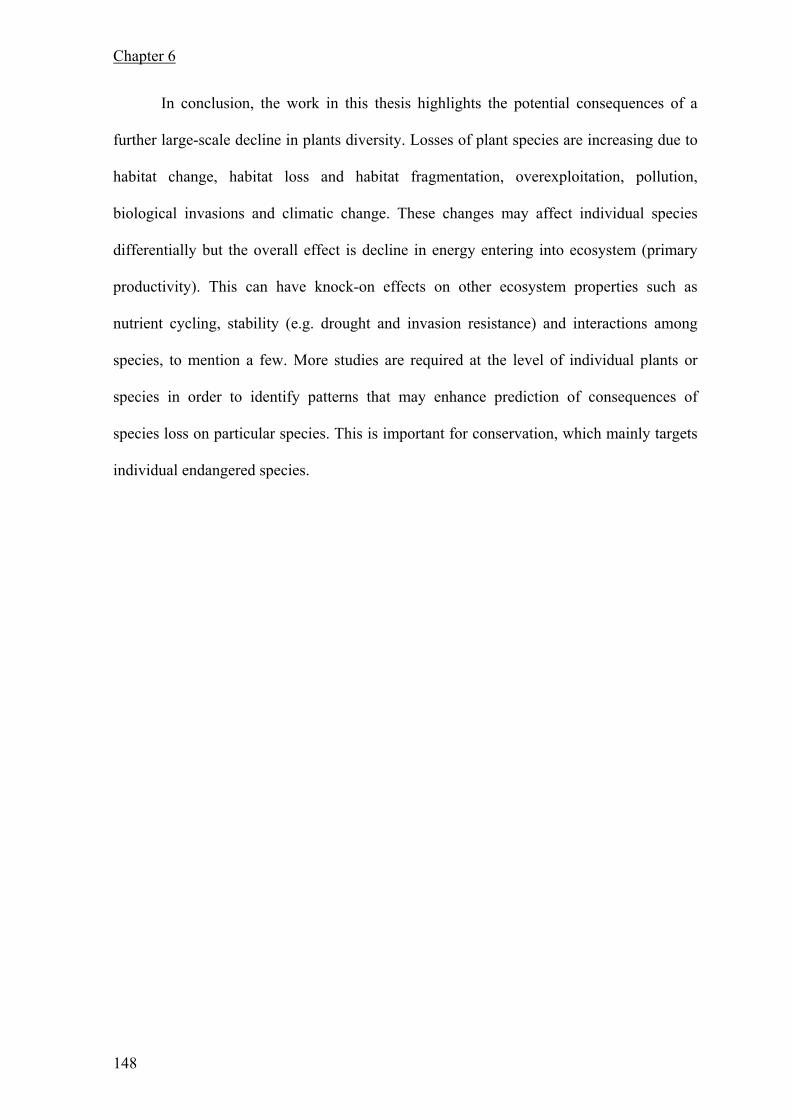
Chapter 6
In conclusion, the work in this thesis highlights the potential consequences of a
further large-scale decline in plants diversity. Losses of plant species are increasing due to
habitat change, habitat loss and habitat fragmentation, overexploitation, pollution,
biological invasions and climatic change. These changes may affect individual species
differentially but the overall effect is decline in energy entering into ecosystem (primary
productivity). This can have knock-on effects on other ecosystem properties such as
nutrient cycling, stability (e.g. drought and invasion resistance) and interactions among
species, to mention a few. More studies are required at the level of individual plants or
species in order to identify patterns that may enhance prediction of consequences of
species loss on particular species. This is important for conservation, which mainly targets
individual endangered species.
148

Zusammenfassung
Zusammenfassung
Die wissenschaftliche Forschung sieht uns schon heute in einer sechsten Phase eines
massenhaften Artensterbens, welches jedoch anders als in der Vergangenheit auf den
Menschen zurückzuführen ist. Konservative Schätzungen der IUCN3 gehen von einem
Pflanzenartenverlust von vier Arten pro Jahr weltweit aus. Andere Untersuchungen zeigen,
dass 22–47 % der Pflanzenarten vom Aussterben bedroht sind4. Ergänzend zu den
Versuchen, das durch den Menschen verursachte Artensterben zu reduzieren, besteht eine
grosse Aufgabe darin, die Folgen des Biodiversitätsverlusts zu erkennen. Dies erfordert
einen integrierenden Ansatz, der durch die Einbindung unterschiedlicher Disziplinen der
Komplexität eines Ökosystems Rechnung trägt.
Das Jena Experiment in Deutschland ist eine derartige Initiative, welche die
Auswirkungen des Verlusts von Pflanzenarten auf verschiedene trophische Interaktionen,
Produktivität, Diversität des Bodenlebens, Nährstoffkreislauf, Hydrologie und
Populationsdynamik der Pflanzen untersucht. Die vorliegende Arbeit beschränkt sich auf
das Teilprojekt innerhalb des Jena Experimentes, welches die populationsdynamischen
Prozesse untersucht. Einerseits wollte ich feststellen, wie lokale Veränderungen der
Diversität einer Pflanzengemeinschaft sich auf die verbleibenden Pflanzenarten auswirken.
Andererseits versuchte ich abzuklären, wie solche Veränderungen die Etablierung
eingewanderter Arten beeinflussen. Die zweite Frage ermöglicht darüber hinaus die
Einschätzung der Bedeutung des Artenverlusts für Komplementarität und positive direkte
oder indirekte Interaktionen in Pflanzengesellschaften.
Hinsichtlich der Produktivität einer Pflanzengesellschaft werden im Jena Experiment
bisherige Forschungsergebnisse, die einen Artenverlusst mit einer geringeren
3 The World Conservation Union (www.iucn.org) 4 Pitman N. C. A., Jorgensen P.M., Williams R.S.R., Leon-Yanez S. & Valencia R. (2002) Extinction-rate estimates for a modern neotropical flora. Conservation Biology, 16, 1427-1431
149

Chapter 6
Pflanzenbiomasse in Verbindung bringen, bestätigt. Daraus lässt sich folgern, dass mit dem
Artenverlusst auch die Rate der Kohlenstofffixierung aus der Atmosphäre sinkt und somit
weniger Energie für höhere trophische Ebenen zur Verfügung steht. Im Kapitel 2 stelle ich
dar, wie sich diese geringere Pflanzenbiomasse im Hinblick auf das Individuum einer
Pflanzengesellschaft manifestiert. Meiner Hypothese zufolge sind einzelne Pflanzen in
artenreichen Gesellschaften grösser, da ihre Nachbarn seltener der gleichen Art angehören,
und bedingen somit den Produktivitätszuwachs der Pflanzengemeinschaft. Im Gegensatz
zu diesem positiven Zusammenhang zwischen Artenzahl und Produktivität einer
Pflanzengemeinschaft, variieren die Auswirkungen der Artenzahl auf die Individuen von
vier ausgewählten Arten sehr. Zunehmende Artenvielfalt hatte positive Auswirkungen auf
die Biomasse der Individuen von Dactylis glomerata, keine Auswirkungen auf die
Biomasse von Phleum pratense-Individuen, sowie negative Auswirkungen auf die
Biomasseproduktion von Trifolium pratense-Individuen. Diese Ergebnisse stimmen gut
mit den Auswirkungen der Artenzahl auf die Biomasseproduktion auf Populationsebene
für dies Testarten überein. Die Sterberate von D. glomerata-Individuen und T. prantense-
Individuen nahm mit zunehmender Artenzahl ab und führte zu einer hohen Dichte pro
gesäte Samen von D. glomerata. Dies zeigte, dass der positive Effekt der Artenzahl auf die
Biomasse der gesamten Population von D. glomerata sowohl auf die Erhöhung der
Individualzahl, als auch auf die grösseren Individuen zurückzuführen war. Die
konkurrenzstarke Art Arrhenaterum elatius hatte negative Auswirkungen auf die Leistung
von Individuen und Populationen anderer Gräser und reduzierte damit den positiven
Diversitätseffekt auf diese Arten. Die Ergebnisse in diesem Kapitel zeigen, dass die
einzelnen Arten recht unterschiedlich auf Veränderungen der Artenzahl reagieren.
Das Verständnis der Faktoren, die die Invasionsfähigkeit einer Pflanzengesellschaft
beeinflussen, ist ein wichtiges Ziel ökologischer Forschung, denn Invasionen fremder
150

Zusammenfassung
Arten können negative Auswirkungen auf die Integrität eines Ökosystems haben. Die
Verwendung von einheimischen Arten als Versuchspflanzen im Invasionsexperiment in
Kapitel 3 und 4 verhindert konfundierende Effekte zwischen Invasion und dem Einfuss
exotischer Arten. Dennoch lässt sich eine zunehmende Invasionsresistenz bei höherer
Pflanzendiversität nachweisen. Dabei hat die Artenzahl einen stärkeren Effekt auf die
Invasionsresistenz als die Anzahl funktioneller Gruppen. Im Allgemeinen verhindern
Gräser das Eindringen fremder Arten in Pflanzegesellschaften. Demgegenüber wirken sich
vorhandene Kräuter neutral und vorhandene Leguminosen positiv auf die Testinvasoren
aus.
Pflanzengemeinschaften mit Arten, die der gleichen funktionellen Gruppe
angehörten wie die fremde Testpflanze, konnten den Eindringling wirksamer unterdrücken.
Darin kommt zum Ausdruck, dass sich überlappende ökologische Nischen der
vorhandenen und der fremden Art die Invasionsresistenz erhöht. Um zu prüfen, ob die
Invasionsresistenz auf ober- und unterirdische Pflanzeninteraktionen zurückzuführen sei,
führte ich ein Experiment durch, in dem ich oberirdische Konkurrenz duch Nachbarn um
die Testpflanzen herum entfernte (Kapitel 4). Die Resultate zeigen, dass unterirdische
Interaktionen wahrscheinlich bedeutender sind als die oberirdischen: Ein Ausschalten
oberirdischer Konkurrenz gegenüber der fremden Testpflanze Knautia arvensis reduzierte
den negativen Einfluss der Artenzahl auf die Biomasse dieser Testpflanze nicht. Das
oberirdische Entfernen der Nachbarn führte bei der Testpflanze zu einer bei
Lichtkonkurrenz typischen morphologischen Reaktion: Die Pflanzen tolerieren eine
oberirdische Konkurrenz mit vermehrtem Längenwachstum bei geringerem Blattgewicht,
eine Strategie der Schattenmeidung, die in der Summe auch zu höherer Gesamtbiomasse
führen kann. Meine Ergebnisse deuten darauf hin, dass die Wurzelkonkurrenz, vor allem
bei Gräsern, in artenreichen Pflanzengemeinschaften ein hohes Potenzial zur
151

Chapter 6
Unterdrückung invasiver Arten erzeugen kann und damit die Invasionsresistenz der
gesamten Pflanzengemeinschaft fördert.
In artenarmen Landwirtschaftssystemen weist vieles darauf hin, dass Leguminosen
sich positiv auf die nicht stickstofffixierende Begleitvegetation auswirken. In Kapitel 5
teste ich mit Hilfe von verpflanzten Testpflanzen („Phytometer“) die Hypothese, dass
Artenvielfalt bei Pflanzen die fördernde Rolle der Leguminosen beeinflusst. Dabei zeigte
sich, dass Pflanzen, die in Kombination mit Leguminosen wuchsen, niedrigere δ15N Werte
(ein Indikator für durch Leguminosen gebundenen Stickstoff) aufwiesen. Die höheren N-
Konzentrationen und der höhere N-Gehalt pro Pflanze deuteten darauf hin, dass die
Pflanzen tatsächlich von dem durch Leguminosen gebunden Stickstoff profitierten.
Darüber hinaus hatte die Artenzahl (und in einem geringeren Masse die Anzahl der
funktionellen Gruppen) einen negativen Einfluss auf die positive Wirkung der Legumiosen
auf andere Pflanzenarten. Der negative Diversitätseffekt auf die positive Wirkung der
Legumionsen hing zum Teil damit zusammen, dass die Anzahl der Leguminosen in den
experimentellen Pflanzengemeinschaften mit steigender Artenzahl abnahm. Auch variierte
dieser positive Effekt der Leguminosen zwischen den vier Phytometer-Arten. Hinweise auf
eine erhöhte N-Aufnahme in Pflanzengemeinschaften mit Leguminosen konnten bei drei
Testpflanzen, die nicht den Leguminosen angehörten, gefunden werden. Dies war
verbunden mit einem Anstieg der Biomasse der Gras-Testarten. Demgegenüber wurde die
den Leguminosen angehörige Testart Trifolium pratense negativ durch die Anwesenheit
anderer Leguminosen in den Pflanzengemeinschaften beeinflusst.
Zusammenfassend hebt diese Doktorarbeit potentielle Konsequenzen einer weiteren
grossflächigen Abnahme der Pflanzenvielfalt hervor. Verluste von Pflanzenarten infolge
von Veränderung, Verlust und Fragmentierung des Lebensraumes, Übernutzung,
Verschmutzung, biologischer Invasion und klimatischer Veränderung nehmen zu. Diese
152

Zusammenfassung
Veränderungen können einzelne Arten unterschiedlich beeinflussen, aber der Gesamteffekt
ist eine Abnahme der Energie, die in das Ökosystem einfliesst (Primärproduktion). Dies
kann Dominoeffekte auf andere Ökosystemeigenschaften haben, so zum Beispiel den
Nährstoffkreislauf, die Stabilität (z.B. Dürre- und Ivasionsresistenz) und die Interaktionen
zwischen den Arten. Es braucht weitere Studien auf dem Niveau der individuellen Pflanze
oder Art, um Muster identifizieren zu können, welche die Vorhersage der Konsequenzen
des Artenverlusts auf bestimmte Arten verbessern. Dies ist auch wichtig für den
Naturschutz, der hauptsächlich auf einzelne gefährdete Arten abzielt.
153

Appendices
Appendices
Appendix 1 The site layout
155

Appendices
Appendix 2 Species list categorised into four functional groups
Grasses Small herbs Tall herbs Legumes Alopecurus pratensis Anthoxanthum odoratum Arrhenatherum elatius Avenula pubescens Bromus erectus Bromus hordeaceus Cynosurus cristatus Dactylis glomerata Festuca pratensis Festuca rubra Holcus lanatus Luzula campestris Phleum pratense Poa pratensis Poa trivialis Trisetum flavescens
Ajuga reptans Bellis perennis Glechoma hederacea Leontodon autumnalis Leontodon hispidus Plantago lanceolata Plantago media Primula veris Prunella vulgaris Ranunculus repens Taraxacum officinale Veronica chamaedrys
Achillea millefolium Anthriscus sylvestris Campanula patula Cardamine pratensis Carum carvi Centaurea jacea Cirsium oleraceum Crepis biennis Daucus carota Galium album Geranium pratense Heracleum sphondylium Knautia arvensis Leucanthemum vulgare Pastinaca sativa Pimpinella major Ranunculus acris Rumex acetosa Sanguisorba officinalis Tragopogon pratensis
Lathyrus pratensis Lotus corniculatus Medicago lupulina Medicago x varia Onobrychis viciifolia Trifolium campestre Trifolium dubium Trifolium fragiferum Trifolium hybridum Trifolium pratense Trifolium repens Vicia cracca
156
Acknowledgements
Acknowledgements
I express my gratitude to many people that contributed to the successful completion of
the work presented in this thesis in one way or another. First, many thanks to Bernhard
Schmid for his continuous mentorship and encouragements; and most of all for giving
me the opportunity to advance my career in ecology. I am very grateful to Wolfgang W.
Weisser for his support and encouragement during my life in Jena. I was glad to be a
member of his research group: thanks to members of the group for those memorable
social and scientific events that I shared with you. I also highly appreciated the
hospitality of people at the Max-Planck Institute for Biogeochemistry and Institute of
Ecology, University of Jena, where I spent most of the time during my stay in Jena.
This work was successful because of dedicated teamwork of PIs, postdocs and my
fellow Ph.D. students with whom I shared ideas in meetings and when working in the
field: many thanks to everyone! Special thanks to Michael and Martin for the ideas
shared during those regular jour fix in Jena, to Vicky for introducing me to δ15N and to
Christoph for close collaboration in transplants experiment. Weeding and collecting
data as a team with Martin, Christiane, Vicky, Alexandru, Holger, Yvonne K., Yvonne
O., Christoph, Stephan, Dominik, Sybille, Jens and Michael were always great
occasions. Many thanks to a devoted team of gardeners and numerous HiWis who
helped maintain the field site in top-notch condition. I owe special credits to Christiana
Fischer, Anja Dassler, Anne Floelich and Beatrice Njoroge (my wife) for their
assistance in the field and laboratory. The work of laboratory assistants, Heike and Ines
of MPI-BGC and Rene of IES (IFU) is also highly appreciated.
157
Acknowledgements
I am grateful to all members of the Institute of Environmental Sciences of the
University of Zurich, Alex, Andrea, Andreas, Andy, Anne, Christine, Chris K., Chris P.,
Cloé, Dennis, Dipti, Dominique, Eva, Fabian T., Fabian W., Felix, Gabor, Giogina,
Gillian, Helmi, Hossein, Isabel, Jana, Jasmin, Jochen, Lilli, Lindsay, Luca, Marc,
Nicolas, Oksana, Petra, René, Sima, Simone, Sophie, Stefie, Susann, Tabea, Thomas,
Yann for cordial occasions I enjoyed with you. Long live SOLA! Special thanks to
Luca, for those spontaneous discussions we held in the office.
Heartfelt thanks to my wife, Wangari wa Njoroge for withstanding my regular absence
and long stays away from home; and for encouragements and moral support when the
going got tough. Many thanks also go to my daughter, Njeri and to my mother, Njeri for
giving me the will to carry on to the end. To all my brothers and sisters nĩwega mũno,
shukran, thanks, tak, danke, mercí for being there for me. Last but not the least I thank
Jenesio Kinyamario of Department of Botany, University of Nairobi, for recommending
me to pursue further studies in plant ecology abroad.
158

Curriculum Vitae
Curriculum Vitae
Name Mwangi Vorname Peter Njoroge Geboren am 21. July 1973 in Mũrang’a, Kenya Ausbildung High School Gaichanjirũ High School, Kenya, 1989-1992 Kenya Certificate of Secondary Education (KCSE) B-
BSc University of Nairobi, Kenya, 1994-1998 Bachelor of Science in Range Management Second class upper MSc Lund University, Sweden, 1999-2000 Master of Science in Theoretical Ecology Dissertation: Effect of temperature on pollen-tube growth rate in Viola tricolor PhD Project: Subproject 10 [Plant Population Processes and Biodiversity Effects] in The Jena Experiment [The Role of Biodiversity for Element Cycling and Trophic Interactions: an Experimental Approach in a Grassland Community] Dissertation: Using Phytometers to Study the Effects of Plant Diversity on Ecosystem Functioning Leitung: Prof. Dr. Bernhard Schmid Gegenwärtige Stellung 07.2000 - 03.2002 Research Assistant, University of Nairobi, Kenya 04.2002 - 03.2005 Research Assistant, University of Jena 04.2005 - 07.2005 PhD fellow Max-Planck Institute for Biogeochemistry 04.2006 - 05.2006 PhD fellow University of Zurich Publikationen Mwangi, P. N. and A. Ely (2001). Assessing risks and benefits: Bt maize in Kenya.
Biotechnology and Development Monitor(48): 6-9. Scherber, C., P. N. Mwangi, et al. (2006). Effects of plant diversity on invertebrate
herbivory in experimental grassland. Oecologia 147(3): 489-500.
159
Top Related