


Languages
Pages
Legal

USARIEM TECHNICAL REPORT T08-07 COMPARISON OF USARIEM HEAT STRAIN DECISION AID TO MOBILE DECISION AID
AND STANDARD ARMY GUIDELINES FOR WARM WEATHER TRAINING
Laurie Blanchard William Santee
Biophysics and Biomedical Modeling Division
June 2008
U.S. Army Research Institute of Environmental Medicine Natick, MA 01760-5007
17.
Unclassified
18.
Unclassified
19.
Unclassified
SPONSORING / MONITORINGAGENCY REPORT NUMBER
10.
7. PERFORMING ORGANIZATION NAME(S) AND ADDRESS(ES)USARIEM
Public report ing burden for this collect ion of information is est imated to average 1 hour per response, including the time for review ing instruct ions, searching exist ing data sources,gathering and maintaining the data needed, and complet ing and review ing the collect ion of information. Send comments regarding this burden estimate or any other aspect of thiscollect ion of information, including suggestions for reducing this burden, to Washington Headquarters Services, Directorate for Information Operat ions and Reports, 1215 JeffersonDavis Highw ay, Suite 1204, Arlington, VA 22202-4302, and to the Off ice of Management and Budget, Paperw ork Reduction Project (0704-0188), Washington, DC 20503.
PERFORMING ORGANIZATIONREPORT NUMBER
REPORT DOCUMENTATION PAGE Form ApprovedOMB No. 0704-0188
SECURITY CLASSIFICATIONOF REPORT
SECURITY CLASSIFICATIONOF THIS PAGE
SECURITY CLASSIFICATIONOF ABSTRACT
8.
1. AGENCY USE ONLY (Leave blank)
4. TITLE AND SUBTITLEComparison of USARIEM Heat Strain Decision Aid, Mobile Heat Stress Monitor, andExisting Army Guidelines for Warm Weather Training
6. AUTHOR(S)Laurie A. Blanchard and William R. Santee
9. SPONSORING / MONITORING AGENCY NAME(S) AND ADDRESS(ES)
11. SUPPLEMENTARY NOTES
12a. DISTRIBUTION / AVAILABILITY STATEMENTApproved for public release; distribution is unlimited.
14. SUBJECT TERMSmilitary training, heat injury, heat illness, decision aid, thermoregulatory model
13. ABSTRACT (Maximum 200 w ords)
Despite the US Army' s comprehensive heat injury prevention program and widespread use and acceptance of guidance basedon the wet bulb globe temperature index (WBGT), there were 5246 reported heat casualties in US Army Soldiers from1980-2002. Of those, 75% occurred during scheduled military training at sites that followed WBGT based doctrine. Thereis a clear need for new methods to reduce the likelihood of heat casualties during military training. This report provides thebasis for the following conclusions:
* Since weather varies in time and space, best guidance will be obtained when model inputs are real-time weathermeasurements in the area of concern rather than estimated values.
* The USARIEM heat strain decision aid (HSDA) is likely to be a more effective tool for reducing the risk of heat injurythan simplifications derived from HSDA such as decision aids which use categorical weather input and the existing WBGTbased Flag guidance (colored flag denotes WBGT heat category and associated heat injury prevention measures).
* Analysis of outcomes over a wide range of conditions should be used to further improve the performance of automatedplanning tools for warm weather training and these tools should be provided to Soldiers and their leaders.
5. FUNDING NUMBERS
20. LIMITATION OF ABSTRACT
UL
15. NUMBER OF PAGES46
16. PRICE CODE
2. REPORT DATEJune 2008
3. REPORT TYPE AND DATES COVEREDTechnical Report
12b. DISTRIBUTION CODE
NSN 7540-01-280-5500 Standard Form 298 (Rev. 2-89)Prescribed by ANSI Std. Z39-18 298-102 USAPPC V1.00

Disclaimer The opinions or assertions contained herein are the private views of the author(s) and are not to be construed as official or as reflecting the views of the Army or the Department of Defense.
Citations of commercial organizations and trade names in this report do not constitute an official Department of the Army endorsement or approval of the products or services of these organizations.

TABLE OF CONTENTS
Section Page List of Figures................................................................................................................v List of Tables................................................................................................................ vi Acknowledgments ....................................................................................................... vii List of Symbols, Abbreviations, and Acronyms Used in This Report .......................... viii
Executive Summary ......................................................................................................1 Introduction ..................................................................................................................2 Methods .......................................................................................................................5 Results and Discussion .................................................................................................9
Conclusions.................................................................................................................17 Recommendations ......................................................................................................18 References..................................................................................................................19 Appendix A: Maximum Work Time Guidance for FT Bliss, TX dataset......... …………22 Appendix B: Maximum Work Time Guidance for Great Inagua Island, Bahamas dataset...…………………….…………………………………………………...……………24 Appendix C: Work Rest Cycle Time Guidance for FT Bliss, TX dataset......................26 Appendix D: Work Rest Cycle Time Guidance for Great Inagua Island, Bahamas dataset ........................................................................................................................28 Appendix E: Differences Between Flag and Automated Decision Tool Maximum Work Time Guidance for FT Bliss, TX dataset......................................................................30 Appendix F: Differences Between Flag and Automated Decision Tool Maximum Work Time Guidance for Great Inagua Island, Bahamas dataset.........................................31
iii

Appendix G: Differences Between Flag and Automated Decision Tool Work Rest Cycle Time Guidance for FT Bliss, TX dataset......................................................................32 Appendix H: Differences Between Flag and Automated Decision Tool Work Rest Cycle Time Guidance for Great Inagua Island, Bahamas dataset.........................................33 Appendix I: Differences in Work Time as Function of Relative Humidity, Wind Speed, and Solar Load............................................................................................................34
iv

LIST OF FIGURES Figure Page
1a FT Bliss, TX Weather 0725h – 1336h 17 August 1991 6 1b Great Inagua Island, Bahamas Weather 0845 7 May – 0800 24 May 1998 6 2a Maximum Work Time and Work Rest Cycle Guidance for Light Work 10 2b Maximum Work Time and Work Rest Cycle Guidance for Moderate Work 11 2c Maximum Work Time and Work Rest Cycle Guidance for Heavy Work 11 3 Maximum Work Time Guidance for Heavy Work for FT Bliss, TX Dataset 12 4 Work Rest Cycle Guidance for Heavy Work for FT Bliss, TX Dataset 12 5a Comparison of Measured and Calculated Black Globe Temperature for FT
Bliss, TX Dataset 13
5b Comparison of Measured and Calculated Black Globe Temperature for Great Inagua Island, Bahamas Dataset
13
6 Comparison of Measured and Calculated Wet Bulb Temperature for FT Bliss, TX Dataset
13
7 Comparison of Measured and Calculated Wet Bulb Globe Temperature Index for FT Bliss, TX Dataset
14
8a Comparison of FT Bliss, TX Dataset Wet Bulb Globe Temperature Index Calculated by Heat Strain Decision Aid and Mobile Heat Stress Monitor
14
8b Comparison of Great Inagua Island, Bahamas Dataset Wet Bulb Globe Temperature Index Calculated by Heat Strain Decision Aid and Mobile Heat Stress Monitor
14
9 Average and Station Wet Bulb Globe Temperature Index for FT Bliss, TX Dataset
15
A-1 Maximum Work Time Guidance for FT Bliss, TX Dataset 22 B-1 Maximum Work Time Guidance for Great Inagua Island, Bahamas
Dataset 24
C-1 Work Rest Cycle Time Guidance for FT Bliss, TX Dataset 26 D-1 Work Rest Cycle Time Guidance for Great Inagua Island, Bahamas
Dataset 28
E-1 Differences in Maximum Work Time Guidance for FT Bliss, TX Dataset 30 F-1 Differences in Maximum Work Time Guidance for Great Inagua Island,
Bahamas Dataset 31
G-1 Differences in Work Rest Cycle Time Guidance for FT Bliss, TX Dataset 32 H-1 Differences in Work Rest Cycle Time Guidance for Great Inagua Island,
Bahamas Dataset 33
I-1 Predicted Maximum Heavy Work Time During the Day and at Night 34
v

vi
Figure Page
I-2 Predicted Work Rest Cycle Time for Moderate Work During the Day and at Night
35
I-3 Maximum Moderate Work Time Guidance as a Function of Wind Speed for FT Bliss, TX Dataset
36
I-4 Maximum Moderate and Heavy Work Time Guidance as a Function of Relative Humidity for FT Bliss, TX Dataset
37
LIST OF TABLES Table
Page
1 Current Wet Bulb Globe Temperature Index Based Flag Doctrine for Maximum Continuous Work Time During Warm Weather Training 2
2 Current Wet Bulb Globe Temperature Index Based Flag Doctrine for Work Rest Cycle Time during Warm Weather Training 3
3 Decision Aid Inputs and Outputs for Warm Weather Training 4 4 Weather Sensors 5 5 Comparison of Weather Data Sets 7 6 Constant Inputs to Automated Decision Tools 7 7 Conversion of Relative Humidity to Descriptive Category 8 8 Conversion of Wind Speed to Descriptive Category 8 9 Conversion of Global Radiation to Descriptive Category 8
10a Differences between Flag Doctrine and Automated Decision Tool Output for FT Bliss, TX Dataset 9
10b Differences between Flag Doctrine and Automated Decision Tool Output for Great Inagua Island, Bahamas Dataset 10
11 Variance of Weather Parameters within Wet Bulb Globe Temperature Index Heat Categories 16
12 Example of Slight Ambient Shift in Great Inagua Island, Bahamas Weather Producing Large Change in Wet Bulb Globe Temperature Index predicted by Mobile Heat Stress Monitor
16

ACKNOWLEDGMENTS
The authors would like to thank several individuals for their contributions to this technical report. David Sauter, our collaborator from the US Army Research Laboratory (ARL) Battlefield Environment Division, provided meteorological expertise and implemented weather and heat stress algorithms on handheld PDAs. William Tharion collected the Great Inagua Island Bahamas weather data and William Matthew assisted with the El Paso, TX, weather data collection. Dan Cadarette provided assistance composing the graphs. We also appreciate insight and editorial assistance from Reed Hoyt and Margaret Kolka.
vii
LIST OF SYMBOLS, ABBREVIATIONS AND ACRONYMS USED IN THIS REPORT ADT automated decision tool alt_m altitude above sea level in meters clo unit of clothing insulation Flag WBGT-based guidance used by the US military for heat injury
prevention (colored flag denotes heat category) FTB Fort Bliss, El Paso, Texas GIIB Great Inagua Island, Bahamas GUI graphical user interface hcg convective heat transfer coefficient for black globe hrg radiative heat transfer coefficient for black globe HC WBGT heat category HSDA USARIEM’s heat strain decision aid HWBDU hot weather battle dress uniform iclo static vapor permeability index MXWRK maximum work time MoHSM mobile heat stress monitor MOPP Mission Oriented Protective Posture, where MOPP4 is highest level of
protection from NBC threats http://en.wikipedia.org/wiki/MOPP NBC nuclear biological chemical Pb barometric pressure PC personal computer PDA handheld personal digital assistant Rg global radiation RH relative humidity Tbg black globe temperature Tc core body temperature Tdb dry bulb temperature Tdp dew point temperature Tmr mean radiant temperature Twb naturally aspirated wet bulb temperature TAIHOD Total Army Injury and Health Outcomes Database
http://www.usariem.army.mil/uniqfac/taihod/home.html TB MED 507 US Army Medical Technical Bulletin for Heat Stress Control and Heat
Casualty Management http://www.usariem.army.mil/download/tbmed507.pdf
USARIEM US Army Research Institute of Environmental Medicine http://www.usariem.army.mil/
WBGT wet bulb globe temperature index
viii

WRC work rest cycle time expressed in min/h WS wind speed γc correction to clothing insulation based on wind speed γi correction to clothing evaporative resistance based on wind speed σ Stefan Boltzmann constant
ix

x
EXECUTIVE SUMMARY
Data from laboratory and field studies carried out over the last 30 years by the US Army Research Institute of Environmental Medicine (USARIEM) and collaborators were used to develop a set of predictive equations for Soldiers performing physical work in a wide range of environmental conditions while wearing various military uniforms. These predictive equations were incorporated into software which can be run on Windows based PCs. The resulting automated decision tool (ADT) is called the USARIEM Heat Strain Decision Aid (HSDA).
A variant of HSDA which can be run on a person digital assistant (PDA) is called the Mobile Heat Stress Monitor (MoHSM). This version uses estimated weather inputs instead of discrete numeric values. For instance instead of entering the relative humidity as an input, users choose from menu choices such as dry or moist. Similar categorical input menus are used to estimate solar radiation and wind speed. Improvements in the availability of measured weather for model inputs will improve model predictions.
Current US military guidance for prevention of heat injury requires display of a colored flag corresponding to the Wet Bulb Globe Temperature Index (WBGT) at US military training installations to indicate the level of risk for heat injury. HSDA was used to develop guidance for safe duration of a single bout of continuous work and optimal work rest cycles for prolonged physical activity for each flag color.
Both the WBGT-based guidance and MoHSM were developed from, and are simplifications of, HSDA recommendations. Performance of the empirically derived HSDA predictive model has been validated for Soldiers working in hot environments. However, to date, the ADTs have not been systematically compared to the guidance given by current WBGT-based Flag doctrine (Flag). In this report, maximum continuous work times and optimal work rest cycle times predicted by HSDA are compared with guidance from its derivatives, MoHSM and Flag.
Despite the US Army’s comprehensive heat injury prevention program and widespread use and acceptance of Flag guidance, there were 5246 reported heat casualties in US Army Soldiers from 1980-2002. Of those, 75% occurred during scheduled military training at sites that followed WBGT based doctrine. There is a clear need for new methods to reduce the likelihood of heat casualties during military training. This report provides the basis for the following conclusions:
• Since weather varies in time and space, best guidance will be obtained when model inputs are real-time weather measurements in the area of concern rather than estimated values.
• HSDA is an effective tool for reducing the risk of heat injury and should be made available to Soldiers and their leaders.
• Analysis of these outcomes over a wide range of conditions should be used to further improve the performance of automated planning tools for warm weather training.
1

INTRODUCTION
Prevention of heat casualties is an important concern during US military training. Historically, heat casualties have resulted in significant morbidity, mortality, and use of health care resources. Though heat casualties continue to affect modern military forces, incidence can be reduced through greater awareness and mitigation of risk, particularly in training environments. Scheduling harder tasks during more favorable weather conditions, following appropriate work rest cycles, providing shade, and ensuring adequate hydration will allow training to continue while minimizing the risk of sustaining heat casualties.
The wet bulb globe temperature index (WBGT) for outdoor environments was first used in heat injury prevention guidelines by the US military almost 50 years ago. This index was developed in response to high rates of heat casualties during basic training at Marine Corps Recruit Depot Parris Island (MCRD-PI) in South Carolina (14, 26). WBGT is an index of the environmental contribution to heat stress which incorporates air temperature, radiant load, humidity, and wind speed. Use of WBGT immediately and dramatically reduced the incidence of severe heat casualties at US military training centers (6, 10, 14, 26). The WBGT-based guidelines have subsequently been adjusted and expanded to minimize the occurrence of heat casualties among military personnel in all branches of service, workers in occupational environments, and athletes (9, 15, 22, 23).
The Army’s current doctrine for warm weather training can be found in the US Army
Medical Technical Bulletin 507 / US Air Force Pamphlet 48-152 (I) entitled “Heat Stress Control and Heat Casualty Management,” (TB MED 507) (22). All US Army programs use TB MED 507 as the main guiding reference for heat stress control, heat injury prevention, and casualty management. The aspects of heat injury prevention covered in TB MED 507 include physiological responses to heat, casualty care, prevention guidelines, and hot weather deployment tips. The controls found within TB MED 507 are based on the WBGT and are categorized by WBGT heat category (HC) and flag color. To determine work limits and optimal work rest cycles for these controls, USARIEM ran HSDA hundreds of times to predict limits for various environmental combinations within each WBGT HC resulting in simplifications of the actual HSDA predictions. This WBGT Flag guidance, with temperatures converted to °C, is summarized in Tables 1 and 2.
Table 1. Current WBGT Based Flag Doctrine for Maximum Continuous Work Time
During Warm Weather Training. Maximum Work Times are Expressed in Minutes with an Upper Limit of 240 Minutes of Continuous Work.
Heat
Category Flag Color WBGT (°C) Easy (250 W)
Work (min) Moderate (425 W)
Work (min) Hard (600 W)
Work (min) 1 no flag 25.6 - 27.7 240 240 70 2 green 27.8 - 29.4 240 150 65 3 yellow 29.4 - 31.1 240 100 55 4 red 31.1 - 32.2 240 80 50 5 black > 32.2 180 70 45
2

Table 2. Current WBGT Based Flag Doctrine for Work/Rest Cycle Time During Warm Weather Training. Work/Rest Cycles are Expressed in Minutes per Hour.
Heat
Category Flag Color WBGT (°C) Easy (250 W)
Work (min/h) Moderate (425 W)
Work (min/h) Hard (600 W) Work (min/h)
1 no flag 25.6 - 27.7 60 60 40 2 green 27.8 - 29.4 60 50 30 3 yellow 29.4 - 31.1 60 40 30 4 red 31.1- 32.2 60 30 20 5 black >32.2 50 20 10
Despite the widespread use and acceptance of this comprehensive heat injury
prevention program, there continue to be heat casualties during military training. Carter et al. (5) reported on all US Army heat-related illnesses and deaths that occurred between 1980 and 2002. These data were documented in the Total Army Injury Health Outcomes Database (TAIHOD) (3). From 1980-2002, 5246 Soldiers were hospitalized and 37 Soldiers died as a consequence of heat illness. Heat injuries were more prevalent early in a Soldier’s career, with 44% of cases occurring during the first 12 months of military service. A majority of cases (84%) occurred while on duty. Scheduled training was the most common activity preceding heat injury. In fact, 3188 cases of heat illness (75% of cases during this study period) occurred during scheduled training at sites that follow WBGT doctrine. The comprehensive review of heat casualties provided by Carter et al. (5) showed that despite decreasing rates of hospitalization due to heat illness, the incidence of heat stroke has increased. The authors point out that some military personnel receive undocumented treatment for heat illness in the field and, of those who receive outpatient care, not all are hospitalized. Therefore, even this comprehensive study does not include the full impact of exertional heat illness in the Army.
The US Army Research Institute of Environmental Medicine (USARIEM) has spent
years developing and improving biophysical models to predict human thermal responses. The thermoregulatory models studied here are versions of USARIEM’s Heat Strain Decision Aid (HSDA), which has documented validity and reliability for simulating Soldier performance (4, 7, 16). It has evolved from a mainframe set up to a calculator version to spreadsheet format (16) and is now an executable file (.EXE) that can run on any PC (11). Tables found in TB MED 507 for WBGT-based Flag doctrine were developed using HSDA simulations. This report compares current US Army WBGT-based warm weather training guidance, with that provided by the output from automated decision tools (ADTs) for the same conditions.
A variation of the HSDA has been adapted for use on a handheld personal digital assistant (PDA) (13). This mobile heat stress monitor (MoHSM) is considered developmental and is not available for purchase. MoHSM uses the latest HSDA biophysical algorithms (version HSDA2004C) with modifications in the user interface to allow for solar load calculation by an alternate method. HSDA, MoHSM and Flag guidance all require users to input dry bulb temperature (Tdb) and other measured or estimated variables. MoHSM requires user input of location, time and date, weather, work rate, and clothing prior to making calculations. Unlike the PC version of the decision tool (HSDA), which requires
3

numerical inputs for weather parameters, work rate, and clothing heat transfer properties, the portable handheld MoHSM platforms use more limited, categorical data input. HSDA and MoHSM allow input of different uniform configurations for simulation. HSDA clothing choices are only limited by the availability of quantitative data of the clothing insulation properties. MoHSM currently allows clothing selection from several uniform choices. Flag guidance assumes that Soldiers are wearing hot weather battle dress uniform (HWBDU) and suggests adjustments to WBGT index for moderate and hard work if wearing NBC clothing (mission-oriented protective posture [MOPP 4]). Furthermore, default standard values for height, weight, acclimation, and dehydration status are used in calculations instead of Soldier-specific data. These simplifications allow general predictions for a group of typical Soldiers, with minimal data entry. Many standard HSDA outputs, such as calculated weather values and recovery times in the shade, are suppressed in MoHSM for simplicity and visual clarity. Differences between HSDA, MoHSM, and WBGT-based Flag guidance are shown in Table 3.
Table 3. Decision Aid Inputs and Outputs for Warm Weather Training.
Inputs HSDA MoHSM Flag dry bulb temperature (Tdb)
ambient environment
mean radiant temperature (Tmr) elevation (alt_m) wind speed (WS) relative humidity (RH)
latitude, longitude, date, time, estimated cloud cover category estimated WS category estimated RH category
black globe temperature (Tbg) wet bulb temperature (Twb)
temperature limits
core body temperature (Tc) limits for total work and work rest cycles are entered
standard Tc limits (for very light casualties) are assumed
Tc not considered
work rate in Watts resting, very light, light, moderate, or heavy
light, moderate, or heavy
clothing properties clo, iclo, γc, γi
choose uniform from menu
HWBDU is assumed uniform; if wearing body armor in humid climate, add 5°F to WBGT; if in MOPP4, add 10°F to WBGT for light work, or add 20°F to WBGT for moderate and hard work
Soldier characteristics
height (ht), weight (wt), acclimation days, dehydration
default values assumed heat acclimated (14 days), average size
default values assumed heat acclimated (14 days), average size
Outputs HSDA MOHSM Flag maximum one-time exposure, sustainable work rest cycle time work times recovery time
casualties probability if suggested work limits are not followed water guidance
for continuous and intermittent work for continuous work
for continuous work and work/rest cycles
calculated WBGT measured WBGT weather Tbg, Twb, Tdp, Pb
4

All maximum work times (MXWRK) and rehydration requirements are based on the
assumption that the trainees performing these continuous effort tasks have not experienced heat stress or been dehydrated prior to this activity and will have several hours of rest afterwards. TB MED 507 further states that rest means minimal physical activity (sitting or standing) in the shade, if possible. HSDA predicts differences in water requirements and recovery times if shade is not available during rest periods. Work/rest cycle times (WRC [min/h]) and fluid replacement volumes (canteens/h) are predicted to sustain performance and hydration for 4 or 5 h of work in the specified HC for Flag and the ADTs, respectively. The goal of this analysis was to compare heat injury prevention guidance from HSDA with guidance obtained from simplifications derived from HSDA including the existing WBGT based Flag guidance and MoHSM which currently uses categorical weather input.
METHODS
Two previously collected weather datasets (19, 21) were used to compare current doctrine with HSDA and MoHSM guidance for maximum continuous work times and optimum work rest cycles. The first was collected at FT Bliss in El Paso, TX, (FTB) and the second at Great Inagua Island, Bahamas (GIIB). Professional grade meteorological instrumentation used to collect weather data (18) at fixed sites for both data sets. The instrumentation is described in Table 4.
Table 4. Weather Sensors. Fort Bliss, TX Great Inagua Island, Bahamas
Tdb shielded type T thermocouples suspended at heights of 2 m, 1.5 m, 1 m, 0.5 m and Metrosonics HS371 at 1.3 m
Vaisala HMP35 radiation shield mounted at 1.5 m
Tground thermistor 5 cm under ground surface and type T thermocouples taped to ground with silver colored duct tape
thermistor 2 cm under ground surface
Tbg Vernon 6” black globe suspended at 1.2m
thermistor inside 15 cm black globe mounted 1.5 m above ground
Twb Metrosonics HS371 not measured
Radiation pyranometers and Fritschen net radiometers
Campbell Scientific LI200X pyranometer mounted 1.5 m above ground and unshaded by weather instruments or surrounding vegetation
WS R.M. Young 03001-5 three cup anemometer 1.5 m, 2 m above ground
R.M. Young 03001-5 three cup anemometer 2 m above ground
RH Vaisala HMP36 Vaisala HMP35 radiation shield mounted at 1.5m
Pb Weathertronics M7105-A not measured WBGT Metrosonics HS371 not measured Measurement Frequency 1/min 4/h
Data Acquisition and Storage
Campbell CR7 and 21X Measurement and Control Modules
Campbell CR10 Measurement and Control Module
5

Figures 1a and 1b show how weather parameters varied during data collection at FTB and GIIB, respectively.
Figure 1a. FTB Weather 0725h - 1336h 17 August 1991
0
20
40
Time of Day
Tem
pera
ture
(°C
)
Win
d S
peed
(m/s
)
Tbg
Tdb
WBGT
Twb
ws
5
0800 0900 1000 1100 1200 1300 1400
Figure 1b. GIIB Weather 0845h 7 May - 0800h 24 May 1998
0
10
20
30
40
50
Time of Day
Tem
pera
ture
(°C
)
Win
d Sp
eed
(m/s
)
TbgTdbWBGTTwbnws
5
1200 7 May 1200 11 May 1200 15 May 1200 19 May 1200 23 May
There was a wider range of WBGT and more data points for GIIB than FTB. Some properties of the datasets are listed in Table 5.
6

Table 5. Comparison of Weather Data Sets.
FTB GIIB WBGT (°C) 20.0 – 29.7 16.9 – 31.2 Tdb (°C) 22.9 – 34.5 19.2 - 31.9 Tbg (°C) 25.3 – 53.3 17.1 - 48.1 Rg (W/m2) 52 – 1124 0 –1050 Wind (m/s) 0.4 – 3.9 0.2 – 5.8 RH (%) 21.8 – 58.8 36.9 - 94.3 Date/Time 17 August 0725h – 1336h 7 May 0845h – 24 May 0800h Frequency 1/min 4/h Twb (°C) 17.6 – 23.2 not measured elevation (m) 1206 20
These weather data sets were supplemented with variables required for input into the
decision aids. HSDA and MoHSM inputs that were kept constant are listed in Table 6.
Table 6. Constant Inputs to Automated Decision Tools.
HSDA MoHSM Acclimation (days) >12 >12 Dehydration (%) -1.24 -1.24 Height (cm) 176.5 180.0 Weight (kg) 81.3 80.0 Maximum Tc (°C) 39.0 39.0 Maximum work rest cycle Tc (°C) 38.5 38.5 Uniform HWBDU HWBDU Work (W) 250, 425, 600 250, 425, 600
To maintain consistency and be representative of a training environment, all simulations of Soldiers assumed full heat acclimation and slight dehydration. For HSDA, typical heights and weights from a recent study of 2778 active duty Soldiers were used (2). Previously accepted standard values for height and weight are hard coded defaults in MoHSM software. The one-time maximum Tc and cycle maximum Tc chosen were historically used typical values (11) for simulation which would result in very light casualties. HSDA allows entry of clothing properties for any uniform configuration. For this investigation the Hot Weather Battle Dress Uniform (HWBDU) was selected for simulations at three standard work rates: light (250 W), moderate (425 W), and heavy (600 W). All of the environmental data were input into HSDA and MoHSM versions of the automated decision aid so outputs could be compared to the current WBGT Flag doctrine for warm weather training found in TB MED 507. As noted, the PC and PDA-based decision aids require slightly different weather input data. For instance, the HSDA requires relative humidity (RH) and wind speed (WS) values, while MoHSM currently requires the user to enter descriptive terms such as dry and calm. This simplification eliminates the necessity of measuring RH and WS in the field. However, for this analysis, the actual measured values were converted to categories
7
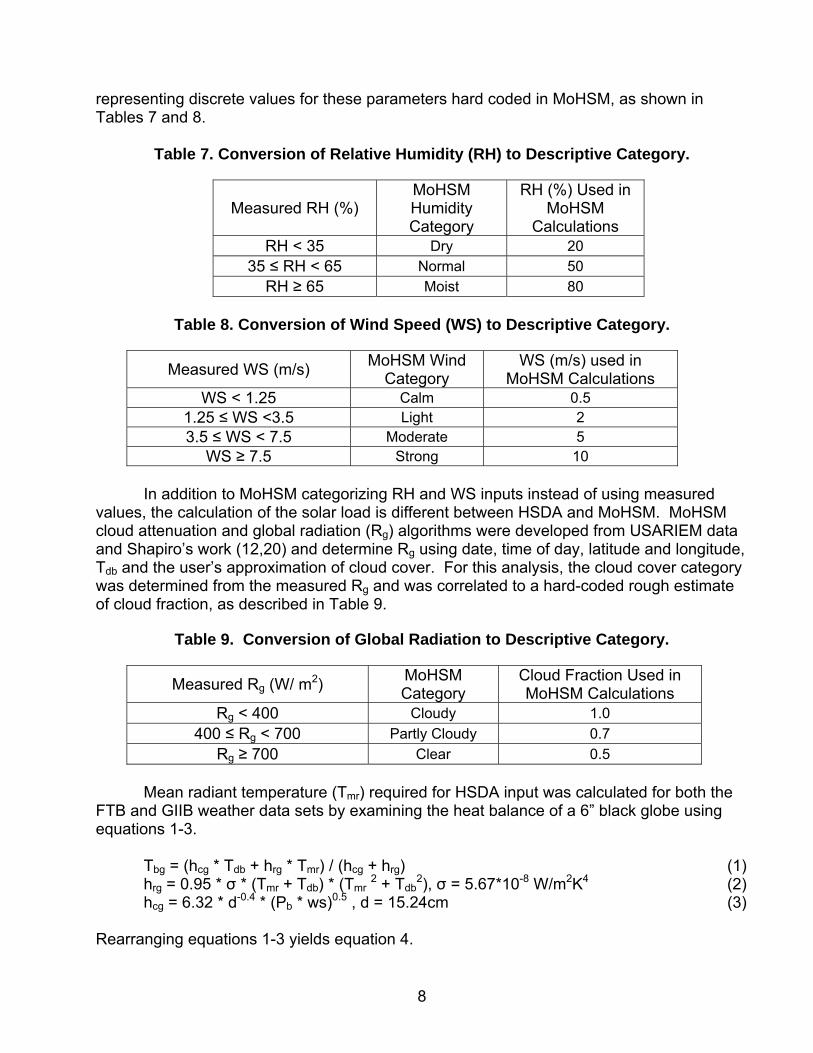
representing discrete values for these parameters hard coded in MoHSM, as shown in Tables 7 and 8.
Table 7. Conversion of Relative Humidity (RH) to Descriptive Category.
Measured RH (%) MoHSM Humidity Category
RH (%) Used in MoHSM
Calculations RH < 35 Dry 20
35 ≤ RH < 65 Normal 50 RH ≥ 65 Moist 80
Table 8. Conversion of Wind Speed (WS) to Descriptive Category.
Measured WS (m/s) MoHSM Wind Category
WS (m/s) used in MoHSM Calculations
WS < 1.25 Calm 0.5 1.25 ≤ WS <3.5 Light 2 3.5 ≤ WS < 7.5 Moderate 5
WS ≥ 7.5 Strong 10
In addition to MoHSM categorizing RH and WS inputs instead of using measured values, the calculation of the solar load is different between HSDA and MoHSM. MoHSM cloud attenuation and global radiation (Rg) algorithms were developed from USARIEM data and Shapiro’s work (12,20) and determine Rg using date, time of day, latitude and longitude, Tdb and the user’s approximation of cloud cover. For this analysis, the cloud cover category was determined from the measured Rg and was correlated to a hard-coded rough estimate of cloud fraction, as described in Table 9.
Table 9. Conversion of Global Radiation to Descriptive Category.
Measured Rg (W/ m2) MoHSM Category
Cloud Fraction Used in MoHSM Calculations
Rg < 400 Cloudy 1.0 400 ≤ Rg < 700 Partly Cloudy 0.7
Rg ≥ 700 Clear 0.5 Mean radiant temperature (Tmr) required for HSDA input was calculated for both the
FTB and GIIB weather data sets by examining the heat balance of a 6” black globe using equations 1-3.
Tbg = (hcg * Tdb + hrg * Tmr) / (hcg + hrg) (1) hrg = 0.95 * σ * (Tmr + Tdb) * (Tmr 2 + Tdb
2), σ = 5.67*10-8 W/m2K4 (2) hcg = 6.32 * d-0.4 * (Pb * ws)0.5 , d = 15.24cm (3)
Rearranging equations 1-3 yields equation 4.
8

((hcg*(Tdb -Tbg)) / σ) – ( Tdb
3 * Tbg )) * Tmr4 + (Tdb
3 - Tdb 2 * Tbg) * Tmr
3 ( + (Tdb
2 - Tdb * Tbg) * Tmr2 + (Tdb - Tbg) * Tmr +1 = 0 (4)
A visual engineering environment program (Agilent VEE Pro 7.0 Graphical Programming Environment. Palo Alto, CA: Agilent Technologies Inc., 2004) running MATLAB (Natick, MA: The MathWorks, Inc.) scripts was used to calculate the roots of this fourth order equation. The real values of Tmr were used for HSDA input.
WBGT was calculated directly from FTB data using equation 5.
WBGT = 0.7 * Twb + 0.2 * Tbg + 0.1 * Tdb (5)
Twb was not collected as part of the GIIB weather data set. Therefore, for comparisons of GIIB WBGT values, the Twb value substituted into the WBGT equation was calculated by solving the heat balance equation with secant iterative method (1), as used in HSDA source code.
The elevation above sea level in meters (alt_m) is an additional input to HSDA that is
used to correct for the effects of altitude on heat transfer. Elevation was converted to an approximation of barometric pressure (Pb) using equation 6 (11).
Pb = (1.0 – 2.5577 * 105 * alt_m)5.2559 (6)
RESULTS AND DISCUSSION
We found many differences between maximum work time (MXWRK) and optimum work/rest cycle time (WRC) predicted by HSDA, MoHSM, and the WBGT Flag guidance for the data collected at FTB and GIIB. The variation in predicted work times for simulations are summarized below in Tables 10a and 10b. These differences are shown graphically in Figures E-1 – H-1 in Appendices E-H.
Table 10a. Differences between Flag Doctrine and Automated Decision Tool Output for FTB.
Maximum Work Time (min) Work/Rest Cycle Time (min)
Δ Flag-HSDA Δ Flag-MoHSM Δ Flag-HSDA Δ Flag-MoHSM Work Rate (W) mean±SD min max mean±SD min max mean±SD min max mean±S
D min max
250 -60 ± 0* -60* -60* -60 ± 0* -60* -60* 0±0 0 0 0±0 0 0
425 -72 ± 38 -200 85 -56 ± 59 -200 111 0 ± 6 -20 30 3 ± 12 -20 36
600 77 ± 77 -17 163 74 ± 78 -25 170 20 ± 9 2 34 20 ± 10 0 41
* Maximum Work Time = 4 h for WBGT guidance, Maximum Work Time = 5 h for MoHSM
9

Table 10b. Differences between Flag Doctrine and Automated Decision Tool Output for GIIB.
Maximum Work Time (min) Work/Rest Cycle Time (min)
Δ Flag-HSDA Δ Flag-MoHSM Δ Flag-HSDA Δ Flag-MoHSM Work Rate (W) mean±SD min max mean±SD min max mean±SD min max mean±
SD min max
250 -60 ± 3* 120* -60* -60 ± 3* 120* -3 0 ± 1 -10 50 0 ± 0 -10 0
425 -52 ± 61 -230 144 -55 ± 37 -200 144 2 ± 7 -20 37 2 ± 10 -40 43
600 85 ± 73 -51 182 87 ± 74 -30 178 20 ± 9 -9 42 20 ± 10 -18 47
* Maximum Work Time = 4 h for WBGT guidance, Maximum Work Time = 5 h for MoHSM
Since Flag guidance is not provided for environmental conditions below HC1 (work is not limited by weather below this threshold), 60 min/h work rest cycles and maximum continuous work times were assumed for WBGT < 25.6°C. Since Flag guidance refers to 4 hour time periods, but ADTs calculate MXWRK and WRC for up to 5 hours, when both methods determine “no limit” to working time, HSDA and MoHSM are predicting that Soldiers could perform 60 min longer than Flag guidance is predicting.
Figures 2a, 2b, and 2c show MXWRK and WRC versus WBGT for light, moderate, and heavy work for combined weather data from FTB and GIIB. Figures A-1 – D-1 in Appendices A-D show MXWRK and WRC versus WBGT and versus time for each work load when these data are separated by test site.
Figure 2a. MXWRK and WRC Guidance for Light Work at FTB and GIIB
0
60
120
180
240
300
15 20 25 30 35
WBGT (°C)
Max
imum
Wor
k Ti
me
(min
)
FlagHSDAMoHSM
0
10
20
30
40
50
60
15 20 25 30 35
WBGT (°C)
Wor
k R
est C
ycle
Tim
e (m
in/h
)
FlagHSDAMoHSM
outlying points resulting from estimated weather inputs
With the exception of the outlying predictions by MoHSM which are circled in the above figures, all three decision tools used in this evaluation (Flag, HSDA, MoHSM) suggest that light work can be performed continuously with minimal risk of heat casualties in the environments observed at FTB and GIIB as shown in Figure 2a. Since Flag guidance is not provided for environmental conditions below HC1 (WBGT<25.6°C), 60 min/h WRC and
10
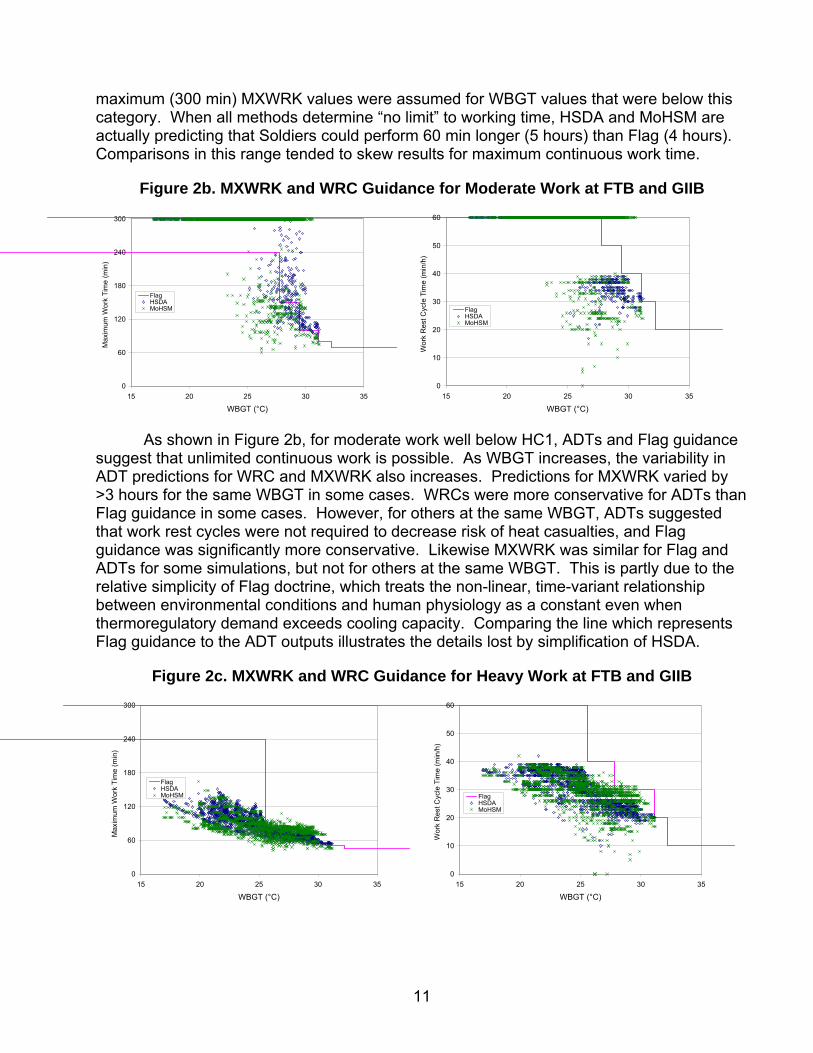
maximum (300 min) MXWRK values were assumed for WBGT values that were below this category. When all methods determine “no limit” to working time, HSDA and MoHSM are actually predicting that Soldiers could perform 60 min longer (5 hours) than Flag (4 hours). Comparisons in this range tended to skew results for maximum continuous work time.
Figure 2b. MXWRK and WRC Guidance for Moderate Work at FTB and GIIB
0
60
120
180
240
300
15 20 25 30 35
WBGT (°C)
Max
imum
Wor
k Ti
me
(min
)
FlagHSDAMoHSM
0
10
20
30
40
50
60
15 20 25 30 35
WBGT (°C)
Wor
k R
est C
ycle
Tim
e (m
in/h
)
FlagHSDAMoHSM
As shown in Figure 2b, for moderate work well below HC1, ADTs and Flag guidance suggest that unlimited continuous work is possible. As WBGT increases, the variability in ADT predictions for WRC and MXWRK also increases. Predictions for MXWRK varied by >3 hours for the same WBGT in some cases. WRCs were more conservative for ADTs than Flag guidance in some cases. However, for others at the same WBGT, ADTs suggested that work rest cycles were not required to decrease risk of heat casualties, and Flag guidance was significantly more conservative. Likewise MXWRK was similar for Flag and ADTs for some simulations, but not for others at the same WBGT. This is partly due to the relative simplicity of Flag doctrine, which treats the non-linear, time-variant relationship between environmental conditions and human physiology as a constant even when thermoregulatory demand exceeds cooling capacity. Comparing the line which represents Flag guidance to the ADT outputs illustrates the details lost by simplification of HSDA.
Figure 2c. MXWRK and WRC Guidance for Heavy Work at FTB and GIIB
0
60
120
180
240
300
15 20 25 30 35
WBGT (°C)
Max
imum
Wor
k Ti
me
(min
)
FlagHSDAMoHSM
0
10
20
30
40
50
60
15 20 25 30 35
WBGT (°C)
Wor
k R
est C
ycle
Tim
e (m
in/h
)
FlagHSDAMoHSM
11

For the simulations of heavy work in the environments seen at FTB and GIIB shown in Figure 2c, MXWRK estimated by both HSDA and MoHSM for given WBGTs ≤ HC1 was far more conservative than MXWRK suggested by Flag guidance. This observation might partially explain accounts of heat casualties that occur during ‘cooler’ times of intensive military training, such as early morning running or marching with loads. For heavy work in HC1-3, MXWRK predicted by ADTs was in better agreement with Flag guidance. MoHSM predictions were more variable than HSDA for both continuous work and work rest cycle times as a result of the categorization of weather inputs. ADTs generally predicted more conservative WRCs than current doctrine for heavy work in these environments.
Figure 3 shows MXWRK predictions for heavy work for the FTB dataset. These data are those from figure 2c with all the data from GIIB removed. The FTB weather varied less than the GIIB weather and this reduced the scatter in the predictions. It is still apparent that the categorical nature of the MoHSM inputs yield outputs which surround the results obtained from precise inputs using HSDA.
Figure 3. MXWRK Guidance for Heavy Work at FTB
0
60
120
180
240
19 22 25 28 31
WBGT (°C)
Max
imum
Wor
k Ti
me
(min
)
FlagHSDAMoHSM
Figure 4 shows WRC predictions for heavy work for the FTB dataset only. For WBGTs up to 5°C below HC1, HSDA and MoHSM suggest limiting work to ~50% duty cycles, i.e. ~30min/h despite Flag guidance that continuous work is possible. For FTB green (HC2) and yellow (HC3) Flag conditions MoHSM WRC times fell in two bands surrounding the HSDA values. Some MoHSM predictions in this range were within minutes of Flag guidance, while others were ~15 min lower.
Figure 4. WRC Guidance for Heavy Work at FTB
0
20
40
60
20 22 24 26 28 30WBGT (°C)
Wor
k R
est C
ycle
Tim
e (m
in/h
)
FlagHSDAMoHSM
12

The ADTs use Tmr, Tdb, and WS to calculate black globe temperature (Tbg) (10). Since Tmr input was calculated from measured Tbg, these calculated Tbg values were closely correlated with Tbg measurements for both FTB (y = 1.0001x -0.0016, R2 = 1.00) and GIIB (y = 0.9981x + 0.049, R2 = 1.00), as shown in Figure 5.
Figure 5a. Comparison of Measured and Figure 5b. Comparison of Measured and Calculated Tbg for FTB Calculated Tbg for GIIB
y = 1.0001x - 0.0016R2 = 1
25
35
45
55
25 35 45 55Measured Tbg (°C)
HS
DA
Cal
cula
ted
Tbg
(°C
)
y = 0.9981x + 0.049R2 = 1
15
30
45
60
15 30 45 60Measured Tbg (°C)
Cal
cula
ted
Tbg
(°C
)
Figure 6 shows the relationship between measured and calculated Twb for FTB. Since Twb was not directly measured at GIIB, calculated Twb values were used for comparisons. This approximation created a source of uncertainty for those analyses.
Figure 6. Comparison of Measured and Calculated Twb for FTB
y = 0.5504x + 6.9412R2 = 0.7745
16
19
22
25
16 19 22 25
Measured Twb (°C)
Cal
cula
ted
Twb
(°C
)
13

Figure 7 shows the relationship between measured and calculated WBGT for FTB.
The step-wise nature of MoHSM input categories contributes to the scatter seen here. While HSDA has a slightly more predictable offset, both predictive models will introduce error in calculating WBGT. This is mainly attributable to error in Twb approximation, as shown in Figure 6.
Figure 7. Comparison of Measured and Calculated WBGT for FTB
y = 0.7364x + 4.0229R2 = 0.4869
y = 0.8456x + 2.355R2 = 0.9845
15
20
25
30
15 20 25 30
Measured WBGT (°C)
Cal
cula
ted
WB
GT
(°C
)
MoHSMHSDA
Figures 8a and 8b show the relationship between WBGTs calculated by HSDA and MoHSM at FTB and GIIB, respectively. Figure 8a. Comparison of FTB WBGT Figure 8b. Comparison of GIIB WBGT Calculated by HSDA and MoHSM Calculated by HSDA and MoHSM
y = 0.8793x + 1.7694R2 = 0.5043
15
20
25
30
15 20 25 30
WBGT (°C) Calculated by HSDA
WB
GT
(°C
) Cal
cula
ted
by M
oHSM y = 0.8218x + 4.2181
R2 = 0.6608
15
25
35
15 25 35
WBGT (°C) Calculated by HSDA
WB
GT
(°C
) Cal
cula
ted
by M
oHSM
14

The WBGT varies temporally as well as spatially. WBGT was measured by three WBGT dataloggers located within a 400 m oval race track which served as the FTB data collection site. Even in this close proximity, weather measurements can be quite variable (Figure 9). It is important that the WBGT used to make decisions about heat stress is representative of the environment where Soldiers are working and training. WBGT measurements taken once per hour, as recommended by current Flag doctrine, may not adequately represent changing WBGT.
Figure 9. Average and Station WBGT for FTB
There are several explanations for observed differences between the ADTs and Flag guidance. TB MED 507 includes instructions on proper measurement of WBGT that suggest that all readings of WBGT be taken at the location representative of the conditions to which the Soldiers are exposed, and that 20 min should elapse from the time the instruments are installed before readings are taken. Besides taking 20 min for equilibration, measurements will be adversely affected by not adhering to recommended sensor placement and wick wetting procedures. Since several large Army training posts measure WBGT in a single location to represent the weather for training areas that are not in close proximity, it seems likely that Flag HC used to calculate risks and training requirements could be different than prevailing ambient conditions at various Soldier training sites.
Another difference between Flag and ADT guidance is the recommendation to update
WBGT hourly when ambient temperature ≥ 23.89°C (75°F). As shown in Figure 1, hourly updates could miss large changes in WBGT. Furthermore, ADTs show the potential for the occurrence of heat casualties at WBGTs well below the Flag threshold of 23.89°C. Furthermore, each WBGT could result from many different combinations of solar load, humidity, wind, and ambient temperature. The wide range of environmental conditions for each HC at sea level, 5% ≤ RH ≤ 95%, and 0.5 ≤ WS ≤ 10 are shown in Table 11.
19
22
25
28
31
7
Heat Category 3
Heat Category 2
Heat Category 1 WBGT (°C)
WBGT1 WBGT2 WBGT3 mean WBGT
8 9 10 11 12 13 14
Time of Day
15

Table 11. Variance of Weather Parameters within WBGT Heat Categories.
Heat Category WBGT (°C) Tdb (°C) Twb (°C) Tbg (°C)
1: no flag 25.6 - 27.7 22 - 46 16.3 - 27.3 27.0 - 52.0 2: green 27.8 - 29.4 25 - 46 18.1 - 28.4 29.0 - 59.4 3: yellow 29.4 - 31.1 26 - 45 19.0 - 30.3 30.0 - 62.7 4: red 31.1 - 32.2 28 - 46 20.3 - 31.3 32.0 - 64.8 5: black >32.2 >29 >24.5 >33.0
As shown in Table 11, for the data sets used in this report, Tdb varied by 21°C, 19°C, and 18°C within green, yellow, and red Flag conditions, respectively. Twb, which makes up 70% of the WBGT, varied by more than 10°C within all HCs. Solar load varied from midday full sun to nighttime darkness. These wide ranging combinations of wind, solar load, humidity, and ambient temperature within each HC show the difficulty of reducing weather to a single index.
Even slight variations in meteorological measurements, or the user’s interpretation of them, can drive inputs to the ADTs from one range to the next which affects WBGT calculation. Table 12 demonstrates how small changes in several ambient conditions between several weather readings taken 15 min apart on May 21 at GIIB resulted in very different calculated WBGTs. The resulting differences in MXWRK and WRC can be seen as outlying points in Figures B-1a, B-1d, D-1a, and D-1d. These slight shifts in ambient inputs resulted in WRC guidance changing from “no limit’ (60 min/h) to “no sustained WRC possible” (0 min/h) for some 15 minute time periods. Figures I-1 – I-4 in Appendix I show more details of the sensitivity of the predictions to solar load, RH, and WS.
Table 12. Example of Slight Shift in GIIB Weather Producing Large Change in MoHSM Predicted WBGT.
Time of
Day
Rg (W/m2)
MoHSMsolar
category
Tdb (°C)
RH (%)
MoHSMhumidity category
WS (m/s)
MoHSM wind
category
Tbg (°C)
HSDAWBGT
(°C)
MoHSMWBGT
(°C) 1045 175.8 Clear 29.2 64.7 normal 1.3 light 34.8 26.8 27.8
1100 152 Clear 28.7 65.3 moist 0.9 calm 33.7 26.2 35.0
1115 182.8 Clear 28.3 71.7 moist 2.3 light 32.7 26.4 30.6
MoHSM input menu categories provide another source of potential error. Ranges of values are lumped together and associated with a specific input for calculations which may or may not be close to the actual value. Even if the values or categories used are adjusted, abrupt discontinuities in MoHSM and Flag output resulting from this step-wise nature of weather input will persist.
TB MED 507 guidance includes a list of factors that increase risk of succumbing to
heat illness. Individual risk factors for Soldiers becoming heat casualties include lack of
16
acclimatization, cumulative exposure to heat, poor physical fitness, overweight, concurrent illness, taking medications/dietary supplements, use of alcohol, prior history of heat injury, skin disorders, and being older than 40. Neither HSDA nor MoHSM currently account for these risk factors, though each could be modified to do so. Cumulative exposure to heat stress has been shown to increase potential for heat injury (6, 22, 23, 25), but this is currently unaccounted for by these ADTs. Higher body mass index (BMI) is also associated with increased risk of becoming a heat casualty, and though Soldier height and weight are factors in ADT algorithms, these may need to be updated when more data become available (6, 24).
Though the ADTs differ in physical size and shape, or form factor, many other differences between PC-based HSDA and PDA-based MoHSM are easily eliminated. With minor modifications the HSDA implementation could be fielded on PDAs and the MoHSM version could be run on PCs. Instances of HSDA are deployed that use real-time weather information via network connection (8) and further studies are planned to better leverage streaming weather data. If analysis of those efforts confirms an additional benefit of using more specific weather values when available, MoHSM menu choices or weather input via networking should be added to enable this data input. Likewise, a supplemental HSDA graphical user interface (GUI) has been created to allow categorical weather inputs for cases where exact values are unavailable. The cloud attenuation function is based loosely on work done by Shapiro (20), which provides for detailed computations as a function of cloud type, fractional cloud cover, surface albedo, precipitation, and solar altitude. Since the input parameters were simplified to user input of cloud cover (e.g. clear, partly cloudy, cloudy) this methodology provides a crude approximation of the reduction of solar load due to cloud cover. The input GUI could be modified to also prompt the user to enter the type of overcast (e.g. wispy cirrus, low-lying fog) to further refine the attenuation factors and improve the approximation of solar load. A menu option exists for precipitation, though there was no precipitation noted in these data sets. A menu selection for night time should be added for future versions. A menu of typical uniform configurations could be included for cases where clothing insulation and permeability properties are not known by the user. Examples of corresponding activities could be included as part of a larger pop-up context-sensitive help system in future versions of MoHSM, as they have been for the supplemental HSDA GUI. Caveats similar to those in TB MED 507 could also be included. Further studies will show if consulting handheld guidance more frequently reduces incidence of heat casualties. A web based version of HSDA would facilitate code upgrades and could be accessed by cell phone, PDA, or laptop.
CONCLUSIONS
The need to balance heat injury prevention with the Army’s training mission is clear. An ideal decision aid would enable maximum training with minimal heat casualties under all circumstances. In some cases USARIEM models may provide better guidance than current WBGT-based Flag doctrine. Therefore it is important to learn how USARIEM thermoregulatory predictive models would perform as a replacement for, or supplement to, WBGT-based Flag guidance to minimize heat casualty risk and disruptions to training. Ideally, commanders should be able to balance training requirements and force protection by using both weather data and predictive models.
17

This investigation confirmed that even though MoHSM and Flag guidance were derived from HSDA, current WBGT-based Flag doctrine and USARIEM ADT guidance can differ significantly. This is particularly true at lower WBGTs where ADT guidance suggests shorter work times than Flag doctrine. Heat stress guidance provided by these tools (Flag, HSDA, and MoHSM) is better correlated at higher WBGTs and lower workloads for most cases simulated in this analysis. Simulations for the same work rates and environmental conditions resulted in predictions varying as much as 230 min for MXWRK and 50 min/h for WRCs. The ADT predictions were more dependent on solar load than either RH or WS in each heat category for the datasets studied here.
Despite being able to draw some conclusions regarding similarities and differences of Flag doctrine and alternative guidance, more data sets correlated with risk for heat injury are needed. These should include a variety of weather combinations in each Flag HC as well as a varied spectrum of Soldiers and activities. Since this study investigated different guidance but not Soldier training or heat injury outcomes, we don’t know how much benefit would be realized by the use of HSDA vs current Flag doctrine in terms of both heat casualty prevention and positive training outcomes. Since overly conservative guidance unnecessarily limits training, and ineffective or incomplete training could potentially cause more harm than heat illness, an accurate decision aid is highly desired.
For many years, simplifications of HSDA have been the basis of military guidance for prevention of heat injury via WBGT based Flag guidance. Further data analysis over a wide range of conditions will enable model refinement and is necessary to demonstrate that training mission planning guided by ADTs will prevent more heat casualties while allowing more work relative to current guidance. Any new guidance should provide significant improvement over current methods in order to increase acceptability and compliance. The widest possible range of environmental conditions, uniforms, Soldiers, and work rates should be studied, with emphasis on heavy work, as performed by Soldiers in a typical training environment.
RECOMMENDATIONS
Whether WBGT-based Flag doctrine or automated decision tools are used to prevent heat casualties, decisions made using weather that is representative of the work environment will yield the best results. Future studies should further investigate the sensitivity of HSDA predictions to the various environmental components to improve model performance. Analysis of these outcomes could be used to further improve HSDA’s performance and increase acceptance of this proven tool for heat injury prevention.
• Weather varies in time and space – for best guidance, real-time measurements in area of concern should be used.
• Estimating weather inputs leads to artificial step changes in guidance outputs. • Due to individual variability and the wide combination of environments yielding similar
heat category, Flag guidelines may not always be appropriate. • Analysis of outcomes over a wide range of conditions should be used to further
improve the performance of automated planning tools for warm weather training and these tools should be provided to Soldiers and their leaders.
18

REFERENCES
1. Allen, M. B., and E. L. Isaacson. Numerical Analysis for Applied Science. New York: Wiley, 1998.
2. Bathalon, G. P., S. M. McGraw, K. E. Friedl, M. A. Sharp, D. A. Williamson, and A.
J. Young. Rationale and Evidence Supporting Changes to the Army Weight Control Program. Natick, MA: USARIEM. Technical Report T04-08, 2004.
3. Bell N.S., Amoroso P.J., Senier L., Williams J.O., Yore M.M., and Hollander I.E.
The Total Army Injury and Health Outcomes Database (TAIHOD): Uses and Limitations as a Research Tool for Force Health Protection. Natick, MA: USARIEM. Technical Note TN05-01, 2004.
4. Blanchard, L.A., S.N. Cheuvront, and D.A. Goodman. Comparison of Model
Predictions to Core Temperature Responses During Prolonged Intermittent Exercise. In: Proceedings of the 12th International Conference of Environmental Ergonomics, Portoroz, Slovenia, August 19-24, 2007.
5. Carter, R., S. N. Cheuvront, J. O. Williams, M. A. Kolka, L. A. Stephenson, M. N.
Sawka, and P. J. Amoroso. Epidemiology of hospitalizations and deaths from heat illness in soldiers. Med. Sci. Sports Exerc. 37(8): 1338-1344, 2005.
6. Gardner, J. W., and J. A. Kark. Clinical diagnosis, management, and surveillance
of exertional heat illness. In: Textbooks of Military Medicine. Medical Aspects of Harsh Environments, Volume 1. Washington, DC: Office of the Surgeon General, US Army, Textbooks of Military Medicine Publications, 2001, p. 231-279.
7. Gonzalez, R. R., T. M. McLellan, W. R. Withey, S. K. Chang, and K. B. Pandolf.
Heat strain models applicable for protective clothing systems: comparison of core temperature response. J. Appl. Physiol. 83(3): 1017-1032, 1997.
8. Hayes, PM and WJ Simcox. Battlespace Visualization and the Integrated
Meteorological System (IMETS). Military Intelligence Professional Bulletin, Oct-Dec, 2002.
9. International Organization of Standardization. Hot Environments: Estimation on
the Heat Stress of Working Man, Based on the WBGT-Index (Wet Bulb Globe Temperature). Geneva, Switzerland, ISO 7243, 1989.
10. Kark, J. A., P. Q. Burr, C. B. Wenger, E. Gastaldo, and J. W. Gardner. Exertional
heat illness in Marine Corps recruit training. Aviat. Space Environ. Med. 67(4): 354-360, 1996.
11. Matthew, W. T., L. G. Berglund, W. R. Santee, and R. R. Gonzalez. USARIEM
Heat Strain Model: New Algorithms Incorporating Effect of High Terrestrial Altitude. Natick, MA: USARIEM. Technical Report T03-9, 2004.
19

12. Matthew, W. T., W. R. Santee, and L. G. Berglund. Solar Load Inputs for
USARIEM Thermal Strain Models and the Solar Radiation-Sensitive Components of the WBGT Index. Natick, MA: USARIEM. Technical Report T01/13, 2001.
13. Miller, J. M. and K. E. Friedl. Development, Testing and Dissemination of Thermal
Models. Memorandum of Agreement between US Army Research Institute of Environmental Medicine (USARIEM) and US Army Research Laboratory (ARL), 2004.
14. Minard, D. Prevention of heat casualties in Marine Corps Recruits. Mil. Med. 126:
261-272, 1961. 15. NIOSH. Criteria for a Recommended Standard. Occupational Exposure to Hot
Environments. Washington, D.C.: U.S. Government Printing Office, 1986. 16. Pandolf, K. B., L. A. Stroschein, L. L. Drolet, R. R. Gonzalez, and M. N. Sawka.
Prediction modeling of physiological responses and human performance in the heat. Comput. Biol. Med. (6): 319-329, 1986.
17. Reardon, M. J., and R. R. Gonzalez. Applications of predictive strain models. Mil.
Med. 162 (2): 136-140, 1997. 18. Santee, W. R., and R. R. Gonzalez. Characteristics of the thermal environment.
In: Human Performance Physiology and Environmental Medicine at Terrestrial Extremes, edited by K.B. Pandolf, M.N. Sawka, and R.R. Gonzalez. Indianapolis, IN: Benchmark Press, Inc., 1988, pp. 1-44.
19. Santee, W. R., W. T. Matthew, and W. J. Tharion. Simulated Approach Marches
during Thermal Stress: A P2NBC2 Study. Natick, MA: USARIEM. Technical Report T12-92, 1992.
20. Shapiro, R. Solar Radiative Flux Calculations from Standard Surface
Meteorological Observations. Bedford, MA: Hanscom AFB. Technical Report AFGL-TR-82-0039, 1982.
21. Tharion, W. J., C. J. Baker-Fulco, S. McGraw, W. K. Johnson, P. Niro, J. P.
Warber, F. M. Kramer, R. Allen, C. M. Champagne, C. Falco, R. W. Hoyt, J. P. DeLany, and L. L. Lesher. The Effects of 60 Days of Tray Ration Consumption in Marine Combat Engineers While Deployed on Great Inagua Island, Bahamas. Natick, MA: USARIEM. Technical Report T00-16, 2000.
22. U.S. Department of Defense. Heat Stress Control and Heat Casualty
Management. Washington, D.C.: Departments of the Army and Air Force. TB MED 507, AFP 48-152 (I), 2003.
20

23. U.S. Department of Defense. Occupational and Environmental Health: Prevention, Treatment and Control of Heat Injuries. Washington, D.C.: Departments of the Army, Navy and Air Force. TB MED 507, NAVMED P-5052-5, AFP 160-161, 1980.
24. Wallace, R. F. Risk Factors and Mortality in Relation to Heat Illness Severity.
Natick, MA: USARIEM. Technical Report T03-14, 2003. 25. Wallace, R. F., D. Kriebel, L. Punnet, D. H. Wegman, C. B. Wenger, J. W.
Gardner, and R. R. Gonzalez. The effects of continuous hot weather training on risk of exertional heat illness. Med. Sci. Sports Exerc. 37(1): 84-90, 2005.
26. Yaglou, C. P., and D. Minard. Control of heat casualties at military training
centers. AMA. Arch. Indust. Health. 16: 302-316, 1957.
21

APPENDIX A. MXWRK GUIDANCE FOR FTB
Figure A-1a. Maximum Light Work (250W) Guidance for FTB
0
60
120
180
240
300
20 22 24 26 28 30WBGT (°C)
Max
imum
Wor
k Ti
me
(min
)FlagHSDAMoHSM
Figure A-1b. Maximum Moderate Work (425 W) Guidance for FTB
0
60
120
180
240
300
19 22 25 28 31WBGT (°C)
Max
imum
Wor
k Ti
me
(min
)
FlagHSDAMoHSM
Figure A-1c. Maximum Heavy Work (600 W) Guidance for FTB
0
60
120
180
240
19 22 25 28 31WBGT (°C)
Max
imum
Wor
k Ti
me
(min
)
FlagHSDAMoHSM
Figures A-1a, A-1b, and A-1c show MXWRK guidance as a function of WBGT while figures A-1d, A-1e, and A-1f show MXWRK guidance vs time.
22

Figure A-1d. Maximum Light Work (250W) Guidance for FTB
0
60
120
180
240
300
Time of Day
Max
imum
Wor
k Ti
me
(min
)
FlagHSDAMoHSM
0800 0900 1000 1100 1200 1300 1400
Figure A-1e. Maximum Moderate Work (425 W) Guidance for FTB
0
60
120
180
240
300
Time of Day
Max
imum
Wor
k Ti
me
(min
)
FlagHSDAMoHSM
0800 0900 1000 1100 1200 1300 1400
Figure A-1f. Maximum Heavy Work (600 W) Guidance for FTB
0
60
120
180
240
300
Time of Day
Max
imum
Wor
k Ti
me
(min
)
FlagHSDAMoHSM
0800 0900 1000 1100 1200 1300 1400
23

APPENDIX B. MXWRK GUIDANCE FOR GIIB
Figure B-1a. Maximum Light Work (250 W) Guidance for GIIB
0
60
120
180
240
300
15 20 25 30 35
WBGT (°C)
MXW
RK
(min
)FlagHSDAMoHSM
outlying point which resulted from estimated weather parameters
Figure B-1b. Maximum Moderate Work (425 W) Guidance for GIIB
0
60
120
180
240
300
15 20 25 30 35
WBGT (°C)
MXW
RK
(min
)
FlagHSDAMoHSM
Figure B-1c. Maximum Heavy Work (600 W) Guidance for GIIB
0
60
120
180
240
300
15 20 25 30 35
WBGT (°C)
MXW
RK
(min
)
FlagHSDAMoHSM
Figures B-1a, B-1b, and B-1c show MXWRK guidance as a function of WBGT while figures B-1d, B-1e, and B-1f show MXWRK guidance vs time.
24

Figure B-1d. Maximum Light Work (250 W) Guidance for GIIB
0
60
120
180
240
300
Max
imum
Wor
k Ti
me
(min
)
FlagHSDAMoHSM
1200 7 May 1200 11 May 1200 15 May 1200 19 May 1200 23 May
outlying point which resulted from estimated weather parameters
Time of Day Figure B-1e. Maximum Moderate Work (425 W) Guidance for GIIB
0
60
120
180
240
300
Max
imum
Wor
k Ti
me
(min
)
FlagHSDAMoHSM
1200 7 May 1200 11 May 1200 15 May 1200 19 May 1200 23 May Time of Day
Figure B-1f. Maximum Heavy Work (600 W) Guidance for GIIB
0
60
120
180
240
300
Max
imum
Wor
k Ti
me
(min
)
FlagHSDAMoHSM
1200 7 May 1200 11 May 1200 15 May 1200 19 May 1200 23 May Time of Day
25
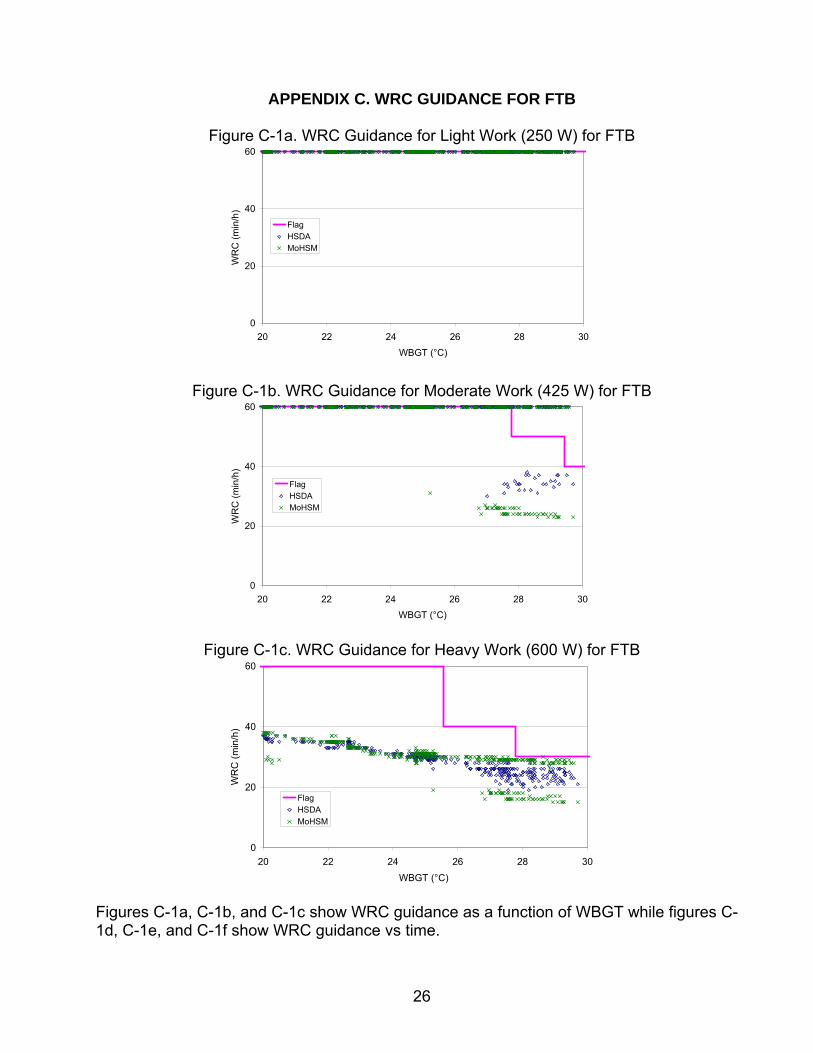
APPENDIX C. WRC GUIDANCE FOR FTB
Figure C-1a. WRC Guidance for Light Work (250 W) for FTB
0
20
40
60
20 22 24 26 28 30
WBGT (°C)
WR
C (m
in/h
)FlagHSDAMoHSM
Figure C-1b. WRC Guidance for Moderate Work (425 W) for FTB
0
20
40
60
20 22 24 26 28 30WBGT (°C)
WR
C (m
in/h
)
FlagHSDAMoHSM
Figure C-1c. WRC Guidance for Heavy Work (600 W) for FTB
0
20
40
60
20 22 24 26 28 30WBGT (°C)
WR
C (m
in/h
)
FlagHSDAMoHSM
Figures C-1a, C-1b, and C-1c show WRC guidance as a function of WBGT while figures C-1d, C-1e, and C-1f show WRC guidance vs time.
26

Figure C-1d. WRC Guidance for Light Work (250 W) for FTB
0
20
40
60
Time of Day
Wor
k R
est C
ycle
Tim
e (m
in/h
)
FlagHSDAMoHSM
0800 0900 1000 1100 1200 1300 1400
Figure C-1e. WRC Guidance for Moderate Work (425 W) for FTB
0
20
40
60
Time of Day
Wor
k R
est C
ycle
Tim
e (m
in/h
)
FlagHSDAMoHSM
0800 0900 1000 1100 1200 1300 1400
Figure C-1f. WRC Guidance for Heavy Work (600 W) for FTB
0
20
40
60
Time of Day
Wor
k R
est C
ycle
Tim
e (m
in/h
)
FlagHSDAMoHSM
0800 0900 1000 1100 1200 1300 1400
27

APPENDIX D. WRC GUIDANCE FOR GIIB
Figure D-1a. WRC Guidance for Light Work (250 W) for GIIB
0
20
40
60
15 20 25 30 35
WBGT (°C)
WR
C (m
in/h
)FlagHSDAMoHSM
outlying point which resulted from estimated weather parameters
Figure D-1b. WRC Guidance for Moderate Work (425 W) for GIIB
0
20
40
60
15 20 25 30 35
WBGT (°C)
WR
C (m
in/h
)
FlagHSDAMoHSM
Figure D-1c. WRC Guidance for Heavy Work (600 W) for GIIB
0
20
40
60
15 20 25 30 35WBGT (°C)
WR
C (m
in/h
)
FlagHSDAMoHSM
Figures D-1a, D-1b, and D-1c show WRC guidance as a function of WBGT while figures D-1d, D-1e, and D-1f show WRC guidance vs time.
28

Figure D-1d. WRC Guidance for Light Work (250 W) for GIIB
0
15
30
45
60
Wor
k R
est C
ycle
Tim
e (m
in/h
)
FlagHSDAMoHSM
1200 7 May 1200 11 May 1200 15 May 1200 19 May 1200 23 May
outlying point which resulted from estimated weather parameters
Time of Day
Figure D-1e. WRC Guidance for Moderate Work (425 W) for GIIB
0
15
30
45
60
Wor
k R
est C
ycle
Tim
e (m
in/h
)
FlagHSDAMoHSM
1200 7 May 1200 11 May 1200 15 May 1200 19 May 1200 23 May Time of Day
Figure D-1f. WRC Guidance for Heavy Work (600 W) for GIIB
0
15
30
45
60
Wor
k R
est C
ycle
Tim
e (m
in/h
)
FlagHSDAMoHSM
1200 7 May 1200 11 May 1200 15 May 1200 19 May 1200 23 May Time of Day
29
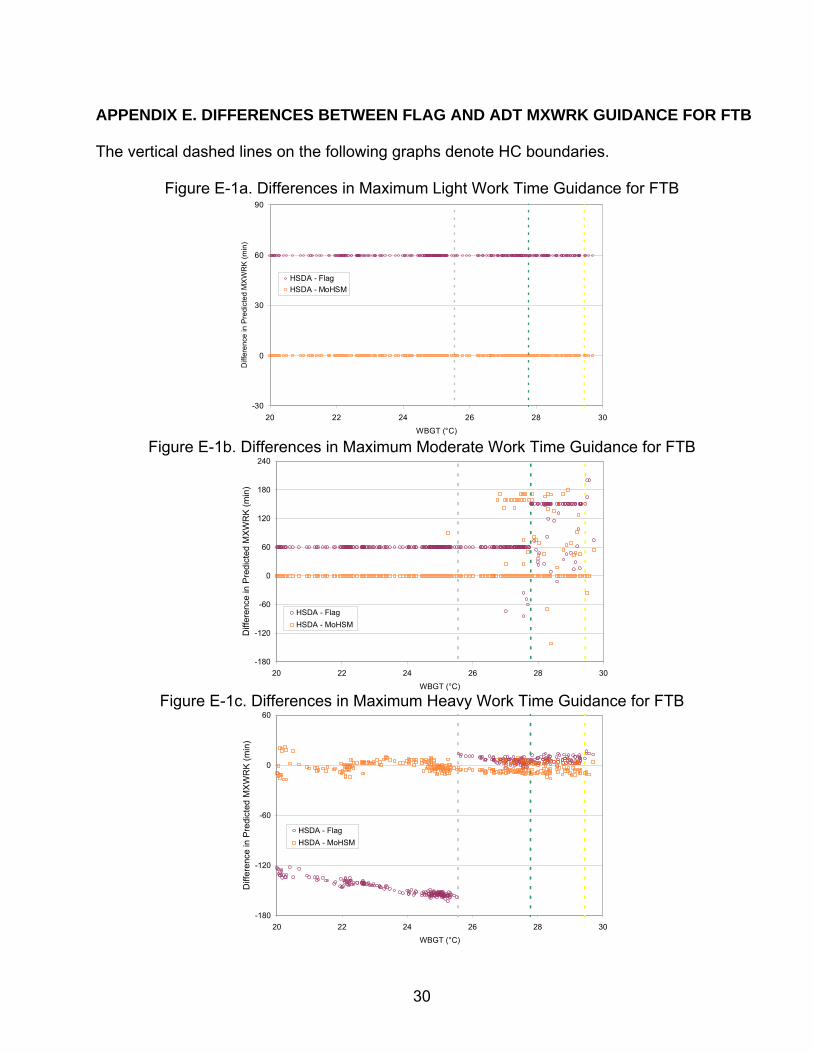
APPENDIX E. DIFFERENCES BETWEEN FLAG AND ADT MXWRK GUIDANCE FOR FTB The vertical dashed lines on the following graphs denote HC boundaries.
Figure E-1a. Differences in Maximum Light Work Time Guidance for FTB
-30
0
30
60
90
20 22 24 26 28 30
WBGT (°C)
Diff
eren
ce in
Pre
dict
ed M
XW
RK
(min
)
HSDA - FlagHSDA - MoHSM
Figure E-1b. Differences in Maximum Moderate Work Time Guidance for FTB
-180
-120
-60
0
60
120
180
240
20 22 24 26 28 30
WBGT (°C)
Diff
eren
ce in
Pre
dict
ed M
XW
RK
(min
)
HSDA - FlagHSDA - MoHSM
Figure E-1c. Differences in Maximum Heavy Work Time Guidance for FTB
-180
-120
-60
0
60
20 22 24 26 28 30
WBGT (°C)
Diff
eren
ce in
Pre
dict
ed M
XW
RK
(min
)
HSDA - FlagHSDA - MoHSM
30

APPENDIX F. DIFFERENCES BETWEEN FLAG AND ADT MXWRK GUIDANCE FOR GIIB
Figure F-1a. Differences in MXWRK Guidance for Light Work for GIIB
-30
0
30
60
90
15 20 25 30
WBGT (°C)
Diff
eren
ce in
Pre
dict
ed M
XWR
K (m
in)
HSDA - FlagHSDA - MoHSM
Figure F-1b. Differences in MXWRK Guidance for Moderate Work for GIIB
-210
-120
-30
60
150
240
15 20 25 30
WBGT (°C)
Diff
eren
ce in
Pre
dict
ed M
XW
RK
(min
)
HSDA - FlagHSDA - MoHSM
Figure F-1c. Differences in MXWRK Guidance for Heavy Work for GIIB
-210
-120
-30
60
15 20 25 30
WBGT (°C)
Diff
eren
ce in
Pre
dict
ed M
XWR
K (m
in)
HSDA - FlagHSDA - MoHSM
31

APPENDIX G. DIFFERENCES IN WRC GUIDANCE FOR FTB
Figure G-1a. Differences in WRC Guidance for Light Work for FTB
-60
-30
0
30
60
20 22 24 26 28 30
WBGT (°C)
Diff
eren
ce in
Pre
dict
ed W
RC
(min
/h)
HSDA - FlagHSDA - MoHSM
Figure G-1b. Differences in WRC Guidance for Moderate Work for FTB
-60
-30
0
30
60
20 22 24 26 28 30
WBGT (°C)
Diff
eren
ce in
Pre
dict
ed W
RC
(min
/h)
HSDA - FlagHSDA - MoHSM
Figure G-1c. Differences in WRC Guidance for Heavy Work for FTB
-60
-30
0
30
60
20 22 24 26 28 30
WBGT (°C)
Diff
eren
ce in
Pre
dict
ed W
RC
(min
/h)
HSDA - FlagHSDA - MoHSM
32
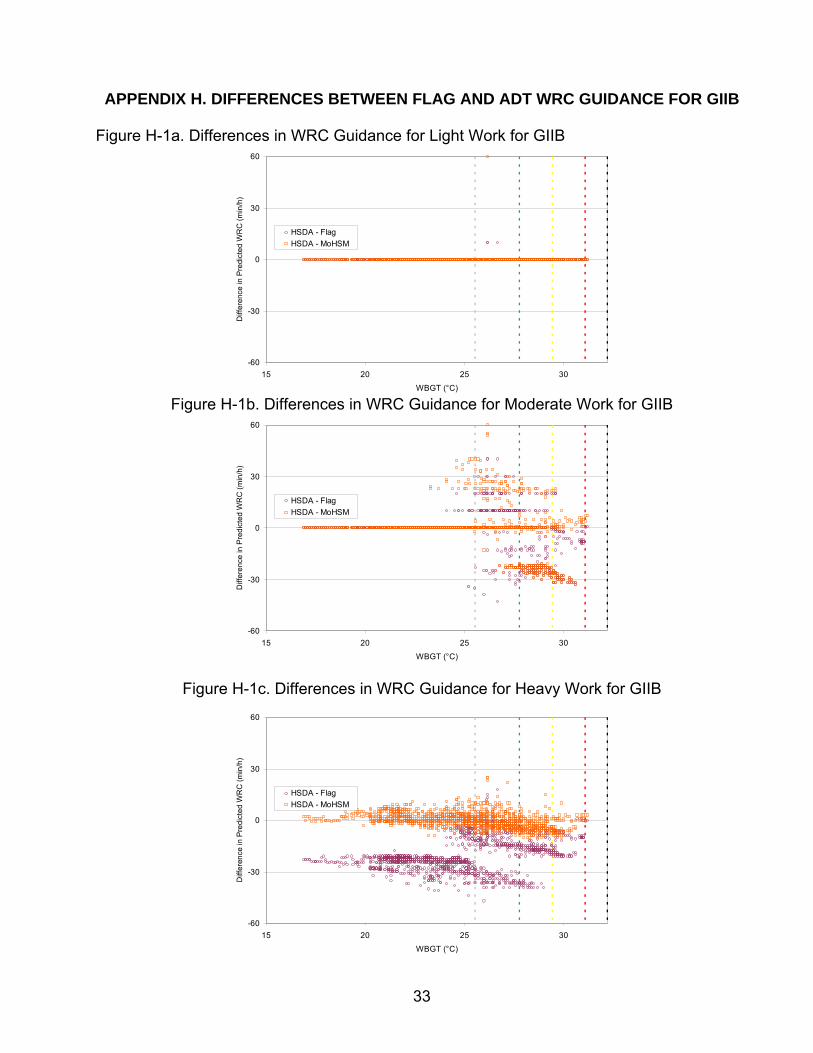
APPENDIX H. DIFFERENCES BETWEEN FLAG AND ADT WRC GUIDANCE FOR GIIB
Figure H-1a. Differences in WRC Guidance for Light Work for GIIB
-60
-30
0
30
60
15 20 25 30
WBGT (°C)
Diff
eren
ce in
Pre
dict
ed W
RC
(min
/h)
HSDA - FlagHSDA - MoHSM
Figure H-1b. Differences in WRC Guidance for Moderate Work for GIIB
-60
-30
0
30
60
15 20 25 30
WBGT (°C)
Diff
eren
ce in
Pre
dict
ed W
RC
(min
/h)
HSDA - FlagHSDA - MoHSM
Figure H-1c. Differences in WRC Guidance for Heavy Work for GIIB
-60
-30
0
30
60
15 20 25 30
WBGT (°C)
Diff
eren
ce in
Pre
dict
ed W
RC
(min
/h)
HSDA - FlagHSDA - MoHSM
33

APPENDIX I. DIFFERENCES IN WORK TIME AS A FUNCTION OF RH, WS, AND SOLAR LOAD
To analyze sensitivity of ADT predictions to various weather components, MXWRK
and WRC were plotted as a function of solar load, WS, and RH. For the GIIB environment, Flag guidance is less restrictive than ADT for lower WBGT whether during the day or at night. Figure I-1 shows more differences between heavy MXWRK predicted by Flag and ADTs at night than during the day as a result of more data at lower WBGTs during the night.
Figure I-1a. Predicted Maximum Heavy Work Time During the Day
0
60
120
180
240
15 20 25 30 35
WBGT (°C)
MX
WR
K (m
in)
FlagHSDA MoHSM
Figure I-1b. Predicted Maximum Heavy Work Time at Night
0
60
120
180
240
15 20 25 30 35WBGT (°C)
MX
WR
K (m
in)
FlagHSDA MoHSM
34

WRC for moderate work are shown in Figure I-2 for GIIB day and night conditions. Flag doctrine and ADTs suggest that continuous work is possible at night except for a few outlying points predicted by MoHSM. There is significantly more variability during the day with some ADT predictions more conservative than Flag and a nearly equal number of cases where the reverse was true.
Figure I-2a. Predicted WRC for Moderate Work During the Day
0
20
40
60
15 20 25 30 35WBGT (°C)
WR
C (m
in)
FlagHSDA MoHSM
Figure I-2b. Predicted WRC for Moderate Work at Night
0
20
40
60
15 20 25 30 35
WBGT (°C)
WR
C (m
in)
FlagHSDA MoHSM
35

Figure I-3 shows the effects of WS on moderate MXWRK. Predictions for lower wind speeds demonstrate that expanding and narrowing the ‘calm’ and ‘light’ ranges of input had a negligible effect for this data. This relationship may not hold true for other environments. Figure I-3a. Predicted Moderate MXWRK Figure I-3b. Predicted Moderate MXWRK
for WS < 1.25 m/s for WS < 1 m/s
0
60
120
180
240
300
20 22 24 26 28 30WBGT (°C)
MXW
RK
(min
)
FlagHSDAMoHSM
0
60
120
180
240
300
20 22 24 26 28 30WBGT (°C)
MX
WR
K (m
in)
FlagHSDAMoHSM
Figure I-3c. Moderate MXWRK for Figure I-3d. Moderate MXWRK for 1.25 m/s <= Wind Speed < 3.5 m/s 1.5m/s <= Wind Speed <= 2.5 m/s
0
60
120
180
240
300
20 22 24 26 28 30WBGT (°C)
MX
WR
K (m
in)
FlagHSDAMoHSM
0
60
120
180
240
300
20 22 24 26 28 30WBGT (°C)
MXW
RK
(min
)
FlagHSDAMoHSM
36

The sensitivity of predicted MXWRK to RH is shown in Figure I-4. Since RH was almost always below 35% for WBGT above HC1 for these data, the differences between ADT recommendations for MXWRK and Flag doctrine are much larger at lower WBGTs where Flag guidance is less conservative than HSDA or MoHSM.
Figure I-4a. Maximum Moderate Work Time Guidance as a Function of RH for FTB
0
60
120
180
240
300
20 22 24 26 28 30WBGT (°C)
MX
WR
K (m
in)
Flag
HSDA RH<35%
MoHSM RH<35%
HSDA RH>35%
MoHSM RH>35%
Figure I-4b. Maximum Heavy Work Time Guidance as a function of RH for FTB
0
60
120
180
240
300
20 22 24 26 28 30WBGT (°C)
MX
WR
K (m
in)
Flag
HSDA RH<35%
MoHSM RH<35%
HSDA RH>35%
MoHSM RH>35%
37
Top Related