


Languages
Pages
Legal

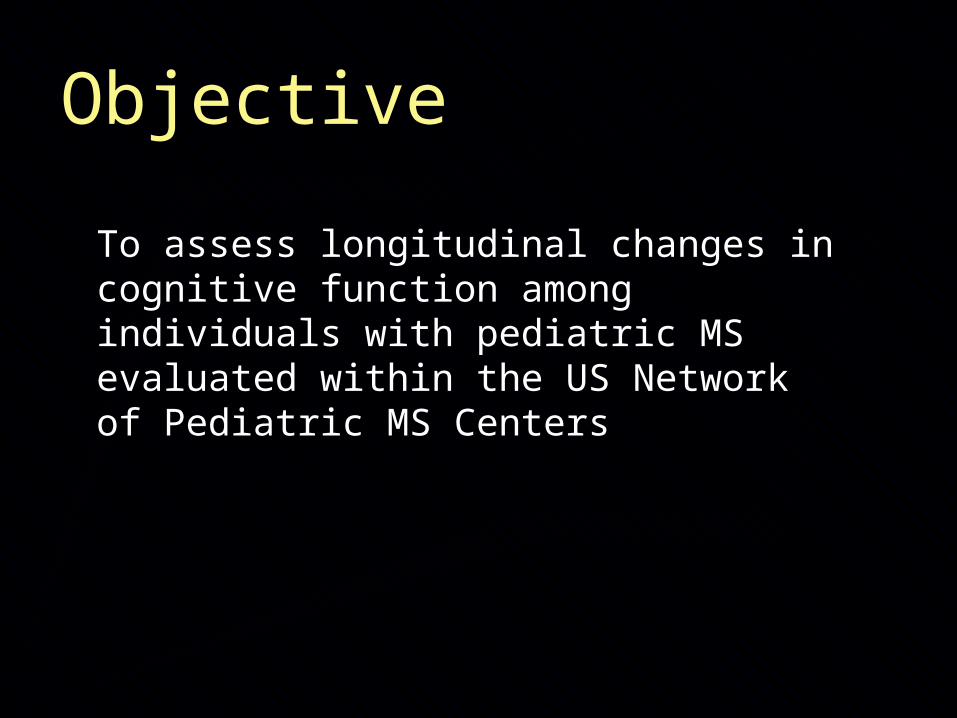
Objective
To assess longitudinal changes in cognitive function among individuals with pediatric MS evaluated within the US Network of Pediatric MS Centers

BackgroundMS onset prior to age18 years has an estimated incidence of:
0.2-0.6/100,000
Cognitive impairment occurs in approximately 1/3 of those with pediatric MS
McAllister et al. 2005 (n=37) 35% Amato et al. 2008 (n=63) 31%Till et al. 2011(n= 35) 29% Julian et al. 2012, (n=231) 32%

Longitudinal studies are few
Amato et al. 2010: Two-year f/u (n=56), compared to controls
75% worsened on a Cognitive Change Index
Till et al. 2013: One-year f/u (n=28) compared to controls
Groups differed in rate of improvement MS improved on 18% of measures vs Controls on 86% Using RCI, decline occurred in 23% MS vs 4% of
Controls

Methods
The US Network consists of 9 pediatric MS centers sharing a common database
Baseline and f/u cognitive testing 18 months later was administered across 6 sites
Participants had MS or CIS and be were 30 or more days free of a relapse and last steroid dose

Cognitive Test Battery
General Intelligence (WASI)
2 subtest IQ
Simple Attention (Digit Span)
Digits Forward
Digits back
Visuo-motor skill Beery (Visual-Motor Integration Test)
Language (Expressive One-Word Vocabulary)

Cognitive Test Battery
WIAT-II Pseudoword decoding
Verbal Memory California Verbal Learning Test (CVLT-C/CVLT-II )
Total learning across trials
Total long-delay free recall
D-KEFS Trail Making Test
Visual Scanning
Number Sequence
Letter Sequence
Letter-Number Sequence
Motor Speed

Study Cohort53 MS, 7CIS
Age at first evaluation (NP1) Mean = 14.36±1.95 years
range (8.11 to 17.77 years)
Time between baseline (NP1) and follow-up testing (NP2)
Mean = 1.54 years ± 0.56 (0.75 to 2.99 years)

Cohort Demographic Features N = 60; 21 male (35%), 39 female (65%) Race
White n=46 (76.7%) African-American n=12 (20%) Asian n=1 (1/7%) Other n=1 (1.7%)
Ethnicity: Hispanic=18 (30%) Non-Hispanic 28 (70%)
Maternal years of education: Mean =13.8 ±2.2 years (7 - 18 yrs)

Cohort Clinical Features
Symptom duration at NP1Mean =1.36 ± 1.66 years
(.09 to 8.32 years)
EDSS at NP1Mean=1.48 ±1.21 (0 to 6)
EDSS at NP2Mean = 1.19 ± 1.40 (0 to 4.5)
EDSS NP1 vs. EDSS NP2 ns (p=0.35)

Performances on individual measures at NP1 and NP2
-1
-0.8
-0.6
-0.4
-0.2
0
0.2
0.4
0.6
WASI 2DSFWDDSBACKEOWPWDLIST A TOT LD FREEVISSCANNUM SCANLETTER SEQLETTER NUMBERMOTOR SPEEDVMI
Baseline Follow-Up
Mean z
score
, n=
60

Average percentage of impaired tests per subject
Percent of test scores <1 SD published norm/patient
NP1: 27% ±21% (range 0 - 86%)
NP2: 26% ±21% (range 0-78%)

Number of impaired tests
Sum of impaired tests at baselineMean 4.23 ±-2.99 (0 to 12
Sum of impaired tests at follow-upMean 4.00 ±-3.00 (0 to 11)
Change in sum of impaired tests-4.00 to 5, mean -.017 ± 1.95

Change in total number of impaired tests

Cognitive Change Index (CCI)

Most patients showed no change
Declined on 2 or more tasks n=8 (13.3%)
Improved on 2 or more tasks n=12 (20%)
No clear pattern of improvement or decline on any test, in any area
Change was not related to any clinical or demographic features

Comparisons with other studies
Amato et al. (2010):
Greater proportion of low IQs
28% vs. only 1 patient in this cohort
20-40% had language problems (with more language measures in battery)
No indication of language impairment or decline in this cohort
More time between testing (18 months vs. 24 months)

Other studies
Till et al. (2013)Lower rate of decline consistent with
findings from our cohortAbsence of expected age-related gainsNatural history control group is needed,

Conclusions
Cognitive impairment remains relatively stable for most children
Relative cognitive stability is present over similar intervals in adult MS
Nonetheless, pediatric MS patients may not be achieving age-expected cognitive gains
Top Related