


Languages
Pages
Legal


UPSKILLING AND DOWNSIZING IN AMERICAN MANUFACTURING
By Anthony P. Carnevale,
Neil Ridley, Ban Cheah, Jeff Strohl,
and Kathryn Peltier Campbell
2019

Reprint Permission
The Georgetown University Center on Education and the Workforce carries a Creative Commons license, which permits noncommercial reuse of any of our content when proper attribution is provided.
You are free to copy, display, and distribute our work, or include our content in derivative works, under the following conditions:
Attribution: You must clearly attribute the work to the Center on Education and the Workforce and provide a print or digital copy of the work to [email protected].
Our preference is to cite figures and tables as follows:
Source: Georgetown University Center on Education and the Workforce, Upskilling and Downsizing in American Manufacturing, 2019.
Noncommercial Use: You may not use this work for commercial purposes. Written permission must be obtained from the owners of the copy/literary rights and from Georgetown University for any publication or commercial use of reproductions.
Approval: If you are using one or more of our available data representations (figures, charts, tables, etc.), please visit our website at cew.georgetown.edu/publications/reprint-permission for more information.
For the full legal code of this Creative Commons license, please visit creativecommons.org.
Email [email protected] with any questions.

UPSKILLING AND DOWNSIZING IN AMERICAN MANUFACTURING By Anthony P. Carnevale, Neil Ridley, Ban Cheah, Jeff Strohl, and Kathryn Peltier Campbell
2019

ACKNOWLEDGMENTS
We are grateful to JPMorgan Chase & Co. for the generous support that made this report
possible, particularly to Sarah Steinberg, who contributed her insight and feedback as the
report was developed.
The staff of the Georgetown University Center on Education and the Workforce was
instrumental in the production of this report from conception to publication. In particular, we
would like to thank
� Andrea Porter for strategic guidance;
� Nicole Smith for research guidance and economic methodology;
� Artem Gulish for data analysis;
� Megan Fasules, Martin Van Der Werf, and Gayle Cinquegrani
for editorial and qualitative feedback;
� Hilary Strahota, Vikki Hartt Salinkas, Emma Wenzinger, and Frank Zhang for
communications efforts, including design development and public relations; and
� Joe Leonard and Coral Castro for assistance with logistics and operations.
Many others contributed their thoughts and feedback throughout the production of this
report. We especially are grateful to our talented designers, editorial advisors, and printers,
whose efforts were vital to its successful completion. We also thank Ken Voytek for his
thoughtful comments after reviewing a version of this report.
The views expressed in this publication are those of the authors and do not necessarily
represent those of JPMorgan Chase & Co. or any of its officers or employees. All errors and
omissions are the responsibility of the authors.

CONTENTS
1 Introduction
3 Manufacturing remains a route to good
jobs for a smaller, more skilled workforce.
4 The industry is bouncing back from the
Great Recession, but the jobs may not follow.
8 Part I. Manufacturing and Structural Change
8 Changes in what people purchase and
how things are produced drove
manufacturing’s evolution.
12 Manufacturing’s evolution is tightly linked
to automation, globalization, and the growth
of a networked economy.
14 Manufacturing employment has declined as
overall output and productivity have risen.
16 Because of structural change, there is a new
balance between production and
non-production jobs in manufacturing.
18 Part II. Upskilling and the Three Pathways
into the Manufacturing Workforce
18 Workers with postsecondary education now
outnumber workers with a high school
diploma or less in manufacturing.
20 Workers with postsecondary education have
taken a larger share of both production and
non-production jobs.
22 The manufacturing workforce, once
dominated by workers with a high school
diploma or less, now employs workers with
a diverse set of credentials and skills.
24 Part III. The Changing Structure of Good
Jobs in Manufacturing
24 Good jobs in manufacturing have declined,
and workers with a high school diploma or
less have borne the brunt of the reductions.
26 Losses of good jobs due to structural
change in manufacturing have varied by
race or ethnicity and sex.
28 The structure of good jobs has shifted in
favor of those with postsecondary education.
30 Manufacturing workers with a non-degree
workforce credential are more likely to have
a good job than those without one.
31 Manufacturing, despite its decline, is still
a source of good jobs for workers without
a bachelor’s degree.
32 While good jobs in manufacturing
still exist for some workers, overall
economic opportunity has shifted
elsewhere in the economy.
34 Conclusion
38 References
42 Appendix A. Data Sources and Methodology
44 Appendix B. Manufacturing Jobs Held by
Worker Education Level
46 Appendix C. Good Jobs by Race or
Ethnicity and Sex
48 Appendix D. Displaced Workers

FIGURES AND TABLESFigure 1. Food, beverages, and clothing were
responsible for 36 percent of consumption in
1947 and just 9 percent in 2017. 9
Figure 2. Between 1947 and 2017,
manufacturing dropped sharply as a share of all
value added in the economy, while the services
industries greatly expanded their share. 11
Figure 3. The number of manufacturing jobs
has dropped since 1979, but the industry’s share
of US employment has been in steady decline
since the 1950s. 15
Figure 4. Manufacturing employment has fallen
even as output has grown since 1991. 15
Figure 5. Manufacturing work has become
more concentrated in front-office,
non-production jobs. 17
Figure 6. High school dropouts had the largest
share of manufacturing jobs in 1970, but the
smallest share by 2016. 19
Figure 7. Workers with middle skills and
bachelor’s degrees increased as a share of
production workers by 2016. 21
Figure 8. Workers with bachelor’s degrees
have greatly increased their share of
non-production jobs. 21
Figure 9. Workers with a high school diploma or
less hold the majority of production jobs, while
workers with bachelor’s degrees hold most
management, engineering, and sales jobs. 22
Figure 10. Manufacturing accounts for most
losses of good jobs for workers without a
bachelor’s degree since 1991. 25
Figure 11. Manufacturing employment decline
took the heaviest toll on good jobs for workers
with a high school diploma or less. 25
Figure 12. For workers with a high school diploma
or less, the odds of finding a good manufacturing
job have dropped sharply since 1991. 26
Figure 13. Whites and Blacks lost good
manufacturing jobs for workers without a
bachelor’s degree, while Latinos made gains. 27
Figure 14. Workers with a high school diploma
or less, who at one time held the largest number
of good manufacturing jobs, lost 2 million jobs
between 1991 and 2016. 28
Figure 15. Workers with some college, no
degree lost good jobs, while those with
associate’s degrees experienced gains. 29
Figure 16. Manufacturing is the top industry
for good jobs for workers without a bachelor’s
degree in 35 states. 31
Figure 17. Manufacturing workers enjoy a wage
premium regardless of education level. 33
Figure 18. Between 1991 and 2016, good jobs
for those without a bachelor’s degree expanded
in skilled-services industries, while those in blue-
collar industries declined. 33
Figure 19. Manufacturing is expected to shed
employment during the next decade. 35
Table 1. Finance and professional and business
services industries make a more significant
contribution than manufacturing to the production
of goods and services across the economy. 10
Table 2. Workers who combine postsecondary
education with a certification or license are
more likely to have a good job. 30
Upskilling and Downsizing in American Manufacturing 1
INTRODUCTIONManufacturing evokes powerful emotions in American communities. The famous sign on a Delaware
River bridge—“Trenton Makes, the World Takes”—captures the pride of a once-bustling manufacturing
city. This confidence was widespread during the heyday of the industrial economy, when making
things was part of our national identity. Today, manufacturing still remains a source of pride, though
often mixed with nostalgia and economic anxiety, for workers and policymakers.
The story of manufacturing in the American economy is bittersweet. The good news is that
increased productivity in manufacturing—the ability to produce more and better goods with fewer
workers—benefited consumers across the economy. As cars, computers, and other products
became more varied and affordable in the post–World War II era, consumers had more money to
spend on goods and services, such as healthcare and recreation.1 But these productivity gains had
a downside: fewer workers were needed to produce the growing stream of manufactured goods.
Manufacturing employment declined both absolutely and as a share of all jobs. After reaching a peak
of almost 20 million jobs (22% of national employment) in 1979, the industry now accounts for 12.6
million jobs and a much smaller share (9%) of employment. If manufacturing were to claim the same
employment share in today’s workforce as it did in 1979, there would be 19 million additional jobs
for American workers.
For decades, manufacturing was a large and reliable source of employment, especially for workers
with a high school education or less. In 1970, nearly four out of five of all manufacturing jobs (79%)
and an even higher proportion of production jobs (92%) went to workers with no more than a high
school diploma. High school dropouts alone accounted for more than two out of five manufacturing
workers (43%). Young people could leave high school, even without a diploma, and find work in a
booming factory or mill.
But this began to change as employers automated routine production functions or shuttered factories
altogether. Workers with a high school diploma or less bore the brunt of this decline, losing nearly
1 Carnevale and Rose, The Economy Goes to College, 2015.

Upskilling and Downsizing in American Manufacturing2
five million jobs between 1991 and 2016.2 Manufacturing workers—typically men with no more than a
high school diploma—became synonymous with displaced workers, those jolted into unemployment
by plant closings or mass layoffs. Compared to workers from other industries, manufacturing workers
often faced considerable difficulty in finding another job or maintaining their wage level.
After decades of job losses, the manufacturing workforce is no longer dominated by workers with a
high school diploma or less. It now provides job opportunities along three educational pathways:
� The high school pathway is a well-traveled route for slightly more than two out of five
manufacturing workers (43%), down from nearly four out of five workers (79%) in 1970. Workers
with no more than a high school diploma fill jobs in production, such as assembly workers and
machinists. Production jobs are increasingly segmented into general production and skilled
production jobs, such as Computer Numerical Control (CNC) machine operators.3 In many
cases workers with a high school diploma or less have worked their way up to serve as first-line
supervisors or production managers.
� The middle-skills pathway has doubled as a share of the manufacturing workforce since 1970,
reaching about a quarter in 2016. This pathway includes workers who have a mix of education
and training beyond high school but no bachelor’s degree. Examples include associate’s degrees
as well as various types of certificates, certifications, and apprenticeships. Middle-skills workers
hold production jobs as well as installation, maintenance, and repair jobs and serve as front-line
supervisors and managers.
� The bachelor’s degree pathway has grown from 8 percent of all manufacturing jobs in 1970
to represent nearly a third of the manufacturing workforce. More than a fifth (21%) of industry
jobs are held by workers with no more than a bachelor’s degree, and 9 percent go to graduate
degree holders. Workers with at least a bachelor’s degree make up an increasing proportion
of non-production workers, such as managers, business analysts, designers, and industrial
engineers, and they have become a slightly larger share of production workers.
2 This report uses 1991 as a baseline for measuring change because that is the first year in which our primary data source (the
US Census Bureau’s Current Population Survey) distinguishes workers with “some college” from those with an associate’s
degree. A different data source and a longer time frame are used in some sections to show the change in the composition of
the high school-educated workforce.
3 Burning Glass Technologies, Job Market Intelligence, 2014.

Upskilling and Downsizing in American Manufacturing 3
Manufacturing remains a route to good jobs for a smaller, more skilled workforce.
Few industries have been as affected by automation as manufacturing. Automation initially created
new jobs for less-skilled workers and, much later, took them away. In the early 20th century, the
introduction of the assembly line boosted factory productivity while creating employment for less-
skilled workers, who were hired to perform standardized, repetitive tasks.4 Technological advances
since then have allowed employers to improve the production process, further automate routine tasks,
and increase output dramatically with fewer workers. Industrial robots, first introduced in the 1960s,
have been used more intensively since their cost began to drop during the 1990s.5
Globalization, too, had a deep impact on manufacturing. Increased international trade and offshoring
have contributed to a shrinking manufacturing employment base, especially after China joined
the World Trade Organization in 2001. Between 2000 and 2016 alone, 61,000 manufacturing
establishments disappeared.6
The growth of a more integrated, networked global economy with an expanded role for business-
to-business services also transformed the industry. Manufacturing firms, like other businesses, have
become dependent on finance, logistics, and business services firms to provide accounting, legal,
and other specialized services instead of staffing these services in-house.7 This growth in domestic
outsourcing alone can explain as much as 21 percent of the decline in manufacturing employment
between 1987 and 2002.8
These industry trends all contributed to declining numbers of good jobs (see sidebar on page 4) in
manufacturing, especially for workers with a high school diploma or less. Between 1991 and 2016,
good manufacturing jobs decreased by 1.6 million. As a result, the route to economic opportunity in
manufacturing is not as straightforward as it used to be. In manufacturing as across the workforce,
the structure of good jobs has shifted in favor of workers with more education. Workers with a high
school diploma or less, who held the largest number of good manufacturing jobs in 1991, held fewer
good jobs than workers with a bachelor’s degree by 2016. During this period, workers with a high
school diploma or less experienced the greatest decline in good jobs, followed by those with some
college but no degree. Meanwhile, workers with associate’s degrees and bachelor’s degrees gained
good jobs. Overall, workers with postsecondary education are best positioned to succeed in today’s
manufacturing workforce as production and assembly jobs have lost ground to jobs for workers off
the factory floor.
4 Vlasic, “100 Years Down the Line,” 2013. The trend toward replacement of highly skilled artisans by less skilled “operatives”
predated the introduction of the assembly line. This “de-skilling” was accompanied by growth in the ranks of white-collar,
more-educated workers during the 19th century. See Katz and Margo, “Technical Change and the Relative Demand for Skilled
Labor: The United States in Historical Perspective,” 2013.
5 Graetz and Michaels, “Robots at Work,” 2015.
6 Georgetown University Center on Education and the Workforce analysis of US Bureau of Labor Statistics, Quarterly Census of
Employment and Wages data.
7 Manyika et al., Manufacturing the Future, 2012.
8 Berlingieri, “Outsourcing and the Shift from Manufacturing to Services,” 2014.

Upskilling and Downsizing in American Manufacturing4
Despite its decline, manufacturing remains an important source
of economic opportunity, particularly in the 24 states where it
is the top industry for good jobs and the 35 states where it is
the top industry for good jobs for workers without a bachelor’s
degree. While manufacturing will never return to its peak when
a third of all workers with a high school diploma or less were
employed in the industry, it is still a route to good jobs for a
smaller, more skilled workforce.9
The industry is bouncing back from the Great Recession, but the jobs may not follow.
Manufacturing output has resumed a steady climb since
the Great Recession ended in 2009, and manufacturing
employment has slowly begun to recover as well. Adopting
a renewed sense of optimism, experts have issued a spate
of reports predicting a powerful industry comeback with a
rebound in employment.10
This faith may be misplaced, however. While an industry recovery
is underway, it is unlikely to lead to an employment resurgence
that will restore manufacturing to its former glory. Future growth in production jobs is more likely to
employ robots than people. Even if output increases dramatically, manufacturing firms are not likely
to add large numbers of jobs, because today’s highly automated production methods require fewer
production workers and more equipment and technology than the labor-intensive factories of the past.11
In fact, the industry is expected to shed employment in the next decade, with most of the losses in
production occupations sustained by workers with a high school diploma or less.12
The manufacturing workforce has been shaped by decades of industry transformation. Modern
manufacturing is not just about making things on the factory floor. It requires workers with a diverse
set of skills to perform functions such as research and development (R&D), product and production
design, marketing and sales, and customer support. While workers with a high school diploma or less
dominated the manufacturing workforce of the past, today, even production jobs have begun to shift
to workers with postsecondary education. The result is that while manufacturing still has good jobs
that pay well, they are now going to a downsized, better-educated workforce.
9 In defining a good job, we have chosen levels that are equivalent to a minimum of $17 per hour for a full-time job for younger
workers and $22 per hour for older workers. These wage levels are consistent with living wage levels. See Carnevale et al.,
Good Jobs that Pay without a BA, 2017.
10 Recent reports include Ramaswamy et al., Making It in America, 2017, and Sirkin et al., Made in America, Again, 2011.
11 Charles et al., “The Transformation of Manufacturing,” 2018.
12 US Department of Labor, Bureau of Labor Statistics, Employment Projections 2016–2026.
WHAT IS A GOOD JOB?
In defining a good job, we
chose minimum earnings
of $35,000 for workers age
25 to 44, and $45,000 for
workers age 45 and older.
In 2016, these good jobs paid
$65,000 per year in median
earnings. Wages for good
jobs between 1991 and 2016
are inflation-adjusted.

Upskilling and Downsizing in American Manufacturing 5
Five key trends described in this report define the changing character of the manufacturing workforce:
Manufacturing, once the powerhouse of the industrial economy, now plays
a smaller, less central role in an economy dominated by services. In 1947,
manufacturing was responsible for a quarter (25%) of all value added in the
economy, more than any other industry. By 2017 it had fallen to 12 percent of all
value added. At the same time, professional and business services jumped from
just 3 percent of value added in 1947 to 12 percent in 2017, and finance rose
from 10 percent to 21 percent.13
This shift reflected fundamental changes in the way goods and services are
produced, which now involves a complex mix of inputs. A prime example is the
food production network. In 2007, just 12 percent of value added came from
food producers (5%) and food manufacturers (7%), while a larger proportion
(19%) came from advertising, banking, legal services, insurance, real estate, and
other business services. Grocery stores, restaurants, and other retailers that
connect food producers with consumers contributed an additional 28 percent.
Getting food from the farm to the table now involves a complicated chain of
industries spanning nearly every part of the economy.14
The days when manufacturing was the dominant industry group are fleeting
images in the rearview mirror. As a result, the manufacturing workforce is a
shadow of what it used to be. It represented about 30 percent of national
employment during the 1950s, but it dropped to about 20 percent in 1980 and
then to 9 percent in 2016. Manufacturing also accounted for a declining share
of good jobs for workers without a bachelor’s degree. In 1991 manufacturing
made up more than a quarter (27%) of all good jobs held by workers without a
bachelor’s degree. By 2016 its share had dropped to 16 percent.
Manufacturing, despite its decline, is still a source of good jobs for less-
educated workers. In 2016 it still provided more good jobs for workers without a
bachelor’s degree than any other industry, with 4.8 million (16%) of all those jobs.
It is the top industry for good jobs for workers without a bachelor’s degree in 35
states.15 At every education level, manufacturing workers earn more, on average,
than workers in other blue-collar and skilled-services industries.
13 The metric of value added, defined as total output in dollars after subtracting the cost of inputs, is often used to show an
industry’s importance to the overall economy. See Carnevale and Rose, The Economy Goes to College, 2015.
14 Carnevale and Rose, The Economy Goes to College, 2015.
15 Carnevale et al., Good Jobs that Pay without a BA, 2017.
1
2

Upskilling and Downsizing in American Manufacturing6
While there are still good jobs in manufacturing, the structure of economic
opportunity has shifted in favor of those with postsecondary education and
industry-recognized credentials. Good jobs in non-production functions have
gone to workers with bachelor’s degrees, and good jobs in production have
shifted toward workers with associate’s degrees. In fact, workers with associate’s
degrees stand out as the only group of workers without a bachelor’s degree to
experience net gains in good manufacturing jobs. The number of workers with
associate’s degrees who had good jobs climbed from 750,000 to nearly
1 million by 2016.
Workers with a bachelor’s degree also have benefited from the new structure
of economic opportunity in the manufacturing industry. Good jobs for workers
with bachelor’s degrees rose from 2.8 million to 3.6 million between 1991 and
2016, with almost all of the increase in non-production jobs, such as those held
by managers, business analysts, software developers, and industrial engineers.
Manufacturing workers, like workers in other industries, now pursue education
and training options beyond traditional degrees and diplomas. About 10
percent of manufacturing workers have earned a certificate, which typically
recognizes completion of a program of study between high school and the
associate’s degree.16 The same proportion (10%) of manufacturing workers holds
an industry certification or license—workforce credentials that are awarded based
on performance on a test or other requirements. At all levels of educational
attainment, workers who hold an industry certification or license are more likely to
hold a good job than those who do not. Workers without a bachelor’s degree get
a particularly large boost from having a workforce credential. While those with a
high school diploma or less are the least likely to have a good job overall, they are
much more likely to have one if they earn a certification or license (59%) than if
they do not (41%).
16 Cronen et al., Adult Training and Education: Results from the National Household Education Survey Program, 2018.
3
4

Upskilling and Downsizing in American Manufacturing 7
Current trends suggest that there will be no return to the glory days when good
manufacturing jobs were plentiful for high school-educated workers. Because
of structural changes in the industrial economy, there are simply fewer good
manufacturing jobs, and the job opportunities that do exist are going to workers
who have postsecondary education.
The future promises more of the same. Manufacturing employment decline is part
of a long-term trend that is not likely to turn around. In fact, projections show
that manufacturing jobs are expected to decrease by 253,000 net jobs or about
2 percent during the next decade, while total employment in the economy is
expected to grow by 8 percent.17
There will also be fewer good jobs in manufacturing. Good manufacturing jobs
for workers with a high school diploma or less are expected to decline from 2.5
million in 2017 to 2.3 million in 2027. Workers with bachelor’s degrees will also
have 200,000 fewer good jobs. However, workers with middle skills, who often
fill more demanding blue-collar and supervisory positions, are expected to gain
about 300,000 good jobs by 2027.18
Taken together, these key trends suggest that the days when manufacturing powered the economy
are long gone. Today, the industry plays a smaller, less central role in the economy, contributing only
12 percent of all value added. It provides only 9 percent of employment, down from 22 percent in
1979. While it continues to be a top source of good jobs in many states, manufacturing is not expected
to be a major job generator in the future, as our projections indicate. The industry’s shrinking presence
across the country means that it employs fewer workers, provides fewer good jobs, and creates
smaller ripples in the surrounding economy than it did in its glory days.
17 Carnevale et al., Job Projections and Education Requirements, 2017–2027, forthcoming. While manufacturing employment
is expected to drop, the industry will still be hiring due to the need to replace manufacturing workers who retire or leave the
workforce. Historically, job openings resulting from replacement needs have been particularly important for production and
other blue-collar occupations.
18 Carnevale et al., Job Projections and Education Requirements, 2017–2027, forthcoming.
5

Manufacturing and Structural ChangeAmerica’s global dominance in manufacturing peaked in the economic boom that followed World War II.
Having led the world in manufacturing output since 1900, the United States was poised to play an even
more commanding role on the global stage.19 The country’s manufacturing infrastructure, built up to
support the war effort, stood ready to meet pent-up demand for consumer goods.
By the beginning of the postwar era, America’s industrial performance had risen to unprecedented
levels. In 1947, the United States produced half of the world’s manufactured goods, 57 percent of
its steel, 43 percent of its electricity, and 63 percent of its oil. In the same year, US citizens owned
75 percent of the world’s cars, and US companies manufactured 80 percent of the cars built.20
This swelling output was good news for the labor force: by the 1950s, almost one out of three
American workers was employed in manufacturing, and many of the nation’s largest employers were
manufacturing firms.21
But the golden age of American manufacturing did not last. Even as growth in industry output and
productivity fueled the prosperity of the post–World War II economy and helped create a vibrant
middle class, productivity gains allowed manufacturing firms to churn out a growing volume of
goods with fewer workers. Global competition also increased: Japan and Germany emerged as
industrial powerhouses during the 1970s, and a rapidly growing China surpassed the United States
in manufacturing value added in 2010.22 Together, these trends took a toll on the manufacturing
workforce; by 2016, fewer than one in ten American workers were employed in manufacturing.
Changes in what people purchase and how things are produced drove manufacturing’s evolution.
Ultimately, the story of American manufacturing is grounded in structural economic change, reflecting
the transition from an industrial economy based on factories to a post-industrial economy dominated
by services. Big changes in how consumers spend their money and how firms produce goods have
been at the heart of the industry’s evolution.
19 Kennedy, The Rise and Fall of the Great Powers, 1989.
20 Carnevale, America and the New Economy, 1991.
21 McIntyre, “America’s Biggest Companies, Then and Now,” 2010.
22 Levinson, “U.S. Manufacturing in International Perspective,” 2018.
PART I

Upskilling and Downsizing in American Manufacturing 9
During the era of robust economic growth following World War II, consumers used their new buying
power to purchase a widening array of manufactured goods and services. A key driver of this shift
in consumption was increased productivity in manufacturing, which made goods more affordable
and allowed consumers to increase their spending on services. In 1947, more than a third (36%) of
consumer spending went to basic necessities, such as food and clothing. By 2017, this share had
dropped to 9 percent, and consumers were spending more heavily on healthcare, recreation, and
financial services (Figure 1).
These economic trends had important consequences for employment and skill demands. The services
industries that expanded the most, such as healthcare, have workers with high levels of postsecondary
FIGURE 1. Food, beverages, and clothing were responsible for 36 percent of consumption
in 1947 and just 9 percent in 2017.
Source: Georgetown University Center on Education and the Workforce analysis of data from US Department of Commerce, Bureau of Economic Analysis, Personal Consumption Expenditures by Function, 1947–2017.
Share of Consumption Change from 1947 to 2017
1947 2017
Food and beverages purchased for off-premises consumption
25% -18%7%
Clothing 11% -9%2%
Furnishings, household equipment, and routine household maintenance
10% -6%4%
Tobacco 2% -1%1%
Communication 1% 2% 1%
Education 1% 2% 1%
Recreation 6% 9% 3%
Housing, utilities, and fuels 13% 19% 6%
Financial services and insurance 3% 8% 5%
Health 4% 21% 17%
Transportation 10% 9% -1%

Upskilling and Downsizing in American Manufacturing10
education. At the same time, the manufacturing industry, with its comparatively less-educated
workforce, declined in importance as its share of consumption dropped.23
The shift in consumption patterns occurred alongside changes in how goods and services are
produced in a more integrated, networked economy. The combination of materials, goods, and
services that are needed to provide a good or service, called a “production recipe,” has changed
dramatically since the early 20th century. These recipes depend less on agricultural and industrial
production and more on services, especially finance and professional and business services, than
in the past (Table 1). Professional and business services in particular stand out because of the rapid
growth of business-to-business services as firms have increasingly contracted with other firms for
accounting, legal, and other functions that were previously performed in-house.
The food production network is a prime example of these changes in the creation of goods and
services. Today, farmers (5%) and food manufacturers (7%) account for only a small fraction of the
economic value generated in food production. A much larger share comes from other sectors, such as
finance and other business services (19%), as well as the grocery stores and restaurants (28%) that join
forces to deliver food to the consumer.24
23 The shift in domestic consumption toward services is a theme in other studies. See Lawrence and Edwards, “US Employment
Deindustrialization,” 2013.
24 Carnevale and Rose, The Economy Goes to College, 2015.
TABLE 1. Finance and professional and business services industries make a more significant
contribution than manufacturing to the production of goods and services across the economy.
Examples of Goods and Services Consumed
within the US (Final Output Categories)
Industry Contribution to Production Food TransportationClothing &
Personal CareRecreation & Leisure
Finance & Other Business Services 19% 21% 13% 29%
Manufacturing 7% 16% 12% 12%
Other Industrial Sectors 20% 7% 12% 15%
Retail, Restaurants, & Personal Services 28% 15% 25% 25%
Imports 10% 23% 29% 12%
Wholesale & Transportation 11% 12% 9% 7%
Natural Resources 5% 6% - -
Total 100% 100% 100% 100%
Source: Carnevale and Rose, The Economy Goes to College, 2015.
Note: This chart includes selected examples of final output categories for goods and services consumed within the United States. Each industry’s contribution to production is based on an analysis of the chain of production for each good or service using 2007 data.

Upskilling and Downsizing in American Manufacturing 11
These increasingly complex production networks have shifted employment toward workers with
at least some postsecondary education. Business services and finance, which employ highly
educated workers, now play a pivotal role in most production networks. In fact, employment in
business services grew as a share of every production recipe between 1967 and 2007. Meanwhile,
manufacturing, with its comparatively less-educated workforce, declined as an employment share
of every production recipe.25
25 Carnevale and Rose, The Economy Goes to College, 2015.
FIGURE 2. Between 1947 and 2017, manufacturing dropped sharply as a share of all value
added in the economy, while the services industries greatly expanded their share.
Source: Georgetown University Center on Education and the Workforce analysis of data from US Department of Commerce, Bureau of Economic Analysis, Gross Domestic Product by Industry, 1947–2017.
Share of Consumption
1947 2017
Wholesale trade
Information
Educational services, healthcare, and social assistance
Professional and business services
Finance, insurance, real estate, rental, and leasing
Arts, entertainment, recreation, accommodation, and food services
Construction
Utilities
Mining
Other services, except government
Transportation and warehousing
Retail trade
Agriculture, forestry, fishing, and hunting
Manufacturing 25%
8%
9%
6%
3%
2%
6%
1%
4%
3%
3%
2%
3%
10%
12%
1%
6%
3%
2%
2%
6%
2%
4%
4%
5%
8%
12%
21%
Upskilling and Downsizing in American Manufacturing12
Thus, the upskilling of America’s workforce is largely due to changes in production. As much as 80
percent of the upskilling in the economy since 1967 is the result of new production recipes, while the
remaining 20 percent is due to broad shifts in consumer spending.26
As a result of these changes in consumption and production patterns, manufacturing yielded its role
as the leading American industry to services in the second half of the 20th century. Between 1947
and 2017, manufacturing fell from 25 percent to 12 percent of all value added in the economy, while
professional and business services jumped from just 3 percent to 12 percent of value added, and
finance rose from 10 percent to 21 percent. Manufacturing had lost its position as the mainstay of the
American economy (Figure 2).27
Manufacturing’s evolution is tightly linked to automation, globalization, and the growth of a networked economy.
Three trends have rearranged the economic landscape, creating a more technology-driven,
networked, and globally integrated economy. Each of these trends was a double-edged sword,
supporting the manufacturing industry’s evolution while contributing to employment decline.
Automation. The introduction of computer-based technology throughout the economy
allowed employers to automate repetitive tasks and have greater flexibility in meeting
consumer needs.28 The spread of industrial robots, which were first used in factories in
the early 1960s, also led to productivity gains.29 The industry began to use robots more
intensively as their cost dropped by at least half between 1990 and 2005.30 As a result, smaller
production teams and fewer workers were needed on the factory floor. About three manufacturing
jobs were lost for every additional industrial robot.31 Overall, estimates suggest that on the high end,
as much as 88 percent of the decline in manufacturing jobs could be attributed to technology-driven
productivity growth.32
26 Carnevale and Rose, The Economy Goes to College, 2015.
27 Carnevale and Rose, The Economy Goes to College, 2015. Analysis of input-output data compiled by the US Bureau of
Economic Analysis shows that the value added of manufacturing dropped and was, in essence, replaced by increased value
added from services industries.
28 Carnevale and Rose, The Economy Goes to College, 2015.
29 National Academies of Sciences, Engineering, and Medicine, Information Technology and the U.S. Workforce, 2017. The first
industrial robot was used in automotive manufacturing in 1961.
30 Graetz and Michaels, “Robots at Work,” 2015.
31 Acemoglu and Restrepo, “Robots and Jobs,” 2017. This report notes that about 80 percent of the industrial robots in the
United States are deployed in manufacturing. It is estimated that each additional robot costs about six jobs in the local
economy; within manufacturing and other robot-intensive industries, adding one more robot is estimated to cost about three
jobs. There is also evidence that technological change is particularly rapid and pronounced during recessions. See Hershbein
and Kahn, “Do Recessions Accelerate Routine-Biased Technological Change?,” 2017.
32 Hicks and Devaraj, The Myth and the Reality of Manufacturing in America, 2017. Some researchers have pointed to the
disproportionate influence of the computer and electronic products sector on overall manufacturing output growth
and productivity change starting in the 1980s. See Houseman, “Understanding the Decline of U.S. Manufacturing
Employment,” 2018.

Upskilling and Downsizing in American Manufacturing 13
Increased investment in technology is linked not only to employment decline, but also to increased
demand for workers with higher skill levels. As each wave of technological advances has automated
repetitive tasks, workers have been expected to take on more non-repetitive tasks and acquire the
technical skills to deploy new technology. In short, they must have broader and deeper competencies.33
The most recent wave of innovation also is ratcheting up skill demands. Technological advances
such as 3D printing, computer modeling and simulation, and advanced robotics are improving the
manufacturing production process and facilitating the generation of new products. Companies that
apply these technologies, which are often associated with advanced manufacturing, make substantial
research and development (R&D) investments and hire highly educated workers, such as engineers,
scientists, and computer experts.34
Networked economy. Another trend that has influenced manufacturing is the growth
of a more integrated, networked economy. In the industrial economy, many firms were
organized as vast hierarchies and managed from the top down. This organizational format
gradually gave way to the production or service delivery network, which integrates firms
performing different functions to generate economic value. Manufacturing firms, like other businesses,
have formed complex production networks that knit together suppliers and other firms across the
globe. Manufacturers also are increasingly dependent on finance and business services firms to
provide accounting, legal, and other specialized services instead of providing them in-house.35 The
share of workers who perform professional and business services-related work within manufacturing
has declined, while the share of those workers employed in services industries has climbed.36 This
growth in domestic outsourcing alone can explain about 14 percent of the rise in services employment
and 16 percent of the decline in manufacturing employment since 1947.37
As networks became more prevalent, firms adopted new ways of organizing work that required higher
levels of skill from their employees. Front-office workers with business, logistics, and financial skills
were needed to manage far-flung production networks. In addition, starting in the 1980s, firms began
to reengineer their workforces to streamline top-down management structures and to push decision-
making authority to individual workers or self-managed teams.38 In some cases, workers were
expected to perform a greater variety of tasks or rotate among different positions.39 These new ways
of organizing work put a premium on cross-cutting skills, especially the ability to process information,
solve problems, communicate effectively, and perform as a team.
33 Carnevale et al., Three Educational Pathways to Good Jobs, 2018. In addition, studies of technological adoption at the firm
level have provided evidence of employment reductions accompanied by skill upgrading, which differs depending on the type
of technology deployed. See Siegel, Skill-Biased Technological Change, 1999.
34 Muro et al., “America’s Advanced Industries,” 2015.
35 Manyika et al., Manufacturing the Future, 2012.
36 Berlingieri, “Outsourcing and the Rise in Services,” 2014
37 Berlingieri, “Outsourcing and the Rise in Services,” 2014.
38 Caroli and Van Reenen, “Skill-Biased Organizational Change?,” 2001. Production technologies disrupt the work environment,
leading to a reallocation of tasks. See Siegel, Skill-Biased Technological Change, 1999.
39 Piva et al., “The Skill Bias Effect of Technological and Organizational Change,” 2005.

Upskilling and Downsizing in American Manufacturing14
Globalization. Increased trade and heightened international competition also had an
outsize influence on the manufacturing industry.40 In the post–World War II economy,
manufacturing firms sold their products primarily to a large and growing US market. Since
the 1960s, international trade has more than tripled as a share of GDP, rising from about
10 percent to almost one-third of the economy.41 While trade has expanded markets and provided
consumers with greater access to affordable goods, it has taken a toll on manufacturing workers at
home. Increased foreign trade and offshoring are associated with steep manufacturing job losses,
especially in the years since 2000 when US trade relations with China improved. Nearly one-
quarter of the manufacturing employment decline between 1990 and 2007 came from increased
competition with China.42 The steep decline in the number of US manufacturing establishments,
which dropped by 61,000 between 2000 and 2016, also coincided with China’s entry in 2001 into
the World Trade Organization.43
Manufacturing employment has declined as overall output and productivity have risen.
The combined effect of these three trends was ultimately bad news for manufacturing workers. While
the number of manufacturing jobs in the post–World War II economy increased until 1979, it began
declining in the 1980s. The overall level of employment recovered somewhat during the expansion of
the 1990s before dropping sharply after 2000 and again during the Great Recession (Figure 3).
In 1979, at the height of manufacturing employment, each worker added $293,000 to manufacturing
output; by 2017, this contribution had increased to $485,000 per worker. During this period,
manufacturing employment also declined as a share of the American workforce, dropping from
22 percent in 1979 to 9 percent in 2017.44 This is the inescapable paradox of manufacturing: both
industrial production and total output have grown and the industry has prospered, even as the
workforce has declined and in some regions nearly disappeared (Figure 4).
In addition to output and employment, one important indicator of any industry’s overall contribution
to the economy is the number of jobs generated for workers outside the industry. For example,
jobs are generated in firms that provide raw and intermediate materials, products, and services to
40 Charles et al., “The Transformation of Manufacturing,” 2018. The authors argue that trade and technology investments are
interrelated. Some researchers, too, have noted the difficulty in separating the effects of trade and technology as increased
foreign competition and offshoring of certain stages of production can increase adoption of automation. See Houseman,
“Understanding the Decline of U.S. Manufacturing Employment,” 2018.
41 Carnevale and Rose, The Economy Goes to College, 2015.
42 Autor et al., “The China Syndrome,” 2013.
43 Georgetown University Center on Education and the Workforce analysis of US Bureau of Labor Statistics, Quarterly Census of
Employment and Wages data on manufacturing establishments.
44 Georgetown University Center on Education and the Workforce analysis of US Department of Commerce, Bureau of
Economic Analysis data (real output per worker measured in 2017 dollars). Output growth reflects the increasing volume of
production as well as official adjustments for improved product quality.

Upskilling and Downsizing in American Manufacturing 15
FIGURE 3. The number of manufacturing jobs has dropped since 1979, but the industry’s
share of US employment has been in steady decline since the 1950s.
Source: Georgetown University Center on Education and the Workforce analysis of MANEMP and PAYEMS data from FRED, Federal Reserve Economic Data, Federal Reserve Bank of St. Louis.
Nu
mb
er
of
Job
s (in
mill
ion
s) Sh
are o
f Em
plo
yme
nt
20
15
10
5
01939 1952 1965 1978 1991 2004 2017
Manufacturing Employment
Dec 1943
Dec 2017
Jun 1979
Dec 2017
39%
9%
19.6 MILLION
12.6 MILLION
Employment Share
40
30
20
10
0
FIGURE 4. Manufacturing employment has fallen even as output has grown since 1991.
Source: Georgetown University Center on Education and the Workforce analysis of MANEMP, OUTMS, and PRS30006163 data from FRED, Federal Reserve Economic Data, Federal Reserve Bank of St. Louis.
Pe
rce
nt
Ch
ang
e S
inc
e 1
99
1
140
120
100
80
60
40
20
0
-20
-40
-601991 1994 1997 2000 2003 2006 2009 2012 2015
Output Output per worker Employment

Upskilling and Downsizing in American Manufacturing16
manufacturers. This indirect employment effect, sometimes called the employment multiplier,45 is
often touted as a sign of the industry’s economic weight. Notably, manufacturing does not have the
most robust employment multiplier: both utilities and real estate generate more indirect jobs than
manufacturers of durable goods.46 Jobs also are generated when workers spend their paychecks
at the grocery store, on services like childcare, or on consumer goods. The industry’s shrinking
presence in many states suggests that manufacturing jobs are creating smaller ripples in the
economy than they have in the past.
Because of structural change, there is a new balance between production and non-production jobs in manufacturing.
As overall manufacturing employment levels have fallen, employment has shifted away from the
assembly line and factory floor and toward tasks not directly involved in production. While production
workers form the core of the workforce, the industry also includes workers who perform research and
development, design, sales and marketing, and customer support functions. These non-production
workers, typified by managers, sales representatives, and engineers, fill front-office positions that
are not directly involved in making things. As the nature of manufacturing work has changed,
manufacturing jobs increasingly have gone to those creating, designing, and selling things as well as
those working on the factory floor. This shift also reflects greater use of technology and technical
expertise in all phases of the production process, often described as advanced manufacturing.
During the 1970s, manufacturing work was evenly divided between production workers and non-
production workers. By 2016, two out of five workers (40%) in manufacturing were engaged in direct
production and three out of five (60%) held non-production jobs.47 The most dramatic increase was for
management, business, and financial operations workers, who tripled their share of industry employment
from 6 percent in 1970 to 18 percent in 2016. Science, technology, engineering, and mathematics
workers, including computer specialists, also increased their share of industry jobs, from 8 percent to 13
percent, during the period. Manufacturing work has, in effect, become more concentrated in high-skill,
white-collar jobs and less concentrated in blue-collar production jobs (Figure 5).
This loss of production capacity has played out in different ways across manufacturing sectors. In
2016 the share of production workers ranged from 55 percent in textiles and apparel to 41 percent
in transportation equipment to 22 percent in computers and electronic products. Sectors that invest
heavily in research and development have retained non-production functions—such as research,
product development, design, and marketing—in the United States while shifting production
45 This multiplier is usually computed using national input-output tables. The Bureau of Labor Statistics cautions that these tables
should be interpreted with care, as they combine domestic and imported inputs and therefore risk overstating the impact of
domestic inputs.
46 For every 100 jobs in the industry, manufacturers of durable goods generate 289 jobs at supplier firms outside the industry, far
fewer than utilities (515 non-industry jobs per 100 industry jobs) and real estate (397 non-industry jobs per 100 industry jobs).
Manufacturers of nondurable goods generate fewer indirect jobs at supplier firms (185 non-industry jobs per 100 industry
jobs) than information (252 non-industry jobs per 100 industry jobs) and mining (224 non-industry jobs per 100 industry jobs).
See Bivens, “Updated Employment Multipliers for the US Economy,” 2019.
47 Levinson comes to the same conclusion in “Job Creation in the Manufacturing Revival,” 2017.

Upskilling and Downsizing in American Manufacturing 17
overseas.48 For example, Apple has concentrated highly skilled management and design work in the
United States, but has shifted production largely to China through the contract manufacturer Foxconn.
Other sectors, such as consumer goods, have simply reduced their production capacity at home.49
The result of structural change in manufacturing, as in the rest of the economy, has been a new set
of higher workforce requirements and greater demand for educated workers. The shift away from
manufacturing and goods-producing industries toward services industries has ratcheted up the need
for workers with some level of postsecondary education and training.50 Within manufacturing, the
growth of complex production networks, the shift away from production jobs, and the spread of
computer-based technology all put a premium on the knowledge and skills expected of workers with
postsecondary education.
48 Manyika et al., Manufacturing the Future, 2012.
49 Manyika et al., Manufacturing the Future, 2012.
50 Carnevale and Rose, The Economy Goes to College, 2015.
Source: Georgetown University Center on Education and the Workforce analysis of data from US Census Bureau, Current Population Survey March Supplement (Annual Social and Economic Supplement), 1971–2017.
FIGURE 5. Manufacturing work has become more concentrated in front-office, non-
production jobs.
1970
Non-production workers
52%
Production workers
48%
2016
Non-production workers
60%
Production workers
40%

PART II
Upskilling and the Three Pathways into the Manufacturing WorkforceAt the peak of the industrial economy, young people could leave high school, even without earning
a diploma, and land factory jobs that paid enough to support a middle-class lifestyle. Workers with a
high school diploma or less can still find jobs in manufacturing, but times have changed. Workers with
postsecondary education, especially those with an associate’s degree or a bachelor’s degree, have
increased their share of manufacturing jobs, even in blue-collar occupations such as production.
Upskilling—the steady rise in educational attainment throughout the workforce—has occurred across
the economy as employers have increased their entry-level and workforce requirements in the face of
a harsher competitive environment. Manufacturing was one of the first industries to adapt to the new
competitive landscape. Technology advances, together with innovations in manufacturing production
process and product development, have reinforced the demand for educated workers.
Workers with postsecondary education now outnumber workers with a high school diploma or less in manufacturing.
High school used to be the primary pathway to manufacturing jobs. In 1970, 79 percent of
manufacturing jobs went to workers with a high school diploma or less, with the largest share of jobs
(43%) held by high school dropouts. Starting in the 1970s, high school dropouts began a long and
steady decline as a share of the workforce, dropping to 9 percent in 2016. Workers with a high school
diploma continued to represent more than a third of the manufacturing workforce, but their share
declined starting in 1989 (Figure 6).
In 2007, for the first time, workers on the high school pathway made up less than half of the manufacturing
workforce. In that year, workers with some level of postsecondary education became the new majority.
As the high school pathway to manufacturing jobs declined, the middle-skills and bachelor’s degree
pathways became more prominent.51 In 1970, the middle-skills pathway (populated by workers with
51 Skill upgrading in manufacturing is a long-term trend that began in the early 20th century, if not earlier. A recent occupational
analysis reveals that within the industry, the share of white-collar, more-educated manufacturing workers has been growing
and the share of less-skilled laborers has been shrinking since at least 1920. There is evidence that growth in white-collar
employment in manufacturing was underway as early as the 19th century. See Katz and Margo, “Technical Change and the
Relative Demand for Skilled Labor,” 2013.

Upskilling and Downsizing in American Manufacturing 19
more than a high school education but less than a bachelor’s degree) accounted for only 12 percent
of jobs, and the bachelor’s degree pathway (for those with a bachelor’s degree or more) amounted to
just 8 percent. The middle-skills pathway’s share of the manufacturing workforce doubled between
1970 and 2000; since 2000, it has held steady at about a quarter (26%) of the industry’s workforce.
The bachelor’s degree pathway became more important, representing almost a third of the workforce
(30%) by 2016. As of 2016, however, workers with a high school diploma or less still made up the
largest share of the manufacturing workforce, at about 43 percent.
These trends took hold as the total number of manufacturing jobs fell in recent decades. Workers with
a high school diploma or less experienced the largest decline, dropping from 10.8 million in 1991 to 6
million workers in 2016, a sharp 45 percent decrease.52 Employment of workers with middle skills fell
by 500,000, or 12.5 percent—driven entirely by a decline in the number of workers with some college
but no degree. Workers with an associate’s degree, in fact, gained about 400,000 jobs, or 36 percent,
while those with a bachelor’s degree gained about 800,000 jobs, or 24 percent.
52 From this point forward, we analyze trends since 1991 to allow for greater detail on the middle-skills pathway, which includes
those with some college as well as those with associate’s degrees.
FIGURE 6. High school dropouts had the largest share of manufacturing jobs in 1970, but
the smallest share by 2016.
Source: Georgetown University Center on Education and the Workforce analysis of data from US Census Bureau, Current Population Survey March Supplement, 1971–2017.
Sh
are
of
Man
ufa
ctu
rin
g J
ob
s
50%
40%
30%
20%
10%
01970 1976 1982 1988 1994 2000 2006 2012
High school dropout
High school diploma
Some college/associate’s degree
Bachelor’s degree or higher

Upskilling and Downsizing in American Manufacturing20
There are other signs of rising education and skill requirements
among manufacturing workers.53 As the use of computers
and internet technology increased in the workplace, the need
for digital skills grew across most occupations between 2002
and 2016. Production occupations central to manufacturing
have undergone upskilling due to the ongoing spread
of information technology and the growing reliance on
computers in the workplace.54
Workers with postsecondary education have taken a larger share of both production and non-production jobs.
Upskilling in manufacturing is not just about the growth of
jobs for white-collar workers with bachelor’s degrees: it
also has affected production workers on the factory floor. In
the early 1990s, workers with a high school diploma or less
filled almost 80 percent of production jobs, which include
positions for assembly workers, machinists, and production
supervisors. By 2016, they still held a majority of those jobs,
but their share had fallen sharply.
As the number of production workers with a high
school diploma or less dropped, workers with some
postsecondary education, especially those with college
degrees, filled a larger share of production jobs. The
number of production workers with associate’s degrees
more than doubled between 1991 and 2016, rising by more than 300,000 workers. The number
of production workers with bachelor’s degrees also increased by about 200,000 workers, or 67
percent. More than one out of three production jobs (36%) went to workers with middle skills or
bachelor’s degrees by 2016 (Figure 7).
Upskilling within production jobs is likely the result of rising computer and other skill requirements
that affect most occupations, as well as distinct trends within manufacturing. Analysis of online
job postings suggests that production jobs have become segmented into general jobs with fewer
requirements and highly skilled jobs, such as those held by Computer Numerical Control (CNC)
programmers and production supervisors.55
53 Georgetown University Center on Education and the Workforce analysis has shown that since the 1990s, new manufacturing
firms that have been in business for one year or less have cultivated a more educated workforce, with a rising proportion of
workers who have some postsecondary education.
54 Muro et al., Digitalization and the American Workforce, 2017.
55 Burning Glass Technologies, Job Market Intelligence, 2014.
THE THREE EDUCATIONAL
PATHWAYS
The high school pathway
includes workers with a high
school diploma or less.
The middle-skills pathway
includes workers with more
than a high school diploma
but less than a bachelor’s
degree. This includes people
with associate’s degrees,
postsecondary certificates, and
some college but no degree.
The bachelor’s degree
pathway includes workers with
bachelor’s degrees, master’s
degrees, professional degrees,
and doctoral degrees.

Upskilling and Downsizing in American Manufacturing 21
Even more than assembly and production jobs, jobs for engineers, managers, and other non-
production workers have increasingly gone to workers with more education. Workers with a high
school diploma or less, who once held the largest share of non-production jobs, have lost the largest
number of positions since 1991. They now hold 30 percent of these jobs, compared to 45 percent in
1991. Workers with bachelor’s degrees filled the largest share of non-production jobs (44%) in 2016,
up sharply from less than 30 percent in 1991 (Figure 8). Middle-skills workers held slightly more than a
quarter of these jobs in 2016, with the only gains achieved by workers with associate’s degrees.
Source: Georgetown University Center on Education and the Workforce analysis of data from US Census Bureau, Current Population Survey March Supplement, 1992–2017.
Note: Percentages may not total 100 due to rounding.
FIGURE 8. Workers with bachelor’s degrees have greatly increased their share of non-
production jobs.
High school diploma or less
Some college/associate’s degree
Bachelor’s degree or higher
1991
2016 26%30% 44%
45% 27% 29%
Source: Georgetown University Center on Education and the Workforce analysis of data from US Census Bureau, Current Population Survey March Supplement, 1992–2017.
FIGURE 7. Workers with middle skills and bachelor’s degrees increased as a share of
production workers by 2016.
High school diploma or less
Some college/associate’s degree
Bachelor’s degree or higher
1991
2016
79%
64% 27%
17% 4%
9%

Upskilling and Downsizing in American Manufacturing22
The manufacturing workforce, once dominated by workers with a high school diploma or less, now employs workers with a diverse set of credentials and skills.
Because of structural change and upskilling, the manufacturing workplace now provides job
opportunities for workers on each of three pathways. Workers with a high school diploma or less, who
make up about 43 percent of the workforce, are clustered in production and other blue-collar jobs.
Middle-skills workers, who make up slightly more than a quarter of the workforce (26%), are found in
production jobs, but they also fill sales, supervisory, and management roles. Bachelor’s degree holders
represent nearly a third (30%) of the workforce and are employed primarily in non-production jobs
that go to engineers, managers, accountants, and sales representatives.56
High school pathway: Workers with a high school diploma or less hold a solid majority (63%) of
production jobs, which still form the core of the manufacturing workforce. Production jobs include
assembly workers, welders, machinists, and production supervisors. Workers with a high school
diploma or less also fill 71 percent of transportation-related jobs (Figure 9).
56 The shares of workers on each pathway do not sum to 100 percent due to rounding.
FIGURE 9. Workers with a high school diploma or less hold the majority of production jobs,
while workers with bachelor’s degrees hold most management, engineering, and sales jobs.
Source: Georgetown University Center on Education and the Workforce analysis of US Census Bureau, American Community Survey pooled data, 2014–2016.
Note: Percentages may not sum to 100 due to rounding. See Appendix B for a list of detailed occupations commonly held by workers on each pathway. Estimates of occupational employment based on the American Community Survey differ slightly from those calculated from the Current Population Survey.
Architecture and engineering occupations
8% 66%25%
Management, business, science, and arts occupations
12% 64%24%
Installation, maintenance, and repair occupations
49% 7%44%
Office and administrative support occupations
40% 20%40%
Production occupations 63% 7%30%
Sales and related occupations
18% 53%29%
Transportation and material moving occupations
71% 4%25%
High school diploma or less
Some college/associate’s degree
Bachelor’s degree or higher

Upskilling and Downsizing in American Manufacturing 23
Middle-skills pathway: Middle-skills workers hold nearly one-third (30%) of production jobs and more
than two out of five (44%) installation, maintenance, and repair positions. These workers also are more
likely (24%) than workers on the high school pathway (12%) to hold management jobs.
Bachelor’s degree pathway: Workers with a bachelor’s degree or more hold nearly two-thirds (66%)
of engineering jobs and more than three out of five (64%) management positions. They also fill sales,
software development, and financial jobs. Workers on the bachelor’s degree pathway are less likely
(7%) than workers on the middle-skills and high school pathways to hold production jobs.
Manufacturing is diverse and its various sectors are also divided, to a lesser extent, by education.
Workers on each pathway are employed in large numbers in motor vehicles, machinery, furniture,
and printing. Workers on the high school pathway are more concentrated in animal slaughtering
and processing and in metals manufacturing. Middle-skills workers and workers with bachelor’s
degrees are clustered in electronic component, aircraft, medical equipment, and industrial chemical
manufacturing. The pharmaceutical industry and instruments manufacturing in particular employ large
numbers of workers with bachelor’s degrees.

Upskilling and Downsizing in American Manufacturing24
PART III
The Changing Structure of Good Jobs in ManufacturingDownsizing and upskilling have changed not only the types of job opportunities available in
manufacturing, but also the structure of “good jobs”: those that start at $35,000 per year with a
median of $56,000 per year for workers without a bachelor’s degree.57 These jobs are still available for
workers without a bachelor’s degree, but their numbers have declined from 7.2 million in 1991 to 4.8
million in 2016. More good manufacturing jobs are now going to those with more education.
The trends in manufacturing in many ways reflect those occurring across the economy, where good
jobs for workers with a high school diploma or less still exist, but have declined sharply. Good jobs for
middle-skills workers have grown since 1991, especially outside manufacturing, and good jobs for
those with bachelor’s degrees have experienced explosive growth.
Good jobs in manufacturing have declined, and workers with a high school diploma or less have borne the brunt of the reductions.
The collapse of manufacturing employment has taken a heavy toll on good jobs for workers without
a bachelor’s degree. In 1991 manufacturing accounted for 27 percent of all good jobs for workers
without a bachelor’s degree. By 2016 its share had dropped to 16 percent. Of the 2.8 million good
jobs lost by workers without a bachelor’s degree between 1991 and 2016, nearly all (2.4 million) were
in manufacturing (Figure 10). These job losses were widespread, striking 38 states in every region of
the country. The largest losses in absolute terms were in California, Illinois, Ohio, and New York.
Among workers without a bachelor’s degree, those with a high school diploma or less absorbed the
heaviest losses. The number of good jobs for those with no more than a high school diploma fell
from 4.5 million to 2.5 million (44%) between 1991 and 2016. The decline was broad-based: good
production jobs for workers with a high school diploma or less fell by 38 percent, while good non-
production jobs dropped by 50 percent. Meanwhile, the number of good jobs for workers with middle
skills dropped from 2.7 million to 2.3 million, with a decline in the number of workers with some
college but no degree and an increase in the number of workers with associate’s degrees. Workers
with bachelor’s degrees bucked the trend, increasing from 2.8 million to 3.6 million (Figure 11).
57 For workers with a bachelor’s degree, the median wage income is $75,000 per year.

Upskilling and Downsizing in American Manufacturing 25
FIGURE 11. Manufacturing employment decline took the heaviest toll on good jobs for
workers with a high school diploma or less.
Source: Georgetown University Center on Education and the Workforce analysis of data from US Census Bureau, Current Population Survey March Supplement, 1992–2017.
Ch
ang
e in
th
e N
um
be
r o
f G
oo
d J
ob
s S
inc
e 1
99
1
1,000,000
-1,000,000
-1,500,000
-2,000,000
-2,500,000
500,000
-500,000
0
1991 1994 1997 2000 2003 2006 2009 2012 2015
Source: Georgetown University Center on Education and the Workforce analysis of data from US Census Bureau, Current Population Survey March Supplement, 1992–2017.
FIGURE 10. Manufacturing accounts for most losses of good jobs for workers without a
bachelor’s degree since 1991.
High school diploma or less
Some college/associate’s degree
Bachelor’s degree or higher
Non-bachelor’s degree good jobs losses
Manufacturing good jobs losses
-2,391,000
-2,754,000

Upskilling and Downsizing in American Manufacturing26
The sheer size of the employment decline has changed the calculus of economic opportunity.
Because of structural change, there are simply fewer good jobs available in manufacturing. In fact, the
chances of a worker with a high school diploma or less finding a good job in manufacturing are half as
high as they were in 1991, representing the sharpest decrease among blue-collar industries (Figure 12).
Losses of good jobs due to structural change in manufacturing have varied by race or ethnicity and sex.
Manufacturing employment losses were concentrated among White and Black workers without a
bachelor’s degree.58 Whites, who hold the largest share of industry jobs, lost about 2.6 million good
jobs for workers without a bachelor’s degree, or 43 percent, between 1991 and 2016. Blacks lost about
200,000 good jobs, or about 30 percent (Figure 13)—a loss nearly as substantial as the percentage
decline experienced by Whites. Downsizing had profound consequences for Whites and Blacks,
58 In this report, we use the term Black to refer to people who identify as Black or African American and the term Latino to
refer to people who identify as Hispanic or Latino. We use single terms for different racial and ethnic groups—White, Black,
and Latino—to alleviate ambiguity and enhance clarity. In charts and tables, we use White, Black/African American, and
Hispanic/Latino.
FIGURE 12. For workers with a high school diploma or less, the odds of finding a good
manufacturing job have dropped sharply since 1991.
Source: Georgetown University Center on Education and the Workforce analysis of data from US Census Bureau, Current Population Survey March Supplement, 1992–2017.
Note: This chart shows the weighted prevalence of good jobs for workers with a high school diploma or less. The likelihood of having a good manufacturing job is adjusted according to the size of the workforce with a high school diploma or less.
Pe
rce
nt
wit
h a
Go
od
Jo
b
4%
2%
3%
1%
01991 20011996 2006 2011 2016
Construction Manufacturing
Transportation, communications, and utilities
Agriculture and mining Wholesale and retail trade

Upskilling and Downsizing in American Manufacturing 27
ranging from economic effects, such as lower employment rates and lower wages, to a host of
adverse effects on housing, family formation, and overall poverty rates.59
Latinos followed a different path. As their share of the manufacturing workforce nearly doubled
from 9 percent to 16 percent between 1991 and 2016, Latinos without a bachelor’s degree gained
about 200,000 good jobs, an increase of more than 50 percent. Other racial or ethnic groups also
experienced a gain of 100,000 good jobs, or about 100 percent growth.
There are also differences in how men and women experienced the decline of good jobs. Men, who
have always dominated manufacturing jobs, suffered the largest decline in good jobs for workers without
a bachelor’s degree. The number of good jobs held by men fell from 5.8 million in 1991 to 4 million in
2016, a loss of nearly 2 million, or 31 percent. Women lost fewer good manufacturing jobs, as good
jobs held by women dropped from 1.4 million to 800,000, but they experienced a larger proportionate
decline of 43 percent. (For more on good job losses by race or ethnicity and sex, see Appendix C.)
The overall decline in good jobs had lasting consequences, especially for unemployed workers and
their communities. Workers who have lost manufacturing jobs as a result of plant closings, mass
layoffs, or a shift in demand have historically made up a disproportionate share of all displaced
59 Gould, “Torn Apart?,” 2018; Wilcox et al., “Black Men Making It in America,” 2018.
FIGURE 13. Whites and Blacks lost good manufacturing jobs for workers without a bachelor’s
degree, while Latinos made gains.
Source: Georgetown University Center on Education and the Workforce analysis of data from US Census Bureau, Current Population Survey March Supplement, 1992–2017.
Note: Not shown are other racial or ethnic groups, which experienced a gain of 100,000 good jobs.
Ch
ang
e S
inc
e 1
99
1
60%
40%
0%
-20%
-40%
-60%
20%
1991 20011996 2006 2011 2016
Black/African American Hispanic/LatinoWhite

Upskilling and Downsizing in American Manufacturing28
workers.60 And laid-off manufacturing workers without postsecondary education have faced a
particularly steep uphill climb in the labor market. Compared to more educated workers, they
generally are less likely to find a new job quickly after a job loss. In 2016, 59 percent of displaced
workers with no more than a high school diploma were reemployed, compared to 63 percent of those
with middle skills and 77 percent of those with a bachelor’s degree or more.61 (For more on displaced
workers, see Appendix D.)
The structure of good jobs has shifted in favor of those with postsecondary education.
Downsizing and upskilling upended the structure of good jobs within manufacturing. Before 2005,
workers with a high school diploma or less held the largest number of good jobs in manufacturing. But
as overall employment dropped, manufacturing workers with a bachelor’s degree claimed a growing
60 Trade Adjustment Assistance is the primary federal program that has provided income support, employment services, and
training to workers who have lost jobs as a result of import competition. Recent evaluations have found that this program
has mixed results for workers. For background on this program, see Stettner, Mounting a Response to Technological
Unemployment, 2018.
61 Georgetown University Center on Education and the Workforce analysis of data from US Census Bureau, Current Population
Survey Displaced Worker Supplement, 2002–2016.
FIGURE 14. Workers with a high school diploma or less, who at one time held the largest
number of good manufacturing jobs, lost 2 million jobs between 1991 and 2016.
Source: Georgetown University Center on Education and the Workforce analysis of data from US Census Bureau, Current Population Survey March Supplement, 1992–2017.
Nu
mb
er
of
Go
od
Jo
bs
(in M
illio
ns)
5
3
4
2
1
01991 20011996 2006 2011 2016
High school diploma or less
Some college/associate’s degree
Bachelor’s degree or higher

Upskilling and Downsizing in American Manufacturing 29
number of good jobs, becoming the largest group of good job holders by 2007. The number of good
jobs going to those with bachelor’s degrees increased from 2.8 million in 1991 to 3.6 million in 2016,
or 29 percent (Figure 14). Nearly all of this increase was in good non-production jobs, such as those
held by managers, business analysts, software developers, and industrial engineers.
The picture for middle-skills good jobs is more complex. Workers with associate’s degrees stand out as
the only group of workers without a bachelor’s degree to experience gains in good jobs, with most of
this increase coming from production jobs, such as those held by production supervisors. The number
of workers with associate’s degrees who had good jobs climbed from 750,000 to nearly 1 million, or
about 30 percent (Figure 15).
Overall, however, good jobs for those with middle skills showed a slight decline, driven by job losses
among workers with some college, no degree. This decrease was mostly due to a drop in non-
production jobs, which can be explained by steep losses in office and administrative support jobs that
took place after 2000.
FIGURE 15. Workers with some college, no degree lost good jobs, while those with
associate’s degrees experienced gains.
Source: Georgetown University Center on Education and the Workforce analysis of data from US Census Bureau, Current Population Survey March Supplement, 1992–2017.
Nu
mb
er
of
Go
od
Jo
bs
(in M
illio
ns)
2.5
1.5
2.0
1.0
0.5
01991 20011996 2006 2011 2016
Some college Associate’s degree
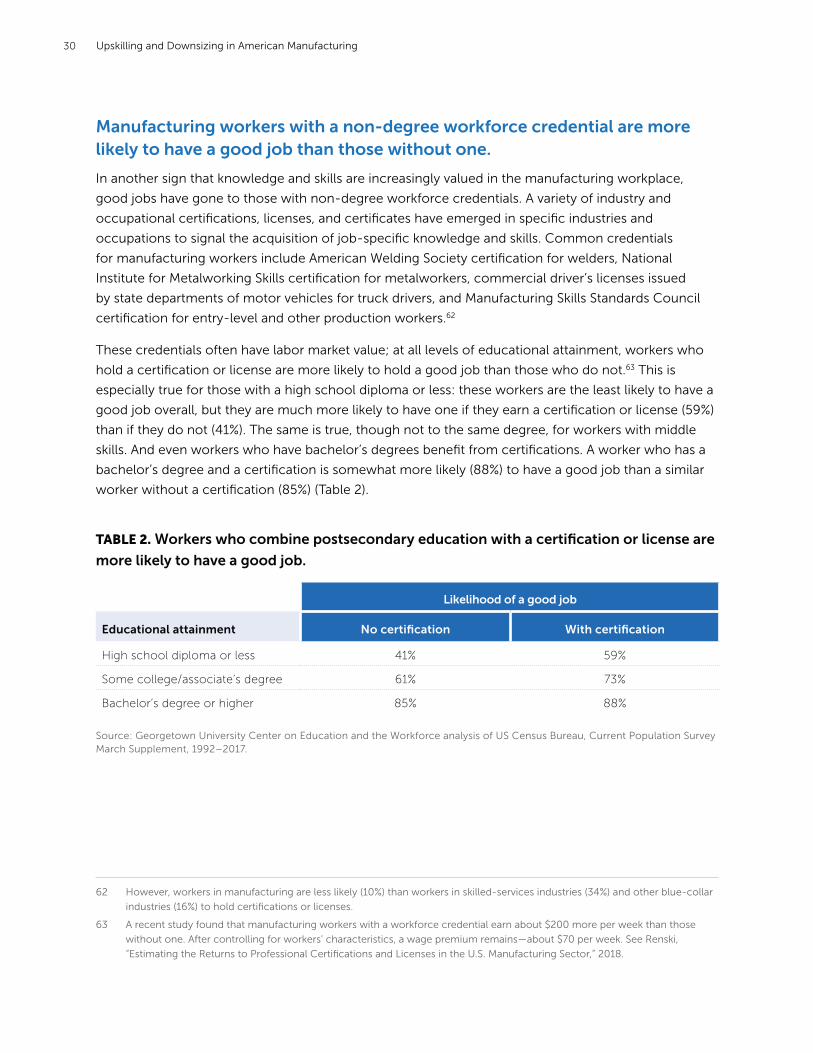
Upskilling and Downsizing in American Manufacturing30
Manufacturing workers with a non-degree workforce credential are more likely to have a good job than those without one.
In another sign that knowledge and skills are increasingly valued in the manufacturing workplace,
good jobs have gone to those with non-degree workforce credentials. A variety of industry and
occupational certifications, licenses, and certificates have emerged in specific industries and
occupations to signal the acquisition of job-specific knowledge and skills. Common credentials
for manufacturing workers include American Welding Society certification for welders, National
Institute for Metalworking Skills certification for metalworkers, commercial driver’s licenses issued
by state departments of motor vehicles for truck drivers, and Manufacturing Skills Standards Council
certification for entry-level and other production workers.62
These credentials often have labor market value; at all levels of educational attainment, workers who
hold a certification or license are more likely to hold a good job than those who do not.63 This is
especially true for those with a high school diploma or less: these workers are the least likely to have a
good job overall, but they are much more likely to have one if they earn a certification or license (59%)
than if they do not (41%). The same is true, though not to the same degree, for workers with middle
skills. And even workers who have bachelor’s degrees benefit from certifications. A worker who has a
bachelor’s degree and a certification is somewhat more likely (88%) to have a good job than a similar
worker without a certification (85%) (Table 2).
62 However, workers in manufacturing are less likely (10%) than workers in skilled-services industries (34%) and other blue-collar
industries (16%) to hold certifications or licenses.
63 A recent study found that manufacturing workers with a workforce credential earn about $200 more per week than those
without one. After controlling for workers’ characteristics, a wage premium remains—about $70 per week. See Renski,
“Estimating the Returns to Professional Certifications and Licenses in the U.S. Manufacturing Sector,” 2018.
TABLE 2. Workers who combine postsecondary education with a certification or license are
more likely to have a good job.
Likelihood of a good job
Educational attainment No certification With certification
High school diploma or less 41% 59%
Some college/associate’s degree 61% 73%
Bachelor’s degree or higher 85% 88%
Source: Georgetown University Center on Education and the Workforce analysis of US Census Bureau, Current Population Survey March Supplement, 1992–2017.

Upskilling and Downsizing in American Manufacturing 31
Manufacturing, despite its decline, is still a source of good jobs for workers without a bachelor’s degree.
Manufacturing has an enduring legacy as the preeminent source of good jobs available to workers
without a bachelor’s degree. In 2016, despite decades of employment decline, it still provided the largest
number of good jobs for workers without a bachelor’s degree, with 4.8 million, or 16 percent of all those
jobs. It is the top industry for good jobs for workers without a bachelor’s degree in 35 states (Figure 16).
Half of jobs in manufacturing for workers without a bachelor’s degree are good jobs—about the
same proportion as in 1991 (48%). But the pockets of opportunity vary within industry sectors and
occupations. The aircraft (71%), chemical (69%), paper (69%), and steel (63%) manufacturing sectors
offer the highest shares of good jobs. More than half of the jobs in the machinery (52%), machine
shops (52%), and motor vehicles (51%) sectors are good jobs.
The types of jobs that have the best odds of paying well vary for workers on each pathway. Production
jobs, such as production supervisor (63%) and machinist (55%), offer the best chances of good pay for
FIGURE 16. Manufacturing is the top industry for good jobs for workers without a
bachelor’s degree in 35 states.
Source: Georgetown University Center on Education and the Workforce analysis of US Census Bureau, American Community Survey pooled data, 2014–2016.
12–16% 17–19% 20–22% 25–32%
Share of a State’s Good Jobs That Are in Manufacturing

Upskilling and Downsizing in American Manufacturing32
those with a high school diploma or less. Workers with an
associate’s degree are most likely to be in a good job when
employed as a manager (84%), production supervisor (78%),
or engineering technician (78%). Bachelor’s degree-educated
workers have the best odds in high-skill positions such as
software developer (96%), mechanical engineer (96%), and
industrial engineer (95%).
At every education level, manufacturing workers earn more,
on average, than workers in skilled-services and other blue-
collar industries. This was true in the past, and it holds true
today. Manufacturing workers with a high school diploma or
less benefit from a large wage premium relative to workers in
skilled-services industries (35%), but the gap has narrowed as
manufacturing earnings have declined and those for skilled-
services jobs have risen. The wage advantage relative to
workers in other blue-collar industries is narrower (3%) than
the gap relative to skilled services.64
For middle-skills workers, the difference between
manufacturing wages and wages in other blue-collar and
skilled-services industries has consistently been more than
10 percent, with a larger gap relative to skilled services. For
workers with a bachelor’s degree, the manufacturing wage advantage has held steady in excess of 30
percent relative to wages in other industries (Figure 17).
While good jobs in manufacturing still exist for some workers, overall economic opportunity has shifted elsewhere in the economy.
Economic opportunity still exists for those who can get good manufacturing jobs, but the industry
has lost much of its luster, particularly for less-educated workers. Workers with a high school diploma
or less have lost their once-strong hold on good jobs, while workers with postsecondary education,
especially those with associate’s and bachelor’s degrees, have gained an increasing share of good jobs.
Workers who have a workforce credential that signals skill acquisition also are more likely to hold a
good job than those without such a credential.
The growth in good jobs has occurred mostly outside of manufacturing—in other blue-collar
industries, such as construction, and in skilled-services industries, such as health services (Figure 18).
Since 1991, good jobs in skilled-services industries grew by 4.5 million, while there has been a decline
of 500,000 good jobs in blue-collar industries.
64 Manufacturing ranks in the top five industries (out of 18 detailed industries) for overall median wages. It ranks in the top five for
workers with bachelor’s degrees, the top seven for those with some college or associate’s degrees, and the top 10 for those
with a high school diploma or less.
BLUE-COLLAR AND SKILLED-
SERVICES INDUSTRIES
Blue-collar industries include
manufacturing, transportation
and utilities, wholesale and
retail trade, natural resources,
and construction.
Skilled-services industries
include healthcare services,
education services, consulting
and business services, financial
services, government services,
leisure and hospitality services,
and personal services.

Upskilling and Downsizing in American Manufacturing 33
FIGURE 17. Manufacturing workers enjoy a wage premium regardless of education level.
Source: Georgetown University Center on Education and the Workforce analysis of data from US Census Bureau, Current Population Survey March Supplement, 1992–2017.
FIGURE 18. Between 1991 and 2016, good jobs for those without a bachelor’s degree
expanded in skilled-services industries, while those in blue-collar industries declined.
Source: Georgetown University Center on Education and the Workforce analysis of data from US Census Bureau, Current Population Survey March Supplement, 1992–2017.
Transportation, communications, and utilities
Agriculture and mining
Wholesale and retail trade
Construction
Manufacturing
Blue-collar change 4.5M
0.1M
0.3M
0.9M
1.4M
1.8M
$100,000
$90,000
$60,000
$80,000
$50,000
$70,000
$40,000
$30,000
$20,000
$10,000
01991 2016
Manufacturing Other blue-collar industries
High school diploma or less
Skilled-services industries
Some college/associate’s degree
Bachelor’s degree or higher
1991 2016 1991 2016
Educational services
Financial activities, real estate, professional, and management services
Health services
Administrative, leisure, food, and other services
Public administration
Skilled-services change-0.5M
-2.4M
-0.4M
0.3M
0.4M
1.5M
Blue-collar good jobs
Skilled-services good jobs

Upskilling and Downsizing in American Manufacturing34
CONCLUSION Manufacturing has begun to bounce back from the depths of the Great Recession. Industry output
has resumed its upward climb. Manufacturing employment has also begun to recover, increasing
by more than 1 million jobs since 2010, although it has not returned to pre-recession levels.65 But
does this signal a brighter future? Some industry experts, exuding a new spirit of optimism, foresee
a manufacturing resurgence in the United States, driven by reshoring of production capacity, rapid
innovation, and fresh government policies.66 This is expected to include a burst of manufacturing
employment as US-based factories resume production.
But an industry comeback, however welcome, would not lead to a dramatic return of the
manufacturing workforce. Firms are able to increase their output without adding large numbers of
workers. The industry now uses fewer workers and more equipment and technology to produce cars,
engines, chemicals, and other goods than it has in the past. Due in part to these shifts in production,
the industry’s labor share of output fell by about 20 percent between 2000 and 2015 while investment
in technology increased.67 As manufacturing has become less labor-intensive, especially in certain
sectors, the iconic large factory complex employing hundreds or thousands of workers has for the
most part disappeared as a fixture in the economic landscape.68
If the rapid technological change of recent years is any indicator, these trends could accelerate in the
future. Innovative uses of technology in the production process are prompting significant changes
in how products are designed and made. For example, engineers now use sophisticated computer
technology to model the design of products and supply chains and even to simulate the entire
production process before a factory is built or reconfigured. In addition, industrial robotics, which
are already widespread within certain manufacturing sectors, are likely to advance, allowing for more
highly automated processes and deployment of “collaborative” robots alongside workers.69
In this context, a massive rebound in employment would be a reversal of long-term technological
and economic trends that have substantial momentum. Projections suggest that manufacturing is
not expected to be a major job generator in the future. In fact, industry employment is expected to
decrease by 253,200 net jobs, or about 2 percent, during the next decade, while total employment in
the economy is expected to grow by 8 percent (Figure 19).70
65 Georgetown University Center on Education and the Workforce analysis of MANEMP, OUTMS, and PRS30006163 data from
FRED, Federal Reserve Economic Data, Federal Reserve Bank of St. Louis.
66 Ramaswamy et al., Making It in America, 2017.
67 Charles et al., “The Transformation of Manufacturing,” 2018.
68 See Levinson, “Job Creation in the Manufacturing Revival,” 2017, for evidence on the decline of large factories.
69 For a description of the industry transformation expected in the future, see Bianchi and Labory, Industrial Policy for the
Manufacturing Revolution, 2018.
70 Carnevale et al., Job Projections and Education Requirements, 2017–2027, forthcoming. While manufacturing employment
is expected to drop, the industry will still be hiring due to the need to replace manufacturing workers who retire or leave the
workforce. Historically, job openings due to replacement needs have been particularly important for production and other
blue-collar occupations.

Upskilling and Downsizing in American Manufacturing 35
Not surprisingly, there will also be fewer good jobs in manufacturing. Good manufacturing jobs for
workers with a high school diploma or less are expected to decline from 2.5 million in 2017 to 2.3
million in 2027. Workers with bachelor’s degrees also will have 200,000 fewer good jobs. Workers with
middle skills, though, are expected to gain about 300,000 good jobs by 2027.71
After decades of industry transformation, the manufacturing workplace has a new look that bears
little resemblance to that of the 1970s. Manufacturing is not just about making things. Economic
value is increasingly generated through sophisticated research and development (R&D), product
and production design, marketing and sales, and customer support.72 Production itself is being
reshaped through new techniques, such as 3-D printing, robotics, and computer-based modeling and
simulation.73 These trends, often associated with advanced manufacturing, have altered the mix of
production and non-production functions needed by employers, reinforcing the demand for educated
and skilled workers. The result is that there are still good jobs in manufacturing, but they are going to a
smaller, more educated workforce.
This reality will force us to reset, and in some cases rethink, our national policies in support of
manufacturing. The health of manufacturing will be measured not by the number of good jobs it
generates, but by its growth in output and the value it provides to the economy as a whole. Going
forward, we can take practical steps in four areas to bolster the economic vibrancy of manufacturing
firms and workers:
71 Carnevale et al., Job Projections and Education Requirements, 2017–2027, forthcoming.
72 Manyika et al., Manufacturing the Future, 2012; Bianchi and Labory, Industrial Policy for the Manufacturing Revolution, 2018.
73 Levinson, “Job Creation in the Manufacturing Revival,” 2017.
FIGURE 19. Manufacturing is expected to shed employment during the next decade.
Source: Georgetown University Center on Education and the Workforce projections of changes in jobs, 2017–2027.
Manufacturing All Industries
-2%
8%

Upskilling and Downsizing in American Manufacturing36
Support research and technology development in manufacturing
Manufacturing has been an important source of innovation for the American economy
dating back to the introduction of the assembly line in the early 20th century. Manufacturing
firms, especially computer and electronics makers and chemical firms, now account for
the vast majority (71%) of domestic spending on R&D and two-thirds (67%) of the number
of US patents issued every year. The federal government currently supports technology
development through the 14 Manufacturing USA institutes that specialize in fostering
specific technologies, such as new types of materials and robotics. Each institute focuses on
research that leads to new types of products and improvements to the production process.
This support should be maintained or even increased with the establishment of additional
institutes across the country.
Build the capacity of small and medium-sized manufacturers
While overall manufacturing output has increased since 1990 except during recessions, this
growth has been uneven across the industry. Large, mostly multinational manufacturers
have increased their revenues by 2 percent per year, but smaller firms, many of which are
suppliers to big firms, have not prospered to the same degree.74 Small firms in particular
benefit from better access to new technologies, as well as market development and
workforce development strategies. The federal government should maintain or even
expand its support for the Manufacturing Extension Partnership Program, a national
network that provides technical assistance to these small- and medium-sized firms.
Build the manufacturing workforce of the future
The manufacturing industry now requires workers with higher skill levels than it used to. This
is true of the engineers, computer scientists, and managers who perform pre-production
and post-production tasks; it is also true of production workers on the factory floor who
have to respond to new competitive requirements and deploy the latest technologies. As
a result, career preparation for many manufacturing jobs has shifted from high school to
postsecondary education. Many of the high school career and technical education programs
that used to form a pipeline into manufacturing jobs have dwindled.75 The Strengthening
Career and Technical Education for the 21st Century Act, authorized in July 2018, provides
an opportunity for federal and state policymakers to rethink and rebuild career and technical
education programs that start in high school and have strong connections to postsecondary
education and, ultimately, good jobs.
In addition, policymakers should build apprenticeship pathways in regions where they make
sense for local firms, colleges, and workers. While apprenticeships represent a very small slice
of the American workforce (0.3%) and have yet to gain traction with most employers, they
are a proven route to good jobs for those who can find them.76
74 Ramaswamy et al., Making It in America, 2017. In addition, employment has become more concentrated in small
establishments. See Levinson, “Job Creation in the Manufacturing Revival,” 2017.
75 Andrew Stettner, “Testimony: Why Federal Government Needs to Invest in American Manufacturing,” 2018.
76 National Science and Technology Council, Strategy for American Leadership in Advanced Manufacturing, 2018.

Upskilling and Downsizing in American Manufacturing 37
Improve worker transitions
While manufacturing has bounced back from the low point it reached during the Great
Recession, it will continue to face occasional economic downturns. Manufacturing
historically has been more sensitive than other industries to the boom and bust of the
business cycle. Firms typically shed large numbers of jobs as demand for products declines
during a recession. Layoffs also result from plant shutdowns, business restructuring, and
sometimes the offshoring of production capacity. The economic pain due to job loss is
particularly severe for manufacturing workers with a high school diploma or less. In 2016,
59 percent of high school-educated displaced workers were reemployed, compared to
63 percent of those with middle skills and 77 percent of those with a bachelor’s degree or
more.77 Less-educated workers are also more likely than those with a bachelor’s degree
to take a pay cut when they land a new job. Unfortunately, federal programs for displaced
workers are either narrowly targeted based on the cause of job loss, like Trade Adjustment
Assistance, or provide a set of discrete services rather than comprehensive adjustment
assistance. A more robust adjustment package would include a wider array of employment
transition options for workers, as well as help for communities that experience large-scale
worker displacement.
Acting on these ideas will require a new understanding from policymakers and the public. The industry
has often evoked anxiety and nostalgia for a distant era—a time when companies like General Motors
were dominant and when high school dropouts and high school graduates could easily find jobs in
factories or mills. But there will be no return to the days when manufacturing employment and the
high school economy were at their peak. The industry has moved forward, and we need to accept this
new reality.
77 Georgetown University Center on Education and the Workforce analysis of data from US Census Bureau, Current Population
Survey Displaced Worker Supplement, 2002–2016. See Appendix D for additional data on displaced workers.

Upskilling and Downsizing in American Manufacturing38
REFERENCES Acemoglu, Daron, and Pascual Restrepo. “Robots and Jobs: Evidence from US Labor Markets.”
National Bureau of Economic Research Working Paper no. 23285, March 2017.
Autor, David H., David Dorn, and Gordon H. Hanson. “The China Syndrome: Local Labor Market Effects
of Import Competition in the United States.” American Economic Review 103, no. 6 (October
2013): 2121–68.
Bivens, Josh. “Updated Employment Multipliers for the US Economy.” Washington, DC: Economic
Policy Institute, 2019.
Berlingieri, Giuseppe. “Outsourcing and the Rise in Services.” CEP Discussion Paper no. 1199, Centre
for Economic Performance, London School of Economics and Political Science, London,
September 2014.
Berlingieri, Giuseppe. “Outsourcing and the Shift from Manufacturing to Services.” VOX CEPR Policy
Portal, September 25, 2014.
Bianchi, Patrizio, and Sandrine Labory. Industrial Policy for the Manufacturing Revolution: Perspectives
on Digital Globalisation. Northampton, MA: Edward Elgar, 2018.
Burning Glass Technologies. Job Market Intelligence: The Burning Glass Report, January 8, 2014.
https://www.burning-glass.com/wp-content/uploads/The-Skills-Gap-in-Production-Roles.pdf.
Carnevale, Anthony P. America and the New Economy. Alexandria, VA: American Society for Training
and Development, 1991.
Carnevale, Anthony P., and Stephen J. Rose. The Economy Goes to College: The Hidden Promise
of Higher Education in the Post-Industrial Service Economy. Washington, DC: Georgetown
University Center on Education and the Workforce, 2015.
Carnevale, Anthony P., Nicole Smith, Michael C. Quinn, and Gayle Cinquegrani. Job Projections
and Education Requirements, 2017–2027. Washington, DC: Georgetown University Center on
Education and the Workforce, forthcoming.
Carnevale, Anthony P., Jeff Strohl, Ban Cheah, and Neil Ridley. Good Jobs that Pay without a BA.
Washington, DC: Georgetown University Center on Education and the Workforce, 2017.
Carnevale, Anthony P., Jeff Strohl, Neil Ridley, and Artem Gulish. Three Educational Pathways to Good
Jobs: High School, Middle Skills, and Bachelor’s Degree. Washington, DC: Georgetown University
Center on Education and the Workforce, 2018.
Caroli, Eve, and John Van Reenen. “Skill-Biased Organizational Change? Evidence from a Panel
of British and French Establishments.” Quarterly Journal of Economics 116, no. 4 (November
2001): 1449–92.

Upskilling and Downsizing in American Manufacturing 39
Charles, Kerwin Kofi, Erik Hurst, and Mariel Schwartz. “The Transformation of Manufacturing and the
Decline in U.S. Employment.” National Bureau of Economic Research Working Paper no. 24468,
March 2018.
Cronen, Stephanie, Meghan McQuiggan, Emily Isenberg, and Sarah Grady. Adult Training and
Education: Results from the National Household Education Surveys Program of 2016: First Look.
Washington, DC: US Department of Education, National Center on Education Statistics, 2018.
FRED. Federal Reserve Economic Data, Federal Reserve Bank of St. Louis. “All Employees:
Manufacturing (MANEMP).” US Department of Labor, Bureau of Labor Statistics. Last modified
September 2018. https://fred.stlouisfed.org/series/MANEMP.
FRED. Federal Reserve Economic Data, Federal Reserve Bank of St. Louis. “All Employees: Total
Nonfarm Payrolls (PAYEMS).” US Department of Labor, Bureau of Labor Statistics. Last modified
September 2018. https://fred.stlouisfed.org/series/PAYEMS.
FRED. Federal Reserve Economic Data, Federal Reserve Bank of St. Louis. “Manufacturing Sector: Real
Output (OUTMS).” US Department of Labor, Bureau of Labor Statistics. https://fred.stlouisfed.org/
series/OUTMS.
FRED. Federal Reserve Economic Data, Federal Reserve Bank of St. Louis. “Manufacturing Sector: Real
Output Per Person (PRS30006163).” US Department of Labor, Bureau of Labor Statistics. https://
fred.stlouisfed.org/series/PRS30006163.
Gould, Eric D. “Torn Apart? The Impact of Manufacturing Employment Decline on Black and White
Americans.” CEPR Discussion Paper no. DP12992, Centre for Economic Policy Research, London,
June 2018.
Graetz, Georg, and Guy Michaels. “Robots at Work.” CEP Discussion Paper no. 1335, Centre for
Economic Performance, London School of Economics and Political Science, London, March 2015.
Hershbein, Brad, and Lisa B. Kahn. “Do Recessions Accelerate Routine-Biased Technological Change?”
Kalamazoo, MI: W.E. Upjohn Institute for Employment Research, 2017.
Hicks, Michael J., and Srikant Devaraj. The Myth and the Reality of Manufacturing in America. Muncie,
IN: Ball State University, 2017.
Houseman, Susan N. “Understanding the Decline of U.S. Manufacturing Employment.” Working Paper
18-287. Kalamazoo, MI: W.E. Upjohn Institute for Employment Research, 2018.
Katz, Lawrence F., and Robert A. Margo. “Technical Change and the Relative Demand for Skilled Labor:
The United States in Historical Perspective.” Paper presented at the Human Capital and History:
The American Record Conference, Cambridge, MA, 2013.
Kennedy, Paul. The Rise and Fall of the Great Powers: Economic Change and Military Conflict from
1500 to 2000. New York: Vintage Books, 1989.

Upskilling and Downsizing in American Manufacturing40
Lawrence, Robert Z., and Lawrence Edwards. “US Employment Deindustrialization: Insights from
History and the International Experience.” Washington, DC: Peterson Institute for International
Economics, 2013.
Levinson, Marc. “Job Creation in the Manufacturing Revival.” Washington, DC: Congressional Research
Service, 2017.
Levinson, Marc. “U.S. Manufacturing in International Perspective.” Washington, DC: Congressional
Research Service, 2018.
Manyika, James, Jeff Sinclair, Richard Dobbs, Gernot Strube, Louis Rassey, Jan Mischke, Jaana Remes,
Charles Roxburgh, Katy George, David O’Halloran, and Sreenivas Ramaswamy. Manufacturing the
Future: The Next Era of Global Growth and Innovation. McKinsey Global Institute, November 2012.
McIntyre, Douglas A. “America’s Biggest Companies, Then and Now.” 24/7 Wall St., September 21,
2010. https://247wallst.com/investing/2010/09/21/americas-biggest-companies-then-and-now-
1955-to-2010/.
Muro, Mark, Sifan Liu, Jacob Whiton, and Siddharth Kulkarni. Digitalization and the American
Workforce. Washington, DC: Brookings Institution, November 2017.
Muro, Mark, Jonathan Rothwell, Scott Andes, Kenan Fikri, and Siddharth Kulkarni. America’s Advanced
Industries: What They Are, Where They Are, and Why They Matter. Washington, DC: Brookings
Institution, February 2015.
National Academies of Sciences, Engineering, and Medicine. Information Technology and the U.S.
Workforce: Where Are We and Where Do We Go from Here? Washington, DC: The National
Academies Press, 2017.
National Science and Technology Council. Strategy for American Leadership in Advanced
Manufacturing. Washington, DC: US Office of Science and Technology Policy, 2018.
Piva, Mariacristina, Enrico Santarelli, and Marco Vivarelli. “The Skill Bias Effect of Technological and
Organizational Change.” Research Policy 34, no. 2 (2005): 141–157.
Ramaswamy, Sree, James Manyika, Gary Pinkus, Katy George, Jonathan Law, Tony Gambell, and
Andrea Serafino. Making It in America: Revitalizing US Manufacturing. McKinsey Global Institute,
November 2017.
Renski, Henry. “Estimating the Returns to Professional Certifications and Licenses in the U.S.
Manufacturing Sector.” Economic Development Quarterly 32, no. 4 (2018).
Siegel, Donald S. Skill-Biased Technological Change: Evidence from a Firm-Level Survey. Kalamazoo,
MI: W.E. Upjohn Institute for Employment Research, 1999.
Sirkin, Harold L., Michael Zinser, and Douglas Hohner. Made in America, Again: Why Manufacturing Will
Return to the U.S. Boston, MA: Boston Consulting Group, 2011.

Upskilling and Downsizing in American Manufacturing 41
Stettner, Andrew. Mounting a Response to Technological Unemployment. New York: The Century
Foundation, 2018.
Stettner, Andrew. “Testimony: Why Federal Government Needs to Invest in American Manufacturing.”
Testimony before the US House of Representatives Subcommittee on Digital Commerce and
Consumer Protection. New York: The Century Foundation, 2018.
US Census Bureau. American Community Survey, 2014–2016 (pooled data).
US Census Bureau. Current Population Survey Displaced Worker Supplement, 2002–2016.
US Census Bureau. Current Population Survey March Supplement (Annual Social and Economic
Supplement), 1992–2017.
US Department of Commerce, Bureau of Economic Analysis. Gross Domestic Product by Industry
data, 1947–2017.
US Department of Commerce, Bureau of Economic Analysis. Personal Consumption Expenditures by
Function data, 1947–2017.
US Department of Labor, Bureau of Labor Statistics. Employment Projections 2016–2026. Washington,
DC, 2017.
US Department of Labor, Bureau of Labor Statistics. Quarterly Census of Employment and Wages.
Washington, DC, 2000–2016.
Vlasic, Bill. “100 Years Down the Line.” New York Times, October 29, 2013.
Wilcox, W. Bradford, Wendy Wang, and Ronald Mincy. “Black Men Making It in America: The Engines of
Economic Success for Black Men in America.” American Enterprise Institute and the Institute for
Family Studies, June 6, 2018.

Upskilling and Downsizing in American Manufacturing42
APPENDIX A Data Sources and Methodology
American Community Survey (ACS): We use pooled ACS data from 2014–16 to estimate employment
by occupation, industry, and education level within manufacturing. We also use ACS data to estimate
employment by state. Industry analysis was based on 10 major industry groups.
Bureau of Economic Analysis (BEA): We use BEA Personal Consumption Expenditures by Function
data, 1947–2017, to determine the share of consumer spending attributable to clothing, food,
healthcare, and other categories of consumer demand. We also use BEA Industry Gross Domestic
Product data, 1947–2017, to show each industry’s value added or contribution to the US economy.
Current Population Survey (CPS): We use CPS data from 1971–2017 for workers age 25 to 64 to
describe the composition of manufacturing employment and wage trends by level of educational
attainment, industry, and occupation. The survey reflects information collected from respondents in
the previous year. Wages are inflation-adjusted.
We also use CPS data from 1992–2017 for workers age 25 to 64 to describe trends in good jobs,
using the 1992 March Supplement (reflecting 1991 data) as a baseline because that is the first year in
which the CPS distinguished workers with some college but no degree from those with an associate’s
degree. Since 1991, the CPS has presented workers’ educational attainment using five levels: high
school dropout; high school graduate; some college, no degree; associate’s degree; and bachelor’s
degree or more.
In 2015, the CPS began including questions on certifications (credentials issued by nongovernmental
certification bodies) and licenses (credentials awarded by governmental licensing agencies). For this
report, we use the 2017 CPS March Supplement to estimate the number of manufacturing workers
who have a certification or a license and the labor market characteristics of those workers.
Displaced Worker Survey (DWS): The Current Population Survey collects supplemental data on
the number and characteristics of people who have been displaced from their jobs during the
previous three calendar years. We use DWS data to show the number, education level, and additional
characteristics of displaced workers who lost jobs in manufacturing.
Federal Reserve Economic Data (FRED): We rely on FRED indicators that draw on data from Current
Employment Statistics for information about employment, hours, and earnings based on employer
records. We use FRED data to estimate the overall size of the manufacturing workforce and its share of
the national workforce from the 1940s to the present. We also use FRED indicators to analyze trends in
industry output and output per person.
Quarterly Census of Employment and Wages (QCEW): We use QCEW data primarily to determine the
change in the number of manufacturing establishments over time.

Upskilling and Downsizing in American Manufacturing 43
A Note on Measurement Considerations
The data in this report are affected by a number of measurement considerations.
First, there are important differences between household survey data and employer-based
survey data; as a result, the numbers may not match across data sets. Household surveys allow
us to focus on prime-age workers (ages 25–64) and include a range of characteristics, such as
education level. In contrast, employer-based surveys are not age-limited, and they do not include
detailed worker characteristics.
Second, the types of establishments that are counted as part of the manufacturing industry have
changed over time, which may affect the time series data generated by the national statistics agencies.
The composition of the manufacturing industry was altered when the US Office of Management and
Budget introduced the North American Industry Classification System (NAICS) in 1997. While this
change does not affect the general trend, it may explain some portion of the decline in manufacturing.
Finally, difficulty in identifying the number of workers at non-manufacturing establishments who
are engaged in manufacturing-related work may cause the number of manufacturing workers to be
undercounted. For example, workers at an industrial design firm that is not owned by a manufacturing
company are counted as workers in the professional, scientific, and technical services sector rather
than the manufacturing sector. In addition, the growth of contract manufacturing—in which firms
design and sell products but are not directly involved in production—has made it difficult to distinguish
manufacturing from other industries. For more information, see Levinson, “Job Creation in the
Manufacturing Revival,” 2017.

Upskilling and Downsizing in American Manufacturing44
APPENDIX B Manufacturing Jobs by Worker Education Level
TABLE B1. Top 10 industries for workers with a high school diploma or less, 2005–2007 ranking
Number of workers
Detailed industry 2005–2007 2014–2016
Motor vehicles and motor vehicle equipment manufacturing 698,000 527,000
Furniture and related product manufacturing 359,000 219,000
Printing and related support activities 341,000 231,000
Machinery manufacturing, n.e.c. or not specified 302,000 238,000
Plastics product manufacturing 287,000 209,000
Miscellaneous manufacturing, n.e.c. 285,000 223,000
Animal slaughtering and processing 276,000 303,000
Structural metals and boiler, tank, and shipping container manufacturing 241,000 171,000
Machine shops; turned product; screw, nut, and bolt manufacturing 196,000 157,000
Electronic component and product manufacturing, n.e.c. 193,000 118,000
Source: Georgetown University Center on Education and the Workforce analysis of US Census Bureau, American Community Survey pooled data, 2014–2016.
Note: n.e.c. = not elsewhere classified.

Upskilling and Downsizing in American Manufacturing 45
TABLE B2. Top 10 industries for middle-skills workers (those with some college or an
associate’s degree), 2005–2007 rankingNumber of workers
Detailed industry 2005–2007 2014–2016
Motor vehicles and motor vehicle equipment manufacturing 428,000 405,000
Printing and related support activities 220,000 171,000
Machinery manufacturing, n.e.c. or not specified 202,000 192,000
Electronic component and product manufacturing, n.e.c. 199,000 151,000
Miscellaneous manufacturing, n.e.c. 138,000 141,000
Plastics product manufacturing 129,000 116,000
Medical equipment and supplies manufacturing 128,000 150,000
Furniture and related product manufacturing 128,000 100,000
Aircraft and parts manufacturing 122,000 170,000
Industrial and miscellaneous chemicals 114,000 116,000
Source: Georgetown University Center on Education and the Workforce analysis of US Census Bureau, American Community Survey pooled data, 2014–2016.
Note: n.e.c. = not elsewhere classified.
TABLE B3. Top 10 industries for workers with a bachelor’s degree or higher, 2005–2007 ranking
Number of workers
Detailed industry 2005–2007 2014–2016
Electronic component and product manufacturing, n.e.c. 309,000 289,000
Motor vehicles and motor vehicle equipment manufacturing 265,000 271,000
Pharmaceutical and medicine manufacturing 265,000 313,000
Medical equipment and supplies manufacturing 162,000 241,000
Aerospace products and parts manufacturing 150,000 77,000
Computer and peripheral equipment manufacturing 150,000 94,000
Machinery manufacturing, n.e.c. or not specified 136,000 158,000
Industrial and miscellaneous chemicals 133,000 147,000
Aircraft and parts manufacturing 130,000 234,000
Printing and related support activities 127,000 104,000
Source: Georgetown University Center on Education and the Workforce analysis of US Census Bureau, American Community Survey pooled data, 2014–2016.
Note: n.e.c. = not elsewhere classified.
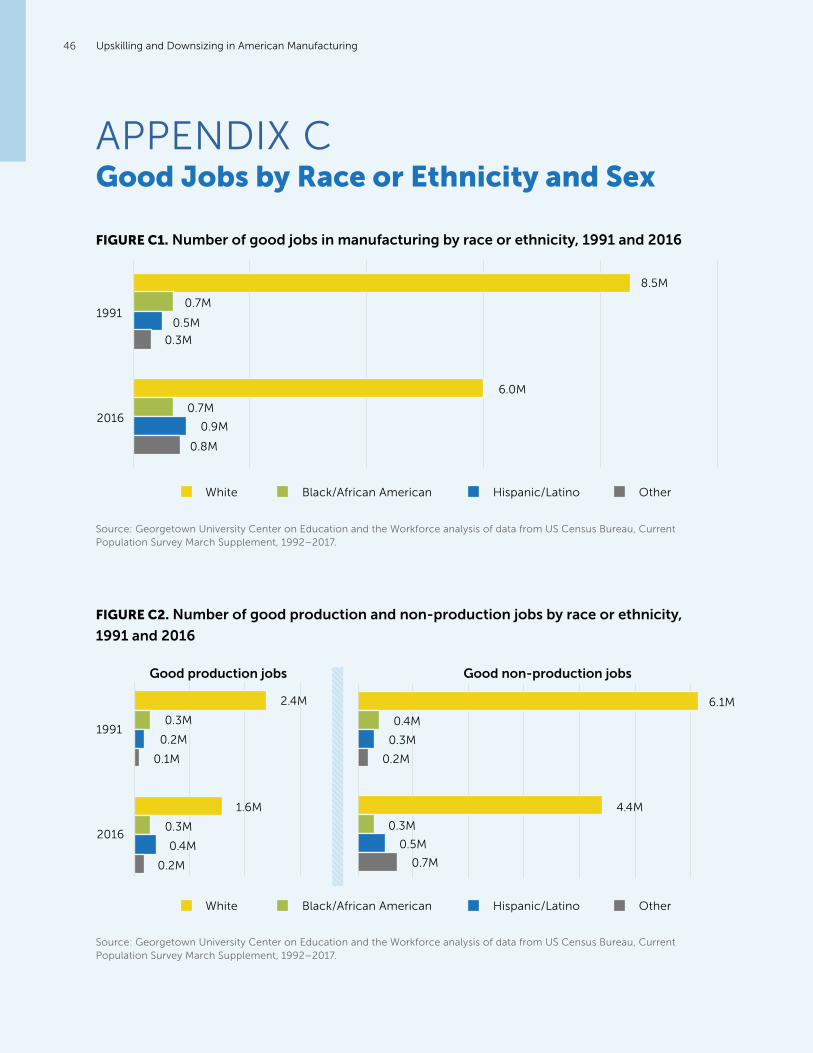
Upskilling and Downsizing in American Manufacturing46
Good production jobs Good non-production jobs
APPENDIX C Good Jobs by Race or Ethnicity and Sex
FIGURE C1. Number of good jobs in manufacturing by race or ethnicity, 1991 and 2016
Source: Georgetown University Center on Education and the Workforce analysis of data from US Census Bureau, Current Population Survey March Supplement, 1992–2017.
FIGURE C2. Number of good production and non-production jobs by race or ethnicity,
1991 and 2016
Source: Georgetown University Center on Education and the Workforce analysis of data from US Census Bureau, Current Population Survey March Supplement, 1992–2017.
1991
2016
8.5M
0.7M
0.5M
0.3M
Black/African American Hispanic/LatinoWhite Other
6.0M
0.7M
0.9M
0.8M
1991
2016
Black/African American Hispanic/LatinoWhite Other
2.4M
1.6M
0.3M
0.2M
0.1M
0.3M
0.4M
0.2M
6.1M
4.4M
0.4M
0.3M
0.2M
0.3M
0.5M
0.7M

Upskilling and Downsizing in American Manufacturing 47
FIGURE C3. Number of good jobs in manufacturing by sex, 1991–2016
Source: Georgetown University Center on Education and the Workforce analysis of data from US Census Bureau, Current Population Survey March Supplement, 1992–2017.
Nu
mb
er
of
go
od
job
s
(in m
illio
ns)
10
6
2
01991 20011996 2006 2011 2016
8
4
WomenMen

Upskilling and Downsizing in American Manufacturing48
APPENDIX D Displaced Workers
FIGURE D1. Percent of displaced workers who were reemployed
Manufacturing workers have generally fared worse than workers from other industries in getting a new
job after a job loss.
Source: Georgetown University Center on Education and the Workforce analysis of data from US Census Bureau, Current Population Survey Displaced Worker Supplement, 2002–2016.
Source: Georgetown University Center on Education and the Workforce analysis of data from US Census Bureau, Current Population Survey Displaced Worker Supplement, 2002–2016.
60%
80%
70%
50%
30%
10%
40%
20%
02005–2007 2007–2009 2009–2011 2011–2013 2013–2015
Manufacturing
Other blue-collar industries
Skilled-services industries
FIGURE D2. Percent of displaced manufacturing workers who were reemployed
Workers with no more than a high school diploma generally have lower reemployment rates than
workers with postsecondary education.
60%
90%
80%
70%
50%
30%
10%
40%
20%
02007–2009 2009–2011 2011–2013 2013–2015
Some college/associate’s degree
Bachelor’s degree or higher
High school diploma or less

Upskilling and Downsizing in American
Manufacturing can be accessed online at
cew.georgetown.edu/manufacturing.
The Georgetown University Center on Education and the Workforce
3300 Whitehaven St. NW, Suite 3200
Washington, DC 20007
cew.georgetown.edu
facebook.com/GeorgetownCEW
twitter.com/GeorgetownCEW
linkedin.com/company/GeorgetownCEW