


Languages
Pages
Legal


Tartu 2013
UNIVERSITY OF TARTU
FACULTY OF TECHNOLOGY AND SCIENCE
INSTITUTE OF MOLECULAR AND CELL BIOLOGY
Jaanika Udam
STUDYING DIFFERENT MOLECULAR MARKERS FOR KERNEL TEXTURE IN
BREAD WHEAT (Triticum aestivum L.)
Bachelor’s thesis (12 EAP)
Instructor associate professor Dr. habil. László Tamás PhD
Co-instructor associate professor Dr. (knd.biol) Evi Padu PhD

2
TABLE OF CONTENTS
TABLE OF CONTENTS ........................................................................................................... 2
ABBREVIATIONS .................................................................................................................... 4
PREFACE ................................................................................................................................... 5
1 OVERVIEW OF LITERATURE ........................................................................................ 7
1.1 The importance of the wheat quality ........................................................................... 7
1.1 Hardness/texture of the wheat endosperm ................................................................... 7
1.2 Puroindolines ............................................................................................................. 10
1.2.1 The discovery and nomenclature of puroindolines............................................. 10
1.2.2 Biochemical properties ....................................................................................... 11
1.2.3 The genetic background...................................................................................... 12
1.2.4 Puroindoline b-2 ................................................................................................. 14
1.2.5 Antimicrobial activities of puroindolines ........................................................... 15
1.3 Marker development for selection in wheat breeding..................................................... 16
1.3.1 Protein markers ................................................................................................... 17
1.3.2 Antibody-based marker assays ........................................................................... 18
1.3.3 DNA- based markers .......................................................................................... 18
1.4 High resolution melting analysis ............................................................................... 22
2 EXPERIMENTAL WORK ............................................................................................... 23
2.1 The aim of the experimental work ............................................................................. 23
2.2 Materials and methods ............................................................................................... 23
2.2.1 Seed sterilization and plant growth conditions ................................................... 23
2.2.2 Genomic DNA isolation and purification ........................................................... 24
2.2.3 Gel-electrophoresis ............................................................................................. 25
2.2.4 DNA purification from gel ................................................................................. 26
2.2.5 Cycle sequencing ................................................................................................ 26
2.2.6 In silico sequence analysis .................................................................................. 27
2.3 Results and discussion ............................................................................................... 28
2.3.1 Historic set results regarding puroindoline-a and puroindoline-b ...................... 28
2.3.2 Biofortification-set results regarding puroindoline-a and puroindoline-b. ......... 29
2.3.3 HRM-PCR primers optimization ........................................................................ 30
2.3.4 Historic set results regarding the puroindolineb-2 alleles .................................. 31
2.3.5 Australian set results regarding puroindolineb-2 alleles .................................... 32
2.3.6 Marker development for seed vitreousness and density ..................................... 32
2.3.7 Marker development for wheat seed hardness ................................................... 35

3
CONCLUSION ........................................................................................................................ 36
Terise tekstuuri molekulaarsete markerite uurimine harilikus nisus (Triticum aestivum) ....... 38
REFERENCES ......................................................................................................................... 40
USED WEB ADDRESSES ...................................................................................................... 45
APPENDIX I ........................................................................................................................ 46
APPENDIX II ....................................................................................................................... 47
AKNOWLEDGEMENTS ........................................................................................................ 59
Non-exclusive licence to reproduce thesis and make thesis public .......................................... 60

4
ABBREVIATIONS
+f – faint positive
AFLP – Amplified Fragment Length
Polymorphism
B-set – Kazakhstan biofortification set
EndoC – endosperm collapse
EndoR – endosperm response
Ha- hardness locus
HRM-PCR – high resolution melting
polymerase chain reaction
HRM-PCR- high resolution melting PCR
H-set – Kazakhstan historical set
MAS/MAB – Marker assisted
selection/Marker assisted breeding
MQ – Milli-Q™ Millipore Corporation
ultrapurifyed water
NIR – near infrared reflectance spectroscopy
NTC – no template control
PINA – protein of puroindoline a
Pina- puroindoline-a gene
PINB – protein of puroindoline b
Pinb – puroindoline b gene
Pinb-2 – puroindoline b-2 gene family
PuroA – bactericidial domain of PIN-a
PuroB – bactericidial domain of PIN-b
QTL – quantitative trait locus/loci
RFLP – Restriction Fragment Length
Polymorphism
RHI – rheological hardness index
SKCS – single kernel characterization system
SNP – single nucleotide polymorphism
TKW – thousand kernel weight
TRD – tryptophan rich domain

Tartu 2013
PREFACE
Wheat is one of the worlds’ most important crop and an important source of nutrients for
human kind. A wide assortment of products is made from wheat such as bread, cakes and
cookies, pasta and other. T. aestivum is an allohexaploid wheat containing three genomes A,
B and D combining the diploid and tetraploid genomes of its ancestors. The size of the
hexaploid bread wheat (Triticum aestivum) genome is 17 000 Mbp, which is 10-20 times
bigger than other common crops. The complexity and the size of the bread wheat genome
makes the research of it challenging, but necessary.
The research of wheat gives answers to breeders about the quality of the wheat and the end-
product, which is made from it. Kernel hardness is one of most well researched characteristic
of wheat kernels as it is perfectly controlled with genetics. It should be noted that apart from
genetics environment also has effects on it, which makes science even more challenging.
Research in the recent decades has found that proteins called puroindolines, coded by the
puroindoline-a and puroindoline-b genes are the main determinants of the kernel hardness.
The similarities between the electrophoretic, detergent fractionation and N-terminal sequence
properties of two of the cold SDS-extractable starch friabilin polypeptides and those of
puroindolines-a and -b strongly suggest that friabilin comprises a mixture of proteins in which
the puroindoline polypeptides are important components. Although these genes affecting the
wheat endosperm texture are close to the hardness (Ha) locus and the endosperm texture is
referred to as kernel hardness, indeed the softness is the dominant trait. Wheat kernels are soft
if both puroindolines are present as wild type. Any mutation either in Pina or Pinb results
with hard kernel. Puroindolines and other molecular markers contribute to modern plant
breeding.
The aim(s) of this work are(is) to study the hardness of the wheat kernel. We studied the
genetic background determining the wheat endosperm texture focusing mainly on
puroindolines. The practical part of this project on one hand was the molecular
characterization and description of the diversity of puroindoline (PIN) genes and alleles.
Sixty-one wheat varieties collected in Kazakhstan were involved in this project. One set
contained 49 cultivars from a historical pool, while samples (12) in the other set were part of
an experiment, carried out in another laboratory, used for biofortification studies On the other
hand we focused on establishing and testing other DNA-based molecular markers regarding

6
kernel hardness, vitreousness and density. The markers were based on sequences published
earlier and validated on Australian varieties. This marker development project is part of an
international collaboration for finding new relationships for quality prediction.
The thesis work was conducted in Eötvös Lórand University (ELTE), Faculty of Science,
Institute of Biology, Department of Plant Physiology and Molecular Plant Biology,
HUNGARY under the supervision of Dr. László Tamás.

7
1 OVERVIEW OF LITERATURE
1.1 The importance of the wheat quality
There are several important characteristics which describe the quality of the bread wheat (T.
aestivum L.). One of the most important amongst others is the hardness of the wheat
endosperm which determines the end-use quality of the flour. To breed the best quality wheat
– co-operation of scientists, breeders and millers is necessary. To ease the work of breeders it
is important to use marker assisted breeding (MAB) or also mainly known as marker assisted
selection (MAS). Marker assisted selection helps breeders to choose high quality varieties in
the early stage which meet their expectations and needs and which are stable across
environments. The ‘appropriate’ quality depends on the user of the wheat and on the product
required from it. For miller the importance stands in the endosperm texture which influences
the tempering, flow, sifting area and energy consumption of a flour mill (Bettge et al., 1995).
For a baker who wishes to bake cakes, cookies and other low moisture content products it is
important to use wheat which has a soft characteristic as its starch granules do not get
damaged while milling and the water absorption of the granules is low so the result is more
satisfying. In case of baking bread – hard bread wheat is advantageous. Its kernels suffer
trough high mechanical damage during milling resulting higher endosperm starch granule
fracturing. Due to the more damaged starch granules the flour has higher water absorption
capacity and the starch molecules are more available for hydrolysis by α-amylase enzyme.
This gives better quality bread, higher loaf volume, in case of making yeast leavened bread
because yeasts have greater amount of fermentable sugar to use thanks to better starch
hydrolysis (Bettge et al., 1995). Tetraploid durum wheat (T. durum), which has the hardest
characteristics is perfect for making pasta-like products but not very good for bread making.
1.1 Hardness/texture of the wheat endosperm
Intensive screening on large population size is needed for breeding programs to get reliable
results of the quality traits. As these procedures are quite expensive and time consuming, the
varietal performance is predicted mainly on advanced breeding lines. Important field of
studies are the identification of Quantitative Trait Loci (QTL) and genes influencing the
specific end use quality traits such as endosperm texture (Tsilo et al., 2011). According to
Edwards (2010) “QTL are stretches of DNA that are closely linked to the genes that underlie
a quality trait”. Hardness of the wheat kernel is one of the best researched quality attributes.

8
Wheat grain classes are mainly formed taking the morphology and texture of the kernel into
consideration, like color, shape and length of the kernel (Campbell et al., 1999). Generally,
hard wheat kernels are narrow, translucent and long while soft wheat kernels are rounded,
short and chalky (Campbell et al., 1999). For efficient trading of wheats, classifications of
wheat categories are developed so that some information about the wheat varieties, hybrids or
landlines can be obtained by the name and without the need to test the samples before trading.
Three main systems of classification are known: The United States, Canadian and Australian.
The US classification is based on the color, hardness and the season of the wheat grown and
harvested.
Table 1 Classification of U.S. wheat classes. Subcategories are marked in parentheses.
Code Official name
HRSW Hard Red Spring wheat (DNSW-Dark Northern Spring; NSW-Northern
Spring; RSW-Red spring)
HRWW Hard Red Winter wheat
SRWW Soft Red Winter wheat
DW Durum wheat (HADW – Hard Amber Durum; ADW – Amber durum)
WW White wheat (HWW – Hard white; SWW –Soft white; Western; white
Club*
UW Unclassified wheat
MW Mixed wheat
* - Club wheat is the special wheat produced from hexaploid T. compactum in the north-
western part of the U.S. (Békés, 2001)
Canadian wheat classification system is based on the combination of endosperm texture and
growing season in addition in some cases the growing region is also used as there are
significant differences depending if the wheat is grown on the Eastern or the Western part.
CWES is a special group as it is the best bread-wheat class in the world with perfect
characteristics for baking high quality bread (Békés, 2001).

9
Table 2 Canadian wheat classification (Békés, 2001).
Code Official name
CWRS Canada Western Red Spring (hard)
CWES Canada Western Extra Strong Red Spring (hard)
CWAD Canada Western Amber Durum (hard)
CWRW Canada Western Red Winter (hard)
CWSWS Canada Western Soft White Spring (soft)
CPSR Canada Prairie Spring Red (hard)
CPSW Canada Prairie Spring White(hard)
CEWW Canada Eastern White Winter (hard)
CERW Canada Eastern Red Winter (hard)
CESWS Canada Eastern Soft White Spring (soft)
CEMW Canada Eastern Mixed Wheat (soft)
CFW Canada Feed Wheat (forage)
Australia is the third biggest producer and exporter of wheat, also having its own
classification system. The interesting point of Australian classification is that the classes are
formed according to the usage of the wheat which makes it easy to export as it is known for
the buyer what quality wheat was purchased.
Table 3 Australian wheat classification (Békés, 2001)
Code Official name Usage
APH Australian Hard Prime Yellow alkaline noodle, Japanes Ramen noodle,
baking products, Wanton noodle, wheat with
corrective qualities
AH1 Australian Hard Baking products, Arabian pita bread, Chinese

10
steamed products
APW Australian Premium
White
Hokkien and instant noodles, Arabian pita, Indian
breads, Chinese steamed products
ASW Australian Standard
White
General usage
ANW Australian Noodle Udon noodle
AS Australian Soft Cookies, cakes, crackers
AD Australian Durum Extruded Pasta products
Generally, each country has its own classification, but knowing the classification of the main
distributers of wheat helps the world market to be stable.
1.2 Puroindolines
1.2.1 The discovery and nomenclature of puroindolines
The discovery of 15 kDa protein named friablilin was a huge breakthrough in researching
biochemical markers. This protein was found in association with soft wheat starch, found less
association with hard wheat starch and no protein was found in durum wheat (Pasha et al.,
2010). This 15kDa protein family is known as a biochemical marker for determining texture
genotype of a single kernel. The appearance of friabilin on water-washed wheat starch
granules is unrelated to the environmental affect and highly correlated to with grain hardness.
(Bettge et al., 1995)
The discovery of puroindolines showed that puroindolines are the primary components of
friabilin (Craig F Morris, 2002). Puroindolines have five disulphide bonds with tryptophan-
rich domains. These proteins have unique tryptophan-rich region which has an indole ring.
The name was first provided by Didier Marion and it refers to puros which means wheat and
indoline which refers to the indole ring of tryptophan.(Blochet et al., 1993) (Pasha et al.,
2010) Similar proteins have been reported in other cereals. In barley these similar proteins is
named hordoindolines and secaloindoline-a and secaloindoline-b in rye.

11
1.2.2 Biochemical properties
The main task of PINs is the fact that they are the molecular basis for endosperm texture.
With both puroindolines in their functional form causes soft and friable endosperm. In case of
the absence or mutation of one of the puroindolines the texture of the endosperm is hard.
Secondary, it has been proved in vivo and in vitro that PINs are antimicrobial proteins which
participate in seed protection (Massa and Morris, 2006).
From the 15kDa biochemical marker friabilin, puroindolines form 12,8 kDa by molecular
mass (Blochet et al., 1993). PINA and PINB comprehend cysteine backbone with 10 Cysteine
residue. Cysteins form a tertiary structure of four alpha helixes which are separated by loops
and stabilized by five disulphide bridges (Miao et al., 2012). Puroindolines have special
tryptophan rich domain (TRD) which in case of PINA has five Trp residues and three Trp-s in
PINB (Bhave and Morris, 2008b). PINA has better lipid binding and antimicrobial properties
due to the fact that it has more tryptophan residues in TRD than PINB and other analogues.
Often mentioned granule softening protein (GSP-1) has only two Trp residues in its TRD and
this may not be enough for playing a role in binding lipids as much as puroindolines do.
The structure and function of the PIN proteins depends highly on the variation in the TRD.
Massa and Morris (2006) adduced that based on nucleotide sequence and amino acid
sequence predicted from it, the comparison showed a highly conserved Pinb domain
(WPTKWWK). In the tryptophan rich region of the Pina (WRWWKWWK) found three
mutations which concluded in amino acid alteration (R65Q, K68R, and K68T) in which the
lysine-to-arginine or lysine-to-threonine alteration at position 68 may conclude in changes of
the molecular structure of the protein (Massa and Morris, 2006).
In the hardness of endosperm, the role of puroindolines is to bind lipids and insert into lipid
bilayers in protein matrix. Due to this, the association of polar lipids and the surface of the
starch granule is possible. Several researches have shown that probably the PINA binds to
starch granules and PINB is assisting the binding. As mentioned before, PINA has greater
influence on hardness. This is proved also by the fact that “null” allele Pina-D1b and SNP
allele Pina-D1m have higher hardness values than the alleles of puroindoline-b (Bhave and
Morris, 2008b). In general the hardness is determined by the strength of adhesion between
starch granules and protein matrix as well as the other influences like the amount of free polar
lipids play role. Increasing amount of lipids is reported to be correlated with increasing
hardness (Pasha et al., 2010). Interestingly, it has been reported that the type of the granules
also may affect the hardness as “puroindoline has a higher affinity for the surface of the type

12
A granules as these contribute least to bonding surface area in the endosperm composite
structure” (Edwards, 2010). Three types of starch granules are known. The smallest is the C-
type < 2 µm, following by the B-type granules with diameter 2µm-9,8µm. The biggest starch
granule is the A-type with diameter > 9,8 µm (Dai, 2009).
1.2.3 The genetic background
Puroindolines were firstly isolated from wheat endosperm, but since then they have been
reported in several other taxa of the tribe Triticeae including rye and barley (Gautier et al.,
2000; Lillemo et al., 2002; Massa et al., 2004)
Allohexaploid means that bread wheat is an allopolyploid containing six copies of its seven
chromosomes, which form sets of two and are inherited from three different species
(2n=6x=42 AABBDD genomes) (Turnbull et al., 2003). The DD of the genome is probably
inherited from D diploid genome Aegilops tauschii and AB genome from tertraploid Triticum
turgidum L. ssp. dicoccum Shrank ex Schübler (Massa and Morris, 2006). To look even
further, the A-genome of wheat is mostly from Triticum uratu. Mostly, all three genomes
contribute to the trait of interest, but that is not the case with kernel hardness (Turnbull et al.,
2003). Due to the initial tetraploidisation event, the puroindoline genes were deleted from A-
and B-genomes, so only a single locus of each of the puroindolines (Pina-D1 and Pinb-D1)
remained, but highly similar Gsp-1 loci prevailed forming now Gsp-1 loci from Gsp-A1, Gsp-
B1 and Gsp-D1 (Massa and Morris, 2006). As mentioned previously grain softness is
controlled by the hardness (Ha) locus which is located in the short arm of the chromosome
5D.
The hardness trait of the grain is determined by the expression of the proteins in the
endosperm. As mentioned before, the protein associated to the starch granules is called
friabilin and it consists of two separate polypeptides called PINA and PINB. According to
Turnbull et al. (2003) the small part of GSP-1 is also a component of friabilin. The intronless
coding regions of Pina-D1 and Pinb-D1 are 447 bp long and 70,2% identical (Bhave and
Morris, 2008a). The genes are physically approximately 100bp far from each other (Edwards,
2010).

13
Figure 1 shows the physical order Pinb – Pina –Gsp-1 within bacterial artificial
chromosome (BACs) clones. Sequence overlap and maximum probable distance between
the genes can be seen. (Turnbull et al. 2003)
Till this day 17 alleles of Pina-D1 (Pina-D1a-q) and 25 alleles of Pinb-D1 (Pinb-D1a-
17w,aa,ab) have been reported in common wheat (Pasha et al., 2010). In modern cultivars, the
allelic forms of puroindoline-b (Pinb-D1b and Pinb-D1c) are the most common. Pinb-D1b
carries a mutation of G→A at the position 223 which results in Gly→Ser change. Pinb-D1c
also has a single mutation at the pos. 60 which causes Leu→Pro. Pina-D1b allele has 15,360
bp deletion starting from 23rd
nucleotide. Pina-D1b causes lack of puroindoline protein on
SDS-page. This mutation was termed as “a-null”. The interpretation of a-null should be
handled with caution as there may be other deletions which may disturb the transcription,
translation or post-translational modification of the proteins ( Morris and Bhave, 2008).
Gsp-1 is the third known gene located in the Ha locus. Although it has sequential similarity
with puroindolines the role of gsp-1 has remained unclear. Gsp-1 is the gene coding grain
softening protein. As it can be assumed from its name gsp-1 has been related to the hardness
of the wheat kernel. Gsp-1 genes are reported to be very diverse but not even the mutations in
the genes show remarkable differences in the hardness. The reason why this may be is that the
GSP-1 has only two tryptophan in the TRD which may not be enough for binding the lipids
and starch granules (Bhave and Morris, 2008b). The fact that most of wheat lines with
identical Pina and Pinb alleles still vary in their hardness values (20-25 SKCS hardness units)
although the plants were handled under the same conditions shows that there must be some
other minor gene or QTL controlling the hardness and it might as well be the Gsp-1 gene.
Many scientists continue the research of the Gsp-1 regarding its influence on hardness as its
definite function remains unclear to this day.

14
1.2.4 Puroindoline b-2
Puroindoline b-2 is a novel puroindoline family with the possible effect on kernel hardness
and grain yield among soft wheats and Pinb-2v proteins may possess antimicrobial activities.
The new Pin locus was first reported in 2008 by Mark Wilkinson who named it Pinb-2
(Wilkinson et al., 2008)(F. Chen et al., 2010). Pinb-2 genes are located on group 7
chromosomes. Pinb-2v1 settles in the long arm of 7D (7DL), Pinb-2v2 resides on 7BL while
puroindoline-b variant 3 (Pinb-2v3) also in 7BL and the fourth variant is located in 7AL
(Chen et al., 2010)(Geng et al., 2013). The gDNA sequences of puroindoline b-2 families
share 70% similarity with Pinb-D1a gene. (Geng et al., 2013)
Puroindoline b-2 sequences show multiple variations, unlike the numerous single point
mutation alleles in Pina-D1 or Pinb-D1. Puroindoline b-2 families are similar to Gsp-1 genes.
Hence, the genes form haplotypes with each having a specific combination of SNPs that are
inherited together as a single gene. According to this, sequences sharing identical SNPs form
one haplotype and sequences differing by one or more nucleotides a separate one (haplotype).
Based on this, 17 haplotypes were identified. Ramalingam, Palombo and Bhave (2012)
previously reported haplotypes Pinb2v1 (Pinb-2v1-1...5), Pinb2v2 (Pinb-2v2-1...1), Pinb2v3
(Pinb-2v3-1;3 and 4), Pinb2v4 (Pinb-2v4-1..4), Pinb2v5 (Pinb-2v5-1..2), Pinb2v6 (Pinb-2v6
1...3). Based on latest article (Chen et al., 2013) the role of Pinb-2v-s is still unclear, although
it must be emphesized that Pinb-2v3 alleles give on average 5.4 SKCS hardness units higher
results than other variants. Pinb-B2v3 is divided into 4 alleles: Pinb- B2v2, Pinb-B2v3a, Pinb-
B2v3b and Pinb-B2v3c. Allelic association analyses showed that varieties carrying Pinb-
B2v3b allele had higher grain hardness compared to those with Pinb-B2v3a and Pinb-B2v3c
in soft wheat (Chen et al., 2013) According to Chen et al. (2013) it is also possible that the
higher SKCS HI with Pinb-B2v3b is due to relatively higher expression level of this allele.
Sequential variations of Pinb-2 show that this novel puroindoline multigene family may
possibly influence the membrane binding abilities and due to that also the grain texture and
antimicrobial activity. Putative proteins of Pinb-2 genes show changes in TRD as well as in
basic and hydrophobic residues (Ramalingam et al., 2012). All Pinb-2 variants contain 10
conserved Cys backbones just like PINs, except PINB-2V3 and PINB-2V5 which have 11
residues (Chen et al., 2010). It is important to emphasize that PINB-2 variants also possess a
part of TRD between 3rd
and 4th
Cys residue with only small Trp motif KWWK (Chen et al.,
2010). As the lipid binding site is smaller than in puroindolines, it is highly likely that this
explains the weaker effect of Pin-2v to kernel hardness.

15
Pinb-2v1 has been reported as minor QTL for hardness. Pinb-2v2 has been reported to have a
textural variation between soft and extra-soft wheats and to yield, while Pinb-2v3 is allelic to
Pinb-2v2. Also, Pinb-2v4 as one of the latest discovered variations has probably some
influence, but no clear statement about the function of this variation has been made as well as
for Pinb-2v5 and Pinb-2v6. It is also known that Pinb-2v family has no influence on the hard
group of bread wheat (Geng et al., 2013). The symbolization of Puroindoline b-2 family has
been revised by Geng et al. (2013) where they suggest the following designation where Pinb-
2v2 and Pinb-2v3 should be changed to Pinb-B2a and Pinb-B2b respectively, whereas they
propose that Pinb-2v1 and Pinb-2v4 should be designated Pinb-D2a and Pinb-A2a,
respectively. In this thesis, both symbolizations have been used parallel.
1.2.5 Antimicrobial activities of puroindolines
During germination and maturation, seeds are sensitive to fungal, bacterial and viral
infections. Thionins were the first know proteins with antimicrobial activities. Thionins are
low molecular weight basic cysteine rich proteins which are known to be toxic to several
microorganism by binding to their membrane. Tryptophan has been found in several toxic
sites of various animal toxins which interfere the membrane functions. As puroindolines
behave quite similarly as purothionins at phase partitioning it suggested that puroindolines
also might have antibacterial and antifungal properties (Blochet et al., 1993). It has been
suggested that PINs act synergistically with thionins and exert their antifungal-antimicrobial
properties through the interaction with lipid cell membranes. Also, the larger number of
tryptophan (Trp) and other positively charged amino acid residues which are common in
puroA, may be the reason for its antimicrobial properties. PuroA (FPVTWRWWKWWKG-
NH2) is the 13-residue fragment of wheat PIN-a which is known to act like a bactericidal
domain in PIN-a as it has higher in vitro antimicrobial activity than the PIN-b
(FPVTWPTKWWKG-NH2; puroB) peptide does. Both arginine (R) and lysine (K) can
connect to tryptophan through the noncovalent molecular cation-π interaction, although the
interaction of arginine is most likely. Caton-π interactions probably contribute to the stability
of the protein (Massa and Morris, 2006). Antimicrobial tests regarding the PINB-2 group
suggested that PINB-2V3 showed the least activity compared to PINB-2V1 and PuroA, but
better compared to PuroB and PINB-2 peptides share the greatest activity against
phytopathogenic fungi (Ramalingam et al., 2012). Last but not least, Lys and Leu also exhibit
strong antimicrobial activity (Ramalingam et al., 2012).

16
The research of puroindoline-a evolution suggests that it has been under positive selection and
fixation of the adaptive mutations to become plant defense-related gene and play role in plants
immune systems (Massa and Morris, 2006). Tests in vivo and in vitro have been made with
puroindolines. Antibacterial and antifungal activities in vitro against S. aureus, Rhizoctonia
solani, Collectotrichum graminicola, Fusarium oxysporum have given proof about the
antimicrobial activities (Ramalingam et al. , 2012)
1.3 Marker development for selection in wheat breeding
There are several benefits of MAB compared to traditional breeding. Due to the accuracy of
the molecular DNA markers, it is possible to describe the characteristics of the kernel easily
and quickly using only small amount of materials for example leaf. This test is considered to
be cheap.
Classification of markers known divides them to linked markers and diagnostic markers.
According to K. Gale (2005): “Linked markers have a probability of being co-inherited with
the trait of interest that is dependent on the genetic proximity of the marker and the gene
influencing the trait.” Linked markers are used if the gene of interest is not known and
therefore can not be targeted for the presence or absence of the gene or for the specific allele.
In the opposite, way the diagnostic markers which are also known as perfect markers are
directly and 100% connected with the gene which affects the variability of the trait of interest.
Diagnostic markers are highly preferred as they have absolute linkage to the trait which is
selected (Gale, 2005)
Traditional breeding is based on the phenotype and non-molecular markers like color and
size. Later on physical measurements with certain equipment accrued. In case of physical
measurements, usually large amount of seed material (approximately 5-50g) is needed to have
reliable measurements. For example measuring test weight (TW), thousand kernel weight
(TKW), particle size index (PSI) or using data generated by equipment like the single kernel
characterization system (SKCS) and near infrared reflectance (NIR) - hundreds and thousands
of kernels are needed, not to notice that some of these methods are destructive. In case of
these measurements, the results of the phenotypic hardness can vary highly also if the same
variety is grown on the same year or on different plots due to the environmental effect.
(Bettge et al., 1995).
Most used non-molecular methods for measuring the hardness of the wheat kernel are single
kernel characterization system (SKCS), near infrared reflectance (NIR) spectroscopy, pearling

17
index (PI) and particle size index (PSI) (Pasha et al., 2010). NIR is used on wavelength 1100-
2500 nm and it is depending on the reflectance signal which is associated to the particle size.
Larger particle size is positively correlated to the NIR absorption and particle size increases
with hardness. Thanks to this, NIR can be used in all classes of whole grain wheats. (AACCI
Method 39-70.02) NIR hardness categories are the following: extra hard >84; very hard 73-
84; hard 61-72; medium hard 49-60; medium soft 37-48; soft 25-36; very soft 13-24 and extra
soft <13 (Hrušková and Švec, 2009).
Single kernel characterization system (SKCS) generates data from measuring and crushing
300 kernel samples which takes approximately only 3 minutes. Individual kernels are weighed
and then crushed between the toothed rotor (Gaines et al., 1985). Weight, width and moisture
content of the single kernel is measured before crushing. Following to non-destructive
measuring, crushing measures the force needed to crush the kernel recorded as individual
crush response profile (iCRP). All these measurements are taken into consideration while
mathematically calculating the SKCS HI (hardness index). SKCS HI is non-rheological
computed interpretation of the hardness and due to that highly variable between kernels.
Hard-medium-soft categorization is used in SKCS HI as following: supersoft <25; soft 25,1-
45; medium hard 45,1-65; hard 65,1- 85 and premium hard from 85,1 to 100 (Haraszi et al.,
2013).
Recently, a new hardness index has been developed by Réka Haraszi et al. named rheological
hardness index (RHI), which provides better categorization of hardness than SKCS hardness
indexes do. SKCS RHI is based on the rheological phenotype phases of the averaged crush
response (aCRP). RHI takes endosperm response (EndoR) and endosperm collapse (EndoC)
into consideration providing more information about the fracturing of the hard and soft
wheats. RHI is calculated by EndoR/EndoC. New RHI also brings new categorization as
following: soft < 1,5; medium hard 1,5-2,1, hard 2,1-4.0 and extra hard >4.0. It is even
suggested by the authors that hard category should be divided into two subcategories:
RHI=2,3-3.0 and RHI= 3.0-4.0 (Haraszi et al., 2013)
1.3.1 Protein markers
Different protein markers have been used since 1970s. Main protein markers are storage
proteins like prolamin and globulin storage proteins of cereals. For different protein markers
like gluten proteins (gliadins and glutenins) in wheat, Sodium Dodecyl Sulphate
Polyacrylamide Electrophoresis (SDS-PAGE) is used mainly for analysis. Gliadins are
monomeric proteins while glutenins are polymers forming several subunits connected by

18
disulphide bonds (Lafiandra et al., 2007). SDS-PAGE separates glutenin to High Molecular
Weight Glutenin Subunits (HMW-GS), Low Molecular Weight Glutenin Subunits (LMW-
GS). Modified forms of same protein or slightly different structure variants like gliadin
groups (ω-gliadins) are tested with Acetic Acid-Urea Polyacrylamide Electrophoresis (A-
PAGE), which at pH=3.0 is able to separate proteins with similar size, but different charge
(Institute of molecular development, LLC, 2001)(Morell and Gale, 2002). Protein markers for
different members of the starch biosynthetic pathway, like granule bound starch synthases
(GBSSI or waxy proteins) which are related to amylose and amylopectin ratios of starch can
also be tested using SDS-PAGE (Lafiandra et al., 2007). A-PAGE and SDS-PAGE usually
complete each other and are invaluable methods in seed storage protein research.
1.3.2 Antibody-based marker assays
Immonassay is based on the presence or concentration of a macromolecule like protein in the
solution. There is a small number of antibody based marker assays available regarding the
wheat quality. These diagnostic antibody markers are usable with high throughput enzyme-
linked immunosorbent assay (ELISA). Antibody-based marker assays for granule-bound
starch synthase-1 (GBSS-1), amylase expression levels in wheat grain for the prediction of
starch quality and tests for gluten-free foods are known. Most interesting to our part,
antibody-based detection for bread wheat contamination with durum wheat based on friabilin
detection has been developed (Gale, 2005)
1.3.3 DNA- based markers
Since early 1990s, several DNA-based molecular markers (RFLPs, RAPDs, AFLPs and
microsatellites) have been developed and used for the genetic analysis of quantitative and
qualitative characteristics of wheat (Blanco et al., 1996). Main molecular markers used in
wheat MAB are resistance markers for leaf rust, stripe rust, fusarium head blight (FHB) and
other plant diseases to help create resistant lines of wheat (Mammadov et al., 2012). The main
advantage of DNA-based assays is that DNA can be extracted from any tissue and the results
are not depending on the plant growth and development conditions (Morell and Gale, 2002).
The simple molecular marker methods are usually divided into two groups: PCR-based
techniques such as microsatellites (SSR), identification of SNPs and AFLPs and non-PCR
based techniques like RFLPs. PCR-based techniques can be divided in two subcategories:
linked markers like SSR and AFLPs. Secondly, direct markers are known. Direct DNA-
markers are genes and their testing is based on the presence/absence of the gene or are

19
targeted to the fragment of the gene for a specific allele. Insertion/deletion mutations can be
targeted with allele specific (AS) PCR to identify SNPs (Morell and Gale, 2002). In case of
molecular PCR methods, a few milligrams of leaf or seed could be enough for extraction of
DNA and conducting as much PCR tests as needed. As the PCR assay recognizes specific
molecular regions in the sequence (whole genes or gene fragments, microsatellites, SNPs) the
results give specific and detailed knowledge about the hardness genotype.
Each of the molecular methods also have their advantages and disadvantages. RFLPs require
large amounts of clean, not degraded DNA and the technique is quite complex, slow and it
cannot be automatized. AFLPs are useful for creating high density maps, but the low
information content of each data point makes them not easy to use on other populations, so
this non-correlation is the main disadvantage of the use of AFLP markers. Microsatellites are
widely used in mapping and breeding. The advantages of SSRs are the high portability from
one germplasm to another and that the high degree of polymorphism provides efficient marker
systems. However, previous genetic information is needed.
1.3.3.1 Puroindolines as markers for hardness
Although the trait of interest is named kernel hardness, actually the softness is the dominant
characteristic in puroindolines meaning that any mutation in the gene causes harder kernel.
Puroindolines are perfect markers as the genes can be easily targeted with specific primers
and tested using PCR. Usually the presence or absence of the wild type (Pina-D1a) is tested
by puroindoline-a. In case of puroindoline-b wild type (Pinb-D1a) and the most common
alleles containing mutations are tested. For example Pinb-D1b allele-specific primer is used to
detect mutation at nucleotide position 233 causing glycine to serine change, resulting with
hard phenotype. Conclusions are made based on the PCR results. If both puroindolines are
wild type (Pina-D1a/Pinb-D1a) the phenotype of the endosperm is always soft. In case of the
genotypes Pina-D1a/Pinb-D1b; Pina-D1a/Pinb-D1d; Pina-D1b/Pinb-D1a and Pina-
D1b/Pinb-D1b the hardness characteristics are mixed, but they are definitely in the hard
category. Haplotypes Pina-D1b/Pinb-D1b give the hardest trait. Durum wheat lacks of
puroindolines because of the absence of the D-genome, hence it is always hard. As several
puroindoline alleles have been sequenced, it is possible to design more allele-specific primers
for unreported mutations and used for screening. Although, it has to be kept in mind that
wheat itself is quite a complex subject of research as its hexaploid nature makes developing of
allele-specific markers quite difficult due to the highly homologous genes and homologous
loci it is possible to amplify areas not in our interest (Morell and Gale, 2002). So, while
designing primers to amplify the specific allele or region to our interest, several controls of

20
the sequences should be completed. For example, in case of designing primers for
puroindoline-a also the puroindoline-b and granule softening protein-1 should be checked as
they share high nucleotide sequence similarities.
1.3.3.2 Other markers related to the endosperm texture
Several studies have showed that although puroindolines of the main hardness (Ha) locus on
chromosome 5D are major determinants of the wheat endosperm texture, the puroindolines do
not explain all the variation of endosperm hardness. As found by Bettige and Morris (2000) in
soft wheats the variation of the hardness was related o cell-wall associated pentosan fraction.
Reported regions contributing to kernel hardness are found in chromosomes 2A, 2D, 5B, 6D
and a major QTL found in 1A plus adding the regions which have indirect influence such as
in chromosomes 5A, 6D and last but not least 7A (Wang et al., 2012). No such relation had
been noticed by hard wheats. Besides the major Ha locus, other chromosomes influence the
hardness, but till this day, minor effects of other chromosomes have been noticed between
hard and soft wheats (Crepieux et al., 2005). Identifying the additional genes and QTL which
control this trait is important for plant breeding (Tsilo et al., 2011). It is also a possibility, that
the hardness is controlled by the two main genes – puroindoline-a and puroindoline-b, but
modified by one or more minor genes.
The main parameters which indirectly measure hardness are density and virtuousness (Faqir
M Anjum and Walker 1991). Therefore not only molecular markers of endosperm texture are
the only importance, but to also find molecular markers for density and vitreousness.
Vitreousness is expressed as a percentage and usually was determined visually by cutting the
wheat kernel in half (Ouafi, 2001). The percentage of vitreousness shows the percentage of
the transparent kernels (Gómez-Becerra et al. 2009). Based on the US Official Standards of
Grain, subclasses for Hard Red Spring and Durum wheat are based on the percentage of the
vitreous kernels (Morris and Beecher, 2012). Finding molecular markers for this trait would
make plant breeding and classification easier and faster. So far, the vitreousness of the kernel
was mainly tested on tetraploid T. durum, but lately there have been more and more reports to
test this feature also on hexaploid T. aestivum as some parts of the durum wheat genome may
be also found in bread wheat as they share a common ancestor.
Kernels which are vitreous have continuous endosperm from which the light refracts in a way
that the kernel looks “glassy” or also called “vitreous”. In case of the non-vitreous kernels the
structure of the endosperm is discontinuous and contains small airspaces (Morris and Beecher,
2012). The opaque or mealy non-vitreous kernel is related to softness and low protein content
21
while vitreous kernel is known to be related to hardness and high protein content (Anjum and
Walker, 1991). Higher N fertility results with higher proportion of vitreous kernels and also
with higher grain protein content (Morris and Beecher, 2012). So, both hard and soft wheats
can be vitreous or non-vitreous. This is probably because of the environmental effect as
vitreousity is influenced by nitrogen fertility.
Figure 2 Field emission scanning electron micrographs. a, b A soft wheat kernel shows
the non-vitreous kernel morphology and high degree of free starch granules. c, d A hard
wheat kernel shows the vitreous kernel morphology and continuous endosperm matrix
with no free starch granules. (Morris and Beecher 2012)
According to work of Morris and Beecher (2012) the connection between the hardness of the
kernel and vitreousness is noticeable, although it may not be the direct result of the
puroindoline proteins, but some other genes located in the distal end of the 5DS which are
deleted or carry a mutation in hard wheats.
Previously mentioned hardness is a mechanical property, vitreousness an optical one and
density is physical (Samson et al., 2005). Higher density is related to higher protein content
where accumulation of gliadin is preferred. Unit of density is g/cm3. Density is highly related
to moisture content, hence this should be taken into consideration while measuring density
with physical methods (Peters and Katz, 1962). Markers for density are also in interest as they
are related to the hardness indirectly.

22
1.4 High resolution melting analysis
Although standard PCR method is a well working way for screening it is not always able to
give the necessary information. In 2002 a new method was introduced named High
Resolution Melting DNA analysis which is based on a special HRM-PCR technique (Reed et
al., 2007). HRM is a good method for genotyping, sequence matching and mutation scanning.
It is based on the melting temperature of the PCR products and melting profile which is
depending on the GC%, length of the PCR product and heterozygosity. Mutation scanning is
depending on the forming heteroduplexes which change the profile of the melting curve (Reed
et al., 2007). New generation saturating dyes like EvaGreen are used while disassociation of
dsDNA samples is measured for generating melting curve. New generation dyes are used as
they do not inhibit PCR reaction and bind equally to GC- and AT- rich regions (Lochlainn et
al., 2011). This technique is also applicable for identifying SNPs, the sensitivity of this
method with products up to 400 bp is 100%. For that reason, primers used for HRM-PCR are
usually maximally 300 bp long including the primers. As there is no need for further
processing after HRM-PCR, samples containing mutation can be used for sequencing. Main
benefits of this system is the high throughput and closed tube system, by which lots of
samples can be analyzed and the risk of contamination is small.

23
2 EXPERIMENTAL WORK
2.1 The aim of the experimental work
The main aim of this work is the molecular characterization and description of puroindolines
in different varieties. Forty-nine (49) historical and 12 varieties of biofortification was tested
in Kazakhstan group. The aim for Kazakhstan group was to screen the puroindoline genes.
From Australian group 106 varieties was used. As Australian group had been tested before for
puroindoline-a and puroindoline-b, the aim for this group was to test and develop new
markers for later comparison with SKCS RHI. The other purpose of this work was to test the
reliability of new molecular markers which were in QTL loci and exceeded the significance
threshold as reported in literature. As mentioned before, the most common alleles in modern
cultivars are Pina-D1a, Pinb-D1b and Pinb-D1c. This lead to the idea to test puroindolines on
the Kazakhstan historical group (in this thesis).
This thesis is a part of international collaboration where these samples were tested also for
protein content, patterns for different storage protein groups (HMW-GS, LMW-GS, gliadins,
mixing parameters, size distribution of storage proteins in the flour) and NIR. The molecular
background for hardness has been assessed in this work.
2.2 Materials and methods
2.2.1 Seed sterilization and plant growth conditions
The seeds of the Kazakhstan lines sets H (historical) and B (biofortification) were used. The
seeds were separately placed to previously marked 100 ml Erlenmeyer flasks and sterilized in
3% hydrogen peroxide (H2O2) for 15 minutes. Flasks were placed under running tap water for
rinsing overnight.
Hydroponic method for growing plants with 1/4 strength modified Hoagland solution
(Appendix 1) was used. Seeds on marked beakers were placed to the dark chamber for
germination for 2 days. After the dark period seeds were placed to climate controlled growth
chamber (Fitotron, SANYO) for 8-12 days with 14/10 hours day/night photoperiod with light
intensity of 200 µmol m -2
s-1
. Temperature regime was 24°C/18°C at day/night, respectively.

24
2.2.2 Genomic DNA isolation and purification
Plant leaf tissue was harvested and plant genomic DNA (gDNA) was extracted/isolated using
AquaGenomic™ kit from MultiTarget Pharmaceuticals. Manufacturers’ instructions were
followed with some modifications. The concentration and quality of the nucleic acid sample
was measured by using NanoDrop® ND-1000 Spectrophotometer. Special attention was
drawn to the absorption curve and to 260/280, 260/230 ratio. The stock samples were stored
at -20°C. Working solutions were adjusted to 40 µl/ml using MQ water.
2.2.2.1 Aqua Genomic Plant Protocol –pestle and mortar
25mg of plant tissue was harvested from upper 1/3 of the leaf from 14 days old plants. Small
amount of sterilized quartz sand and according to the larger amount of plant tissue used,
250µl AquaGenomic Solution was added. During homogenization at room temperature, 1/10
volume (30µl) of 100% 2-propanol was added to reduce the foaming. The samples were
transferred to 1,5 ml Eppendorf tube and VORTEXed vigorously for 30 seconds and
incubated at 65°C for 15 minutes. The mixture was rotated gently in every 5 minute during
the incubation. Five minute centrifugation at 12,000 x g was used to pellet the debris. Clear
lysate (approximately 185µl) was transferred to a clean 1,5 ml Eppendorf tube. 1 volume
100% 2-propanol was added to the lysate and VORTEXed vigorously for 60 seconds. To
pellet the DNA Eppendorf tube was centrifuged at 12,000 x g for 5 minutes and the
supernatant was carefully discarded . After the pellet was washed twice with 70% ethanol and
air-dried it was dissolved in 100µl 1xTE buffer.
For further DNA extraction, if it was necessary extra tissue was collected and lyophilized.
100mg tissue was put into Eppendorf tube, closed with Parafilm M® Laboratory Film and
holes were made on it using needle. Lyophilization was carried out in a SpeedVac®Plus,
Savant equipment. The freeze dried tissues were stored at +4°C.
2.2.2.2 AquaGenomic Plant Protocol – Eppendorf method
Because the Australian samples were delivered as lyophilized tissue a modified method was
developed for DNA extraction. Only 8 mg dry tissue was grinded with sterilized quartz sand
in Eppendorf tube using glass rod with cone end. 100 µl AquaGenomic solution was added to
the powder and mixed for another 5 minutes. After homogenization 15µl of 2-propanol was
also added and the tube was incubated at 65°C for 10 minutes. Samples were centrifuged at
12, 000 x g for 10 minutes (Heraeus Biofuge Pico, KENDRO). Lysate was transferred to new
Eppendorf tube and 1 volume (approximately 15µl) 2-propanole was added followed by
vigorous VORTEXing for 60 seconds. Samples were centrifuged at 12,000 x g for 5 minutes.

25
The discarding of the supernatant and centrifugation was completed followed by two washing
steps with 70% ethanol. DNA was dissolved in 50 µl 1xTE buffer.
All PCR reactions were carried out in the volume of 10µl. For general PCR and optimization
procedure, determining the annealing temperature and the appropriate MgCl2 concentration
the following general reaction mixture was used as starting point:
0,5 µl of polymerase (Taq or Pfu, Fermentas; Thermo Scientific)
1µl of 10X buffer (-MgCl2) (Fermentas; Thermo Scientific)
0,5 µl of 10µM (0,5µM) Forward primer (Mycrosynth)
0,5 µl of 10µM (0,5 µM) Reverse primer (Mycrosynth)
0,5 µl of 10 mM dNTP (0,5 mM) (2,5 mM each deoxynucleoside phosphate)
0,6 µl of 25mM (1,5mM) MgCl2 (Fermentas; Thermo Scientific)
2 µl (80ng) of DNA template
4,4µl MQ water
The following general PCR programs was used:
Pre-denaturation: 95°C for 5 minutes
Denaturation: 95°C for 30 seconds
Annealing: APPENDIX II
Extension: 72°C for 12-35 seconds
Post-extension: 72°C for 2 minutes
PCRs were conducted with thermocyclers ICycler™ Version 2.033 (Bio-Rad). Additional
information on all the Primers used during my work can be found under APPENDIX II.
2.2.3 Gel-electrophoresis
Gel-electrophoresis was used to separate the DNA molecules using 1-2% (w/v) agarose gel
depending on the size of the product. Agarose was made with 1x Tris-acetate (TAE) buffer.
For electrophoresis RunOne™ Eletrophoresis Cell (EmbiTec) was used. Samples were loaded
using bromophenol blue or xylencianol as loading dye. GeneRuler™ 1kb DNA Ladder
X 36

26
(Fermentas, Thermo Scientific) was used to assess the length of the DNA fragment. Samples
were run in 1x TAE buffer and stained in ethidium bromide solution (0,5 µg/ml) for 10
minutes and the bands were visualized under UV-light.
2.2.4 DNA purification from gel
For DNA purification from gel QIAquick Gel Extraction Kit microcentrifuge protocol was
used with minor modifications. All the centrifugation steps were carried out with 12,000 x g,
unless mentioned otherwise. After visualization under UV-light, the expected DNA fragment
was cut out, weighed and placed to 2ml Eppendorf tube. Three (3) volumes of Buffer QC was
added to 1 volume of gel (~100mg). The gel slice was incubated at 50°C until the gel was
dissolved completely. Add 1 gel volume 2-propanole and mix gently. QIAquick spin column
was placed to 2ml collection tube. For binding the DNA, the sample was applied on the
QIAquick column and centrifuged for 1 minute. Flow-trough was discarded. As the DNA was
used for direct sequencing, 0,5 ml Buffer QG was added to QIAquick column and centrifuged
again for 1 min. In the washing step, 0,75 ml of Buffer PE was added to the column and left
for 5 minutes at room temperature, followed by 1 min centrifugation. The flow-trough was
discarded and additional centrifugation for 1 min was completed. The column was placed into
new 1,5 ml Eppendorf tube. For DNA elution, 50 µl of 2 mM Tris buffer (pH=8) was added
to the center of the column membrane instead of elution buffer (EB). Centrifugation at 13,000
x g for 1 minute was followed. Concentration and quality of the gel-extracted DNA was
measured on NanoDrop-1000.
2.2.5 Cycle sequencing
For asymmetric PCR sequencing Big Dye®
Terminator V3.1 Cycle Sequencing Kit (Applied
Biosystems) was used. Final reaction volume for sequencing was 20 µl in which 200 ng of
template DNA, 3,2 µl of primer (1 µM), 2 µl of BD reaction mixture and 4 µl of Big Dye
sequencing buffer was used. The rest of the volume was sterile MQ water. Cycle sequencing
was conducted on thermocycler Icycler™ (Bio-Rad) with following program: initial
denaturation at 96 °C for 1 minute followed by 25 cycles of 96°C for 10 seconds, 55°C for 20
seconds, 60°C for 4 minutes and infinitive hold at 4°C. Amplified DNA (20 µl reaction) was
ethanol precipitated with the addition of 0.5 µl of 5M EDTA and 2 µl of 10M ammonium
acetate (pH=5) 55 µl of 96% ethanol. Sample was centrifuged 13,000 x g (Sigma 3-18K) at
4°C for 30 min. Supernatant was carefully removed and pellet was washed with 70% ethanol,

27
supernatant was removed and sampled was dried at 37°C. The tubes containing pellet and
purified DNA were sent to adequate laboratory for sequencing product analysis.
2.2.6 In silico sequence analysis
Sequences were analysed with Chromas Lite v2.01 (Technelysium Pty Ltd) program and
alignments were made with Blast® (NCBI). Unclear nucleotides in the sequence were
controlled manually by checking the chromatogram. For analysis of amino acid changes,
nucleotide sequence was translated into amino acid sequence with ExPASy Bioinformatics
Resource Portal.

28
2.3 Results and discussion
All PCR reactions were optimized to the highest possible annealing temperature using
gradient PCR as different final MgCl2 concentration (1,5mM; 2mM or 2,5mM) was also
determined to get the most specific and more trustable information.
2.3.1 Historic set results regarding puroindoline-a and puroindoline-b
In Kazakhstan H-set 49 varieties were tested (Table 10). For screening this set 6 primer pairs
were used. For detecting Pina Primpa1-3 was used and the results were checked with PAF-
PAR if needed. For Pinb wild type PBF and PBR was used. Pinb was also tested for specific
mutation allele Pinb-D1b with PBKF-PBKR. PCR reaction conditions and used primers can
be found in Table 8. Forty-four (44) varieties (89,80%) out of 49 were tested positive for Pina
(Pina-D1a allele) meaning that 44 varieties are Pina WT. Five (5) varieties (H10;
H12;H37;H38;H39) were tested as negative for puroindoline-a gene by PCR testing
(puroindoline null).
Table 4 Historical set results regarding Pina and Pinb
Puroindoline Pina Pinb
Result + - + -
Validation WT null mut WT null
Frequency in pool 44 5 43 3 3
Frequency % 89,80% 10,20% 87,76% 6,12% 6,12%
Regarding the results of Pinb three (3) varieties (H12; H19; H44) were tested positive for
Pinb-D1a allele. Forty-three (43) varieties were tested positive as puroindoline-b mutants.
These samples were checked with PBKF-PBKR primer pair which is Pinb-D1b allele
specific. PBKF-PBKR amplifies fragment with the size of 356 bp of Pinb-D1b allele.
According to the results from these tests it can be assumed that these mutants are Pinb-D1b
allele, which is the most frequent mutation of puroindoline-b gene. There is also a possibility
that there are mutants that share the same SNP as Pinb-D1b allele (Gly 46→Ser) does plus
some other mutation(s) in the amplified region. Irrespective of the mutation, based on this
information, the kernels with mutation should be harder. Three (3) varieties (H37;H38;H39)

29
were tested as Pinb null. The phenotypes of hardness based on the Pina and Pinb markers are
shown in the Table 5.
Table 5 Genotypes found in testing and their frequencies in the pool of Kazakhstan H-
set 49 samples
Genotype Pina-D1a/Pinb-
D1b
null/Pinb-
D1b
null/Pinb-
D1a
Pina-D1a/Pinb-
D1a
null/
null
Phenotype hard hard hard soft hard
Frequency
in pool 42 1 1 2 3
Frequency
% 85,71% 2,04% 2,04% 4,08%
6,12
%
The most frequent (85,71%) genotype was Pina-D1a/Pinb-D1b which gives hard phenotype.
Only two varieties have soft genotype with the frequency of (4,08%) in the H-set. Only
varieties carrying puroindoline-a and puroindoline-b alleles have soft phenotype as any other
changes like mutation or lack of the gene results with hard phenotype.
2.3.2 Biofortification-set results regarding puroindoline-a and puroindoline-b.
B-set refers to biofortification. Biofortification is the development of crops in means to
increase the nutritional value (Food et al., 2006). Traditional selective breeding or genetic
engineering is used to get these results. The samples of the B-set are nutritionally improved
varieties with fortified Zn+ content.
In Kazakhstan group B-set (Table 11) varieties were tested for Pina and Pinb. All 12 varieties
were tested as positive for Pina meaning that they carry the WT Pina-D1a allele. For Pinb all
11 varieties were tested as Pinb mutants and one WT (Eritrospermium-32), meaning that only
this variety has soft phenotype in this group based on DNA molecular markers for
puroindoline proteins. Five varieties from 12 were selected randomly for sequencing. For
sequencing the PCR product: Big Dye® Terminator V3.1 Cycle Sequencing Kit (Applied
Biosystems) was used. Whole puroindoline-b gene (477 bp) was sequenced using PBF-PBR.
Sequencing of one variety was carried out twice. Asymmetrical sequencing with PBF and
PBR primers was used. This way, the often “unreadable” first 50 nucleotides can be read from
the other end of the chromatogram. The sequence chromatogram was controlled manually for
possible mismatches from both strands. Sequence analysis showed that variant B7

30
(GVK1369-2) and B-26 (Golubovskaya) are Pinb-D1b allele containing mutation at position
223 resulting with Gly to Ser substitution. In case of B-6 (Stepanya 1), B-12 (Lutescens 53-
95) and B-31 (Iren) new alleles were found. B-6 has an A to G substitution at the position 128
plus G to A leading to Gly to Ser change and at 223. This is common for Pinb-D1b allele, but
allele with these two mutations in one sequence has not been reported taking the latest review
into consideration (Morris and Bhave, 2008). B-12 has substitution in position 382 where C
changes to T which concludes with Gln being substituted with STOP codon. This C to T
substitution has been reported in Pinb-D1ab allele catalogued in 2007 (Morris and Bhave
2008). Additionally in B-12 position 257 a G to A change was found which results in Cys to
Tyr substitution. In case of B-31 in nucleotide position 22 a G to T (Ala to Ser) as in Pinb-
D1v and 266 T to C (Pro to Leu) like in Pinb-D1c was found, plus in position 63 C→T
without change in amino acid sequence.
From information gathered from sequencing B-set Pinb mutants it can be concluded that
many alleles carry the frequent substitution in position 233 plus some other SNPs. Based on
this, SNP identification in other locations using high resolution melting PCR (HRM-PCR) or
sequencing should be done on remaining B-set and H-set puroindoline-b mutants which tested
positive for Pinb-D1b allele but may also carry double SNPs
2.3.3 HRM-PCR primers optimization
Primers found in Error! Reference source not found. were designed specifically for HRM-
CR which requires quite short product size (max 250-300 bp including primers). Overlapping
primers were designed for HRM-PCR with the aim to identify puroindoline polymorphisms.
Designed primers were tested using standard PCR method. With primer pair Pura-J1F and
Pura-J1R several optimization reactions of annealing temperature and MgCl2 concentration
were carried out, since there was no clear amplification at 56°C as designed. After the
optimization the optimal annealing temperature of 59°C and 2,5mM MgCl2 was determined
for this primer pair. In case of the Purb-J1F – PurbJ1Rd the optimal annealing temperature
was 63°C with final MgCl2 concentration of 2mM. Letter d in the end of the PurbJ1Rd refers
to degenerative primer in which S=G+C in the sequence for the primer to be able to amplify
all alleles needed. No further optimization was needed with the other primers and optimal
annealing temperatures are shown in the Table 13Error! Reference source not found. All
eight primers were tested on 9 samples [B-6; B-12; D-21; D-23; H-36; H-42; K-22, K-123
and MV-SUBA (+ control)] and all were tested positive, meaning that these oligonucleotides

31
are able to anneal to the sequence. In future, these primers will be tested with HRM-PCR for
detecting polymorphisms
2.3.4 Historic set results regarding the puroindolineb-2 alleles
Screening of puroindolineb-2v alleles was conducted as Pinb-2 variants have been reported as
minor QTL for hardness (Wilkinson et al., 2008). Based on the information gathered from the
screening of H-set with Pina and Pinb, we could group the varieties as soft and hard. For finer
categorization among soft group, Pinb-2v alleles were tested. Primers and conditions used for
screening can be found in Table 9. General PCR program was used.
In Kazakhstan group, only historical (H-set) was tested for puroindolineb-2v alleles. Forty-
nine (49) samples were tested in this group (Table 10). Regarding Pinb-2v1 (Pinb-D2a) all 49
varieties were tested positive, in which H49 was tested positive, but had an extra band on 500
bp and H54 had a faint positive (+f WT) band.
Figure 3 Pinb-2v1 H-set. Lane 1 MWS, lane 2 H43; lane 3 H44; lane5 H47; lane 6 H48;
lane 7 H49; lane 8 H50; lane 9 H51; lane 10 H52; lane 11 H53; lane 12 H54;lane 13 B6 (+
control); lane 14 NTC.
Pinb-2v2 (Pinb-B2a) had no WT Pinb-2v2 variants. All 40 varieties were tested as Pinb-2v2
negative, meaning that they are a “null” type of Pinb-2v2 as there was no amplification. The
50th
sample, positive control Chinese Spring was tested as WT Pinb-2v2 as expected. Pinb-
2v3 (Pinb-B2b): 47 samples were tested as WT puroindoline-2v3 (Pinb-B2b allele). Two
samples (H7 and H48) gave a “null” amplification. Chinese Spring was used as negative
control. Pinb-2v2 and Pinb-2v3 have been reported to be allelic and not to exist together. In
this case it can be said that this is not the case in this group as varieties H7 (Omskaya 26) and
H48 (Omskaya 28) were both tested as Pinb-2v2 and Pinb-2v3 negative. In case of Pinb-2v4
(Pinb-A2a) all 49 samples were tested positive as wild-type Pinb-A2a.
According to this, no variation was detected in Pinb-2v1 and Pinb-2v4 as they have been
detected in all common wheat varieties tested. Based on this data, it can be concluded that 45
samples out of 47 had the following genotype: Pinb-2v1/ Pinb-2v3/Pinb-2v4. Two samples
H7 (Omskaya 26) and H48 (Omskaya 28) having a genotype Pinb-2v1/Pinb-2v4 lacking the

32
both Pinb-2v2 and Pinb-2v3 allele. According to this it can be said that variants with genotype
Pinb-2v1/ Pinb-2v3/Pinb-2v4 are probably harder than those containing other alleles.
2.3.5 Australian set results regarding puroindolineb-2 alleles
Australian set was also screened for Pinb-2 variants. PCRs were carried out only on soft
varieties as Pinb-2v2 marker is reported to make difference among soft wheats. As Pinb-2v3
was reported allelic and as a dominant haplotype, tests with Pinb-2v3 were conducted. The
Australian group was tested only on 42 varieties. Results can be seen in Table 12. Six samples
were tested negative for Pinb-2v3. All the tests were completed twice and the same results
were gained. Later on, the negative samples were tested separately with Pinb-2v3 and Pinb-
2v2 markers. Varieties with Pinb-2v3 should be harder in soft group than those containing
Pinb-2v2. It is likely that these 6 varieties (Bungulla, Chinese Spring, Isis, Kondut,
Macquarie, Tatiara) are softer among soft group. The results of SKCS RHI are needed for
comparison and conformation.
According to works of Chen and Zhang (2011), Geng and Beecher (2012), Pinb-2v3 is the
predominant and most frequent allele. Our work with Australian group confirms that Pinb-
2v3 is more frequently occuring than Pinb-2v2. According to our Australian group results
among soft wheats, Pinb-2v2 variant was detected in 6 samples (14,28%) and the occurance
of Pinb-2v3 was 36 samples – (85,72%) from the pool of 42 samples. Statistical analysis for
sample variance was not carried out as the number of samples is not adequate.
Based on the hypothesis of Chen et al., (2013) that the higher SKCS HI can be correlated
with the higher expression level of Pinb-B2v3b allele, the author of this thesis suggests that
Pinb-2v3b allele expression level measurments should be carried out in the future.
2.3.6 Marker development for seed vitreousness and density
New molecular markers with promising QTL were searched from the articles. From five
markers selected, Xgwm107 (vitreousness) was chosen as it was only microsatellite in our
group of markers which could be tested by PCR. This QTL is known to be located in the long
arm of the 4B chromosome. Relative importance of the this QTL in influencing a trait (QTL
R2
%) is reported to be 12 %. (Ouafi, 2001)
Vitreousness marker was tested on different hardness category durum wheat samples provided
by Martonvasar Research Institute, Hungary. During the optimization following program was
used 95° for 5 min, 95° for 30 sec, 65° for 30 sec, 72° for 30 sec and lastly 72° for 5 min, 10°

33
hold for ∞, repeated 40 cycles. The annealing temperature was raised till dissapearing of the
products at 67°C. Optimal annealig temperature was determined to be 65 °C with 2mM
MgCl2 concentration.
Figure 4 Agarose gel-electrophoresis 1,5% gel with different hardness type durum
wheats. Lane 1 MWS, Lane 2 Pennedur I, lane 3 Pennedur II, lane 4 Hundur, lane 5
Semperdur and lane 6 NTC.
Table 6 T.durum samples used in vitreousness testing with Xgwm107F-R, 65°C. The
information about durum wheat vitreousness types was known previously and selected
for marker control
Variety Vitreousness Result
Selyemdur chalky, mealy ++
Makaroni good vitreous (opaque in case of watery
environment) -+
Pennedur good vitreous ++
Hundur good vitreous - /-+
MV-Vitaldur very good vitreous ++
Svevo (Italian) spring wheat, international control No data
Semperdur (Austrian) spring wheat, international control -+
According to the tests on these samples, even after PCR optimization, this marker could not
make clear difference between different hardness index varieties. Due to that, this marker was

34
not tested further on Australian group. The testing for this marker will be continued. Search
for better molecular marker identifying vitreousness characteristics in wheat kernels should be
continued.
From five (5) density markers, an STS marker was chosen for testing. As no PCR markers
were found for wheat, marker Mwg770 with the R2 of single marker effect =10% was used
(Campbell et al., 1999). According to the GrainGenes this marker has been used on barley.
This marker was tested on samples of wheat for the reason that many conserved regions has
been reported in cereals. Following varieties from soft group (20) were used: Bencubbin,
Bolero, Bungulla, Capelle deprez, Capitole, Centauro, Chinese Spring, Ghurka, Insignia,
Insignia 49, Kewell, Libero, Mersey, Pinnacle, Ranee, Robin, Summit, Tincurrin and Zenith.
Density marker was also tested on three (3) hard wheats: Soissons, Golia and Wildcat – all
tested positive.
Even after optimization, this marker gave two products after gel-electrophoresis imaging. One
at the expected size of 195 bp and another approximately at 250 bp. First of all this marker
was tested on barley to check whether it results with double-band also.
Figure 5 Lane 1 MWS, lanes 2 and 3 wheat, lanes 4and5 barley, lane 6 empty, lane 7
NTC. On this photo, it can be seen clearly that barley gives one strong band at 195 bp,
but wheat samples give a double band, one on 195 bp and other on approximately 250
bp.
For finding out if the longer product was caused by the D-genome, the same marker was also
tested on durum wheat. The same double-band appeared also in durum wheat samples.
According to this, the amplification of the longer product was not because of the D-genome as
it is absent in durum wheat. As it can be seen on Figure 5 the barley samples give perfect
products at 195 bp when wheat samples are a bit longer. This suggests that the amplification

35
of the wheat products is not perfect as both bands are higher. This marker needs to be tested
further whether it would be suitable to use as wheat density marker before using it on larger
pool of samples.
2.3.7 Marker development for wheat seed hardness
A new hardness marker was chosen from 42 markers found in the literature. A hardness
marker Xcfa2153 located in the 1AL chromosome was reported significant (Arbelbide and
Bernardo, 2006). This marker had not been associated with hardness previously. The marker
was chosen because of its location in the end of 1AL as in this region more markers and QTL
have been reported related to kernel hardness.
Optimal annealing temperature was 60°C for 25 seconds with 2mM MgCl2 concentration. The
extension time in 72°C was decreased to 12 seconds as tests in the workgroup showed that
Taq polymerase (Thermo Scientific) can extend the chain faster than 1000 bp/min. As 200 bp
product was expected, the PCR samples were run on 1,5% (w/v) agarose gel. After clear
amplifications the marker was tested on all 106 Australian hexaploid bread wheat and
tetraploid durum wheat varieties where clear differences could be seen. Further specific
determination of the length of every single product should be determined to make
conclusions.
Figure 6 PCR-results using Xcfa2153F-R primers. 200 bp fragment was expected, but
fragments from 210 bp to 280 bp were gotten.
As it can be well seen on Figure 5, this marker gives as several different length products
referring that it may be marker with fragment length polymorphism. The exact size of these
bands was determined by calculating the distance of the bands using program Phoretix 1D
(Phoretix International). The sizes were compared with the GeneRuler 1kb (Thermo
Scientific) ladder and the possible lengths of the products were calculated logarithmically
using MS Excel. Based on this, the products could be divided into 4 or 5 groups as following:
190 bp, 200 bp, 210 bp and 250 bp and 280 bp. According to these results the author suggests
that further research and development for this marker is needed. Probably Xcfa2153 could
give us a marker with size difference to detect kernel hardness.
36
CONCLUSION
The use of molecular markers closely related to QTLs of interest allows precise and fast
breeding processes. That makes usage of molecular markers simple and perfect way to
improve modern plant breeding. Although, molecular methods cannot replace the traditional
methods completely as the environmental influences play a huge roll in the selection of wheat
lines. Puroindolines have been proved to be perfect markers for seed endosperm texture as
they determine the hardness of the kernel genetically and no environmental influence is
known.
Plants were grown from seeds to extract genomic DNA from plant tissue. Clean gDNA was
necessary for the PCR reactions. In the Kazakhstan group puroindoline-a and puroindoline-b
WT and mutant genes were screened with PCR. Optimizations of the PCR reactions were
conducted by varying by MgCl2 concentration and modifying annealing temperatures. In
Kazakhstan group H-set our results proved that Pina-D1a is the dominant allele occurring
89,90% in the set. Pina-D1b was the second most common allele also referred as “null” allele.
In case of puroindoline-b, mutant allele Pinb-D1b is the frequent allele (87,76%) as reported
also by others. Three Pinb-D1 nulls and four Pinb-D1a alleles were detected. B-set of
Kazakhstan group was also tested for Pina and Pinb. All 12 varieties were tested as WT
puroindoline-a. In case of Pinb, only one variety B-32 (Eritrospermum 78) was tested as WT,
8 alleles were established as Pinb-D1b mutant and 3 alleles have not been reported, so
possibly new alleles were identified by sequencing.
In the second part of this work, four (puroindoline b-2, Mwg770, Xgwm107 and Xcfa2153)
other markers were tested with the aim to develop a new marker and for using them as
indirect markers for hardness. Puroindoline b-2 gene family has been reported previously as a
significant marker and was used for screening. The aim was to use and develop markers
which would be able to separate the mixed category of endosperm hardness or to make
difference inside the wheat hardness soft categories (soft and extra-soft). From four new
markers, Xcfa2153 seems the most promising as it gives several different products around 200
bp. Based on testing this marker on 106 Australian varieties, it can be assumed that Xcf2153
may be a marker with fragment length polymorphism. Regarding this marker, comparisson
with SKCS HI/RHI and statistical analysis should be carried out. Unfortunately, the author
has to admit that in this work the developing and testing of new QTL markers had unexpected
difficulties and more tests are needed to obtain significant information. In the future the Pinb-

37
2v3 variant needs to be tested more specifically and expression levels of Pinb-2v3b should be
determined and compared with the SKCS HI results.
The author would like to emphasize the importance and the reliability of using puroindoline
markers in wheat breeding in means of kernel hardness. In the future perspective more
molecular DNA markers should be developed for different traits connected to kernel hardness
to provide more specific information about the traits of the lines to breeders.

38
Terise tekstuuri molekulaarsete markerite uurimine harilikus nisus
(Triticum aestivum)
Jaanika Udam
Resümee
Hariliku nisu (Triticum aestivum L.) endospermi tekstuuri mõjutavate tegurite
väljaselgitamine on oluline soovitud omadustega nisutoodete valmistamist võimaldavate
sortide aretamisel. Kaasaegses sordiaretuses on geneetiliste markerite tuvastamine
kvantitatiivsete tunnuste lookustes (QTL) ja nende kasutamine muutunud üha olulisemaks.
See lihtsustab soovitud tunnustega nisusortide saamist. Puroindoliinid on oluliseimad
markerid määramaks nisu terise kõvadust endospermi tekstuuri muutuste kaudu.
Käesoleva bakalaureusetöö kirjanduse ülevaates on käsitletud puroindoliinide geenide poolt
kodeeritud valkude osa nisu endospermi tekstuuri määramises, samuti on antud ülevaade
puroindoliinide geneetikast ja nende geenijärjestuste mitmekesisusest. Puroindoliin-a (PINA)
ja puroindoliin-b (PINB) metsiktüüpi valgud põhjustavad pehme ja rabeda endospermi
tekstuuri, sest tärkliseterad on nõrgalt seotud valgulise maatriksiga. Jahvatamisel eralduvad
tärkliseterad tervetena, tagades hea kvaliteediga jahu, mis on sobilik küpsiste, kreekerite,
tortide ja teiste madala niiskusesisaldusega toodete valmistamiseks. Mutatsioonid Pina-D1
või Pinb-D1 puroindoliinide geenides tekitavad kõvema terise. Jahvatamisel saavad
tärkliseterad kahjustatud, seovad hilisemal kasutamisel paremini vett ja seetõttu sobib kõvema
terisega harilik nisu paremini leivatoodete valmistamiseks. Lisaks on kirjeldatud uut
puroindoliinide b2v multigeenset perekonda. Tutvustatud on nisuteriste kõvaduse kaudsete
tunnuste nagu klaasilisus ja tihedus molekulaarseid markereid.
Töö eksperimentaalses osas kasutati kahte erinevat katsetaimede rühma: Kasahstani rühm ja
Austraalia rühm. Kasahstani rühm omakorda on jagunenud kaheks: ajalooline H- (historical)
alarühm 49-st sordist ja B-(biofortification) alarühm 12 sordiga. Enamus markeritest on
kasutatavad pehme fenotüübiga sortidega. Seetõttu valiti Austraalia rühma 106-st sordist 43
sorti põhiliseks markerite testimiseks ja jäeti Triticum durum ja enamus terise kõva
fenotüübiga sorte kõrvale. Xcfa2153 oli ainus marker mida testiti kõigi 106 sordi peal.
Katsed tõestasid, et puroindoliin-a puhul on enimlevinud metsiktüüp (Pina-D1a) ja “null”
alleel (Pina-D1b). Mutatsioonid puroindoliin-a alleelis esinevad harva. Olukord puroindoliin-
b puhul on vastupidine. Kõige levinumaks on mutatsiooniline alleel Pinb-D1b, mille puhul
punktmutatsiooni tõttu nukleotiidses järjestuses, mille tõttu valgus glütsiin 46 positsioonis on

39
asendunud seriiniga. Kasahstani rühma B-alarühmast tuvastati sekveneerimisel kolm
puroindoliin-b alleeli, mida pole varem kirjanduses mainitud.
Puroindoliinidele sarnase aminohappelise järjestusega ja sarnaste omadustega Pinb-B2
variatsioonide puhul näitasid tulemused, et Pinb-2v1 ja Pinb-2v4 esinesid kõikides sortides.
Variante Pinb-2v2 ja Pinb-2v3 on peetud alleelseteks, kuid selles töös leiti ka kaks sorti, mis
olid nii Pinb-2v2 kui ka Pinb-2v3 null, ega sisaldanud kumbagi alleeli. Pinb-2v3 esineb
sagedamini kui Pinb-2v2. Kõige suuremat mõju terise tugevusele Pinb-B2 perekonnas on
täheldatud Pinb-2v3 alleelil (Geng et al., 2013). Selle alleeli täpne toimimismehhanism on
veel teadmata, kuid lisaks alleelispetsiifikale võib tegu olla erinevatest
ekspressioonitasemetest põhjustatud endospermi tekstuuri muutustega. Sellest tulenevalt
tuleks jätkata selle geneetilise markeri uurimist ekspressioonianalüüside kaudu.
Uute terise klaasilisuse ja tiheduse molekulaarsete markerite katsetamine ei andnud üheselt
mõistetavaid tulemusi. Vajalikud on edasised katsed ja SKCS (single kernel characterization
system) kõvadusindeksi andmed. Lisaks klaasilisuse ja tiheduse markeritele testiti ka uut
kõvaduse markerit Xcfa2153. Uutest markeritest on Xcfa2153 kõige sobivam kasutamiseks,
sest annab PCR analüüsil 4 kuni 5 erineva pikkusega produkti. Xcfa2153 puhul võib tegu olla
fragmendi pikkuse polümorfisimi sisaldava molekulaarse markeriga. Edasised uuringud on
vajalikud, määramaks markeri usaldusväärsust pehme ja väga pehme fenotüübiga sortide
eristamisel.
Töö autor soovib rõhutada molekulaarsete markerite uurimise ja kasutamise olulisust
kaasaegses sordiaretuses. Molekulaarsed DNA-põhised markerid annavad kiire ja
usaldusväärse võimaluse määrata sordi genotüüpi välistades seejuures keskkonnategurite
mõju.
40
REFERENCES
Anjum, F. M. and Walker, C.E., (1991). Review on the Significance of Starch and Protein to
Wheat Kernel Hardness *. Journal of the Science of Food and Agriculture, 56: 1–13.
Arbelbide, M. and Bernardo, R., (2006). Mixed-model QTL mapping for kernel hardness and
dough strength in bread wheat. Theoretical and applied genetics, 112: 885–90.
Békés, F. 2001. A búza endospermium szerkezetének szerepe néhány minőségi búzát termelő
országban, p. 25-35. In B. Zoltan, B. Géza, and M. János (ed.), A jó minőségű
keményszemű búza nemesítése és termesztése. MTA-MKI, KITE Mezőgazdasági
szolgáltató és Kereskedelmi Rt., Gabonatermesztési Kutató Közhasznú Társaság.
Mártonvásár; Nádudvar; Szeged, Magyarorszag.
Bettge, A. D., Morris, C. F. and Greenblatt, G. A., (1995). Assessing genotypic softness in
single wheat kernels using starch granule-associated friabilin as a biochemical marker.
Euphytica, 86: 65–72.
Bhave, M. and Morris, C. F., (2008a). Molecular genetics of puroindolines and related genes:
allelic diversity in wheat and other grasses. Plant molecular biology, 66: 205–219.
Bhave, M. and Morris, C. F., (2008b). Molecular genetics of puroindolines and related genes:
regulation of expression, membrane binding properties and applications. Plant molecular
biology, 66: 221–231.
Blanco, A., Di Fonzo, N., Laddomada, B., Pasqualone, A., Simeone, R., Troccoli,
A. 2000.Variation for grain protein content and identification of QTLs by molecular
markers in tetraploid wheats, p. 455-461 In : Royo, C., Nachit, M., Di Fonzo, N., Araus,
J.L. (ed.). Durum wheat improvement in the Mediterranean region: New challenges .
Zaragoza: CIHEAM. Zaragoza (Spain).
Blochet, J.E., Chevalier, C., Forest, E. et al. (1993). Complete amino acid sequence of
puroindoline, a new basic and cystine-rich protein with a unique tryptophan-rich domain,
isolated from wheat endosperm by Triton X-114 phase partitioning. FEBS letters, 329:
336–40.

41
Campbell, K.G., Bergman, C.J., Gualberto D.G. et al. (1999). Quantitative Trait Loci
Associated with Kernel Traits in a Soft ϫ Hard Wheat Cross. Crop Science, 39: 1184–
1195.
Chen, F., Xu, H.-X., et al. (2010). Physical mapping of puroindoline b-2 genes and molecular
characterization of a novel variant in durum wheat (Triticum turgidum L.). Molecular
Breeding, 28:.153–161.
Chen, Feng et al. (2013). Allelic variation and distribution independence of Puroindoline b-
B2 variants and their association with grain texture in wheat. Molecular Breeding, May.
DOI: 10.1007/s11032-013-9879-z
Chen, F., Zhang, F. et al. (2010). Association of Puroindoline b-B2 variants with grain traits,
yield components and flag leaf size in bread wheat (Triticum aestivum L.) varieties of
the Yellow and Huai Valleys of China. Journal of Cereal Science, 52: 247–253.
Chen, F., Beecher, B. S. and Morris, C. F. (2010). Physical mapping and a new variant of
Puroindoline b-2 genes in wheat. Theoretical and applied genetics,120: 745–51.
Crepieux, S., Lebreton C., Flament, P. and Charmet, G. (2005). Application of a new IBD-
based QTL mapping method to common wheat breeding population: analysis of kernel
hardness and dough strength. Theoretical and applied genetics, 111: 1409–1419.
Dai, Z. (2009). Starch Granule Size Distribution in Grains at Different Positions on the Spike
of Wheat (Triticum aestivum L.). Starch - Stärke, 61: 582–589.
Edwards, M.A. (2010). Morphological features of wheat grain and genotype affecting flour
yield Morphological Features of Wheat Grain and Genotype Affecting Flour Yield. PhD
thesis, Southern Cross University, Lismore, NSW.
Food, S. et al. (2006). Symposium: Food Fortification in Developing Countries. The journal
of nutrition, 136: 1064–1067.
Gaines, C.S., Finney, P.F., Fleege L.M. and Andrews L.C. (1985). Predicting a Hardness
Measurement Using the Single-Kernel Characterization System. Cereal Chemistry, 73:
278–283.

42
Gale, K.R., 2005. Diagnostic DNA markers for quality traits in wheat. Journal of Cereal
Science, 41: 181–192.
Geng, H., Beecher, B.S., Pumphrey, M., Zhonghu, H., Morris, C.F. (2013). Segregation
analysis indicates that Puroindoline b-2 variants 2 and 3 are allelic in Triticum aestivum
and that a revision to Puroindoline b-2 gene symbolization is indicated. Journal of Cereal
Science, 57: 61–66.
Gómez-Becerra, H.F. et al. (2009). Phenotypic correlations, G × E interactions and broad
sense heritability analysis of grain and flour quality characteristics in high latitude spring
bread wheats from Kazakhstan and Siberia. Euphytica, 171: 23–38.
Haraszi, R., Sissons, M., Tamas, L., Juhasz, A., Rakszegi, M., Anderssen, R.S. (2013)
Rheological Hardness Index for Assessing Hardness of Hexaploids and Durums. Cereal
Chemistry. Accepted for publication. DOI: 10.1094/CCHEM-10-12-0133-R
Hrušková, M. and Švec, I. (2009). Wheat Hardness in Relation to Other Quality Factors.
Czech Journal of Food Science, 27: 240–248.
Lafiandra, D., Sanguineti, M.C., Maccaferri, M. and Deambrogio, E. 2007. Molecular
markers and QTL analysis for grain quality improvement in wheat, p 25-50. In Varshrey,
R.K. and Tuberosa, R. (eds.), Genomics-Assisted Plant Iprovement, vol.2. Springer.
Lochlainn, S.O. et al. (2011). High Resolution Melt (HRM) analysis is an efficient tool to
genotype EMS mutants in complex crop genomes. Plant methods, 7:43.
Mammadov, J., Aggarwal, R., Buyyarapu, R. and Kumpatla, S. (2012). SNP markers and
their impact on plant breeding. International Journal of Plant Genomics, vol. 2012,
Article ID 728398, 11 pages. DOI:10.1155/2012/728398
Massa, A.N. and Morris, C. F. (2006). Molecular Evolution of the Puroindoline-a,
Puroindoline-b , and Grain Softness Protein-1 Genes in the Tribe Triticeae. J.Mol. Evol,
63: 526–536.
Miao, Y. et al. (2012). Expression, purification and antimicrobial activity of puroindoline A
protein and its mutants. Amino acids, 43: 1689–1696.

43
Morell, M.K. and Gale, K.R. (2002). Use of perfect markers in wheat quality. Acta
Agronomica Hungarica, 50: 263–274.
Morris, C. F. (2002). Puroindolines: the molecular genetic basis of wheat grain hardness.
Plant Molecular Biology, 48: 633–47.
Morris, C. F. and Beecher, B.S. (2012). The distal portion of the short arm of wheat (Triticum
aestivum L.) chromosome 5D controls endosperm vitreosity and grain hardness. TAG,
125: 247–54.
Morris, C. F. and Bhave, M. (2008). Reconciliation of D-genome puroindoline allele
designations with current DNA sequence data. Journal of Cereal Science, 48: 277–287.
Ouafi, I. (2001). Quantitative Trait Loci ( QTL ) determination of grain quality traits in durum
wheat (Triticum turgidum L . var . durum) PhD. Thesis, Cordoba, Spain.
Pasha, I., Anjum, F. M. and Morris, C. F. (2010). Grain hardness: a major determinant of
wheat quality. Food science and technology international = Ciencia y tecnología de los
alimentos internacional, 16: 511–22.
Peters, W.R. and Katz, R. (1962). Using A Density Gradient Column To Determine Wheat
Density. Cereal Chemistry, 39: 487-493
Ramalingam, A., Palombo, E. A. and Bhave, M. (2012). The Pinb-2 genes in wheat comprise
a multigene family with great sequence diversity and important variants. Journal of
Cereal Science, 56: 171-180.
Reed, G.H., Kent, J.O. and Wittwer, C.T. (2007). High-resolution DNA melting analysis for
simple and efficient molecular diagnostics. Pharmacogenomics, 8: 597–608.
Samson, M. F., Mabille, F. et al. (2005). Mechanical and Physicochemical Characterization
of Vitreous and Mealy Durum Wheat Endosperm. Cereal Chemistry, 82: 81–87.
Tsilo, T.J.,Simsek, S. et al. (2011). Quantitative trait loci influencing endosperm texture,
dough-mixing strength, and bread-making properties of the hard red spring wheat
breeding lines. Genome / National Research Council Canada = Génome / Conseil
national de recherches Canada, 54: 460–70.

44
Turnbull, K., Turner, M. et al. (2003). The organization of genes tightly linked to the Ha
locus in Aegilops tauschii, the D-genome donor to wheat. Genome / National Research
Council Canada = Génome / Conseil national de recherches Canada, 338: 330–338.
Wang, G., Leonard, J.M. et al. (2012). Identification of genetic factors controlling kernel
hardness and related traits in a recombinant inbred population derived from a soft ×
“extra-soft” wheat (Triticum aestivum L.) cross. Theoretical and applied genetics, 124:
207–21.
Wilkinson, M., Wan, Y. et al. (2008). Identification and genetic mapping of variant forms of
puroindoline b expressed in developing wheat grain. Journal of Cereal Science, 48: 722–
728.

45
USED WEB ADDRESSES
ExPASy: Bioinformatics Resource Portal - http://web.expasy.org/translate/
FastPCR - http://primerdigital.com/fastpcr.html
GrainGenes: a Database for Triticaceae and Avena-
http://wheat.pw.usda.gov/GG2/index.shtml
NCBI: National Center for Biotechnology information - http://www.ncbi.nlm.nih.gov/
Primer3: http://frodo.wi.mit.edu/
Reverse complement: http://www.bioinformatics.org/sms/rev_comp.html
IDT: Integrated DNA technologies Oligoanalyzer:
http://eu.idtdna.com/analyzer/applications/oligoanalyzer/default.aspx
Institute of molecular development, LLC: http://www.molecularinfo.com/MTM/G/G1/G1-
3.html

46
APPENDIXES
APPENDIX I
Table 7 Modified Hoagland nutrient solution after Dr. Cseh Edit workgroup, Dep. Plant
physiology and Molecular Plant Biology, ELTE).
Hoagland nutrient solution (modifyed)
Macronutrients
Final
concentration
(mol/dm3)
For 100 ml
stock
solution
(g)
Amount of stock
solution for 1 L
nutrient solution
For ¼
Hoagland
(8L)
KNO3 0,00125 12,6375 1 ml 8ml
Ca(NO3)2 0,00125 29,5188 1 ml 8ml
MgSO4 0,0005 12,323 1 ml 8ml
KH2PO4 0,00025 3,4023 1 ml 8ml
Fe-EDTA 0,00001 1,468 1 ml 8ml
Micronutrients
H3BO3 0,00001156 0,2859 250 µl 2ml
MnCl2·4H2O 0,0000046 0,3642 250 µl 2ml
ZnSO4·7H2O 0,00000019 0,0219 250 µl 2ml
Na2MoO4·2H2O 0,00000012 0,0116 250 µl 2ml
CuSO4·5H2O 0,00000008 0,008 250 µl 3ml*
* - 3ml of CuSO4•5H2O was used as CuSO4•5H2O precipitates easily, therefore based on
the practice +1ml was used. For stock solutions, macro- and micronutrients were diluted in
deionized water. For preparing ¼ strength solution, the dilution to 8 L was made using
destilled water.

Tartu 2013
APPENDIX II
Table 8 Primers used with Kazakhstan H- and B-set. Optimal annealing temperature given.
Primer Sequence 5'→3'
Annealing
t°C
Annealing
time (sec)
Extension time
at 72°C
Fragment size
(bp) Use
1 PAF ATTCATCTCCACCTGACC 61 30 35 535
Pina WT (Pina-D1a) 2 PAR ACACGCAGTGGTATGTGAC
3 Primpa1 GCCCTCTTCCTCATAGGAC 55 20 30 420
4 Primpa3 TGCCGGGGATGTTGCAGGG
5 PBKF CCCACAAAATGGTGGAAGA 58 25 25 356
Pinb mutant (Pinb-
D1b) 6 PBKR GAACACAGATCAATATACAAGG
7 Primpb1 ACCTTATTCCTCCTAGCTC 58 25 30 422
Pinb WT (Pinb-D1a) 8 Primpb3 GGGAACTTGCAGTCGGCGC
9 PBF ATGAAGACCTTATTCCTCCTA 55 20 30 447
10 PBR TCACCAGTAATAGCCACTAG

48
Table 9 Primers for puroindoline-B2v after Chen et al., (2010). Optimal annealing temperature is given
Code Sequence Annealing
t°C
Annealing
time (sek)
Product
size (bp)
Use
1 Pb2v1F GGTTCTCAAAACTGCCCAT 57 25 319 purB-2 variant1(Pinb-D2a), wheat
kernel hardness 2 Pb2v1R ACTTGCAGTTGGAATCCAG
3 Pb2v2F CTTGTAGTGAGCACAACCTTTGCA 65 30 401 purB-2 var.2 (Pinb-B2a), kernel
texture among soft and very soft
wheats
4 Pb2v2R GTATGGACGAACTTGCAGCTGGAG
5 Pb2v3F GCAGAAAAAGCCATTGCACCTA 65 30 528 purB-2 var.3 (Pinb-B2b), kernel
texture among soft and very soft
wheats
6 Pb2v3R CATTAGTAGGGACGAACTTGCAGCTA
7 Pb2v4F CCTTTCTCTTGTAGTGAGCACAACCA 65 30 403 purB-2 var.4 (Pinb-A2a)
8 Pb2v4R GACGAACTTGCAGTTGGAATCCAA

49
Table 10 Results regarding Kazakhstan H-set. Variety, pedigree and year/cross of selection was known previously.
Nr code Variety Pedigree Year of
cross/selection Pina Pinb Genotype Phenotype
+ - + -
mut WT
1 H2 Smena selection from local (Siberia)
variety
1919 * * Pina-D1a/Pinb-D1b hard
2 H3 Lutescens 956 selection from local (Siberia)
variety
1919 * * Pina-D1a/Pinb-D1b hard
3 H4 Irtyshanka 10 Skala/Saratovskaya 36 1964 * * Pina-D1a/Pinb-D1b hard
4 H6 Omskaya 21 Spontaneous hybrid
(Canada)/Novosibirskaya 22
1986 * * Pina-D1a/Pinb-D1b hard
5 H7 Omskaya 26 Novosibirskaya 22 / W.W.16151
(Sweden)
1986 * * Pina-D1a/Pinb-D1b hard
6 H8 Pamyaty Azyeva Saratovskaya 29 / Lutescens 99-
80-1
1987 * * Pina-D1a/Pinb-D1b hard
7 H9 Omskaya 32 Lutescens 162-84-1 / Chris
(USA)
1989 * * Pina-D1a/Pinb-D1b hard
8 H10 Kazanskaya
yubileynaya
Omsraya 20 / Lutescens 204-80-
1//Lutescens 3-86-6
1992 * * null/Pinb-D1b hard

50
9 H11 Tulunskaya 12 Biryusinka / Bezostaya 1 1970 * * Pina-D1a/Pinb-D1b hard
10 H12 Altayskaya 92 Novosibirskaya 67 / Lutescens
4029
1981 * * null/Pinb-D1a hard
11 H13 Rosinka Physical mutant from
Sibakovskaya 3,
1979 * * Pina-D1a/Pinb-D1b hard
12 H14 Selenga Buryatscaya 34 / Buryatscaya 79 1978 * * Pina-D1a/Pinb-D1b hard
13 H16 Strada Sibiri Rang/ Hibryd 21// Irtishanka
10/4/к-54049/3/Line 1633
1986 * * Pina-D1a/Pinb-D1b hard
14 H17 Omskaya 34 Omskaya 21 / Lutescens 4979c /
1553
1993 * * Pina-D1a/Pinb-D1b hard
15 H18 Tarskaya 6 Lutescens 89-87-29 / Narskaya 5 1993 * * Pina-D1a/Pinb-D1b hard
16 H19 Omskaya 36 Lutescens 150-86-10 / Runar
(Norway)
1994 * * Pina-D1a/Pinb-D1a soft
17 H20 Tarskaya 7 Lutescens 89/87-29 / Omskaya
26
1993 * * Pina-D1a/Pinb-D1b hard
18 H22 Omskaya 27 Omskaya 17 // Atlas 66 /
Lutescens 1140
1983 * * Pina-D1a/Pinb-D1b hard
19 H23 Albidum 3700 selection from local (Siberia)
variety
1925 * * Pina-D1a/Pinb-D1b hard
20 H24 Sibiryashka Sibiryashka 2 / Saratovskaya 29 1966 * * Pina-D1a/Pinb-D1b hard

51
21 H25 Omskaya 17 Lutescens 1138-166 / Red River
68 (USA)
1972 * * Pina-D1a/Pinb-D1b hard
22 H26 Omskaya 19 Lutescens 1138-70 / Lutescens
1210
1973 * * Pina-D1a/Pinb-D1b hard
23 H27 Dias 2 Novosibirskaya 67 / Rang
(Norway)
1973 * * Pina-D1a/Pinb-D1b hard
24 H28 Omskaya 20 Irtishanka 10 // Graecum 114 /
Kavkaz
1980 * * Pina-D1a/Pinb-D1b hard
25 H29 Omskaya 29 Lutescens 204-80-1 / Lutescens
99-80-1
1987 * * Pina-D1a/Pinb-D1b hard
26 H30 Omskaya 33 Lutescens 137-87-39 / Omskaya
28
1992 * * Pina-D1a/Pinb-D1b hard
27 H31 Saratovskaya 29 Lutescens 91 / Sarroza //
Lutescens 55-11
1938 * * Pina-D1a/Pinb-D1b hard
28 H32 Tselinnaya 26 Shortandinskaya 25 /FKN 25
(USA)
1983 * * Pina-D1a/Pinb-D1b hard
29 H33 Sybakovskaya 3 Bezostaya 1 / Saratovskaya 29 1965 * * Pina-D1a/Pinb-D1a soft
30 H34 Niva 2 PS -360/76 / Irtishanka 10 1982 * * Pina-D1a/Pinb-D1b hard
31 H35 Rosinka 2 Chemical mutant from
Tselinnaya 21,
1979, 1987 * * Pina-D1a/Pinb-D1b hard
32 H36 Slavyanka Sibiri Chemical mutant from Lutescens 1984, 1986 * * Pina-D1a/Pinb-D1b hard

52
65,
33 H37 Sonata Tselinnaya 20 /Tertsiya 1986 * * null/null hard
34 H38 Tuleevskaya Olivatseva / Vendel // Lutescens
105 (WW)
1989 * * null/null hard
35 H39 Svetlanka Omskaya 23 / Tselinnaya 26 1987 * * null/null hard
36 H40 Marquis Hard Red Calkytta / Red Five 1892 * * Pina-D1a/Pinb-D1b hard
37 H41 Omskaya 20 Irtishanka 10 // Graecum 114 /
Kavkaz
1980 * * Pina-D1a/Pinb-D1b hard
38 H42 Milturum 321 selection from local (Siberia)
redspike variety
1913 * * Pina-D1a/Pinb-D1b hard
39 H43 Milturum 553 Milturum 321 / Citchener
(Canada)
1927 * * Pina-D1a/Pinb-D1b hard
40 H44 Cesium 94 Caesium 117 / Western Polba 1923 * * Pina-D1a/Pinb-D1a soft
41 H45 Omskaya 9 Bezostaya 1 / Saratovskaya 29 1964 * * Pina-D1a/Pinb-D1b hard
42 H47 Omskaya 24 Lutescens 1594 / Sibiryashka 8 //
Krasnodarskaya 39
1977 * * Pina-D1a/Pinb-D1b hard
43 H48 Omskaya 28 Lutescens 19 / Hibryd (Canada) 1985 * * Pina-D1a/Pinb-D1b hard
44 H49 Omskaya 30 Omskaya 20 / Lutescens 204-80-
1
1987 * * Pina-D1a/Pinb-D1b hard

53
45 H50 Omskaya 35 Omskaya 29 / Omskaya 30 1994 * * Pina-D1a/Pinb-D1b hard
46 H51 Omskaya 37 Lutescens 61-89-100 / Lutescens
350-89-9
1997 * * Pina-D1a/Pinb-D1b hard
47 H52 Tertsiya Saratovskaya 36 / I 428010
(Canada)
* * Pina-D1a/Pinb-D1b hard
48 H53 Karagandinskaya
70
Chayka (WW) / Irtishanka 10 1979 * * Pina-D1a/Pinb-D1b hard
49 H54 Eritrospermum 59 ANK 1 / ANK 2 // ANK 3 /3/
ANK 7A
1980 * * Pina-D1a/Pinb-D1b hard

54
Table 11 Results of biofortification set; Pina and Pinb PCR and sequencing results.
Code Variety Biofortific
ation Pina Pinb Comment
B-1 Aktobe 32 Zn+ wild
(+band)
mutant, may be Pinb-D1b
allele
B-6 Stepnaya 1 Zn+ wild
(+band) mutant sequenced (no name)
in position 128 A→ G (Glu→ Gly); plus in position
223 G→A (Gly→Ser) like in Pinb-D1b
B-7 GVK 1369-2 Zn+ wild
(+band)
mutant sequenced (Pinb-
D1b allele) in nucleotide position 223 G→A(Gly→Ser)
B-12 Lutescens 53-95 Zn+ wild
(+band)
mutant sequenced extra Stop
codon (no name)
in 382 position C →T (Gln→ Stop codon) like in Pinb-
D1ab variant; plus in position 257 G →A (Cys→ Tyr)
B-13 Astana Zn+ wild
(+band)
mutant, may be Pinb-D1b
allele
B-18 Shortandinskaya 95 Zn+ wild
(+band)
mutant, may be Pinb-D1b
allele
B-19 Chelyaba Zn+ wild
(+band)
mutant, may be Pinb-D1b
allele
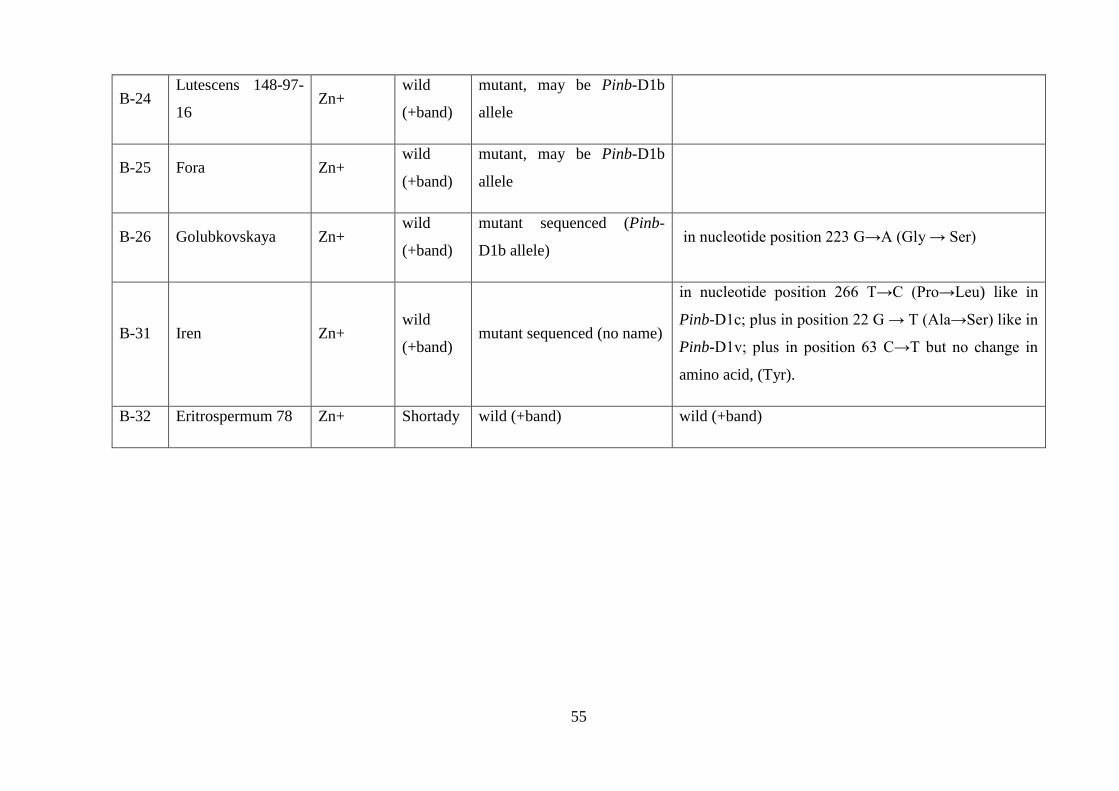
55
B-24 Lutescens 148-97-
16 Zn+
wild
(+band)
mutant, may be Pinb-D1b
allele
B-25 Fora Zn+ wild
(+band)
mutant, may be Pinb-D1b
allele
B-26 Golubkovskaya Zn+ wild
(+band)
mutant sequenced (Pinb-
D1b allele) in nucleotide position 223 G→A (Gly → Ser)
B-31 Iren Zn+ wild
(+band) mutant sequenced (no name)
in nucleotide position 266 T→C (Pro→Leu) like in
Pinb-D1c; plus in position 22 G → T (Ala→Ser) like in
Pinb-D1v; plus in position 63 C→T but no change in
amino acid, (Tyr).
B-32 Eritrospermum 78 Zn+ Shortady wild (+band) wild (+band)

Tartu 2013
Table 12 Results regarding Pb2v2 and Pb2v3 in Australian group. Puroindoline-a and
puroindoline-b genotypes were screened earlier, SKCS HI known previously.
Gen
oty
pe
Gra
in t
extu
re
SK
CS
HI
Pin
a
Pin
b
Pin
b2
-v3
Pin
b-2
v2
Vali
dati
on
base
d
on
Pin
b-2
1 Bencubbin soft a a + hard
2 Bolero soft 28 a a + hard
3 Bungulla soft a a - + softer
4 Capelle Desprez soft a a + hard
5 Capitole soft a a + hard
6 Centauro soft 21 a a + hard
7 Chinese Spring soft 33 a a - + softer
8 Declic soft a a + - hard
9 EGRET soft a a + hard
10 Emblem soft a a + hard
11 Galahad soft a a + hard
12 Gamenya soft a a +f hard
13 Ghurka soft a a +f hard
14 Glenwari soft a a +f hard
15 Gluclub soft a a + hard
16 Gluyas soft a a + hard
17 Insignia soft a a + hard
18 Insignia 49 soft a a + hard
19 Isis soft a a - + softer

57
20 Jabiru soft a a + hard
21 Kalkee soft a a + hard
22 Kewell soft a a + hard
23 Kondut soft a a - + softer
24 Libero soft 35 a a + hard
25 Macquarie soft a a - + softer
26 Matong soft a a + hard
27 Mengavi soft a a + hard
28 Mersey soft a a + hard
29 Mokoan soft a a + hard
30 Olympic soft a a + hard
31 Orca soft a a + hard
32 Pinnacle soft a a + hard
33 Radja soft a a + hard
34 Ranee soft a a + hard
35 Robin soft a a + hard
36 Summit soft a a + hard
37 Tatiara soft a a - + softer
38 Teal soft a a + hard
39 Tincurrin soft a a + hard
40 Wren soft a a + hard
41 Zenith soft a a + hard
42 Heron soft a a + hard

Tartu 2013
Table 13 Primers designed for HRM-PCR. Fragment locations in the sequence based on the nucleotide location counting based on the
information in NCBI using the accession number in the parentheses.
Primer Sequence 5'→3' Annealing
t °C
time
(sek)
Extension
time at
72°C (sec)
Fragm
ent size
(bp)
Use
1 PuraJ1F AACCACACTGACAACATGAAG
59 25 20 245
For HRM-PCR, puroindoline-a
polymorphism detection. Locations 836
-1080 (DQ363911.1). 2 PuraJ1R TTGACAACCTCCCTTCC
3 PuraJ3F AAGGGAGGTTGTCAAGAGC
60 25 20 231
For HRM-PCR, puroindoline-a
polymorphism detection. Locations
1066-1297 (DQ363911.1) 4 PuraJ3R ATCACCAGTAATAGCCAATAGTG
5 PurbJ1F AACATGAAGACCTTATTCCTCCT
63 28 20 250
For HRM-PCR, puroindoline-b
polymorphism detection. Locations
271-527 (DQ363913.1) 6 PurbJ1Rd TTCTCSCGAACCTCATGC
7 PurbJ2F TGTGAGCATGAGGTTCG
59 25 20 240
For HRM-PCR, puroindoline-b
polymorphism detection. Locations
502-742 (DQ363913.1) 8 PurbJ3R GTCACGAATAGAGGCTATATCA

Tartu 2013
AKNOWLEDGEMENTS
I would like to thank Prof Toivo Maimets, the head of the Institute of Molecular and Cell Biology,
University of Tartu for the permission to write this thesis in English.
I would like to say thank to Prof. Zoltán Szigeti the former head and to Dr. Ferenc Fodor the current
head of the Department of Plant Physiology and Molecular Plant Biology, Eötvös Lorand
University, Budapest for the possibility to make the research in their department.
I would like to express my greatest gratitude to my thesis instructor and supervisor Dr. László
Tamás for his suggestions, advice, endless patience and encouragment during the past year. The
dedication for his students is remarqable and I am sincerely grateful for the possibility to be part of
the workgroup.
I would like to thank all the members of Dr. Lászlo Tamás workgroup for their advice regarding
academical and everyday life in Hungary. My special thank goes to PhD student Csaba Éva for
teaching the methods used in molecular biology laboratory and his experienced advice.
My sincere thank goes to Dr. Angela Juhasz, Hungarian Academy of Sciences, Applied Genomics
Department for her advice and instructions regarding the new markers for kernel hardness,
vitreousness and density.
I would aslo like to thank the co-instructor of this thesis, Dr. Evi Padu, Department of Biophysics
and Plant Physiology, Tartu University for her advice and suggestions.

60
Non-exclusive licence to reproduce thesis and make thesis public
I, Jaanika Udam (date of birth: 19.03.1989),
herewith grant the University of Tartu a free permit (non-exclusive licence) to:
reproduce, for the purpose of preservation and making available to the public, including for
addition to the DSpace digital archives until expiry of the term of validity of the copyright,
and
make available to the public via the university's web environment, including via the DSpace
digital archives, as of 05.28.2015 until expiry of the term of validity of the copyright,
Studying different molecular markers for kernel texture in bread wheat (Triticum aestivum L.)
(title of thesis)
supervised by Dr. László Tamás and Dr. Evi Padu,
(supervisor’s name)
I am aware of the fact that the author retains these rights.
This is to certify that granting the non-exclusive licence does not infringe the intellectual
property rights or rights arising from the Personal Data Protection Act.
Tartu, 05.28.2013 (date)

61
Top Related