


Languages
Pages
Legal

University of Al berta
Shear Lag in Bolted Cold-Formed Steel Angles and Channels in Tension
Amy Sin-Man Yip @
A thesis submitted to the Faculty of Graduate Studies and Research in partial fulfillment
of the requirements for the degree of Master of Science
Structural Engineering
Department of Civil and Environmental Engineering
Edmonton, AIberta
Fa11 2000

National Library I*l of Canada Bibliothèque nationale du Canada
Acquisitions and Acquisitions et Bibliographie Services services bibliographiques
395 Wellington Street 395. rue Wellington Ottawa ON K1A O N 4 Ottawa ON K1A ON4 Canada Canada
The author has granted a non- exclusive licence ailowing the National Library of Canada to reproduce, loaq distribute or sell copies of this thesis in microfoxm, paper or electronic formats.
The author retains ownership of the copyright in this thesis. Neither the thesis nor substantial extracts fkom it may be printed or otherwise reproduced without the author' s permission.
Y w r m e votm nmrence
Our 6k Norre rdfBren~)
L'auteur a accordé une licence non exclusive permettant à la Bibliothèque nationale du Canada de reproduire, prêter, distribuer ou vendre des copies de cette thèse sous la forme de microfiche/nùn, de reproduction sur papier ou sur format électronique.
L'auteur conserve la propriété du droit d' auteur qui protège cette thèse. Ni la thèse ni des extraits substantiels de celle-ci ne doivent être imprimés ou autrement reproduits sans son autorisation.
Highly non-uniform stresses will be generated near the connection of a tension
member when the mernber is not connected through d l of the elements of the cross
section. Thus, the whole cross-section may not be fully utilized, which causes a
reduction in the net section efficiency. This loss of efficiency of the section is termed as
"shear lag". This phenornenon has been studied extensively and design provisions are
available in most of the steel design standards. However, most of these researches, on
which the current design standards are based, used hot-rolled steel sections. There is
reiatively Little information available about the shear lag effects in the design of cold-
formed tension mernbers, which are more slender than hot-rolled sections. An
investigation was therefore undertaken to study the shear lag effect in angle and channel
cold-fonned tension mernbers with bolted connection.
An experimental program, consisting of 23 angle and channel specimens, was
conducted to study the shear Iag effect. The connection length and cross sectional
geometry are two major parameters studied in the program. With the test results, the net
section efficiency and the behavior of the specimens were discussed. Finite element
method was used to mode1 and analyze the test specirnens. A good correlation between
the numencal results and test results was found. A parametric study was also set up
using the developed finite element models to invesrigate the factors affecting the net
section efficiency of angle and channel sections.
With the results obtained from the p-etnc study, it was concluded that the
current design equations give inconsistent predictions on the net section efficiency of
cold-formed tension members. It was found that the net section efficiency does not only
depend on the connection length and eccentricity, but also the flat width-to- thickness and
flat width-to-bolt diameter ratios. Based on this observation, new net section efficiency
equations were developed using non-linear regression analysis for both angle and channel
sections. It is shown that the prediction calculated by the formulae is in good agreement
with the available test data. A design recommendation for cold-formed tension members
has also been developed based on the formulae proposed.
The author wishes to express her deepest appreciation and gratitude to her
supervisor, Dr. J.J.R. Cheng, for his invaluable guidance and constant support throughout
the course of this study.
The technical assistance of L- Burden and R. HeIfrich of the I.F. Morrison
Structural Laboratory is acknowledged. The author is also indebted to Dr. S. Afhami,
A. Lemenhe and E. Wang, who assisted in conducting the experiments.
Special thanks are given to Dr. H.A. Khoo, B. Estabrooks and 1. Sheikh for their
assistance in using the Finite Element Program and to H. Tong for her time in aiding with
the Finite Element Analysis. Thanks are also extended to A. Dorey who provided
assistance in using the SigmaPlot program.
The author would also like to express her gratitude to her parents for their
understanding and encouragement throughout the course of this study, and to her brother
for his help in computer related areas.
TABLE OF CONTENTS
INTRODUCTION ............................................................................................ 1.1 Gener al ................................................ .,,..
1.2 S tatement of the Problem ............................................................................ 1 -3 Objectives ..................................................................................................... 1.4 Mechodology Used in the Research .............................................................
1.5 Outline of the Thesis ....................................................................................
LITERATURE REVIEW ....................................... ............ ............................ .................................. 2.1 Previous Studies on Shear Lag of Tension Members
.......................... 2.3 Specific Studies on Cold Forrned Tension Steel Members
2.3 Current Design Specifications ...................................................................... 2.3.1 Arnerican Iron and Steel Institute (AISI, 1996)) ..................................
2.3.1.1 Tensile Strength ..........................................................................
2.3.1.2 Bearing Capacity ........................................................................
................... 2.3.2 American Institute of Steel Construction (AISC. 1993)
2.3.2.1 Tensiie Strength ..........................................................................
........................................................................ 2.3.2.2 Bearing Capacity
2.3.2.3 Block Shear ................................................................................
.................................................................... 2.3.3 CSA Standard S 16-1-94
.......................................................................... 2.3.3.1 Tensile Strength
........................................... ...................... 2.3.3.2 Bearing Capacity ... 2.3.3.3 Block Shear ................................................................................
2.3.4.1 Tensile Strength .......................................................................
2.3.4.2 Bearing Capacity ........................................................................ 20
2.3.4.3 Block Shear ................................................................................ 21
2.4 Comparison of Previous Test Results with Current Specifications .............. 21
EXPERIMENTAL PROGRAM ........................ ...... ..................................... 27
3.1 General ........................................................................................................ 27
3.2 Tension Coupons .......................................................................................... 27
..................................................... 3.3 Specirnens Description ..................... ... 28
.................................................................. 3.4 Test Set-up and Instrumentation 29
....................................................................... ............. 3.5 Test Procedure .... 30
TEST RESULTS ............................................................................................. 39
4.1 Tension Coupon Tests ..... ............................................................................. 39
....................................................... ......................... 4.2 Fu11 Scale Tests .,-. 40
4.2.1 Test results ..................................................................................... 40
.............................................. ................... 4.2.2 General observations ... 40
4.2.3 Load-deformation relationship .......................................................... 42
.............................................................................. 4.2.4 S train distribution 43
............................... ......................... FINITE ELEMENT ANALYSIS ............. 62
.................... 5.1 General .. .............................. 62
. 5.2 Numerical Mode1 .................................................................................... 62
5.3 Material Mode1 ............................................................................................. 64
5.4 Numerical Results .............................. ...... ................................................ 65
........................................................ 5.4.1 Experimental-to-anaIytical ratio 65
.................................................................................. 5.4.2 Mode of failure 65
5.4.3 Load-deformation relationship ......... .... ................................... 66
....... ............................................. 5.4.4 Strain and stress distributions ... 67
................................. PARAMETRIC STUDIES .............................................. 85
.......................................................................................................... 6.1 General 85
6.2 Design of Parametric Studies ........................................................................ 85
6.2.1 Scope of the study ......................... ... ............................................ 85
............................................................................. 6.2.1.1 Angle Sections 85
6.2.1.2 Channel Sections ......................................................................... 86
................................................ 6.2.2 Designation of the numerical models 87
6.3 Results of Parametric S tudies ........................................................................ 87
6.4 Discussion of Pararnetnc Study Results ........................................................ 88
6.4.1 Effect of material property ................................................................ 88
6.4.2 Effect of eccentricity, 5 ................................................................... 90
6.4.3 Effect of nurnber of bolts .................................................................. 9 1
6.4.4 Effect of flat width-to-thickness ratio .............................................. 92
6.4.5 Effect of flat width-to-boit diameter ratio ................... .........- ............ 93
6.5 Proposed Net Section S trength Formula ....................................................... 94
6.5.1 Evduation of the (1- T L ) mie .......................................... ....... 94
6.5.2 Proposed net section efficiency formula ........................................... 95
6.6 Recommended Design Method ..................................................................... 98
6.6.1 Design recommendations .......................... .., ..................................... 98
6.6.2 Evaiuation of design recommendations with test results .................. 99
6.6.3 Further discussion of proposed methods ........................... .... ............ 100
7 . S UMMARY, CONCLUSIONS, AND FWCOMMENDATIONS ..... ., ........ 126
................................................................ 7.1 Summary ................................. ,. 126
......... 7.2 ConcIusions ........................................ ., ...................................-........... 127
7.3 Recomrnendations ......................... ..........,... ,.... ................................... 128
........................................................ ............. REFERENCES ................... ,., ..,., 130
APPENDIX A - LOAD VS . DEFORMATION CURVES FOR THE TEST
.............................. SPECIMENS ........................................... 132
APPENDIX B - LOAD VS . DEFORMATION CURVES OBTAINED FROM THE
FINITE ELEMENT ANALYSIS .................... ... ................. 145
LIST OF TABLES
Table 2.1
Table 2.2
Table 2.3
Table 2.4
Table 3.1
Table 4.1
Table 4.2
Table 4.3
Table 5.1
Table 6.1
Table 6.2
Table 6.3
Table 6.4
Table 6.5
Table 6.6
Table 6.7
Table 6.8
Table 6.9
Nominal Bearing Stress for Bolted Connections with Washers
under Both Bolt Head and Nut ...................................................... 22
Nominal Bearing Stress for Bolted Connections without Washers
Under Both Bolt Head and Nut, or With Only One Washer ............. 22
Comparison of Others' Test Results with Current Specifications
for Angle Sections ............................................................................ 23
Comparison of Others' Test Results wiih Current Specifications for
Channel Sections ............................................................................... 25
Specimens Description ...................................................................... 32
Material Properties ............................................................................ 47
Average Material Properties for Angle and Channel Sections ......... 47
Test Results ....................................................................................... 48
Summary of Analytical Results ....................................................... 69
Description of Angle ModeIs for Parametric Study .......................... 102
Description of Channel Models for Parametric Study ...................... 104
Results for Angle Models .................................................................. 106
Results for Channel Models ................... .. ..................................... 107
Details and Results of Angle Models categorized in accordance
...................................................................... with Material Constant 108
Details and Results of Channel Models categorized in
accordance with Material Constant ................................................... 108
Surnmary of the Sectional Properties and Results for Angle
.................................... Sections That Failed in Net Section Fracture 109
Summary of the Sectional Properties and Results for Channel
.................................... Sections That Failed in Net Section Fracture 110
Cornparison of ( 1 . t) and the Finite EIement Result for Angle
Sections ......................................................................................... 1 1 1
- X
Table 6.10 Cornparison of ( 1 - with Finite Elernent ResuIt for Channel ï' ........................................................................ ................... Sections .., 112
Table 6.1 1 Comparison of the Proposed Net Section Efficiency Formulae to
the Finite Element Analysis for Angle Sections ................... ...... 113
Table 6.12 Comparison of the Proposed Net Section Efficiency Formulae to
the Finite Element Analysis for Channel Sections ............................ 114
Table 6.13 Evaluation of Equation 6.9 with the Test Results for Angle
Sections ............................................................................................. 1 15
Table 6.14 Evaluation of Equation 6.9 with the Test Results for Channel
............................................................................................. Sections 1 16
Table 6.15 Comparison of Test Data with Equation 6.9 for Angle Sections
That were Beyond the Scope of This Study .................................... 1 17
Table 6.16 Table 6.16 Comparison of Test Data with Equation 6.9 for
Channel Sections That were Beyond the Scope of This Study ......... 1 18
LIST OF FIGURES
Figure 2.1
Figure 3.1
Figure 3.2
Figure 3 -3
Figure 3.4
Figure 3.5
Figure 3 -6
Figure 4.1
Figure 4.2
Figure 4.3
Figure 4.4
Figure 4.5
Figure 4.6
Figure 4.7
Figure 4.8
Figure 4.9
Figure 4.10
Figure 4.1 1
Figure 4.12
Figure 4.13
Figure 4.14
Figure 4.15
Figure 4 . I. 6
Figure 4.17
Figure 4.18
Figure 4.19
Figure 4.20
....................... ............. Failure Modes of Bolted Connections ,... 26
.......... Tension Coupons Locations for Angle and Channel Sections 33
....................................................................... Specimen Dimensions 34
Test Set-up .................................................................................... 35
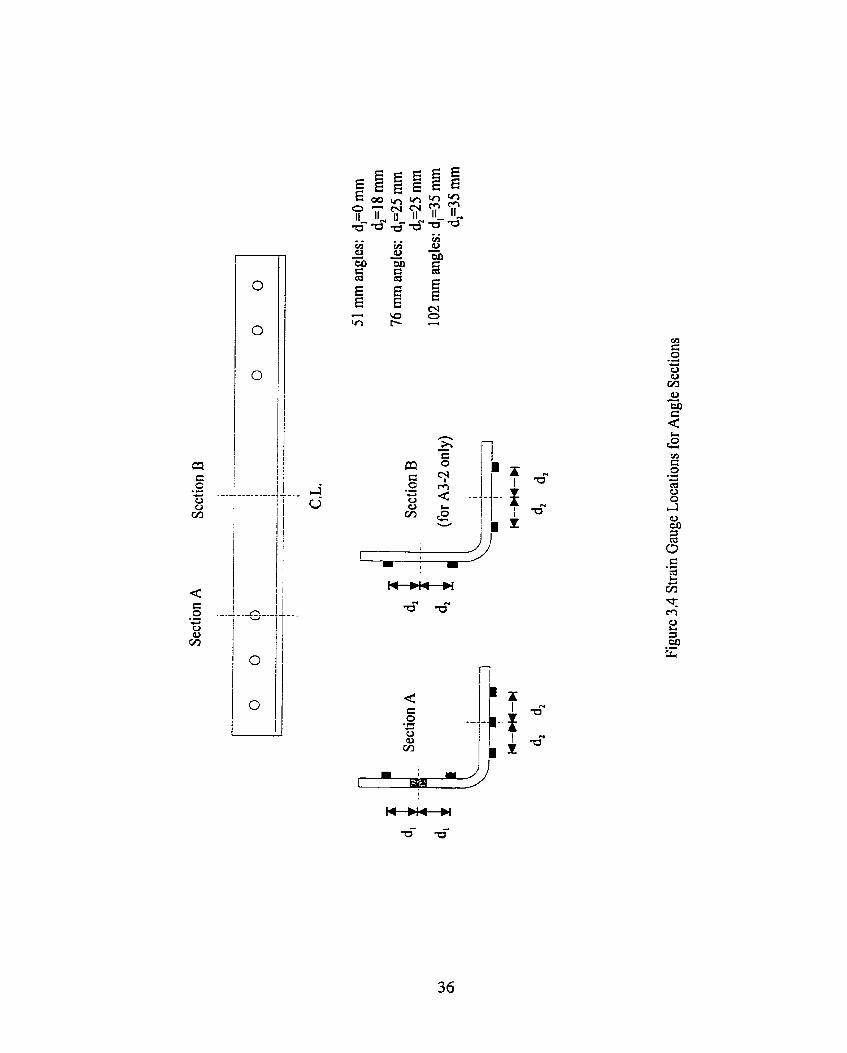
...................................... Strain Gauge Locations for Angle Sections 36
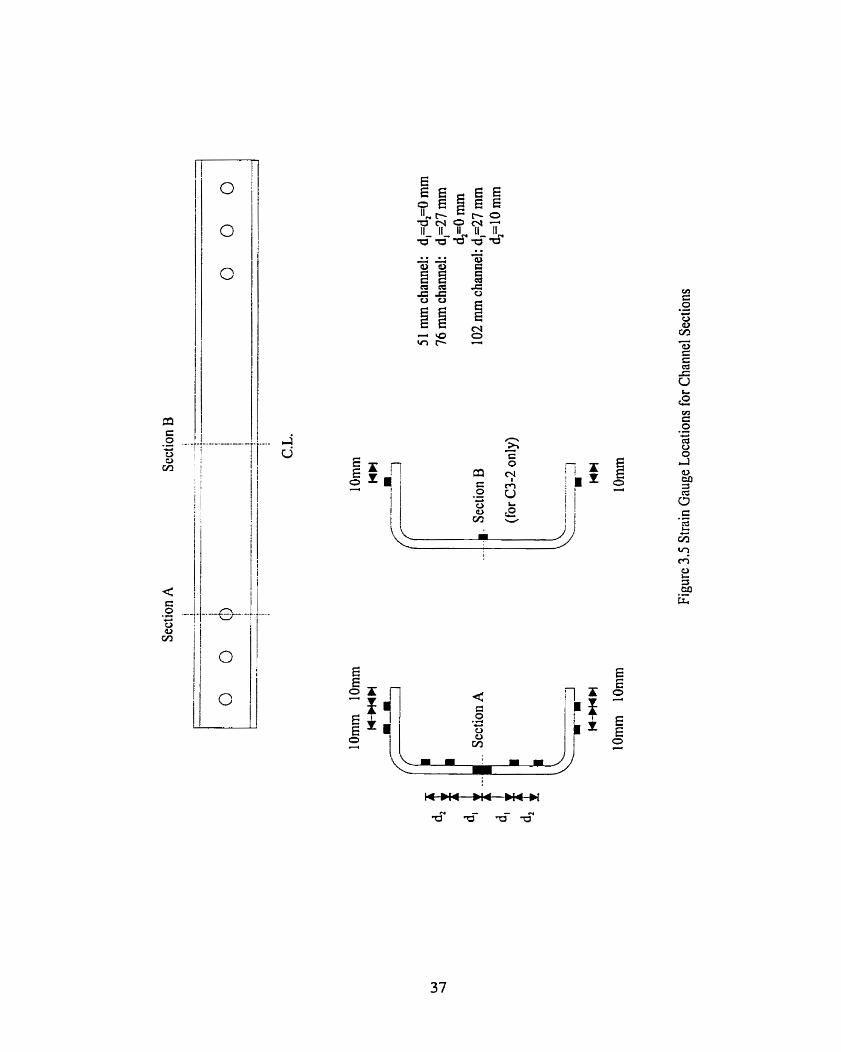
................................... Strain Gauge Locations for Channel Sections 37
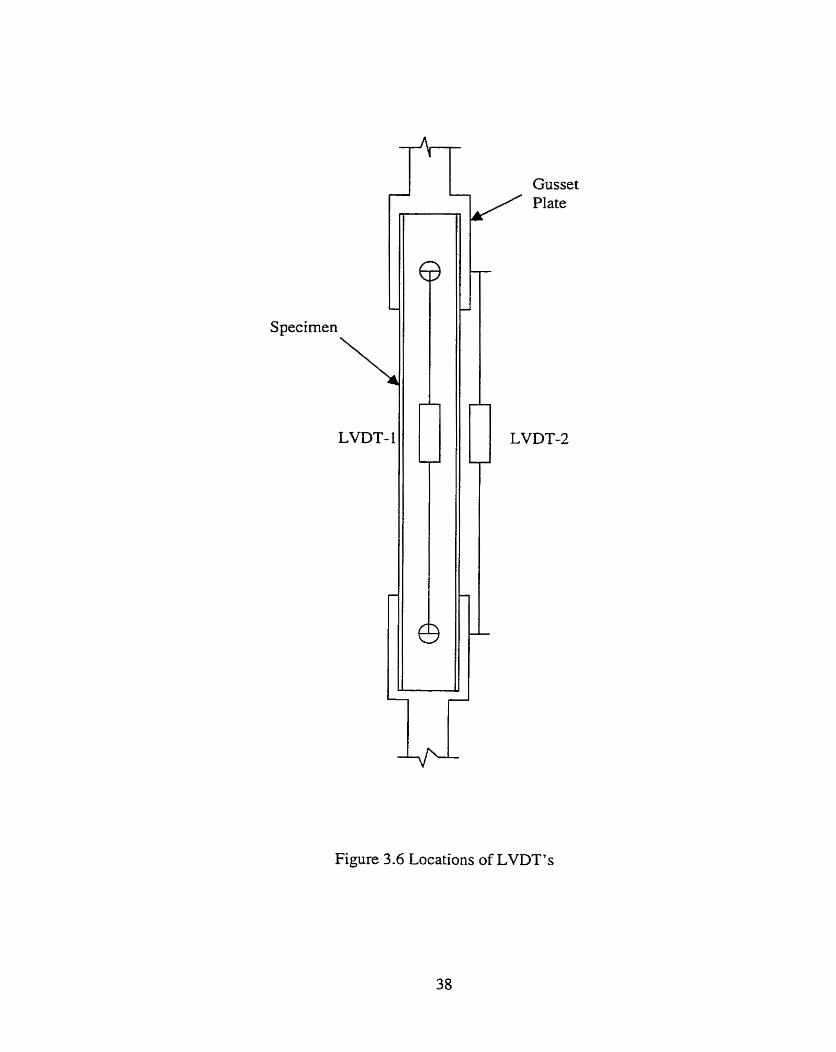
........................................ ......................... Locations of LVDT's ,.. 38
...... . Stress vs Strain for Tension Coupons cut from Angle Sections 49
... . Stress vs Strain for Tension Coupons cut from Channel Sections 49
................................................................................... Local Bending 50
.................................................. Deformed Angles Failed in Bearing 50
...................... ................... Deformed Channels Failed in Bearing .. 51
Deformed Angle Failed by Net Section Rupture .............................. 51
Deformed Channel Failed by Net Section Rupture ........................... 52
........................... Load vs . Deformation for A2-3, A3-3 and A4-3 .... 53
Load vs . Defornation for C2-3, C3-3 and C4-3 ............................... 53
Load vs . Deformation for A4-2, A4-3 and A4-4 ............................... 54
Load vs . Deformation for C4-2, C4-3 and C4-4 ............................ 53
Load vs . Deformation for A2-2 and A2-ZN ...................................... 55
Load vs . Deforrnation for C3- 1 and *C3- 1 ....................................... 55
Load vs . Strain at the Critical Section for A4-4 ................................ 56
Load vs . Strain at the Critical Section for A3-2 ....................... ..... 56
Load vs . Strain at the Mid-length of A3-2 ........................................ 57
................................... Stain Distribution at Critical Section of A3-2 57
Load vs . Strain at the Flanges at Critical Section of C4-2 ................ 58
................ Strain Distribution at the web at Critical Section of C4-2 58
.......... Load vs . Strain at the Critical Section at the Flanges of C 4 4 59
. ............... Figure 4.21 Load vs Strain at the Critical Section at the Web of C4-4 59
Figure 4.22
Figure 4.23
Figure 4.24
Figure 5.1
Figure 5.2
Figure 5.3
Figure 5.4
Figure 5.5
Figure 5.6
Figure 5.7
Figure 5.8
Figure 5.9
Figure 5 . 1 O
Figure 5.1 1
Figure 5.12
Figure 5-13
Figure 5.14
Figure 5.1 5
Figure 5.16
Figure 5 . 17
Figure 5.18
Figure 5.19
Figure 5.20
Figure 5.2 1
Figure 5.22
Figure 5.23
Figure 5.24
.............. Strain Distribution at CriticaI Section of the Web for C4-4 60
. ............................................. Load vs Strain at Mid-section of C3-2 60
................ ................. Strain Distribution at Mid-length for C3-2 ... ... 61
....................... .................................... Mesh for A2- 1 Specirnen .. 70
............................ Typical Finite Element Mesh for Specimen A3-3 71
............... Typical Finite Element Mesh for Specimen C3-3 ............. - 71
Material Model for AngIe Sections ................................................. 72
.... Materid Mode1 for Channel Sections ....... .................................. 72
............. Predicted and Observed Deformation for Specimen A2-ZN 73
Predicted and Observed Deformation for Specimen C3-3 -.. ...... .. ..... 74
Observed and Predicted Deformed Shape for Specimen A3- 1 ......... 75
Observed and Predicted Deforrned Shape for Specimen C4- 1 ......... 76
Side View of Typical Predicted Deformed Specimen C3-2 ............. 77
Cornparison of Load vs . Deformation for A24 ............................. ... 77
Cornparison of Load vs . Deformation for C2-3 ....... .. ....................... 78
Cornpaison of Load vs . Deformation for C3- 1 and *C3-1 .............. 78
Strain Distributions of Specimen A4-2 at Critical Section ............ ... 79
Strain Distributions of Specimen C4-2 at Critical Section ............... 79
Strain Distribution of Specimen A3-2 at Mid.Section ..,. ...-... ., ...... ... 80
Strain Distribution of Specimen C3-2 at Mid-Section .......-........... ... 80
Stress (in Load Direction) Contour of Specimen A4-2 at
the Ultimate Load ................ .. ....................................................... 8 1
Stress (in Load Direction) Contour of Specimen C4-2 at
the Ultirnate Load .............................................................................. 81
Stress Distributions of Specimen A4-2 at the Critical Section ......... 82
Stress Distributions of Specimen C4-2 at the Critical Section .......... 82
Stress (in Load Direction) Contour of Specimen A4-4 at the
Ultimate Load ............................................................................... 83
Stress Distributions of Specimen A4-4 at the Critical Section ......... 83
Stress (in Load Direction) Contour of Specimen C4-4 at the
Ultirnate Load ........................... ...................................................... 84
Figure 5.25
Figure 6.1
Figure 6.2
Figure 6.3
Figure 6.4
Figure 6.5
Figure 6.6
Figure 6.7
Figure 6.8
Figure 6.9
Figure 6.10
Figure 6 . 1 1
Figure 6.12
Figure 6.13
Figure 6.14
Figure A . 1
Figure A.2
Figure A.3
Figure A.4
Figure A S
........... Stress Distributions of Specirnen C4-4 at the Ultimate h a d 84
Effect of Material Property on Net Section Efficiency for Angle
Sections ............................................................................................. 119
Effect of Material Property on Net Section Efficiency for
............................................................................... Channel Sections 119
Effect of Material Properties on Net Section Efficiency for Angle
Models with Consideration of Gross Section Yielding ..................... 120
Load vs . Deformation Curves for Angle Models with Different
Matenal Constant, Number of bolts = 4 ........................................... 120
Effect of Eccentricity on Net Section Efficiency Angle Sections ..... 121
Effect of Eccentricity on Net Section Efficiency Channel
Sections ......................................................... 121
Effect of Bolt Number on the Net Section Eff~ciency for Angle
Sections .................................................... Effect of Bolt Number on thz Net Section Efficiency Channel
Sections ...........................................................................................
Effect of Flat Width-to-Thickness Ratio on Net Section
Efficiency for Angle Sections with 2 Bolts ....................................... 123
Effect of Flat Width-to-Thickness Ratio on Net Section
Efficiency for Channel Sections with 3 Bolts ................................... 123
Effect of Flat Width-to-Bolt Diameter Ratio on the Net Section
.................... Efficiency for the Angle Sections .................... ,... 123
Effect of Flat Width-to-BoIt Diameter Ratio on the Net Section
.................................................. Efficiency for the Channel Sections 124
Evaluation of Equation 6.9 for Angle Sections ................................. 125
Evaluation of Equation 6.9 for Channel Sections ............................. 125
. Load vs Deformation Curve for Specimen A2- 1 ............................ 133
. Load vs Deformation Curve for Specimen A2-2 ...................... .... 133
. .......................... Load vs Deformation Curve for Specimen A2-2N 134
. ............................. Load vs Deformation Curve for Specimen A2-3 134
. ............................. Load vs Deformation Curve for Specimen A3-1 135
Figure A.6
Figure A.7
Figure A.8
Figure A.9
Figure A . 10
Figure A . 1 1
Figure A . 12
Figure A . 13
Figure A . 14
Figure A . 15
Figure A. 16
Figure A . 17
Figure A . 18
Figure A . 19
Figure A.20
Figure A.2 1
Figure A.22
Figure A.23
Figure B . 1
Figure B.2
Figure B.3
Figure B.4
Figure B.5
Figure B.6
Figure B.7
Figure B.8
Figure B.9
Figure B . 10
Figure B . 1 1
Figure B . 12
Figure B . 13
................... . Load vs Deformation Curve for Specirnen *A3-1 ........ 135
............................. . Load vs Deformation Curve for Specirnen A3-2 136
............................. . Load vs Deformation Curve for Specimen A3-3 136
..... ...................... . Load vs Deformation Curve for Specimen A4-1 .. 137
............................. . Load vs Deformation Curve for Specimen A4-2 137
................. ..,,.... . Load vs Deformation C u ~ e for Specimen A4-3 .. 138
............................. . Load vs Deformation Curve for Specimen A 4 4 138
............................. . Load vs Deformation Curve for Specimen C2- 1 139
............................. . Load vs Deformation Curve for Specimen C2-2 139
............................. . Load vs Deformation Curve for Specimen C2-3 140
............................. . Load vs Deformation Curve for Specimen C3- 1 140
........................... Load vs . Defonnation Curve for Specirnen T 3 - 1 141
............................. Load vs . Deformation Curve for Specimen C3-2 141
............................. . Load vs Deformation Curve for Specimen C3-3 142
............................. . Load vs Deformation Curve for Specimen C4-1 142
............................. Load vs . Deformation Curve for Specimen C4-2 143
............................. Load vs . Deformation Curve for Specimen C4-3 143
Load vs . Deformation Curve for Specimen C4-4 ........................... 144
Cornparison of Load vs . Deformation Curves for AS-1 .................... 146
Comparison of Load vs . Deformation Curves for A2-2 .................... 146
Cornparison of Load vs . Deforrnation Curves for A2-3 .................... 147
Comparison of Load vs . Deformation Curves for A3-1 and *A3-1 .. 147
Comparison of Load vs . Deformation Curves for A3-2 .................... 148
Cornparison of Load vs . Deformation Curves for A3-3 .................... 148
Cornparison of Load vs . Deformation Curves for A4- 1 .................... 149
Cornparison of Load vs . Deformation Curves for A4-2 .................... 149
Cornparison of Load vs . Deformation Curves for A4-3 .................... 150
Cornparison of Load vs . Deformation Curves for A4-4 .................... 150
Cornparison of Load vs . Deformation Curves for C2- 1 .................... 151
Cornparison of Load vs . Deformation Curves for C2-2 .................... 151
Cornparison of Load vs . Deformation Curves for C2-3 .................... 152
Figure B . 14
Figure B . 15
Figure B . 16
Figure B . 17
Figure B . 18
Figure B . 19
Figure B.20
Figure B -2 1
Cornparison of Load vs . Deformation Curves for C3- 1 .................... 152
. Cornparison of Load vs Deformation Curves for *C3-l.................. 153
.................... . Cornparison of Load vs Deformation Curves for C3-2 153
.................... Cornparison of Load vs . Deformation Cumes for C3-3 154
.................... Cornparison of Load vs . Deformation Curves for C4-1 154
Cornparison of Load vs . Deformation Cumes for C4-2 ................. ... 155
Cornparison of Load vs . Deformation Cumes for C4-3 .................... 155
Cornparison of Load vs . Deformation Cumes for C4-4 .................... 156
LIST OF SYMBOLS
cross-sectional area of the tension coupon at rupture
initiai cross-sectional area of the tension coupon
net cross-sectional area of the connected leg
gross area of cross-section
gross shear area
gross tension area
net shear area
net tension area
net area of cross-section
effective net area of cross-section
effective net cross-sectional area accounting for shear iag
gross cross-sectional area of the unconnected leg
width of the flange
width of the flange for channel/unconnected leg for angle
factored bearing capacity
factored block shear resistance
constant for bearing resistance
diameter of the bolt hole
location of strain gauges
depth of the section
average modulus of elasticity obtained from the tension coupons at the flat
portions
tensile strength of the material in bearing
nominal bearing stress
ultimate tensile strength of the material
yield strength of the material
ratio of & to Au
ductility factor
fabrication factor
geometry factor
shear lag factor
connection length
distance from the point of loading to the innermost bolt
width of the connected leg
distance dong the line of force from the edge of the connected part to the
center of a standard hole
failure path length normal to force
width of the unconnected leg
failure path length paralle1 to force (ie, in shear)
number of holes across the connected leg
number of holes across the web
number of bolts per line
maximum load obtained from the coarse or intermediate mesh model
net section capacity of the member calculated based on AIS1 Specification
net section capacity of the member calculated based on AISC Specification
predicted bearing capacity of the member
predicted block shear capacity of the member
maximum load obtained from the fine mesh model
maximum Ioad obtained from the finite element analysis
net section tensile strength of the member
predicted capacity of the member
net section capacity of the member calculated based on CSA-S 136-94
net section capacity of the member calculated based on CSA-S 16.1-94
dynamic ultimate strength of the test
ultimate capacity of the member
net section capacity of the member calculated based on the equations sugpsted
by University of Missouri-Roila
percent reduction in the area of a standard test coupon (51 mm gauge length)
force transmitted by the bolt or bolts at the section considered, divided by the
tension force in the member at that section
inner corner radius
coefficient of determination
relative difference in maximum load
distance dong the line of force between centers of holes
spacing of bolts perpendicular to the line of stress
thickness of the section
factored tensile resistance of the member
net section efficiency, reduction factor
flat width of the section
eccentricity, distance from the face of the connection to the center of gravity of
the mernber
factor that accounts for the effect of connection length
the slope of the Load-Deformation cuve for the tension coupon at the corner
resistance factor
tensile fracture resistance factor
resistance factor for bolts in beanng-type connections
1- INTRODUCTION
1.1 General
Tension members are frequently used in fabricated steel structures, Cornmon uses
for tension mernbers are in bracing rnembers, chords and web mernbers of tmsses,
hangers for floors and roofs, and in other sirnilar applications. The rnost widely used
structural shapes are the angle section and the channe1 section. For practical reasons. it is
unusual to connect the entire cross-section at the connections. As a result, highly non-
uniform stresses wiI1 be generated near the connection and this can cause localized
yielding in parts of the cross-section. Thus, the whole cross-section may not be fully
utilized which causes a reduction in the net section efficiency. This behavior of loss of
efficiency of the section is termed "shear lag".
Generally, the ratio of the ultimate capacity to the net section tensile strength of
the member is used to evaluate the efficiency of a cross-section. When fasteners are
used, this ratio is referred to as net section efficiency (U). Thus. for the case under
examination, the net section efficiency is:
where Pu = ultimate capacity of the member
P.,, = net section tensile strength of the member
An = net area of cross-section =gross area - hole area
Fu = tensile strength of the material
1.2 Statement of the Problem
Most design provisions, including Canadian Standard C W S A - S 16-1-94 (1 994)
for fabricated steel tension members, are based on the work done by Munse and Chesson
(1963) and subsequent work that was performed in an attempt to simplify the design
procedure. However, the work of Munse and Chesson and subsequent work on shear lag
effect in tension members made use of hot-rolled steel sections, which are much more
stocky than cold-formed steel sections. Therefore, these results may not be applicable to
cold-formed steel members in tension.
In the current CSA-S 136-94 (1994) Standard, Cold-Fonned Steel Structural
Members, the method proposed by Marsh (1969) is used to consider shear lag effects in
designing cold-formed tension members. This method considers a partially connected
tension mernber as an eccentrically loaded member; however, it does not consider the
geometry of the boIted connection and does not make any distinction between bolted and
welded connections. Therefore, more information from both physical tests and numerical
analyses of cold-formed steel tension members having different types of end connections
is desirable. Thus, there is a need to conduct research on the shear lag effect ir. cold-
formed angles and channels in tension.
1.3 Objectives
The objectives of this program are to:
1. Conduct physical tests of single angle and channel tension members in order to
examine the shear lag effect;
2. Expand the data base of test results on cold-formed tensile steel rnember with
bolted connection;
3. Examine the validity of the current design criteria for cold-forrned steel members
in tension;
4. Develop finite element models that can be used in future studies to obtain the
capacity of single angles and channels numerically;
5. Propose design criteria for cold-formed steel members in tension.
1.4 Methodology Used in the Research
In order to investigate the shear lag effect on bolted cold-formed tension
mernbers, an experimental program, which consists of three different sizes of unstiffened
cold-formed angles and channels with various connection lengths, was first conducted.
Based on the test results, finite element method would be applied to mode1 and anaiyze
the test specimens under tension. A parametric study was then conducted using the
validated finite element models. With the results obtained from the p ~ m e t n c study,
new net section efficiency equations for both angle and channel sections were developed
using non-linear regression analysis, and design recommendations for cold-formed
tension members were proposed.
1.5 Outline of the Thesis
Chapter 2 presents of a literature review on the net section efficiency of bolted
tension members. The review includes research done on hot-rolled and cold-fonned steel
sections. The design specifications currently used for both hot-rolled and cold-fonned
steel members in tension are also listed. Chapter 3 contains a description of the
experimental program in which specimen description, instrumentation, test set-up and
procedures are described. Chapter 4 presents the results of the test program. The finite
element method is used in Chapter 5 to predict the test results. Chapter 6 presents a
pararnetric study performed using the finite element mode1 developed in Chapter 5.
Based on the results of the parametric study and non-linear regression analysis, design
equations for cold-fomed steel tension members are proposed and design provisions are
developed. Finally, the summary, conclusions and recommendations are presented in
Chapter 7.
2. LITERATURE REVIEW
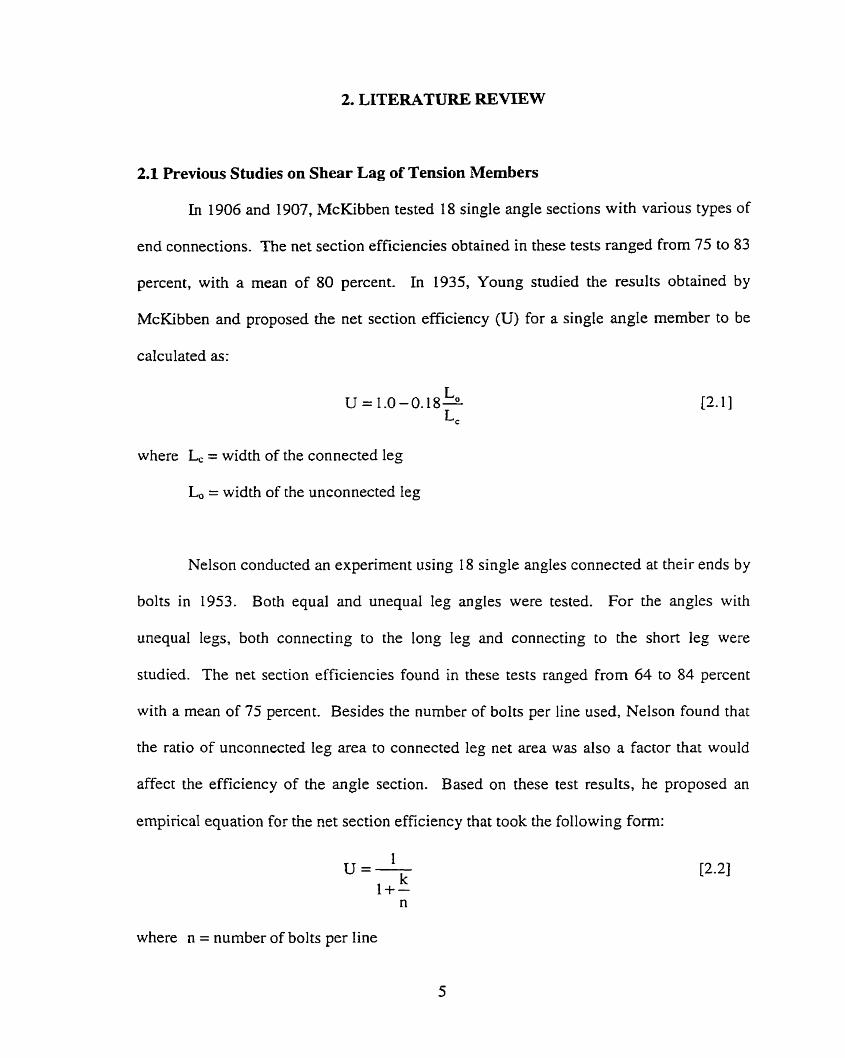
2.1 Previous Studies on Shear Lag of Tension Members
Ln 1906 and 1907, McKibben tested 18 single angle sections with various types of
end connections. The net section efficiencies obtained in these tests ranged from 75 to 83
percent, with a mean of 80 percent. In 1935, Young studied the results obtained by
McKibben and proposed the net section efficiency (U) for a single angle rnember to be
calculated as:
=O U = 1.0-0.18- Lc
where L, = width of the connected leg
L, = width of the unconnected leg
Nelson conducted an experirnent using 18 single angles connected at their ends by
bolts in 1953. Both equal and unequal Ieg angles were tested. For the angles with
unequal legs, both connecting to the long leg and connecting to the shon leg were
studied. The net section efficiencies found in these tests ranged from 64 to 84 percent
with a rnean of 75 percent. Besides the number of bolts per line used, Nelson found that
the ratio of unconnected leg area to connected leg net area was also a factor that would
affect the efficiency of the angle section. Based on these test results, he proposed an
empirical equation for the net section efficiency that took the following fonn:
where n = number of bolts per line
A, = gross cross-sectional area of the unconnected leg
A, = net cross-sectional area of the connected leg
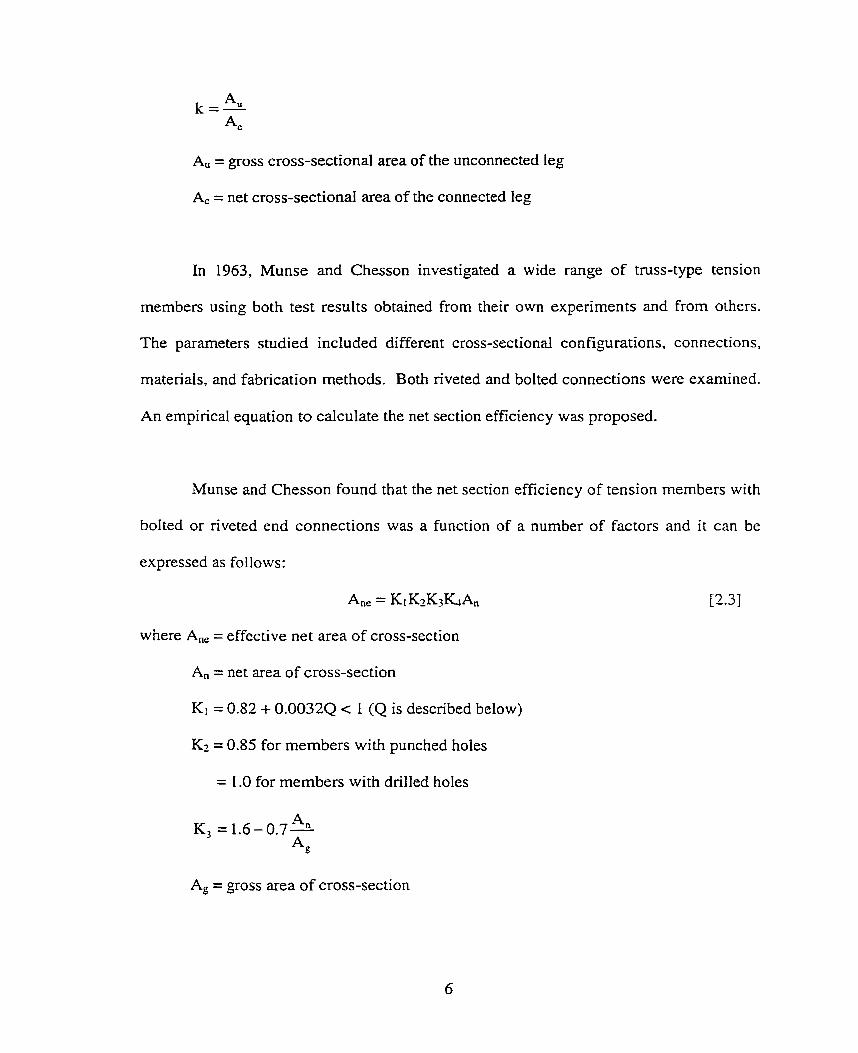
In 1963, Munse and Chesson investigated a wide range of truss-type tension
members using both test results obtained from their own experiments and from orhers.
The parameters studied included different cross-sectional configurations, connections,
materials, and fabrication methods. Both riveted and bolted connections were examined.
An empirical equation to calculate the net section efficiency was proposed.
Munse and Chesson found that the net section efficiency of tension members with
bolted or nveted end connections was a function of a number of factors and it can be
expressed as follows:
Ane = Ki &K3&An
where A,, = effective net area of cross-section
An = net area of cross-section
Kl = 0.82 + 0.0032Q < 1 (Q is described below)
K2 = 0.85 for members with punched hoIes
= 1 .O for members with drilled holes
A, = gross area of cross-section
- X
K, = 1 - - (T and L are descnbed in the following) L
Ki is the factor that accounts for the ductility of material, in which, the terrn Q is the
percent reduction in the area at rupture of a standard tensile test coupon (51 mm gauge
Iength). K3 is the fabrication factor that accounts for the reduction in efficiency due to
the effect of punching the holes. K3 is a geometry factor that accounts for the effect of
hole spacing on the connection. Finally, & is the shear lag factor. This factor takes into
account both the eccentricity in the connected part and the connection length. In the
expression for Kq, X refers to the distance from the face of the connection to the center of
gravity of the member, and L represents the connection length and is taken as the distance
between extreme fasteners.
In 1969, the influence of the edge distance and the end distance on net section
efficiency was investigated by Kennedy and Sinclair. In this investigation, 721 single
angle, single bolted connections were tested. In order to simulate the fabrication of
members in field conditions, a11 the specimens were cut to length by sheanng and al1
holes were punched. The test results showed that minimum edge and end distances were
required to develop the yield strength of the cross-section.
A series of tests on single angle members in tension and compression were
conducted by Marsh in 1969. The effects of plastic behavior were studied during
ultimate loading of the sections. Marsh stated that as the extreme fibres of the section
yield, the Iine of action of the load would move, as well as the eccentricity. Based on
these observations, he proposed that the net effective area (A,,) could be calculated as
follows:
where L, = width of the connected leg
L, = width of the unconnected leg
t = thickness of the section
L' = distance from the point of loading to the innermost bolt
d = diameter of the bolt hole
For unequal leg angles, this formula gives a good prediction if the long leg is connected.
However, the prediction is rather optimistic if the short leg is connected.
In 1993, an experimental program was conducted by Wu and Kulak to investigate
the shex lag effect on single and double angle tension members. The parameters studied
included:
- Lenpth of the member;
- Length of the connection;
- Size and disposition of the cro section, inch ~d ing angle thickness and whether
the long or short leg is connected;
- Out-of-plane stiffness of the gusset plate for the single angle cases.
Based on the test results, the following design formula was proposed:
T, = 0.85@(FU& + BF,A,)
where T, = factored resistance of the member
@ = 0.90
Fu = ultimate tensile strength of the material
Fy = yield strength of the materid
A, = net area of the connected leg at the critical cross-section, computed by taking
the diameter of holes 2 mm larger than the nominal size if the hoIes are
punched
A, = gross area of the connected leg
p = 1 .O for members with four or more transverse lines of fasteners
= 0.5 for members with fewer than four transverse lines of fasteners
AIternatively, as a convenience in the design process, a simplified equation was
also proposed and is stated as follows:
A,, = UA,
and T, = 0.8S$FuAn,
where U = 0.80 if the connection has four or more fasteners per line
= 0.60 if the connection has fewer than four fasteners per line
A, = net area of the critical cross-section, calculated by taking the hole diarneter
2 mm larger than the nominal size if the holes are punched
2.2 Specific Studies on Cold-Formed Tension Steel Members
Since 1950, Winter conducted a series of tests on cold-forrned steel with bolted
connections and the tests were mainly focused on the flat sheet connections with washers.
Based on his findings, he derived empirical relationships to predict the ultimate capacity
and mode of failure for bolted connections. Four basic types of failure modes, as shown
in Fig. 2.1, were identified as follows:
1. Longitudinal shearing (block shear failure) of the sheet (Fig. 2. la)
2. Bearing failure, leading to a visible bulge in front of the bolt or bolts
(Fig. 2.1b)
3. Net section fracture (Fig. 2- 1 c)
4. Bolt shear fracture (Fig. 2, Id)
In 1975, Chong and Matlock studied the strength of bolted connections without
washers in cold-formed steel sheets. The procedures they used followed closely to those
being used by Winter. In their test results, they observed the same four types of failure
modes described by Winter. They also derived relationships in the same format as
Winter for the ultimate capacity for the bolted connections without washers.
In 1993, an experimental and analytical study was initiated by La-Boube and Yu
at the University of Missouri-Rolla to expand the knowledge and understanding of the
behavior of cold-formed steel bolted connections. This research consisted of two parts.
The first part concentrated on the tensile capacity, bearing capacity and the interaction of
tension and bearing capacities of Bat sheet cold-formed steel bolted connections. For the
specimens that failed in bearing, the results showed that the AIS1 specification was a
good predictor of the ultimate strength while the AISC specification was not. For the
specimens that failed in net section, both the AIS1 and AZSC specifications were deemed
to be good predictors. In the second part, the tensile capacity and bearing capacity of
bolted connections of flat sheet, angle and channel cold-formed steel members were
addressed. For the angle and channel sections that failed by net section fracture, the
studies showed that the current AISC specification formulation for addressing the
influence of shear lag is unacceptable for cold-formed steel connections. Based on the
tests results, the equations that could estimate the degrading influence of shear lag on the
tensile capacity of bolted connections were derived for cold-formed angle and channel
cold-formed sections and are stated as follows:
(i) for angle sections
(ii) for channel sections
but 2 0.4
but 2 0.5
where U = net section efficiency
- x = distance from the face of the connection to the center of gravity of the
member
L = connection length
Between 1994 and 1998, a total of eighteen tests were conducted by Cheng et al.
at the University of Alberta to study the shear Iag effects on bolted cold-formed sections
in tension. Among those cold-formed steel tests, there were seven unstiffened angles,
five stiffened angles, and six unstiffened channels. Test results showed that the shear lag
effects must be considered in the design of bolted cold-formed steel angles in tension
while the shear lag effect is negligible for chmnel sections. The results also showed that
the stiffener has no effect on the net section efficiency.
2.3 Current Design Specifications
2.3.1 American Iron and Steel Institute (AISI, 1996)
2.3.1.1 Tensile S t r e n a
According to the specification, the tensile resistance of the net section connected
by fasteners shall be the lesser of:
6) Tr = $A&
0 = 0.95
(ii) When washers are provided under both the bolt head and the nut
Tr = @(1 .O - 0.9r + 3 r d ~ ' ) F,An 5 @FuAn C2.111
0 = 0.65 for double shear
$ = 0.55 for single shear
(iii) Either washers are not provided under the bolt head and nut, or only one
washer is provided under either the bolt head or nut
T, = ((1 .O - r + 3.5rd/sy) F,An 5 $Fu& [2.12]
9 = 0.65
where A. = net area of the connected part
r = force transmitted by the bolr or bolts at the section considered,
divided by the tension force in the member at that section. If r
is less than 0.2, it shall be permitted to be taken equal to zero
s' = spacing of boIts perpendicular to the line of stress; in the case
of a single bolt, s = gross width of sheet
d = diameter of bolt hole
Fy = yield strength of the material
Fu = uItimate tensile strength of the material
2.3.1-2 Bearing Capacitv
The factored bearing capacity, Br, of a bolted section shall be taken as:
Br = QdtF,
where d = diameter of bolt hole
t = thickness of the section
Fp = nominal bearing stress as given in Tables 2.1 and 2.2
4 = resistance factor, given in Tables 2.1 and 2.2
2.3.2 American Institute of Steel Construction (AISC, 1993)
2.3 2.1 Tensile S trength
This specification indicates that for fracture in the net section, the factored tensile
strength shall be the lesser of the followings:
(9 Tr = OF& [2. 141
(ii) Tr = &FuAne [2. 151
where Tr = factored tensile resistance
Fy = yield strength of the matend
Fu = ultimate tensile strength of material
A, = gross cross-sectional area
Ane = effective net area = UA,
An = net area of the specimen
U = reduction coefficient
4, = 0.90
@, = 0.75
In the Eqn. 2.15, the reduction coefficient varies depending on the type of
member and the nurnber of bolts in the connection. According to the 1993 AISC
Commentary, the reduction coefficient shall be taken as follows:
(a) for connections with two bolts in the line of stress,
U = 0.75
(b) for connections with three bolts in the line of stress,
U = 0.85
However, the specification makes no provision for rnembers connected with only
one bolt. In addition, the 1993 specification introduced the following caiculation of the
reduction coefficient U:
- U = 1 - X / L 50.9 C2.161
where = connection eccentrïcity
L = length of the connection parallel to the line of stress
2.3.2.2 Bearinn Ca~acity
According to Section J3.10, the factored bearing strength, Br, at bolt holes shail be
taken as follows:
(i) When L, 1.5d and s 2 3d and there are two or more bolts in line of stress:
a) when deformation around the bolt holes is a design consideration
B, = 2.4@dtFu 12.1 71
b) when deformation around the bolt holes is not a design consideration
(1) for the bolt nearest the edge
B, = @LetFu 5 3.0@dtFu
(2) for the remaining boIts
Br = Q(s-0.5d)tFu 5 3.0odtF" 7 191 [-•
(ii) When L, < 1.5d and s < 3d or for a single bolt in the line of force:
(1) for a single bolt hole or the bolt nearest the edge when there are two or
more bolt holes in the line of force
Br = @LetFu 1 2.4@dtFu [2.20]
(2) for the remaining bolts
Br = $(s-OSd)tF, 5 2-4@dtFu l2.2 11
where Le = distance along the line of force from the edge of the connected part to
the center of a standard hole
s = distance along the line of force between centers of standard holes
d = diameter of bolt hole
Fu = ultimate strength of the material
t = material thickness
@ = resistance factor, taken as 0.75
2.3.2.3 Block Shear
The block shear strength is determined by the sum of the shear strenglh on a
failure path paralle1 to the force direction and the tensile strength on a perpendicular
segment. When tensile strength on the net section is used to determine the resistance on
one segment, yielding on the gross section shalI be used on the perpendicular segment.
The factored block shear resistance, BI,, shall be deterrnined as follows:
(i) when FUAnt > 0.6F,An,
BI, = $[0.6FyAp + FuAnJ
(ii) when 0.6FuAn, > F,Ant
BI, = $[0.6FuA, + F,A,]
where Agv = gross shear area
A,, = gross tension area
An, = net area subject to shear
A,, = net area subject to tension
Fy = yield strength of the material
Fu = ultimate tensile strength of the material
9 = resistance factor, taken as 0.75
2.3.3 CSA Standard S15.1-94
2.3-3.1 Tensile Strength
The factored resistance of a tension member, T,, developed by a member
subjected to an axial tensile force shall be taken as the lesser of:
(i> Tr = @Ag, [2 -241
(ii) T, = 0.8 5 @AneFu l2.251
(iii) Tr=0.85@A',.F, l2.263
where T, = factored tensile resistance
@ = resistance factor, taken as 0.9 for tension members
A, = gross cross-sectional area
A,, = effective net area
A'ne = effective net cross-sectional area accounting for shear lag
Fy = yield strength of the material
Fu = ultimate strength of the material
The first equation is based on the yield strength of the gross section and the rest are
based on the ultimate tensile strength of the effective net section of the member. In the
case where the member capacity is govemed by the net section rupture, there is the
additional multiplier of 0.85 to the regular reduction factor of 0.9. This additional
multiplier is to increase the safety index for this mode of failure because i t was found that
in the case where the net section fractures before the gross section yields, failure occurs
with little deforrnation and little waming.
In the equation (iii) stated above, the effective net area of the section is reduced to
account for the effect of shear Iag. According to Clause 12.3.3.2 (b) and (c), the reduced
effective net area shall be taken as follows:
(a) for angles connected by only one leg with
(i) four or more transverse lines of fasteners,
A'ne = 0.8 Ane
(ii) fewer than four transverse lines of fasteners,
A',, = 0.60 Ane
(b) for structural shapes other than 1 shapes, shapes made from 1 shapes, and
angle sections connected with
(i) three or more transverse lines of fasteners:
A'.. = 0.85 A,, or
(ii) with two transverse lines of fasteners:
A',, = 0.75 Ane
2.3.3.2 Bearing Capacitv
The factored bearing resistance of a mernber with bolted connections shall be
taken as:
Br = 3 QbtdnF,
where t = material thickness
d = diameter of bolt hole
n = number of bolts in the connection
Fu = ultimate tensile strength of the material
QUb = performance factor for bolts in bearing-type connections,
taken as 0.67
2.3.3.3 BIock Shear
The facfored block shear strength, BI,, of a rnember shall be calculated as:
BI, = 0.85QU[0.6L, + LJtF,
where L, = failure path length parallel to force (ie, in shear)
L, = failure path length normal to force
Fu = ultimate strength of the material
@, = tensile fracture resistance factor, taken as 0.75
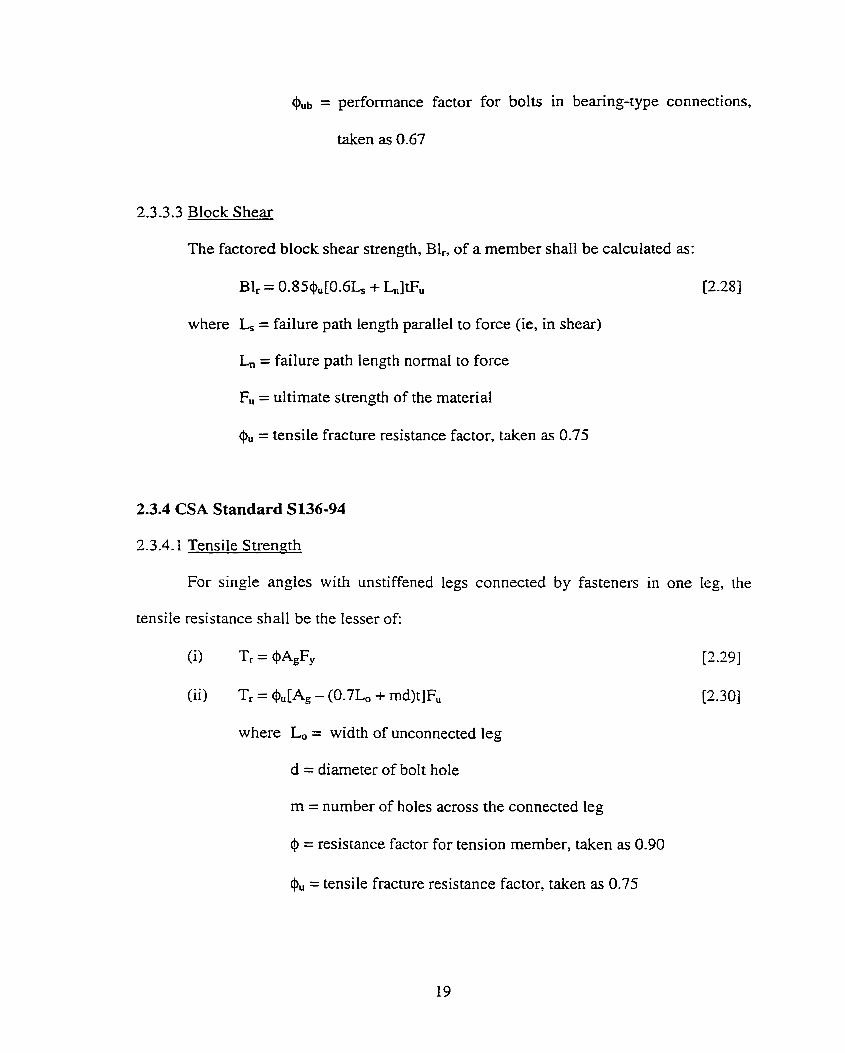
2.3.4 CSA Standard S136-94
2.3.4.1 Tensile S trength
For single angles with unstiffened legs connected by fasteners in one leg, the
tende resistance shall be the lesser of:
(i) Tr = @ A g ,
(ii) T, = @,[A, - (0.7Lo + md)t]F,,
where L, = width of unconnected leg
d = diameter of bolt hole
m = number of holes across the connected leg
@ = resistance factor for tension member, taken as 0.90
Qu = tensile fracture resistance factor, taken as 0.75
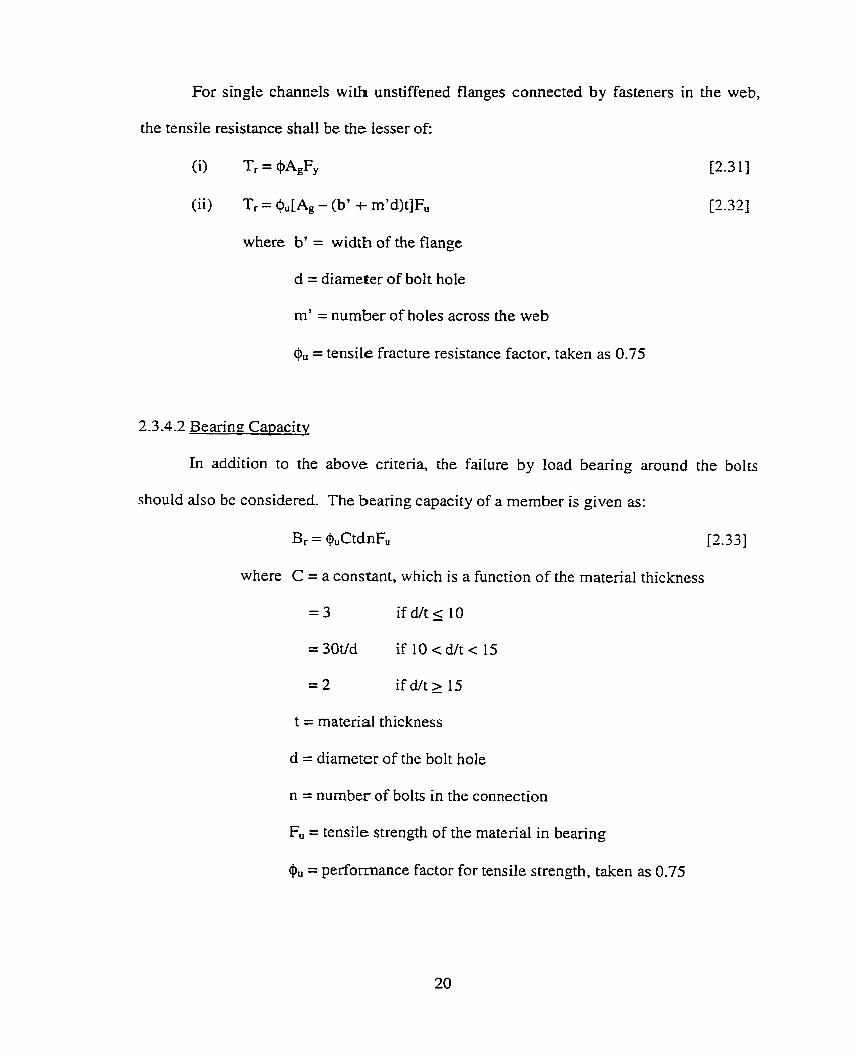
For single channels with unstiffened flanges connected by fasteners in the web,
the tensile resistance shail be the lesser of:
(il Tr = @AgF,
( i ) Tr=@u[Ag-(b'+rn'd)t]Fu
where b' = width of the flange
d = diameter of bolt hole
m' = number of holes across the web
Qu = tensile fracture resistance factor, taken as 0.75
2.3.4.2 Bearing Capacitv
In addition to the above criteria, the failure by load bearing around the bolts
should also be considered. The bearing capacity of a member is given as:
Br = @,CtdnF, [2.33]
where C = a constant, which is a function of the matend thickness
= 3 if d/t 5 10
= 30t/d i f l O c d / t d 5
= 2 if d/t 2 15
t = material thickness
d = diameter of the bolt hole
n = number of bolts in the connection
Fu = tensile strength of the material in bearing
Qu = performance factor for tensile strength, taken as 0.75
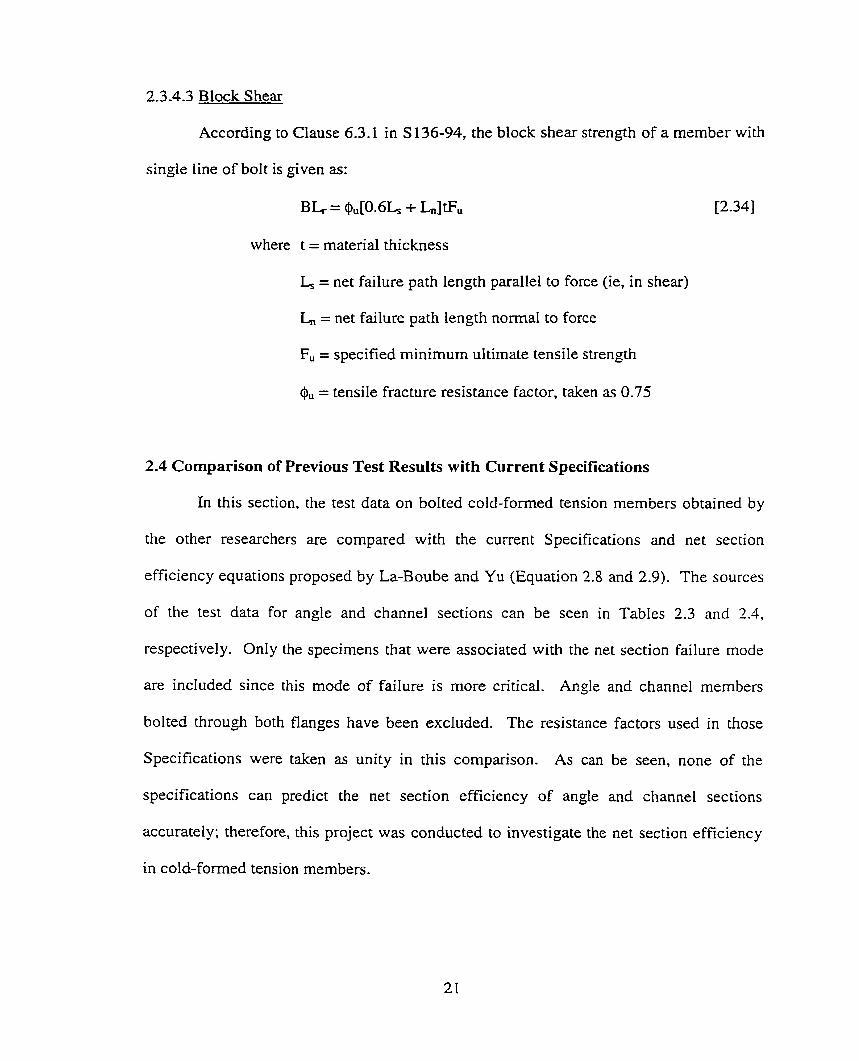
2.3 -4.3 Block Shear
According to Clause 6-3.1 in S 136-94, the block shear strength of a member with
single Iine of bolt is given as:
B L = @"[O& + LI tFu [2.34]
where t = material thickness
= net failure path length parallel to force (ie, in shear)
L, = net failure path length normal to force
Fu = specified minimum ultimate tensile strength
0, = tensile fracture resistance factor, taken as 0.75
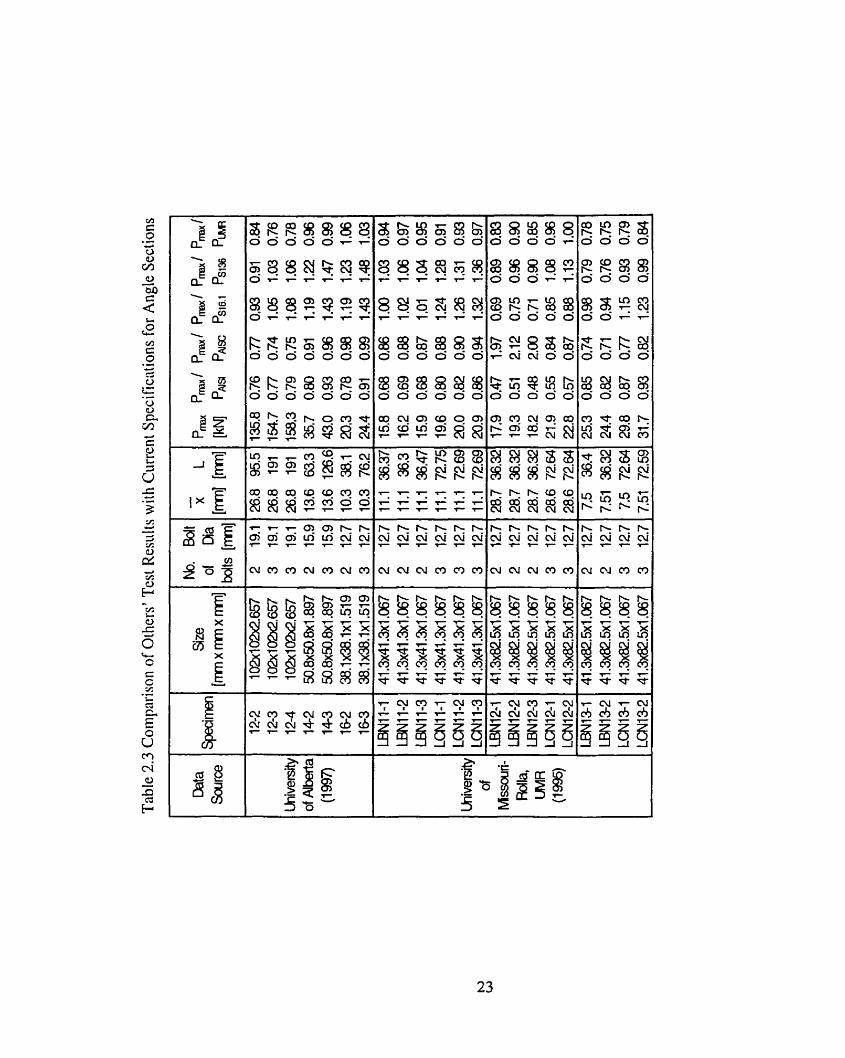
2.4 Cornparison of Previous Test Results with Current Specifications
In this section, the test data on bolted cold-formed tension members obtained by
the other researchers are compared with the current Specifications and net section
efficiency equations proposed by La-Boube and Yu (Equation 2.8 and 2.9). The sources
of the test data for angle and channel sections can be seen in Tables 2.3 and 2.4,
respectively. Only the specimens that were associated with the net section failure mode
are included since this mode of failure is more critical. Angle and channel members
bolted through both flanges have been excIuded. The resistance factors used in those
Specifications were taken as unity in this comparison. As can be seen, none of the
specifications can predict the net section efficiency of angle and channel sections
accurately; therefore. this project was conducted to investigate the net section efficiency
in cold-forrned tension members.
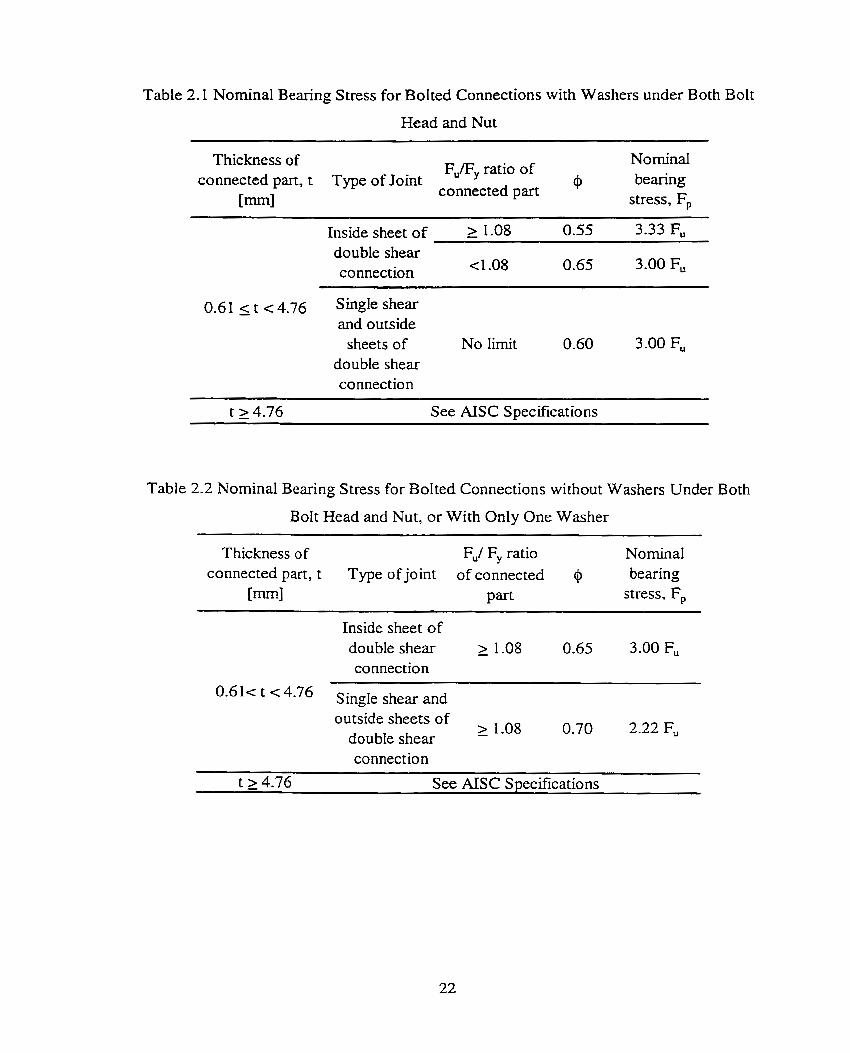
Table 2.1 Nominal Bearing Stress for Bolted Connections with Washers under Both Bolt
Head and Nut . -
Thickness of Fu/Fy ratio of Nominai
connected part, t Type of Joint cP bearing
[mm1 connected part stress, F,
Inside sheet of - > 1 .O8 0.55 3.33 Fu -
double shear connection
0.61gc4.76 Skgleshear and outside
sheets of double shear connection
t 2 4.76 See AISC Specifications
Table 2.2 Nominal Bearing Stress for Bolted Connections without Washers Under Both
Bolt Head and Nut, or With Only One Washer
Thickness of Fu/ F, ratio No minal connected part, t Type of joint of connected bearing
[mm3 Pafl stress, F,
Inside sheet of double shear connection
< 4-76 S ingle shear and outside sheets of
> 1.08 doubIe shear - connection
t 2 4.76 See AISC Specifications
- - F - - v - - v - - - T X X X X X X X X X * L n I n r r , L n L T , q ' e u > a i f w i w ! a a c * . -
@ ? - r n c ? Q c ?
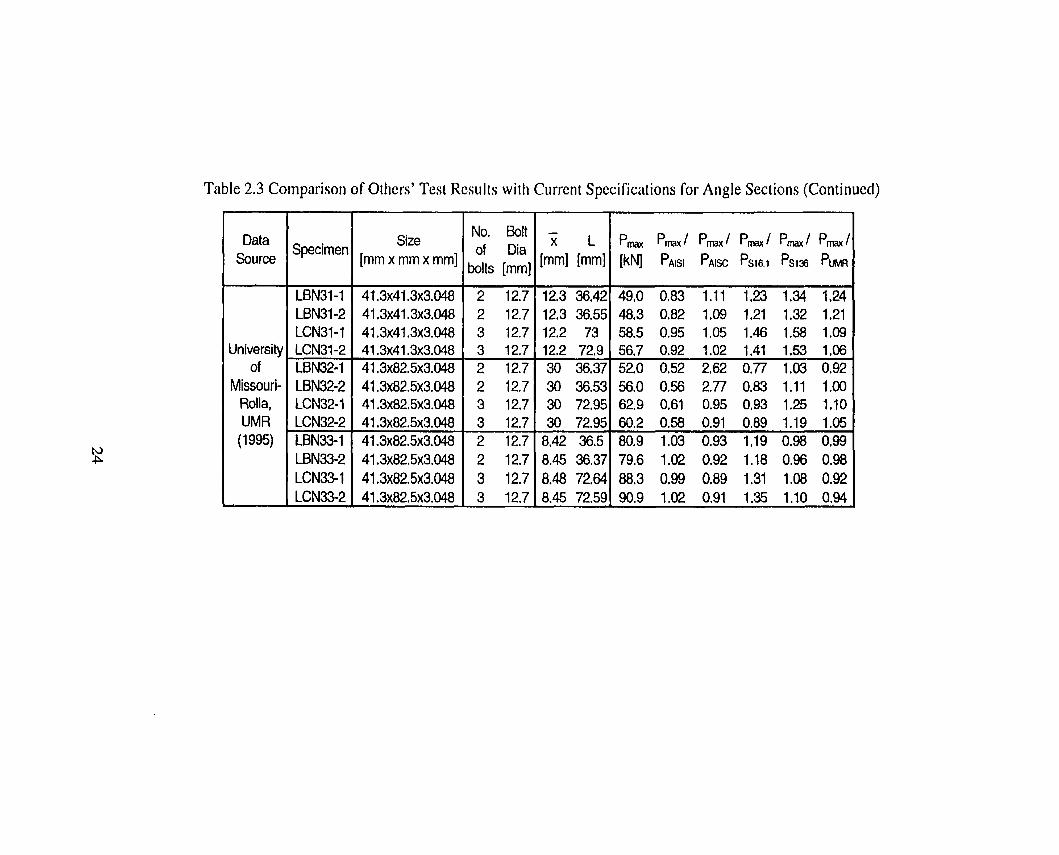
Table 2.3 Cornparison of Oihers' Test Resiilts with Current Specifications for Angle Sections (Continued)
Data Source
University of
Missouri- Rolla, UMR (1 995)
i
Size
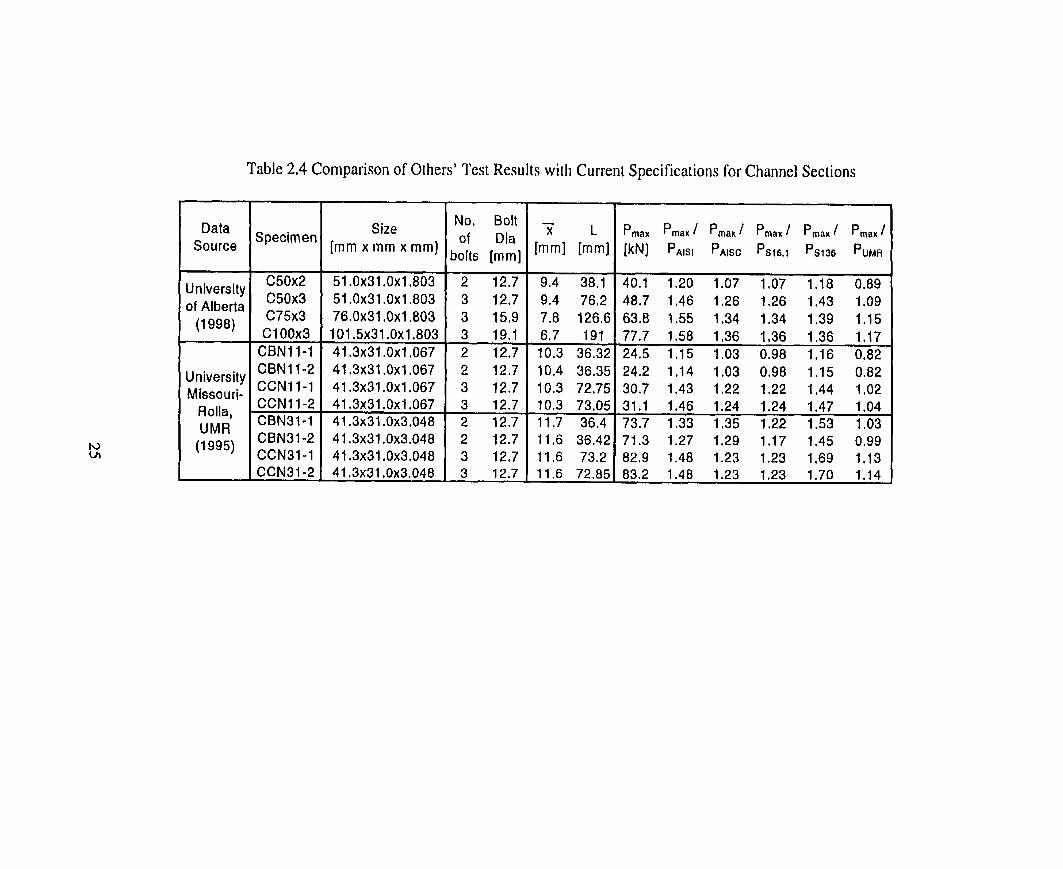
Table 2.4 Cornparison of Others' Test Results witli Current Specifications for Channel Sections
Size No, BON -
Data ~pecimen of Dia x L Pmm P m a x I ? m a x i PmaK 1 Pmax 1 Pmax /
Source [mm x mm x mm] bolts [mm] [mm] [mm] [kN] PAISI PAISC ps16.1 Psi36 PUMR
University of Alberta (1998)
University Missouri-
Rolla, UMR
l (1995)
C50x2 C50x3 C75x3 C100x3 CBN11-1 CBN11-2 CCN11-1 CCN11-2 CBN31-1 CBN31-2 CCN31-1 CCN31-2
51.0~31.0~1.803 51.0~31.0~1.803 76.Ox3l,Oxl.8O3 101.5~31.0~1.803 4l.3x3l.Oxl,O67 41,3~3l.OXl.O67 4l.3x3l.Oxl.O67 41.3~31.0~1.067 41.3~31,0~3.048 41.3~31.0~3.048 41.3~31.0~3.048 41.3~31 ,Ox3.O48
2 12.7 3 12.7 3 15.9 3 19.1 2 12.7 2 12.7 3 12.7 3 12.7 2 12.'7 2 12.7 3 12.7 3 12.7
9.4 38.1 9.4 76.2 7.8 126.6 6.7 191 10.3 36.32 10,4 36.35 10.3 72.75 1 O,3 73.05 11.7 36.4 11.6 36.42 11.6 73.2 11.6 72.85
40.1 1.20 1.07 1,07 1.18 0,89 48.7 1.46 1.26 1.26 1.43 1.09 63.8 1.55 1.34 1.34 1,39 1.15 77.7 1.58 1.36 1.36 1.36 1.17 24.5 1 .l5 1 .O3 0,98 1.16 0,82 24,2 1 .l4 1 .O3 0.98 1.15 0.82 30.7 1.43 1.22 1.22 1.44 1.02 31.1 1,46 1.24 1.24 1.47 1.04 73.7 1.33 1.35 1-22 1,53 1.03 71 .3 1.27 1.29 1.17 1.45 0.99 82.9 1.48 1.23 1.23 1.69 1.13 83.2 1 A 8 1-23 1.23 1.70 l,l4
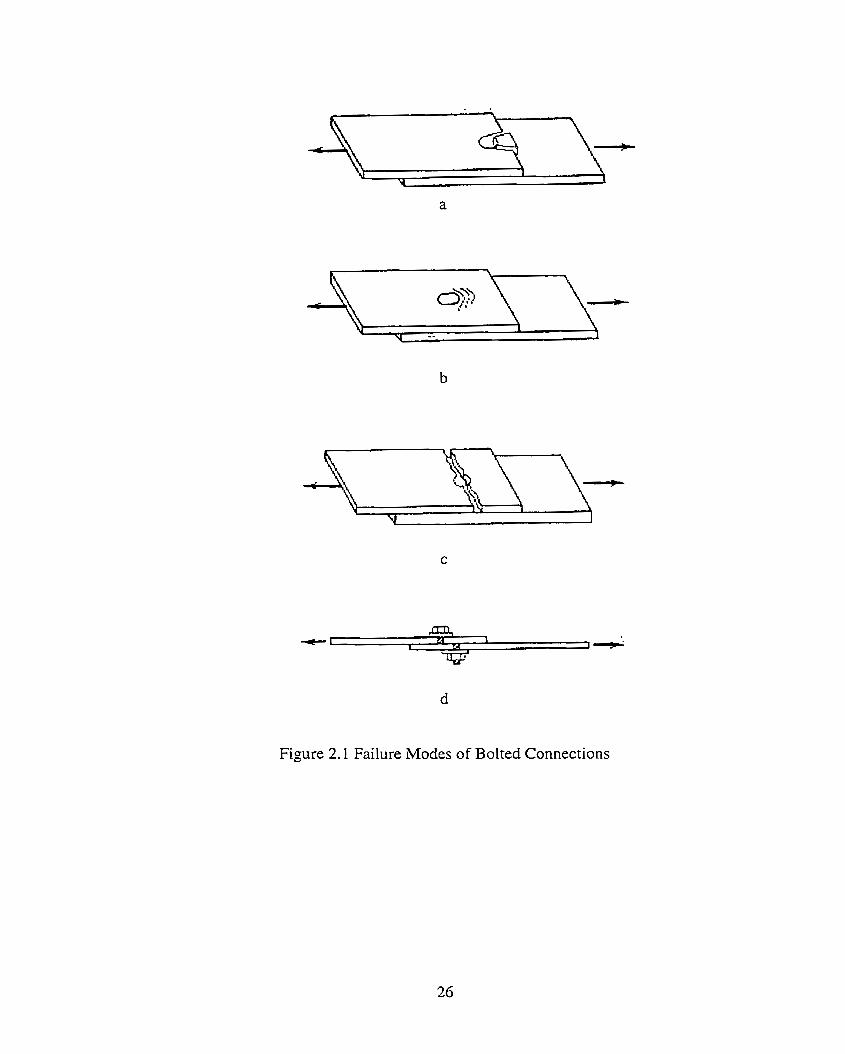
Figure 2.1 Failure Modes of Bolted Connections
3. EXPERIMENTAL PROGRAM
3.1 General
The purpose of this experimental program is to investigate the effect of shear Iag
on the net section fracture of boIted cold-formed steel angle and channel tension
mernbers. The parameters that were considered in this program were:
number of transverse lines of bolts/ length of connections
size of cross-section
presence of washers
Besides the net section strength of the member, the strain distributions at the
critical section and the deformations of the specimens were also examined. A total of
twenty-three specimens were tested. Three different sizes of both angle and channel
sections were used. OnIy one line of bolts was considered and the number of transverse
lines of bolts tested varied from one to four. A11 tests were performed at the University of
Alberta using MTS lOOOlcN Universal Testing Machine.
3.2 Tension Coupons
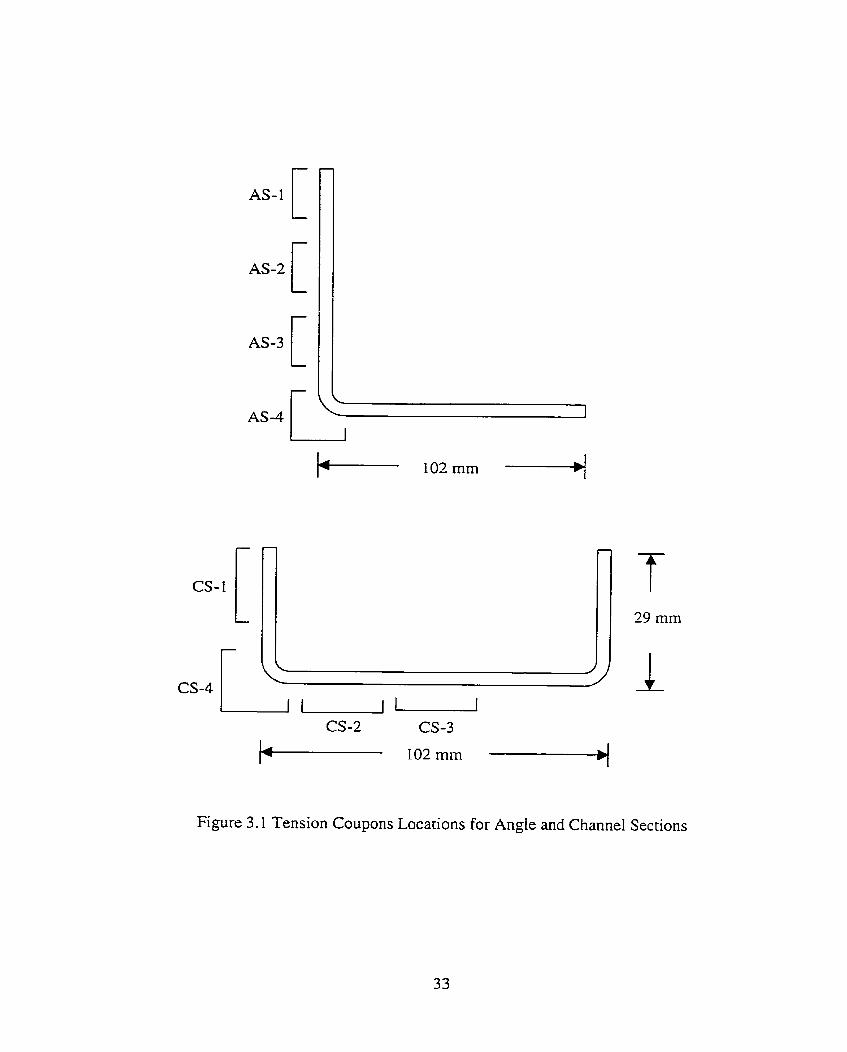
The material properties of the angle and channel sections were obtained using
tension coupon tests. A total of eight tests were conducted. The coupons were taken
from 305 mm leftovers from the delivered 3050 mm sections. For the angle section,
three coupons were taken from the flat portion of one leg and one from the corner of the
102 mm angle. For the channel section, one coupon was taken from the Range, two
coupons were taken from the web and one coupon was taken from the corner of the L02
mm channel. The Iocations of tension coupons cut from the angle and channel sections
are shown in Fig. 3.1. A gauge length of 50 mm was used for the coupons. The tension
coupons were prepared in accordance with the requirements of Amencan Society for
Testing and Materiais (ASTM) A370 (1997).
The load and the deformation were obtained as a read-out from the MTS testing
machine. An extensometer with a 50 mm gauge length was used to measure the strain in
the coupon. Elongation over the coupon gauge length at rupture was measured after
rupture.
3.3 Specimens Description
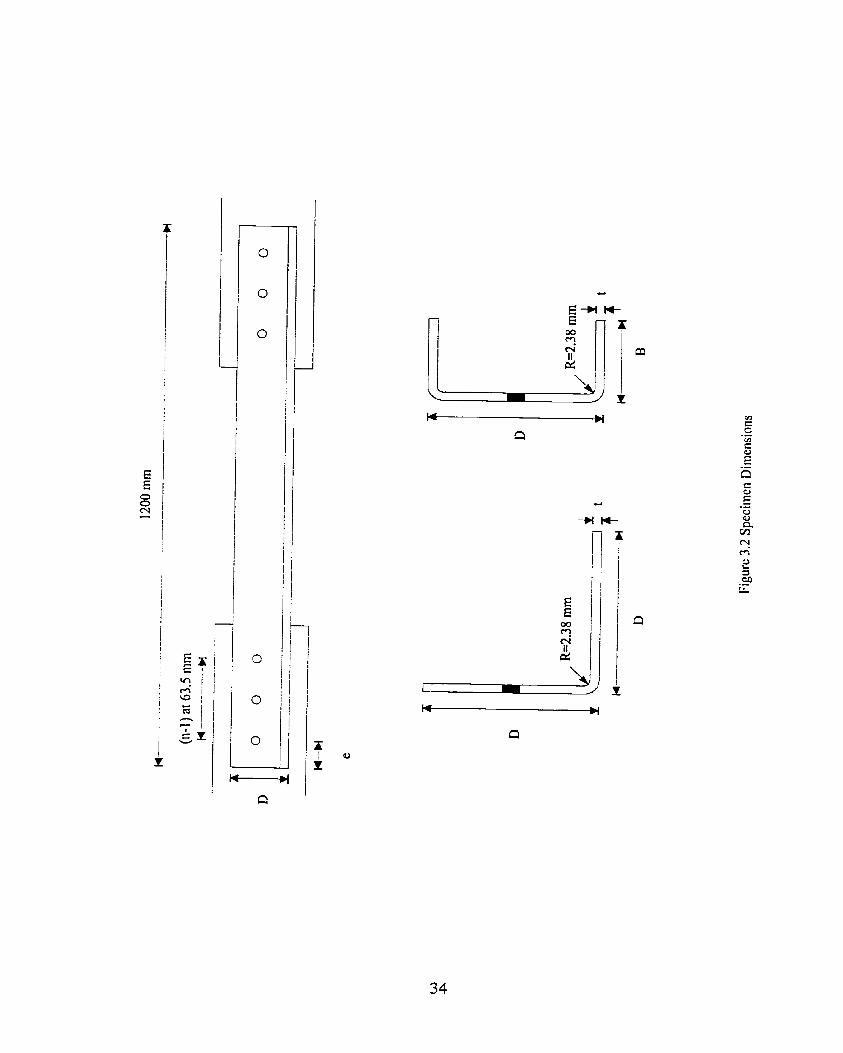
The specimens were prepared from 12 individual pieces of angle and channel.
Each of the pieces was about 3000 mm long. They were produced from the same roll of
sheet steeI and were formed by brake forming. Two specimens were cut from each piece
and the length of each specimen was about 1200 mm long. The description of the
specimens is presented in Table 3.1 and shown in Fig. 3.2.
A system of identification was used to differentiate between the various
specimens. A three Ietteddigits name was given to each specimen. The first letter
represents the geometry that being either an angle (A) or a channel (C). The second digit
signifies the size of the specimen in inches. The third digit to the right of the hyphen
designates the number of bolts used in the connections. Washers were used in al1 the
specirnens, except A2-2N. N represents the specimen without washer. In addition,
duplicated tests were made for specimen A3- 1 and C3- 1. An asterisk is placed in front of
the first digit in order to distinguisii the duplicated tests. As shown in Table 3.1, al1 test
specimens had the same thickness.
Al1 holes were drilled to a diameter of 20.6 mm and these accommodated 29.1
mm dia. ASTM A325 bolts in a bearhg-type connection- Gusset plates were prepared
from steel meeting CAN/CSA G40.21-M Grade 350W (1997). The gusset plates had a
thickness of 12.7 mm and a width of 50.8 mm within the tension grips and 101.6 mm
beyond the tension grips. One set of gusset plates was used throughout the entire phase
of the test set-ups since only one set of bolt spacing was used.
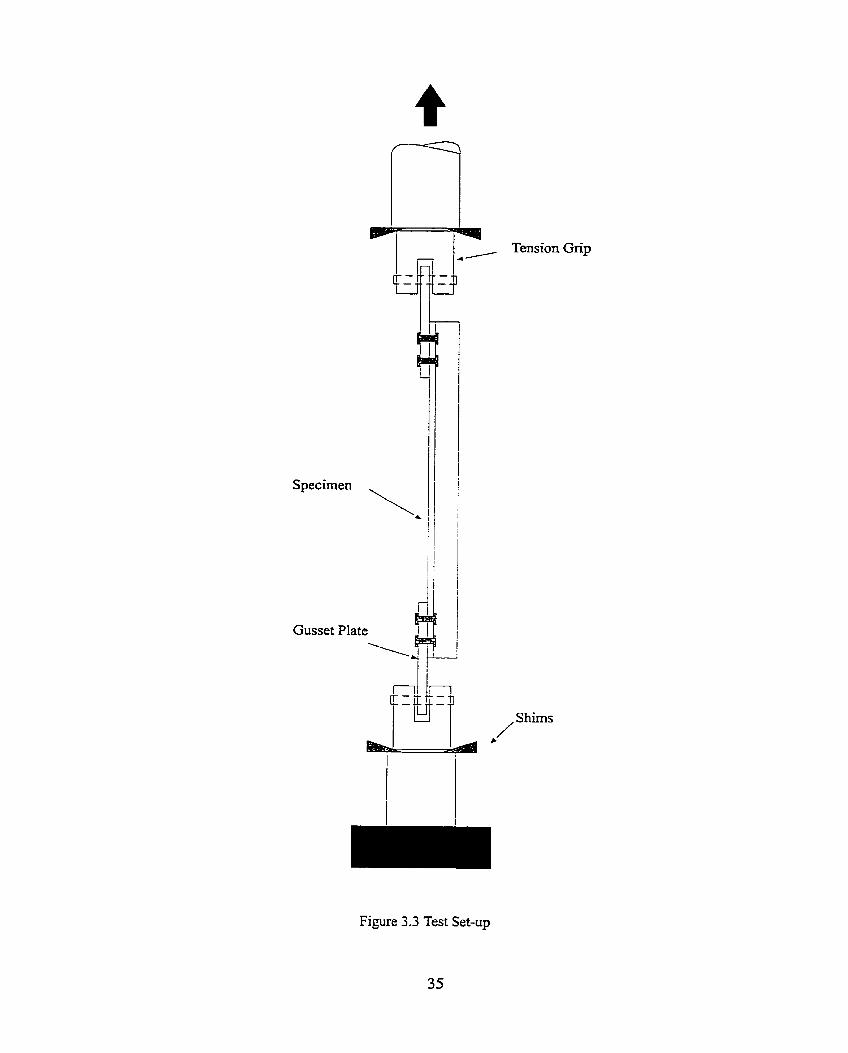
3.4 Test Set-up and Instrumentation
The gusset plates were held in the tension grips with bolts. Shims were inserted
between the tension grips and the crosshead to prevent any in-plane rotation of the gusset
plates. The test set-up is shown in Fig. 3.3.
Electrical resistance strain gauges were used to measure the strain distribution at
the critical section of the rnember (Section A) and the rnid-Iength of one of the angle and
channel sections (Section B). All gauges were orïented to measure the strains in the load
direction. The strain pauge locations for the angle and channel sections are shown in Fig.
3.4 and Fig. 3.5, respectively.
The total elongation of a specimen was measured by stroke of the testing
machine. Two tests were repeated in order to verify the stroke measurement. They were
76 mm channel and angle sections with one bolt at the connection. In these two tests,
two linear variable differential transfomers (LVDT's) were used to rneasure the
elongation of the specimen on the connected element. The locations of LVDT's are
shown in Fig. 3.6, one was connected to the head of the bolts while the other was tied to
the gusset plates at the boIt locations.
3.5 Test Procedure
The top and bottom gusset pIates were first installed in the tension grips. After
alignment was considered to be satisfactory, the specirnen was bolted to the gusset plates
with one washer on the specimen side for each bolt (except specimen A2-2N). The bolts
were lightly tightened but not yet at the so-called "snug-tight" condition. A tensile load
of 2 kN was then applied to the system such that the bolts were bearing against the gusset
plate and the specimen. In this way, major sIip of the connections during the loading was
unIikely. While the load was being held, the bolts were turned to "snug-tight" condition,
the load on the MTS was then returned to zero.
With d l instrumentation zeroed, the tensile load was then applied using the MTS
set on the stroke control mode. At regular intervals, the stroke was held constant such
that the specimen was allowed to redistribute the stress and static load readings were
obtained. Readings of strain gauges and LVDTs were taken continually during the

loading process. An x-y plotter was used to monitor the load versus elongation behavior
of the test.
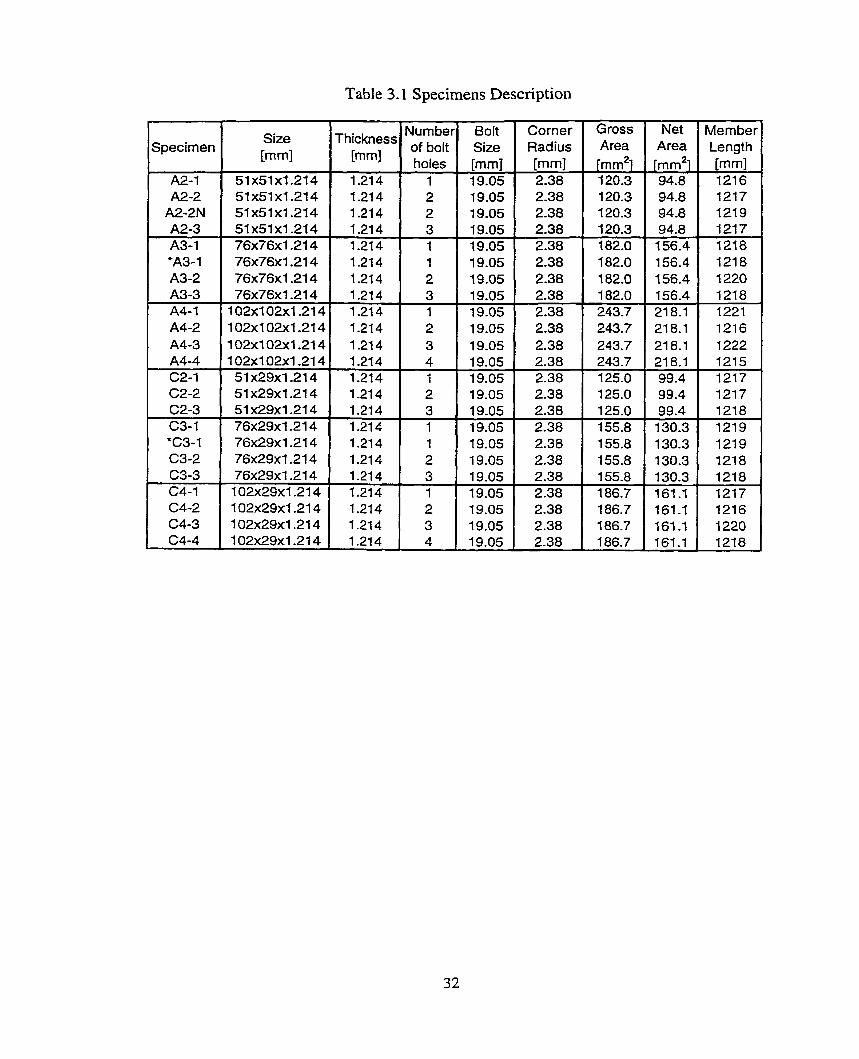
Table 3.1 Specimens Description --
Specimen Size mm1
Number Boit Corner Gross Net of bolt Size Radius Ares Ares
1 holes [mm] [mm] [mrn21 [mm2] 1 19.05 2.38 120.3 94.8
Member Length [mm1 121 6 121 7 1219 121 7 1218 1218 1220 1218 1221 121 6 1222 1215 1217 121 7 1218 1219 1219 1218 121 8 1217 1216 1220 1218
AS- 1
AS -2
AS -3
CS- 1
du- cs-2 cs-3
Figure 3.1 Tension Coupons Locations for Angle and Channel Sections
Tension Grip
Figure 3.3 Test Set-up
35
Specimen
LVDT- 1
Gusset Plate
Figure 3.6 Locations of LVDT's
4. TEST RESULTS
4.1 Tension Coupon Tests
The material properties of the tension coupons taken from the angle and channel
sections are reported in Table 4.1. The average modulus of elasticity, static yield
strength, dynamic yield strength, static ultimate strength, and dynarnic ultirnate strength
for the flat coupons from the angle and channel sections are shown in Table 4-2. The
material properties of the corner coupons were calculated by assuming the modulus of
elasticity is the same as the flat coupons, the initial cross-sectional area for corner
coupons, Ao, can then be calculated using the following formula:
where -/Ac = the slope of the Load-Deformation curve for the tension coupon at the
corner
Eave = average modulus of elasticity obtained from the tension coupons at the flat
portions
The modulus of elasticity of tension coupon CS-3 is significantly Iower than that of CS-1
and CS-2. The reason is probably due to the error in extensometer; therefore, the result
of tension coupon CS-3 is not considered. The rupture strain for both corner coupons
AS-4 and CS-4 are not available due to the non-uniform distortion at the corner of the
coupon at rupture. The average values calculated in Tabie 4.2 for each section are based
on the values of the coupons taken from the flat portion. The stress-strain diagrams for
the coupons of angle and channel sections are shown in Fig. 4.1 and Fig. 4.2,
respectively .
4.2 Full Scale Tests
4.2.1 Test results
The dynamic ultimate strength, PT=, and the failure mode of the specimens are
presented in Table 4.3. The net section efficiency (N.S.E.) of the member was calculated
based on the dynamic ultimate load and the measured dynamic ultimate strength of the
tension coupon material.
PTtSf N.S.E. = - F W ,
From a design point of view, usually static strength is used to calculate the predicted
load; however, dynamic strength is used in this report because using the dynamic strength
would give a lower value of net section efficiency, as a result, a conservative result would
then be obtained. In addition, the load obtained from the test was in dynamic, therefore
the dynamic strength should be used to calculate the predicted load. Table 4.3 shows that
the net section efficiency increases as the connection length increases.
4.2.2 General observations
During the loading process, the gusset plates used for al1 angle and channel
sections remained straight. As the load increased, the unconnected portion at the two
ends of the specimens from the end of specimens to the last line of bolt gradually
separated from the psse t plates. As a result, a gap was fonned between free ends and
the gusset plate due to the eccentncity about the centroid of the section, which is termed
as global bending. The width of the gap varied from one specimen to another, with the
maximum observed value of 10 mm. The width of this type of gap increased as the
connection Iength decreased, as the end distance increased, and as the size of the
specimen increased. In addition, as shown in Fig. 4.3, local bending of the angle about
the bolt was observed after the fracture occurred. The magnitude of in-plane detlection
due to the local bending varied from one angle to another, and the maximum value
observed was 15 mm. However, this type of bending was not found in channel sections
due to the symmetry of the cross-section. Generdly, the Iarger defleccions were observed
with those cases of shorter connection lengths.
There was no major slip of the connections observed, except specimen C3-1 (76
mm x 29 mm x 1.2 14 mm channel, one-bolt connection). Al1 the specimens failed at the
critical cross-section as the ultimate load was reached. For the specirnens that faiIed in
bearing, piling up of material and elongation of bolt hole were observed at the critical
section, as c m be seen in Fig. 4.4 and Fig. 4.5. This type of failure was observed for al1
the test specimens with one bolt and some with two bolts in the connections, depending
on the size of the specimens. The rest of the specimens with two or more transverse lines
of bolts failed by net section fracture. Necking at the critical section was observed for
this type of failure. At the failure load, the unconnected leg of the angle sections and the
Ranges of the channel sections at the connections had moved in considerably due to the
second order effects, as shown in Fig. 4.6 and Fig. 4.7. The magnitude of this
deformation (or second order buckling) effect became more severe as the size of
specimen increased. It was noted that al1 the bolts were still tight after completion of the
tests. This indicates that the bolts were not highly stressed during the tests.
4.2.3 Load-deformation relationship
In this section, the effects of the size of cross-section, the connection length and
the presence of washers on the load-deformation behavior, and the cornparison between
the repeated tests are discussed. The load-versus-deformation curves for al1 specimens
were attached in Appendix A for reference. The elongation of the specimen reported
herein was the stroke reported by the MTS machine.
The effect of different connection lengths can be illustrated in the load versus
elongation curves in Fig. 4.10 and Fig. 4.1 1. In Fig. 4.10, specimens A4-2, A4-3, and
A 4 4 were al1 102 mm x 102 mm x 1.214 mm angle specimens, which had two, three,
and four bolts, respectively, at the connection. Specimens C4-2, C4-3, and C4-4 shown
in Fig. 4.1 1 are al1 102 mm x 102 mm x 1.2 14 mm channel specirnens with two, three,
and four bolts, respectively, at the connection. As expected, the specimen A4-2 and C4-2
with the shortest connection had the lowest ultimate strength. The ultimate strengths for
the four-bolted connection and the three-bolted connection in both cases were very close
to each other, however the deformation of the specimens with long connection were Iess
than that of the specimens with short connection. This situation c m be due to the
distribution of shear forces among the bolts. Since the deformation of the specimen is
mainly contributed frorn the elonbation of the first bolt. If the number of bolt used
increases, each bolt would carry less amount of load; as a result, elongation of the bolt
hole would decrease.
The behavior of specimen with washer at the connection (A2-2) and without
washer (A2-2N) is shown in Fig. 4.12. Each of these specimens was identical in al1
respects except for the use of washer. With the use of washers at the connection, the
maximum load was increased by 16 percent. In both cases, the elongations are relatively
the same. This phenomenon can be attributed to the better clarnping force provided by
the washers. The better clamping force would reduce the stress concentration at the
connection. Therefore, the stress distribution at the critical section would become more
uniform; consequently, the capacity of the section would increase.
The load-deformation relations for the repeated channel section tests, C3-1 and
*C3-1 (76 mm x 76 mm x 1.214 mm, one-bolt connection) are showed in Fig. 4.13. As
can be seen, the maximum load obtained in *C3-1 was about 50 percent higher than C3-
1. The large discrepancy was most Iikely due to the inconsistent clamping force applied
dunng when tightening the bolts. Since tension control was not applied in the test, the
clamping force may Vary from test to test and causing such a variation. A slip was
observed for specimen C3-1. For specimen *C3-1, the increase indicated that the high
clamping force produced by the bolt introduced a frictional resistance between the plates
and the specimen and causing the connection to become a frictional type of connection.
More discussion about this postulation will be covered in Chapter 5.
4.2.4 Strain distribution
The typical strain distribution for angle and channel sections is discussed in this
section. The load versus strain curves at the critical section for specimen A 4 4 (102 mm
x 102 mm x 1.214 mm angle, four-bolt connection) are shown in Fig 4.14. A s shown in
the figure, the strain was largest at edge of the connected leg and srnaIlest at the edge of
the outstanding leg. The edge of the outstanding leg was in compression throughout the
whole Ioading process and the strain reached a value close to the compressive yield strain
after the ultimate Ioad was reached. The strain at the middle of the unconnected Ieg was
in compression under Ioads up to about 95 percent of the ultimate Ioad; after that it
shifted to tension. The same behavior was observed for angles with short connections.
As shown in Fig. 4.15, the edge of the outstanding leg of A3-2 (76 mm x 76 mm x 1.2 14
mm angle, two-bolt connection) was in compression throughout and the strain measured
at the edge of the outstanding Ieg reached a value close to the compressive yield strain.
The load versus strain curves for the mid-length section of A3-2 (76 mm x 76 mm x
1.214 mm angle, two-bolt connection) are shown in Fig 4.16. Similar to the strain at the
critical section, the strain close to the edge of the outstanding leg was in compression
throughout the whole loading process.
Due to the stress concentration around the bolt hoIes, the strains measured on the
critical section of the connected leg usually had wide variations for the angles. However,
Iimited number of strain gauges were used at the connected leg, therefore, the strain
distribution at the connected leg could not be obtained. On the other hand, the strain
distribution of the outstanding leg at the cntical section showed some regular patterns.
These can be seen in Fig. 4.17, where the strain distributions A3-2 are shown for different
Ievels of load. The strain distribution of A3-2 was linear on the unconnected leg during
the entire loading history. This type of linear strain distribution pattern described was
typical for al1 angle members. This linear strain distribution throughout the loading
process reflected the bending deformation perpendicular to the gusset plate, as descnbed
in Section 4.2.2 in terms of global bending and local bending.
Among the channel specimens, there were two different strain distributions found:
one for specimens with short connection length, and one for specimens with long
connection length. For channels with short connection length, the flanges were in
compression throughout the Ioading process. As shown in Fig. 4.18, the strain at the
edge of the flanges of specimen C4-2 (102 mm x 29 mm x 1.214 mm, two-bolt
connection) reached a value close to the compressive yield strain after the ultimate load
was reached. Figure 4.19 shows the strain distribution at the critical section of C4-2. At
low load level, the strain distribution was relatively uniforrn; however, after the yield
strength was reached, the distribution became highly non-uniform, especially for the
strain around the bolt hole due to the stress concentration.
For specimen having long connection length, as illustrated in Figs. 4.20 and 4.21
for specimen C4-4, the strains in the flanges and web were in tension throughout. Similar
to specimens with short connection length, the strain distribution was uniform at the
beginning of the loading stage (Fig. 4.22); however, as the Ioad increased, the strain
distribution at the web became non-uniform due to the stress concentration around the
bolt hole.
Figure 4.23 shows the load versus strain curves for the mid-section of specirnen
C3-2 (76 mm x 29 mm x 1.214 mm angle, two-bolt connection). It showed that the
strains at two flanges were very close to each other and the strain at the web was about
twice as much as that at the flanges. As seen in Fig. 4.24, the shapes of the strain
distribution at the mid-section of specimen of C3-2 remained relativeiy the sarne at
different load levels.
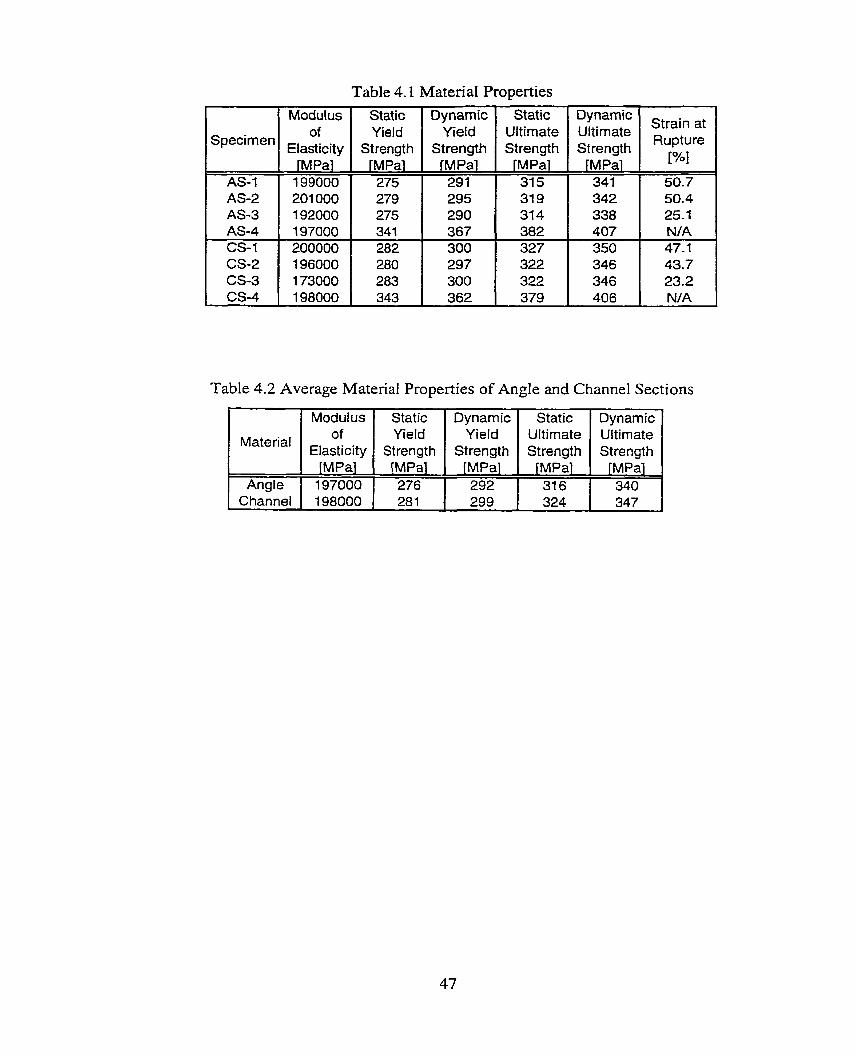
Table 4.1 Material Properties
Table 4.2 Average Material Properties of Angle and ChanneI Sections
Specimen
AS- 1 AS-2 AS-3 AS-4 CS-1 CS-2 CS-3 CS-4
ModuIus of
Elasticity IMPal 199000 201000 192000 197000 200000 196000 173000 198000
Material
Angle Channel
Static Yield
Strength IMPal 275 279 275 341 282 280 283 343
Modulus of
Elasticity [MPa]
197000 198000
Dynamic Yield
Strength IMPal 291 295 290 367 300 297 300 362
Static Yield
Strength [MPa] 276 28 1
Static Ultimate Strength TMPal 315 31 9 31 4 382 327 322 322 379
Dynamic Yield
Strength [MPa] 292 299
Dynamic Ultimate Strength
TMPal 341 342 338 407 350 346 346 406
Static Ultirnate Strength [MPa] 31 6 324
Strain at Rupture
1x1 50.7 50.4 25.1 N/ A 47.1 43.7 23.2 N/A
Dynamic Ultimate Strength
[MPa] 340 347
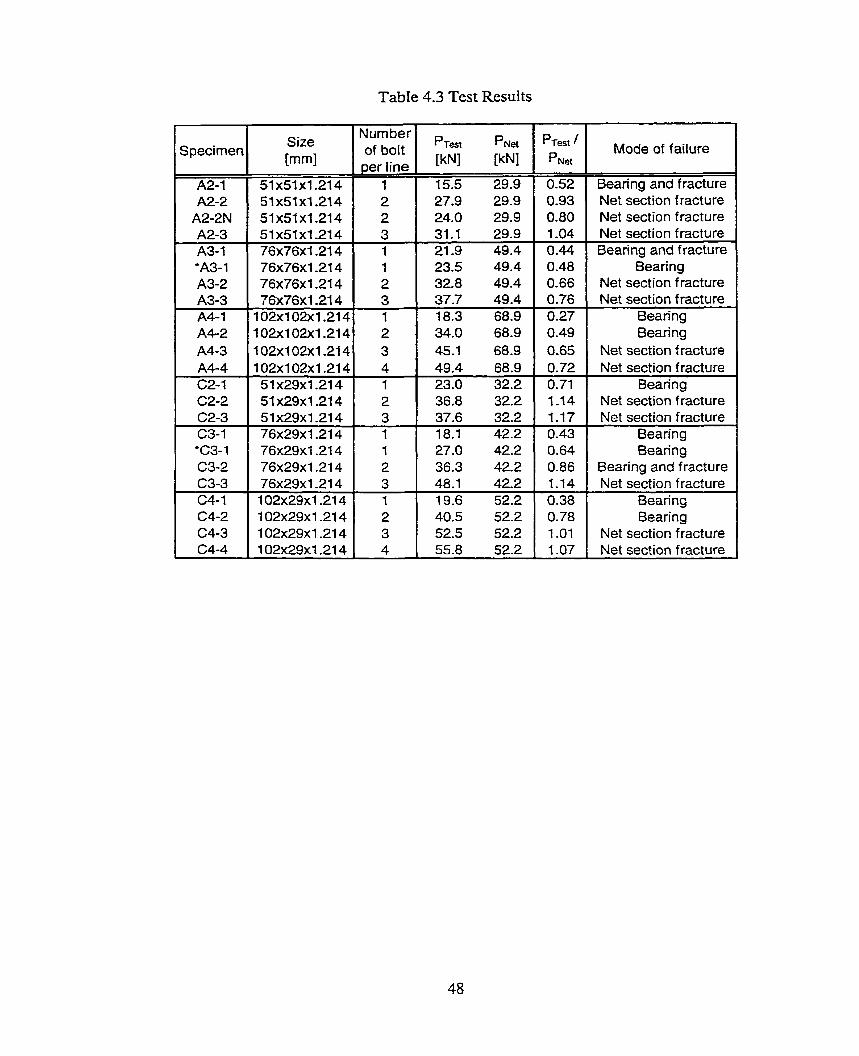
Table 4.3 Test Results
Specimen
A2- 1 A2-2
A2-2N A2-3 A3- I *A3- 1 A3-2 A3-3
S ize Number of bolt P ~ e s t PNet
[mm1 per line [kNl [kN1
51 x51 x1.214 1 1 15.5 29.9
Mode of failure 1
Net section fracture Net section fracture
I Bearing Net section fracture i Net section frscture
Bearing Bearing Clil; Net section fracture
Net section fracture Bearing
1 -1 4 Net section fracture 1.1 7 Net section fracture 0.43 Bearing 0.64 Bearing 0.86 Bearing and fracture ; , t section fracture
Bearing Bearing
Net section fracture 1 .O7 Net section fracture
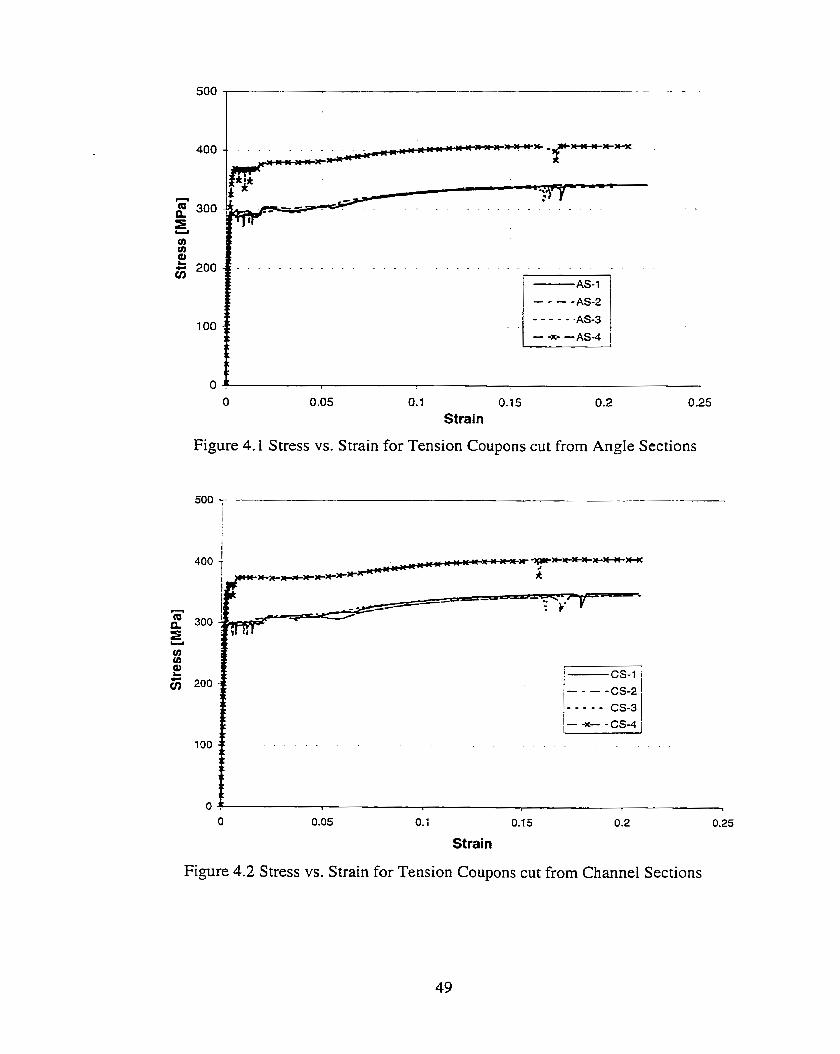
O O .O5 0.1 0.15 0.2 O .25
Strain
Figure 4.1 Stress vs. Strain for Tension Coupons cut from Angle Sections
Strain
Figure 4.2 Stress vs. Strain for Tension Coupons cut from Channel Sections
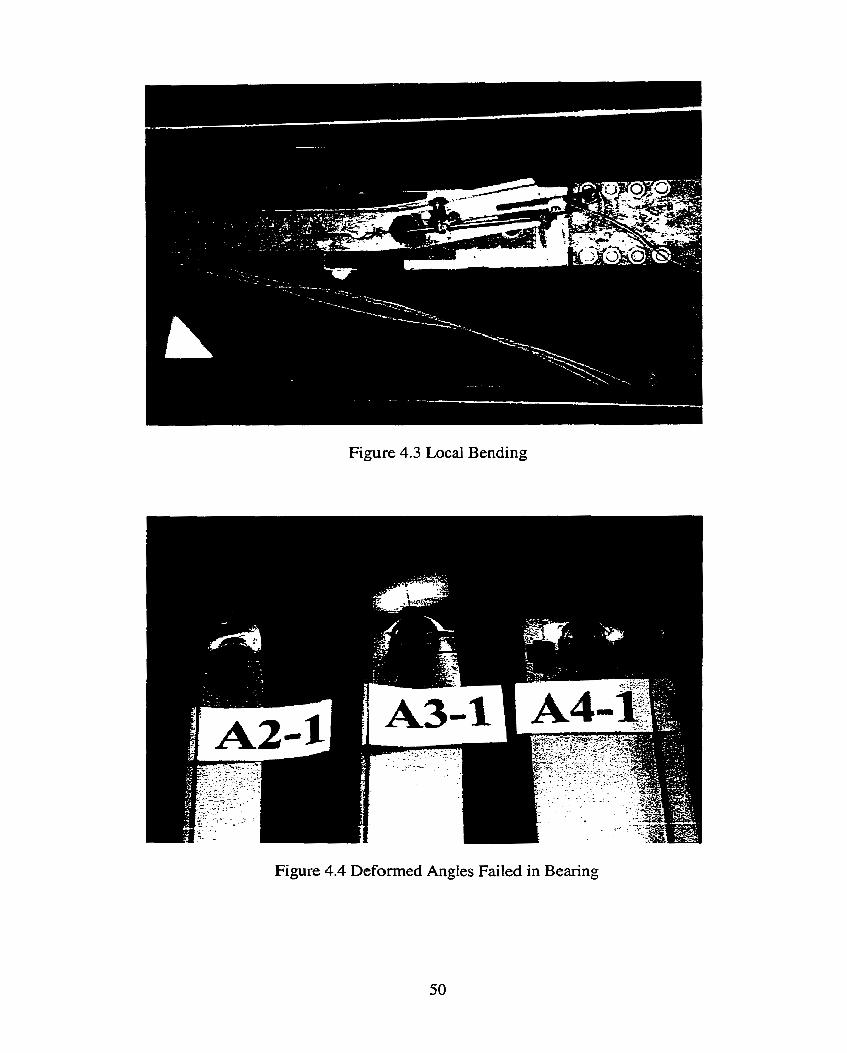
Figure 4.3 Local Bending
Figure 4.4 Deformed Angles Failed in Bearing
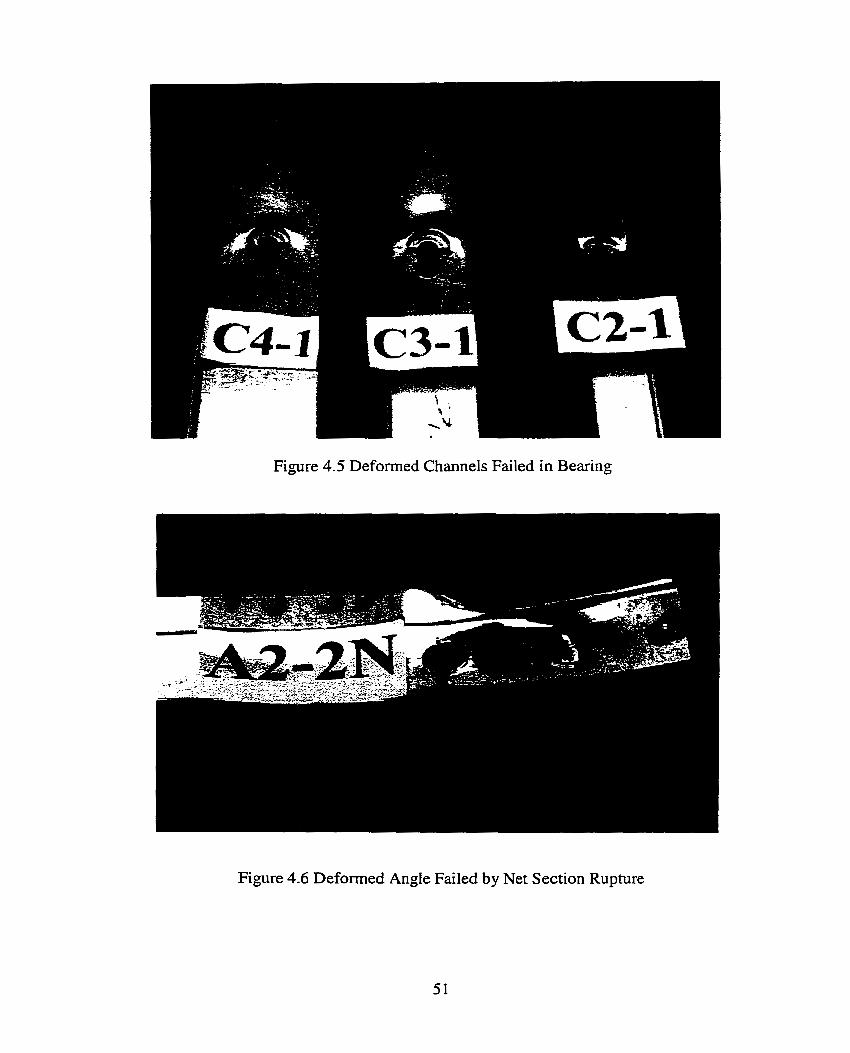
- - - - - - -
Figure 4.5 Deformed Channels Failed in Bearing
Figure 4.6 Deformed Angle Failed by Net Section Rupture
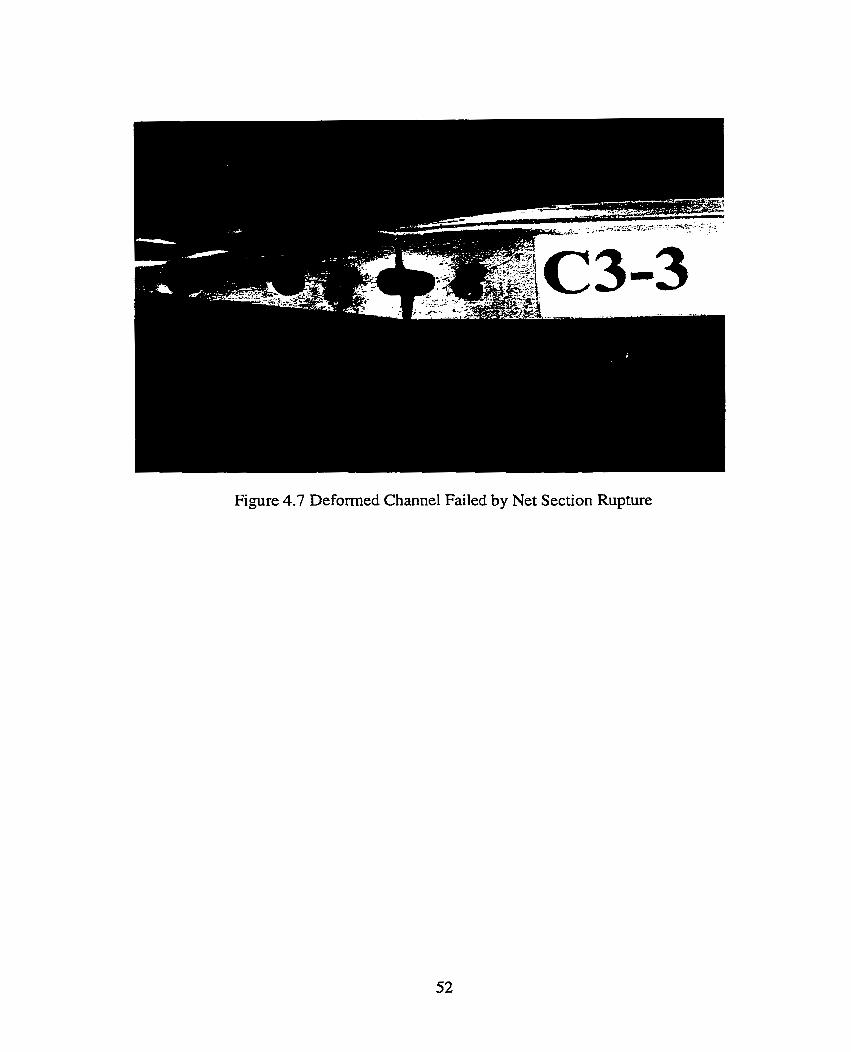
Figure 4.7 Deformed Channel Failed by Net Section Rupture
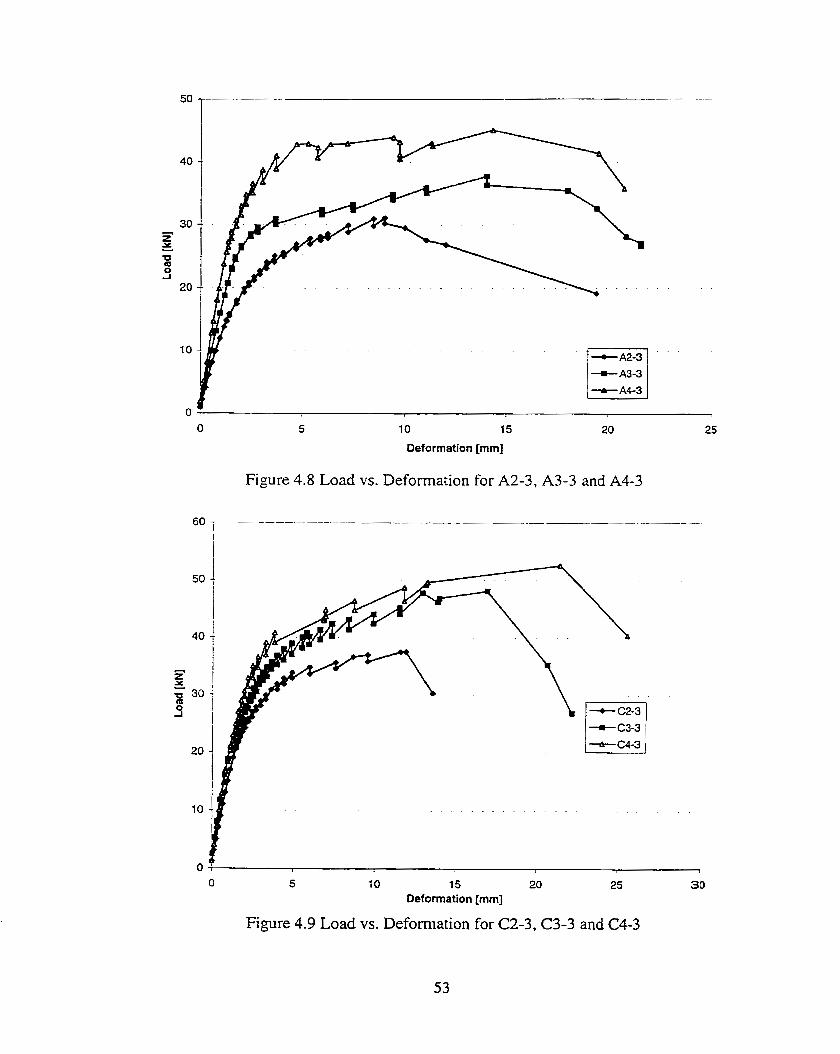
10 15
Deformation [mm]
Figure 4.8 Load vs. Deformation for A2-3, A3-3 and A4-3
1 0 15 20 Deformation [mm]
Figure 4.9 Load vs. Deformation for C2-3. C3-3 and C4-3
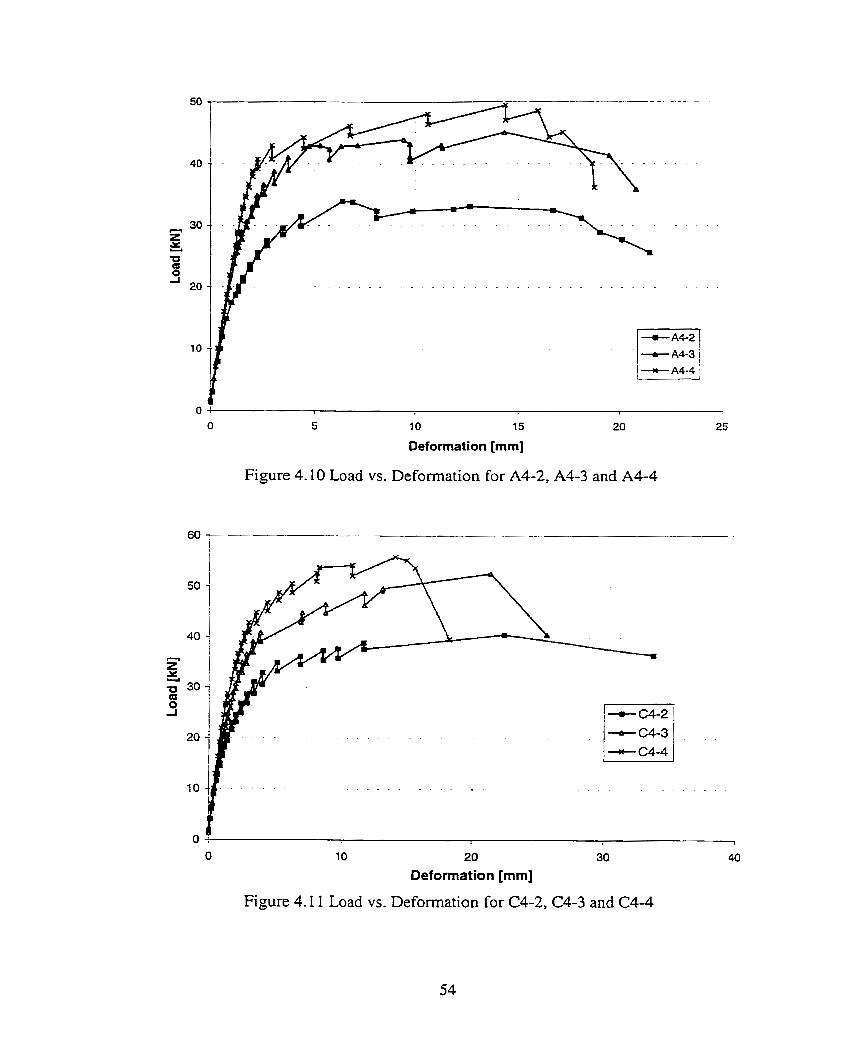
10 15
Deformation [mm]
Figure 4.10 Load vs. Deformation for A4-2, A4-3 and A44
- c4-3 . . . . - . - - - . - . . . - - . . - - -
3
O 1
1 O 20 30 40
Deformation [mm]
Figure 4.1 1 Load vs. Deformation for C4-2, C4-3 and C4-4
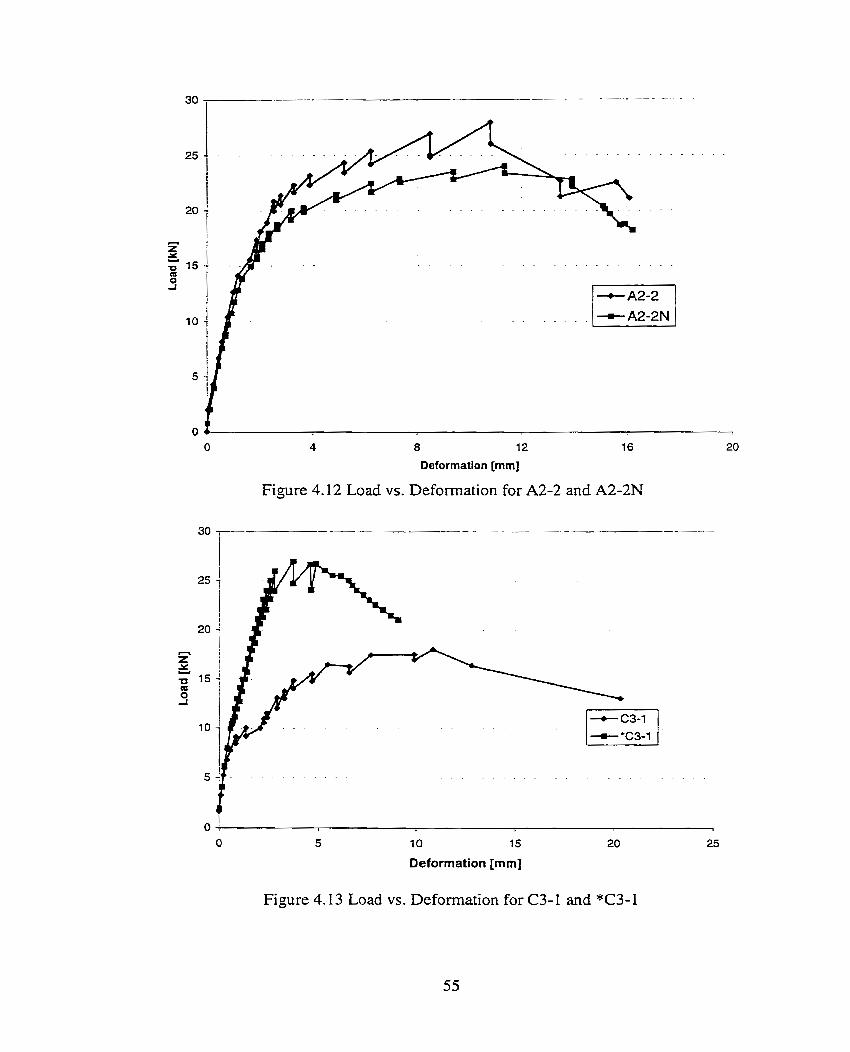
O 4 8 12 16 20
Deformation [mm]
Figure 4.12 Load vs. Deformation for A2-2 and A2-2N
O 1
5 10 15 20 25
Deformation [mm]
Figure 4.13 Load vs. Deformation for C3-1 and *C3-1
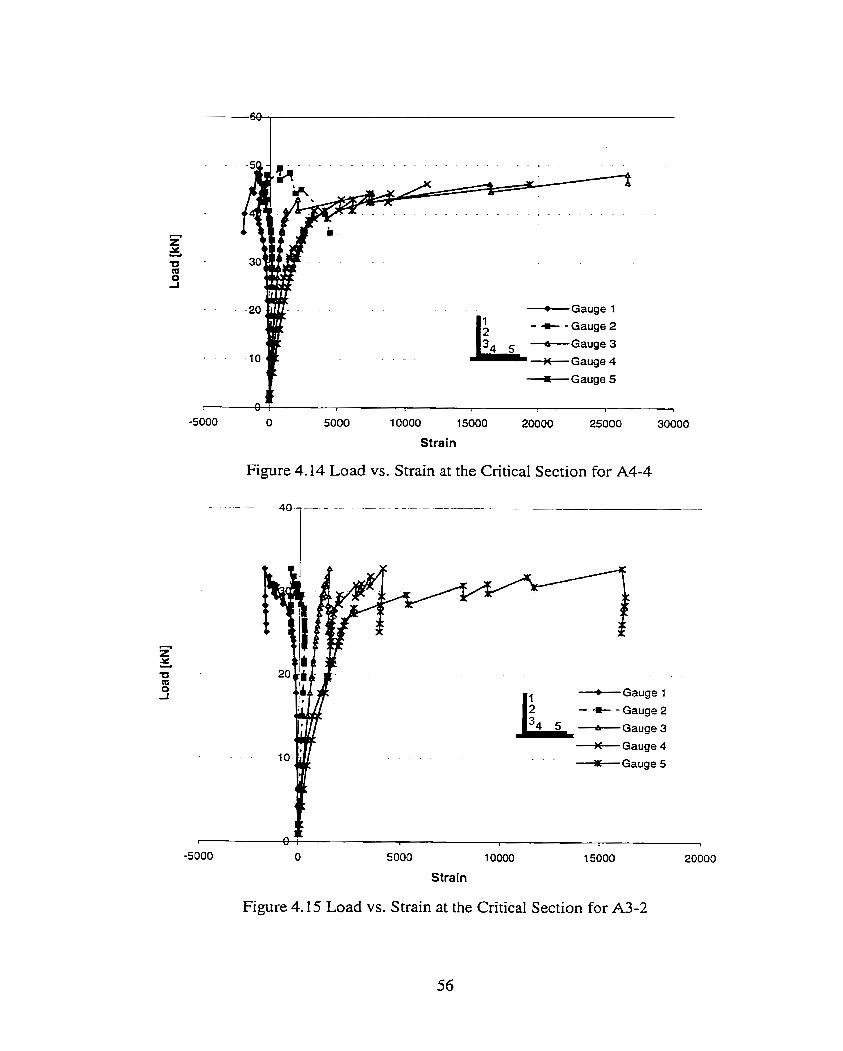
- - - . . . - . .
. .
- H u - Q O 4
. . . . . -Gauge 1
- t - Gauge 2
+ Gauge 4
I. Gauge 5
-5000 O 5000 1 O000 15000 20000 25000 30000
Strain
Figure 4.14 Load vs. Strain at the Critical Section for A4-4
-5000 . Y O 5000 , 1 O000 , 15000 , 20000 ,
Strain
Figure 4.15 Load vs. Strain at the Critical Section for A3-2
G a u g e 1
- -m- - Gauge 2
r\ Gauge 4
rn Gauge 5
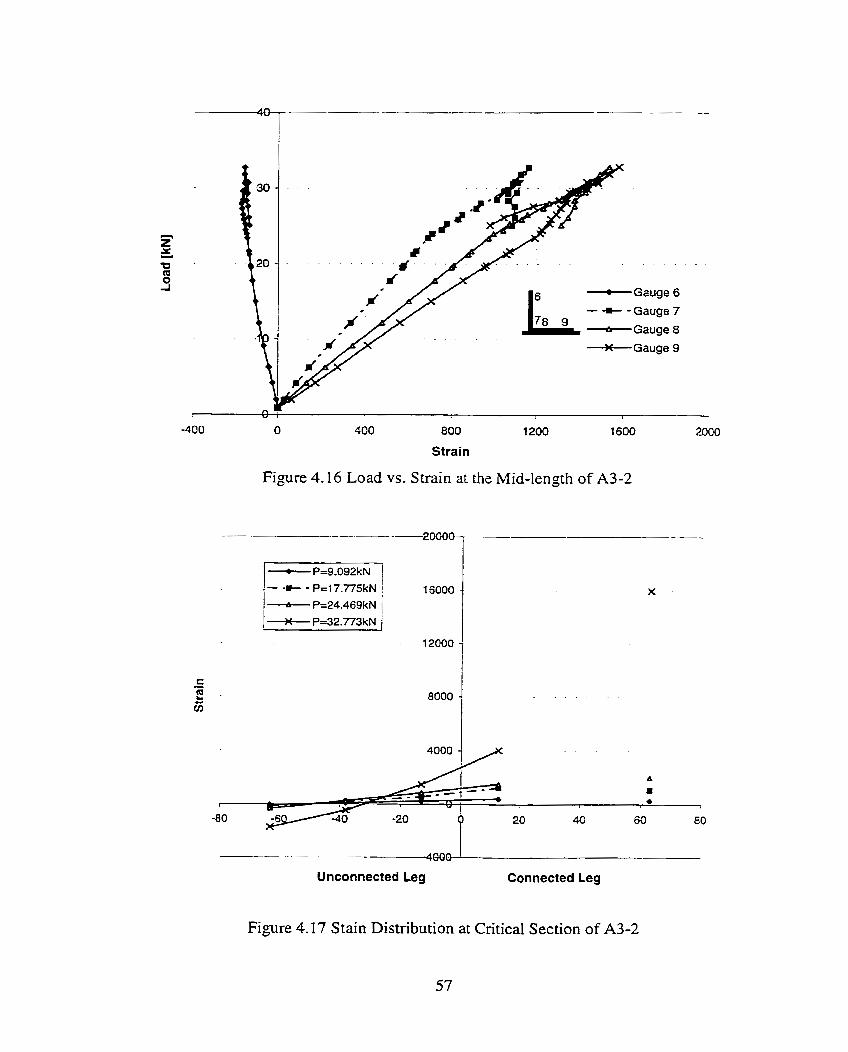
I I G a u g e 6
- / 15 0 - + - Gauge 7
-400 O 400 800 1 200 1600 2000
Strain
Figure 4.16 Load vs. Strain at the Mid-length of A3-2
--- -----4800 ' Unconnected Leg Connected Leg
Figure 4.17 Stain Distribution at Critical Section of A3-2
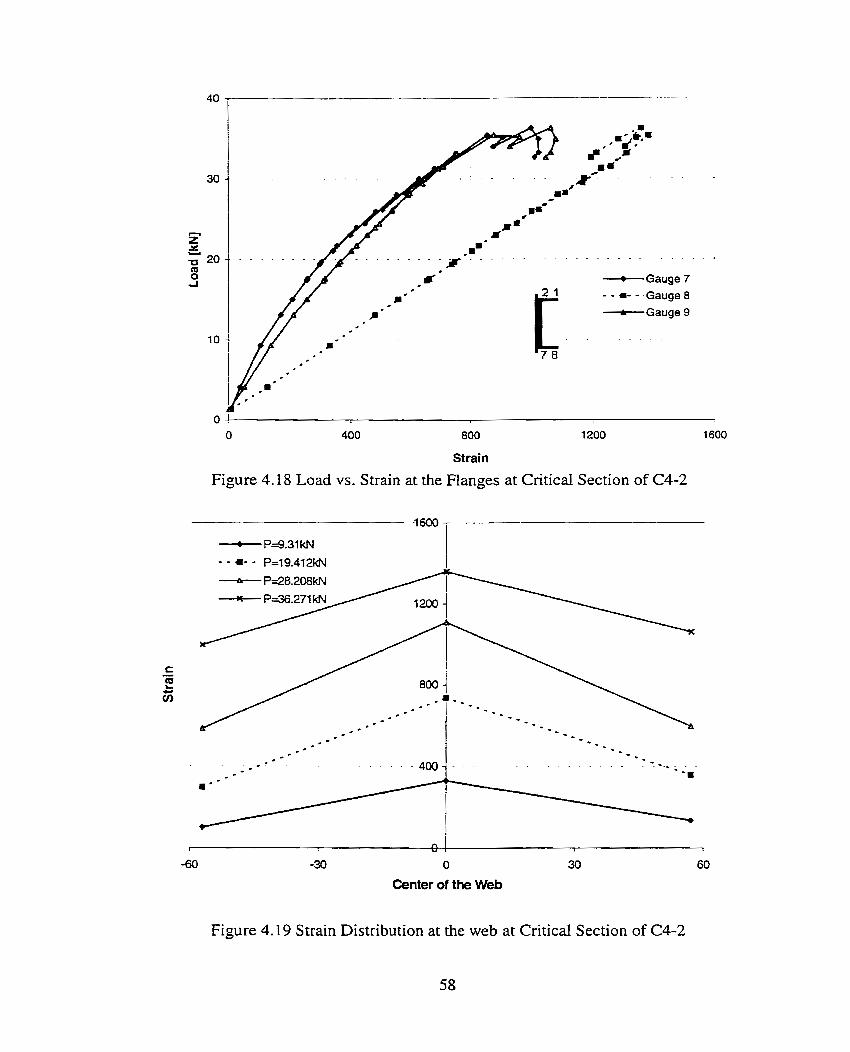
O 400 800 1200 1600
Strain
Figure 4.18 Load vs. Strain at the Flanges at Critical Section of C4-2
I n l 1
-60 -30 O 30 60
Center of the Web
Figure 4.19 Strain Distribution at the web at Critical Section of C4-2
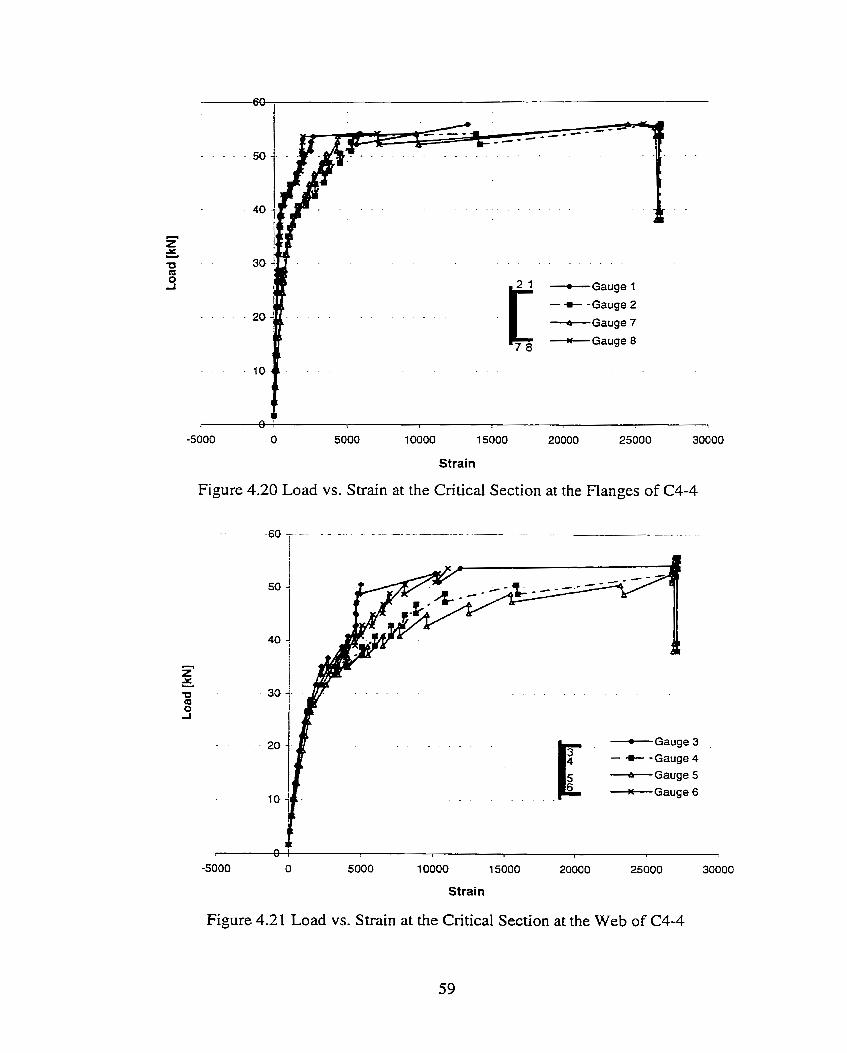
G a u g e 1
- +- -Gauge 2
-Gauge 7
V G a u g e 8
-5000 O 5000 1 O000 15000 20000 25000 30000
Strain
Figure 4.20 Load vs. Strain at the Critical Section at the Flanges of C4-4
G a u g e 3
- +- - Gauge 4
-Gauge 5
G a u g e 6
Strain
Figure 4.21 Load vs. Strain at the Critical Section at the Web of C4-4
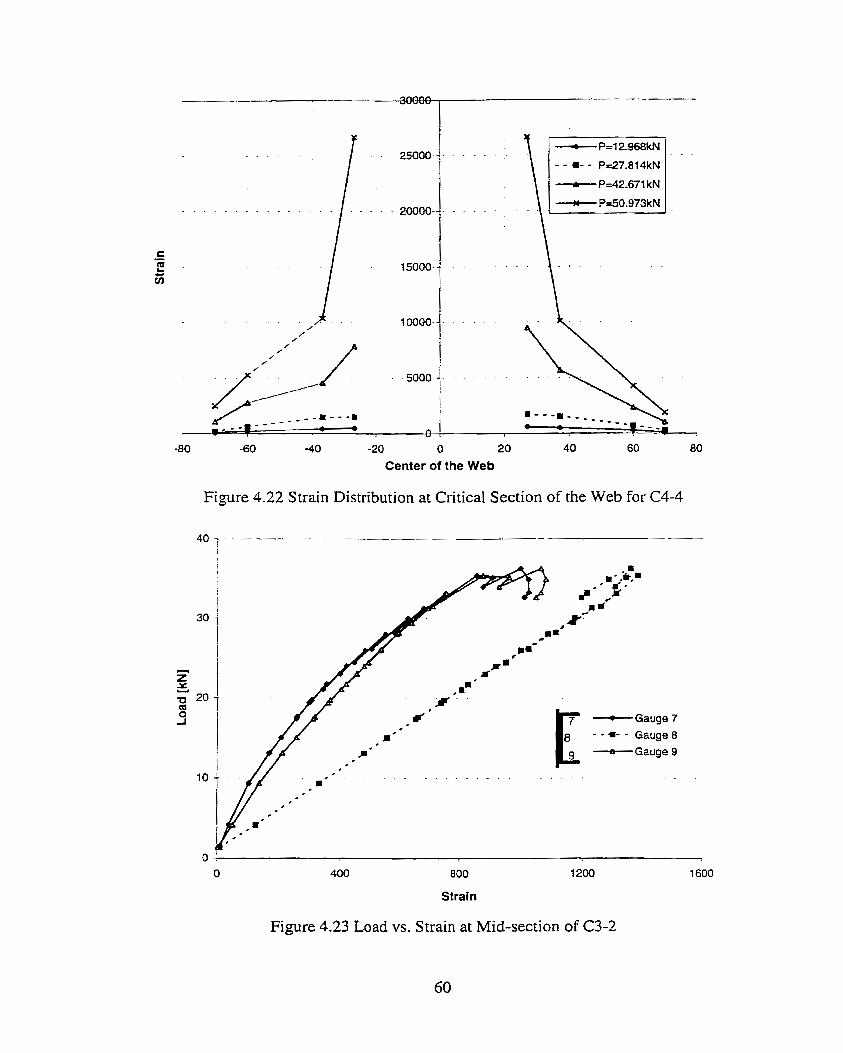
-80 -60 4 0 -20 O 20 40 60 80
Center of the Web
Figure 4.22 Strain Distribution at Critical Section of the Web for C4-4
Strain
Figure 4.23 Load vs. Strain at Mid-section of C3-2
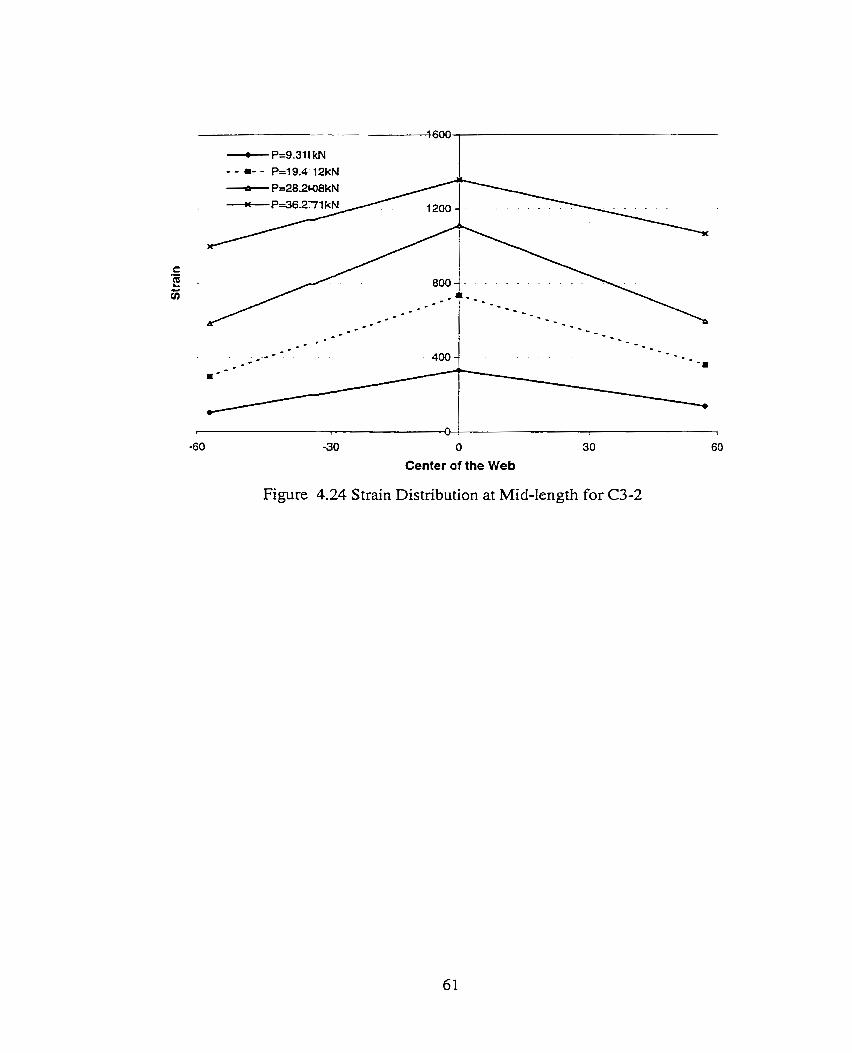
t n r
-60 -30 O 30 60
Center of the Web
Figure 4.24 Strain Distribution at Mid-length for C3-2
5. FLNITE ELEMENT ANALYSIS
5.1 General
The goal of the finite element analysis was to develop a model that could study
the shear lag behavior of cold-formed steel tension member. In order to test the validity
of the model, the results obtained from the analysis were used to compare with the test
results from the experiments. The validated mode1 was then used to conduct a pararnetric
study, which can determine the effect of pararneters that were not investigated
specifically in the test progarn.
The finite element analysis was performed using the commercial finite elernent
program ABAQUS, version 5.7 (Hibbitt et al., 1997). The analysis was conducted on a
SUN SPARC workstation.
5.2 Numerical Mode1
The ABAQUS S4R element was used to model the tension member. It is a four-
node, doubly curved quadratic shell element. This element has six degrees of freedom at
each of the four nodes: three translational components and three rotational components.
The S4R e1ement allows for changes in element thickness and accounts for finite
membrane strains. It has one integration point at the centroid of the element. The cross-
sectional behavior of this element is integrated at five points across the thickness of the
elernent (Hibbitt et al., 1997). Finite elernents were not used to model the gusset plate
because of the relatively large stiffness of these elements comparing to the test specimen.
Instead, appropriate boundary conditions were placed in the mode1 to simulate the effects
of the gusset plate on the specimens.
In order to find the optimal mesh configuration, a mesh study was performed.
Optimal mesh is the coarsest mesh that would lead to an accurate result. Three different
meshes were used: coarse mesh, intemediate mesh, and fine mesh. The number of
elements and eIement size for coarse mesh was 551 and 12.7 mm by 16 mm, for
interrnediate mesh was 1334 and 6.35 mm by 5 mm, and for fine mesh was 3271 and
3.18 mm by 5 mm. The meshes are shown in Fig. 5.1. The maximum load obtained
from the analysis was 21.8 kN for coarse mesh, 15.6 kN for the intermediate mesh, and
15.2 kN for the fine mesh. The relative difference in maximum load, RD, was calculated
using the folIowing formula:
where P = maximum load obtained from the coarse or intemediate mesh mode1
Pr = maximum load obtained from the fine mesh mode1
The difference between the load predicted using the coarse mesh and the fine mesh was
43.4 percent, while the difference between the loads predicted using the interrnediate
mesh and the fine mesh was 2.63 percent. It showed that the intermediate mesh has
converged to the exact solution and it was chosen as the mesh used in this study.
Using the mesh chosen above, a typical undeforrned finite element mesh of the
modeled angles and channels were developed, as shown in Fig. 5.2 and Fig. 5.3
respectively. As c m be seen in these figures, only half of the length of the member was
modeled in the finite elernent andysis due to symmetry of the test specimens. At the
mid-length cross-section of the member, the 2 and 3-direction rotational degrees of
freedom were fixed. In the analysis, the axes 1, 2, and 3 were equivalent to axes x, y and
z, respectively.
In the finite element models, the shear deformation of the bolts was ignored. The
Ioad was assumed to transfer from the gusset plate to the zngle hl ly by the bearing of the
bolts. Therefore, one-half of the circumference of each bolt hole in the model, which was
supposed to bear against the bolt in the tests, was fixed in the 1 and 2 translational
degrees of freedom. Since the bolts had been tightened before loading and the bolts were
still tight after tests. al1 nodes in the first two circumferences around the bolt holes of the
specimen were fixed in the 3 translational degree of freedom.
5.3 Material Mode1
In the analysis, the materials were assumed to behave according to the
incremental isotropie hardening material. The material propenies used at corner area of
the specimen were different from that at the flat area. This is to account for the influence
of cold working. The rnaterial properties used in the analysis were true stress and strain
converted from the average stress-strain data obtained from the coupon tests. Figures 5.4
and 5.5 show the material model used to model the angle sections and channel sections,
respectively. Failure was assumed to occur when the most highly strained elements in
the specimen around the first bolt reached the rupture strain. The rupture strains used for
angle and channel sections are 0.5 and 0.45, respectively. These two values were
obtained from the tension coupon tests based on the following equation:
A0 Rupture Strain = Ln(-) A
where A = cross sectiond area of the tension coupon at rupture
A. = initial cross sectional area of the tension coupon
5.4 Numerical Results
5.4.1 Experirnental-to-analytical ratio
Table 5.1 presents the summary of the results obtained from the finite element
analysis. It also shows the cornparison of the experirnentd results with the analytical
results. The ratio of ultimate load from the experiments to that from the analysis ranges
from 0.97 to f -3 1 with mean value of 1.1 1 and coefficient of variation of 0.093 for the
angle sections, and from 0.95 to 1.3 1 with mean value of 1 .O9 and coefficient of variation
of 0.096 for the channe1 sections. Good agreement was obtained, except for couple of
specimens, between the numerical predictions and test results. The reason of discrepancy
can be attributed to the conservative assumptions, such as neglecting the frictional forces
between the gusset plates and the specimen, used in the finite element model.
5.4.2 Mode of failure
The typical deformed shape obtained from the analysis for the angle and channel
sections, which failed in net section fracture, dong with that obtained frorn the
experirnent are shown in Fig. 5.6 and Fig. 5.7, respectively. Sirnilar to the experimental
results, the unconnected leg of the angle and the flanges of the channel moved in towards
the bolt line. The in-plane bending at the connecting length of the angle specimens
observed in the test (as shown in Fig. 5.6) is due to the eccentric force generated after the
fracture of the section at the first line of bolts. Fig. 5.8 and Fig. 5-9 show the deforrned
shape obtained from the test and the analysis for the angle and channel sections that
failed in bearing. SimiIar to the test specimens, piling of material at the bolt hole was
observed in the analysis. In addition, Fig. 5.10 shows the side view of the typical
defomed shape of specimen, the bending of the free end agreed with what has been
observed in the experimental program. As illustrated in those figures above-mentioned,
the numerical analysis gave a good prediction in the failure mode and deformed shape.
5.4.3 Load-deformation retationship
The load versus elongation behavior obtained from the finite elemerit analysis can
be compared with that observed in the experiment. The comparison for specimen A 2 4
(51 mm x 51 mm x 1.214 mm angle, one-bolt connection) for the angle section and
specirnen C3-3 (51 mm x 29 mm x 1.214 mm channel, three-bolt connection) for the
channe1 section are plotted in Fig. 5.11 and Fig. 5.12, respectively, where it can be seen
that the curves from analysis were very similar to the test results. For the other
specimens, the analytical behavior aiso agreed with the test results in the general sense.
except that the limit elongation reached at the limit point of the anaiytical curves were
different from that of the test results. This is due to the simplified assumption of the
rupture strains used in the analyses. Other load-versus-elongation curves are included in
Appendix B.
Although the maximum load was similar, discrepancy between the analyticai and
test results for specimen C3-1 was observed in terms of the deformation due to the slip,
therefore, a repeated test, designated as *C3-1, was done. However, the tested load for
the *C3-1 was 50 percent higher than that of C3-1. As discussed in Section 4.2.3, the
increase was possibly due to the high clamping force produced when tightening the bolts,
in order to verify this, a slightly different finite element mode1 was used for *C3-1. At
the connection, the bolt hole of *C3-1 was filled in order to eliminate the stress
concentration at the edge during the loading process. So that, instead of having bearing
type of connection, the frictional type of connection would be obtained. Figure 5.13
shows the analytical and experimental results for both specimen C3-1 and T3-1 . Tt
shows that the analytical results correlate with the experimental results in terms of
ultimate load for both cases. In addition, frorn the comparison of the analytical result
with the experimental result for *C3-1, it confirmed that the 50 percent increase of load
in the test was due to the change in connection type from bearing to frictional. Therefore,
it proved that the amount of bolt tension applied does affect the ultimate load capacity of
the connection.
5.4.4 Strain and stress distributions
The typical strain distributions at the critical section obtained from the analysis
for the angle and channel section are shown in Figs. 5.14 and 5.15, respectively. Similar
to the test results, the strain around the bolt hole was highest in both the angle and
channel section. At the unconnected leg of the angle section and the Ranges of the
channel section, the strains were in compression, which correlated with the test results.
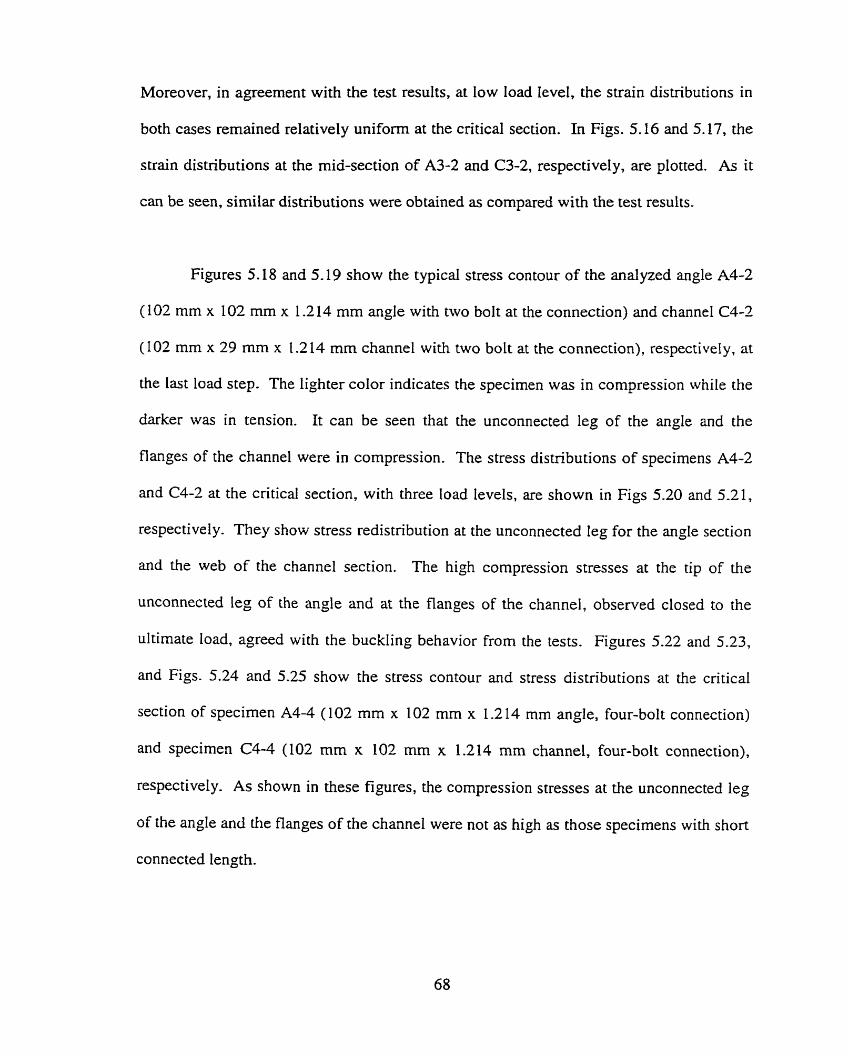
Moreover, in agreement with the test results, at low load level, the strain distributions in
both cases remained refatively uniform at the critical section. In Figs. 5.16 and 5.17, the
strain distributions at the mid-section of A3-2 and C3-2, respectively, are plotted. As it
can be seen, similar distributions were obtained as compared with the test results.
Figures 5.18 and 5.19 show the typical stress contour of the analyzed angle A4-2
(102 mm x 102 mm x 1.2 14 mm angle with two bolt at the connection) and channel C4-2
(102 mm x 29 mm x 1.214 mm channel with two bolt at the connection), respectively, at
the last load step. The lighter color indicates the specimen was in compression while the
darker was in tension. It can be seen that the unconnected leg of the angle and the
flanges of the channel were in compression. The stress distributions of specimens A4-2
and C4-2 at the critical section, with three load levels, are shown in Figs 5.20 and 5.21,
respectively. They show stress redistribution at the unconnected leg for the angle section
and the web of the channel section. The high compression stresses at the tip of the
unconnected leg of the angle and at the flanges of the channel, observed closed to the
ultimate load, agreed with the buckling behavior from the tests. Figures 5.22 and 5.23,
and Figs. 5.24 and 5.25 show the stress contour and stress distributions at the critical
section of specimen A 4 4 ( 102 mm x 102 mm x 1 -2 14 mm angle, four-bolt connection)
and specimen C4-4 (102 mm x 102 mm x 1.214 mm channel, four-bolt connection),
respectively. As shown in these figures, the compression stresses at the unconnected leg
of the angle and the flanges of the channel were not as high as those specimens with short
connected length.
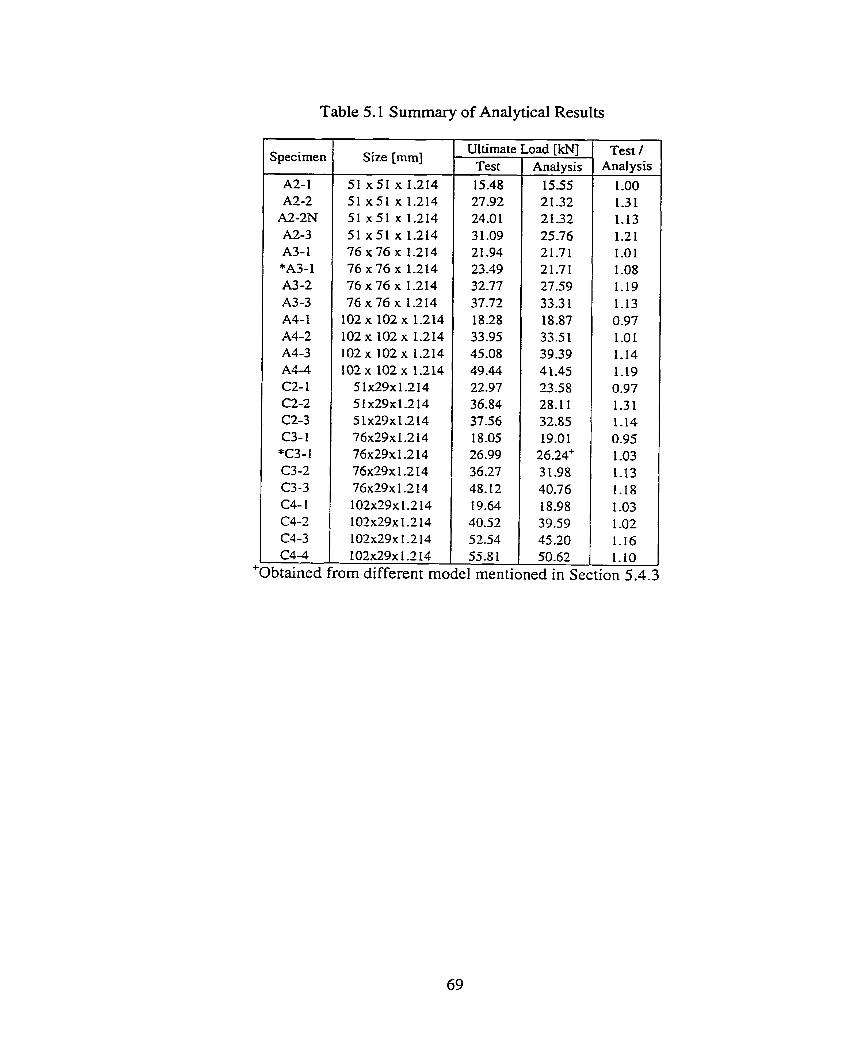
Table 5- 1 Summary of Analytical Results
Specimen
-
Size [mm] Ultimate
Test
15.48 27.92 24.0 1 3 1-09 2 1 -94 23 -49 32.77 37.72 18-28 33.95 45.08 49.44 22.97 36.84 37.56 18.05 26.99 36.27 48.12 19.64 40.52 52.54 55.8 1
.oad [icNl Anaiysis
15.55 21.32 2 1-32 25.76 21.71 21.71 27.59 33.3 1 18.87 33-5 1 39.39 4 1 -45 23.58 28.1 1 32.85 19-01
26.24" 31.98 40.76 L 8.98 39.59 45.20 50.62
Test / Anaiysis
el mentioned in Section 5.4.3
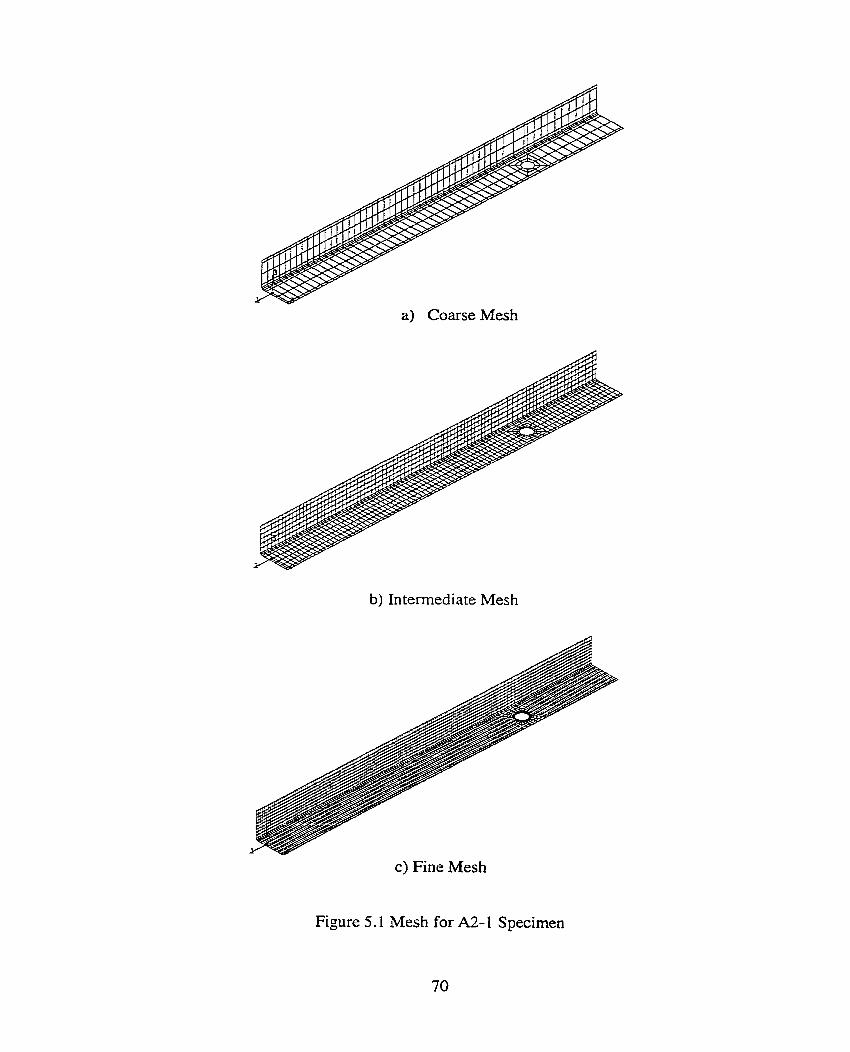
a) Coarse Mesh
b) Intermediate Mesh
c) Fine Mesh
Figure 5.1 Mesh for A2- 1 Specimen
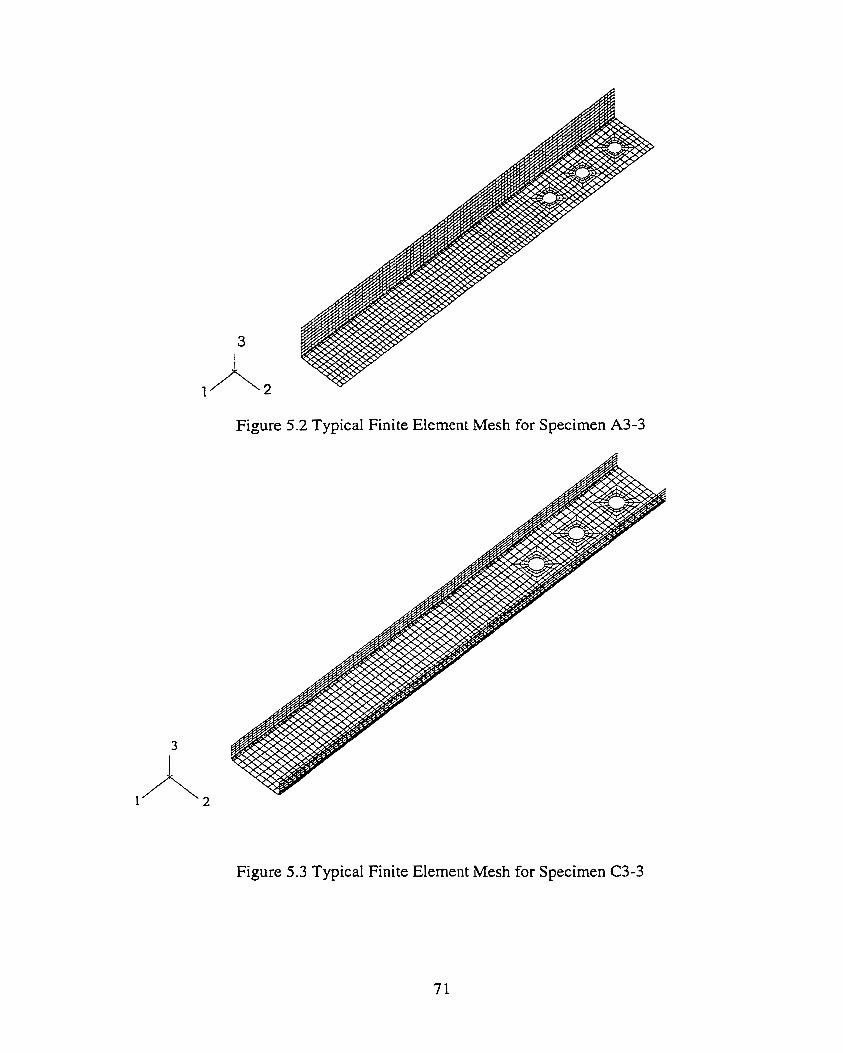
Figure 5.2 Typical Finite Element Mesh for Specimen A3-3
Figure 5.3 Typical Finite Element Mesh for Specimen C3-3
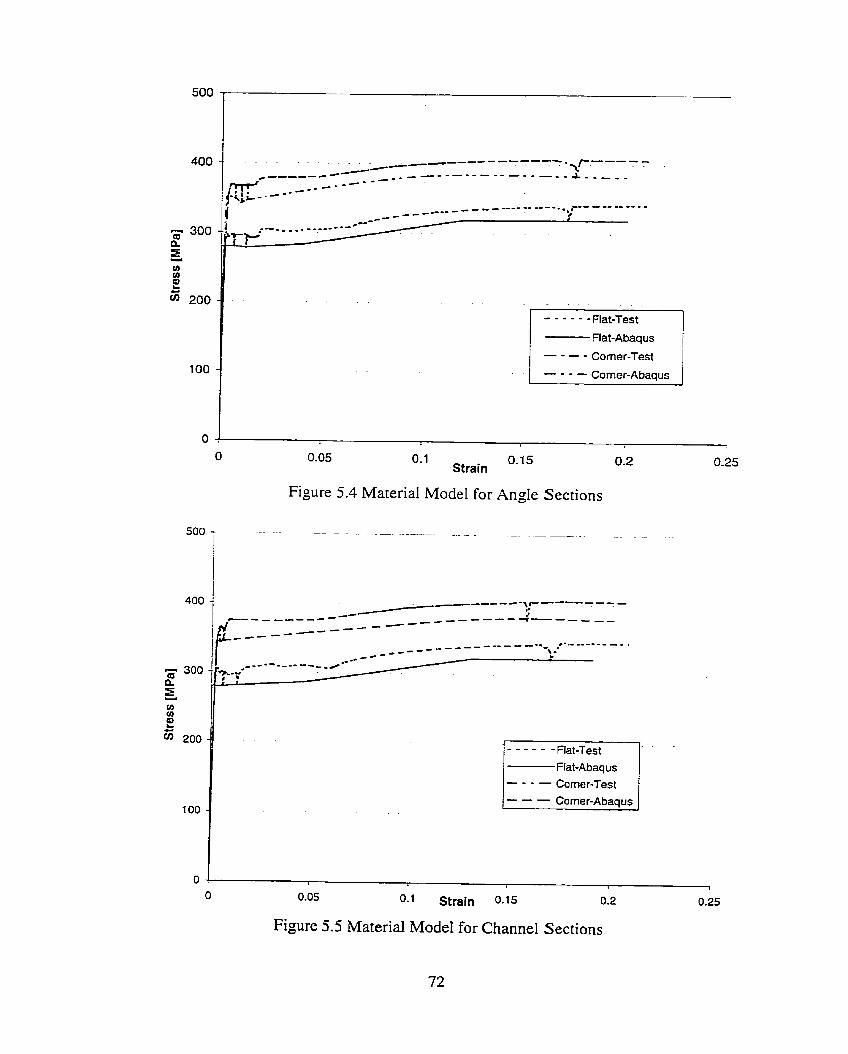
0.1 0.1 5 Strain
Flat-Abaqus / - - - - Corner-Test - - - - Corner-Abaqus
Figure 5.4 Material Model for Angle Sections
- - - - - - Rat-Test 1. 1 - _ - _ Corner-Test 1 --- Corner-Abaqus
0.05 0.1 Strain 0.15 0.2
Figure 5.5 Material Model for Channel Sections
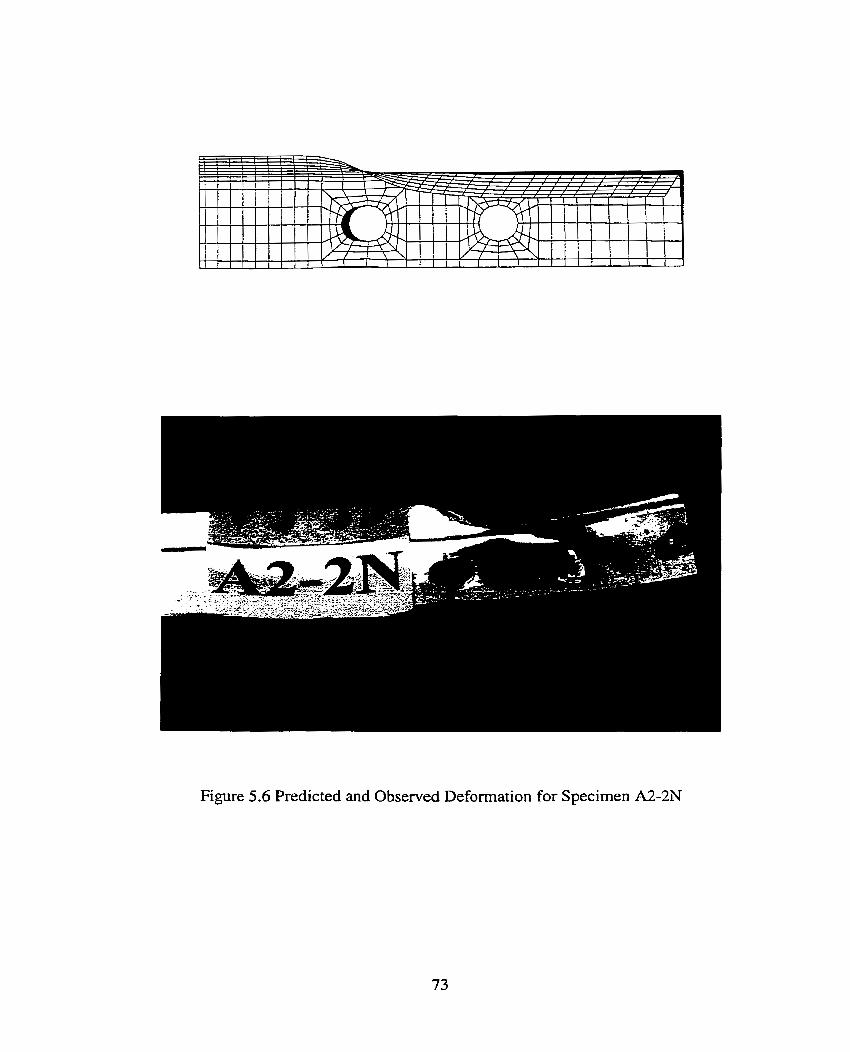
Figure 5.6 Predicted and Observed Deformation for Specimen A2-2N
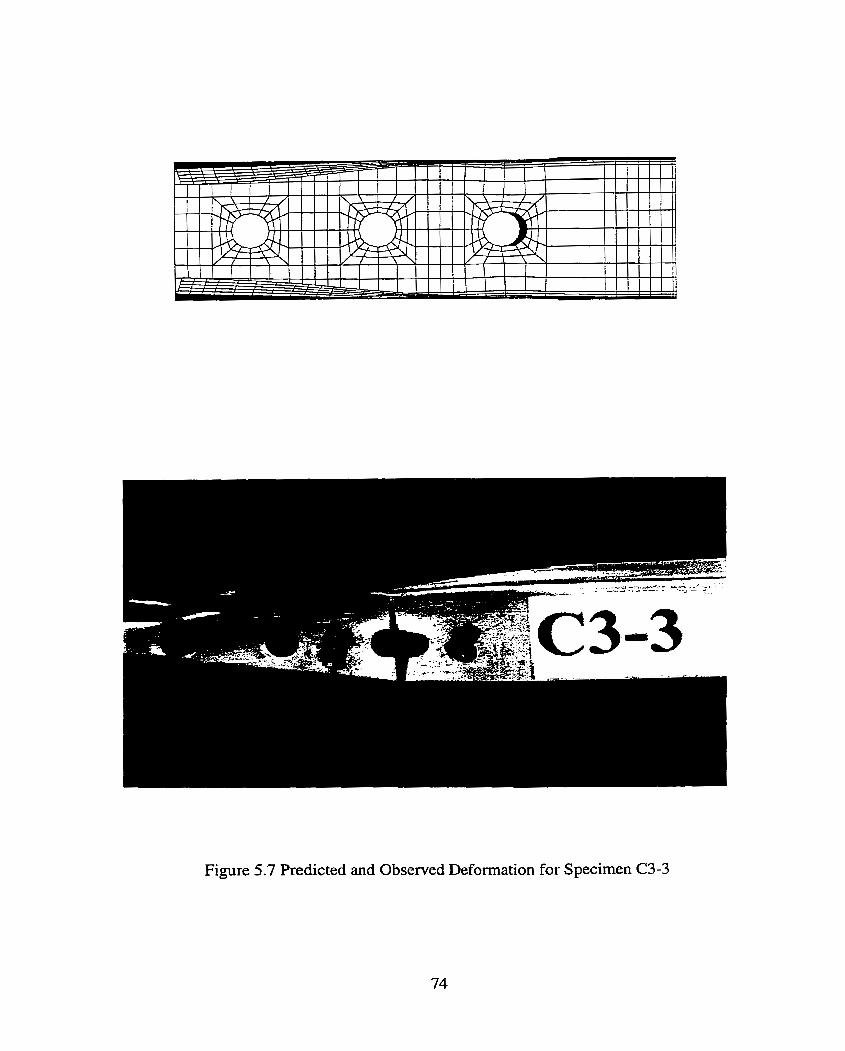
Figure 5.7 Predicted and Observed Deformation for Specimen C3-3
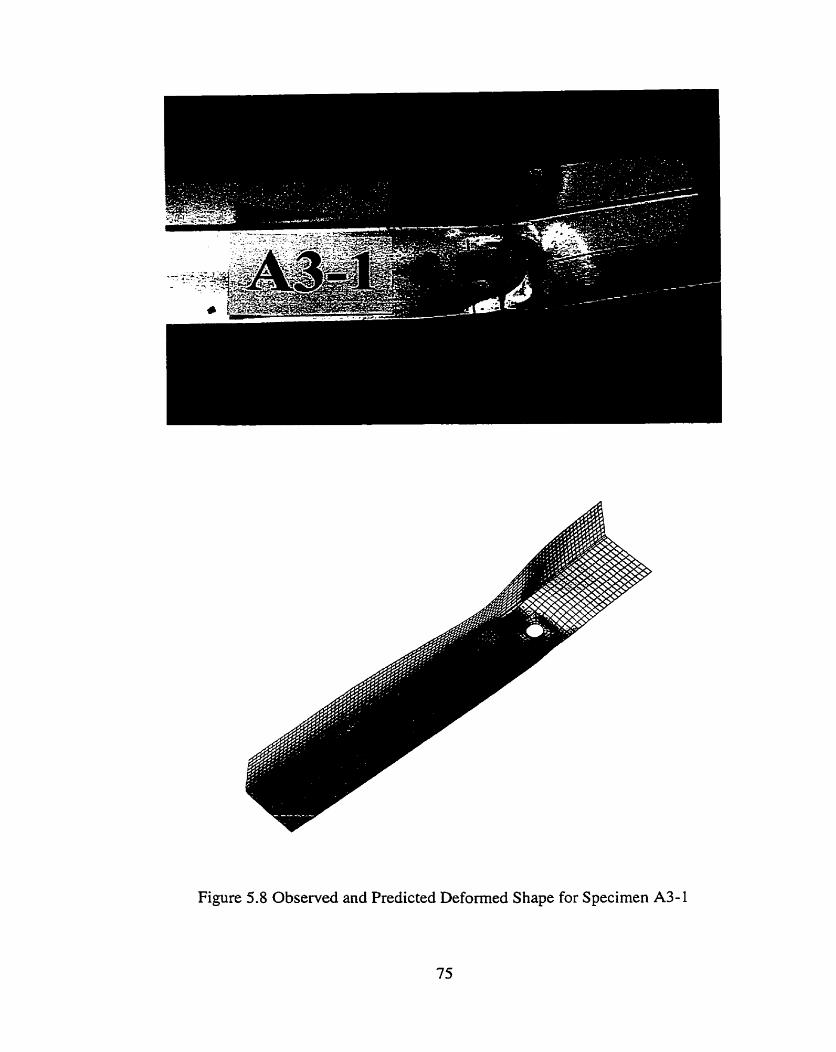
Figure 5.8 Observed and Predicted Deformed Shape for Specimen A3-1
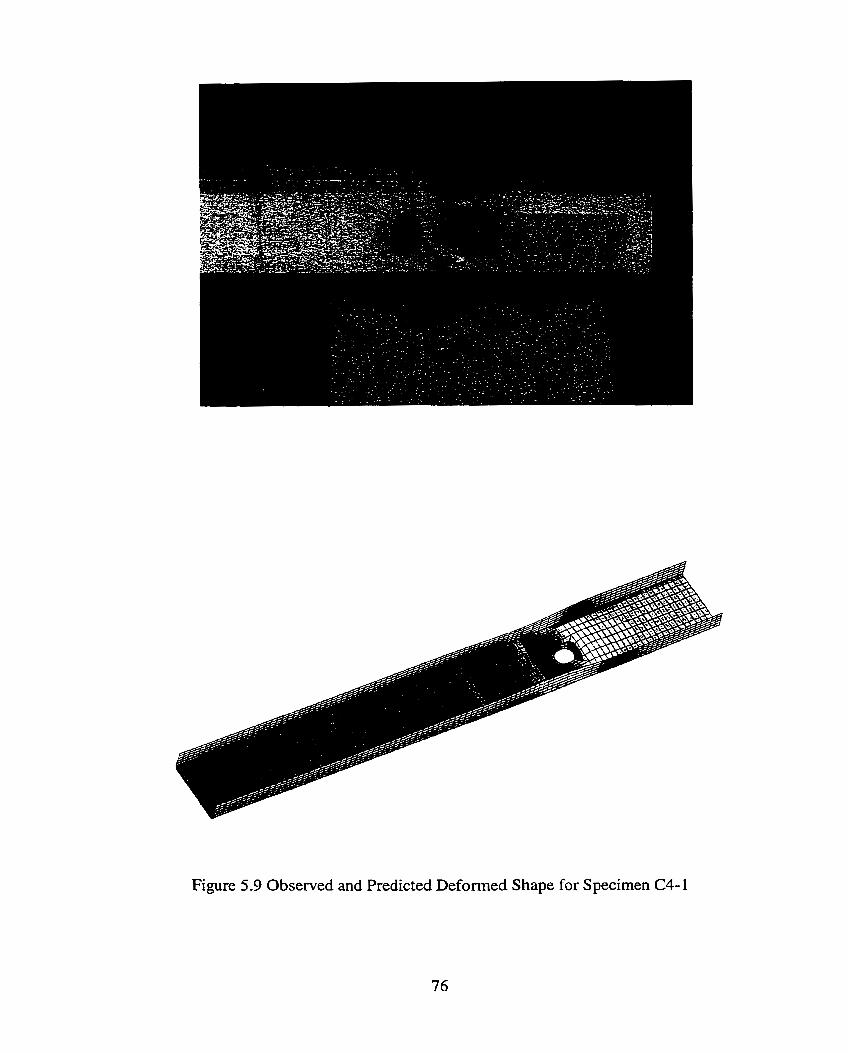
Figure 5.9 Observed and Predicted Deformed Shape for Specimen C4-1
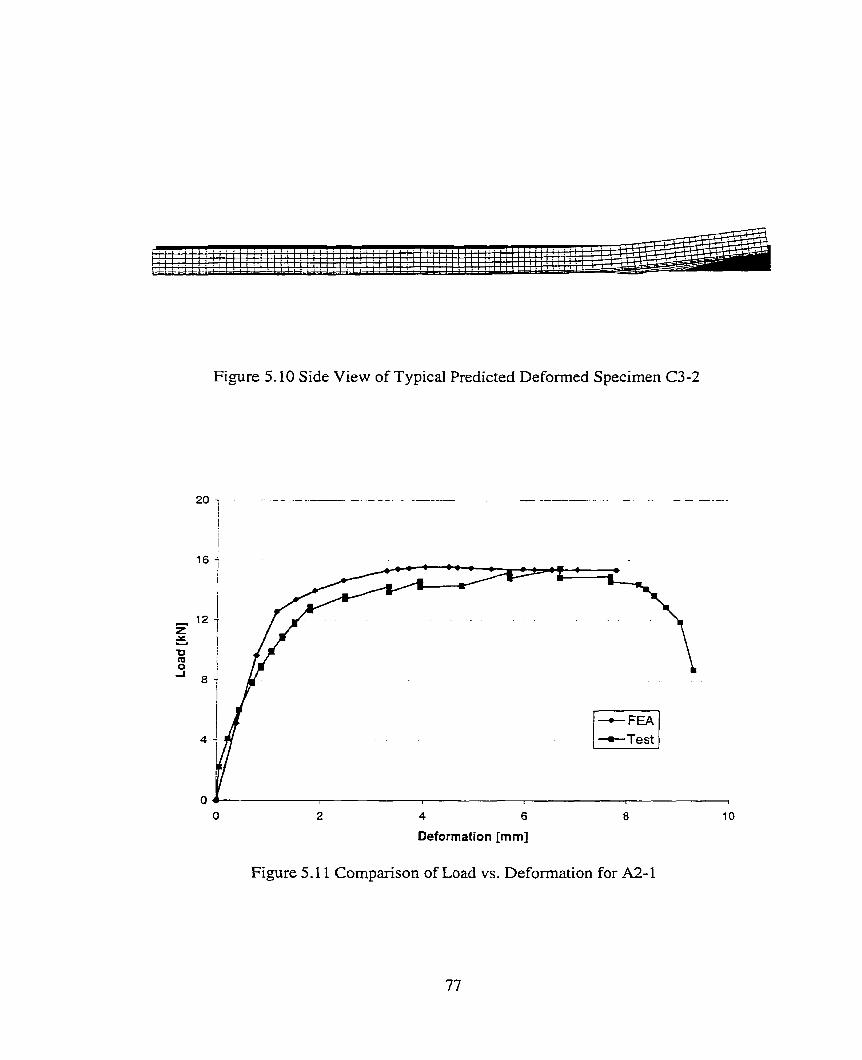
Figure 5.10 Side View of Typical Predicted Deformed Specimen C3-2
4 6
Deformation [mm]
Figure 5.11 Cornparison of Load vs. Deformation for A2-1
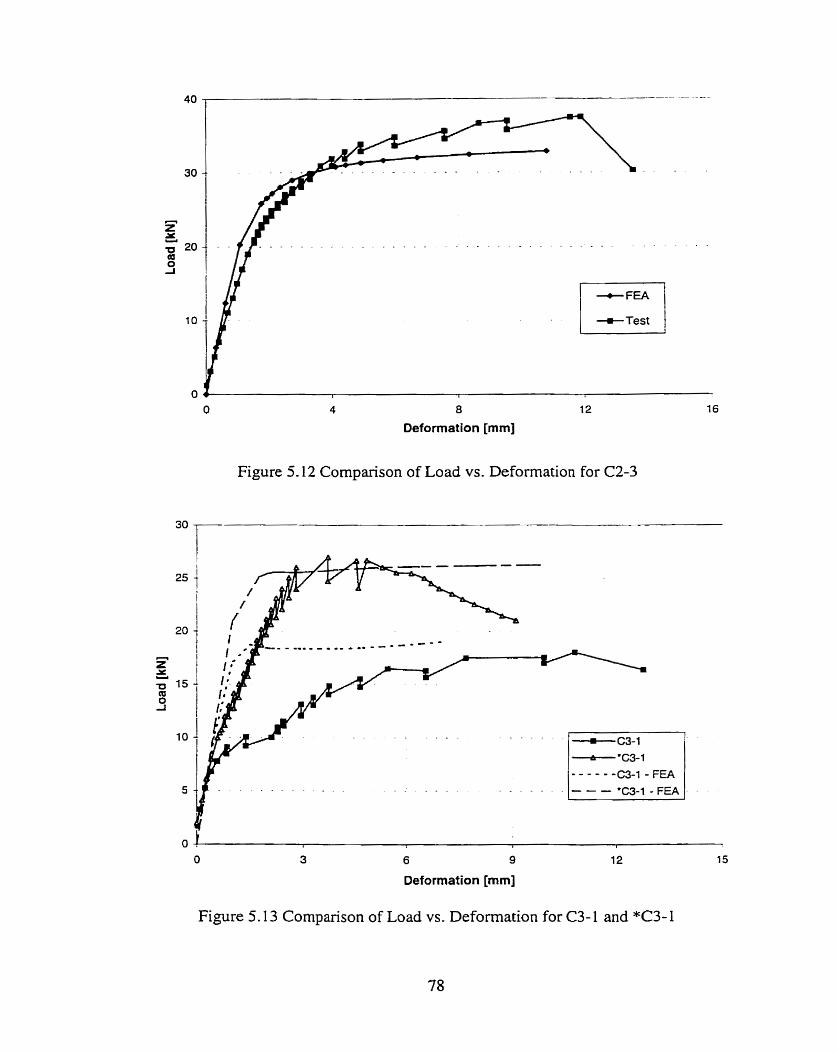
Deformation [mm]
Figure 5.12 Cornparison of Load vs. Deformation for C2-3
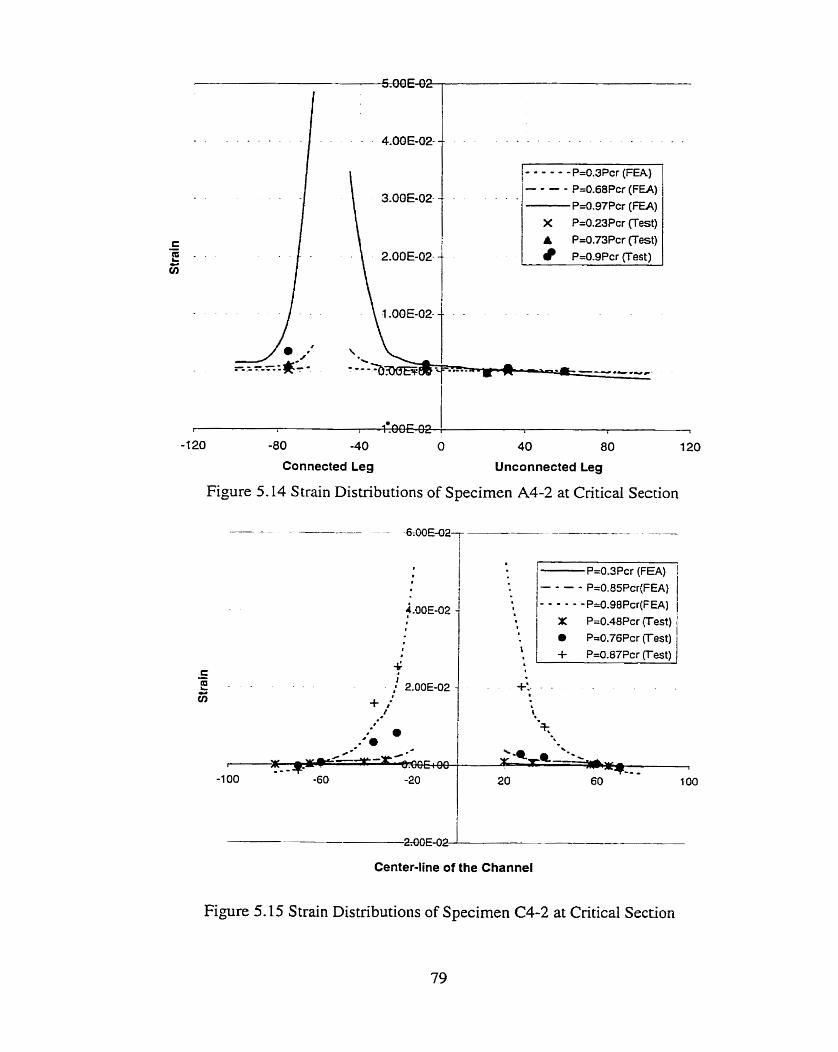
- . - 4.00E-02-
- - - - - - P=0.3Pcr (FEA)
A - - -
. . . P=0.68Pcr ( F U )
3-00 E-02- P=0.97Pcr (FU)
X P=0.23Pcr (Test)
C - A P=0.73Pcr (Test) i? - P=O.gPcr (Test) G
1 -0OE-02- -- -
I I , - wq L l i L 1
-1 20 -80 -40 O 40 80 120
Connected Leg Unconnected Leg
Figure 5.14 Strain Distributions of Specirnen A4-2 at Critical Section
P=0.3Pcr (FEA) 1 - - - - P=O.BSPcr(FEA) 1 . - - - - - P=0.98Pcr(FEA)
X P=0.48Pcr (Test)
P=0.76Pcr (Test)
P=0.87Pcr (Test)
2;00~-0-- -
Center-line of the Channel
Figure 5.15 Strain Distributions of Specimen C4-2 at Critical Section
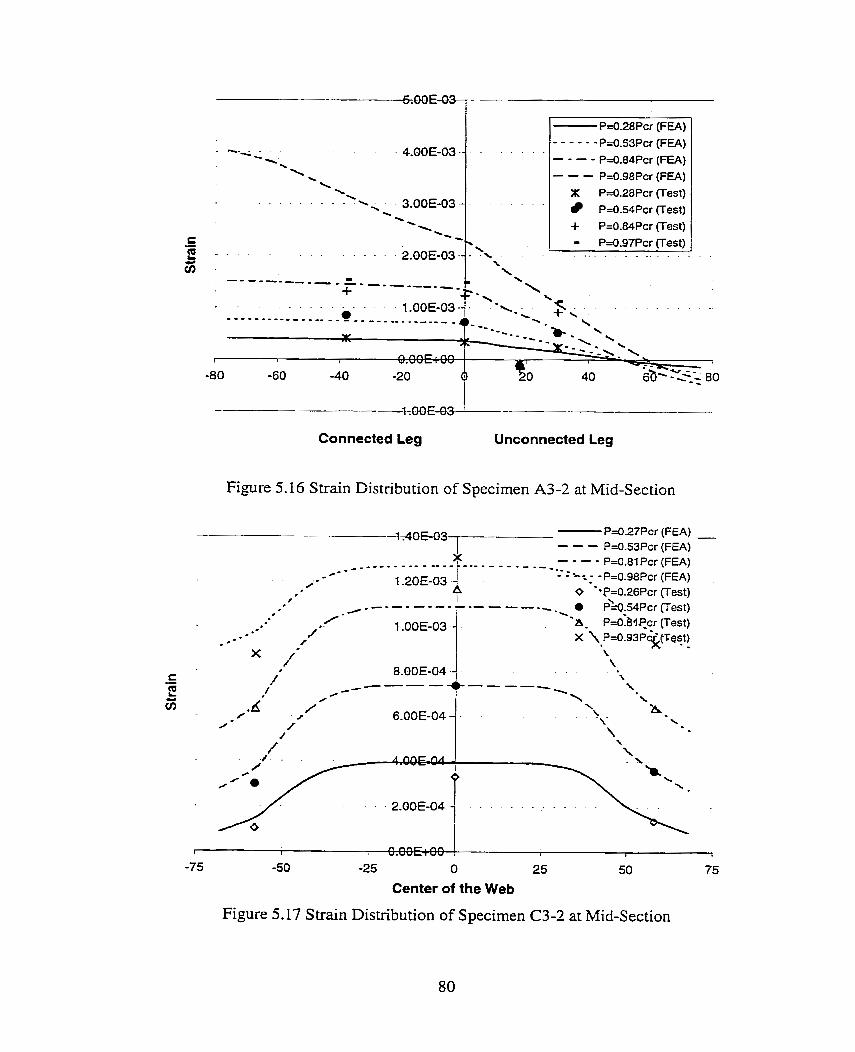
P=0.28Pcr (FEA)
- P=O.S3Pcr (FEA) . . . . .
P4.84Pcr (FEA) P=0.98Pcr (FEA)
X P=0.28Pcr (Test) . . . . . . . .
P=0.54Pcr (Test)
f P4.84Pcr (Test) % - P4.97Pcr (Test)
.. ? . . . - 1 . . . . . . . . . . . . . . . ! .
Connected Leg Unconnected Leg
Figure 5-16 Strain Distribution of Specimen A3-2 at Mid-Section
1 1 n n l i y. L I b I
-75 -50 -25 O 25 50 75
Center of the Web
Figure 5.17 Strain Distribution of Specimen C3-2 at Mid-Section
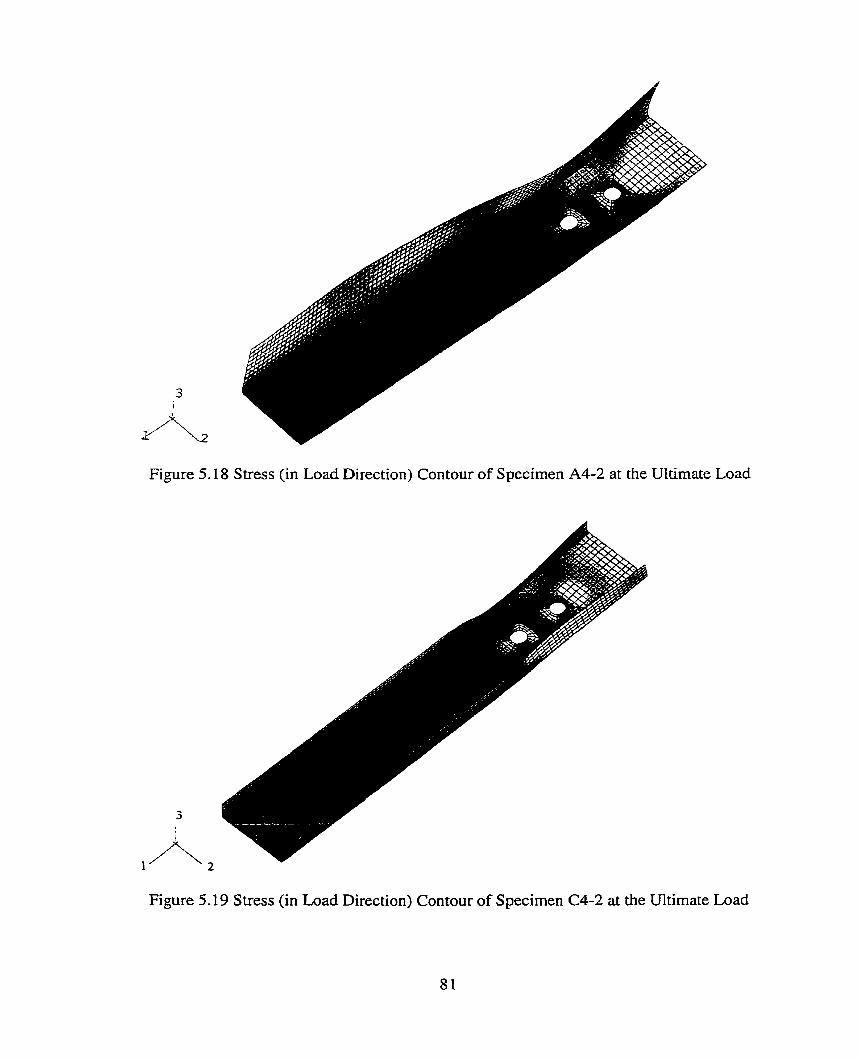
Figure 5.1 8 Stress (in Load Direction) Contour of Specimen A4-2 at the Ultimate Load
Figure 5.19 Stress (in Load Direction) Contour of Specimen C4-2 at the Ultimate Load
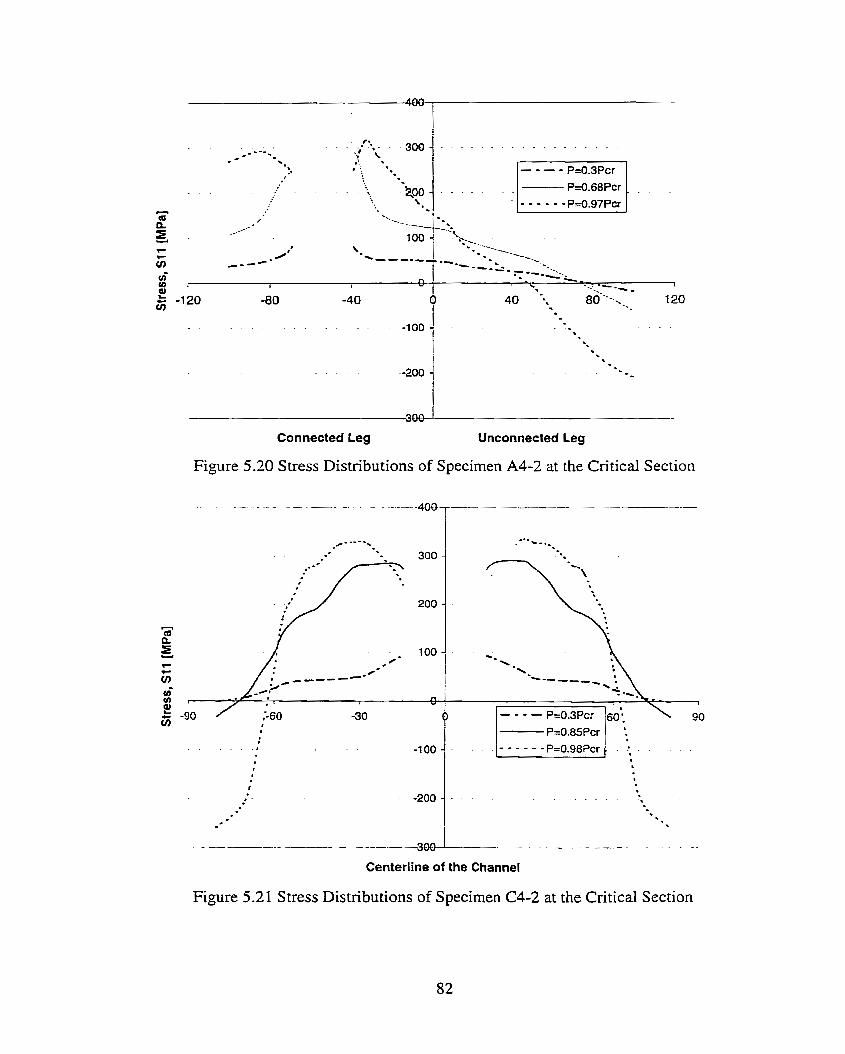
-300-
Connected Leg Unconnected Leg
Figure 5.20 Stress Distributions of Specirnen A4-2 at the Critical Section
Centerline of the Channel
Figure 5.21 Stress Distributions of Specimen C4-2 at the Critical Section
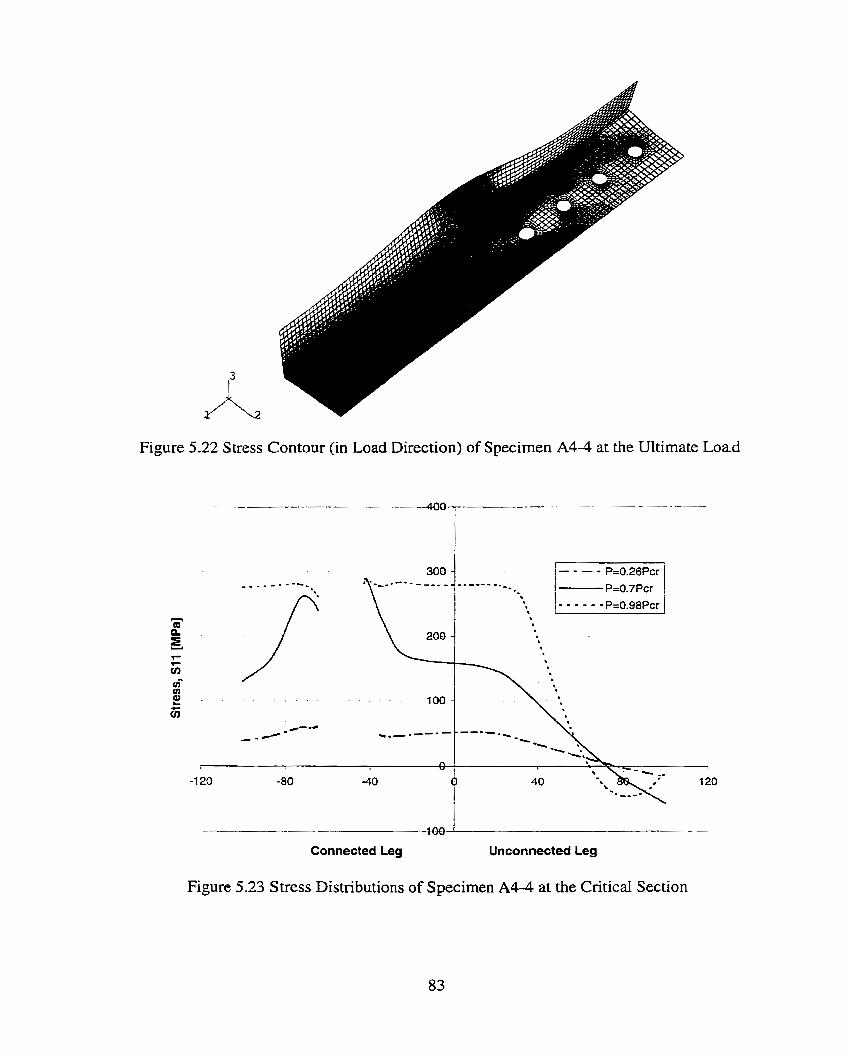
Figure 5.22 Stress Contour (in Load Direction) of Specimen A4-4 at the Ultimate Load
- WO-
Connected Leg Unconnected Leg
Figure 5.23 Stress Distributions of Specimen A 4 4 at the Critical Section
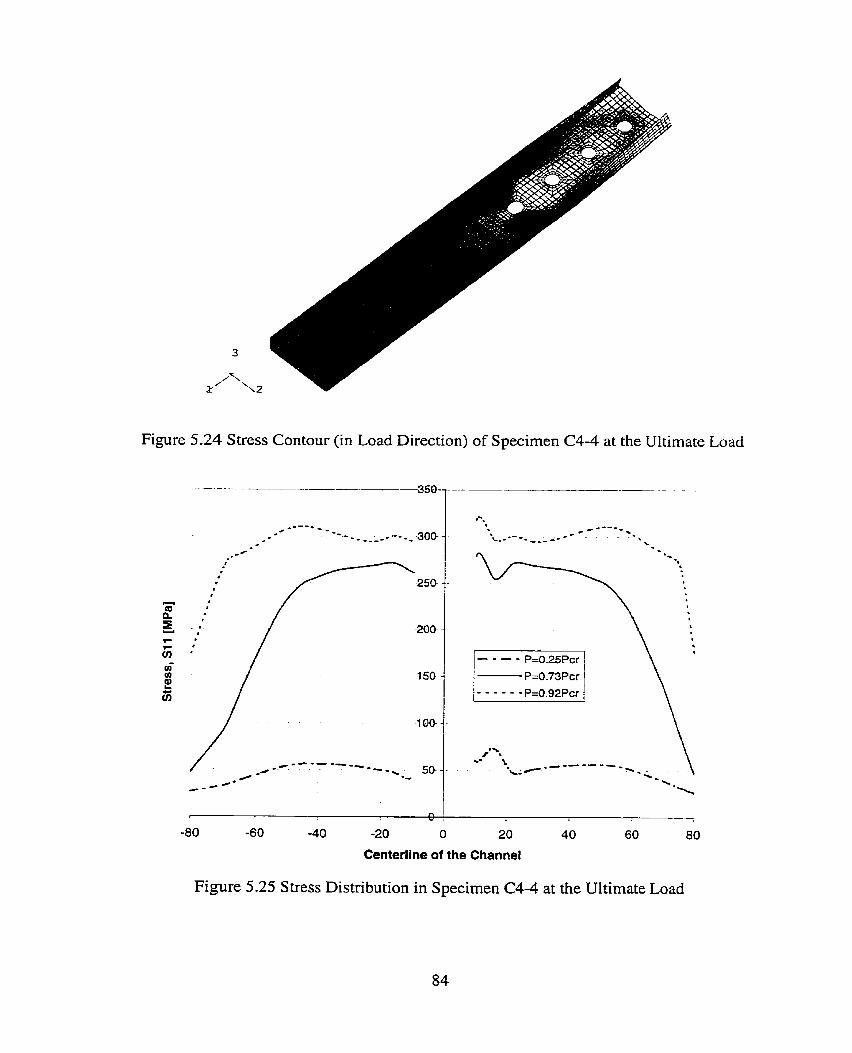
Figure 5.24 Stress Contour (in Load Direction) of Specirnen C4-4 at the Ultimate Load
-80 -60 -40 -20 O 20 40 60 80
Centerline of the Channel
Figure 5.25 Stress Distribution in Specimen C4-4 at the Ultimate Load
6. PARAMETRIC STUDIES
6.1 General
The finite element rnodels developed in the previous chapter were used to
investigate the net section strength of angle and channel cold-formed tension members.
The parameters that were considered in the analysis included the materid property, the
eccentncity, the number of bolts used at the connection, the flat width-to-thickness ratio
and the flat width-to-bolt diameter ratio.
The results obtained from the finite element analyses were then discussed with
respect to the above-mentioned parameters that were considered to have a possible effect
on the net section efficiency. A net section efficiency formula for each section based on
the parametric studies was proposed and the formulae were verified with the test results
obtained in this project and from the others.
6.2 Design of Parametric Studies
6.2.1 Scope of the study
6.2.1.1 Angle Sections
For the angle sections, only equal leg angles without stiffeners and single line of
bolts are considered. Ranges of the parameters considered are listed as follows:
Size: 50 mm x 50 mm, 76 mm x 76 mm, and 102 mm x 102 mm
Thickness, t (Gage number) : 2.667 mm (G 12), 1 -905 mm (G M), 1 -524 mm
(G16), and 1.219 mm (GI8)
Number of bolts: 1 to 4
Spacing between bolts: 63.5 mm
Diameter of bolt: 19- 1 mm
Material constant (Fu/Fy): 1.15 (3 10 MPa/270 MPa), 1.35 (3 10 MPd230 MPa)
and 1.50 (345 MPd230 MPa)
6.2.1.2 Channel Sections
For the channel sections, only unstiffened channels with single line of bolts
connected at the web are considered. Ranges of the parameters considered are listed as
follows:
Size (web depth x flange width): 50 mm x 29 mm, 76 mm x 29 mm, and 102 mm
x 29 mm
Thickness, t (Gage number): 2.667 mm (G12), 1.905 mm (G14), 1.524 mm
(G16), and 1.219 mm (G18)
Number of bolts: 1 to 4
Spacing between bolts: 63.5 mm
Diameter of bolt: 19.1 mm
Material constant (FJFy): 1.15 (3 10 MPaI270 MPa), 1.35 (3 10 MPal230 MPa)
and 1.50 (345 MPa/230 MPa)
A total of 100 finite element analyses were performed for angle and channel
sections. For al1 the analyses, the analysis was stopped when the strain of the element
reached the rupture strain, and the rupture strain used in this analysis was assumed to be
50%.
6.2.2 Designation of the numerical rnodels
A system of identification is used to differentiate between the various numerical
models. The first digit represents the geometry that being either an angle (a) or a channel
(c). The second digit signifies the gage number of the specimen. The third digit
designates the size of the model in inches and the fourth digit designates the number of
bolts used in the connections. Some of the rnodels have an extra number at the end of the
designation, this number signifies the end distance of the model in millimeters. For those
models having a material constant other than 1.35, an extra letter is inserted at the end of
the designation: 'x' represents the model having a materid constant of 1.15 while 'y'
represented the model having a material constant of 1 S. The descriptions of models used
in this study for angIe and channel sections are Iisted in Tables 6.1 and 6.2, respectiveIy.
6.3 Results of Parametric Studies
The results for the angIe sections and channel sections are showed in Tables 6.3
and 6.4, respectively. The ratio of the results obtained from the finite element analysis to
the predicted load was calculated for each mode of failure. The predicted loads for net
section strength, beanng failure, and block shear fracture were calculated according to
Eqs. 2.25, 2.33, and 2.34 discussed in Section 2.3, respectively, except the resistance
factors of 0.85g in Eq. 2.25 and 9 in Eqs. 2.33 and 2.34 were taken as unity. Only the
models that were associated with the net section M u r e mode were considered in further
discussion.
In order to differentiate the net section fracture from bearing and biock shear
failures, assumption regarding the finite element-to-predicted load ratio has been made.
The formulas of the predicted load for bearing and bIock shear (Eqs. 2.33 and 2.34) were
assumed to be accurate. That means if the finite element result-to-predicted load ratios
for bearing and block shear were greater than or equal to 1.0, then the section would fail
in bearing and block shear, respectively. Otherwise, the section was failed in net section
fracture. The governing mode of failure for each section is shown in "bold" in Tables 6.3
and 6.4.
6.4 Discussion of Parametric Study Results
6.4.1 Effect of material property
To study the effect of ultimate tensile-to-yield strength ratio on the net section
efficiency (N. S. E.), 76 mm x 76 mm x 1.905 mm angle and 102 mm x 28.6 mm x 1.905
mm channel sections were used. Three types of material properties were considered.
The rupture strain was assumed to be 50%. Tables 6.5 and 6.6 show the details and
results for this analysis. The effect of material property on the net section efficiency for
angle and channel sections is shown in Fig. 6.1 and Fig. 6.2, respectively. As shown in
these figures, as the ultimate tensile-to-yield strength ratio, Fu/%, increases, the net
section efficiency decreases. It also means that higher the ductility the lower net section
efficiency.
Besides net section fracture, as mentioned in Chapter 2, there is another design
criteria that has to be considered when designing tension members: gross section yield,
which is limited by yielding at the gross section. For those sections with higher ultimate
tensile-to-yield strength ratio, the probability for them to be govemed by yielding at gross
section is higher, and this c m be shown in Fig. 6.3. In this figure, by assuming the net
section area equal to the gross section area, gross section yield would occur when the net
section efficiencies for the section with material constant of 1-15, 1.35, and 1.50 are
above 0.87, 0.74, and 0.67, respectively. The values of these critical net section
efficiencies Xe derived by equating the net section strength to the gross section yielding:
UA,F, = A,F,
A,% u=- *,F,
By assuming A, = A,,
As seen in this figure, gross section yield is obtained for the section with FURy ratio of
1.35 and 1.5 when four or more bolts are used at the connection. AIthough the net
section efficiency for these sections is lower, a greater value of elongation can be
obtained since the ductility is higher for these sections. For the angle models with four
bolts at the connection, the load vs. deformation curves of different materiai properties
are plotted in Fig. 6.4. As illustrated in this figure, the elongation for the section with
Fu/Fy ratio of 1.5 is greater than that with Fu& ratio of 1-15; while the ultimate load for
that section is lower than that with F u 4 ratio of 1.15.
Another contributing factor to the net section fracture is the rupture strain.
Generally, a matenal with higher Fu& ratio gives higher rupture strain. For the ease of
analysis, however, the same rupture strain is used for a11 the models without considering
the difference in limiting strain, the ultimate load predictions for the section with higher
ductility are therefore lower. Since large variations in the material properties exist, the
intermediate material constant (FUIF, = 1.35) with 50% rupture strain was used as the
material properties for the rest of the parametric analysis.
6.4.2 Effect of eccentricity, F
The eccentricity is one of the factors influencing the net section efficiency.
According to Munse and Chesson (1963), the efficiency of a section would decrease as
the eccentricity increases. The eccentricity highly depends on the shape of the cross
section. Tables 6.7 and 6.8 summanze al1 the sectiond properties, including eccentricity,
flat width-to-thickness ratio (wft), and flat width-to-bolt diameter ratio (w/d), dong with
the net section efficiency for the angle and channel sections, respectively. As can be seen
in the tables, the net section efficiency for channel models was generally higher than that
for the angle rnodels. For instance, considering the a14-4 series of the angle sections and
c 14-4 series of the channel sections, both series have the w/t ratio of 50 and w/d ratio of
5, while the eccentncity of the angle sections are as twice much as that for the channel
sections. By comparing the two series, the net section efficiency of the angle sections are
significantly lower than that of the channel sections due to the difference in eccentricity,
rherefore, it implies that the shear lag effect in channel sections was not as severe as that
in angle sections.
In addition, the effect of eccentricity on net section effrciency for angle sections
and channel sections is shown in Figs, 6.5 and 6.6, respectively. The sections considered
in both cases were those with 3 bolts at the connection and gage thickness of 14 to 18.
As shown in Fig, 6.5, the net section efficiency decreases significantly as the eccentricity
increases for the angle sections. The decrease of net section efficiency may also be
contributed from the flat width-to-thickness ratio. However, by comparing the G16 and
G18 series with G14 series, same significant drop in effrciency is also observed. The
main difference between the three series is the value of flat width-to-thickness ratio;
however, the net section efficiency remains aImost the same for the sections with the
same eccentricity- It implies that the eccentricity is the most important factor for the net
section efficiency of angle section. In contrat, different observation is found for the
channel sections. Figure 6.6 shows that the net section efficiency increases as the
eccentricity increases; however, the increase is not significant. It implies that the
eccentricity is not the main factor affecting the net section efficiency of the channel
sections. This can be contributed to the practical geometrïc limitation of channel
sections. In this study, the flange to web ratio of channel sections was limited to the
range of from 0.25 to 0.56. This limitation practically eliminates the significance of the
eccentricity on channel sections.
6.4.3 Effect of nurnber of bolts
As discussed in Chapter 2, the net section strength is strongly affected by the
connection length, designated as 'L'. The connection Iength was calculateci using the
following formula:
L = BoIt spacing x (Number of bolts - 1)
Since there was only one bolt spacing used in this parametric study, the effect of the
nurnber of bolts used at the connection was simply equivalent to the effect of the
connection length. The results of the gage 14 angle and channel sections are used to
study the effect of the number of bolts on the net section efficiency. There are twelve
angle and twelve channel sections with six different section shapes considered in this
cornparison. 1,2, 3 and 4 bolts were used at the connections.
Figures 6.7 and 6.8 show the relation between the net section efficiency and the
number of bolts used at the connection for gage 14 angle and channel models,
respectively. From these figures, it shows that the net section efficiency increases with
the increase in number of bolts used. In addition, for those angle and channel sections
with flat width-to-thickness ratio, wlt, Iess than 25, and channel sections with w/t ratio
less than 50, the net section efficiency of the sections with four transverse lines of bolts
gave about the same values as those with three transverse lines of bolts. It irnplies that
effect of the number of bolts used at the connection, as well as the effect of the
connection length, upon the net section efficiency is not significant when three transverse
lines of bolts were used for those sections. Similar observations are found as well for the
angle and channel sections with different thickness.
6.4.4 Effect of flat width-to-thickness ratio
Flat width, w, is usually used when defining the width of connected element. It is
the width of the straight portion of the connected element and does not include the bent
portion of the element. It is usually non-dirnensionalized with the thickness, t, of the
section to form the fiat width-to-thickness ratio, w/t, which has been proved to be an
influential factor for net section efficiency.
In order to study the effect of flat width-to-thickness ratio on net section
efficiency, nine angle and nine channel sections with three different section sizes were
considered in this comparïson. The number of bolts at the connection is 2 for the angle
sections and 3 for the channel section. The results are shown in Figs. 6.9 and 6.10 for the
angle and channel sections, respectively. The values of the eccentricity and the flat
width-to-boh diameter ratio are the same for the sections used in each curve. These
figures show that as the flat width-to-thickness ratio increases, the net section efficiency
decreases.
6.4.5 Effect of flat width-to-bolt diameter ratio
As mentioned above, the flat width could also be non-dimensionalized with the
diameter of the boit hole, d, to form the flat width-to-bolt diameter ratio, w/d, which
reflects the shear Iag effect across the width. In order to illustrate the effect of the w/d
ratio on the net section efficiency, sections with about the same values of eccentricity and
w/t ratio were chosen. For the angle sections, the senes of a124 and a14-3 were
considered since both of these series have the values of eccentricity around 25 and the w/t
ratio around 36. Sirnilarly, for the channel sections, the senes of cI2-6 and c 14-4 were
considered. Both of these series have the values of eccentricity around 7.0 and the wlt
ratio around 50. The results for the angle and channel section are shown in Figs. 6.1 1 and
6.12, respectively. As shown in these figures, the net section efficiency decreases as the
w/d ratio increases; however, the decrease in the net section efficiency for the angle
sections is not as significmt as that in the channel sections,
6.5 Proposed Net Section Strength Formula
6.5.1 Evaluation of the (1-TL) rule
The net section efficiency based on (1-TL) for the angle and charme1 sections
used in the parametric study are calcuIated and shown in Tables 6.9 and 6.10,
respectively. Only those angle and channel sections with two or more bolts in the Iine of
force and with the net section failure mode were considered. Illustrated from the tables,
the ( 1 - T L ) mle does not accurately predict the net section efficiency for angles and
channels. As discussed in Section 6.4, there are two other factors affecting the net
section efficiency, and they are flat width-to-thickness ratio and flat width-ta-bolt
diameter ratio. For the angle sections with flat width-to-thickness ratio, w/t, less than 30,
and the fIat width-to-bolt diameter ratio, w/d, less than 2.5, the (1-TL) rule is a fair
predictor of the net section efficiency; however, for those angle sections with w/t ratio
greater than 30 and w/d ratio greater than 2.5, this rule does not provide good results. For
the channel sections, the (1-TL) mle only gives a good correlation to the results
obtained frorn the parametric study for those channel sections with Rat width-to-thickness
ratio, w/t, less than 40 and flat width-to-bolt diameter ratio, w/d, less than 5.
6.5.2 Proposed net section efficiency formula
Based on the above-mentioned observations, in addition to the factor (1-TL),
geometric factors such as the flat width-to-thickness ratio and the flat width-to-bolt
diameter ratio aiso have the effect on the net section efficiency- Therefore, new net
section efficiency factor, U, equations for both angle and channel sections are developed
to include the effects of eccentricity (T), connection length (L), flat width-to-thickness
ratio (w/t), and flat width-to-bolt diameter ratio (w/d). In order to establish the forrn of
the equation, regression analyses (including linear and non-linear regression analysis)
have been performed and the commercially available statistical software SigmaPlot 5.0
(SPSS, 1999) is used. In the analysis. the form of the predicted equation was first chosen
and the optimal values of the unknown coefficients were then calculated. Li SipaPlot,
the coefficients are obtained by minimizing the residual errors using the least squares
method. In order to determine the most suitable forrn of equation to describe the net
section efficiency of a section, the coefficient of determination, R' is used. It is the rnost
common measure of how well the regression mode1 describes the data. If R' values are
close to 1, the equation is a good description of the relation between the independent and
dependent variables.
Different forms of net section efficiency equations have been tried and the
equation with the following form was found to give the greatest value of R':
- X W W u = 1- a(L)b(T)C(d)g
where a, b, c and g are the regression coefficients obtained by performing regression
analysis. The data used in the analysis were those having two or more fasteners in the
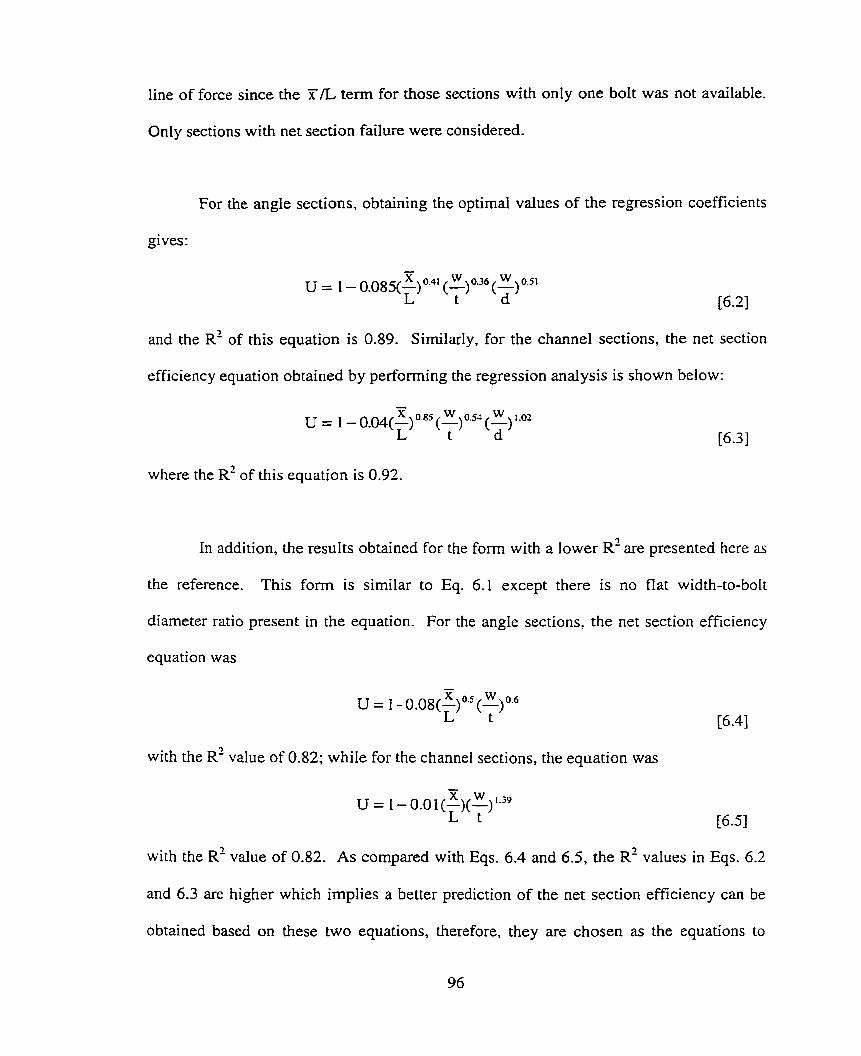
line of force since the T L term for those sections with only one bolt was not available.
Only sections with net section failure were considered.
For the angle sections, obtaining the optimal values of the regression coefficients
gives:
and the R' of this equation is 0.89. Sirnilarly, for the channel sections, the net section
efficiency equation obtained by perfonning the regression analysis is shown below:
where the R' of this equation is 0.92.
In addition, the results obtained for the form with a lower R' are presented here as
the reference. This form is similar to Eq. 6.1 except there is no flat width-to-bolt
diameter ratio present in the equation. For the angle sections, the net section efficiency
equation was
with the R' value of 0.82; while for the channel sections, the equation was
with the R' value of 0.82. As cornpared with Eqs. 6.4 and 6.5, the It2 values in Eqs. 6.2
and 6.3 are higher which implies a better prediction of the net section efficiency can be
obtained based on these two equations, therefore, they are chosen as the equations to
obtain the net section efficiency in this report herein for cold-formed angle and channel
sections.
For those connections with onIy one fastener, since the T/L term was not
available, non-linear regession analysis was performed using the equation with the forrn
similar to Eq. 6- 1 with no T/L term applied. Again, only sections with net section failure
were considered. For the angle sections, the net section efficiency equation was
W W u = 1-0.1 1(-)0-~(-10-~~ t d 5 6 1
with the R' value of 0.99; while for the channel sections, the equation was
with the R' value of 1 .O.
In Tables 6.1 1 and 6.12, the net section efficiency predicted by using Eqs. 6.2 and
6.6, and Eqs. 6.3 and 6.7 are compared with the net section efficiency obtained from the
parametric study for angle and channel sections, respectively. The average ratio of the
predicted values to the results obtained from the finite elernent analysis is 1.01 with a
standard deviation of 0.07 for the angle section and 1.00 with a standard deviation of 0.05
for the channel section. This indicates that Eqs. 6.2 and 6.6, and Eq. 6.3 and 6.7 provide
a better prediction on the net section efficiency than the (1- T L ) rule did. Therefore, Eqs.
6.2 and 6.6, and Eqs. 6.3 and 6.7 are proposed to predict the net section efficiency of
bolred equal leg angle and channel sections, respectively.
6.6 Recomrnended Design Method
6.6.1 Design recommendations
With the results obtained from the above discussion, it is recommended that for
cold-formed equal Ieg angle members with one line of boIts connected at one Ieg and
channel rnernbers with one line of bolts connected at the web, the factored tensile
resistance, T,, can be taken as the l e s t of
a) Tr= WgFy f6-81
b) T, = (hd~,~, c6-91
where $ = resistance factor, taken as 0.9 for tension members
$, = tensile fracture resistance factor, taken as 0.75
F, = specified yieId strength
Fu = specified uItirnate strength
A, = gross cross-sectional area
A,, = effective net area accounting for shear lag
In Eq. 6.9, the effective net area can be caIcuIated as follows:
A,, = UA, [6 - 1 O]
where A, = critical net area of connected part, calculated by taking the hole diameter 2
mm Iarger than the nominal size
U = shear Iag reduction factor to be determined as follows:
a) For angle members connected by one leg
(i) with one boit in the line of force
(ii) with two or more bolts in the Iine of force
b) For channel members connected by the web
(i) with one bolt in the line of force
W W u = 1 - 0.1 1(-)0-4(-)0.07 5 1.0 t d
(ii) with two or more bolts in the Iine of force
6.6.2 Evaluation of design recommendations with test results
Tables 6.13 and 6.24 show the cornparison between unfactored tensile resistance
of a member and the test results obtained in this project and by the others (by University
of Alberta from 1994 to 1997 (Cheng et al), and University of Missouri-Rolla (La-Boube
and Yu, 1995)) and the results are plotted in Fig. 6.13 and Fig. 6.14 for the angle and
channel sections, respectively. In order to calculate the unfactored tensile resistance of a
section, Eq. 6.9 was used without any @-factor applied. For the angle sections, only those
having equal leg and failed in net section fracture are being considered while for the
channel sections, only those sections connected on the web and having net section failure
were considered. It was found that the mean ratio of the test results to the predictions
based on Eq. 6.9 is 1.01 with a standard deviation of 0.17 for the angle sections and 1.08
with a standard deviation of 0.13 for the channel sections. Al1 the calculated data is
within 20% of the tested data. Also, most of the ratios are above 1.0. (It is
unconservative if the ratio is iess than 1.0.) Therefore, it c m be concluded that the net
section efficiency can be predicted well using Eqs. 6.1 1 to 14 directly and the factored
tensile resistance of a net section of the cold-formed steel angle and channel sections can
be calculated based on the recommendation suggested in this section.
6.6.3 Further discussion of proposed methods
The design recommendations proposed above, based on the test data and
parametric study results obtained from this report, c m be applicable to those equal leg
angles and channels with flange-to-web ratio ranging from 0.25 to 0.625, which have one
line of bolts at the connection. Tables 6-15 and 6.16 illustrate the applicability of the
proposed methods on those angle and channel sections, respectively, which were not
considered in this study. The source of the data for angle sections was from University of
Alberta (1997) and University of Missouri-Rolla (1995) while the data for channel
sections was from the University of Missouri-Rolla (1995). As can be seen from the
Table 6.15, good correlation is found between the efficiencies obtained from the test and
the proposed method for the stiffened angle sections. For the unequal k g angles, the
proposed method is unconservative when the short leg is connected but conservative
when the long leg is connected. In the situation where both legs of the angle sections or
both the flanges of the channel sections are connected, the proposed methods become
non-applicable. Therefore, further tests and analyses are desirable in order to investigate
the shear lag effect on unequal leg angles and sections with more than one element
connected. In addition, when designing the sections with two lines of bolts, the proposed

recommendations should provide a conservative predicted load since the net section
efficiency increases with the increase in the number of bolt line across the connection;
however, this assumption should be confirmed with future investigation.
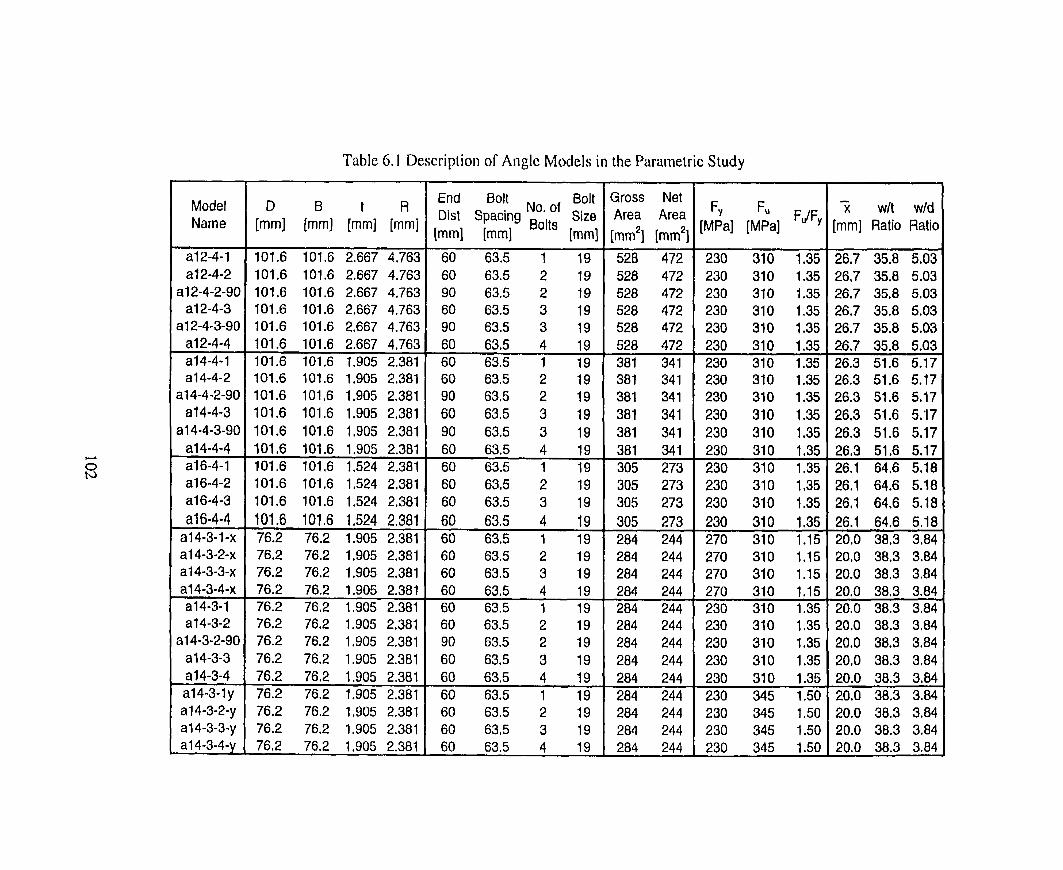
Table 6. I Description of Angle Models in the Püraiiieiric Study
End 8011 No. of Bolt Dist Spacing Size
[mm1 Imml [mm1
Gross Net Area Area [mm2] [mm2] 528 472 528 472 528 472 528 472 528 472 528 472 381 341 381 341 381 341 381 341 381 341 381 341 305 273 305 273 305 273 305 273
F~ Fu FJFy [MPa] [MPa]
- x w/t wld
:mm] Ratio Ratio
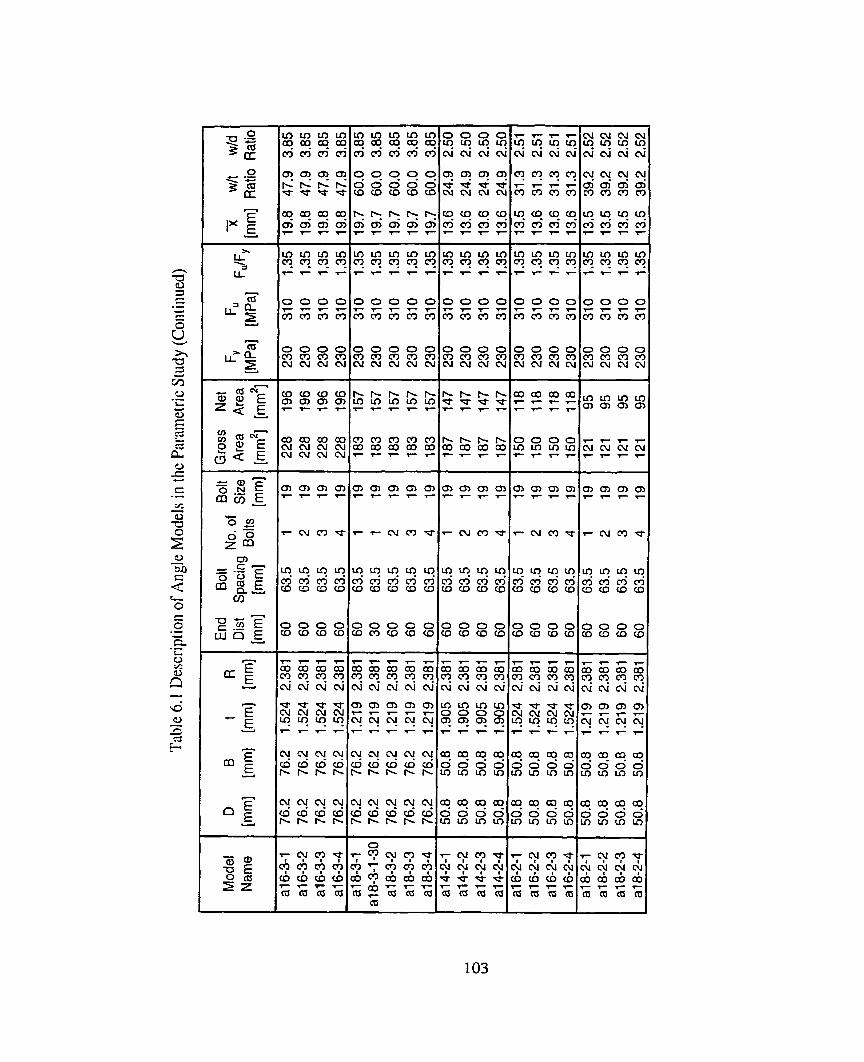
* * m m Y * - - m m m m
4 E S Z m m m m
0 0 0 0 m m m m C U C V N C U
0 0 0 0 m m m m N C U C U N
O O O C ( D a C D c c
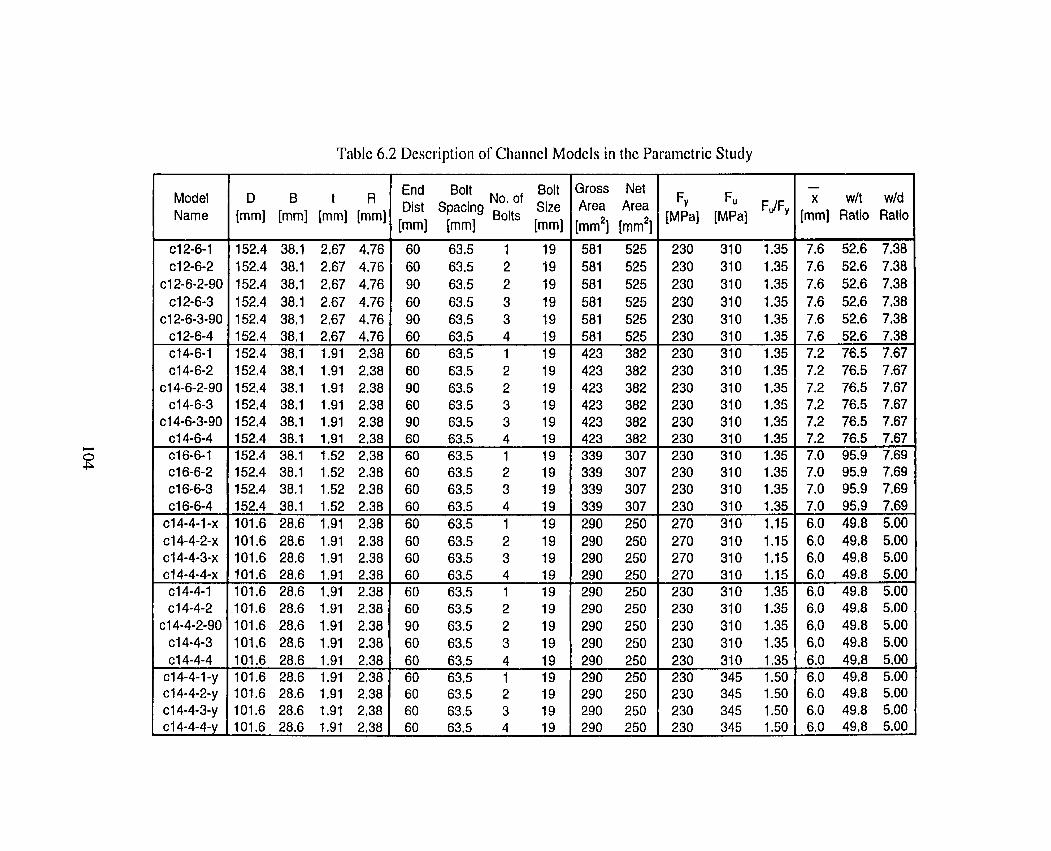
Table 6.2 Descriptioii of Cliiiiiiiel Models in the Parametric Study
Model Name
CI 2-6-1 CI 2-6-2
CI 2-6-2-90 CI 2-6-3
cl 2-6-3-90 CI 2-6-4
End Bolt No, of Bolt Dist Spacing Size [mm1 Imml [mm1
3oss Net Area Area :mm2] [mm2]
- x wlt wld
[mm] Ratio Ratio
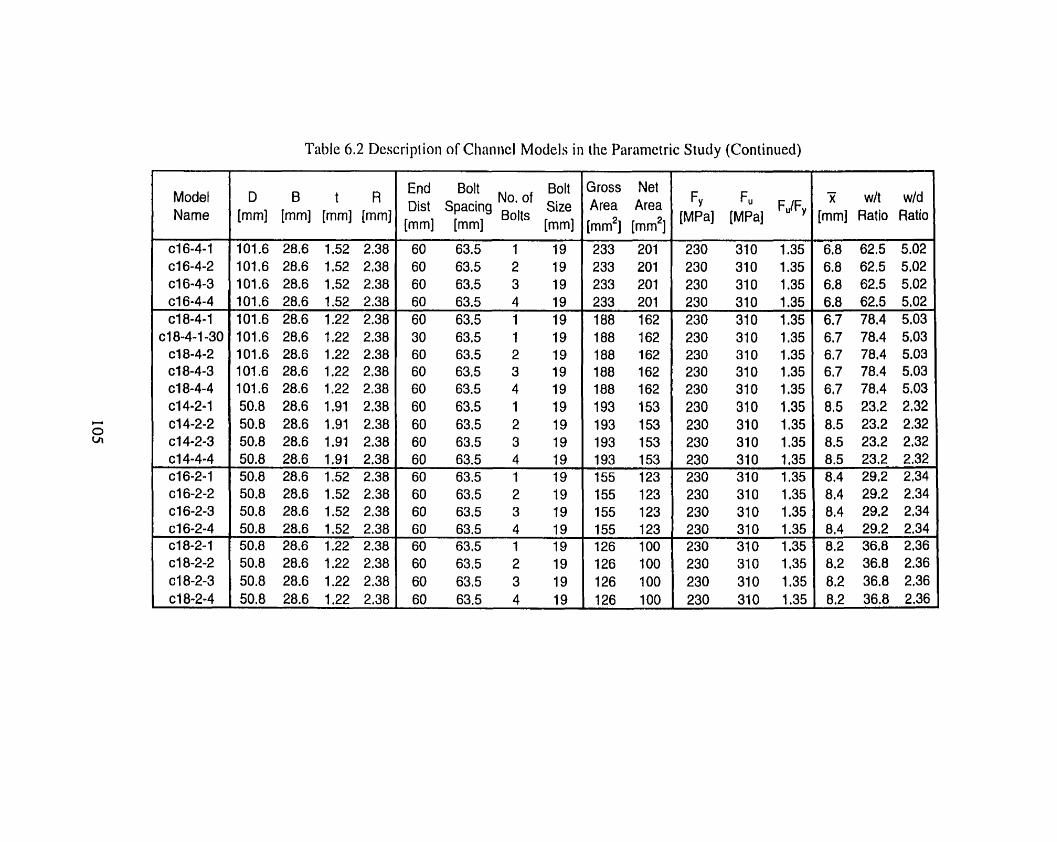
Table 6.2 Descripiion of Clianiicl Models in the Paramctric Study (Continued)
Modet Name
CI 6-4-1 CI 6-4-2 CI 6-4-3 cl 6-4-4
End Bolt Bolt No. of
Dist Spacing Bolts [mm1 [mm1 [mm1
Gross Net Area Area [mm2] [mm2]
X w/t wld [mm] Ratio Ratio
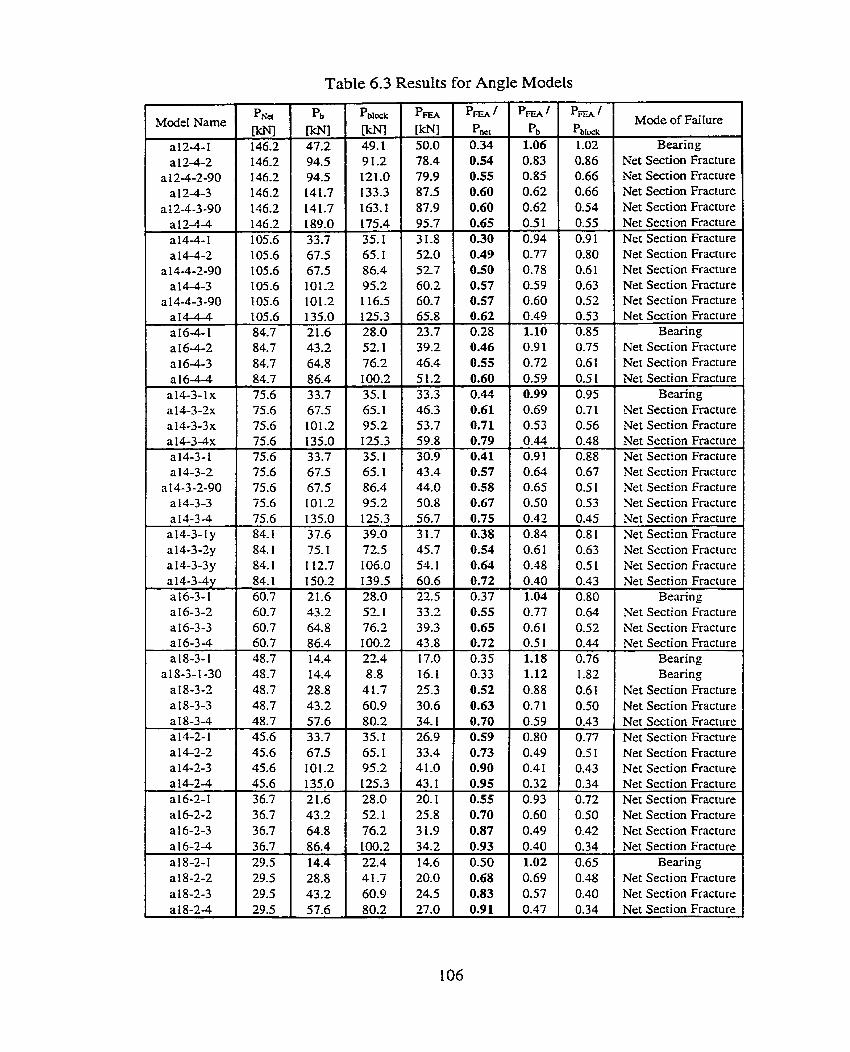
Table 6.3 Results for Angle Models
Mode of Failure FNJ FN] Pm, Pb
49.1 50.0 0.34 1.06 Bearing Net Section Fracture Net Section Fracture Net Section Fracture Net Section Fracture Net Section Fracture Net Section Fracture Net Section Fracture Net Section Fracture Net Section Fracture Net Section Fracture Net Section Fracrure
Bearing Net Section Fracture Net Section Fracture Net Section Fracture
Bearing Net Section Fracture Net Section Fracture Net Section Fracture Net Section Fracture Net Section Fracture Net Section Fracture Net Section Fracture Net Section Fracture Net Section Fracture Net Section Fracture Net Section Fracrure Net Section Fracture
Bearing Net Section Fracture Net Section Fracture Net Section Fracture
Bearing Bearing
Net Section Fracture Net Section Fracture Net Section Fracture Net Section Fracture Nec Section Fracture Net Section Fracture Net Section Fracture Net Section Fracture Net Section Fracture Net Section Fracture Net Section Fracture
Bearing Net Section Fracture Net Section Fracture Net Section Fracture
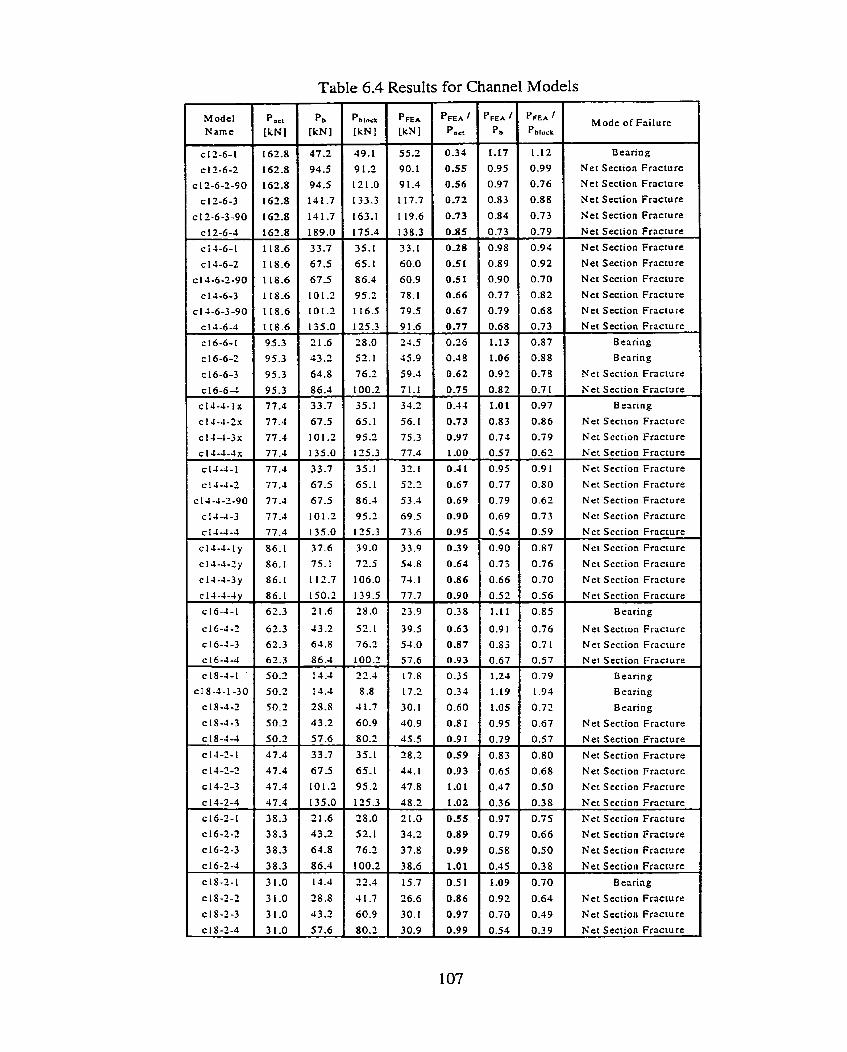
Table 6.4 Results for Channel Models
Mode of Failure
B earing
Net Section Fracture
Net Section Fracture
Net Section Fracture
Net Section Fracture
Net Section Fracture
Net Section Fracture
Net Section Fracture
Net Section Fracture
Net Section Fracture
Net Section Fracture
Net Section Fracture
Bearing
B raring
Net Scction Fracture
Net Section Fracture
B earing
Net Section Fracture
Net Section Fracture
Net Section Fracture
Net Section Fracture
Net Section Fracture
Net Section Fracture
Net Section Fracture
Net Section Fracture
Net Section Fracture
Ner Section Fracture
Net Section Fracture
Net Section Fracture
Bearing
Net Section Fracture
Net Section Fracture
Net Section Fracture
Bearing
Bearing
Seriring
Net Section Fracture
Net Section Fracture
Net Section Fracture
Net Section Fracture
Net Section Fracture
Net Section Fracture
Ket Section Frricturr
Net Section Fracture
Net Section Fracture
Net Section Fracture
Bearing
Net Section Fracture
Net Section Fracture
Net Srction Fracture
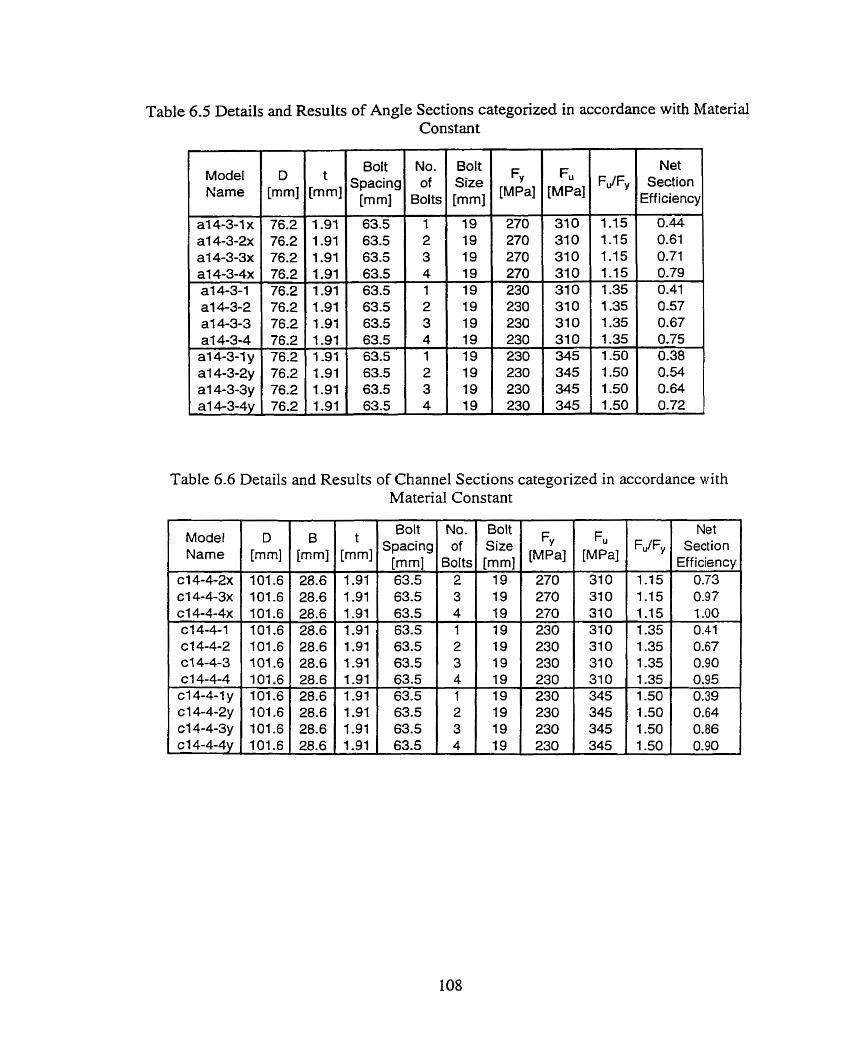
Table 6.5 Details and Results of AngIe Sections categorized in accordance with Materd
Model Name
a1 4-3-1 x a l 4-3-2x a1 4-3-3x a l 4-3-4x a l 4-3-1 a1 4-3-2 a1 4-3-3 a1 4-3-4 a l 4-34 y a1 4-3-2y a1 4-3-3y a1 4-3-4y
Boit spacing
[mm]
Constant -
No. of
Bolts - 1 2 3 4 - 1 2 3 4 - 1 2 3 4 -
Table 6.6 Details and Results of Channel Sections categorized in accordance wirh Material Constant
Bolt Size [mm1
5 [MPa]
Model Name
~14-4-2x ~14-4-3x ~14-4-4x ~14-4-1 ~14-4-2 ~14-4-3 ~14-4-4 ~14-4- l y ~14-4-2y ~14-4-3y ~14-4-4y
Fu
[MPa]
D
101.6 101.6 101.6 101.6 101.6 101.6 101.6 101.6 101.6 101.6 101.6
FJFy
B hm] 28.6 28.6 28.6 28.6 28.6 28.6 28.6 28.6 28.6 28.6 28.6
Net Section
Eff iciency
1-91 1.91 1.91 1.91 1.91 1.91 1.91 1.91 1.91 1.91 1.91
Bolt Spacing
[mm] 63.5 63.5 63.5 63.5 63.5 63.5 63.5 63.5 63.5 63.5 63.5
No. of
BORS
2 3 4 1 2 3 4 1 2 3 4
Bolt Size [mm]
19 19 19 19 19 19 19 19 19 19 19
FY [MPa]
270 270 270 230 230 230 230 230 230 230 230
Fu
[MPa]
310 310 310 3 1 0 310 310 310 345 345 345 345
FJFy
1-15 1.15 1.15 --
1.35 1.35 1.35 1.35 1.50 1.50 1.50 1.50
Net Section
Eff iciency 0.73 0.97 1.00
--
0.41 -
0.67 0.90 0.95 0.39 0.64 0.86 0.90
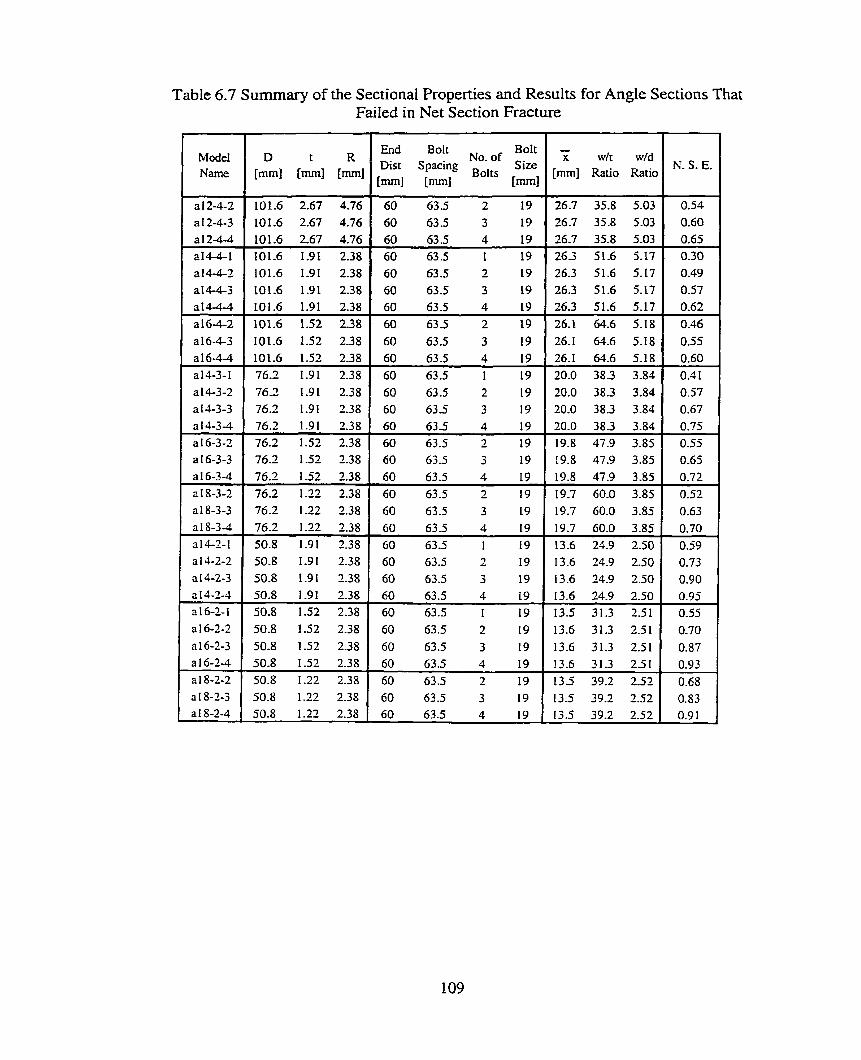
Table 6.7 Summary of the Sectional Properties and Results for Angle Sections That Failed in Net Section Fracture
N. S. E. -
W't w'd [mm] Ratio Ratio
End Bolt Bolt Dist Spacing No. of S ize [ml BOIB
[mm1 h m 1
t
Mode1 Name
D t
[mm1 [mm1 h m 1
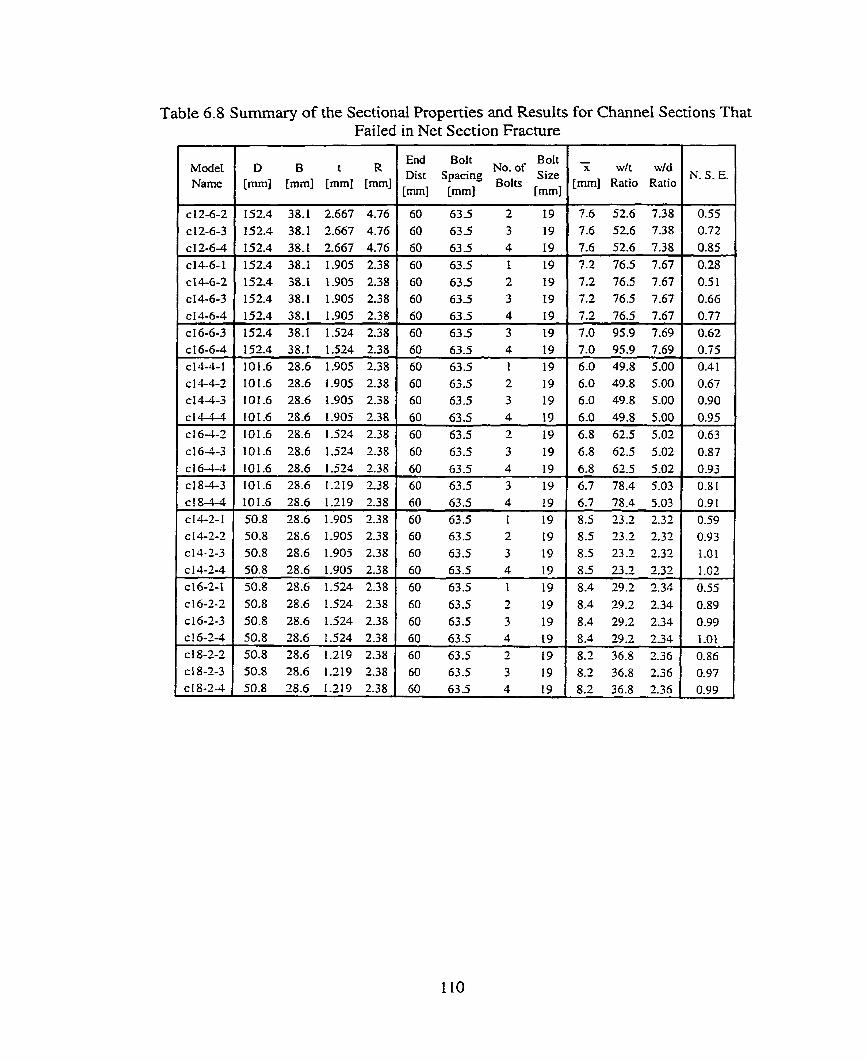
Table 6.8 Summary of the Sectional Properties and Results for Channel Sections Thai Failed in Net Section Fracture
Model Name
c12-6-2 c12-6-3 ~12-6-4 ~14-6-1 ~14-6-2 ~14-6-3
B D t
[mm1 [mm] [mm] [mm]
152.4 38.1 2.667 4.76 152.4 38-1 2.667 4.76 152.4 38.1 2.667 4.76 152.4 38.1 1.905 2.38 152.4 38-1 1.905 2.38 152.4 38.1 1.905 2.38
End Bolt BoIt Dirt Spacing
No. of Size
[mm] [mm] Bolts [mm1
60 63.5 2 19 60 63.5 3 19 O0 63.5 4 19 60 63.5 1 19 60 63.5 2 19 60 63.5 3 19
- w/t wld
[mm] Ratio Ratio
7-6 52.6 7.38 7.6 52.6 7.38 7.6 52.6 7.38 7.2 76.5 7.67 7.2 76.5 7-67 7.2 76.5 7.67
N- S. E.
0.55 0.72 0.85 0.28 0.51 0.66
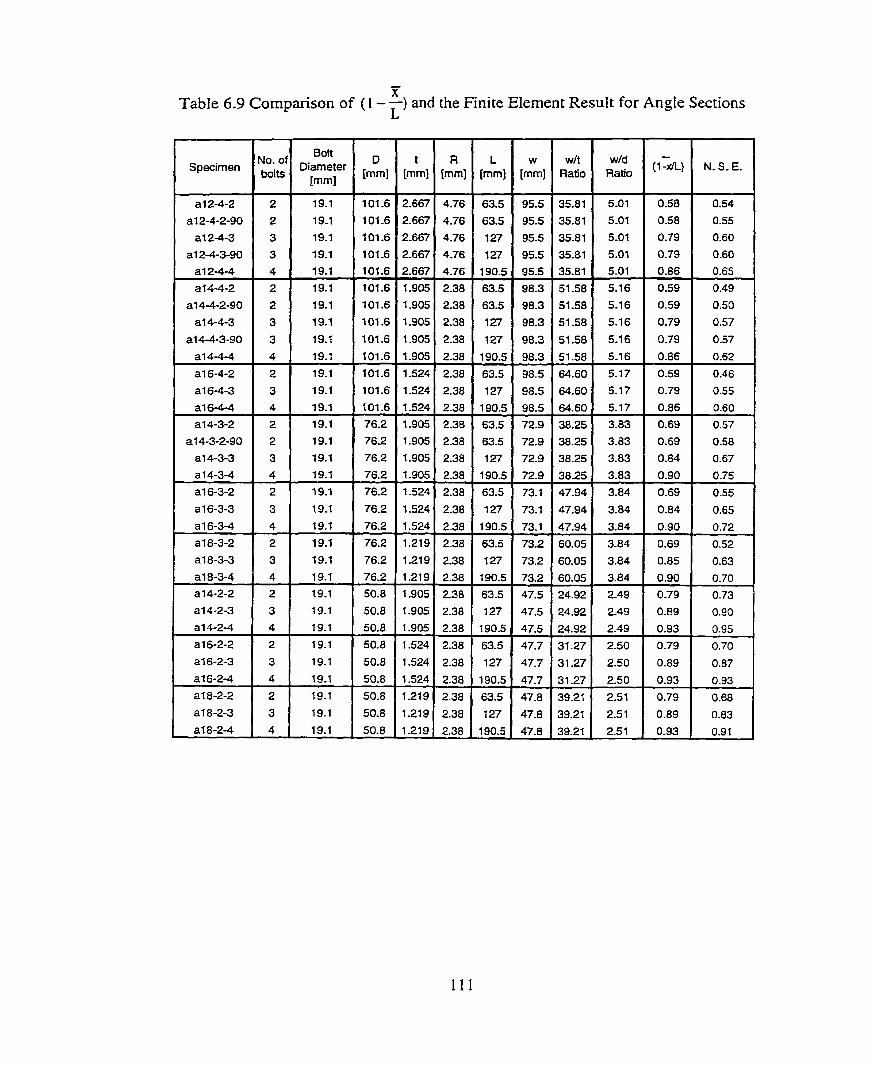
- X
Table 6.9 Cornparison of ( 1 - 7) and the Finite Element Result for Angle Sections
No. of Boit R L w w/t w/d
[mm] [mm] [mm] Ratio Ratio (l&
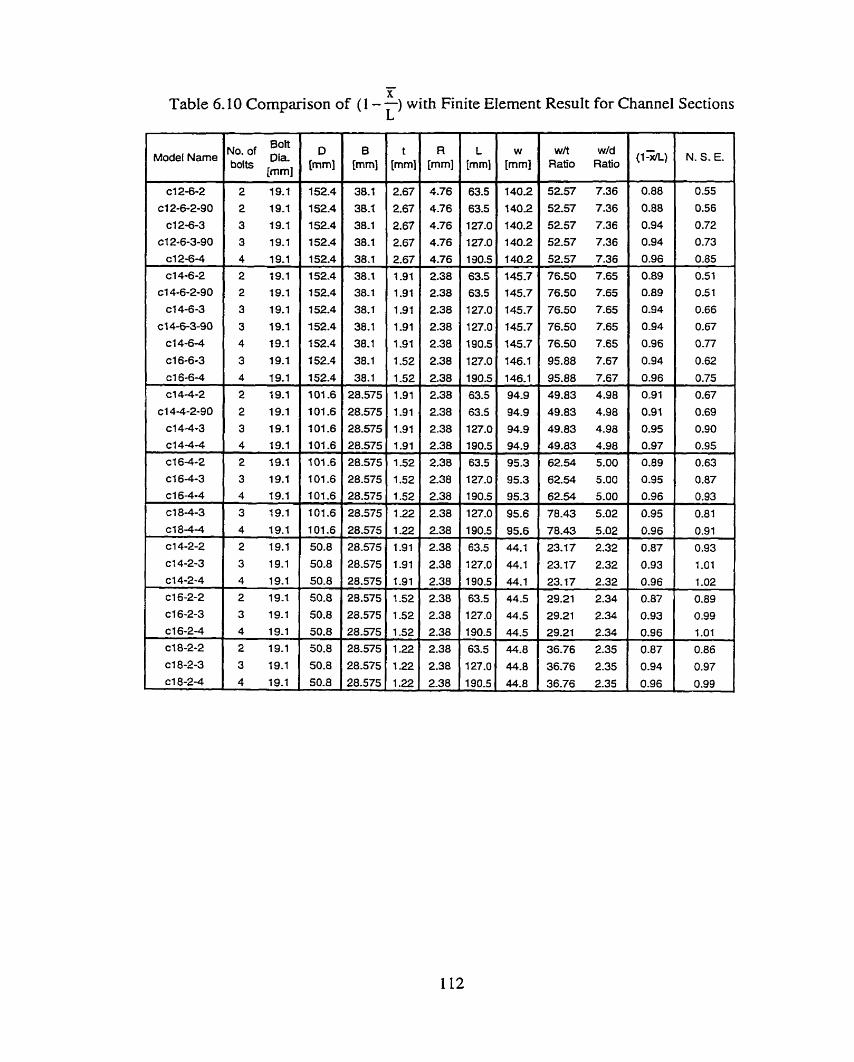
- X
Table 6.10 Cornparison of ( 1 - r) with Finite EIement ResuIt for Channel Sections
w/t w/d Ratio Ratio
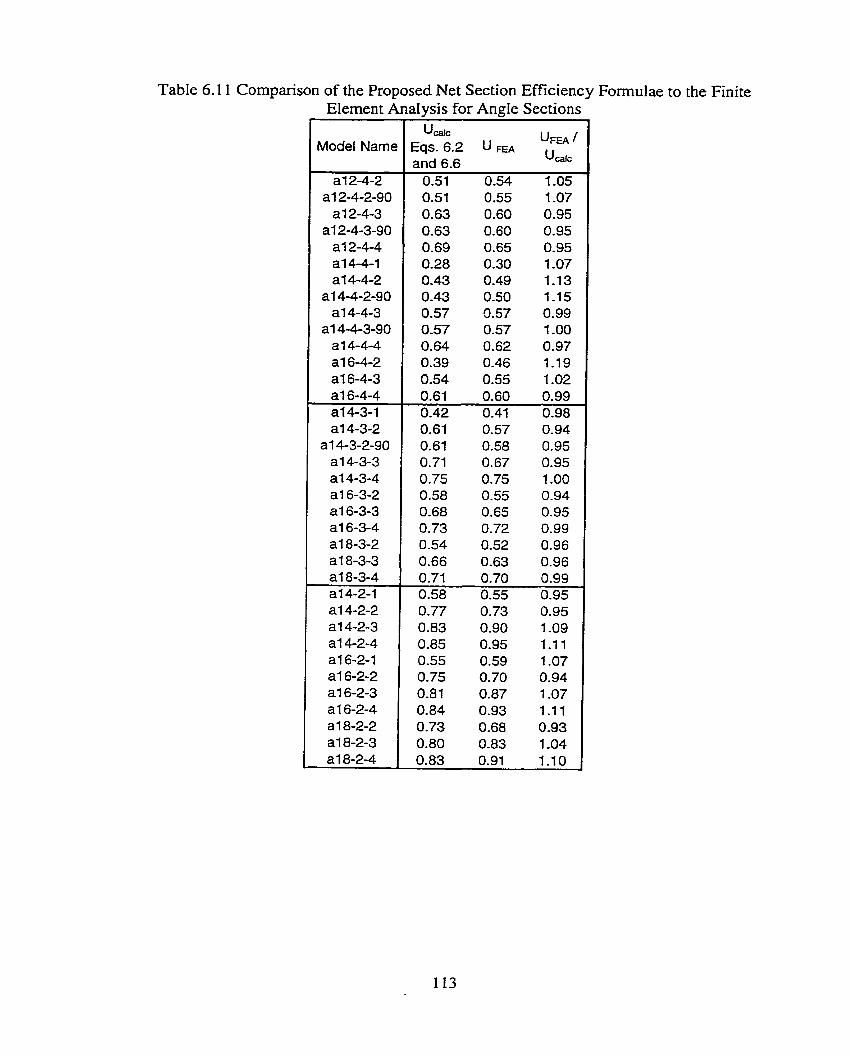
Table 6.1 1 Cornparison of the Proposed Net Section Efficiency Formulae to the Finite Element
U,k E ~ s . 6.2 U FEA
UFEA
and 6.6 Ucalc
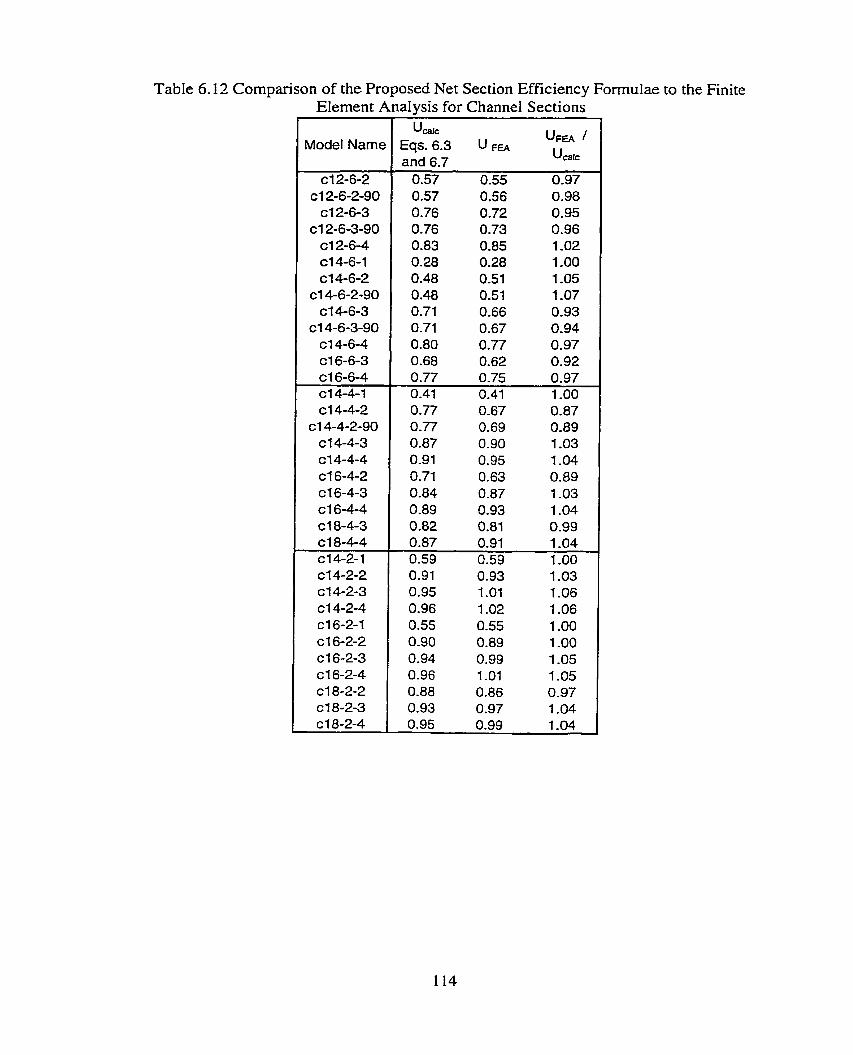
Table 6.12 Cornparison of the Proposed Net Section Efficiency Formulae to the Finite Element Analvsis for Channel Sections
Model Name
CI 2-6-2 cl 2-6-2-90 CI 2-6-3
CI 2-6-3-90 CI 2-6-4 CI 4-6-1 CI 4-6-2
CI 4-6-2-90 CI 4-6-3
cl 4-6-3-90 CI 4-6-4 CI 6-6-3 cl 6-6-4 CI 4-4-1 CI 4-4-2
cl 4-4-2-90 cl 4-4-3 cl 4-4-4 cl 6-4-2 c 1 6-4-3 CI 6-4-4 CI 8-4-3 CI 8-4-4 c 1 4-2- 1 CI 4-2-2 CI 4-2-3 CI 4-2-4 CI 6-2-1 CI 6-2-2 c 1 6-2-3 CI 6-2-4 c 1 8-2-2 CI 8-2-3 c 1 8-2-4
uac E ~ s . 6.3 U FEA
UFEA
and 6.7 u,ic
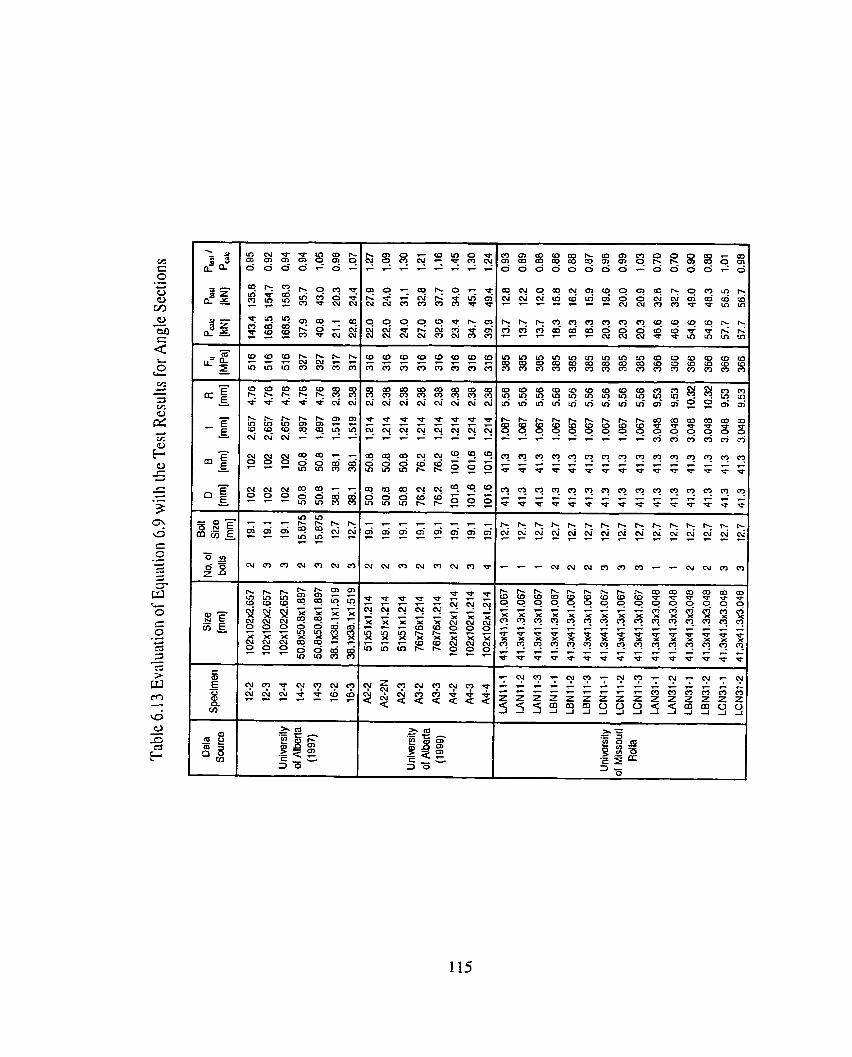
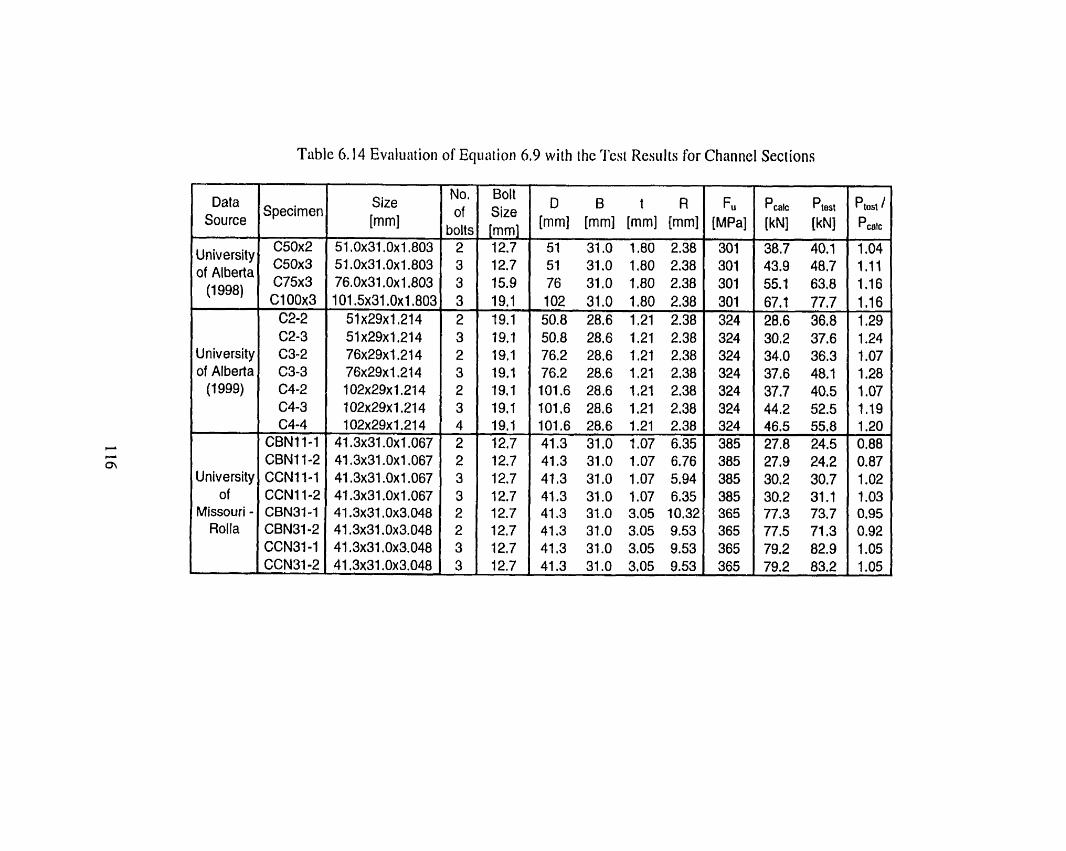
Table 6.14 Evnluation of Eq~iation 6.9 wiih the Tcsi Resiilis for Channel Sections
Data Source
University of Alberta
(1 998) - - -- -
University of Alberta
(1 999)
University of
Missouri - Rolla
Specimer
C50x2 C50x3 C75x3 C l 00x3
C2-2 C2-3 C3-2 C3-3 C4-2 C4-3 C4-4
CBN11-1 CBN11-2 CCN11-1 CCN11-2 CBN31-1 CBN31-2 CCN31-1 CCN31-2
Size [mm1
- No, of
bolt: - 2 3 3 3 2 3 2 3 2 3 4 2 2 3 3 2 2 3 3 -
Bolt Size
[mml 12.7 12.7 15.9 19.1 - 19.1 19.1 l 9 , l 19.1 19.1 19.1 19.1 - I2 , ï 12.7 12.7 12.7 12.7 12.7 12.7 12.7
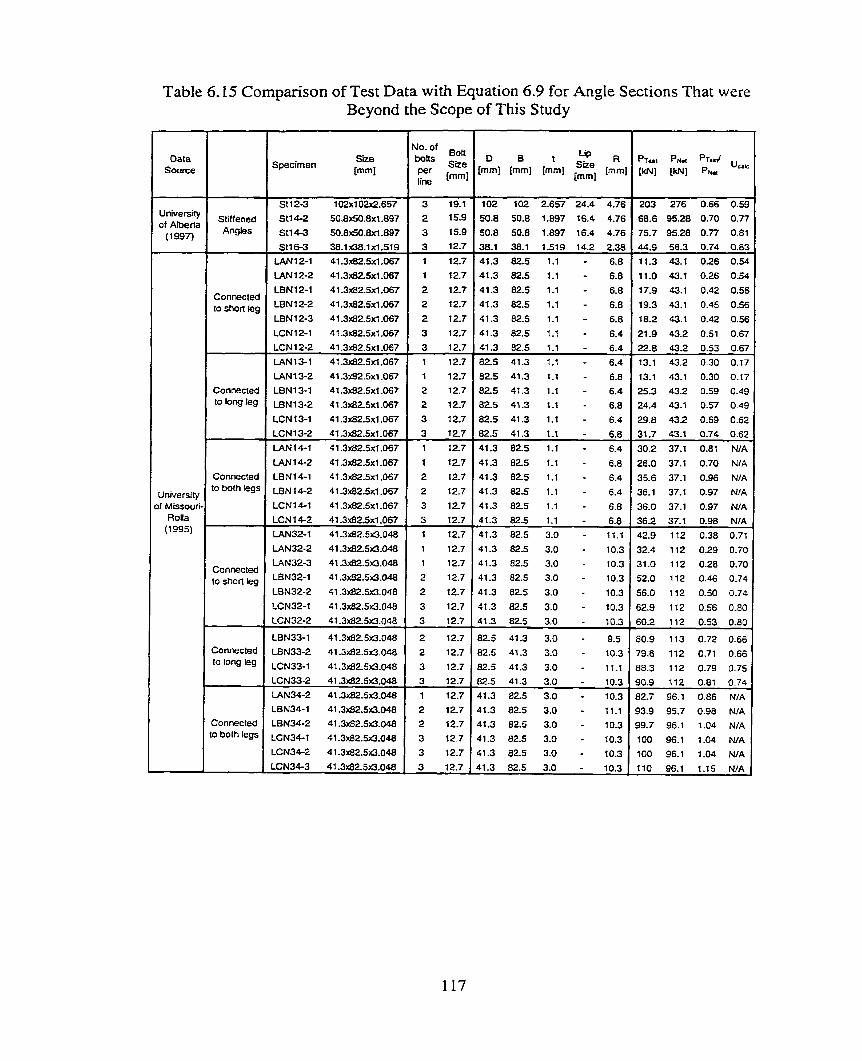
Table 6.15 Cornparison of Test Data with Equation 6.9 for Angle Sections That were
Data Source
University of Alberta
(1 997)
--
University ~f Missouri
Rolla (1 995)
Stiifened Angles
Connected to shoR k g
Connected to long leg
Connected to bolh legs
- --
Connected to short leg
Corinected to long ieg
Connected :O both legs
- Beyond the Scope of This Study
Specimen S i e [mm1
s t i 4-2 so.8Xso.axi .897
Stl4-3 5O.8fiO.8xl.897
Stl6-3 38.1~.1x1.519
U N 1 2-1 41.3~B2.5~1 .O67
LAN12-2 4 l .3SSxl .O67
LBN 12-1 41.362.5xl .O67
LBN12-2 41.3JB2.5x1 .O67
LBNl2-3 41.3d25xl .O67
LCN12-1 4l.362.5~1 .O67
LCN 12-2 41.3d2.5~1 .O67
LAN 1 3- 1 41.3d2.5x1.067
LANI 3-2 41.3d2.5~1 .O67
LBN13-1 41.3~ô2.5~1.067
LBN13-2 41 -362.5~1 .O67
LCN13-1 41.362.5~1 .O67
LCN 13-2 41.3B?Sxl.O67
LANI 4-1 41.3mzs~i -067
LAN14-2 41.3JB2.5~1.067
LBN14-1 4l.362.5xl.O67
LBN 14-2 41.3d2.5xl.067
LCN14-1 41.3~82.5~1 .O67
LCN 14-2 41.3~82.5~1 .O67
LAN32-1 41.3d2.5û.048
LAN32-2 41 .362.5û.048
LAN32-3 41.3>632.56.048
LBN32-1 41.3~82.56.048
LBN32-2 41.3~82.5fl.048
LCN32-1 41.3~82.S>c3.048
No. of Bott
'Otts Size per
[mm] fine
3 19.1
2 15.9
3 15.9
3 12.7
1 12.7
1 12-7
2 12.7
2 12.7
2 12.7
3 127
3 12.7
1 12.7
1 12.7
2 12.7
2 12-7
3 122
3 12.7
1 12.7
1 12.7
2 12.7
2 12.7
3 12.7
3 12.7
1 12.7
1 12.7
1 12.7
2 12.7
2 12.7
3 12.7
3 12.7
2 12.7
2 12.7
3 12.7
3 12.7
1 12.7
2 12.7
2 12.7
3 12-7
3 12.7
3 12.7
' 26.0 37.1 0.70 NIA 1 35.6 37.1 0.96 NIA
36.1 37.1 0.97 NIA
36.0 37.1 0.97 NIA
36.2 37.1 0.98 NIA
42.9 112 0.38 0.71
32.4 112 0.29 0.70
31.0 112 0.28 0.70
52.0 112 0.46 0.74
56.0 112 0.50 0.74
62.9 112 0.56 0.80
60.2 112 0.53 0.80
80.9 113 0.72 0-66
79.6 112 0.71 0.66
88.3 112 0.79 0.75
82.5 41.3 1 - 6.8
41.3 82.5 1.1 - 6.4
z:: il.: i3 ; 10-3 90.9 112 0.81 0-74
10.3 82.7 96.1 0.86 NIA
41.3 82.5 11.1 93.9 95.7 0.98 NIA 41.3 82.5 3.0 10.3 99.7 96.1 1.04 NIA
41.3 82.5 3.0 10.3 100 96.1 1.04 N/A
41.3 82.5 3.0 10.3 100 96-1 1.04 N/A
31.7 43.1 0.74 0.62
30.2 37.1 0.81 NIA
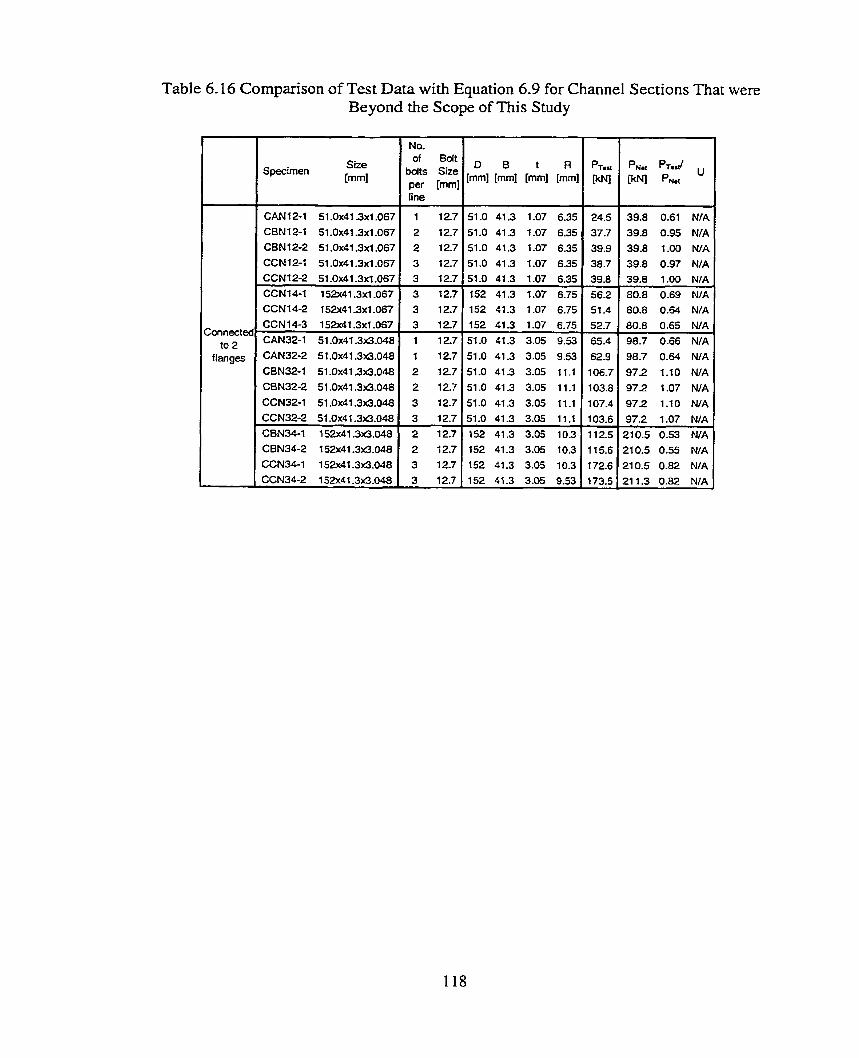
Table 6-16 Cornparison of Test Data with Equation 6.9 for Channel Sections That were Beyond the scope of This Study
1 No.
Size I of Bdt S pecimen bdts Size
[mm1 Per mm1
CAN 1 2-1 51.0~41.3xl .O67
CBN12-1 51.0~41.3Xl .O67
CBN12-2 51.0~41.3~1 .O67
CCNl2-1 51.0~41.3xl .O67
80.8 0.64 NIA
80.8 0.65 NIA
987 0.66 N/A
98.7 0.64 NIA
972 1.10 NIA
97.2 1.07 NIA
97.2 1-10 N/A
9 7 2 1-07 NIA
210.5 0.53 N/A 210.5 0.55 N/A
210.5 0.82 NIA
21 1.3 0.82 NIA
Iine
1 12.7
2 12.7
2 12.7
3 12.7
51.0 41.3 1.07 6.35 39.8 152 41.3 1.07 6.75 56.2
CCN12-2 51 .0~41.3~1.0ôï 3 12.7
CCN14-1 152~41.3~1.067 3 12.7 CCN14-2 152~41.3xl.067 3 127
39.8 1.00 NIA
80.8 0.69 N/A
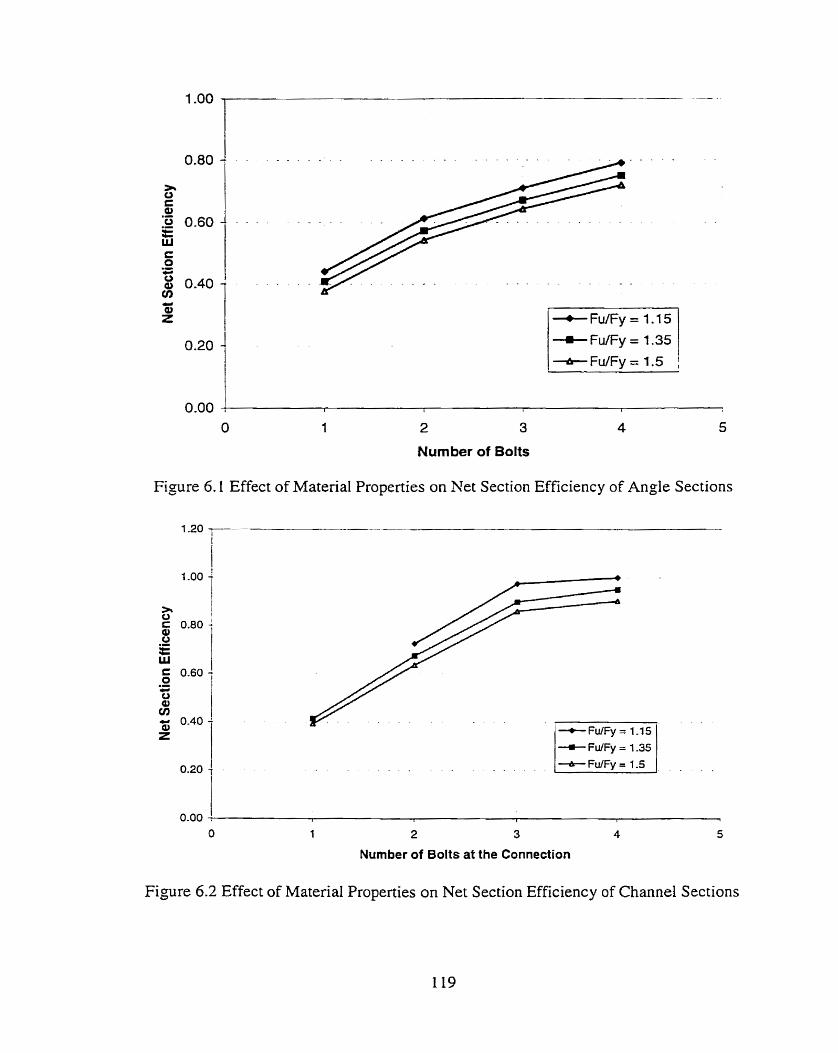
O 1 2 3 4 5
Num ber of Bolts
Figure 6.1 Effect of Material Properties on Net Section Efficiency of Angle Sections
f 0.00 . O
, 1 2 3 4 5
Number of Bolts at the Connection
Figure 6.2 Effect of Material Propenies on Net Section Efficiency of Channel Sections
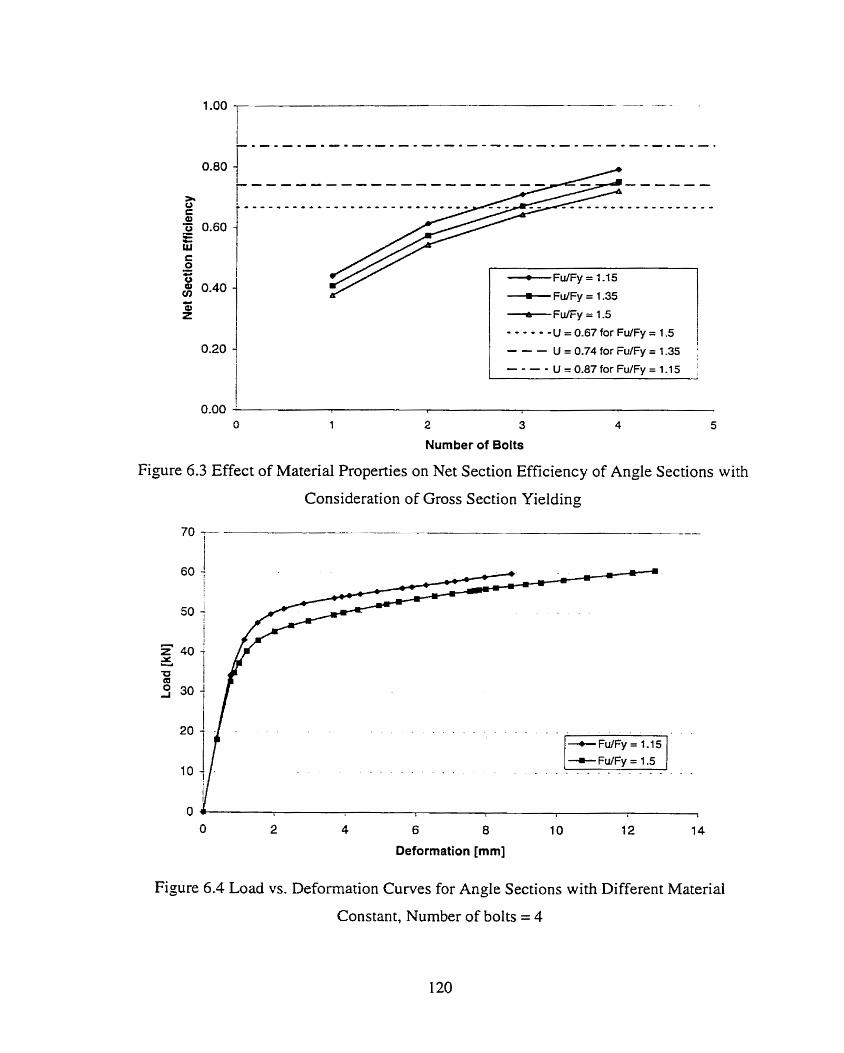
-FldFy = 1.5 - - - * - - U = 0.67 for FufFy = 1.5
- - -U=0 .74 fo rFdFy= l . 35 1 - - - - U = 0.87 for FdFy = 1.1 5
1 0.00 '
O 1 2 3 4 5
Number of BoIts
Figure 6.3 Effect of Material Properties on Net Section Efficiency of Angle Sections with
Consideration of Gross Section Yielding
-e- FdFy = 1.5 . - a . - - - . - - . . .
Deformation [mm]
Figure 6.4 Load vs. Deformation Curves for Angle Sections with Different Marerial
Constant, Number of bolts = 4
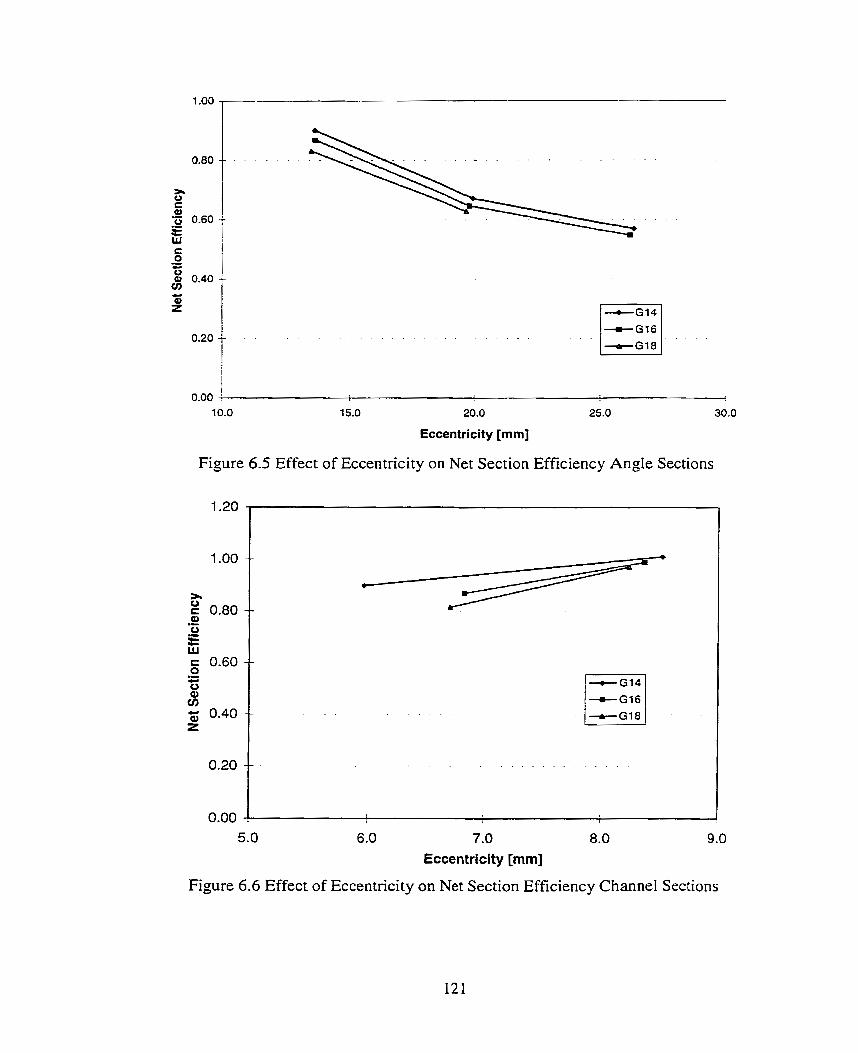
15.0 20.0 25.0
Eccentricity [mm]
Figure 6.5 Effect of Eccentricity on Net Section Efficiency Angle Sections
5.0 6.0 7.0 8.0 9.0
Eccentricity [mm]
Figure 6.6 Effect of Eccentricity on Net Section Efficiency Channel Sections
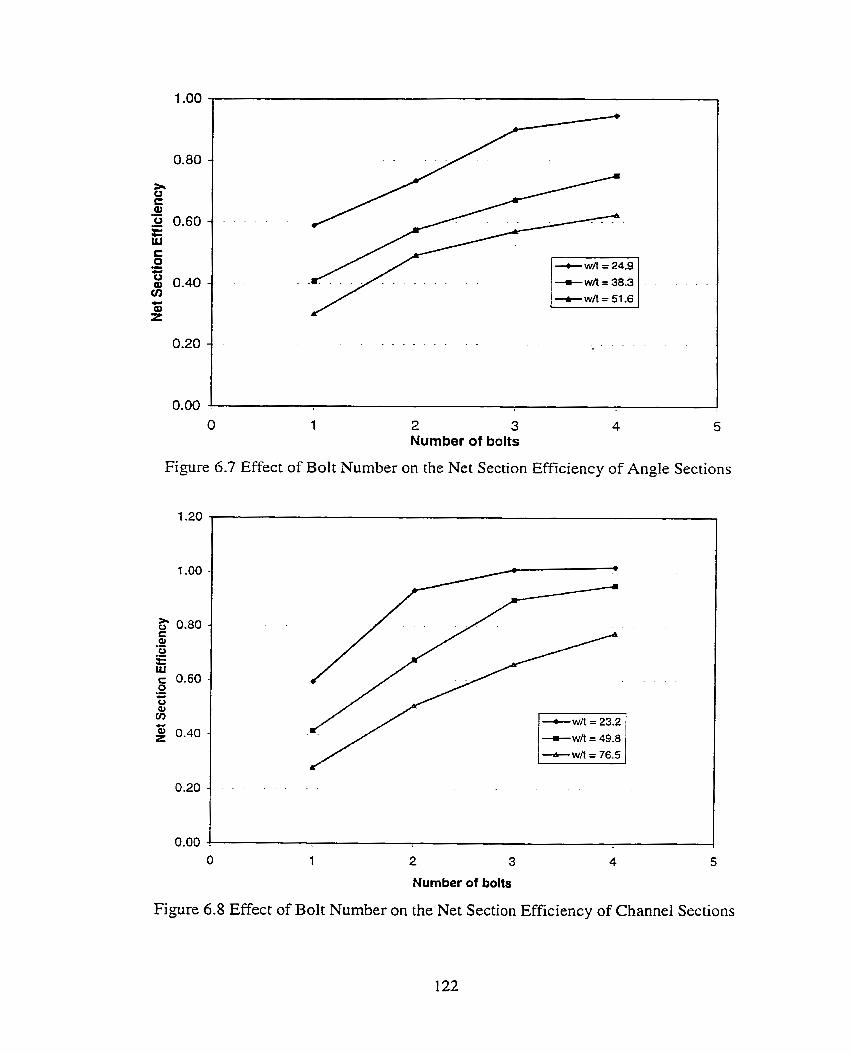
2 3 Number of bolts
Figure 6.7 Effect of Bolt Number on the Net Section Efficiency of Angle Sections
2 3
Number of bolts
Figure 6.8 Effect of Bolt Number on the Net Section Efficiency of Channel Sections
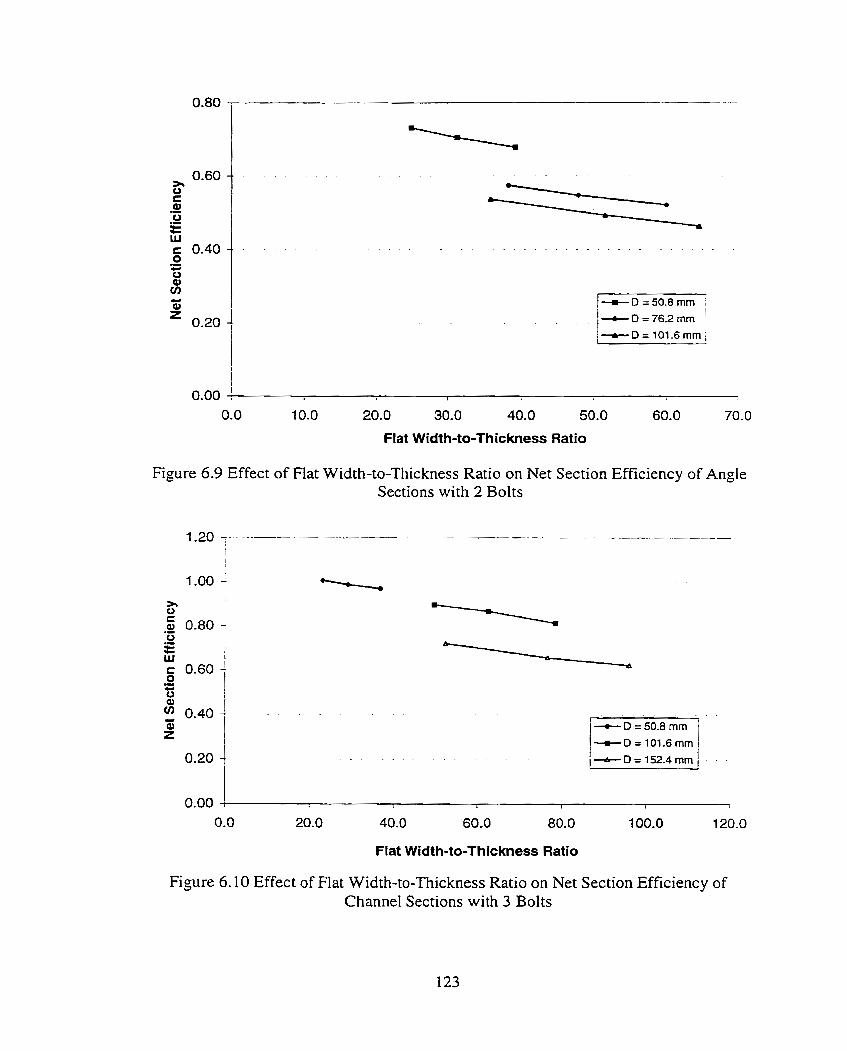
20.0 30.0 40.0 50.0
Flat Width-to-Thickness Ratio
Figure 6.9 Effect of Hat Width-to-Tliickness Ratio on Net Section Efficiency of Angle Sections with 2 Bolts
Flat Width-to-Thickness Ratio
Figure 6.10 Effect of Flat Width-to-Thickness Ratio on Net Section Efficiency of Channel Sections with 3 Bolts
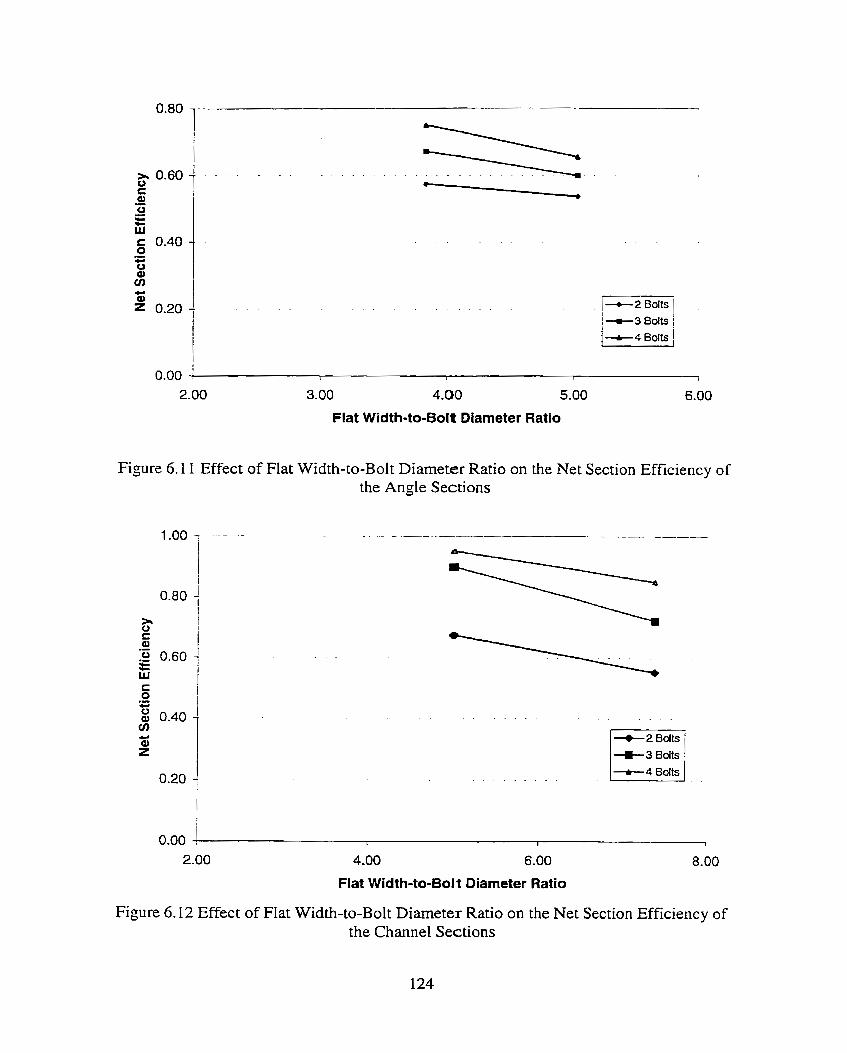
14-4 Bolts
3.00 4.00 5.00
Flat Width-to-Bolt Diameter Ratio
Figure 6.1 1 Effect of Flat Width-to-Bolt Diarneter Ratio on the Net Section Efficiency of the Angle Sections
+ 3 Bolts
-+-4 Bolts
4.00 6.00
Flat Width-to-Bolt Diarneter Ratio
Figure 6.12 Effect of Flat Width-to-Bolt Diameter Ratio on the Net Section Efficiency of the Channel Sections
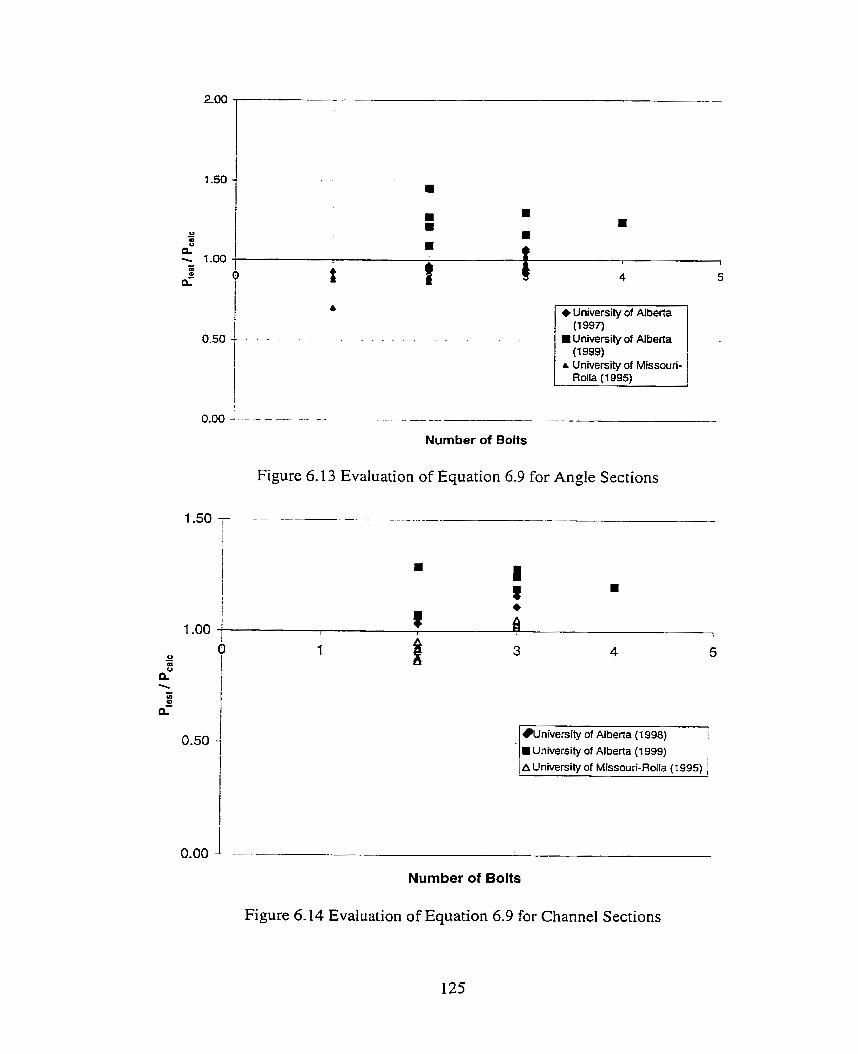
(1 997) I University of Alberta
(1 999) A University of Missouri-
Number of Bolts
Figure 6.13 Evaluation of Equation 6.9 for Angle Sections
University of Alberta (1 998) I
- 1 H University of Alberta (1 999) 1 1 A University of Missouri-Rolla (1 99s)
0.00
Number of Bolts
Figure 6.14 Evaluation of Equation 6.9 for Channel Sections
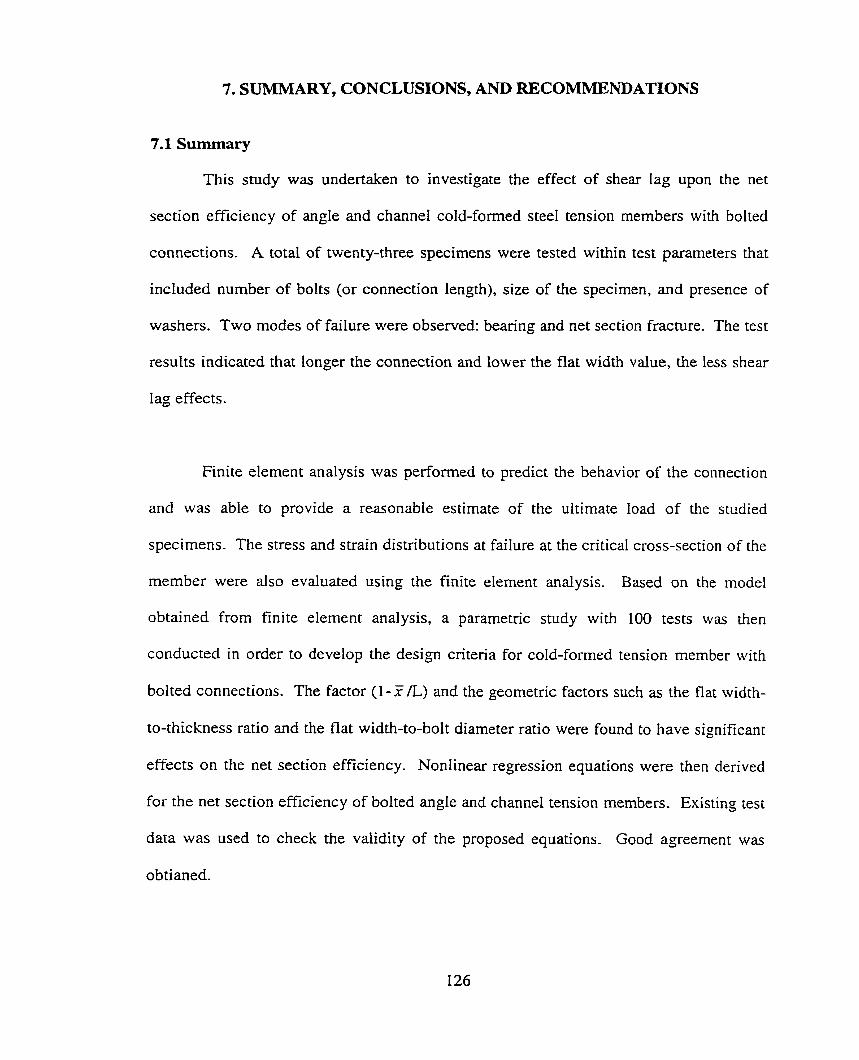
7. SUMMARY, CONCLUSIONS, AND RECOMMENDATIONS
7.1 Summary
This study was undertaken to investigate the effect of shear lag upon the net
section efficiency of angle and channel cold-formed steel tension members with bolted
connections. A total of twenty-three specimens were tested within test parameters that
included number of bolts (or connection length), size of the specimen, and presence of
washers. Two modes of failure were observed: bearing and net section fracture. The test
results indicated that Longer the connection and lower the flat width value, the less shear
lag effects.
Finite elernent analysis was performed to predict the behavior of the connection
and was able to provide a reasonable estimate of the ultimate load of the studied
specimens. The stress and strain distributions at failure at the critical cross-section of the
member were also evaluated using the finite element analysis. Based on the mode1
obtained from finite element analysis, a parametric study with 100 tests was then
conducted in order to develop the design criteria for cold-fonned tension member with
bolted connections. The factor (1-TL) and the geometric factors such as the flat width-
to-thickness ratio and the flat width-to-bolt diameter ratio were found to have significant
effects on the net section efficiency. Nonlinear regression equations were then derived
for the net section efficiency of bolted angle and channel tension members. Existing test
data was used to check the validity of the proposed equations. Good agreement was
obtianed.
7.2 Conclusions
Based on the study presented herein and together with the results obtained by
others, it c m be concluded that:
The net section efficiency of both bolted angle and channel members in tension is
affected by the connection length and cross-sectional geometry if only one element in
the sections is connected by fasteners;
The factors found to have significant effects on the net section efficiency include
eccentricity, connection length, slendemess of connected elements, size of bolt, and
length of unconnected elements relative to Iength of connected element;
The amount of torque applied when tightening the bolt has been found to have effect
on the net section fracture capacity of the connection and further investigation is
required;
- X
The Munse and Chesson's net section efficiency equation, (U = 1 --) , was not able L
to provide a good prediction for the cold-formed angle sections with flat width-to-
thickness ratio, w/t, greater than 30 and flat width-to-bolt diameter ratio, wld, greater
than 2.5, and for the channel sections with wlt ratio greater than 40 and wld ratio
greater than 5.
When there are two or more bolts in the line of force, it has been shown that Eqs. 6.2
and 6.3 accurately predict the net section efficiencies of equal leg angle members and
channel members connected at the web, respectively.
For the cases with only one bolt in the line of force, Eqs. 6.6 and 6.7 are a good
predictor for predicting the net section efficiencies of equal leg angle sections and
channel sections connected at the web.
7. The available test results aIso indicate that the proposed net section efficiency
equations can also be used for the stiffened sections and unequal leg angles with long
leg connected. Further tests and analyses, however, are desirable in order to confirrn
these conclusions.
7.3 Design Recommendations of Net Section Fracture for Bolted Coid-Formed
Members in Tension
For bolted cold-formed members, the factored tensile resistance, T,, shall be taken
as the lesser of
a) Tr = @A&,
b) Tr = @uAneFu
where $ = resistance factor for gross yielding, taken as 0.9
$u = tensiie fracture resistance factor, taken as 0.75
Fy = specified yield strength
Fu = specified ultimate strength
A, = gross cross-sectional area
A,, = effective net area accounting for shear lag
The effective net area c m be calculated as follows:
A,, = UA, 17.31
where A. = critical net area at a potential fracture section, calculated by reducing hole
area from the gross area and the hole diameter is taken as 2 mm larger than
the nominal size of bolt
U = net section efficiency factor to be determined as follows:
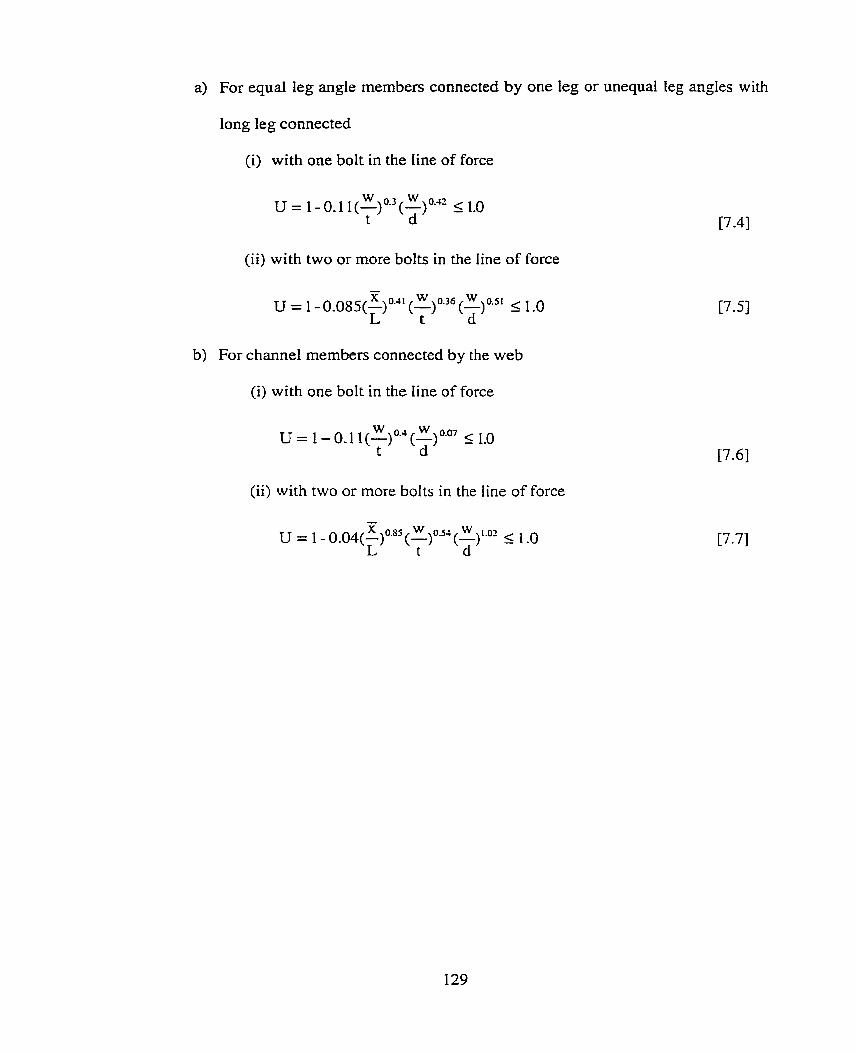
a) For equal k g angle rnembers connected by one leg or unequal leg angles with
long leg connected
(i) with one bolt in the Iine of force
(ii) with two or more bolts in the line of force
b) For channel members connected by the web
(i) with one bolt in the line of force
(ii) with two or more bolts in the line of force
American Institute of Steel Construction (1993). Load and Resistance Factor Design Specification for Structural Steel Buildings. Chicago, Illinois.
Amencan Iron and Steel Institute (1996). Specification for the Design of Cold-Formed S tee1 Structural Members. Washington, D.C..
American Society for Testing and Materials (1997). A370 Standard Test Methods and Definitions for Mechanical Testing of Steel Products. ASTM, PhiladeIphia, PA..
Canadian Standards Association (1 994). CAN/CSA-S 16.1-94 -- Limit States Design of Steel Structures. Canadian Standards Association, Rexdale, Ontario.
Canadian Standards Association ( 1994). CANKS A-S 1 36-94 - Cold-Formed S tee1 Structural Members. Canadian Standards Association, Rexdale, Ontario.
Canadian Standards Association (1997). CAN/CSA-G40.21-97 - Stmctural Qualitv SteeIs. Canadian Standards Association, Rexdale, Ontario.
Chong, K. P. and Matlock, R. B. (1975). "Light-Gage Steel Bolted Connections without Washers." Journal of Structural Division, ASCE, Vol. 10 l(7), pp. 138 1-1 392.
Cheng, J, J. R., Grondin, G. Y., and Takai, N. (1998). "Shear Lat; Effects on BoIted Cold- Formed Steel Angles in Tension." Proceedings of the Canadian Society of Civil Engineers Conference, Halifax, Nova Scotia, Vol. 3, pp. 147- 156.
Cheng, J. J. R., Grondin, G. Y., and Estabrooks, B. (1999). "Shear Lag Effects on Bolted CoId-Formed Steel Channels in Tension." Proceedings of the Canadian Society of Civil Engineers Conference, Regina, Saskatchewan, Vol. 1, pp. 335-344.
Chesson, E. and Munse, W. H. (1963). "Riveted and Bolted Joints: Truss Type Tensile Connections." Journal of the Structural Division, ASCE, Vol. 89(1), pp. 67-106.
Chesson, E. and Munse, W. H. (1963). "Riveted and Bolted Joints: Net Section Design." Journal of the Structural Division, ASCE, Vol. 89(1), pp. 107-126.
Gilchnst, R. T. Ir. and Chong, K. P. (1979). "Thin Light-Gage Bolted Connections without Washers." Journal of Structural Division, ASCE, Vol. 105(1), pp. 175-184.
Hibbitt, Karlsson, & Sorenson, Inc. (HKS) (1997a). ABAQUSIStandard, Version 5.7-1 (Cornputer Software). Hibbitt, Karlsson, & Sorenson Inc., Pawtucket, Rhode Island.
Hibbitt, Karlsson, & Sorenson, Inc. (HKS) (1997b). ABAOUS/Standard Theorv Manual. Version 5.7. Hibbitt, Karlsson, & Sorenson Inc., Pawtucket, Rhode IsIand.
Hibbitt, Karlsson, & Sorenson, Inc. (HKS) (1997~). ABAQUS/Standard User's Manual. Version 5.7. Hibbitt, Karlsson, & Sorenson Inc., Pawtucket, Rhode Island.
Kennedy, J. B. and Sinclair, G. R. (1969). "Ultimate Capacity of Single Bolted Angle Connections." Journal of the Structural Division, ASCE, Vol. 95(8), pp. 1645-1660.
Kulak, G. L., Adams, P. F., and Gilmor, M. 1. (1995). Limit States Design in Structural Steel. Fifth Edition, CISC, Alliston, Ontario.
Kulak, G. L., Fisher, J. W., and Struik, J. H. A. (1987). Guide to Desicrn Criteria for Bolted and Riveted Joints- John Wiley and Sons, New York, N. Y., pp. 99-100.
LaBoube, R. A. and Yu, W. W. (1995). "Tensile and Bearing Capacities of Bolted Connections." Final Summary Report, University of Missouri-Rolla, Rolla, Missouri.
March, C. (1969). "Single Angles in Tension and Compression." Journal of Structural Division, ASCE, Vol. 95(5), pp. 1043-1049.
McKibben, F. P. (1906). "Tension Tests of Steel Angles." Proceedings of the ASTM, Vol. 6, pp. 267-274.
McKibben, F. P. (1907). "Tension Tests of Steel Angles with Various Types of End- connections." Proceedings of the ASTM, Vol. 7, pp. 287-295.
Nelson, H. M. (1953). "Angles in Tension." Publication No. 7, British Constructional Steelwork Association, UK, pp. 8- 18.
SPSS, Inc. (1999). Sigrnaplot 5.0 (cornputer software). SPSS Inc., Chicago, Illinois.
Winter, G. (1956). "Tests on Bolted Connections in Light Gage Steel." Journal of the Structural Division, ASCE, Vol. 82(2), pp. 92 1-925.
Wu, Y. and Kulak, G. L. (1993). Shear L ~ P : in BoIted Single and Double Angle Tension Members. Structural Engineering Report 187, Department of Civil Engineering, University of Alberta, Edmonton, Alberta.
Young, C . R. (1935). Elementarv Structural Problems in Steel and Timber. John Wiley and Sons, New York, N. Y., pp. 7.
Yu, W. W. (199 1). Cold-Formed Steel Desiun. Second Edition, John Wiley and Sons, New York, N. Y..
APPENDIX A
LOAD VS. DEFORMATION CURVES FOR THE TEST SPECIMENS
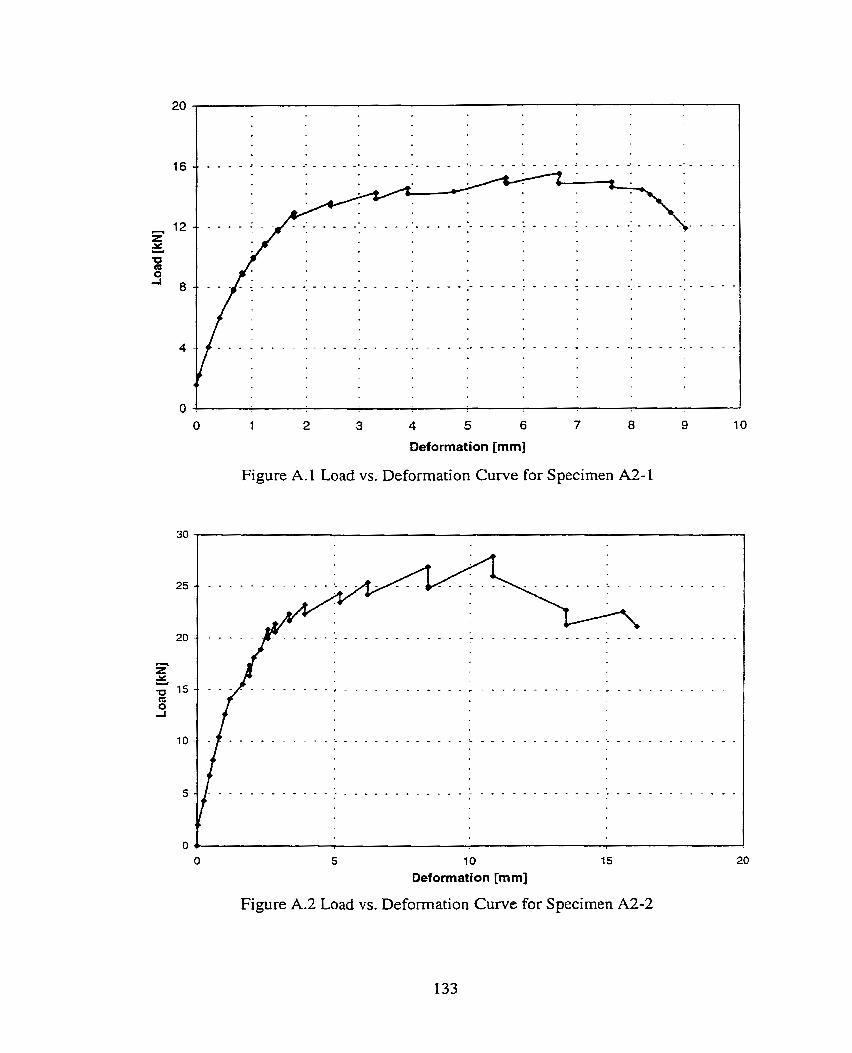
Deformation [mm]
Figure A. 1 Load vs. Deformation Curve for Specimen A2-1
Figure A.2 Load vs. Deforrnation Curve for Specimen A2-2
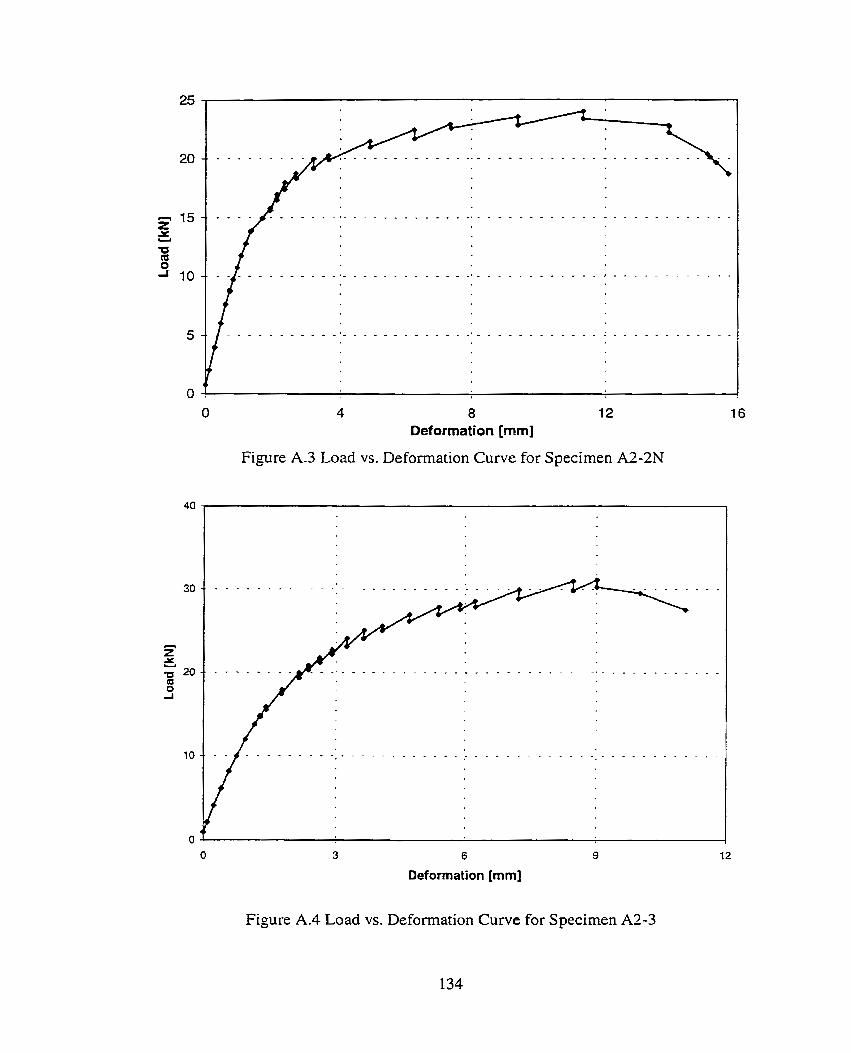
8 Deformation [mm]
Figure A.3 Load vs. Deformation Curve for Specimen A2-ZN
6
Deformation [mm]
Figure A.4 Load vs. Deformation Curve for Specimen A2-3
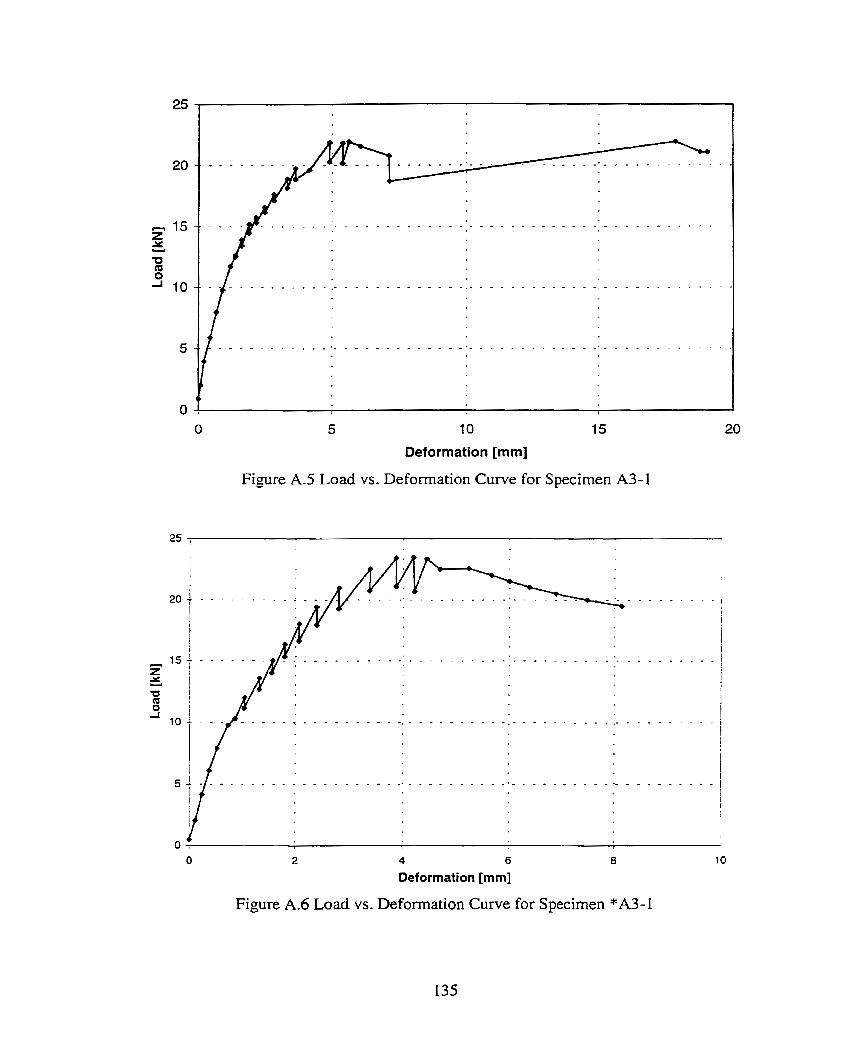
Deformation [mm]
Figure A S Load vs. Deformation Curve for Specimen A3-1
Figure A.6 Load vs. Deformation Curve for Specimen *A34
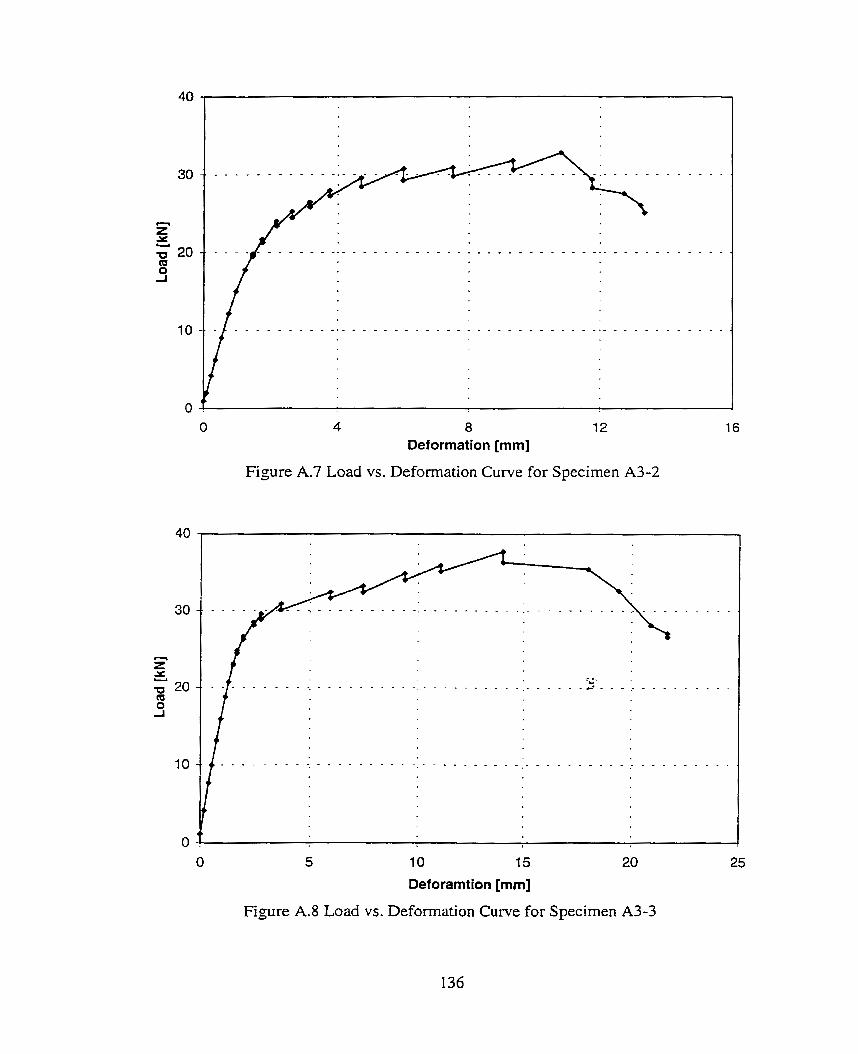
8 Deformation [mm]
Figure A.7 Load vs. Defornation Curve for Specimen A3-2
10 15
Deforamtion [mm]
Figure A.8 Load vs. Deformation Cuve for Specimen A3-3
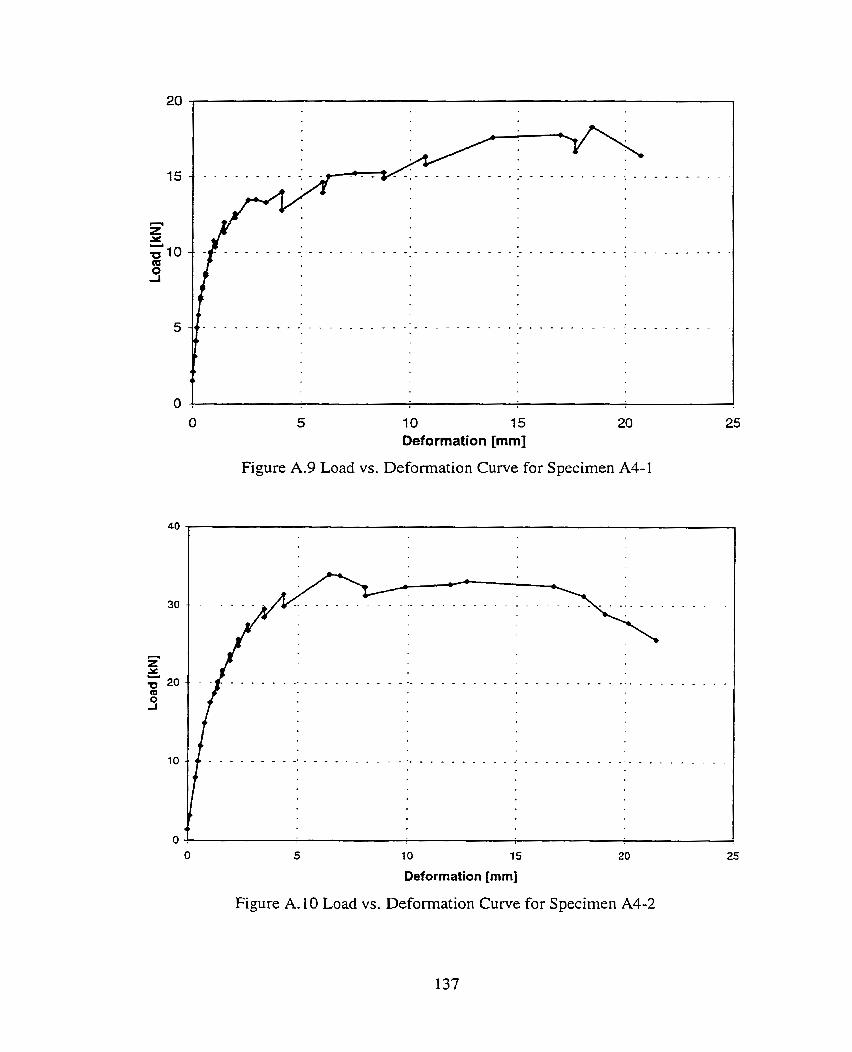
Figure A.9 Load vs. Deformation Curve for Specimen A4-1
5 10 15 20
Deformation [mm]
Figure A. 10 Load vs. Deformation Curve for Specimen A4-2
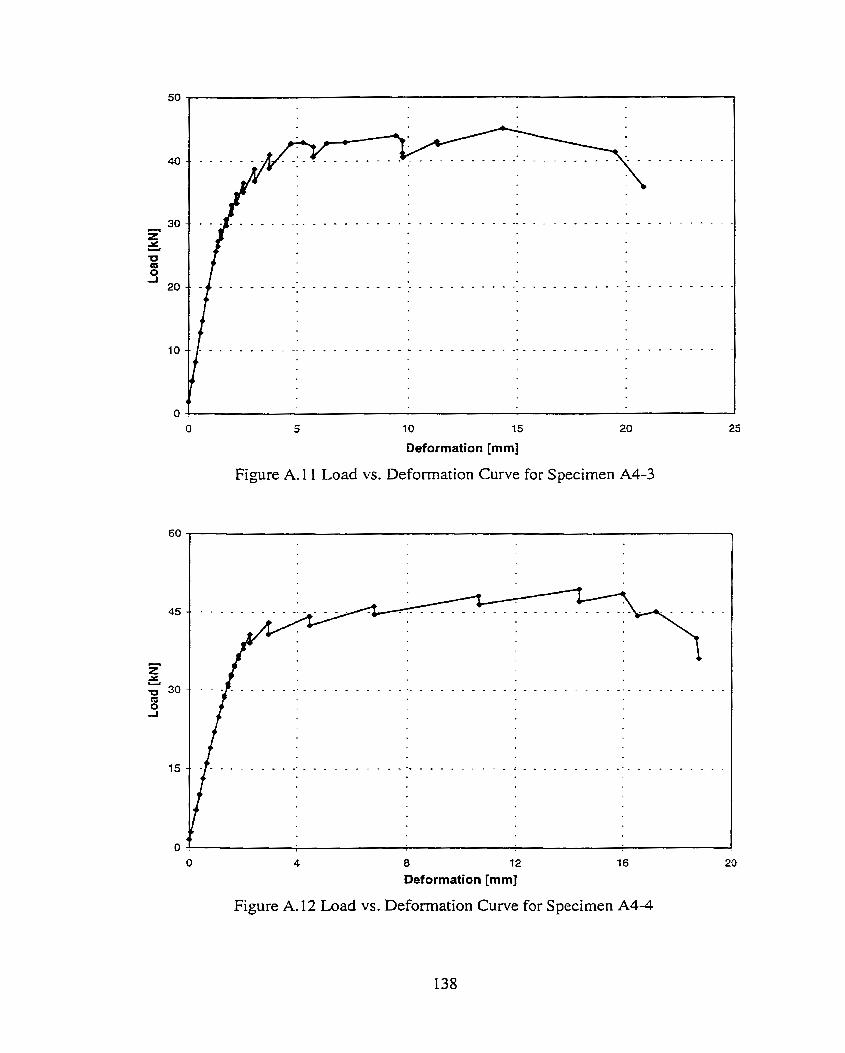
10 15
Deformation [mm]
Figure A. 1 1 Load vs. Deformation Curve for Specimen A4-3
8 12
Def ormation [mm]
Figure A. 12 Load vs. Deformation Curve for Specimen A 4 4
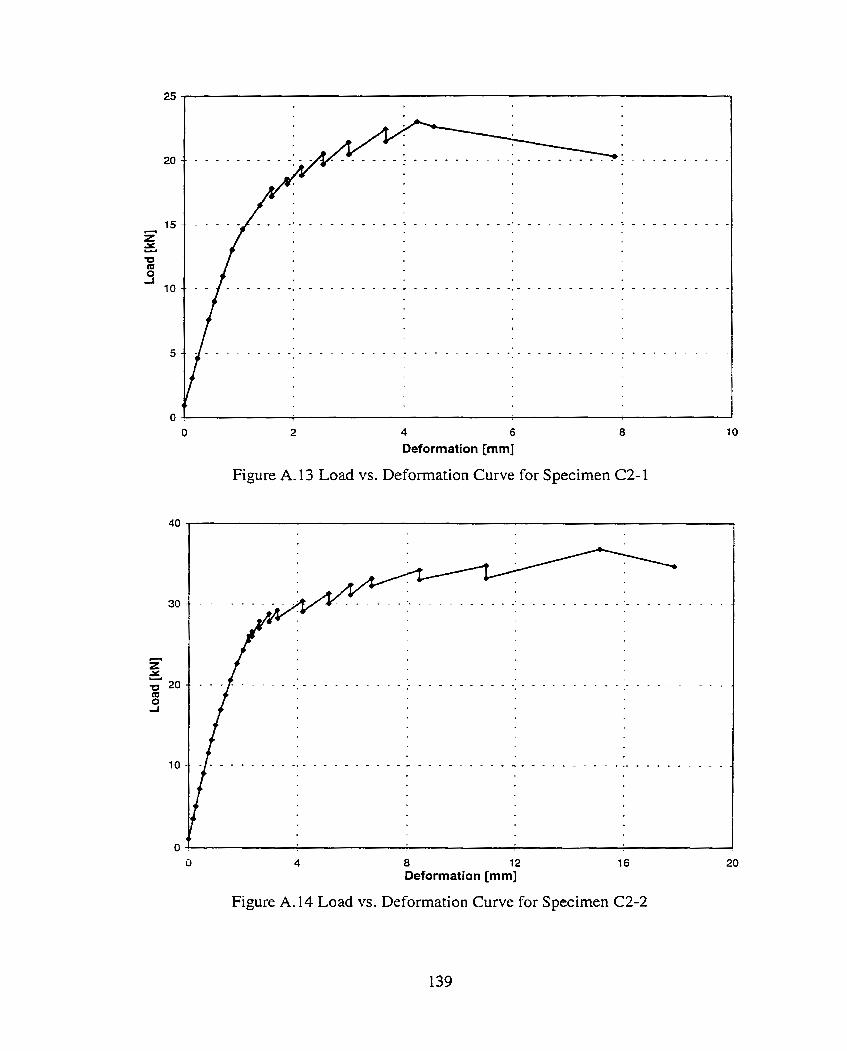
Figure A. 14 Load vs. Deformation Curve for Specimen C2-2
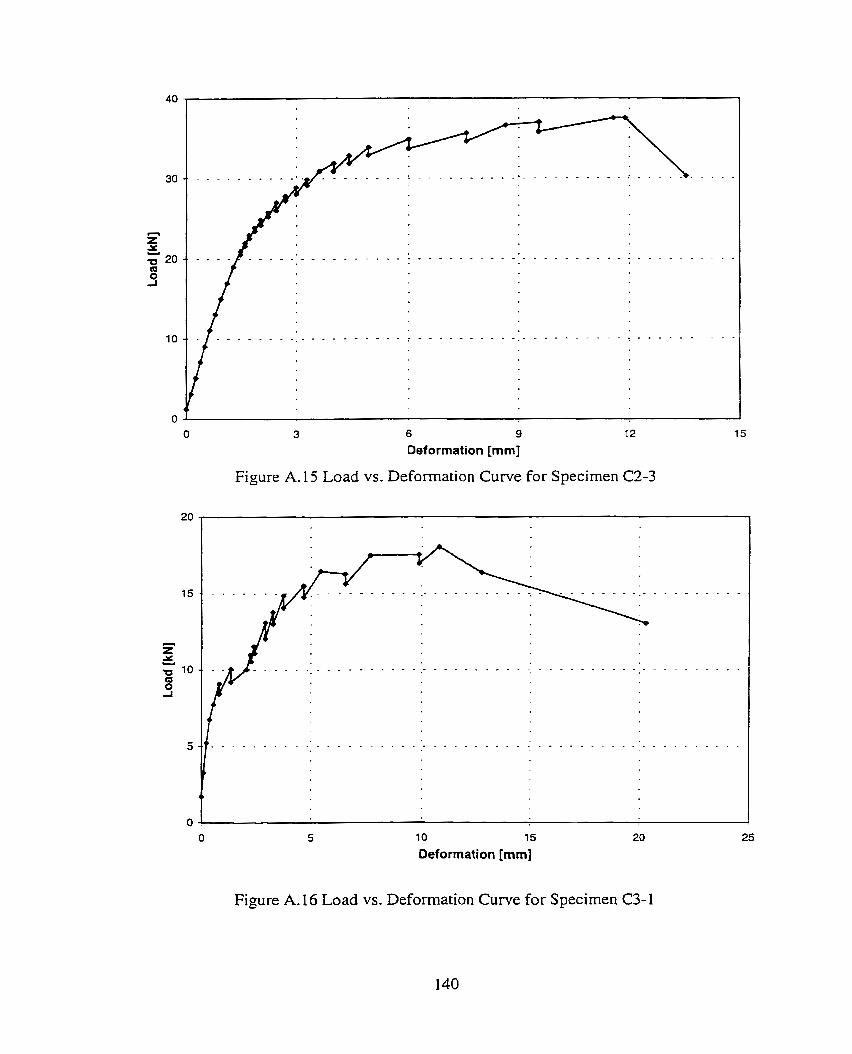
Figure A. 15 Load vs. Deformation Curve for Specimen C2-3
Figure A. 16 Load vs. Deformation Curve for Specimen C3- 1
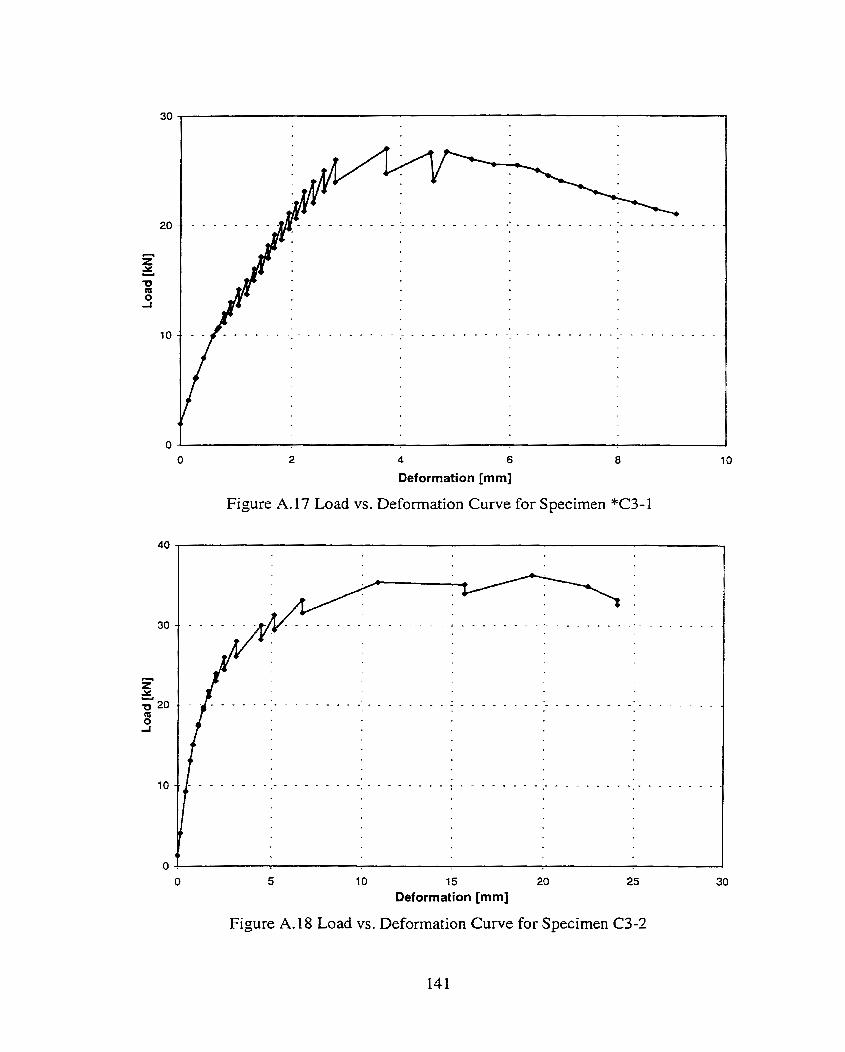
4 6
Deformation [mm]
Figure A. 17 Load vs. Deformation Curve for Specimen *C3-I
Figure A. 18 Load vs. Deformation Curve for Specimen C3-2
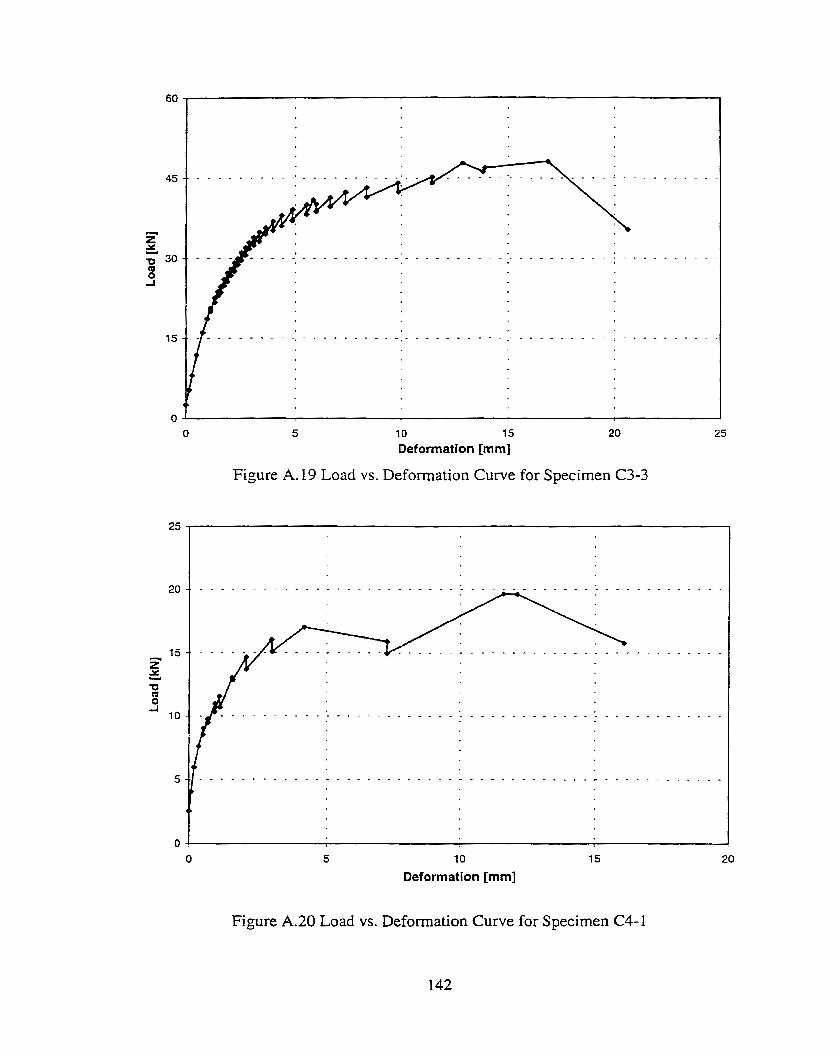
Deformation [mm]
Figure A. 19 Load vs. Deformation Curve for Specimen C3-3
1 O
Deformation [mm]
Figure A.20 Load vs. Deformation Curve for Specimen C4-1
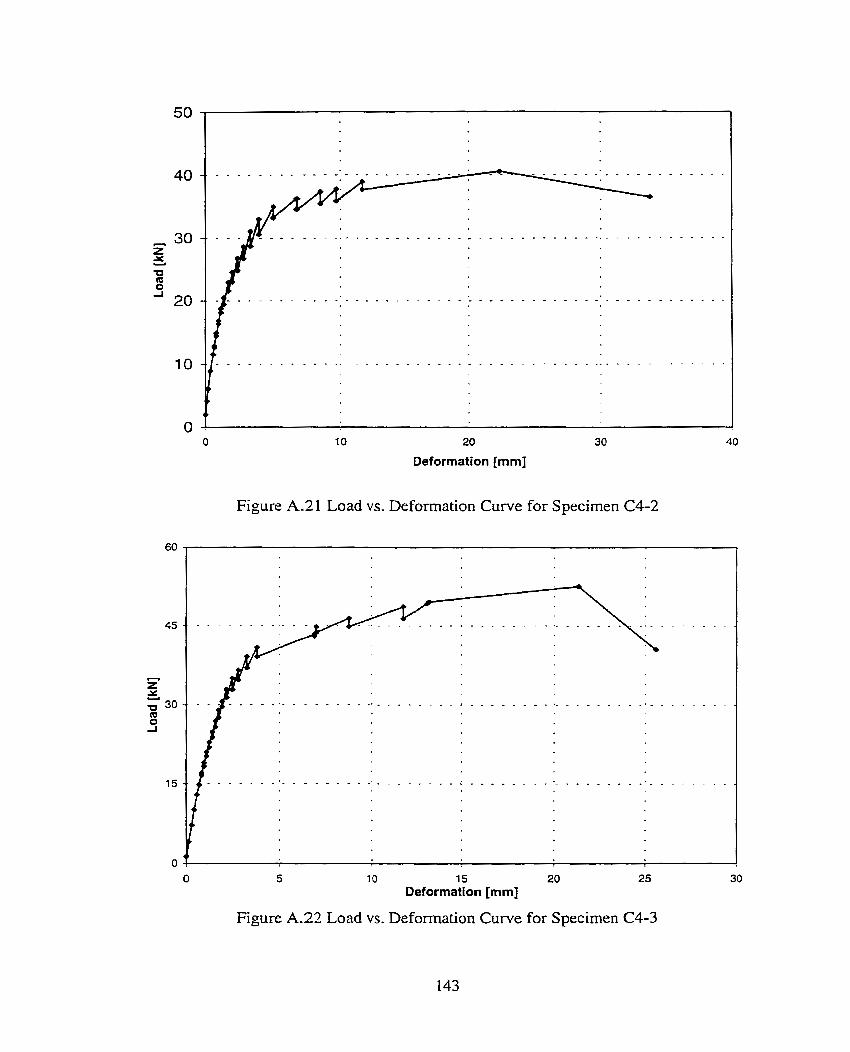
20
Deformation [mm]
Figure A.21 Load vs. Defomation Curve for Specimen C4-2
1 O 15 20 Deformation [mm]
Figure A.22 Load vs. Deformation Curve for Specimen C4-3
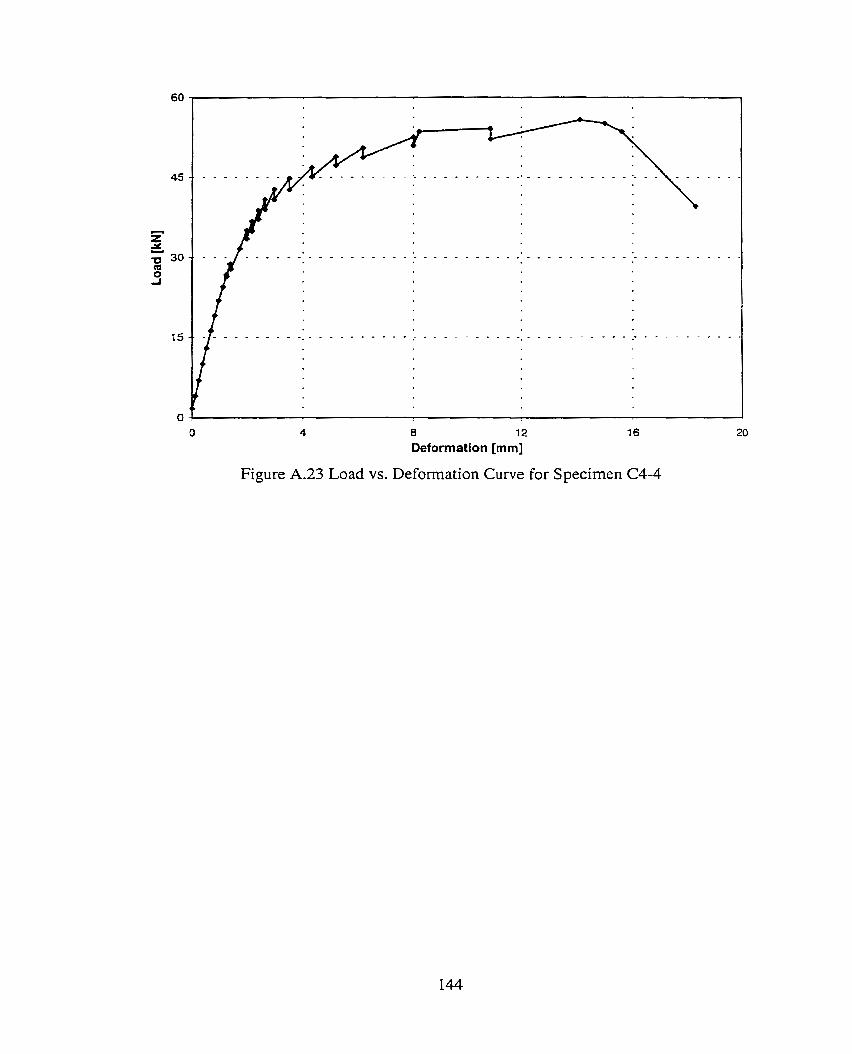
8 12
Deformation [mm]
Figure A.23 Load vs. Deformation Curve for Specimen C4-4
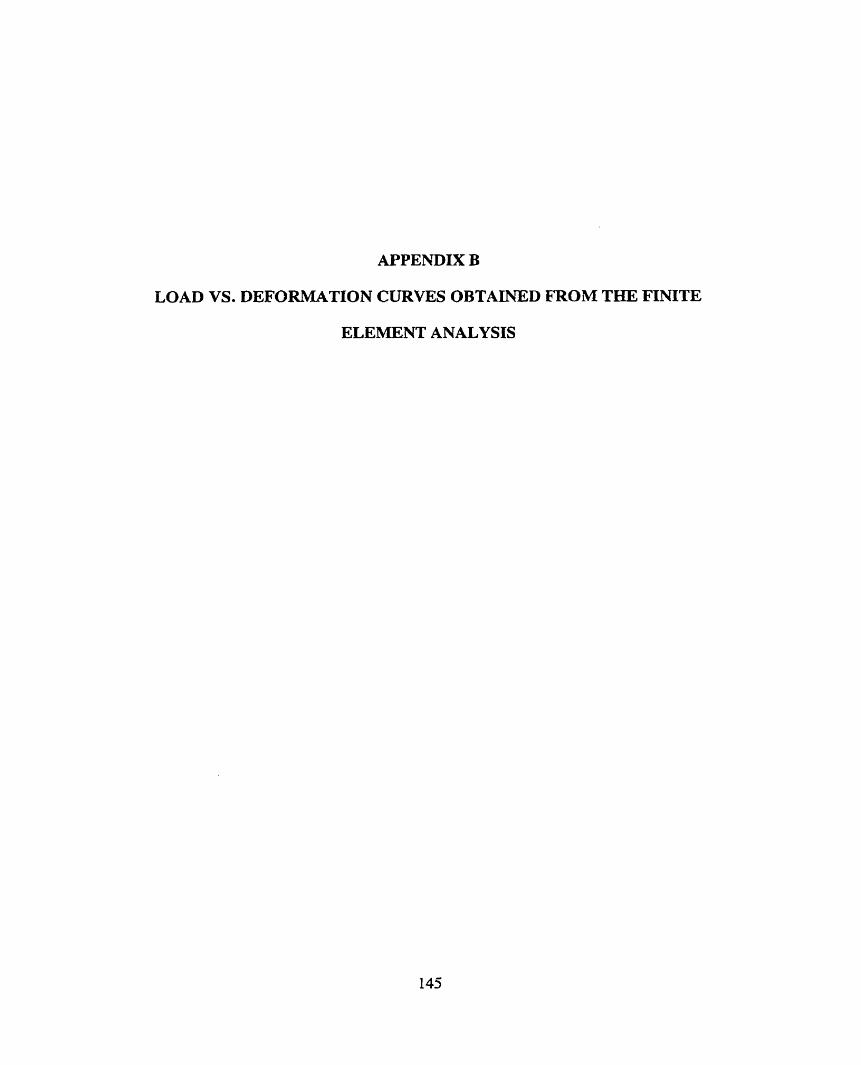
APPENDIX B
EOAD VS. DEFORMATION CURVES OBTAIh'lED E'ROM THE FINITE
ELEMENT ANALYSIS
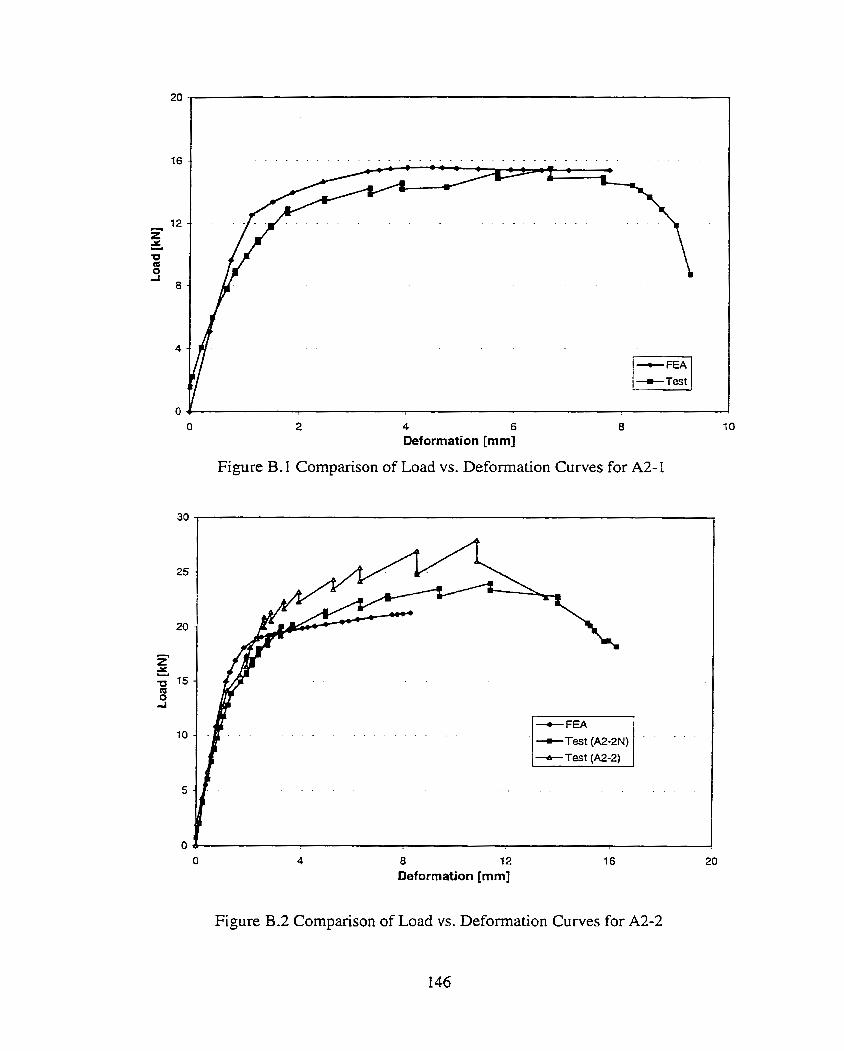
4 6 Deformation [mm]
Figure B. 1 Comparison of Load vs. Deformation Curves for A24
8 12 Deformation [mm J
Figure B.2 Comparison of Load vs. Deformation Curves for A2-2
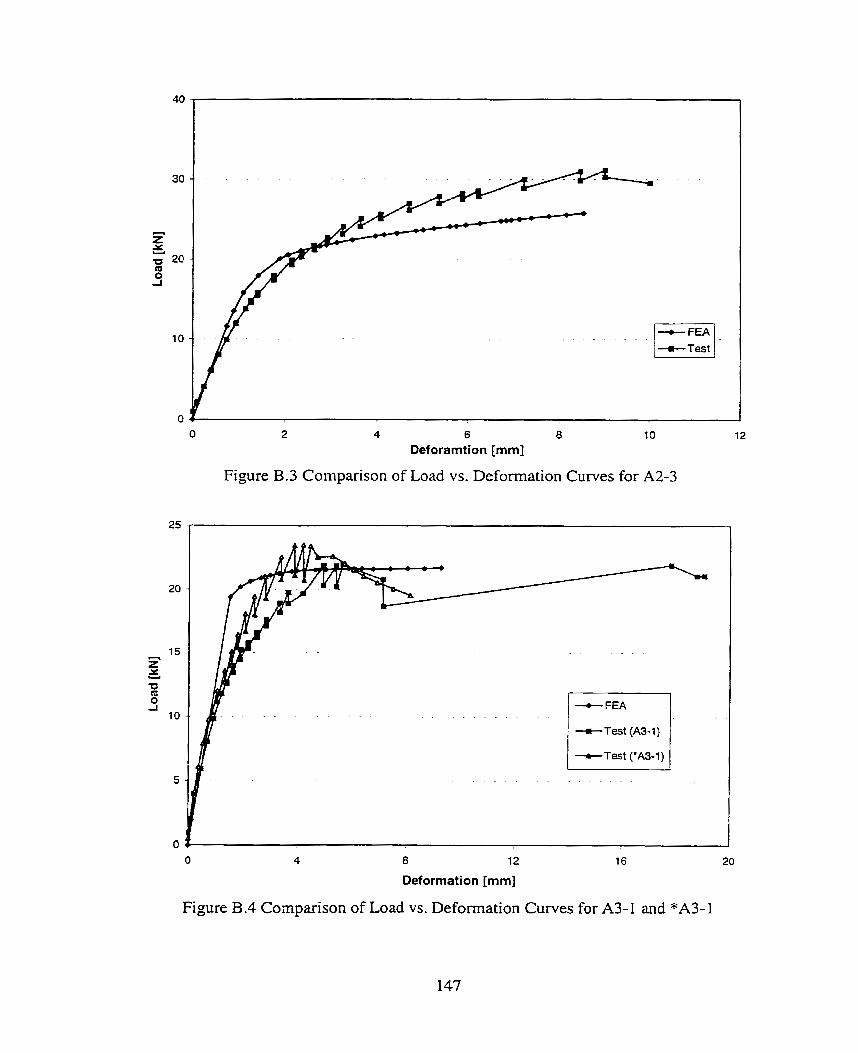
4 6 8
Deforamtion [mm]
Figure B.3 Comparison of Load vs. Deformation Curves for A2-3
8 12
Deformation [mm]
Figure B.4 Comparison of Load vs. Deformation Curves for A 3 4 and *A34
Deformation [mm]
Figure B.5 Comparison of Load vs. Deformation Curves for A3-2
10 15
Deformation [mm]
Figure B.6 Comparison of Load vs. Deformation Curves for A3-3
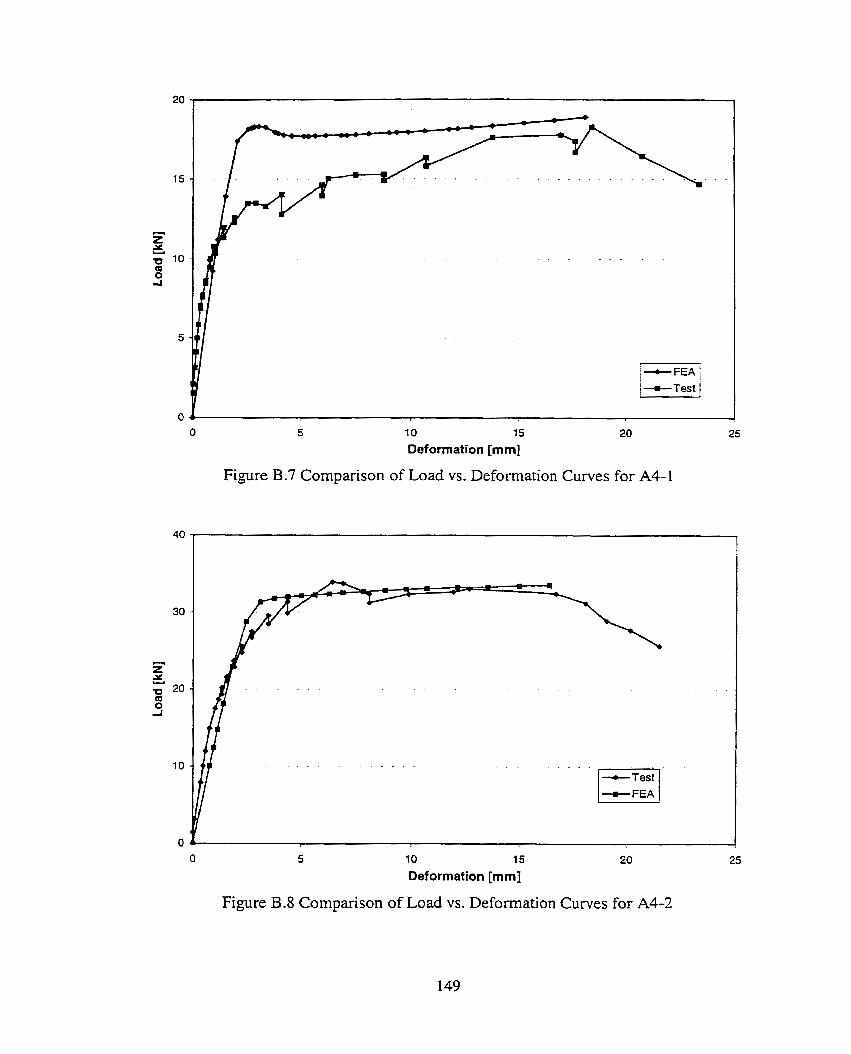
O 5 1 O 15 20
Deformation [mm]
Figure B.7 Comparison of Load vs. Deformation Curves for A4-1
1 O 15
Deformation [mm]
Figure B.8 Comparison of Load vs. Deformation Curves for A4-2
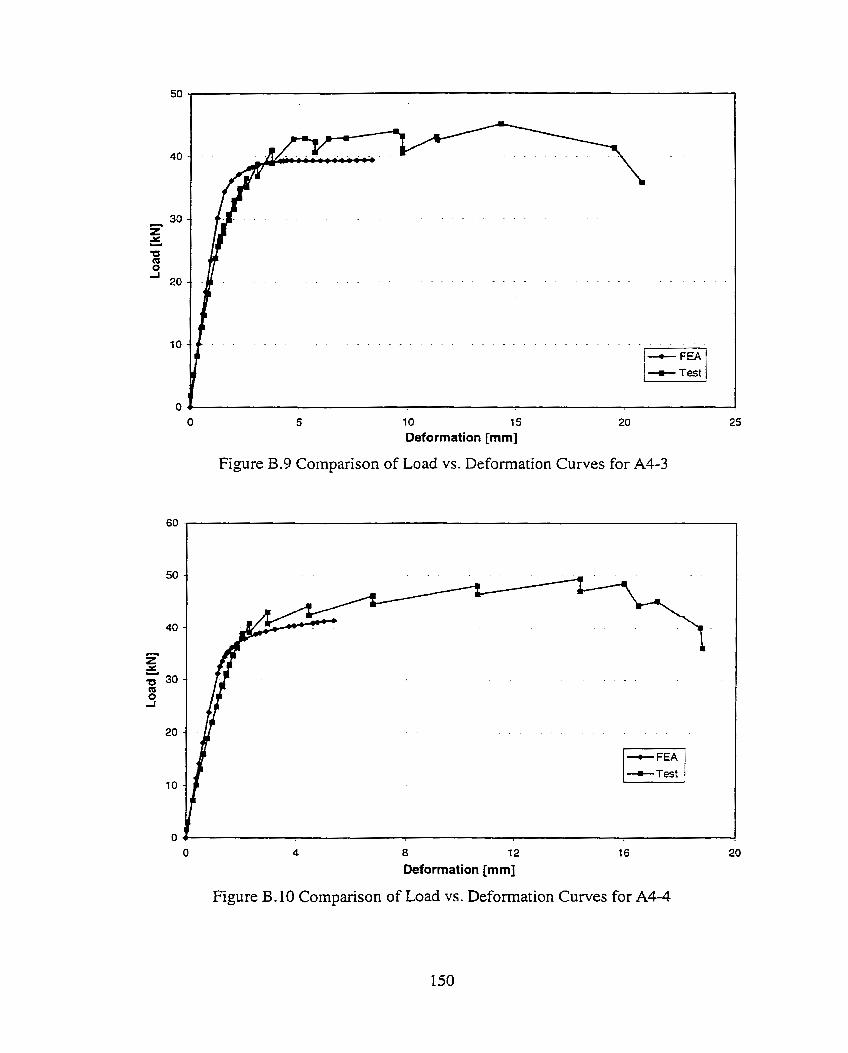
10 15
Deformation [mm]
Figure B.9 Cornparison of Load vs. Deformation Curves for A4-3
8 12
Deformation [mm]
Figure B. 10 Cornparison of Load vs. Deformation Curves for A 4 4
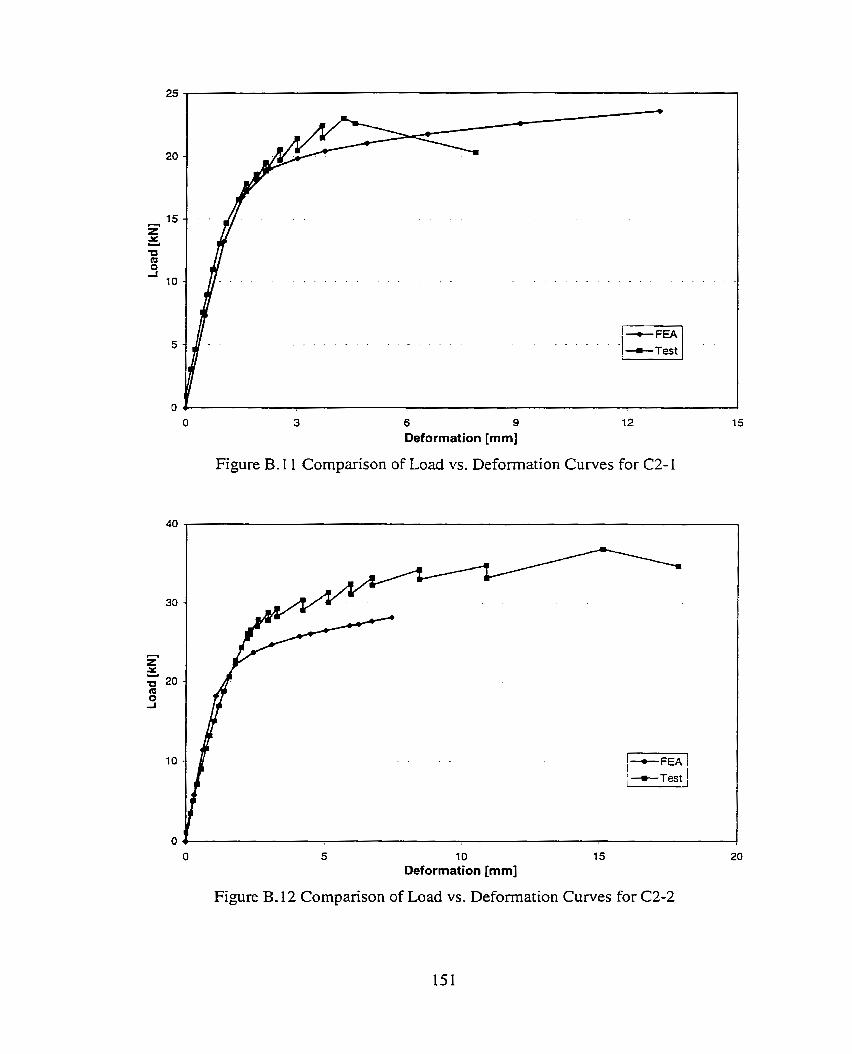
6 9
Deformation [mm]
Figure B. 1 1 Cornparison of Load vs. Deforrnation Curves for C2- 1
1 O Deformation [mm]
Figure B. 12 Companson of Load vs. Deformation Curves for C2-2
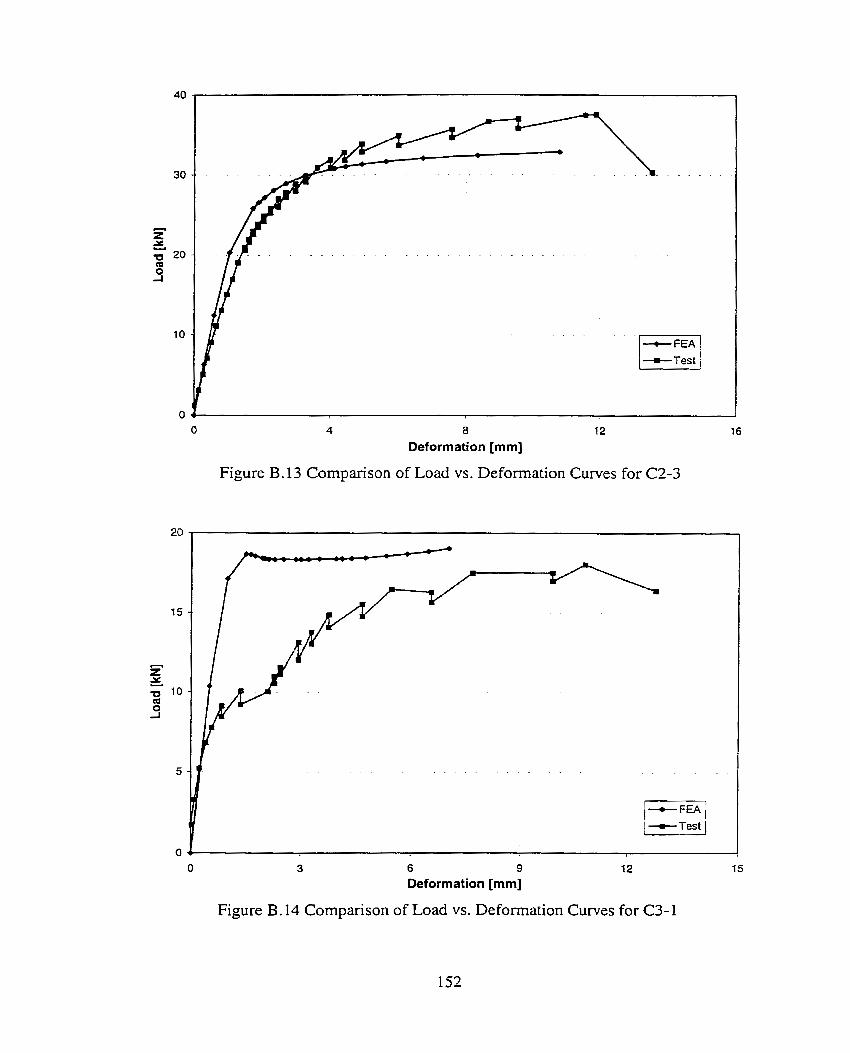
8
Deformation [mm]
Figure B. 13 Comparison of Load vs. Deformation Curves for C2-3
6 9 Deformation [mm]
Figure B. 14 Comparison of Load vs. Deformation Curves for C3-1
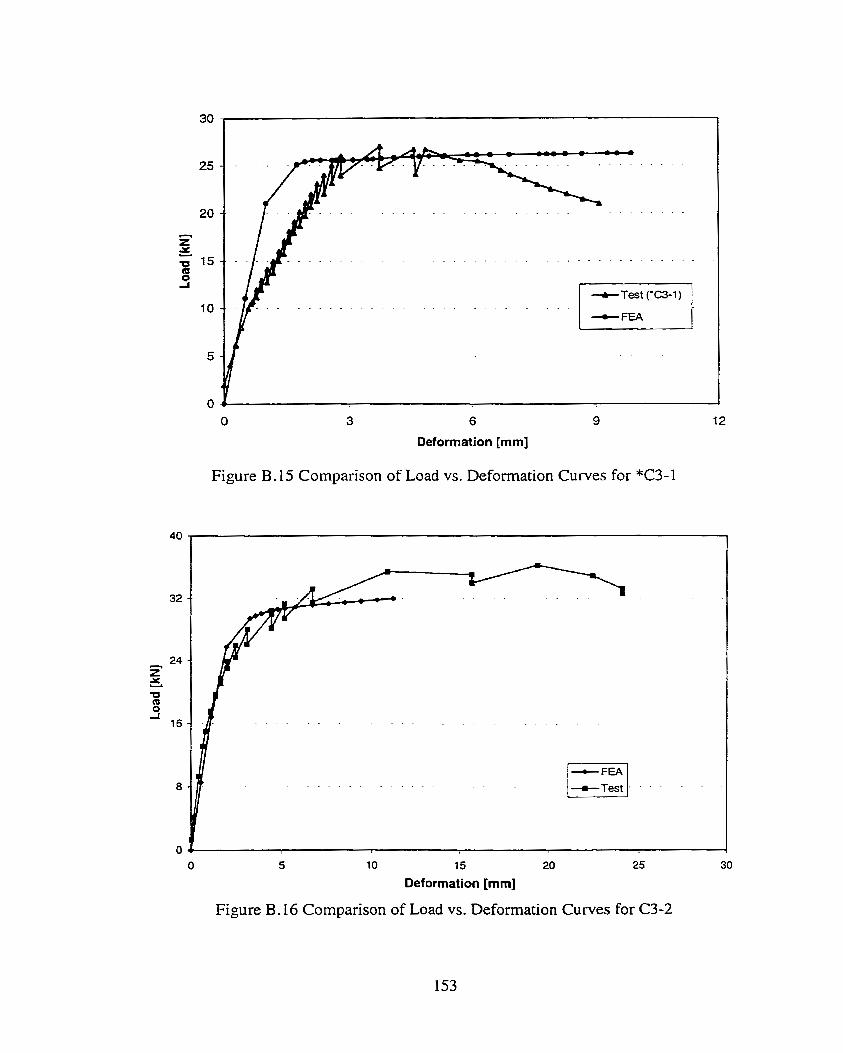
6
Deformation [mm]
Figure B. 15 Cornpanson of Load vs. Deformation Curves for *C3- 1
10 15 20
Deformation [mm]
Figure B. 16 Cornparison of Load vs. Deformation Curves for C3-2
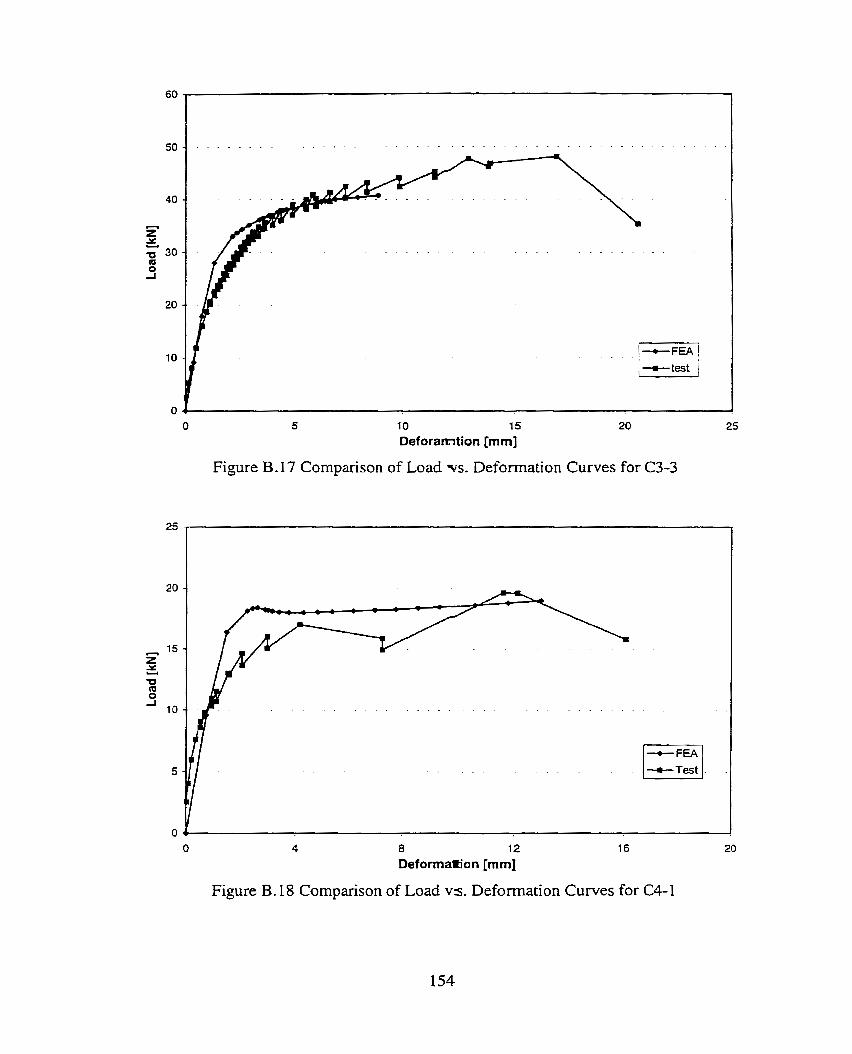
10 15
Deforamtion [mm]
Figure B. 17 Comparison of Load vs. Deformation Curves for C3-3
8 12
Deformation [mm]
Figure B. 18 Comparison of Load vs . Deformation Curves for C4-1
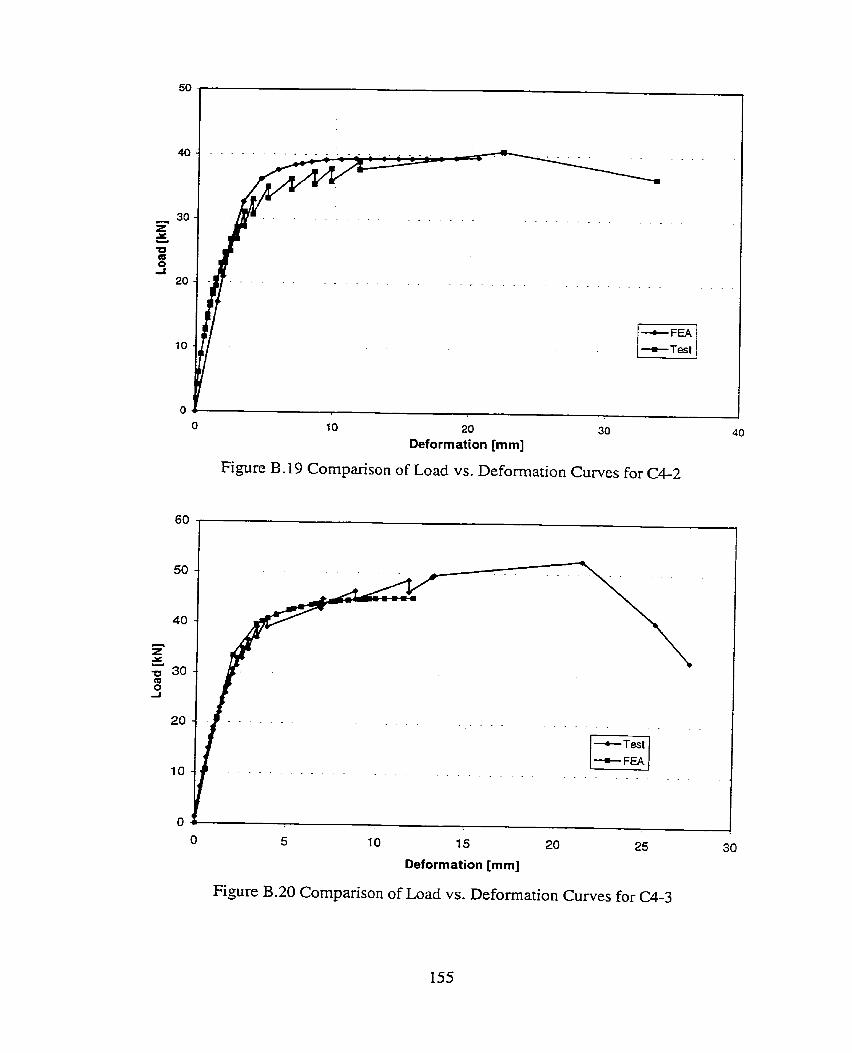
20 30
Deformation [mm]
Figure B. 19 Comparison of Load vs. Deformation Curves for C4-2
1 O 15 20
Deformation [mm]
Figure B.20 Comparison of Load vs. Deformation Curves for C4-3
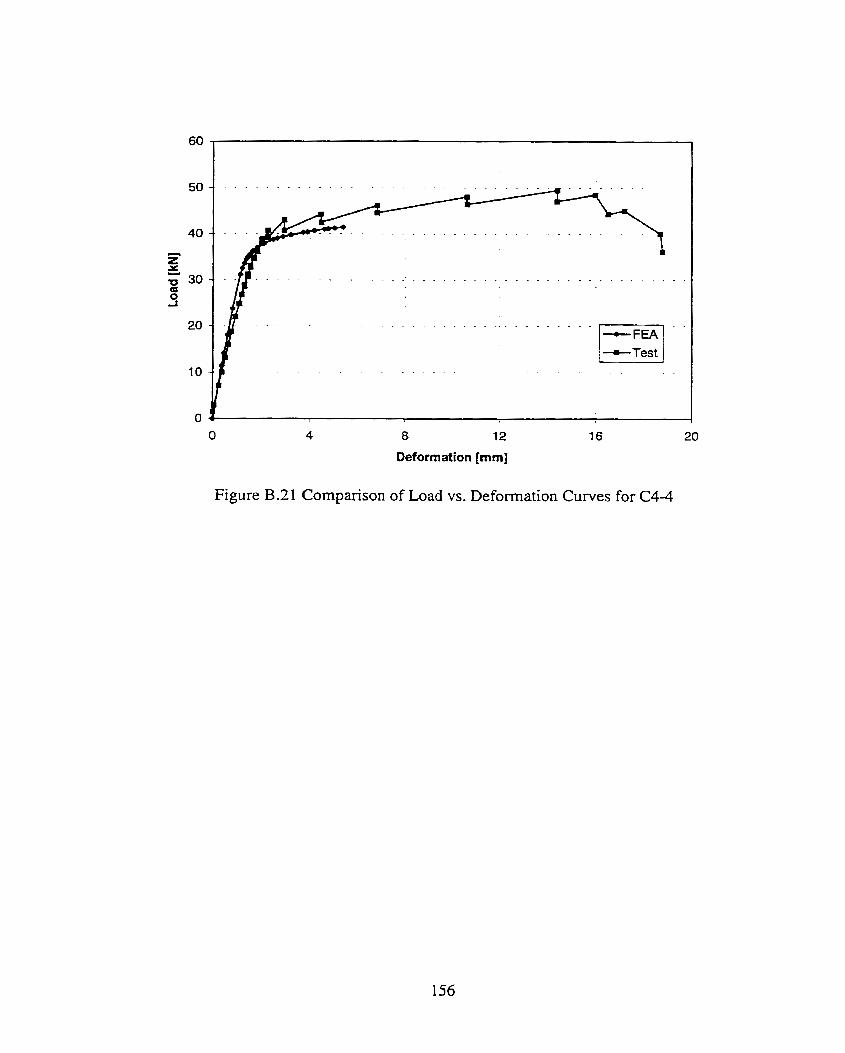
. . . . . .
_ _ . _ _ _ _ _ _ . _ . . . . _ _
. . . - . . . . . . .
O 4 8 12 16 20
Deformation [mm1
Figure B.21 Cornparison of Load vs. Deformation Curves for C4-4
Top Related