


Languages
Pages
Legal


UNIVERSITI PUTRA MALAYSIA
FORMATION AND CHARACTERISTICS OF ENGKABANG-BASED NANO-COSMECEUTICALS
SITI SALWA ABD GANI FS 2010 21
FORMATION AND CHARACTERISTICS OF ENGKABANG-BASED NANO-
COSMECEUTICALS
By
SITI SALWA ABD GANI
Thesis Submitted to the School of Graduate Studies, Universiti Putra Malaysia, in Fulfillment of the Requirement for the Degree of Doctor of
Philosophy
July 2010

ii
DEDICATED TO:
My family: Abah & Emak, my siblings,
my nephews and nieces
For your unwavering support, love and what you mean to me.
iii
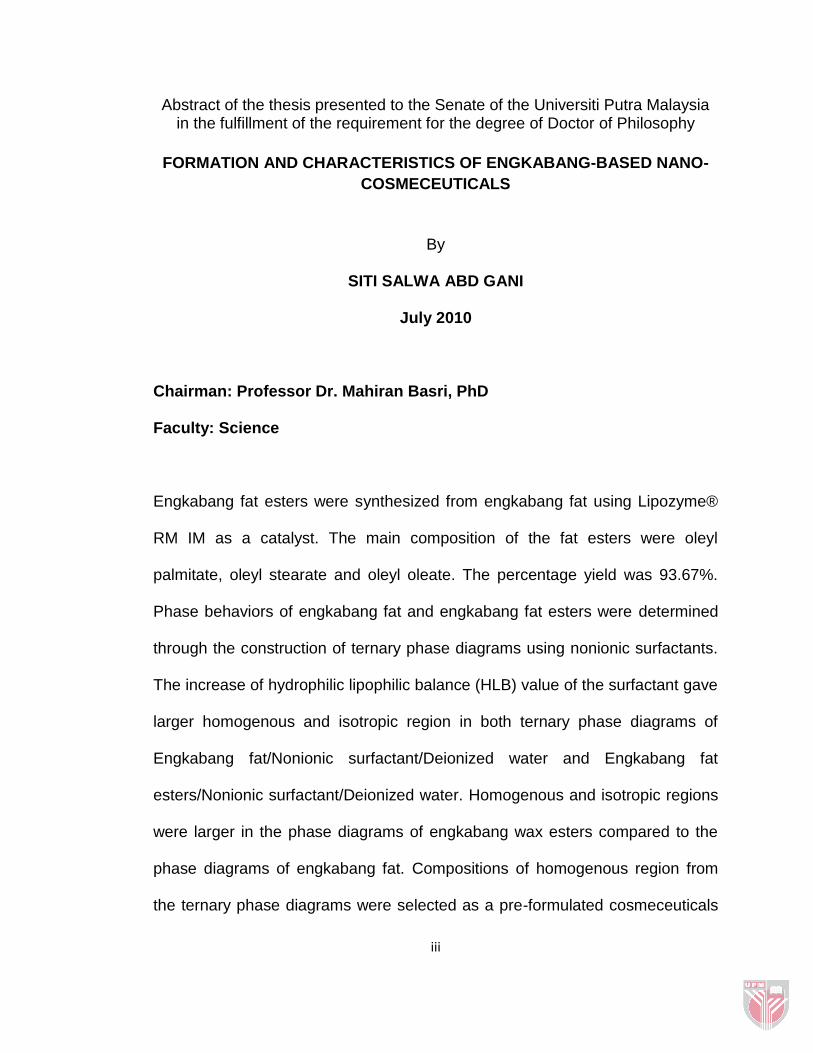
Abstract of the thesis presented to the Senate of the Universiti Putra Malaysia in the fulfillment of the requirement for the degree of Doctor of Philosophy
FORMATION AND CHARACTERISTICS OF ENGKABANG-BASED NANO-
COSMECEUTICALS
By
SITI SALWA ABD GANI
July 2010
Chairman: Professor Dr. Mahiran Basri, PhD
Faculty: Science
Engkabang fat esters were synthesized from engkabang fat using Lipozyme®
RM IM as a catalyst. The main composition of the fat esters were oleyl
palmitate, oleyl stearate and oleyl oleate. The percentage yield was 93.67%.
Phase behaviors of engkabang fat and engkabang fat esters were determined
through the construction of ternary phase diagrams using nonionic surfactants.
The increase of hydrophilic lipophilic balance (HLB) value of the surfactant gave
larger homogenous and isotropic region in both ternary phase diagrams of
Engkabang fat/Nonionic surfactant/Deionized water and Engkabang fat
esters/Nonionic surfactant/Deionized water. Homogenous and isotropic regions
were larger in the phase diagrams of engkabang wax esters compared to the
phase diagrams of engkabang fat. Compositions of homogenous region from
the ternary phase diagrams were selected as a pre-formulated cosmeceuticals
iv
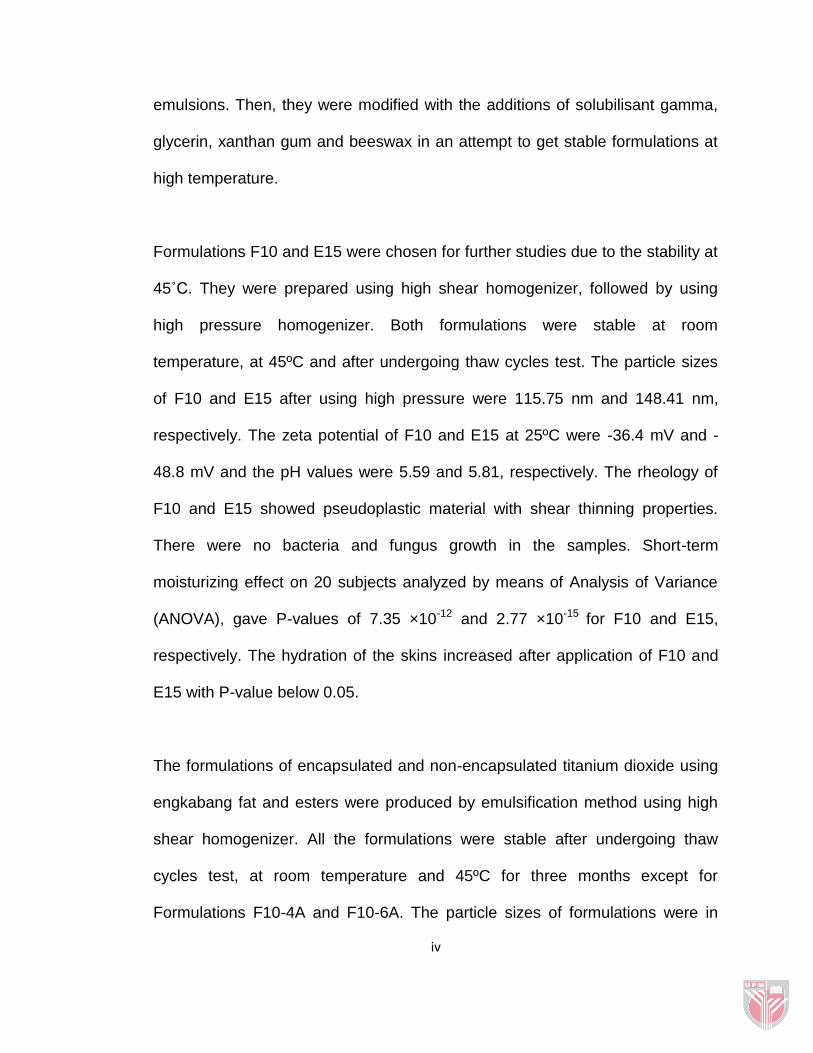
emulsions. Then, they were modified with the additions of solubilisant gamma,
glycerin, xanthan gum and beeswax in an attempt to get stable formulations at
high temperature.
Formulations F10 and E15 were chosen for further studies due to the stability at
45˚C. They were prepared using high shear homogenizer, followed by using
high pressure homogenizer. Both formulations were stable at room
temperature, at 45ºC and after undergoing thaw cycles test. The particle sizes
of F10 and E15 after using high pressure were 115.75 nm and 148.41 nm,
respectively. The zeta potential of F10 and E15 at 25ºC were -36.4 mV and -
48.8 mV and the pH values were 5.59 and 5.81, respectively. The rheology of
F10 and E15 showed pseudoplastic material with shear thinning properties.
There were no bacteria and fungus growth in the samples. Short-term
moisturizing effect on 20 subjects analyzed by means of Analysis of Variance
(ANOVA), gave P-values of 7.35 ×10⁻¹² and 2.77 ×10⁻¹⁵ for F10 and E15,
respectively. The hydration of the skins increased after application of F10 and
E15 with P-value below 0.05.
The formulations of encapsulated and non-encapsulated titanium dioxide using
engkabang fat and esters were produced by emulsification method using high
shear homogenizer. All the formulations were stable after undergoing thaw
cycles test, at room temperature and 45ºC for three months except for
Formulations F10-4A and F10-6A. The particle sizes of formulations were in

v
range 80 nm to approximately 400 nm. Surface charge measurements of
formulations having values from -30 mV to -59 mV denoted the presence of
stable dispersions.
The morphological characterization confirmed the encapsulations of titanium
dioxide in the formulations. The rheology analysis of the formulations showed
shear thinning property as when the shear rate increased, the viscosity
decreased. Formulations containing Engkabang fat could be classified as the
thixotropic materials, whereby formulations containing Engkabang fat esters
could be classified as pseudo plastic materials under a non-Newtonian fluid.
Increasing amount of TiO2 gave higher pH values of the formulations and higher
conductivity. The TGA thermograms showed three major weight losses due to
the evaporation of water content, evaporation of water content in lattice
structure and decomposition of oil phase. The stable formulations containing
encapsulated of TiO2 gave higher absorbance compared to the formulations
containing non-encapsulated of TiO2.

vi
Abstrak tesis dikemukakan kepada Senat Universiti Putra Malaysia bagi memenuhi syarat untuk mendapatkan ijazah Doktor Falsafah
PENGHASILAN DAN SIFAT-SIFAT EMULSI BERASASKAN ENGKABANG
DALAM BIDANG NANO-KOSMESUTIKAL
Oleh
SITI SALWA ABD GANI
Julai 2010
Pengerusi: Profesor Dr. Mahiran Basri, PhD
Fakulti: Sains
Ester lemak engkabang disintesis daripada lemak engkabang menggunakan
Lipozyme® RM IM. Komposisi utama daripada ester lemak adalah oleyl
palmitate, oleyl stearate dan oleyl oleate. Peratusan penghasilan adalah
93.67%. Fasa perilaku lemak engkabang dan ester lemak engkabang
ditentukan dengan menggunakan rajah tiga fasa menggunakan surfaktan tidak
berion. Peningkatan nilai keseimbangan sifat suka air dan minyak (HLB)
surfaktan memberikan fasa homogen dan isotropik yang lebih besar di kedua-
dua wilayah diagram tiga fasa lemak engkabang / surfaktan tak berion / air
dinyah ion dan lemak ester engkabang / surfaktan tak berion / air dinyah ion.
Fasa homogen dan isotropik lebih besar dalam rajah tiga fasa ester lemak
engkabang dibandingkan dengan rajah tiga fasa lemak engkabang. Fasa
homogen dari diagram tiga fasa dipilih sebagai emulsi awal kosmesutikal.

vii
Kemudian, formulasi itu diubahsuai dengan penambahan solubilisant gamma,
glycerin, xanthan gum dan beeswax untuk mendapatkan formulasi yang stabil
pada suhu tinggi.
Formulasi engkabang mengandungi lemak dan ester lemak engkabang, F10
dan E15, menggunakan mesin pengemulsi, diikuti dengan menggunakan mesin
pengemulsi bertekanan tinggi. Kedua-dua formulasi tersebut stabil pada suhu
bilik (25ºC), 45º C dan selepas menjalani ujian kitaran mencair. Saiz zarah F10
dan E15 selepas menggunakan mesin pengemulsi bertekanan tinggi ialah
115.75 nm dan 148.41 nm. Nilai zeta F10 dan E15 pada 25ºC adalah-36.4 mV
dan-48.8 mV dan nilai pH 5.59 dan 5.81 untuk formulasi F10 dan E15. Sifat
aliran F10 dan E15 menunjukkan ciri-ciri pseudo-plastik dengan sifat-sifat
luncur menipis. Tiada pertumbuhan bakteria dan kulat dalam kedua-dua
formulasi. Ujian jangka pendek kesan kelembapan kulit telah dijalankan ke atas
20 subjek dan dianalisis dengan menggunakan Analisis varians (Anova),
memberikan nilai-P 7.35 ×10⁻¹² and 2.77 ×10⁻¹⁵ bagi F10 and E15. Kelembapan
kulit meningkat selepas penggunaan F10 dan E15 dengan nilai-P di bawah
0.05.
Formulasi mengandungi enkapsulasi dan tidak enkapsulasi titanium dioksida
menggunakan lemak dan ester engkabang dihasilkan melalui kaedah
pengemulsian menggunakan mesin pengemulsi bertekanan tinggi. Semua
formulasi adalah stabil selepas menjalani ujian kitaran mencair, pada suhu bilik

viii
dan 45ºC selama tiga bulan, kecuali formulasi F10-4A dan F10-6A. Saiz zarah
formulasi adalah antara 80 nm ke 400 nm. Pengukuran cas permukaan
formulasi menunjukkan nilai daripada -30 mV ke-59 mV mengesahkan
kestabilan formulasi-formulasi tersebut.
Gambar TEM mengesahkan bahawa titanium dioksida berjaya diencapsulasi di
dalam formulasi. Analisis sifat aliran formulasi-formulasi yang dihasilkan
menunjukkan sifat-sifat luncur menipis dengan kelikatan menurun apabila
kelajuan meluncur bertambah. Formulasi engkabang yang mengandungi lemak
boleh diklasifikasikan sebagai bahan thixotropic dan formulasi mengandungi
ester lemak engkabang boleh diklasifikasikan sebagai bahan pseudo plastik di
bawah bendalir non-Newtonian. Peningkatan jumlah TiO2 memberikan nilai pH
dan. konduktiviti lebih tinggi pada formulasi. Gambar rajah haba TGA
menunjukkan tiga pengewapan berlaku; pengewapan air, pengewapan air
dalam struktur kisi dan penguraian fasa minyak. Formulasi stabil yang
mengandungi titanium dioksida yang dienkapsulasi menunjukkan penyerapan
UV yang tinggi berbanding dengan formulasi yang mengandungi titanium
dioksida yang tidak dienkapsulasi.

ix
ACKNOWLEDGEMENTS
In the name of Allah S.W.T the compassionate and merciful, I would like to
express my deepest gratitude to Allah S.W.T. for allowing me to complete my
study. I wish to express my sincere appreciation to my supervisor, Prof. Dr.
Mahiran Basri for her valuable guidance, advice, supervision, patience, and
suggestions during the period of this study. My appreciation also goes to my co-
supervisors, committee members and EMTECH group’s principle researchers;
Prof. Dr. Mohd Basyaruddin Abdul Rahman, Prof. Dr. Anuar Kassim, Prof. Dr.
Raja Noor Zaliha Raja Abd Rahman, Prof. Dr. Abu Bakar Salleh, Dr. Zahariah
Ismail for their valuable time, comments, encouragement and moral support.
My deepest appreciation is also extended to Sarawak Forestry Research
Centre, Sarawak Forest Tree Seed Bank, Sarawak Timber Museum, and
Sarawak Forest Department for their help and kindness. I could not forget the
experiences there especially when I saw the real engkabang tree in Semengoh
Reserve Forest, Sarawak. I would like to convey million thanks to Rosita
Hamdan and Datuk Kenneth Kanyan for their help while I was in Sarawak.
I am grateful to Advanced Oleochemical Technology Division (AOTD), Sime
Darby Plantation Sdn. Bhd., my laboratory members; K. Us, Hasmah, Sook
Han, Atena, Fariza, Lim, Malahat, Naz and others for their cooperation in one
way or another. Finally, my deepest appreciation and love goes to my family

x
especially to my ‘abah’ and ‘emak’, Hj. Abd Gani Talip and Hjh. Fatimah Kadir
for their strong support, understanding and love. Your unwavering support and
love lifted my spirit and confidence, and really reduce my physical and mental
burdens. May Allah bless you all the time.

xi
I certify that a Thesis Examination Committee has met on 1st July 2010 to conduct the final examination of Siti Salwa Abd Gani on her thesis entitled “Formation and Characteristics of Engkabang-based Nano-Cosmeceuticals” in accordance with Universities and Universities Colleges Act 1971 and the Constitution of the Universiti Putra Malaysia [P.U.(A) 106] 15 March
1998.The committee recommends that the student be awarded the Doctor of Philisophy Degree. Members of the Thesis Examination Committee were as follows: Zulkarnain Zainal, Ph.D Professor Faculty of Science Universiti Putra Malaysia (Chairman) Faujan Hj. Ahmad, Ph.D Professor Faculty of Science Universiti Putra Malaysia (Internal Examiner) Mohd Aspollah Hj. Md. Sukari, Ph.D Professor Faculty of Science Universiti Putra Malaysia (Internal Examiner) Shahidan Radiman, Ph.D Professor Faculty of Science and Technology Universiti Kebangsaan Malaysia Malaysia (External Examiner)
_________________________ BUJANG BIN KIM HUAT, PhD Professor and Deputy Dean School of Graduate Studies Universiti Putra Malaysia Date:

xii
This thesis is submitted to the Senate of University Putra Malaysia has been accepted as fulfillment of the requirements for the degree of Doctor of Philosophy. The members of Supervisory Committee are as follows: Mahiran Basri, PhD Professor Faculty of Science Universiti Putra Malaysia (Chairperson) Anuar Kassim, PhD Professor Faculty of Science Universiti Putra Malaysia (Member) Raja Noor Zaliha Raja Abd Rahman, PhD Professor Faculty of Biotechnology and Biomolecular Science Universiti Putra Malaysia (Member) Zahariah Ismail, PhD Chief Chemist 1 Sime Darby Plantation Sdn. Bhd. Banting, Selangor, Malaysia (Member)
____________________________ HASANAH MOHD. GHAZALI, PhD Professor and Dean School of Graduate Studies Universiti Putra Malaysia Date: 12 August 2010
xiii
DECLARATION
I hereby declare that the thesis is based on my original work except for quotations and citations, which have been duly acknowledged. I also declare that it has not been previously or concurrently submitted for any other degree at Universiti Putra Malaysia or other institutions.
_______________________
(SITI SALWA ABD GANI)
Date:

xiv
TABLE OF CONTENTS
Page
DEDICATION ii ABSTRACT iii ABSTRAK vi ACKNOWLEDGEMENTS ix APPROVAL xi DECLARATION xiii LIST OF TABLES xviii LIST OF FIGURES xx LIST OF SCHEMES xxvi LIST OF ABBREVIATIONS xxvii CHAPTER
1 INTRODUCTION 1 Objectives 3
2 LITERATURE REVIEW
Cosmeceuticals 5 Cosmeceuticals as Quasidrugs 5 Market Values of Cosmeceuticals Product 6 Importance of Cosmeceuticals 8 Hydration on the Human Skin 8 Ultraviolet Protection 11 Delivery System 18 Cosmeceuticals Ingredients 23 Fats and Esters 24 Surfactants as Emulsifiers 31 Humectants 39 Active Ingredients 40 Rheology Modifier 45 Preservatives 46 Stability of Emulsion System 48 Formation of Emulsions 48 Preparation of Nano-Emulsions using High
Pressure Homogenizer 50
Ostwald Ripening 51 Reducing Ostwald Ripening 53 Characteristics of Cosmeceuticals Emulsions 54 Particle Sizing 54 Electrical Charges in Dispersions 56 Rheology 59

xv
3 MATERIALS AND METHODS Materials 67 Synthesis of Engkabang Fat Esters 68 Alcoholysis Reaction 68 Isolation and Purification of Engkabang Fat Esters 68 Identification of Engkabang Fat Esters (EFE) 69 Thin Layer Chromatography (TLC) 69 Gas Chromatography (GC) 69 Analysis of Yield of Engkabang Fat Esters 70 Percentage Yield of Engkabang Fat Esters 70 Determination of HLB Value of EFE 71 Construction of Ternary Phase Diagram 72 Phase Behavior of Engkabang Fat (EF) and
Esters (EFE) 72
Effect of Phase Behavior of EF and EFE with Respect to Different Nonionic Surfactants
72
Effect of Addition of Solubilisant Gamma in Ternary System
73
Selection of Composition Points in Ternary System 73 Preparation of Pre-formulated Emulsion Using Low
Shear Rate Emulsification 74
Stability of Engkabang-based Formulations 74 Addition of Solubilisant Gamma 74 Addition of Glycerin 75 Addition of Xanthan Gum 75 Addition of Beeswax 75 Preparation of Emulsion using High Shear and High
Pressure Homogenization 76
Preparation of Formulation Containing Encapsulated Titanium Dioxide
78
Preparation of Formulation Containing Non-encapsulated Titanium Dioxide
79
Characteristics of the Emulsions 81 Stability Study and pH Measurement 81 Particle Size Measurement 81 Surface Charge Measurement 82 Rheology Study 83 Transmission Electron Microscopy (TEM) Analysis 83 Conductivity Measurement 85 Thermogravimetric Analysis (TGA) 86 Safety Test 86 Microbiology Test 86 Irritancy Test (In-Vitro Irritection Assay) 89 Efficacy Test 90 Moisturizing Efficacy Test 90

xvi
UV Absorption Analysis 91
4 RESULTS AND DISCUSSION Synthesis of Engkabang Fat Esters 92 Identification of Engkabang Fat Esters (EFE) 94 Thin Layer Chromatography (TLC) Analysis 94 Gas Chromatography (GC) Analysis 96 Determination of HLB Value of Engkabang Fat Esters 100 Phase Behavior Study 101 Effect of Phase Behavior of Engkabang Fat with
Respect to Different Nonionic Surfactants 101
Effect of Phase Behavior of Engkabang Fat Esters with Respect to Different Nonionic Surfactants
106
Effect of Engkabang Fat and Esters with Respect to the Homogenous and Isotropic Region
111
Effect of Addition of Solubilisant Gamma in Ternary System
112
Selection of Composition Points in Ternary Phase Diagrams
115
Preparation of Pre-formulated Emulsions Using Engkabang Fat and Esters
120
Stability of Engkabang-based Formulations 121
Addition of Solubilisant Gamma 121
Addition of Glycerin 125
Addition of Xanthan Gum 130
Addition of Beeswax 132
Physico-chemical Analysis of Formulations F10 and E15 137 PH Measurement 137 Particle Size Measurement 137 Surface Charge Measurement 140 Rheology Study 141 Safety Test 144 Microbiology Test 144 Irritancy Test (In-vitro Irritection Assay) 149 Efficacy Test 151 Moisturizing Efficacy Test 151 Addition of Titanium dioxide (TiO2) as Sunscreen Agent 156 Physico-chemical Analysis of Engkabang-based
Formulations Containing TiO2 157
Stability Study of Engkabang-based Formulations Containing TiO2
157
Particle Size Measurement of Engkabang-based Formulations Containing TiO2
159
Surface Charge Measurement of Engkabang- 162

xvii
based Formulations Containing TiO2 Transmission Electron Microscopy
Characterization of Engkabang-based Formulations Containing TiO2
165
Rheology of Engkabang-based Formulations Containing TiO2
173
PH Measurement of Engkabang-based Formulations Containing TiO2
178
Conductivity Measurement of Engkabang-based Formulations Containing TiO2
181
Thermogravimetric Analysis of Engkabang-based Formulations Containing TiO2
185
UV Absorption Analysis of Engkabang-based Formulations Containing TiO2
195
5 CONCLUSIONS 199
REFERENCES 201 APPENDICES 221 BIODATA OF STUDENT 282

xviii
LIST OF TABLES
Table Page
2.1 Examples of cosmeceutical ingredients and their functions
23
2.2 Major fatty acids in engkabang fat, palm oil and palm kernel oil
29
2.3 Range HLB of surfactants for different purposes
36
2.4 Preferred synthetic preservatives in the cosmetic industry
47
2.5 Application of non-newtonian fluids
65
3.1 Chemical composition of formulation F10
77
3.2 Chemical composition of formulation E15
77
3.3 Chemical composition of formulations of EF containing encapsulated and non-encapsulated of TiO2
79
3.4 Chemical composition of formulations of EFE containing encapsulated and non-encapsulated of TiO2
80
3.5 Materials for agar preparation
88
3.6 Relationship of human equivalent score to irritancy classification for the dermal irritection test method
89
4.1 The original compositions of the pre-formulations based on ternary phase diagrams
116
4.2 Addition of solubilisant gamma in engkabang fat formulations
124
4.3 Stability after freeze-thaw cycle, stability at room temperature, 25ºC and at 45ºC for three months
124
4.4 Addition of glycerin in engkabang fat formulations
127
4.5 Stability after freeze-thaw cycle test, stability at room 127

xix
temperature, 25ºC and at 45ºC for three months for F6 and F7
4.6 Addition of glycerin in engkabang fat esters formulations
128
4.7 Stability after freeze-thaw cycle test, stability at room temperature, 25ºC and at 45ºC for three months for E1, E2, E3, E5, E7, E8, E9 and E10
129
4.8 Addition of xanthan gum in engkabang fat esters formulations
131
4.9 Stability after freeze-thaw cycle test, stability at room temperature, 25ºC and at 45ºC for three months for E3, E4 and E6
131
4.10 Addition of beeswax in engkabang fat formulations
135
4.11 Stability after freeze-thaw cycle test, stability at room temperature, 25ºC and at 45ºC for three months for F7 to F10
135
4.12 Addition of beeswax in engkabang fat esters formulations
136
4.13 Stability after freeze-thaw cycle test, stability at room temperature, ±25ºC and at 45ºC for three months for E11 to E15
136
4.14 Particle sizes of Formulations F10 and E15
138
4.15 Irritancy test of Formulation E15
150
4.16 Analysis of data of F10 and F10P through Tukey-test
153
4.17 Analysis of data of E15 and E15P through Tukey-test
153
4.18 Stability after freeze-thaw cycle test, stability at room temperature and 45ºC for three months
158

xx
LIST OF FIGURES
Figure Page
2.1 Revenue Split by Cosmeceuticals Product Type in Europe
7
2.2 Stratum Corneum
10
2.3 The Sun Radiation Spectrum
11
2.4 Surfactant Interaction at an Oil/Water Interface
19
2.5 Illustration of Multiple Emulsions for (a) w/o/w Emulsion and (b) o/w/o Emulsion
21
2.6 Structure of Triglyceride
24
2.7 Engkabang Tree
26
2.8 Engkabang Seed
26
2.9 Major Fatty Acids in Exotic Butters
27
2.10 Sorbitan mono-oleate(Span80)
38
2.11 Sorbitan monolaurate(Span20)
38
2.12 Polyoxyethylene (20) sorbitan tri-oleate(Tween85)
38
2.13 Polyoxyethylene (20) sorbitan mono-oleate(Tween80)
38
2.14 Chemical Structure of Glycerin
40
2.15 Chemical Structures for (a) d-alpha-tocotrienol,(b) d-beta-tocotrienol, (c) d-gamma-tocotrienol, (d) d-delta-tocotrienol
43
2.16 Chemical Structure of Xanthan Gum
46
2.17 Illustration of Increase in Laplace Pressure When a Spherical Drop is Deformed to a Prolate Ellipsoid
49
2.18 Illustration of Ostwald Ripening
53
xxi
2.19 Set-up for PCCS. Two Lasers Illuminate the Same Scattering Volume Creating Two Sets of Scattering Patterns
55
2.20 Schematic Representation of Zeta Potential
58
2.21 Illustration of Deformations Produced Between Parallel Plates
60
2.22 Typical flow curves of shear stress versus shear rate
64
2.23 Typical curves of viscosity versus shear rate
64
3.1 Transmission Electron Microscope
84
3.2 Schematic Diagram of Transmission Electron Microscope
85
4.1 Thin Layer Chromatogram of Oleyl Alcohol (Lane 1), Engkabang Fat (Lane 2), and Engkabang Fat Esters (Lane 3)
95
4.2 A Chromatogram of the Standard Esters. Methyl Arachidate is the Internal Standard
97
4.3 A Chromatogram of the Sample before Reaction
98
4.4 A Chromatogram of Engkabang Fat Esters after Purification
99
4.5 Ternary Phase Diagram of Engkabang Fat/Span80/Deionized water. T2p-Two-Phase Region and TT-Three-Phase Region
102
4.6 Ternary Phase Diagram of Engkabang Fat/Span20/Deionized Water. L-Isotropic Region, Th-Homogenous Milky Region, T2p-Two-Phase Region and TT-Three-Phase Region
103
4.7 Ternary Phase Diagram of Engkabang Fat/Tween85/Deionized Water. C-Liquid Crystal Region, L-Isotropic Region, Th-Homogenous Milky Region T2p-Two-Phase Region and TT-Three-Phase Region
104

xxii
4.8 Ternary Phase Diagram of Engkabang Fat/Tween80/Deionized Water. L-Isotropic Region, Th-Homogenous Milky Region and T2p-Two-Phase Region
105
4.9 Ternary Phase Diagram of Engkabang Fat Esters/Span80/Deionized Water. T2p- Two-Phase Region and TT- Three-Phase Region
106
4.10 Ternary Phase Diagram of Engkabang Fat Esters/Span20/Deionized Water. L-Isotropic Region, Th-Homogenous Milky Region, T2p-Two-Phase Region and TT-Three-Phase Region
107
4.11 Ternary Phase Diagram of Engkabang Fat Esters/Tween85/Deionized Water. C-Liquid Crystal Region, L-Isotropic Region, Th-Homogenous Milky Region, T2p-Two-Phase Region and TT-Three-Phase Region
108
4.12 Ternary Phase Diagram of Engkabang Fat Esters/ Tween80/Deionized Water. L-Isotropic Region, Th-Homogenous Milky Region, T2p-Two-Phase Region and TT-Three-Phase Region
109
4.13 Ternary Phase Diagram of Engkabang Fat:Solubilisant Gamma(2:1)/Tween85/Deionized Water. C-Liquid Crystal Region, L-Isotropic Region, Th-Homogenous Milky Region, T2p-Two-Phase Region and TT-Three-Phase Region
113
4.14 Ternary Phase Diagram of Engkabang Fat Esters: Solubilisant Gamma (2:1)/Tween85/Deionized Water. C-Liquid Crystal Region, L-Isotropic Region, Th-Homogenous Milky Region, T2p-Two-Phase Region and TT-Three-Phase Region
114
4.15 Composition Points of Pre-formulated Cosmeceuticals Emulsions; (a) EF:SG/Tween85/Deionized water, (b) EF/Tween85/Deionized water, (c) EF/Span20/Deionized water, (d) EFE:SG/Tween85/Deionized water, (e) EFE/Tween85/Deionized water and (f) EFE/Span20/Deionized water
117

xxiii
4.16 Zeta potential of Formulations F10 (red) and
E15(blue)
141
4.17 Graph of Shear Stress (τ) and Apparent Viscosity (η) versus Shear Rate (γ) for (a) F10 and (b) E15
142
4.18 Representative of Microbiology Test Results for (a) Aerobic Plate Count Test and (b) Yeast and Mould Count Test
146
4.19 The Representative Results of Positive Control for Bacteria (a)Staphylococcus aureus, (b)Pseudomonas aeruginosa and (c)Escherichia coli
147
4.20 The Representative Results of Positive Control for Fungus and Yeast (a) Aspergillus-niger (b) Candida albitan
148
4.21 Hydration Value of F10 and F10P on the Human Skin
154
4.22 Hydration Value of E15 and E15P on the Human Skin. The symbol ** means P-value below than 0.01 and *** means P-value below than 0.001
155
4.23 Particle sizes of EF Formulations with Increasing Amount of TiO2
161
4.24 Particle Size of EFE Formulations with Increasing Amount of TiO2
161
4.25 Zeta Potential of EF Formulations with Increasing Amount of TiO2
164
4.26 Zeta Potential of EFE Formulations with Increasing Amount of TiO2
164
4.27 Illustration of Encapsulation of TiO2 using Oil Droplet in Colloid System
165
4.28 TEM Micrograph of Titanium Dioxide Dispersed in Deionized Water at 150 000x Magnification
166
4.29 TEM Micrograph of Formulation using Engkabang 167

xxiv
Fat without TiO2 (F10) at 60 000x Magnification
4.30 TEM Micrograph of F10-2A (2% Encapsulated TiO2)
at 60 000x Magnification
169
4.31 TEM Micrograph of F10-2B (2% Non-encapsulated TiO2) at 100 000x Magnification
169
4.32 TEM Micrograph of E15(1) (without TiO2) at 60 000x Magnification
171
4.33 TEM Micrograph of E15(1)-2A (2% Encapsulated TiO2) at 60 000x Magnification
171
4.34 TEM Micrograph of E15(1)-6A (6% Encapsulated TiO2) at 70 000x Magnification
172
4.35 TEM Micrograph of E15(1)-2B (2% Non-encapsulated TiO2) at 100 000x Magnification
172
4.36 Graph of Shear Stress (τ) and Apparent Viscosity (η) Versus Shear Rate (γ) for (a) F10-2A, (b) F10-2B, (c) F10-4A, (d) F10-4B, (e) F10-6A and (f) F10-6B
176
4.37 Graph of Shear Stress (τ) and Apparent Viscosity (η) Versus Shear Rate (γ) for (a) E15(1)-2A, (b) E15(1)-2B, (c) E15(1)-4A, (d) E15(1)-4B, (e) E15(1)-6A and (f) E15(1)-6B
177
4.38 PH Values of of EF Formulations with Increasing Amount of TiO2
180
4.39 PH Values of EFE Formulations with Increasing Amount of TiO2
180
4.40 Conductivity Measurement of EF Formulations with Increasing Amount of TiO2
184
4.41 Conductivity Measurement of EFE Formulations with Increasing Amount of TiO2
184
4.42 TGA Thermogram of F10
189
4.43 TGA Thermogram of F10-2A
190
Top Related