


Languages
Pages
Legal


Prepared by:
Quest Offshore Resources, Inc. Prepared for:
1600 Highway 6, Suite 300 American Petroleum Institute (API)
Sugar Land, TX 77 National Ocean Industries Association (NOIA)
June 2011
United States Gulf of Mexico Oil and Natural Gas Industry Economic Impact Analysis
The Economic Impacts of GOM Oil and Natural Gas Development on the U.S. Economy

i
Key Findings
This report has documented the decline in
capital expenditures and operational
spending of the GoM offshore oil and
natural gas industry that occurred over the
2008 to 2010 period. The principal reasons
for this decline include the economic
recession in 2008-09 and the establishment
of a moratorium on deepwater drilling and
subsequent slowdown of permit issuance in
both GoM deep and shallow waters in 2010
and into 2011. We estimate that tens of
thousands of jobs have been lost in
response to the decline in capital
expenditures and operational spending of
the offshore GoM oil and natural gas
industry over this period.
We also demonstrate the near term
potential of the offshore GoM oil and natural
gas industry to create jobs, boost GDP and
generate tax revenues at all levels of
government – if the government pursues
a balanced regulatory approach that
allows for the timely development of the
backlog of GoM projects in an
environmentally responsible manner.
Under such government policy, we
estimate total spending by the GoM
offshore oil and natural gas industry to
increase by over 70 percent by 2013
from 2010 levels, and capital
expenditures to increase by over 140
percent. If potential spending levels are
reached, total employment supported by
the Gulf of Mexico oil and natural gas
industry in 2013 could exceed 430
thousand jobs or a 77 percent increase
from 2010.
.
Table 1: Estimated Historical and Projected Capital and Operational Spending, GDP
Impacts, and Employment1 Supported by the Offshore Gulf of Mexico Oil and Natural Gas
Industry (2008-2013)*
*Projected spending, GDP, and employment contingent on returning to pre-Macondo permitting rates.
Source: Quest Offshore Resources, Inc.
1 Total employment includes direct, indirect, and income induced employment.
($b illions)
2008 2009 2010 2011 2012 2013
Operating Expenditures $16.7 $17.2 $17.7 $21.6 $25.0 $25.7
Capital Expenditures $11.9 $9.7 $6.5 $8.9 $10.4 $15.7
GDP Impacts $30.8 $29.1 $26.1 $32.9 $38.2 $44.5
Total Employment 306,870 285,042 242,317 311,023 356,174 429,208
Historical Projected

i

ii
Table of Contents Executive Summary ................................................................................................. 1
Capital Investment and Spending of the Oil and Natural Gas Industry – Gulf of Mexico ............................................................................................................... 1 Economic Impacts Associated with Gulf of Mexico Oil and Natural Gas IndustryActivity .................................................................................................. 5 State Impacts ..................................................................................................... 8
Main Report ............................................................................................................. 11 1. Introduction .................................................................................................. 11 2. Data Development .......................................................................................... 14
2-1 Overview of Quest Offshore Data Development ........................................ 15 2-2 Uncertainty and Assumptions in Data Collection and Forecasting ............. 17 2-3 Allocation of Capital Investment and Operational Spending to States ........ 18
3. I/O Methodology .................................................................................... ……..21 4. Review of Capital Investment and Operational Spending ............................23
4-1 Domestic vs. International Capital Investment ....................................... ….29 4-2 Spending Trends Within and Outside of the Gulf States……………….. ......30
5. National and State Economic Impacts...………………………….…………….. 33 5-1 Naitonal Impacts ........................................................................................ 34 5-2 State and Regional Impacts ....................................................................... 37 5-3 Impacts on Other Industries ....................................................................... 40
6. Conclusions .................................................................................................... 42
Appendix 1: Summary of Non-Gulf Coast State Economic Impacts….….….46 Appendix 2: Introduction to the U.S. Gulf of Mexico’s Offshore Oil &
Natural Gas Industry .................................................................................. 67 Life Cycle of a Field Development ................................................................... 68 Assesment, Exploration, Appraisal and Definiton ............................................. 69 Concept Selection............................................................................................ 73 Project Sanctioning .......................................................................................... 82 FEED (Front-End Engineering & Design) and Detailed Engineering ................ 83 Execute ........................................................................................................... 84 Operate ........................................................................................................... 88
Appendix 3: RIMS II I/O Model Definitions ........................................................ 89 Appendix 4: Explanation of Terms ..................................................................... 91 Appendix 5: RIMS Category Summary Tables ................................................ 93
Total Summary Tables ..................................................................................... 94 Support Activities for Oil and Natural Gas Operations ...................................... 97 Oil and Natural Gas Extraction .......................................................................101 Drilling Oil and Natural Gas Wells ...................................................................105 Mining and Oil and Natural Gas Field MachineryManufacturing ......................109 Construction ...................................................................................................113
Appendix 6: Employment Summary Table .......................................................117 Estimated Historical and Projected Employment Summary Table ...................118 Appendix 7: Selected Gulf of Mexico Oil and Natural Gas Industry
Suppliers ......................................................................................................119

iii
List of Tables
Table 1: Estimated Historical and Projected Capital and Operational Spending, GDP,
and Employment Supported by the Offshore GoM Oil and Natural Gas
Industry (2008-2013).... ................................................................................... i
Table 2: Selected GoM Oil and Natural gas Industry Suppliers Outside the Gulf Coast.... ......................................................................................................... 4 Table 3: Total Estimated Historical and Projected Contribution to GDP due to the
Offshore GoM Oil and Natural Gas Industry Investments and Spending (2008-2013). .................................................................................................. 6
Table 4: Total Employment Supported by the Gulf of Mexico Offshore Oil and Gas Industry by State (2013) ............................................................................... 9
Table 5: Distance Multipliers ..................................................................................... 20 Table 6: Steps to Determine Non- GoM State Allocated Spending ............................ 20 Table 7: Determining State Spending by RIMS II Industrial Category ........................ 22 Table 8: Estimated Historical and Projected GoM Oil and Natural Gas Industry
Domestic Spending Trends by Detailed Spending Type .............................. 26 Table 9: Estimated Historical and Projected GoM Offshore Oil and Natural Gas
Industry Domestic vs. International Spending Trends .................................. 30 Table 10: Estimated Historical and Projected Gulf States vs. Non-Gulf State Total
Spending (2008- 2013) ............................................................................... 31 Table 11: Estimated Historical and Projected Key Development Equipment for
Offshore GoM Oil and Natural Gas Fields (2008-2013) .............................. 32 Table 12: Estimated Historical and Projected Gulf Coast States Spending and GDP
due to the Offshore GoM Oil and Natural Gas Industry(2008-2013) ............ 37 Table 13: Estimated Historical and Projected TX, LA, MS, AL Direct, Indirect and
Induced Employmet (2008-2013) ................................................................ 40 Table 14: Estimated Historical Sectoral GDP and Employment Impacts due to
Offshore GoM Oil and Natura Gas Industry Activity (2010) .......................... 41 Table 15: Estimated Historical and Projected Total Spending, Contributions to GDP,
and Employment Impact for Other States due to Oil and Natural Gas Operations (2008-2013) .............................................................................. 66
Table 16: Estimated Historical Offshore Drilling Rigs in Service (2009-2011) .............. 71 Table 17: Estimated Historical and Projected Number of Platforms Installed in the
GoM by Year (2008-2013) ........................................................................... 74 Table 18: Estimated Historical and Projected Number of Subsea Trees Installed in the
GoM byYear ................................................................................................ 76 Table 19: Comparison of 2010 Revenue, Income and Profit Margin for Major
Companies- Various Industries .................................................................... 82 Table 20: Average Estimated Historical 2010 GoM Deepwater Modu Day-Rates ........ 84 Table 21: Estimated Historical and Projected Pipeline Capex Spent Overseas
(2008-2013) ................................................................................................. 87 Table 22: Explanation of Terms ................................................................................... 92 Table 23: Estimated Historical and Projected Total Contribution to GDP by State
Associated with GoM Oil and Natural Gas Operations (2008-2013) .............94 Table 24: Estimated Historical and Projected Total Spending by State Associated with
GoM Oil and Natural Gas Operations (2008-2013) ...................................... 95

iv
Table 25: Estimated Historical and Projected Total Employment by State Associated with GoM Oil and Natural Gas Operations (2008-2013) ................................96
Table 26: Estimated Historical and Projected Support Activities for Oil and Natural Gas Operations Contribution to GDP by State (2008-2013) .........................98
Table 27: Estimated Historical and Projected Support Activities for Oil and Natural Gas Operations Spending by State (2008-2013) ..................................... ….99
Table 28: Estimated Historical and Projected Support Activities for Oil and Natural Gas Operations Employment by State (2008-2013) ................................. ..100
Table 29: Estimated Historical and Projected Oil and Natural Gas Extraction Contribution to GDP by State (2008-2013) ............................................... .102
Table 30: Estimated Historical and Projected Oil and Natural Gas Extraction Spending by State (2008-2013) ..................................................................103
Table 31: Estimated Historical and Projected Oil and Natural Gas Extraction Employment by State (2008-2013) .............................................................104
Table 32: Estimated Historical and Projected Drilling Oil and Natural Gas Wells Contribution to GDP by State (2008-2013) .................................................106
Table 33: Estimated Historical and Projected Drilling Oil and Natural Gas Wells Spending by State (2008-2013) ..................................................................107
Table 34: Estimated Historical and Projected Drilling Oil and Natural Gas Wells Employment by State (2008-2013) .............................................................108
Table 35: Estimated Historical and Projected Mining Oil and Natural Gas Field Machinery Manufacturing Contribution to GDP by State (2008-2013) .........110
Table 36: Estimated Historical and Projected Mining Oil and Natural Gas Field Machinery Manufacturing Spending by State (2008-2013) .........................111
Table 37: Estimated Historical and Projected Mining Oil and Natural Gas Field Machinery Manufacturing Employment by State (2008-2013).....................112
Table 38: Estimated Historical and Projected Construction Contribution to GDP by State (2008-2013) ......................................................................................114
Table 39: Estimated Historical and Projected Construction Spending by State (2008-2013) ................................................................................................115
Table 40: Estimated Historical and Projected Construction Employment by State (2008-2013) ................................................................................................116
Table 41: Estimated Historical and Projected Employment Associated with GoM Oil and Natural Gas Industry Operations Summary Table (2008-2013) ..................118
Table 42: Selected Gulf of Mexico Oil and Natural Gas Industry Suppliers .................121

v
List of Figures
Figure 1: Estimated Historical and Projected Offshore GoM Oil and Natural Gas
Industry Domestic Spending (2008- 2013) ................................................... 2
Figure 2: Estimated Historical and Projected Number of Projects and Capital
Expenditures in the GoM (2008-2013) ........................................................... 3 Figure 3: Estimated Historical and Projected Direct, Indirect and Induced
Employment due to the Offshore GoM Oil and Natural Gas Industry Activity (2008-2013) ................................................................................................. 7
Figure 4: Estimated Historical and Projected Spending of the GoM Offshore Oil and Natural Gas Industry in Gulf Coast and Non-Gulf Coast States (2008-2013) ................................................................................................. 8
Figure 5: Estimated Historical and Projected Employment in Gulf Coast and Non-Gulf Coast States due to GoM Offshore Oil and Natural Gas Industry Activity (2008-2013) ..................................................................................... 9
Figure 6: Quest Offshore, Inc.- Simplified Data Collection and Research Model ...... 16 Figure 7: Quest Spending Categories ...................................................................... 17 Figure 8: Estimated Historical and Projected GoM Oil and Natural Gas Spending
Trends by Type of Spending (2008-2013) .................................................. 24 Figure 9: GoM Deep and Shallow Water Drilling Permit Approvals ........................... 27 Figure 10: Estimated Historical and Projected GoM Oil and Natural Gas Production
Trends(2008-2013) ................................................................................... 29 Figure 11: Estimated Historical and Projected Total Employment Supported by GoM
Oil and Natural Gas Industry Activity (2008-2010) ...................................... 34 Figure 12: Estimated Historical and Projected Total Spending and Contribution to
GDP of GoM Oil and Natural Gas Industy Activity (2008-2013) .................. 35 Figure 13: Estimated Historical and Projected Direct and Indirect/Induced Jobs in
Gulf Coast States Supported by GoM Oil and Natural Gas Industry Activity vs. Other States (2008-2013) ..................................................................... 39

1
Executive Summary
The offshore oil and natural gas industry is
instrumental to the United States both from
an energy supply perspective and due to its
contribution to U.S. GDP and job creation. In
2010, over 30 percent of the oil and 11
percent of the natural gas produced in the
United States was produced in the Gulf of
Mexico (GoM). This production is crucial to
U.S. energy security. In addition, capital
investment and purchases of intermediate
inputs of the oil and natural gas industry
stimulate its entire value chain and ripple
through many sectors of the economy,
creating jobs, contributing to GDP and
generating tax revenue at all levels of
government. Oil and natural gas industry
activity supports employment across a wide
swath of industries in manufacturing and
services, including oil and natural gas
machinery, air and marine transport, legal
and insurance services.
This report builds out the entire value chain
of oil and natural gas development and
production in the Gulf of Mexico. It quantifies
the capital investment and purchases of
intermediate goods undertaken by the oil
and natural gas industry, identifies linkages
to supplying industries, and estimates both
job creation and contribution to GDP
associated with oil and natural gas
development. A unique feature and strength
of this study is the primary nature of the
capital investment and spending data. Quest
Offshore Resources, Inc. (Quest), drawing
on its proprietary database of suppliers of
capital equipment and intermediate goods to
Gulf of Mexico oil and natural gas
operations, is able to bring primary data to
bear on the issues of importance to this
study.
Capital Investment and Spending
of the Oil and Natural Gas
Industry – Gulf of Mexico
Historical Spending 2008-2010
The development of oil and natural gas
resources in the offshore Gulf of Mexico is
highly capital intensive. Total industry
investment and spending in the GoM is
estimated to have been $80 billion from
2008 to 2010 or an average of $26.5 billion
a year2 (Figure 1). Capital investments,
which are required to bring new oil and
natural gas production online, totaled $28.0
billion over the same three-year period,
averaging $9.3 billion per year over this
period. Operating expenditures, which are
comprised of purchases of intermediate
inputs totaled $51.6 billion or an average of
$17.2 billion per year3.
2 Industry investment and spending includes labor
associated with design, fabrication, and installation. 3 Operating expenditures include labor for operations.

2
Figure 1: Estimated Historical and Projected Offshore Gulf of Mexico Oil and Natural Gas
Industry Domestic Spending (2008-2013)*
$0
$5
$10
$15
$20
$25
$30
$35
$40
$45
2008 2009 2010 2011 2012 2013
Bil
lio
ns
Capital Expenditures
Operating Expenditures
Total Spending
* Projected spending contingent on returning to pre-Macondo permitting rates.
Source: Quest Offshore Resources, Inc.
Total spending in the Gulf of Mexico
declined 15 percent over the 2008 to 2010
time period from $28.5 billion to $24.2 billion
per year. Operational expenditures
increased slightly during that period while
capital expenditures plummeted by 46
percent. The principal reasons for reduced
GoM capital investment were declining
energy prices, the economic recession
which began in late 2008, and the
establishment of a deepwater drilling
moratorium and subsequent reduced
offshore permitting following the Macondo
incident in 2010. The 10 percent year-to-
year decline in total spending and 33
percent decline in capital spending from
2009 to 2010 were due in large part to the
drilling moratorium. Approximately one-third
of the 2010 decline in capital investment
was due to reductions in GoM shallow water
capital investment even though the shallow
water was not directly subjected to the
drilling moratorium. Shallow water drilling
significantly slowed due to a slowdown in
permitting activity.
Quest’s forecasts for Gulf of Mexico
spending are based on actual project
developments in the Gulf of Mexico. Quest
tracks individual projects4 on a day to day
basis and utilizes actual contracts (when
available) and historical benchmark data to
4 Projects are defined as oil field developments or oil field development components.

3
best ascertain the timing and scope of future
projects (Figure 2). This project data,
coupled with historical benchmarks of
spending for various equipment and
services, provide the basis for Quest’s
capital investment projections. Operational
expenditures are determined using actual
expenditure data where possible. When
actual operational expenditures are not
known, operational expenditures are
determined through benchmarking against
comparable projects on a project by project
basis.
Figure 2: Estimated Historical and Projected Number of Projects and Capital Expenditures
in the Gulf of Mexico (2008-2013)*
* Projected number of projects contingent on returning to pre-Macondo permitting rates.
Source: Quest Offshore Resources, Inc.
Quest has identified key providers to the oil
and natural gas supply chain throughout the
country, both along the Gulf Coast region
and in other parts of the United States.
A sample of companies that contribute to the
offshore oil and natural gas industry is
identified in Table 2.
0
20
40
60
80
100
120
140
2008 2009 2010 2011 2012 2013
Nu
mb
er
of P
roje
cts
Installation Year
Historical Shallow Water Projected Shallow Water
Historical Deepwater Projected Deepwater
72
Pro
jects
$1
7.0
Billio
n4
2 Pro
jects
$11.6
Billio
n
53
Pro
jects
$12.7
Billio
n27
Pro
jects
$14
.2 Billio
n
31 P
roje
cts
$11
.0 B
illion
27
Pro
jects
$1
4.4
Billio
n
90 P
roje
cts
$16
.1 Billio
n
28
Pro
jects
$1
6.2
Billio
n
83 P
roje
cts
$19.2
Billio
n
37
Pro
jects
$2
0.1
Billio
n
83
Pro
jects
$21.3
Billio
n
23 P
roje
cts
$1
3.2 B
illion

4
Table 2: Selected Gulf of Mexico Oil and Natural Gas Industry Suppliers
Source: Quest Offshore Resources, Inc. Please see Appendix 7 for a more comprehensive company list of Gulf of Mexico suppliers.
State Company What they do?
Alabama Alabama Drydock & Shipping Company Marine Production Facility
Alaska RJE International Inc Supplier of Subsea Communication Systems
Arizona Valley Forge & Bolt Manufacturing Co. Manufacture Fasteners
Arkansas Baldor Electric Company Manufacture Electrical Industrial Motors, Drives and Generators
California Compass Water Solutions Specialized Water Solutions
Colorado BAND- IT Engineer Band Clamping and Fastening Solutions
Connecticut APS Technology Oilfield Equipment Manufacturer
Delaware DuPont Upstream Oil and Gas Technology Solutions
Florida Oceaneering Manufacture Umbilicals
Georgia WIKA Instrument Corporation Pressure & Temperature Messurement Solutions
Hawaii Structural Solution Architecture Design and Engineering
Illinois Caterpillar Power Generation
Indiana Trellborg Insulation and Pipeline Technologies
Iowa Fisher Valves High Pressure Valves
Kansas KMT Aqua- Dyne Water Blasting Technologies and Solutions
Kentucky General Cable Communications Wire and Cable
Louisiana McDermott Fabricator & Installer for Offshore Structures
Maine Flotation Technologies R&D and Maufacturing Distributed Buoyancy Offshore Oil and Gas
Maryland Aerotek Staffing Solutions
Massachusetts Cashman Equipment Corporation Material Barges
Michigan Dow Chemical Pipeline and Subsea Equipment Insulation & Coatings
Minnesota 3M Corporation Foams for Pipeline Insulation
Mississippi Ingalls Shipbulding Construction and Repair for Commercial Marine Structures
Missouri Emerson Electric Provider of Process Management, Topsides Automation
Nebraska Pieter Kiewit and Sons Engineer and Build FPS Topsides and Platforms
Nevada GE Energy Measurement and Control
New Hampshire Sponge- Jet, Inc. Abrasive Blasting
New Jersey Honeywell Topsides and Control Systems, High Performance Fibers
New Mexico Murchison Drilling Schools Drilling Training
New York Rotork Manufacture Valve Actuators & Control Systems
North Carolina SOS Global Express Transport Specialist
North Dakota Revel Digital Technology Management
Ohio Parker Corporation Umbilicals, Mooring Systems
Oklahoma Roxtec Cable and Pipe Sealing Solutions
Oregon Sulzer Pumps Manufacture Centrifugal Pumps
Pennsylvania Whitehill Manufacturing Mooring Rope Manufacturing
Rhode Island Bad Dog Tools Manufacture Tools
South Carolina Zues, Inc. Polymer Extrusionist and Material Science
South Dakota Sioux Corporation Drill Pipe Environment Cleaner
Tennessee Thomas & Betts Corporation Manufacture Specialty Electric Connectors
Texas Baker Hughes Oilfield Service
Utah TankLogix Machine Automation
Vermont Superior Technical Ceramics Corporation Custom Technical Ceramic Parts and Components
Virginia Marine Spill Response Corporation Spill Response Services
Washington Rasmussen Equipment Company Energy and Environmental Research and Development
West Virginia PCC Energy Group Equipment and Pipe Manufacturer
Wisconsin Veolia VES Special Services Offshore Oil and Gas and Inland Marine Services

5
Projected Spending 2011-2013
The vast majority of the Gulf of Mexico oil
and natural gas industry expenditures are
spent domestically. Less than five percent of
GoM operational spending and capital
investment is spent outside the U.S. Total
domestic spending levels are projected to
increase from the 2010 level of $24.2 billion
to $41.4 billion by 2013, a 71 percent
increase. Capital expenditures are projected
to reach $15.7 billion in 2013, a 141 percent
increase from 2010 levels. Crucial to
Quest’s spending/investment projection is
the assumption that permitting rates in the
Gulf of Mexico return to their pre-Macondo
levels. To the extent that this does not
happen, all spending and economic
projections in this report would need to be
revised downward accordingly.
The unique confluence of the global
economic recession, volatile energy prices,
the deepwater drilling moratorium, and the
slow down in GoM permit rates have aligned
to drop Gulf of Mexico offshore spending to
its lowest level in years. These factors have
contributed to a large back log of projects
which operators are expected to develop
assuming a balanced regulatory
environment going forward. If this backlog of
existing projects is developed in a timely
manner spending by the Gulf of Mexico
offshore oil and natural gas industry could
change course and resume an upward
trend. This rise in capital and operational
spending would also facilitate an increase in
employment, contributions to GDP, and tax
revenues at all levels of government.
Economic Impacts Associated
with Gulf of Mexico Oil and
Natural Gas Industry Activity
Quest estimated both the employment and
GDP impacts associated with offshore Gulf
of Mexico oil and natural gas industry
investment and spending at both national
and state levels. Our estimated economic
impacts are likely conservative because they
do not take into account the benefits of
increased government revenue from bonus
bids, royalties, and corporate income taxes.
They also do not account for the economic
impact associated with certain profit type
income.
As expected, the GDP and employment
impacts track the pattern of
spending/investment, declining over the
historical period from 2008 to 2010 and
rising over the projected period of 2011 to
2013. The GDP impacts decreased by an
estimated 15 percent from 2008 to 2010,
largely attributable to the same forces
driving the spending reduction over this
period. The total U.S GDP impact
associated with offshore Gulf of Mexico oil
and natural gas industry spending is
projected to improve to $32.9 billion in 2011,
after falling to its lowest level in the study
period in 2010 at $26.1 billion. (Table 3) If
the issuance of permits returns to

6
pre-Macondo levels required to support
planned developments, the total contribution
to U.S. GDP is expected to reach $44.5
billion by 2013, a 70% increase over the
2010 level. To the extent that permitting
rates do not return to historical levels, these
estimates would need to be adjusted
downwards.
Table 3: Total Estimated Historical and Projected Contribution to Gross Domestic Product
due to the Offshore Gulf of Mexico Oil and Natural Gas Industry Investments and
Spending, $billions (2008-2013)*
* Projected GDP impacts contingent on returning to pre-Macondo permitting rates.
Source: Quest Offshore Resources, Inc.
Similar to GDP impacts, estimates of total
employment (direct, indirect and induced
jobs5) associated with offshore Gulf of
Mexico oil and natural gas industry
investments reached its lowest level over
the study period in 2010 (Figure 3). Even so,
the GoM offshore oil and natural gas
industry is a significant provider of
employment in the United States, with an
estimated 242 thousand jobs supported by
industry activity in 2010. Quest estimates
that over 60 thousand of these jobs were
within the oil and natural gas industry and
180 thousand were either indirect (providing
equipment and services to the offshore Gulf
of Mexico oil and natural gas industry) or
induced jobs. For 2010, Quest estimated a
5 Direct employment is defined as jobs within the oil and natural gas industry. Indirect employment occurs throughout the supply chain of the oil and natural gas industry. Induced employment is jobs supported by household spending of labor income earned either directly or indirectly from oil and natural gas business activity.
15 percent reduction in total jobs associated
with GoM oil and natural gas industry activity
compared to 2009. Likewise, the 2009
employment level is estimated to be 7
percent below 2008 levels. Employment in
2011 is expected to grow to 310 thousand
jobs, a 28 percent increase on 2010 due to
increased investments associated with long
delayed projects. This estimate is likely
optimistic given the current rate of
permitting. Employment levels in 2012 are
expected to increase by 15 percent
compared to 2011 to 350 thousand jobs. In
2013, employment is projected to reach its
highest level in the study period at 430
thousand jobs which is a 20 percent
increase on the 2012 level and a 77 percent
increase over the 2010 level.
2008 2009 2010 2011 2012 2013
GDP Impact
Associated w ith GoM$30.8 $29.1 $26.1 $32.9 $38.2 $44.5
Historical Projected

7
Figure 3: Estimated Historical and Projected Direct, Indirect and Induced Employment6due
to Offshore Gulf of Mexico Oil and Natural Gas Industry Activity (2008-2013)*
* Projected employment contingent on returning to pre-Macondo permitting rates.
Source: Quest Offshore Resources, Inc.
6 Employment is defined as total payroll, and self employed employment inclusive of part time workers. Includes employment throughout the U.S. including states outside the Gulf region.
0
50,000
100,000
150,000
200,000
250,000
300,000
350,000
400,000
450,000
500,000
2008 2009 2010 2011 2012 2013
Nu
mb
er
of
Jo
bs
Historical ─ Direct Projected ─ Direct
Historical ─ Indirect and Induced Projected ─ Indirect and Induced

8
State Impacts
The majority of the spending/capital
investments and therefore the majority of the
associated economic impacts are estimated
to occur in the four main producing Gulf
coast states: Texas, Louisiana, Mississippi,
and Alabama. In 2010, 72 percent of
spending and investment, or approximately
$17.5 billion, is estimated to have occurred
in the four Gulf States (Figure 4), down 19
percent from 2008. Total employment in the
four GoM states supported by the offshore
Gulf of Mexico oil and natural gas industry is
estimated to have been 175 thousand in
2010, a decrease of 60 thousand (25
percent) from 2008 (Figure 5). The Gulf
State’s direct oil and natural gas industry
employment is estimated to have dropped
by 25 thousand jobs over the same time
period.
Figure 4: Estimated Historical and Projected Spending of the Gulf of Mexico Offshore Oil
and Natural Gas Industry in Gulf Coast States and Non-Gulf States (2008-2013) *
* Projected spending contingent on returning to pre-Macondo permitting rates.
Source: Quest Offshore Resources, Inc.
$0
$5
$10
$15
$20
$25
$30
$35
$40
$45
2008 2009 2010 2011 2012 2013
Sp
en
din
g in
$B
illi
on
s
Historical ─ Gulf States Projected ─ Gulf States
Historical ─ Non-Gulf States Projected ─ Non-Gulf States

9
Figure 5: Estimated Historical and Projected Employment in Gulf Coast States and Non-
Gulf States due to Gulf of Mexico Offshore Oil and Natural Gas Industry Activity (2008-
2013)*
* Projected employment contingent on returning to pre-Macondo permitting rates.
Source: Quest Offshore Resources, Inc.
Table 4: Total Employment Supported by the Gulf of Mexico Offshore Oil and Gas Industry
by State (2013)
* Projected employment contingent on returning to pre-Macondo permitting rates.
Source: Quest Offshore Resources, Inc.
0
50,000
100,000
150,000
200,000
250,000
300,000
350,000
400,000
450,000
500,000
2008 2009 2010 2011 2012 2013
Nu
mb
er
of
Jo
bs
Historical ─ Gulf States Projected ─ Gulf States
Historical ─ Non-Gulf States Projected ─ Non-Gulf States
Alabama 48,793 Nebraska 971
Alaska 3,116 New Jersey 480
Arkansas 4,355 New Mexico 12,842
California 22,216 New York 165
Colorado 14,582 North Dakota 143
Florida 1,340 Ohio 6,150
Illinois 2,842 Oklahoma 20,000
Indiana 871 Pennsylvania 3,911
Kansas 2,559 Tennessee 148
Kentucky 1,522 Texas 140,213
Louisiana 129,108 Utah 1,570
Michigan 721 Virginia 978
Minnesota 191 West Virginia 1,555
Mississippi 3,359 Wisconsin 1,272
Missouri 990 Wyoming 2,010
Montana 161

10
We estimate that supported employment
levels could exceed 320 thousand in the four
Gulf Coast states by 2013 if projected
spending and investment levels are met
(Table 4). This would represent an 80
percent increase over the 2010 employment
levels and would be comprised of
approximately 85 thousand direct industry
jobs and 235 thousand indirect and induced
jobs. Reaching these employment levels will
require a return to pre-Macondo permitting
rates and a balanced regulatory
environment that allows for a resumption of
environmentally safe development and
production.
The positive economic impacts of the
offshore oil and natural gas industry
investments/spending in the Gulf of Mexico
are not restricted to the Gulf States or
limited to the oil and natural gas industry.
They are spread over a wide geographic
area and ripple through many sectors of the
economy, from oil and natural gas
machinery manufacturers to marine and air
transport services to food service providers
servicing offshore operations and financial
companies that provide financial services
and insurance to the industry. The offshore
Gulf of Mexico oil and natural gas industry is
estimated to have spent $6.7 billion in 2010
outside the Gulf Coast states. This
accounted for 35 percent of annual
investment/spending and supported 65
thousand jobs in the non-Gulf of Mexico
Coast States. The 2010 spending was 4
percent lower than in 2008 with employment
7 percent lower. In 2013, Quest projects
spending in the non-Gulf States due to the
offshore Gulf of Mexico activity to increase
to $10.8 billion as operators invest heavily to
bring forward delayed projects. This
estimated 29 percent increase in spending
from 2010 is projected to spur an expansion
of non-Gulf State employment to 110
thousand, a 66 percent increase.
While the industry remains committed to
developing the natural resources located in
the Gulf of Mexico, they will only be able to
do so according to the speed with which
offshore drilling permits are granted. Quest’s
projections of domestic spending increasing
by 71 percent from 2010-2013, contributions
to GDP increasing by 70 percent, and
employment increasing 77 percent are all
predicated on the assumption of a return to
historical rates of permitting.
Growth of the offshore Gulf of Mexico oil and
natural gas industry will be crucial for
meeting U.S. energy needs over the coming
decades, and for spurring job creation and
economic growth. In light of the potential of
the offshore oil and natural gas industry to
create jobs, enhance U.S. energy security,
and increase U.S. GDP, the return to normal
activity in the Gulf of Mexico in a safe and
environmentally responsible manner is of
utmost importance to the United States.

11
1. Introduction

12
Production of oil and natural gas from the
offshore Gulf of Mexico (“GoM”) provides a
significant share of total U.S. oil and natural
gas production. Approximately 1.6 million
barrels per day of crude oil or 30 percent of
2010 domestic oil production, and 6.7 billion
cubic feet per day of U.S. natural gas
production (11 percent) originated from the
GoM7. The development of these resources
provides positive economic impacts to our
nation’s economy in terms of employment,
GDP and tax revenues. It is also crucial to
U.S. energy security.
Quest Offshore Resources, Inc. (Quest) was
commissioned by the American Petroleum
Institute (API) and the National Ocean
Industries Association (NOIA) to provide an
evaluation of the impacts of offshore GoM oil
and natural gas development. Quest is a
full-service market research and consulting
firm focused on the global deepwater oil and
natural gas industry. Much of the analysis in
this report relies on information that Quest
has received directly from companies
operating in the GoM. This report assesses
the total economic impacts of GoM
development (both shallow and deepwater)
on the U.S. economy as a whole as well as
estimates of economic contributions to
individual states.
This analysis accounts for all offshore GoM
capital investment and operational spending
through the entire “life cycle” of offshore
operations. Every offshore oil or natural
7 Source: Energy Information Administration. Includes offshore state waters.
gas project must go through a series of
steps in order to be developed. Initial
expenditures necessary to identify targets
and estimate the potential recoverable
resources in place include seismic surveys
and the drilling and evaluation of exploration
wells. For projects that are commercially
viable, the full range of above and below
water equipment must be designed and
purchased. Offshore equipment includes
production platforms and potentially on-site
processing facilities as-well as below water
equipment generally referred to as SURF
(Subsea, Umbilicals, Risers and Flowlines).
Finally the equipment must be installed and
additional development wells must be
drilled. The full process necessary to bring
an offshore field to production from initial
appraisal to operation is detailed in
Appendix 2.
This report is structured as follows.
Preceding this introductory section is the
Key Findings and Executive Summary
outlining all principal results and conclusions
of this report. Immediately following this
section is the Data Development section
outlining how Quest gathers data on current
projects and creates projections of future
offshore industry spending. Following this is
the I/O Methodology section that outlines
how economic impacts from offshore
spending are estimated as well as how
these impacts are allocated among the
individual states. In the next section we
review recent historical offshore capital
investment and operational spending as well

13
as project spending through 2013. The
following section details the estimated
national and individual state economic
impacts including number of jobs supported
as well as contributions to GDP. The final
section of the report summarizes the main
conclusions and results. Appendixes
included in this report are:
• Appendix 1: Summary of Non-Gulf
Coast State Economic Impacts
• Appendix 2: An Introduction to the
Offshore Oil & Natural Gas Industry
• Appendix 3: RIMS II I/O Model
Definitions
• Appendix 4: Explanation of Terms
• Appendix 5: RIMS Category
Summary Tables
• Appendix 6: Employment Summary
Table
• Appendix 7: Gulf of Mexico Oil and
Natural Gas Industry Suppliers
Quest Offshore is providing this study on
the impacts of Gulf of Mexico offshore oil
and natural gas development under the
assumption that permits for offshore drilling
which began to be reissued during the first
half of 2011, will continue to be issued at
an increasing pace throughout the year,
and ultimately arriving back at pre-
Macondo rates. To the extent that this is
not the case, all spending and economic
projections in this report would need to be
revised downward accordingly.

14
2. Data Development

15
2-1 Overview of Quest Offshore
Data Development
Quest Offshore Resources, Inc. is a full-
service market research and consulting firm
focused on the global deepwater oil and
natural gas industry. As a function of
Quest’s core business, the company is daily
engaged in the collection and analysis of
data as it relates to the offshore oil and
natural gas industry. Quest serves the global
community of operating oil and natural gas
companies, their suppliers, financial firms,
and many others by providing detailed data
and analysis on capital investment and
operational spending undertaken by the
offshore industry.
Quest collects and develops market data
from a variety of sources at the project-level
(Figure 6). A unique feature of this analysis,
and which lends it high credibility, is its
reliance on primary data through direct
contact with the industry’s supply chain. This
connection with operating oil and natural gas
companies through to the smallest of
equipment and service providers imparts a
high quality/accuracy to the data. This data
is tracked in Quest’s proprietary Quest
Enhanced Deepwater Development
Database as well as other proprietary
databases related to shipyards and other
facets of the supply chain. Quest builds up
capital and operating expenditures on a
project by project basis, with detailed
information recorded on the supply of the
equipment and services necessary to
develop offshore oil and natural gas
projects. Quest Offshore tracks not only
existing or historical projects, but also
projects that are in all stages of
development from the prospect (or undrilled
target) stage through to development. For
projects without firm development
information, Quest utilizes benchmarking
based on Quest’s proprietary databases to
forecast development timing and scenarios;
this information coupled with operators
expected exploration and appraisal
programs are used to take into account yet
to be discovered and delineated fields that
may be developed in the forecast time
frame.

16
Figure 6: Quest Offshore, Inc. - Simplified Data Collection and Research Model
Source: Quest OffshoreResources, Inc.
Secondary data development was also
undertaken in this analysis and refers to any
source of information and data that is not
collected via direct contact with the industry,
such as press releases, financial reports
(and other SEC filings), industry white
papers, industry presentations, and other
publicly available sources. The designation
of “Tertiary” data collection was reserved for
areas of research that fell outside of the
offshore oil and natural gas industry. This
information was collected in the same
manner as described for secondary data
development and relied heavily on public
sources of information.
This proprietary approach allows Quest to
ensure a comprehensive “canvassing” of the
industry, which in turn facilitates a high level
of validation and quality control needed to
produce accurate analysis and forecasts.
Once collected and verified, the data is
housed and maintained in Quest Offshore’s
Deepwater Development Database. The
primary components of this proprietary
database are the numerous pieces of
offshore oilfield equipment and services that
are used in the development of an offshore
project.
Quest Offshore’s estimation of domestic
GoM offshore spending was delineated into
four primary categories (Geoseismic and
Geophysical (G&G), Drilling, Subsea
Equipment and Facilities), which were then
cross classified according to shallow water
and deepwater, capital and operations
spending and further by engineering and
labor, procurement, and fabrication and
installation (Figure 7).
Project-Level
Data
Primary Sources
Secondary Sources
Quest Data Validation Process
Quest Offshore Deepwater
Development Database
Market Data & Analysis
Tertiary Research
Quest Supplemental Databases / Offline
Data Records
Client-Directed Consulting
Rese
arc
h &
Data
Con
sult
ing

17
Figure 7: Quest Spending Categories
Shallow Water Deepwater
Capex Opex
Engineering & Labor
Procurement & Fabrication
Installation
Capex Opex
Engineering & Labor
Procurement & Fabrication
Installation
G & G Drilling Subsea Equip. Facilities
Source: Quest Offshore Resources, Inc.
These categories represent the four main
expenditure classes of offshore oil and
natural gas production, and roughly follow
the life cycle of a field described in the “Life-
Cycle of a Field Development” section
(Appendix 2). G&G or geological and
geophysical describes the work done before
drilling to identify drilling prospects, drilling
constitutes the actual drilling of the wells,
while subsea equipment and facilities
constitutes the two major capital
expenditures related to the equipment
needed to bring the field into production.
Facilities are platforms and floating
production units that act as the physical
location where oil or natural gas is initially
produced as well as drilling and control
centers. Subsea equipment includes trees,
pipelines, umbilicals and other associated
equipment.
Information on the number of historical
shallow water platforms, pipelines and wells
was collected from the Bureau of Ocean
Energy Management and was combined
with Quest’s forecast of shallow water
platforms and wells to provide information
on the number of shallow water
developments for historical and forecast
years. This information was then combined
with estimated costs for the various
equipment pieces to provide estimates of
capital investment. Operational costs were
based on known operating costs for facilities
and were extrapolated for unknown facilities
based on benchmarks according to facility
type, facility size, production, and age.
2-2 Uncertainty and Assumptions
in Data Collection and Forecasting
As with any market forecast, the projections
provided herein are subject to change
according to the dynamics of the offshore oil
and natural gas industry and
macroeconomic conditions. While Quest has
provided the spending numbers according to
a sound forecasting methodology that has

18
been widely accepted throughout the
industry, there will remain some margin of
error (or uncertainty) when assessing long-
term activity for individual companies. Also,
a changed economic outlook or regulatory
environment could have a significant impact
on the forecast contained herein. In
particular, this analysis assumed that
permitting rates in the Gulf of Mexico return
to their pre-Macondo levels over the 2011 to
2013 period. To the extent that this does not
happen, capital investment and associated
economic impacts would need to be
adjusted downward.
2-3 Allocation of Capital
Investment and Operational
Spending to States
The data compiled for this analysis allows
for a comprehensive characterization of the
complete value chain associated with oil and
natural gas field developments in the Gulf of
Mexico. In particular, this data provides
Quest with the ability to tie offshore capital
investment with specific pieces of equipment
for known and named offshore field
development projects. Hence, Quest
believes that both historical and projected
capital investment projections provided
herein are based upon the highest quality
data available, and are realistic given the
universe of development projects that are
assumed to be undertaken through 2013.
Additionally, due to the level of detail
available in Quest’s data, Quest is able to
track the supply chain involved in the
offshore oil and natural gas industry. This
allows Quest to provide accurate information
on the supply chain accounting for a majority
of capital spending which enables Quest to
allocate a majority of historical spending to
the location where it was spent. Quest has
utilized these actual historical spending
breakdowns to extrapolate the spending
locations for future projects, which should
continue to provide an accurate depiction of
the location of supplies associated with
primary offshore oil and natural gas capital
investment and operational spending.
When determining spending by state, Quest
has relied on its industry experience to
assign the cost of equipment to certain
states based on known manufacturing
contracts placed with equipment providers.
For example, via the data contained in
Quest’s database, spending for a subsea
production system can be tied directly to a
specific state based on which manufacturer
is producing the final product (given Quest’s
knowledge of oilfield equipment
manufacturing locations). Platform and
floating production unit construction takes
place at shipyards in known locations so this
spending is placed into the appropriate
states. Other key equipment manufacturing
and support services also take place at
known location allowing this spending to be
accurately placed in the appropriate state as
well. This level of spending – referred to
herein as “Primary Spending” – represents
the cost for goods and services that can be
assigned to certain components of
equipment by location, and accounts for

19
over half of the total annual spending.
Quest’s proprietary database provides this
level of detail for all major components of
developments, which allows Quest to track
manufacturing, construction and installation
locations for projects in the Gulf of Mexico.
Quest used this data to determine historical
spending trends by state for those parts of
developments with known manufacturing
locations. Quest then utilized these historical
trends to project spending locations by state
associated with potential future projects.
Allocation of spending across states was
carried out as follows. Initially each state
was apportioned the primary spending that
could be reasonably determined due to
Quest’s knowledge of the oil and natural gas
supply chain. Due to the complexity of the
offshore Gulf of Mexico oil and natural gas
supply chain some of the state locations for
some spending could not be determined
with certainty. This spending (referred to as
allocated) was divided into two sections,
spending occurring within one of the four
GoM states and spending deemed to have
occurred outside the GoM region.
For the Gulf of Mexico states, the allocated
spending was partitioned by state based
upon the need for the equipment and
services in offshore Gulf operations and the
assessed ability of each Gulf of Mexico state
to provide them.
The non-Gulf of Mexico allocated spending
was assigned to states using a measure of
oil and natural gas industry “intensity” by
state.
A measure of oil and natural gas intensity by
state was developed with Bureau of
Economic Analysis state level data on oil
and natural gas production, manufacturing
of oil and natural gas equipment and
support services, and engineering and
management services provided to the oil
and natural gas industry.
Quest weighted the state level oil and
natural gas intensity factors by distance
factors (given below) under the assumption
that the further the distance between the
state and the GoM, the less likely it is that
the allocated spending occurred there.

20
Table 5: Distance Multipliers
Source: Quest Offshore Resources, Inc.
This resulting weighted state intensity factors were employed to determine each state’s share of
allocated non-Gulf of Mexico capital investment and operational spending.
Table 6: Steps to Determine Non-Gulf of Mexico State Allocated Spending
Source: Quest Offshore Resources, Inc.
Band Distance Multiplier Example of States
Band 1 36% AL, LA, MS, TX
Band 2 25% GA, AR, FL, TN
Band 3 16% MO, NC, KY, IL
Band 4 12% NE, IA, CO, MD
Band 5 8% UT, WY, NY, CT
Band 6 2% AK, HI, MT, ND
Step Number Determining Non-GoM State Allocated Spending
1 Calculate total non-GoM allocated spending
2 Calculate state oil and gas intensity factor
3 Calculate distance weighted state oil and natural gas intensity factor
4 Calculate state share of non-GoM allocated spending
5 Calculate state GoM allocated spending

21
3. I/O Methodology

22
Rims II Input/Output8 multipliers from the
Bureau of Economic Analysis were
employed to estimate GDP and employment
impacts from the estimated capital
investment and operational spending data.
Rims II multipliers give contribution to GDP
and employment per unit increase in final
per dollar spending. For each state and for
each year primary and allocated spending
were partitioned into five BEA industrial
sectors corresponding to the relevant Rims
II multipliers (drilling oil of natural gas wells,
support activities for oil and natural gas
operations, construction, oil and natural
8 For a more detailed explanation of the RIMS II
multipliers please see Appendix 2.
gas extraction, mining and oil and natural
gas field machinery manufacturing). This
was accomplished by dividing spending
according to the activity type this spending
entailed, e.g. drilling spending to the drilling
category, manufacturing to the
manufacturing category, etc. Primary and
allocated spending across these categories
was then summed to provide yearly state by
state totals for each category (Table 7).
Direct and indirect/induced employment
impacts were derived from total employment
impacts. This was accomplished by utilizing
the detailed industry effects of spending
provided by the BEA RIMS II model
multipliers (which detail the industry by
industry activity for each spending category).
Reported national GDP impacts and
employment are the sum total of the
individual state impacts.
Table 7: Determining State Spending by RIMS II Industrial Category
Step Number Determining State Spending by Category
2 Apportion State Primary Spending by RIMS II Industrial Category
3 Apportion State Allocated Spending by RIMS II Industrial Category
4 Calculate Total Spending by RIMS II Industrial Category
5 Sum State Totals to Calculate National Impacts
Source: Quest Offshore Resources, Inc.
State level GDP impacts were estimated by
multiplying the capital and operational
spending (partitioned into BEA industrial
sectors as described above) by the
corresponding Rims II GDP multipliers and
summing the products. Quest followed the
same procedure to estimate employment
impacts for each state, using the
appropriate spending and corresponding
Rims II employment multipliers.

23
4. Review of Capital Investment and Operational Spending

24
The U.S. Gulf of Mexico’s offshore oil and
natural gas industry invests billions of dollars
each year for the development and
operation of offshore oil and natural gas
fields that provide critical energy resources
to the country. The annual sums invested in
the Gulf of Mexico are regularly in the tens-
of-billions of dollars range, making this
sector one of the most capital intensive
industries in the economy.
Spending due to the offshore Gulf of Mexico
oil and natural gas industry in 2008 was
$28.5 billion. For 2009, due primarily to the
global recession, spending fell 6 percent to
$26.9 billion. In 2010, spending again
declined to $24.2 billion despite the
economy beginning to recover. This 10
percent decrease was due primarily to the
drilling moratorium and the slowdown in
permitting after the Macondo incident. The
impacts of the moratorium are more
accurately indicated by the 33 percent
decrease in capital spending9 from 2009 to
2010, which fell to $6.4 billion from $9.6
billion (Figure 8).
9 Capital spending includes labor associated with design, fabrication, and installation
$0
$5
$10
$15
$20
$25
$30
$35
$40
$45
2008 2009 2010 2011 2012 2013
Bil
lio
ns
Capital Expenditures
Operating Expenditures
Total Spending
Figure 8: Estimated Historical and Projected Gulf of Mexico Offshore Oil and Natural
Gas Spending Trends by Type of Spending (2008-2013)*
* Projected spending contingent on returning to pre-Macondo permitting rates.
Source: Quest Offshore Resources, Inc.

25
Of the $24.2 billion in spending in 2010,
operational expenditures10
accounted for 64
percent of total spending (its highest over
the 2010-2013 period) due to a major
decrease in capital investment of 46 percent
compared to 2008. Capital expenditures are
expected to be highest over the study period
relative to operating expenditures in 2013 at
$15.7 billion, or 38 percent of total
expenditures of $41.4 billion. A significant
backlog of projects are expected to proceed
if and when regulatory uncertainties are
removed.
While the federal moratorium on offshore
deepwater drilling activity and subsequent
regulatory changes caused (and are still
10 Operational spending includes labor for operations.
causing) significant reductions in spending,
the future for the region has the potential to
be very positive and could see increasing
levels of spending under a balanced
regulatory environment. It should also be
noted that shallow water spending activity in
the Gulf has been adversely affected due to
a significant slowdown in permitting activity
in 2010 (despite their being no official
moratorium on shallow water permits) with
shallow water capital expenditures down 32
percent in 2010 as compared to 2009 (Table
8).

26
Table 8: Estimated Historical and Projected Gulf of Mexico Oil and Natural Gas Industry
Domestic Spending Trends by Detailed Spending Type*
* Projected spending contingent on returning to pre-Macondo permitting rates.
Source: Quest Offshore Resources, Inc.
From 2009-2010, overall spending (both
deep and shallow water) fell by 10 percent.
The most affected sector was the drilling
sector, which saw a 41 percent decrease in
spending during the period as deepwater
drilling all but halted for two quarters of the
year due to the moratorium and shallow
water drilling significantly declined due to the
extreme slowing of drilling permit issuances.
The drilling sector is also expected to see
the most significant growth in spending if a
return to historical conditions occurs, with
drilling spending in 2013 expected to rise
165 percent from 2010 levels to $9.1 billion.
Facilities spending is also expected to see
significant growth from 2010 to 2013, with
spending expected to be up by 113 percent
over 2008 levels reaching $3.2 billion. For
this particular category, 2010 spending was
2008 2009 2010 2011 2012 2013
G&G $0.1 $0.1 $0.1 $0.1 $0.1 $0.1
Drilling $2.6 $3.5 $1.8 $2.6 $3.5 $4.8
Facilities $0.0 $0.0 $1.2 $1.9 $0.8 $1.9
SURF $3.0 $2.9 $1.3 $1.3 $1.9 $2.9
Total Deepwater $5.8 $6.5 $4.3 $5.9 $6.3 $9.8
2008 2009 2010 2011 2012 2013
G&G $0.1 $0.1 $0.1 $0.1 $0.1 $0.1
Drilling $4.0 $2.4 $1.6 $1.3 $2.5 $4.3
Facilities $1.1 $0.4 $0.4 $1.4 $1.3 $1.3
SURF $0.8 $0.2 $0.1 $0.4 $0.3 $0.3
Total Shallow Water $6.1 $3.2 $2.2 $3.1 $4.1 $5.9
Total CAPEX $11.9 $9.7 $6.5 $8.9 $10.4 $15.7
2008 2009 2010 2011 2012 2013
Total Deepwater $5.8 $6.2 $6.7 $8.5 $9.9 $10.3
2008 2009 2010 2011 2012 2013
Total Shallow Water $10.9 $11.0 $11.1 $13.1 $15.1 $15.4
Total OPEX $16.7 $17.2 $17.7 $21.6 $25.0 $25.8
Total Spend $28.5 $26.9 $24.2 $30.5 $35.4 $41.5
Projected
Deepwater
Capital Expenditures (Billions)
Shallow Water
Historical
Operating Expenditures (Billions)
Shallow Water Shallow Water
Deepwater
Shallow Water
Deepwater Deepwater

27
actually 236 percent higher at $1.5 billion
than in 2008 as specific large projects,
which had already completed exploration
and appraisal drilling moved forward.
Subsea spending inclusive of hardware,
risers, pipelines and umbilicals is expected
to grow 125 percent to $3.2 billion in 2013
from $1.4 billion in 2010. This level will still
be slightly below the $3.8 billion seen in
2008, due to the drilling moratorium pushing
the next big wave of very large projects
further out into the future. Such major
projects drive subsea spending through
major hardware and pipeline installation
contracts.
Quest’s spending projections are based on
actual projects to be developed in the Gulf of
Mexico, coupled with operators expected
exploration and appraisal programs which
are used to take into account yet to be
discovered and delineated fields that may be
developed in the forecast time frame.
It is important to note that Quest Offshore is
providing the spending forecasts used in this
report on the U.S. Gulf of Mexico’s offshore
oil and natural gas industry under the
assumption that permits for offshore drilling,
which began to be reissued during the first
half of 2011, will continue to be issued at an
increasing pace throughout the year, and
ultimately arriving back at levels seen prior
to the Macondo incident (Figure 9).
0
2
4
6
8
10
12
14
Nu
mb
er
of
Perm
its
Deep Water Shallow Water
Oil Spill Moratorium Lifted
Figure 9: Gulf of Mexico Deep and Shallow Water Drilling Permit Approvals
Note: Excludes Water Injection Wells
Source: Greater New Orleans, Inc. Bureau of Ocean Energy Management.

28
Although activity has slowed dramatically in
2010, as well as the first half of 2011, it is
important to note that the projects slated for
evaluation and development by oil
companies still exist. The halt in drilling
permits has likely not resulted in cancellation
of these projects; rather it has delayed the
sanctioning of numerous world class
deepwater projects postponing deepwater
production growth into 2015-2016. The
capital investment and operational spending
projections estimated by Quest Offshore rely
on the assumption that permitting activity in
the U.S. Gulf of Mexico will see a noticeable
increase during the second half of 2011
further accelerating in 2012 and continue
into the future as oil companies, drilling
contractors and federal regulators work to
restore permitting rates back to historical
levels. To the extent that this is not the case,
investment levels and projected economic
impacts estimated herein would need to be
revised downward.
If there is a return to historical permitting
levels and annual GoM investment and
operational spending levels increase as
forecasted, Quest projects that GoM oil
production will begin to increase after 2013
(Figure 10). Increases in production will lag
spending due to the time necessary for
development to come online. GoM oil
production levels could reach approximately
1.8 million barrels per day by 2016 given
that many large capital projects have
already been sanctioned. Quest projects
declining natural gas production through
2013 followed by several years of relative
steady production levels of around 5 Bcf per
day. Recent increases in on-shore natural
gas production have made purely natural
gas targets in the Gulf less attractive.
Quest’s forecast for both oil and natural gas
GoM production would need to be revised
downward if permitting activity does not see
a significant increase from current levels.
One upside to Quest’s production
projections is that natural gas production
could be higher if there is a relatively greater
amount of associated gas with newly
developed oil projects.

29
Figure10: Estimated Historical and Projected Gulf of Mexico Oil and Natural Gas
Production Trends
Source: Energy Information Administration, Quest Offshore Resources
4-1 Domestic vs. International Capital Investment
As many of the service providers employed
by the oil and natural gas industry are
located overseas, it is important to
understand what portion of the capital
investment remains in the U.S., and what
part flows to other countries. Quest’s
analysis reveals that while a portion of
offshore capital investment flows abroad, the
vast majority is used to purchase equipment
and structures manufactured in the United
States. Most of the internationally purchased
equipment is of relatively lower value,
consisting of, for instance, steel pipe and
floating production system hulls. For floating
production systems, while the hull is likely
built in an Asian shipyard, the processing
and production topsides, which are the more
technically complex and thus expensive
equipment, are fabricated in the United
States. Operating expenditures, which
account for the spending required to
maintain and operate existing producing
assets, account on average for 66 percent of
spending over the 2008-2013 period and
occur almost exclusively in the United
States. From 2008 to 2010, 98 percent of
total spending (capital investment and
operational spending) was domestic with an
average of only 2 percent occurring
overseas. This changed only slightly for the
0
2
4
6
8
10
12
14
16
0.0
0.5
1.0
1.5
2.0
2.5
3.0
2006 2007 2008 2009 2010 2011 2012 2013 2014 2015 2016
Bcf p
er Day
Mil
lio
ns o
f B
arre
ls o
f O
il E
qu
ivele
nt
per
day
Oil Total BOE Natual Gas

30
period 2011-2013 with 97 percent of total
spending being domestic compared to 3
percent occurring overseas. This is due to a
higher share of capital spending flowing
overseas (primarily floating production units
hull and pipelines) relative to the earlier time
frame (Table 9).
Table 9: Estimated Historical and Projected Gulf of Mexico Offshore Oil and Natural Gas
Industry Domestic vs. International Spending Trends (2008-2013)*
* Projected spending contingent on returning to pre-Macondo permitting rates.
Source: Quest Offshore Resources, Inc.
4-2 Spending Trends Within and Outside of the Gulf States
The majority (roughly three-quarters) of
GoM offshore operational spending and
investment occurs in the Gulf Coast states:
Texas, Louisiana, Mississippi, and Alabama
(Table10). Quest estimates that a significant
portion of the spending, about one-quarter,
occurs over a wider geographic area outside
the Gulf. The primary reason spending is
significantly higher in the Gulf states is due
to supplying firms location near to
production due to the cost (or in some cases
impossibility) of transporting supplies and
equipment and the need for services to be
located close to producing areas. Despite
this, spending outside the region results in
the economic impacts of GoM offshore
development being felt throughout the U.S.
and throughout many sectors of the
economy.
$Billions
Spending 2008 2009 2010 2011 2012 2013
Domestic $28.5 $26.9 $24.2 $30.5 $35.4 $41.4
International $0.76 $0.40 $0.71 $1.43 $0.94 $1.45
Total $29.3 $27.3 $24.9 $31.9 $36.3 $42.9
Percentage of Spending
Domestic 97% 99% 97% 96% 97% 97%
International 3% 1% 3% 4% 3% 3%
Historical Projected

31
Table 10: Estimated Historical and Projected Gulf State vs. Non-Gulf State Total Spending (2008 –2013)*
* Projected spending contingent on returning to pre-Macondo permitting rates.
Source: Quest Offshore Resources, Inc.
The Gulf States Alabama, Louisiana,
Mississippi and Texas account for 74
percent of spending on average, and up to
76 percent of spending (in 2008). The
percentage of total spending is higher in the
Gulf States in years with less capital
investment, as non-Gulf Coast States see
most of their spending from capital
expenditures. A relatively higher proportion
of operational expenditures occur in the Gulf
States. Growth in operational expenditures
accounts for the slight decline in the share of
total expenditures in non-Gulf Coast States
over the forecast period.
Although it may appear that the estimated
amount of spending in non-Gulf Coast
States is not significant, it is important to
understand the absolute scale of investment
that constitute these percentages. In 2010,
the estimated amount of spending totaled
$6.7 billion across 36 non-Gulf Coast States.
Spending is expected to grow 61 percent to
$10.8 billion in 2013. This spending thus
contributes to both GDP and employment
impacts outside the immediate Gulf Coast
area.
Forecasted spending increases are driven
by increases in development activity in the
Gulf of Mexico, with development activity
expected to increase steadily into the
forecast period. After dismal showings in
2009 and 2010, key indicators of
development activity such as host facilities,
number of wells drilled and miles of
pipelines installed are projected to begin to
steadily grow (Table 11).
2008 2009 2010 2011 2012 2013
Alabama $3.3 $3.0 $2.7 $3.5 $4.2 $4.8
Louisiana $9.3 $8.6 $7.3 $9.0 $10.7 $12.9
Mississippi $0.3 $0.3 $0.3 $0.3 $0.4 $0.4
Texas $8.7 $8.0 $7.3 $9.3 $10.7 $12.5
Other States $7.0 $7.1 $6.7 $8.4 $9.4 $10.8
Total Spending $28.5 $26.9 $24.3 $30.5 $35.4 $41.4
AL, LA, MS, TX 76% 74% 72% 72% 73% 74%
Other States 24% 26% 28% 28% 27% 26%
Projected
Domestic Spending ($billions)
Historica l

32
Table 11: Estimated Historical and Projected Key Development Equipment for Offshore
Gulf of Mexico Oil and Natural Gas Fields (2008-2013)*
* Projected Activity contingent on returning to pre-Macondo permitting rates.
Source: Quest Offshore Resources, Inc.
# of Units
Domestic
Spend
($Bil l ions)
# of Wells
Domestic
Spend
($Bil lions)
Miles
Domestic
Spend
($Bill ions)
2008 148 $0.3 566 $6.7 1,828 $1.6
2009 57 $0.1 320 $6.0 850 $1.6
2010 52 $1.1 252 $3.0 353 $0.7
2011 183 $2.0 247 $3.3 730 $0.7
2012 169 $1.0 414 $5.0 1,050 $0.9
2013 171 $2.0 615 $7.7 1,070 $1.4
His
tori
ca
lP
roje
cte
d
Year
Host Facil ities Dril l ing Pipelines

33
5. National and State Economic
Impacts

34
5-1 National Impacts
Overall spending for the Gulf of Mexico
offshore industry in 2008 was over $28.5
billion which translated into a total GDP
impact of over $30.8 billion (Figure 12)11
.
This impact was felt throughout the country
and supported over 305 thousand jobs
nationwide (Figure 11). Approximately 90
thousand of those jobs were directly related
to the industry (meaning jobs working
directly for oil and natural gas companies or
for contractors that are directly paid by the
oil and natural gas industry) while 220
thousand
11 GDP and employment impact results are likely conservative because they do not take into account the economic impacts of increased government revenue from bonus bids, royalties, and corporate income taxes. Nor do they account for the impacts of certain profit type income associated with oil and gas operations.
were indirect (meaning jobs providing goods
and services to oil companies such as
components for manufacturing, legal and
financial services, etc.) and induced jobs
(meaning jobs throughout the economy that
result from the spending of income from
direct and indirect employment such as
waiters, retail workers, automobile
manufacturers, service providers, etc). The
year 2008 coincided with, the tail end of a
strong investment period which had seen
development activity increase and economic
impacts grow.
0
50,000
100,000
150,000
200,000
250,000
300,000
350,000
400,000
450,000
500,000
2008 2009 2010 2011 2012 2013
Nu
mb
er
of
Jo
bs
Historical ─ Direct Projected ─ Direct
Historical ─ Indirect and Induced Projected ─ Indirect and Induced
Figure 11: Estimated Historical and Projected Total Employment Supported by Gulf of Mexico Oil and Natural Gas Industry Activity (2008 - 2013)*
* Projected employment contingent on returning to pre-Macondo permitting rates.
Source: Quest Offshore Resources, Inc
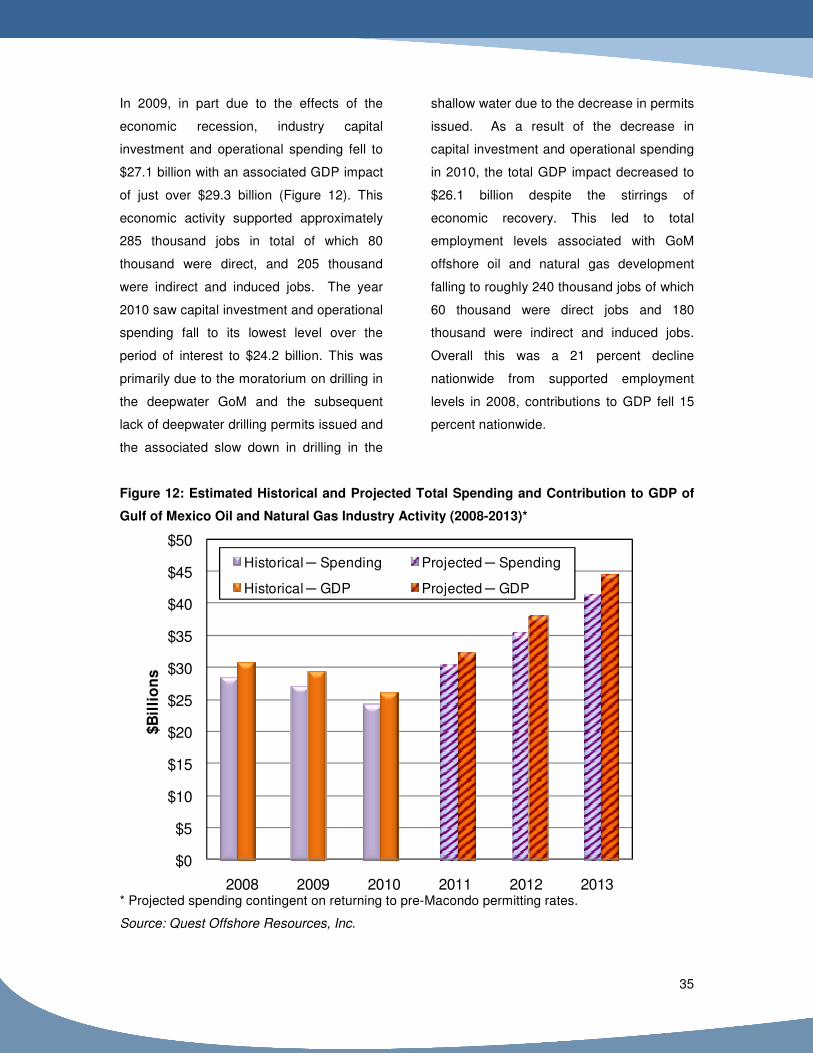
35
In 2009, in part due to the effects of the
economic recession, industry capital
investment and operational spending fell to
$27.1 billion with an associated GDP impact
of just over $29.3 billion (Figure 12). This
economic activity supported approximately
285 thousand jobs in total of which 80
thousand were direct, and 205 thousand
were indirect and induced jobs. The year
2010 saw capital investment and operational
spending fall to its lowest level over the
period of interest to $24.2 billion. This was
primarily due to the moratorium on drilling in
the deepwater GoM and the subsequent
lack of deepwater drilling permits issued and
the associated slow down in drilling in the
shallow water due to the decrease in permits
issued. As a result of the decrease in
capital investment and operational spending
in 2010, the total GDP impact decreased to
$26.1 billion despite the stirrings of
economic recovery. This led to total
employment levels associated with GoM
offshore oil and natural gas development
falling to roughly 240 thousand jobs of which
60 thousand were direct jobs and 180
thousand were indirect and induced jobs.
Overall this was a 21 percent decline
nationwide from supported employment
levels in 2008, contributions to GDP fell 15
percent nationwide.
Figure 12: Estimated Historical and Projected Total Spending and Contribution to GDP of
Gulf of Mexico Oil and Natural Gas Industry Activity (2008-2013)*
* Projected spending contingent on returning to pre-Macondo permitting rates.
Source: Quest Offshore Resources, Inc.
$0
$5
$10
$15
$20
$25
$30
$35
$40
$45
$50
2008 2009 2010 2011 2012 2013
$B
illi
on
s
Historical ─ Spending Projected ─ Spending
Historical ─ GDP Projected ─ GDP

36
Our industry capital investment and
operational spending outlook for the GoM in
2011 was predicated on a return to historical
permitting rates by the second half of 2011,
which was an optimistic assumption not in
line with current permitting rates. Spending
is expected to reach $30.5 billion, resulting
in a total GDP impact of over $32.3 billion.
Total supported employment is estimated at
311 thousand jobs of which 80 thousand are
direct and 230 thousand are indirect and
induced. This would represent a 28 percent
increase in employment over 2010 and a 24
percent increase in contributions to GDP. A
large portion of this projected spending
increase stems from major projects far along
in the development cycle which had been
delayed in the previous two years.
In 2012, again assuming a return to
historical permitting rates in the GoM, it is
estimated that capital and operational
spending in the GoM could reach $35.4
billion resulting in an estimated GDP impact
of over $38.2 billion. Capital spending is
projected to grow at the fastest rate at 17
percent due to more and more delayed
projects beginning development while
operational expenditures are projected to
increase by 16 percent as more projects
come into production. This uptick in activity
should see the industry and its suppliers
hiring with total supported employment
associated with GoM oil and natural gas
development projected to reach 355
thousand jobs of which 90 thousand are
direct and 265 thousand are indirect and
induced. This would represent a 15 percent
increase in supported employment from
2011 and an 18 percent increase in
contribution to GDP.
Finally we estimate that in 2013, which is
projected to yield all time record investment
and spending levels under the assumption
that permitting rates in the GoM had
returned to pre-Macondo levels by mid
2011, (an optimistic assumption not met),
investment and spending should reach
nearly $41.4 billion. In 2013, projects which
had seen their exploration and appraisal
drilling halted by the drilling moratorium
should see final investment decisions and
subsequent major spending. This is
estimated to result in a total GDP impact of
$44.5 billion, a 16 percent increase over
Economic impacts from oil and natural gas
capital investment and purchases of
intermediate goods ripple through many
sectors of the economy. In the combined
Louisiana, Texas, Alabama and Mississippi
region almost all sectors of the economy
benefit. Examples include the
transportation and warehousing sectors
with increases of $340 million in 2010, the
real estate industry, which shows a $2.5
billion increase, the health care and social
assistance industry, with a $686 million
increase, and the food service industry,
with a $221 million increase.
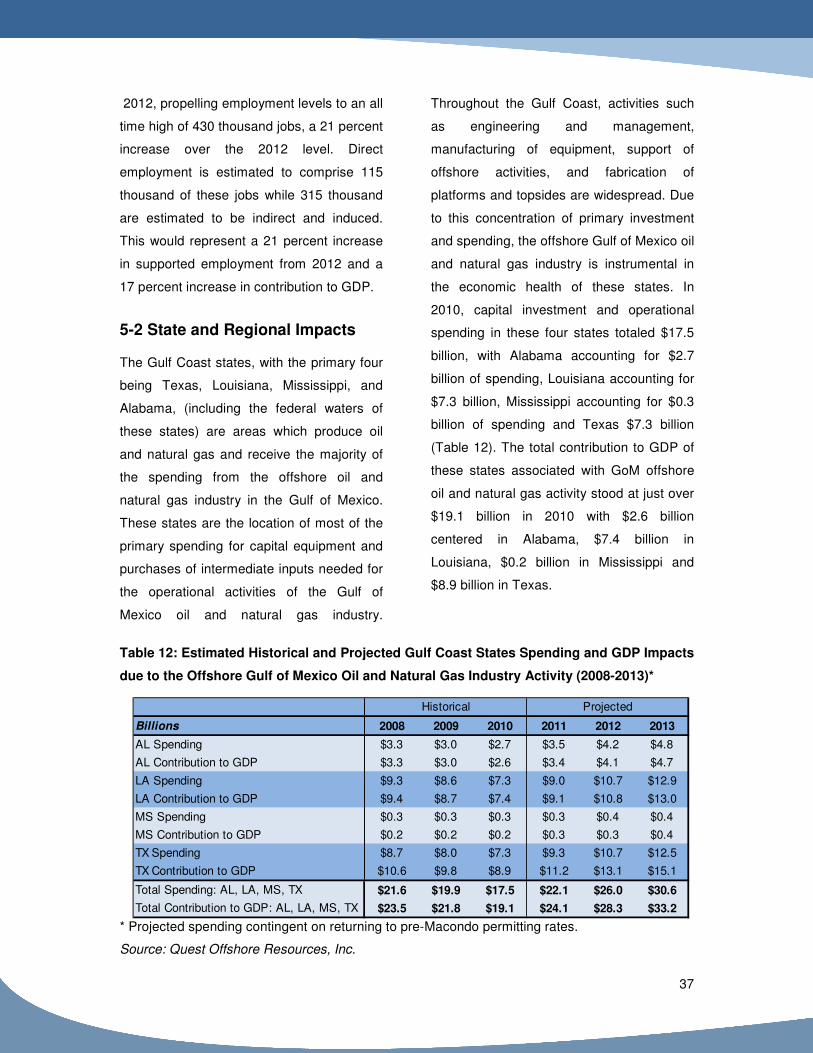
37
2012, propelling employment levels to an all
time high of 430 thousand jobs, a 21 percent
increase over the 2012 level. Direct
employment is estimated to comprise 115
thousand of these jobs while 315 thousand
are estimated to be indirect and induced.
This would represent a 21 percent increase
in supported employment from 2012 and a
17 percent increase in contribution to GDP.
5-2 State and Regional Impacts
The Gulf Coast states, with the primary four
being Texas, Louisiana, Mississippi, and
Alabama, (including the federal waters of
these states) are areas which produce oil
and natural gas and receive the majority of
the spending from the offshore oil and
natural gas industry in the Gulf of Mexico.
These states are the location of most of the
primary spending for capital equipment and
purchases of intermediate inputs needed for
the operational activities of the Gulf of
Mexico oil and natural gas industry.
Throughout the Gulf Coast, activities such
as engineering and management,
manufacturing of equipment, support of
offshore activities, and fabrication of
platforms and topsides are widespread. Due
to this concentration of primary investment
and spending, the offshore Gulf of Mexico oil
and natural gas industry is instrumental in
the economic health of these states. In
2010, capital investment and operational
spending in these four states totaled $17.5
billion, with Alabama accounting for $2.7
billion of spending, Louisiana accounting for
$7.3 billion, Mississippi accounting for $0.3
billion of spending and Texas $7.3 billion
(Table 12). The total contribution to GDP of
these states associated with GoM offshore
oil and natural gas activity stood at just over
$19.1 billion in 2010 with $2.6 billion
centered in Alabama, $7.4 billion in
Louisiana, $0.2 billion in Mississippi and
$8.9 billion in Texas.
Table 12: Estimated Historical and Projected Gulf Coast States Spending and GDP Impacts
due to the Offshore Gulf of Mexico Oil and Natural Gas Industry Activity (2008-2013)*
* Projected spending contingent on returning to pre-Macondo permitting rates.
Source: Quest Offshore Resources, Inc.
Billions 2008 2009 2010 2011 2012 2013
AL Spending $3.3 $3.0 $2.7 $3.5 $4.2 $4.8
AL Contribution to GDP $3.3 $3.0 $2.6 $3.4 $4.1 $4.7
LA Spending $9.3 $8.6 $7.3 $9.0 $10.7 $12.9
LA Contribution to GDP $9.4 $8.7 $7.4 $9.1 $10.8 $13.0
MS Spending $0.3 $0.3 $0.3 $0.3 $0.4 $0.4
MS Contribution to GDP $0.2 $0.2 $0.2 $0.3 $0.3 $0.4
TX Spending $8.7 $8.0 $7.3 $9.3 $10.7 $12.5
TX Contribution to GDP $10.6 $9.8 $8.9 $11.2 $13.1 $15.1
Total Spending: AL, LA, MS, TX $21.6 $19.9 $17.5 $22.1 $26.0 $30.6
Total Contribution to GDP: AL, LA, MS, TX $23.5 $21.8 $19.1 $24.1 $28.3 $33.2
Historical Projected

38
In 2013 capital investment and purchases of
intermediate goods are projected to reach
their highest levels in the studied period,
assuming that permitting rates in the Gulf of
Mexico return to pre-Macondo levels. Total
capital investment and spending in the four
state region is projected to reach $30.6
billion. More specifically, investment and
spending in Alabama associated with
offshore GoM oil and natural gas
development is estimated at $4.8 billion,
Louisiana at $12.9 billion, Mississippi at $0.4
billion and Texas at $12.5 billion. This
investment and purchases of intermediate
inputs is estimated to increase GDP in the
four state area by over $33.2 billion. In
particular for 2013, the contributions to GDP
in Alabama due to GoM offshore oil and
natural gas industry activity is projected to
be $4.7 billion, Louisiana $13 billion,
Mississippi $0.4 billion and Texas at $15.1
billion.
In 2010 the Gulf Coast States, defined as
Alabama, Louisiana, Mississippi, and Texas,
saw employment levels of 175 thousand due
to Gulf of Mexico offshore oil and natural
gas industry activity (Figure 13). Jobs tied
directly to the industry were estimated at 42
thousand while indirect and induced jobs
were estimated at 135 thousand. These
states see the highest employment levels
due to the concentration of spending in the
region as many goods and services
providers to the industry are located near to
the Gulf coast. Employees on drilling rigs
and other offshore personnel who often work
offshore for two week stretches normally live
close to their onshore bases for ease of
transportation.

39
Figure 13: Estimated Historical and Projected Direct and Indirect/Induced Jobs in Gulf
Coast States Supported by Gulf of Mexico Oil and Natural Gas Industry Activity vs. Other
States (2008-2013)*
*”I and I” defined as Indirect and Induced;
* Projected employment contingent on returning to pre-Macondo permitting rates.
Source: Quest Offshore Resources, Inc.
At the time of the moratorium the Louisiana
Mid-Continent Oil and Natural Gas
Association stated that for every idle rig
platform there were 800-1400 jobs at risk.12
According to the association wages lost for
these jobs could exceed $5 to $10 million for
one month per platform, with a maximum of
33 rigs having been idled at the peak.
Direct employment associated with oil and
natural gas operations in the Gulf States
stood at 42 thousand in 2010, with
employment at 7 thousand in Alabama,
12 Source: Louisiana Mid-Continent Oil and Natural gas Association
18 thousand in Louisiana, 500 in Mississippi
and 16 thousand in Texas. In 2010 an
estimated 135 thousand indirect and
induced jobs in the Gulf States were due to
the GoM offshore oil and natural gas
industry’s investment and spending (Table
13). More specifically, 19 thousand jobs in
Alabama were supported due to the indirect
and induced effects of offshore oil and
natural gas industry investment and
spending, 52 thousand jobs supported in
Louisiana, 15 hundred jobs supported in
Mississippi and 63 thousand jobs were
0
50,000
100,000
150,000
200,000
250,000
300,000
350,000
Nu
mb
er
of
Jo
bs
Historical ─ Gulf States Projected ─ Gulf States
Historical ─ Non- Gulf States Projected ─ Non- Gulf States
2008 2009 2010 2011 2012 2013

40
supported in Texas. Total employment
impacts for Texas, Louisiana, Alabama and
Mississippi are projected to reach 320
thousand jobs (direct, indirect and induced)
in 2013 with 50 thousand being supported in
Alabama, 130 thousand in Louisiana, 3
thousand in Mississippi and 140 thousand
being supported in Texas.
Table 13: Estimated Historical and Projected Texas, Louisiana, Mississippi, and Alabama
Direct, Indirect & Induced Employment (2008-2013)*
* Projected employment contingent on returning to pre-Macondo permitting rates.
Source: Quest Offshore Resources, Inc.
Outside of the Gulf States, Quest estimated
that offshore Gulf of Mexico oil and natural
gas industry activity supported 65 thousand
jobs in 36 other states in 2010. Total
contribution to GDP from these states due to
offshore GoM oil and natural gas industry
activity was estimated at $7.0 billion in 2010
based on total spending in these states of
$6.7 billion. The non-Gulf of Mexico States,
which primarily provide manufactured
goods, component parts and services to the
industry, are expected to see spending
levels rise 61 percent to $10.8 billion in 2013
from 2010 levels. This spending rise is
expected to yield a 61 percent increase in
contributions to GDP to $11.3 billion and a
67 percent increase in employment to 105
thousand jobs. (See Appendix 1 for a
detailed description of non-Gulf Coast State
impacts)
5-3 Impacts on Other Industries
While the economic impact of the offshore
Gulf of Mexico oil and natural gas industry is
felt across many sectors, certain industries
are impacted more than others. The largest
other industry beneficiary, due to the
investment and operations of the offshore
Gulf of Mexico oil and natural gas industry,
Number of Jobs 2008 2009 2010 2011 2012 2013
AL Direct Jobs 11,851 10,134 7,186 9,959 11,312 14,338
AL Indirect and Induced Jobs 24,275 22,158 18,635 24,606 29,354 34,456
LA Direct Jobs 30,301 26,385 18,110 23,804 27,326 36,469
LA Indirect and Induced Jobs 67,947 62,798 52,363 64,943 76,814 92,638
MS Direct Jobs 648 640 531 685 759 929
MS Indirect and Induced Jobs 1,629 1,658 1,529 1,889 2,162 2,431
TX Direct Jobs 24,619 20,717 16,524 22,760 25,201 32,060
Tx Indirect and Induced Jobs 76,189 70,066 62,751 79,818 92,443 108,152
Total Direct Jobs: AL,LA, MS, TX 67,419 57,876 42,351 57,208 64,598 83,796
Toal Indirect and Induced Jobs: AL,LA,MS,TX 170,040 156,680 135,278 171,256 200,773 237,677
Historical Projected

41
was the real estate and rental and leasing
industry (Table 14). Activity in this sector
was nearly $3.5 billion and over 18,500 jobs
were supported due to offshore GoM oil and
natural gas industry activity.
Table 14: Estimated Historical Sectoral GDP and Employment Impacts Due to Offshore
Gulf of Mexico Oil and Natural Gas Industry Activity (2010)
Source: Quest Offshore Resources, Inc.
Other industries in 2010 which were
beneficially supported include the
manufacturing sector, with a GDP impact of
approximately $2.0 billion and over 23
thousand jobs supported and the
professional, scientific and technical
services sector with GDP impact in 2010 of
$1.2 billion and supported employment of
approximately 14 thousand jobs. The GoM
oil and natural gas industry also supports
jobs in the real estate and construction
sectors.
Total indirect and induced jobs due to
offshore GoM oil and natural gas industry
activity stood at 180 thousand jobs in 2010.
The large impacts of oil and natural gas
industry activity on other sectors make up a
large share of the total economy-wide
economic impacts. This plays an important
role in the value of the industry to the U.S.
economy.
Contribution to GDP
(Billions)
Employment
Impact
(In Jobs)
Real Estate and Rental Leasing $3.5 18,533
Manufacturing $2.0 23,303
Profession, Scientific, and Technical Services $1.2 14,061
Construction $1.1 23,192

42
6. Conclusions

43
This report has documented the decline in
capital expenditures and operational
spending of the GoM offshore oil and natural
gas industry that occurred over the 2008 to
2010 period. The principal reasons for this
decline include the economic recession in
2008-09 and the establishment of a
moratorium on deepwater drilling and
subsequent slowdown of permit issuance in
both GoM deep and shallow waters in 2010
and into 2011. We estimate that tens of
thousands of jobs have been lost in
response to the decline in capital
expenditures and operational spending of
the offshore GoM oil and natural gas
industry over this period. We also
demonstrate the near term potential of the
offshore GoM oil and natural gas industry to
create jobs, boost GDP and generate tax
revenues at all levels of government – if the
government pursues a balanced regulatory
approach that allows for the timely
development of the backlog of GoM projects
in an environmentally responsible manner.
Under such government policy, we estimate
total spending by the GoM offshore oil and
natural gas industry to increase by over 70
percent by 2013 from 2010 levels, and
capital expenditures to increase by over 140
percent.
• The Gulf of Mexico oil and natural gas industry’s operational and capital
investment spending is projected to average $35.7 billion from 2011-2013, with
spending estimated at $26.5 billion for the 2008-2010 period. In 2013 spending is
projected to reach $41.4 billion, a 71 percent increase from the 2010 level of
$24.2 billion.
• The majority of the Gulf of Mexico oil and natural gas industry’s spending is spent
domestically, with an average of 98 percent of industry expenditures occurring
within the United States from 2008-2010 and 97 percent expected to be spent
domestically from 2011-2013.
• Direct employment from GoM development expenditures and operations is
projected to average 95 thousand from 2011 to 2013, after averaging 75
thousand from 2008-2010, with direct employment reaching a high of nearly 115
thousand by 2013. Total employment supported by the Gulf of Mexico oil and
natural gas industry, including indirect and induced (income related) effects, is
projected to average nearly 365 thousand jobs from 2011-2013 compared to total
estimated employment of 275 thousand from 2008-2010. Employment in 2013 is
projected to exceed 430 thousand jobs or a 77 percent increase from 2010.

44
• The Gulf of Mexico oil and natural gas industry is projected to contribute an
average of $38.5 billion a year to U.S. GDP from 2011-2013 as compared to
$28.7 billion a year from 2008-2010. In 2013 total contributions to GDP are
projected to reach $44.5 billion, or a 71 percent increase over the 2010 estimated
level of $26.1 billion. These results are likely conservative because they do not
take into account the economic impacts of increased government revenue from
bonus bids, royalties, corporate income taxes, and certain profit type income
associated with oil and natural gas operations.
• GDP impacts in the Gulf of Mexico states of Alabama, Louisiana, Mississippi and
Texas, due to offshore GoM oil and natural gas industry activity, are projected to
average $28.5 billion a year from 2011-2013, as compared to $21.4 billion a year
from 2008-2010. Total contributions to GDP in 2013 are expected to have
increased 73 percent from 2010 to $33.2 billion due to offshore GoM oil and
natural gas industry activity. Total supported employment in the Gulf states due
to offshore GoM oil and natural gas industry activity is expected to average 270
thousand jobs from 2011-2013 compared to 210 thousand jobs in the 2008-2010
period. In 2013, total supported employment is expected to grow to 320 thousand
jobs, an 80 percent increase over the 2010 level.
• While spending from the offshore Gulf of Mexico oil and natural gas industry is
focused along the Gulf coast, many states see benefits from the industry. Non-
Gulf Coast States are expected to average $9.9 billion in spending from 2011-
2013, compared to an average of $7.2 billion spending per year from 2008-2010.
Total supported non-Gulf State employment due to offshore oil and natural gas
industry operations is expected to average 94 thousand from 2011-2013,
compared to estimated total employment of 67 thousand in the 2008-2010
period.
• Quest’s forecast for spending and hence contribution’s to GDP and employment
for forecast years are predicated on a return to normal permitting activity in the
second half of 2011. This may be optimistic given current rates of permitting. A
failure to return to historical issuance of drilling permits, as well as
implementation of overly excessive regulation, would significantly decrease
projections of spending and thus economic and job impacts.

45
• Quest’s estimated and projected spending are based on Quest’s proprietary
Enhanced Deepwater Development Database and thus provide a high degree of
accuracy with relation to both spending levels and the locations of spending. This
is likely to yield realistic estimates of economic activity both with respect to
magnitude and location.
The offshore oil and natural gas
industry is a key contributor to the
energy supply of the United States;
additionally the industry contributes
both to the gross national product
and overall employment of the
country. The offshore GoM industry
contributed 14 percent of the oil and
natural gas produced in the United
States in 2010. Additionally, capital
investment and operational
spending by the Gulf of Mexico oil
and natural gas industry supports
hundreds of thousands of jobs
across multiple sectors and regions,
spurs economic growth, and
generates significant tax revenue at
all levels of government. It is
therefore critical that permitting
return to historical rates, and that
development and production are
allowed to reach their potential in an
environmentally responsible manner
under a balanced regulatory regime.

46
Appendix 1: Summary of Non-Gulf Coast State Economic
Impacts

47
Index: Non-Gulf Coast State Economic Impacts:
State Page
Alaska 57
Arkansas 57
California 53
Colorado 55
Florida 62
Idaho 70
Illinois 59
Indiana 66
Kansas 58
Kentucky 61
Michigan 64
Minnesota 70
Missouri 62
Montana 69
Nebraska 65
New Jersey 67
New Mexico 55
New York 68
North Dakota 69
Ohio 56
Oklahoma 54
Pennsylvania 58
South Dakota 70
Tennessee 69
Utah 59
Virginia 61
West Virginia 60
Wisconsin 63
Wyoming 59
" Other States" 71
Arizona
Connecticut
Delaware
Georgia
Hawaii
Iowa
Maine
Maryland
Massachusetts
Nevada
New Hampshire
North Carolina
Oregon
Rhode Island
South Carolina
Vermont
Washington

48
Non- Gulf Coast States
California
The results of the study indicate that
California has the next largest economic
impact (second to the Gulf Coast States) as
a result of the Offshore Gulf of Mexico oil
and natural gas industry with total
contribution to GDP of $1.7 billion in 2010
derived from $1.5 billion in spending. It may
seem surprising that the economy of a west
coast state would benefit so greatly from oil
and natural gas operations in the GoM.
However, there are areas where California is
directly involved in the offshore oil and
natural gas industry, for instance Chevron, a
major player in the offshore Gulf of Mexico,
is headquartered in San Ramon, California.
In general, the reason GoM oil and natural
gas development impacts the California
economy is due to California’s standing as
the largest overall state economy. In
addition, California has had a long historical
involvement in oil and natural gas
production. Its base of high tech industries
supports a large number of equipment
manufacturers and technology providers.
Examples include companies such as
Teledyne Technologies that produce
sophisticated electronics and
instrumentation for the industry. These types
of manufacturers supply components that
are used throughout offshore developments
in important equipment such as platform
topsides and subsea hardware. From an
employment perspective, approximately 14
thousand men and women in California were
employed due to the offshore Gulf of Mexico
oil and natural gas industry in 2010 as a
result of spending of $1.5 billion associated
with GoM oil and natural gas operations.
Notably affected industries in California
include real estate with a $262 million
impact in 2010, professional scientific and
technical services with an $88 million
impact, finance and insurance, which sees
an $81 million impact and manufacturing
with an $85 million impact in 2010. In 2013
total contribution to GDP in California due to
GoM oil and natural gas operations is
projected to reach $2.6 billion with total
related employment estimated to reach over
22 thousand on spending of $2.3 billion.
Source: Quest Offshore Resources, Inc.

49
Oklahoma
Oklahoma while not directly on the Gulf of
Mexico, borders Texas and has historically
been heavily involved in oil production both
inside the state and through its legacy as
one of the historical centers of the oil and
natural gas industry. Some of Oklahoma’s
involvement the offshore Gulf of Mexico
operations is through corporate operations
such as ConocoPhillips headquartered in
Bartlesville, Oklahoma or through equipment
manufacturing, or the ownership of key
infrastructure such as Williams Partners, LP;
a key owner of pipelines in the Gulf of
Mexico.
The state of Oklahoma sees significant
economic and employment due to the
Offshore Gulf of Mexico offshore oil and
natural gas industry. Total contributions to
GDP stood at $1.3 billion in 2010 based on
spending of almost $1.2 billion, with total
employment impact
reaching 12 thousand jobs. Industries such
as Real estate which sees employment 11
hundred and over $188 million of
contributions to GDP and finance with
supported employment of 500 and over $43
million of contributions to GDP. In 2013
Oklahoma is forecast to see slightly over 2
billion dollars of contributions to GDP from
the offshore Gulf of Mexico oil and natural
gas industry due to slightly over 1.9 billion
dollars of spending, with total employment
impact set to reach slightly over 20 thousand
jobs, a 60 percent increase from 2010.
Williams Partners L.P. – Tulsa,
Oklahoma
Williams Partners L.P. is a leading diversified master limited partnership focused on natural gas transportation; gathering, treating, and processing; storage; natural gas liquid (NGL) fractionation; and oil transportation. Williams operates three natural gas transmission pipelines: With a combined design capacity of more than 12 billion cubic feet per day, these three pipelines transport enough natural gas in one day to serve the needs of more than 30 million homes. Placed into service in May 2002, Gulfstream is a state-of-the-art, 745-mile natural gas delivery network across the Gulf of Mexico. As the Sunshine State's first new natural gas pipeline in more than 40 years, Gulfstream can transport approximately 1.26 billion cubic feet of natural gas each day from vast natural gas reserves to a wide array of customers, including electric utilities, local distribution companies and municipal users.
Source: Quest Offshore Resources, Inc.

50
Colorado
Colorado, which is home to a large domestic
oil and natural gas industry, also benefits
through the supply chain from the offshore
Gulf of Mexico oil and natural gas industry.
In 2010, the total economic impact stood at
nearly $1.1 billion, with total employment
impact at over 9 thousand jobs based on
spending of $1 billion. Job losses from 2008
to 2010 were 680 jobs.
Industries such as real estate with $174
million of economic impact, professional,
scientific and technical services with $60
million in impact, and management of
companies and enterprises with $52 million
in economic impact see the most benefits.
2013 should see total economic impact in
Colorado at about $1.8 billion leading to a
total employment impact of slightly of 15
thousand jobs due to spending of $1.5
billion.
New Mexico
New Mexico which also has a large
domestic oil and natural gas industry felt a
total economic impact due to the offshore
Gulf of Mexico oil and natural gas industry of
$810 million in 2010 due to spending of
slightly over $943 million. New Mexico
experienced a loss of 700 jobs in 2010
compared to 2008.
Key industries include real estate industry
with contributions to GDP of $61 million, the
construction industry with contributions to
GDP at $37 million, and retail trade with $30
million. 2013 economic impact is predicted
to reach $1.3 billion due to $1.5 billion in
spending; total employment impact is
predicted to reach 13 thousand jobs.

51
Ohio
Ohio which produces very little oil and
natural gas relative to the largest producing
states is still a major manufacturer of goods
utilized in both the onshore and offshore oil
and natural gas industries. Some of the
leading members of the oil and natural gas
supply chain are based in Ohio. Parker
Hannifin corporation which is based out of
Cleveland is heavily involved in the offshore
Gulf of Mexico oil and Natural gas industry
fabricating such items as umbilicals and
mooring ropes.
The total economic impact of the offshore
Gulf of Mexico oil and natural gas industry
was $306 million in 2010, based on
spending of $280 million. Employment
impact stood at 34 hundred jobs.
Impacts to the manufacturing industry stood
at $56 million with 750 employed. 2013 total
economic impact for Ohio is predicted to
reach $530 million based on spending of
$476 million, total employment impact in
2013 should reach 6 thousand, a100
percent increase on 2009.
Parker Hannifin – Cleveland, Ohio
Parker Hannifin is the 13th largest
Manufacturing Company in Ohio with 9 facilities in the state (including headquarters). Parker Hannifin has operations in 36 states and 153 U.S. cities. With annual sales of $10 billion for fiscal year 2010, Parker Hannifin is the world's leading diversified manufacturer of motion and control technologies and systems, providing precision-engineered solutions for a wide variety of commercial, mobile, industrial and aerospace markets. Parker is a global supplier of umbilicals, subsea power cables and associated termination equipment to the offshore oil & natural gas industry, and the offshore wind turbine industry.
Other top 50 manufacturing companies directly involved in the oil & natural gas supply chain with facilities in Ohio: Siemens, GE, Rockwell Automation, AK Steel Corp., Emerson Electric.
Aubert & Duval- Ohio
Aubert & Duval (A&D), a member of the Eramet Group, provides advanced metallurgical solutions in the form of parts or long products required for projects in the most demanding industries including aerospace, energy, industrial tool steels, and motor racing.
The Company’s core activity is developing, melting and hot processing (open and closed-die forging and rolling, casting or powder metallurgy) special steels, super alloys, aluminum alloys and titanium alloys which need to meet clients’ stronger specifications.

52
Arkansas
Arkansas which borders the gulf coast
region, sees significant impacts to its
economy due to the offshore Gulf of Mexico
oil and natural gas industry. Total economic
impact in 2010 reached $273 million, with
the industry accounting for over 3 thousand
jobs based on spending of $300 million.
In 2013 spending levels are set to reach
over $472 million in Arkansas, which should
see total economic impact reach $430
million. Total employment impact is
predicted to reach slightly over 4 thousand.
Alaska
Alaska though very distant from the Gulf
Coast and the offshore Gulf of Mexico oil
and natural gas industry, still sees significant
economic impact from the industry due to its
links to the oil and natural gas industry as a
whole based on its significance as one of
the leading oil and natural gas producing
states in the country. Total economic impact
in 2010 was $262 million based on spending
of $291 million. Total employment impact
was slightly under 2 thousand jobs.
2013 should see spending levels in Alaska
reach $455 million, with total economic
impact reaching $404 million; due to this
spending total employment impact is
predicted to reach slightly over 3 thousand
jobs, a gain of 200 jobs on 2010.
Murphy Oil – El Dorado, Arkansas
Murphy Exploration & Production Company, (Murphy EXPRO) is engaged worldwide in crude oil and natural gas exploration and production. Murphy EXPRO is headquartered in Houston, Texas. Murphy Oil USA, Inc., (MOUSA) is engaged in refining, marketing and transportation of petroleum products in the United States. It is headquartered in El Dorado at Murphy's corporate offices.
Murphy’s refining and marketing operations are conducted through wholly-owned subsidiaries including Murphy Oil USA. Murphy operates over 1,000 retail natural gas stations in 23 U.S. states under the Murphy USA brand and 93 Murphy Express stations in 11 U.S. states. The company’s refining business includes a 125,000 barrel-a-day refinery in Meraux, Louisiana, which produces refined petroleum products for distribution in the Gulf Coast market, and a 35,000 barrel-a-day refinery in Superior, Wisconsin, which serves the Upper Midwest. In 2010 Murphy’s U.S. production was 20,100 barrels of oil per day and 53 million cubic feet of natural gas. Over 60 percent of the production came from just two deepwater Gulf of Mexico fields – Thunder Hawk and Medusa – both of which are expected to see production declines in 2011 due inability to drill new wells. The deepwater Gulf of Mexico remains an integral component of Murphy’s upstream strategy. Murphy moved to the deepwater in 1996 and to date has three major discoveries on production (Habanero, Medusa and Front Runner) and a fourth now in development at Thunder Hawk. Murphy is the 16
th
largest leaseholder in deepwater Gulf of Mexico (>500fsw) with 113 operated leases and 57 leases as partner.

53
Pennsylvania
Pennsylvania, due to its legacy as both a
key manufacturing state for the United
States and its past (and now growing)
involvement in the oil and natural gas
industry, saw spending due to the offshore
Gulf of Mexico oil and natural gas industry of
$170 million in 2010.
Total economic impact stood at $200 million
with total employment impact of 2 thousand
jobs. In 2013, total economic impact is
predicted to reach $404 million based on
spending of $341 million. Total employment
impact in 2013 is predicted to reach slightly
over 4 thousand jobs, a two fold increase on
2010.
Kansas
Offshore Gulf of Mexico oil and natural gas
spending for Kansas stood at $190 million
for 2010, leading to a total economic impact
of $170 million. Total employment impact
was 15 hundred jobs.
The industry contributed $16 million to
Kansas’s real estate industry in 2010. In
2013 spending for Kansas is predicted to
reach $292 million leading to a total
economic impact of $266 million and a total
employment impact of impact of 25 hundred.
Whitehill Manufacturing- PA Whitehill supplies mooring lines for the navy, oil tankers and drilling rigs and floating production units.
Whitehill can be described as a differentiated niche player in the high performance rope arena. Many of their competitors produce high volume, low cost products for general use. Whitehill focuses its efforts and expertise on demanding projects that require high quality materials, engineering precision and technical support. These problem-solving projects often involve developing new technical solutions for existing industries using a unique engineering experience with high performance synthetic fibers.
Whitehill's competitive advantage is their experience with high performance synthetic materials. Whitehill has invented and reinvented high performance rope with new fibers, new designs and new concepts supported with rigorous testing to meet the changing requirements of evolving applications. Offshore rigs and floating units are very reliant on these products.
United States Steel – Pittsburgh, Pennsylvania
U.S. Steel is an integrated steel producer with major production operations in the United States, Canada and Central Europe and an annual raw steel-making capability of 31.7 million net tons. The company manufactures a wide range of value-added steel sheet and tubular products for the automotive, appliance, container, industrial machinery, construction, and oil and natural gas industries. U.S. Steel is the ninth largest fortune 500 company in Pennsylvania and one of the few fully integrated steel manufacturers left in the United States. In 2010 U.S. Steel revenues were $17.4BN. U. S. Steel Tubular Products manufactures quality tubular products for the energy industry including drill pipe for offshore applications. Major product lines include oil country tubing, casing and drill pipe, standard and line pipe, and coupling stock. Tubular Products are manufactured in Alabama, Ohio, Texas and Pennsylvania.

54
Wyoming
Wyoming, though very distant from the Gulf
of Mexico offshore oil and natural gas
industry geographically still received
spending of almost $186 million in 2010.
This spending was responsible for a total
economic impact of $161 million and a total
employment impact of almost 12 hundred
jobs.
In 2013 total economic impact for Wyoming
is expected to reach $248 million dollars on
spending of $291 million leading to an
employment impact of slightly over 2
thousand.
Illinois
In 2010 Illinois saw a total economic impact
due to the offshore Gulf of Mexico oil and
natural gas industry of $124 million based
on spending of $104 million. Total
employment impact in 2010 stood at 13
hundred jobs. In 2013 industry growth
should lead to spending of $213 million,
leading to a total economic impact of $254
million and a total employment impact of 3
thousand jobs.
Utah
Utah, while relatively distant geographically
from the Gulf of Mexico has a strong
domestic oil and natural gas industry
through which it is connected to the offshore
Gulf of Mexico oil and natural gas supply
chain.
Spending in 2010 due to the industry stood
at $83 million leading to a total economic
impact of $96 million. Total employment
impact was at slightly under 1 thousand
jobs.
In 2013, total economic is predicted to rise
to $150 million based on spending of $130
million with total employment impact
predicted to reach slightly over 15 hundred
jobs, a 50 percent increase over 2010.

55
West Virginia
West Virginia, though traditionally seen as a
coal state, also is involved in oil and natural
gas production domestically and with the
overall oil and natural gas supply chain.
Through this West Virginia saw total
economic impact due to the offshore Gulf of
Mexico oil and natural gas industry of $95
million in 2010.
Total employment impact was 1 thousand
jobs. In 2013, total economic impact should
reach $150 million, with total employment
impact at 15 hundred jobs due to spending
of $168 million.
U.S. DOE National Energy Tech Labs- WV
The Office of Research and Development (ORD) provides DOE's Fossil Energy R&D program an onsite "corporate laboratory" at NETL. The onsite R&D efforts utilize state-of-the-art capabilities and facilities in Morgantown, WV. About one-quarter of NETL's approximately 1,100 Federal and contractor employees are involved with onsite research activity. Because NETL is DOE's only government-owned, government-operated (GOGO) national laboratory, the onsite research program has a core group of about 150 Federal scientists and engineers.
One of DOE's primary strategic goals is “to protect our national and economic security by promoting a diverse supply and delivery of reliable, affordable, and environmentally sound energy.” NETL contributes to this strategic goal through cutting-edge research and development, focused on the clean production and use of the Nation's domestic fossil energy resources. Advanced technologies provide policymakers with expanded options for meeting vital national energy, environmental, and security needs.

56
Kentucky Kentucky’s portion of Offshore Gulf of
Mexico oil and natural gas spending was at
$74 million in 2010, leading to a total
economic impact of $71 million and a total
employment impact of 800 jobs. In 2013
total economic impact should reach about
$121 million, while total employment impact
is expected to reach 15 hundred jobs.
Virginia
In Virginia, which has often been seen as a
possible location for future offshore
production, the effects of the offshore Gulf of
Mexico oil and natural gas industry are still
felt despite its distance from the centers of
production. In 2010 Virginia spending from
the offshore Gulf of Mexico oil and natural
gas industry was at $65 million, with total
economic impact of $67 million and total
employment impact of 600 jobs.
In 2013 growth in the industry should see
spending into Virginia reach $102 million
leading to a total economic impact of $105
million and a total employment impact of 1
thousand jobs.
General Cable – Highland Heights, Kentucky
General Cable is a leader in the development, design, manufacture, marketing and distribution of copper, aluminum and fiber optic wire and cable products for the energy, industrial, specialty and communications markets. General Cable is the fifth largest company in Kentucky. The company is present in 13 U.S. states and 19 U.S. cities. In 2010 General Cable had $4.9BN in sales. General Cable is one of few experienced global manufacturers with the technical expertise, material science and processing and testing capabilities called upon to service the Oil, Natural gas & Petrochemical (OGP) market.
General Cable offers the most comprehensive line of specialty IEEE, IEC, Industrial and Communications wire and cable solutions tested and certified on both a global and regional scale. With years of industry knowledge and insight, General Cable engineers exclusive designs to meet product and application specifications and withstand demanding environments. Our ongoing technology effort delivers new solutions that continue to advance the drilling, exploration, production and refining of natural resources for Oil, Natural gas & Petrochemical (OGP) markets globally.

57
Missouri
Missouri’s share of Offshore Gulf of Mexico
oil and natural gas spending was $43 million
in 2010, leading to a total economic impact
of $43 million and a total employment impact
of 500 jobs. In 2013 total economic impact
should reach about $80 million, while total
employment impact is expected to reach 1
thousand jobs.
Florida
Florida, despite being geographically on the
Gulf of Mexico coast does not produce
significant amounts of oil and natural gas
offshore. Relative to its closeness to the
producing region Florida has little
involvement in the oil and natural gas
industries both on and offshore. However
some key suppliers to the oil and natural gas
industry have a presence in the state, such
as Oceaneering International which
operates an umbilical manufacturing plant in
Panama City, Florida.
Despite this, Florida still sees the impacts of
the offshore Gulf of Mexico oil and natural
gas industry. Total economic impact in 2010
stood at $42 million derived from spending
of $44 million. Total employment impact in
2010 stood at 600 jobs, which should reach
13 hundred jobs in 2013. Total spending in
2013 is forecasted to be $98 million leading
to a total economic impact of about $91
million.
Emerson Electric – St. Louis, Missouri
Emerson is a diversified global manufacturing and technology company that offers a wide range of products and services in the industrial, commercial, and consumer markets through its network power, process management, industrial automation, climate technologies, and tools and storage businesses. Recognized widely for its engineering capabilities and management excellence, Emerson has approximately 127,700 employees and 240 manufacturing locations worldwide. In 2010 Emerson had revenues of $21BN including $1.3MM attributed to U.S. exports. The company spends nearly $500MM annually in research and development. Emerson is the second largest company in Missouri and the largest Fortune 500 Company in Electrical Equipment. Emerson is the leading U.S. based provider of process management solutions, topsides automation and network power for offshore platforms, rigs and floating production systems. In 2009 Emerson acquired the Norwegian based subsea metering specialists Roxar ASA. The deal creates the world’s first integrated automation solutions company whose products span from subsea oil and natural gas reservoirs, to platform and floating production, to transmission, and ultimately through refining and production of goods .
Oceaneering - Panama City, FL
Oceaneering is a global oilfield provider of engineered services and products, primarily to the offshore oil and natural gas industry, with a focus on deepwater applications. Oceaneering is a leading provider of Remotely Operated Vehicles as well as subsea production umbilicals. Oceaneering operates and umbilical manufacturing plant in Panama City, FL.
Almaco - Boca Raton, FL
ALMACO provides a complete range of products and services in Accommodations and Food Handling Systems, addressing all aspects from conceptualization and design, through complete turnkey deliveries and efficient post-delivery support for passenger ships, floating accommodations, offshore platforms and land-based buildings.

58
Wisconsin
In 2010 Wisconsin had a total economic
impact of $41 million due to the offshore
Gulf of Mexico oil and natural gas industry
spending. Employment Impact from the
industry was 600 jobs with expectations to
reach 12 hundred by 2013. Predicted
spending of $88 million should lead to a total
economic impact of about $ 90 million in
2013.
Rockwell Automation – Milwaukee, Wisconsin
Rockwell Automation is the 8th
largest company in Wisconsin with 2010 revenues of nearly $5BN. The company is present in 33 states and 49 U.S. cities. Rockwell is the second leading U.S. based provider of process and control solutions for large manufacturing facilities. The company spends nearly $200MM annually on research and development. Rockwell’s Integrated Architecture Solutions, provides sequential, process and power control in one architecture for seamless information flow from production fields and platforms. These advanced technologies enable the safe operations of large fields in complex environments where 24/7 monitoring is required.
Veolia Environmental Services- WI Veolia Environmental Services in North America is a subsidiary of Veolia Environmental Service (VES). Veolia Environmental Services - Industrial Services (VES-IS) offers proven experience in environmental, industrial cleaning and maintenance solutions.
Industrial services include: Industrial cleaning, environmental waste management, mechanical services, and special services.

59
Michigan
Michigan received spending of $34 million
due to the offshore Gulf of Mexico oil and
natural gas industry in 2010; this led to a
total economic impact of $38 million. Total
employment impact of 400 jobs was felt. In
2013 total economic impact is expected to
reach $67 million on spending of $61 million,
with total employment impact at 700 jobs.
Dow Chemical Corporation - Midland, Michigan
Dow Chemical is the third largest company in Michigan (the largest non-auto manufacturing company in the state). The company ranks 46 on the fortune 500. Dow is present in 24 U.S. states with roughly 24 thousand U.S. based employees. Dow’s diversified industry-leading portfolio of specialty chemical, advanced materials, agrosciences and plastics businesses delivers a broad range of technology-based products and solutions to customers in approximately 160 countries and in high growth sectors such as electronics, water, energy, coatings and agriculture.
Dow Oil & Natural gas is a business unit of The Dow Chemical Company and its consolidated subsidiaries combining Dow’s experience in the chemicals industry with their knowledge of the energy business. As a leading expert in materials science Dow provides essential knowledge around insulation and coatings for deepwater pipelines and subsea equipment.
R.M. Young Company- MI The company has 40 years of experience in manufacturing meteorological instruments, and provides sensors for many unique applications. The company provides meteorological instruments that are used on offshore vessels, drilling rigs and platforms.

60
Nebraska
Nebraska received spending due to the
offshore Gulf of Mexico oil and natural gas
industry of $44 million in 2010. This
spending led to a total economic impact of
about $33 million and a total employment
impact of 500 jobs. In 2013 spending is
predicted to rise to $80 million dollars,
leading to a total economic impact of $60
million and a total employment impact of 900
jobs.
Peter Kiewit Sons – Omaha, Nebraska
Kiewit is one of North America's largest and most respected construction and mining organizations. For over 125 years, Kiewit has delivered world-class solutions to projects of every size, in every market. Kiewit is the 4
th largest
company in Nebraska with just under $10BN in annual revenues. The company is present in 19 U.S. states and 29 U.S. cities. Through their subsidiary Kiewit Offshore Services, Ltd., the company fabricates large, complex offshore oil production platforms at their 400-acre fabrication facility in Ingleside, Texas. Kiewit builds fixed and floating structures for most of the world's major oil companies. Kiewit has extensive experience in the fabrication, erection and construction of offshore jackets and decks; concrete gravity base structures; oil and natural gas processing units; well heads, flow lines and flow stations; pipelines and compressor stations; and enhanced oil-recovery facilities.

61
Indiana
Indiana received spending of $24 million in
2010 from the offshore Gulf of Mexico oil
and natural gas industry leading to a total
economic impact of $24 million and a total
employment impact of 300 jobs. In 2013
growth in spending to $62 million will lead to
a total economic impact of about $63 million
and total employment impact of 900 jobs, a
threefold increase from 2010.
Cummins, Inc. – Columbus, Indiana
Cummins Inc., a global power leader, is a corporation that designs, manufacture, distributes and services engines and related technologies, including fuel systems, controls, air handling, filtration, emission solutions and electrical power generation systems. Cummins serves customers in approximately 190 countries and territories.. Cummins reported net income of $428 million on sales of $10.8 billion in 2009. Cummins is the third largest fortune 500 company in Indiana. The company is present in 13 U.S. states and 22 U.S. cities. Cummins is a leading supplier of engines and generators for offshore drilling and production units in addition to power supply solutions for well servicing, pressure pumping, and natural gas compression.
Trelleborg- Indiana The company offers customized and standard sealing solutions for the Construction, Industrial and Transport sectors mainly in Europe and North America Using their extensive application knowledge coupled with state-of-the-art design and tooling technology Trelleborg provides optimized sealing solutions to meet customer needs. Trelleborg offer profiles from a comprehensive range of elastomer and thermoplastic materials including multi-component composite solutions. Supported by the polymer materials expertise available within Trelleborg can offer a full range of materials, surface treatments and fabrication techniques for use in the oil and natural gas industry.

62
New Jersey
In 2010, spending by the offshore Gulf of
Mexico oil and natural gas industry in New
Jersey was $15 million, leading to a total
economic impact of over $15 million and a
total employment impact of 200 jobs. In
2013 spending should rise to $42 million
leading to a total economic impact of $41
million and a total employment impact of 500
jobs
.
Honeywell International – Morristown, New Jersey
Honeywell is the 4th largest Fortune 500
Company in New Jersey and the 6th
largest U.S. Aerospace and Defense Contractor. Honeywell invents and manufactures technologies to address tough challenges linked to global macro trends such as safety, security, and energy. In 2010 Honeywell spent $1.5BN in research and development. The company has approximately 122,000 employees worldwide, including more than 19,000 engineers and scientists. Nearly 50 percent of the workforce is based in the U.S. Honeywell operates through four distinct business units: Aerospace, Transportation Systems, Automation & Control Solutions, and Specialty Materials. Honeywell’s key roles in the offshore oil & natural gas market include topside control systems, safety & security systems, and high performance fibers. The ACS business unit provides topside control systems & safety/security systems for floating production platforms and drilling rigs. Specialty Materials provides advanced fibers and coatings for deepwater mooring ropes, slings, and installation work ropes.

63
New York
New York State received $12 million of
spending due to the offshore Gulf of Mexico
oil and natural gas industry in 2010, this
spending led to a total economic impact of
$11 million and a total employment impact of
85 jobs. In 2013 spending is set to rise to
$23 million leading to a total economic
impact of $21 million and a total employment
impact of 156 jobs.
Pall Subsea Division- Port Washington, NY Pall Corporation is a technology leader in the $48 billion global filtration, separation and purification industry. Pall has become a $2.4 billion company by solving complex fluid management challenges for diverse customers around the world. Revenues are almost evenly split between the Industrial and Life Sciences markets.
Pall Corp is a leading provider of topsides fluid processing and separation equipment to the oil and natural gas industry. Pall corp’s equipment is deployed on drilling rigs, floating production units and fixed platforms to enable the separation of fluids for environmental and commercial purposes. Their water filtrations systems are also deployed on subsea components offshore.
Hess Corporation – New York, New York Hess Corporation is a fully integrated energy company engaged in exploration and production of crude oil and natural gas, as well as the refining and marketing of petroleum products, natural gas and electricity. Hess operates 1,350 natural gas and retail stores serving 1.3MM customers per day in 16 states along the East Coast USA. Hess is the 13
th largest
Fortune 500 Company in New York City. The company offices can be found in 8 U.S. states and 11 U.S. cities. In 2010 Hess produced domestically (U.S.) 89,000 barrels of crude and natural gas liquids per day and 108 million cubic feet of natural gas per day. Roughly 70 percent of Hess crude and natural gas liquid production comes from offshore while 50 percent of natural gas production comes from offshore fields. The company spends roughly $3BN per year on U.S. exploration and production activities. Hess is one of a few large independent oil companies that play an active role in exploration and production of deepwater Gulf of Mexico. The company is the ninth largest leaseholder in deepwater (>500fsw) with 237 operated leases and 58 leases as partner.

64
Montana
Montana has a large domestic oil and
natural gas industry and thus sees a
relatively small percentage of its oil and
natural gas industry spending from the
offshore Gulf of Mexico. In 2010 total
spending in Montana was at $12 million,
leading to a total economic impact of $11
million dollars and total employment impact
of 100 jobs.
In 2013 spending should rise to $19 million,
with a total economic impact of $17 million
and a total employment impact of 150 jobs.
North Dakota
North Dakota has significant domestic oil
and natural gas production and as such
sees very little of its substantial oil and
natural gas related domestic product derived
from the offshore Gulf of Mexico oil and
natural gas industry. However, through its
involvement in the oil and natural gas supply
chain still saw spending of $11 million in
2010 leading to a total economic impact of
$9 million. Total employment impact stood at
90 jobs.
Due to increasing spending levels total
economic impact is projected to reach $14
million in 2013, with total employment
impact expected to reach 100 jobs from
spending of $17 million.
Tennessee
In 2010 offshore Gulf of Mexico oil and
natural gas spending in Tennessee was $8
million, total economic impact of this
spending stood at $9 million while total
employment impact was at 100 jobs.
In 2013 due to growth in the offshore Gulf of
Mexico oil and natural gas industry,
spending in Tennessee is expected to reach
$12 million leading to a total economic
impact of $13 million while total employment
impact is expected to reach 150 jobs.

65
Minnesota
In 2010, spending by the offshore Gulf of
Mexico oil and natural gas industry in
Minnesota was $4 million, leading to a total
economic impact of over $4 million and a
total employment impact of 60 jobs. In 2013
spending should rise to $13 million dollars
leading to a total economic impact of over
$13 million and a total employment impact of
200 jobs.
South Dakota
In 2010 offshore Gulf of Mexico oil and
natural gas spending in South Dakota was
$3 million, total economic impact of this
spending stood at $2 million while total
employment impact was at 15 jobs in 2010.
In 2013 due to growth in the offshore Gulf of
Mexico oil and natural gas industry,
spending in South Dakota is expected to
reach $4.5 million leading to a total
economic impact of over $3 million while
total employment impact is expected to
reach 25 jobs.
Idaho
Idaho felt and economic impact of $1 million
in 2010 due to the offshore Gulf of Mexico
oil and natural gas industry based on
spending of $2 million, total employment
impact stood at 20 jobs. In 2013 spending
should reach $2 million leading to a total
economic impact of $2 million and a total
employment impact of 30 jobs.
3M Corporation – St. Paul, Minnesota
3M is the largest publicly held manufacturing company in Minnesota which is home base to the world renowned 3M Corporate Research Labs. The company has 33,000 U.S. employees including 3,700 scientific researchers and an annual R&D budget of $1.5BN including $20MM on pure scientific research. With nearly $25 billion dollars in annual revenues and 74 manufacturing facilities across 27 US states 3M Corporation is one of America’s most notable innovation leaders.
Though widely known as the company that introduced the “sticky-note”, 3M has also been supplying products to the Oil and Natural gas business for over 50 years. Today, nearly 10,000 3M products are available into every corner of the industry – from exploration and production to transportation, refining and marketing. 3M’s key enabling contribution to the deepwater sector is the advanced material solutions for syntactic foams used to insulate pipelines in water-depths with extreme pressures and temperatures such as the Gulf of Mexico.

66
Other States
The total offshore Gulf of Mexico oil and
natural gas industry spending for the
remaining states, as well as their total
contributions to GDP and employment is
listed below (Table 15). The remaining non-
Gulf States include, Nevada, Oregon, North
Carolina, Maine, Arizona, Massachusetts,
Hawaii, Connecticut, Delaware, Georgia,
Iowa, Maryland, New Hampshire, Rhode
Island, South Carolina, Vermont, and
Washington.
Table 15: Estimated Historical and Projected Total Spending, Contributions to GDP, and Employment Impact for Other States due to Oil and Natural Gas Operations (2008-2013)*
* Projected employment contingent on returning to pre-Macondo permitting rates.
Source: Quest Offshore Resources, Inc.
APS Technology- CT
APS Technology, Inc. specializes in the design, development and manufacture of electromechanical, instrumentation, sensor, and software designs for the oilfield and other harsh environments. APS has engineering expertise in oilfield drilling and sensor equipment, shock and vibration isolation designs, and stress analysis for static and rotating conditions. APS's customers include all of the major integrated multinational oilfield service companies, independent directional drilling companies, MWD service companies and oilfield companies engaged in non-drilling related services. APS also provides engineering analysis, product development services, and proprietary products to customers worldwide.
2008 2009 2010 2011 2012 2013
Total Contribution to GDP (Millions) $1.1 $1.1 $1.0 $1.3 $1.5 $1.6
Total Spending (Millions) $1.2 $1.2 $1.2 $1.4 $1.7 $2.3
Total Employment Impact 13 14 12 15 17 19
Historical Projected

67
Appendix 2: Introduction to the U.S. Gulf of Mexico’s Offshore
Oil & Natural Gas Industry

68
Life-Cycle of a Field Development
The domestic offshore oil and natural gas
industry provides vital energy for the U.S.
economy. However, developing offshore oil
and natural gas resources is significantly
more challenging than their land-based
counterparts. These challenges only
increase with increasing water depth. The
purpose of this section is to give the reader
a better understanding of the necessary
activities and practices the industry must
engage in to provide offshore oil and natural
gas production.
This section outlines all of the major steps
that a typical project must go through from
initial resource appraisal to production
(Figure 16). The review also discusses the
relevant pieces of equipment at the reservoir
level, the sea floor, and at the water surface.
Figure 14: Typical Development Timeline for Offshore Oil and Natural gas Developments
Source: Quest Offshore Resources, Inc.
Every potential offshore oilfield development
project goes through a “life-cycle”. What
follows is a walk-through of this cycle to
provide an understanding of the functioning
and process of the offshore oil and natural
gas industry via a typical offshore oilfield
development plan. This plan essentially
involves deciding the equipment pieces and
infrastructure that will be needed to produce
the wells and transport resources back to
shore, and where these pieces of equipment
will be placed to optimize production.
The typical field development plan moves
through predetermined stages – the
terminology may vary from operator to
operator, but the steps are generally the
same. These six stages outline the main
processes every offshore oil and natural gas
development goes through in order to
become a producing asset. A review of
what actions are undertaken during each
stage provides insight into the operational
plans of offshore oil companies operating in
the U.S.

69
Stage 1: Assessment, Exploration, Appraisal and Definition
During the “Assessment, Exploration,
Appraisal and Definition” stage, oil
companies engage in the evaluation and
appraisal of potential oil and natural gas
targets. Seismic surveys must be
conducted to locate promising areas.
Exploration wells must be drilled to further
determine the size and extent of the
potential field.
G&G Assessment
The first stage in developing an offshore oil
and natural gas field is finding out where
these resources may be present. To do this,
the industry relies on specialized seismic
contractors who provide imaging and data of
the geologic formations below the GoM’s
seafloor.
Figure 15: Seismic Vessel
Source: Quest Offshore Resources, Inc.
These seismic contractors own and operate
a fleet of boats that use acoustic imaging
techniques to assess the geological
formations lying beneath the seafloor
(Figure 17). Operations typically involve a
vessel towing “streamers” which are sensors
used to send and receive electromagnetic
waves in a set pattern throughout a defined
area which normally encompasses a group
of standardized “blocks” which operators
have leased. These boats, or vessels, are
highly specialized pieces of equipment that
play a pivotal role in the acquisition of this
information.
The seismic images and data captured by
these vessels provide critical information to
properly trained eyes. According to the
physical composition of these formations,
geologists, geoscientists, and other experts

70
will then determine the areas in which oil
and natural gas may be present. If a
potential oil or natural gas target looks
promising, the oil company that owns the
federal offshore lease will create an
exploration plan which involves the
scheduling of exploration wells.
Exploration Drilling
Direct physical evaluation of formations, or
reservoirs, is accomplished by drilling
exploration wells. In general terms, an
exploration well is viewed as a “sample”
production well. This exploration well will
allow companies to determine 1if oil or
natural gas is present, 2the quality of the
product and 3the potential size of the
formation (or “drilling target”). Offshore
drilling contractors have been vital to the
industry since the first underwater well was
drilled beneath a lake in Louisiana in the
1910s. These contractors own and operate
a sophisticated fleet of offshore drilling rigs
whose equipment specifications are relevant
to the intended water depth in which these
drilling rigs will be used.
In general, the industry’s fleet of offshore
drilling rigs can subdivided between shallow
water rigs (often referred to as “Jackups”)
and deepwater rigs (floating Mobile offshore
drilling units, or MODUs).
Jack-up Drilling Rig
A jack-up rig is a combination of a drilling rig
and floating barge, fitted with long support
legs that can be raised or lowered
independently of each other (Figure 18).
The jack-up is towed onto location with its
legs up and the barge section floating on the
water. Upon arrival at the drilling location,
the legs are jacked down onto the seafloor,
preloaded to securely drive them into the
sea bottom, and then all three legs are
jacked further down. Since the legs have
been preloaded and will not penetrate the
seafloor further, this jacking down of the legs
has the effect of raising the jacking
mechanism, which is attached to the barge
and drilling package. In this manner, the
entire barge and drilling structure are slowly
raised above the water to a predetermined
height above the water. Wave, tidal and
current loading acts only on the relatively
small legs and not the bulky barge and
Figure 16: Jack-up Drilling Rig
Source: Quest Offshore Resources, Inc.

71
drilling package. From March 2009- March
2011 there was an average of 39 jack-up
drilling rigs working in the Gulf of Mexico,
while in the same period and average of 301
were working in the rest of the world (Table
15).
Table16: Estimated Historical Offshore Drilling Rigs in Service (2009 – 2011)
Source: Quest Offshore Resources, Inc.
Drillship
A drillship is a maritime vessel modified to
include a drilling rig and special station-
keeping equipment. The vessel is typically
capable of operating in deep water. A
drillship must stay relatively stationary on
location in the water for extended periods of
time. This positioning may be accomplished
with multiple anchors, dynamic propulsion
(thrusters) or a combination of these.
Drillships typically carry larger payloads than
semisubmersible drilling vessels (discussed
below), but their motion characteristics are
usually inferior. An average of 7 drillships
have been in service in the U.S. GoM from
March 2009-2011 compared to an average
of 40 in the rest of the world.
Semisubmersible Drilling Rig
A semisubmersible drilling rig is a particular
type of floating vessel that is supported
primarily on large pontoon-like structures
submerged below the sea surface. The
operating decks are elevated perhaps 100
or more feet above the pontoons on large
steel columns. This design has the
advantage of submerging most of the area
of components in contact with the sea and
minimizing loading from waves and wind.
Semisubmersibles can operate in a wide
range of water depths, including ultra deep
water. They are usually anchored with six to
twelve anchors tethered by strong chains
and wire cables, which are computer
controlled to maintain station keeping
(mooring systems). Semisubmersibles
(called semi-subs or simply semis) can be
used for drilling, work over operations, and
production platforms, depending on the
equipment with which they are equipped. On
average 21 semi-submersible drilling rigs
Type of Rig in Service
U.S. GoM March 2009 March 2010 March 2011
Drill Ships 7 7 8
Semi-Submersibles 22 24 18
Jack-Ups 40 40 38
Rest of World March 2009 March 2010 March 2011
Drill Ships 35 40 45
Semi-Submersibles 139 138 138
Jack-Ups 319 296 289
Total Worldwide 562 545 536

72
have been in service in the U.S. GoM from
March 2009-2011 compared to an average
of 138 in the rest of the world.
Drilling the Well
Once the appropriate drilling target has been
located, and a suitable drilling rig has been
contracted, the operator will then engage in
a drilling campaign to explore the potential
formation found in the G&G process. This
process is performed under some of the
most technically advanced and challenging
conditions in the world. Whether drilling a
well in shallow waters or the ever complex
deepwater, drilling contractors are aiming at
a target that is often many miles from the
drilling rig; averaging between 15 thousand
and 30 thousand feet below the subsurface
(beneath the ocean floor).
A drill bit surrounded by an outer pipe is sent
thousands of feet below the waterline to
penetrate the Earth’s surface at the sea floor
(Figure 19). The drilling contractor continues
to feed more and more pipe through the rig,
while the drill bit churns deeper and deeper,
until the targeted depth is reached.
Approximately 125 crew men are on the rig
at any given time. The crew consists of a
mixture of personnel from the drilling
contractor such as rough necks (manual
laborers), drillers, and support staff and
people from the operating oil company and
other various contractors. Most employees
work on a rotational schedule with two
weeks offshore followed by two weeks off.
Products consumed in this period include
drill pipe, drilling mud, and other supplies
such as food and fuel which are transported
by specialized supply ships from shore
bases located along the Gulf Coast.
Once the target depth is reached, the drilling
contractor will allow the well to flow briefly in
order to collect some oil for further
assessment (a drill stem test). Once an
adequate quantity is produced, the drilling
contractor will then temporarily plug the well
until the operator is able to make a decision
on the commerciality of the well.
Field Definition
The “define” stage is very important, as it
sets the foundation for if and how a field is
developed. The operating company uses
data and information collected during
exploration and appraisal drilling to define
the layout and physical composition of the
oil and natural gas resources in place.
Figure 17: Drillship Drilling Well
Source: Quest Offshore Resources, Inc.

73
Flow tests during exploration drilling are very
important because they determine how
easily oil and natural gas flows throughout
the reservoir. Operators consider the
estimated recoverable amount of resource in
place and apply financial models to
determine the commercial viability of the
field. If the field is deemed economic,
further development plans are made in the
“concept selection" phase of field
development.
Stage 2: Concept Selection
During the “concept selection” stage, the
operating oil company and its partners work
together to develop an optimal plan for
developing an offshore field or well. During
this stage, the companies will consider
different concepts for how to best develop
the field in a manner that adheres to any
and all regulations and is efficiently
profitable to all parties.
Often included in this stage are discussions
around whether or not the field is large
enough to require its own in-field host /
processing facility (a stand alone, fixed
platform, or floating platform). This stage is
also where the companies will decide how
many wells to drill offshore, optimize well
placement, the pipeline needs and designs,
as well as determining the quantity and
location of other equipment to be placed on
the seafloor.
What follows is a concise overview of the
various equipment and oil field infrastructure
components that are used in the
development of these resources. This stage
of development is primarily undertaken by
engineers and their support staff working in
both the major oil and natural gas centers
such as Houston, Texas or in the
headquarters location of the company.
Contract engineers also contribute to this
process as do contractors throughout the
country who provide information to the oil
companies on the products they can supply
and how these could fit into the
development.
Shallow Water Fields
In general, there are few options available to
fields that will require a host facility. For
shallow water fields, the primary choice is
the employment of a fixed platform – or a
steel jacketed structure that is physically
attached to the seafloor.
While these fields require less technical
difficulty than their deepwater counterparts,
they account for a very large portion of the

74
GoM’s production. Most of the Gulf’s fixed
platforms consist of the fixed platform,
surface wells and export pipelines. On
average from 2008-2013, 63 fixed platforms
are expected to be installed in the Gulf of
Mexico per year (Table 16).
Table 17: Estimated Historical and Projected Number of Platforms Installed in the Gulf of
Mexico by Year (2008-2013)*
* Projected platforms contingent on returning to pre-Macondo permitting rates.
Source: Quest Offshore Resources, Inc.
The surface wells are all controlled from the
platform topsides and allow for easier
access to the reservoir to ensure the field
maintains its desired production rates. Once
production reaches the platform, the
processed liquid is then transported via
underwater pipeline (export pipeline) back to
shore to be refined into the multitude of
components for which the final product is
used.
Most of the platforms utilized in the Gulf of
Mexico are fabricated in shipyards along the
gulf coast. Being near to the water allows for
ease of transportation as these are often
either towed out or placed on barges. In the
shipyards workers such as welders and
machinists assemble steel into the sections
of the hull according to the engineered
design using heavy equipment such as
cranes.
A platform’s weight can vary widely from a
few thousand tons to tens of thousands of
tons depending on the size of the field and
amount of production expected. The
“topsides” are where the actual processing
of the produced fluids (which normally
includes water, oil and natural gas in
addition to other impurities) takes place, as
well as the drilling in the case of most fixed
platforms. These are assembled in
shipyards from steel, piping, and other
components such as separation units, power
supply units, and drilling equipment which is
sourced from throughout the country.
YearNumber of Platforms
Installed
2008 72
2009 27
2010 23
2011 90
2012 83
2013 83

75
Figure 18: Types of Production Platforms / Floating Production Units Used in the Gulf of
Mexico
Source: Quest Offshore Resources, Inc.
Deepwater Fields: Facilities
In deepwater environments, the application
of a fixed platform is unfeasible. The
practical limit is 1,000 feet. Therefore in
deep water, operators must use floating
hosts or “floating production systems”
(FPS’s). The FPS solutions that are
currently available are the Tension-Leg
Platform (TLP), the SPAR, the Semi-
Submersible platform, and in specific
instances a Floating Production Storage and
Offloading (FPSO) vessel (Figure 20).
Tension-Leg Platforms are very buoyant
platforms either with three or four columns
which are moored to the sea bottom via
multiple steel tendons. These tendons are
shorter than the distance the platform would
settle at if it was not moored to the sea floor;
this leads the platform to be very stable and
prevents vertical and horizontal movement
thus allowing drilling operations to be
conducted from the platform.
Spar platforms are long cylindrical hulled
platforms with the length and weight of the
hull providing enough stability necessary to
conduct drilling operations. Due to the length
of the hull, the hull must be towed out to the
field horizontally and righted at the field.
Therefore, topsides must be lifted and
integrated onto the platform offshore.
Semi-submersible platforms, which are often
utilized for the largest projects in the
offshore Gulf of Mexico normally consist of
four columns on pontoons with a large deck
built on top. The arrangement leads to a
large topside area. The lower part of the hull
sits below the water level while the upper
part sits above the waterline, this can be
actively adjusted via the movement of water

76
into and out of the tanks which are inside the
pontoons at the bottom of the hull.
Floating production storage and offloading
units (FPSO) are a technology that is rare in
the Gulf, with only one existing unit which is
due to start up this year. These are of a
simpler design, which basically constitutes a
strengthened oil tanker with production
topsides. This allows for the export of oil
without a pipeline and thus makes it more
common in less developed regions where
less infrastructure is in place.
Most hulls for floating production units are
fabricated in foreign shipyards due to the
lack of suitable facilities in the United States.
Fabrication of Topsides for floating platforms
is done almost exclusively in Shipyards in
the United States. The topsides are more
complex and highly engineered than the
platform hulls though, leading to more
spending from floating production platforms
in the country versus overseas.
Deepwater Fields: SURF Equipment
Equipment below the water line and at the
seafloor is generally referred to as the
“SURF” market, where SURF stands for
Subsea, Umbilicals, Risers and Flowlines.
These technologically advanced
components tie together to power and
transport the production back to the surface
facility for processing and delivery. A
thorough review of each of these
components is provided below.
Subsea
While subsea equipment is used as a “catch
all” for a large portion of the equipment on
the sea floor, the most critical component of
subsea production equipment is the subsea
“Christmas tree,” or tree. The tree and
control pod is a highly technical piece of
equipment that sits on top of the well and
allows for the control of each well’s
production and performance. (Figure 21)
From 2008-2013, an average of 60 subsea
trees are expected to be installed per year
(Table 17).
Table 18: Estimated Historical and Projected Number of Subsea Trees Installed in the Gulf
of Mexico by Year (2008-2013)*
* Projected trees contingent on returning to pre-Macondo permitting rates.
Source: Quest Offshore Resources, Inc.
YearNumber of Trees
Installed
2008 79
2009 87
2010 79
2011 46
2012 22
2013 30

77
Figure 19: Subsea Christmas Tree
Source: Quest Offshore Resources, Inc.
These pieces of equipment are of a fairly
standard composition from a general
standpoint, but differ greatly from oilfield to
oilfield. However, all trees serve as the
primary access point to the reservoir(s)
being produced on a field. Operating oil
companies often access a well via the
subsea tree to performing operating
maintenance operations to ensure a safe
and productive flow of liquids from the well.
Other components included in the broader
“subsea” equipment category include the
various pieces of connection machinery.
These include:
• Manifold: A central collection point for multiple subsea wells. A manifold is then connected to a pipeline to transport production to the host location
• Pipeline End Termination (PLET): a
connection point between a pipeline and a subsea tree or manifold
• Jumper: short, pipeline-like link
connecting a PLET or manifold to a pipeline
• Flying Lead: short-range connector of
power (electric or hydraulic) to subsea tree(s)
Whatever the specific component, the
pieces of equipment in the “Subsea”
category of SURF all serve to connect and
control production from the well to the
infrastructure and / or equipment that will
transport the produced product.
Subsea equipment utilized in the U.S. Gulf
of Mexico is almost exclusively
manufactured inside the Unites States, with

78
all the contractors involved (including foreign
companies) maintaining factories and shore
bases to serve the U.S. Gulf of Mexico. This
activity provides large levels of spending
due to their high value and complexity into
not only the key states where these are
primarily physically located (Texas,
Louisiana, and Alabama) but also
throughout the country due to companies
which as subcontractors supply components
to the industry.
Umbilicals
The umbilical performs functions that are
required to provide power and fluids to the
entire subsea production system. These
Figure 20: Umbilical Cross Section
Source: Quest Offshore Resources, Inc.
“cables” are often very complex and
technologically advanced containing multiple
functions in a single umbilical (Figure 22)
Moreover, in addition to providing the
electrical or hydraulic power for the subsea
trees, these cables also carry various
chemicals that are injected into a well to
enhance production and inhibit the formation
of hydrates that can block the flow of liquids
through the well. This optimization is called
flow assurance.
The umbilicals often require a large amount
of engineering to ensure there is no negative
interaction between the power and other
functions in a single umbilical. Additionally,
as umbilicals increase in the number of
functions contained in a single line, the
installation of that line becomes increasingly
difficult – requiring extensive installation
engineering to ensure that the unit is not
damaged before coming online. These
installation operations also require
specialized and expensive marine
construction and installation equipment.
Risers & Flowlines
The “R” (risers) and “F” (flowlines) portions
of the SURF market refer to the pipelines
needed for any offshore oilfield (the term
flowlines is used interchangeably with
pipelines). Both segments refer to the
pipeline transportation system of an oilfield
(Figure 23).
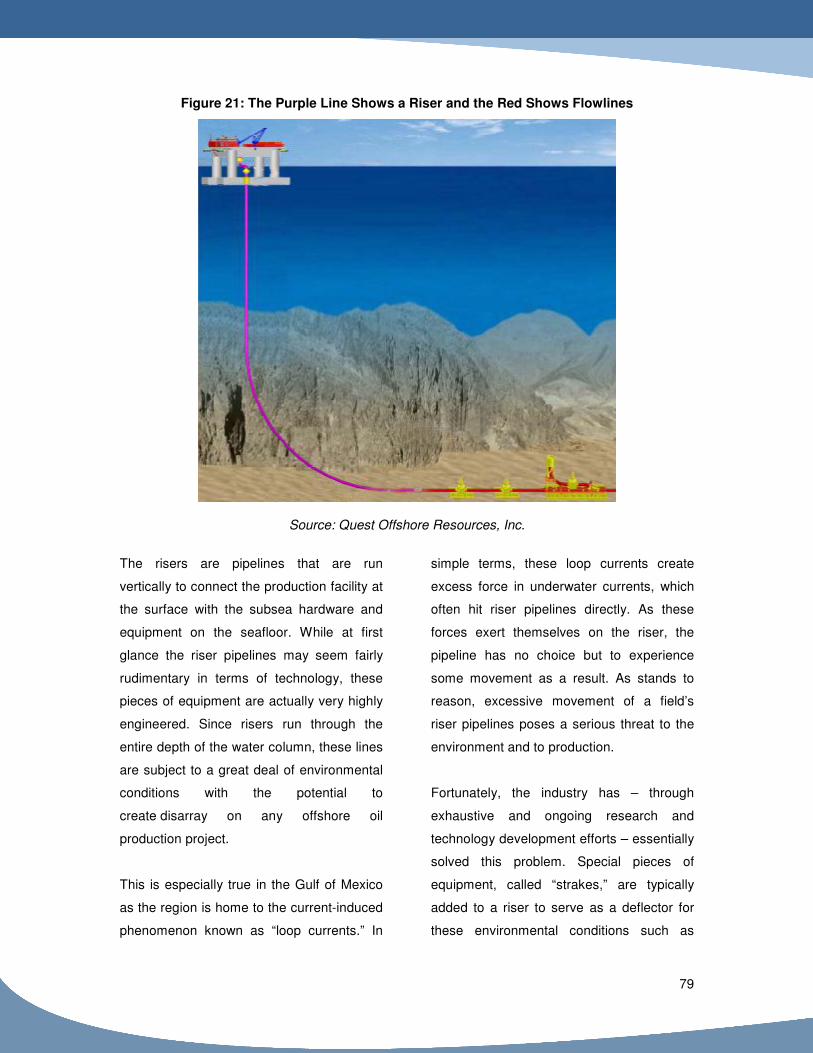
79
Figure 21: The Purple Line Shows a Riser and the Red Shows Flowlines
Source: Quest Offshore Resources, Inc.
The risers are pipelines that are run
vertically to connect the production facility at
the surface with the subsea hardware and
equipment on the seafloor. While at first
glance the riser pipelines may seem fairly
rudimentary in terms of technology, these
pieces of equipment are actually very highly
engineered. Since risers run through the
entire depth of the water column, these lines
are subject to a great deal of environmental
conditions with the potential to
create disarray on any offshore oil
production project.
This is especially true in the Gulf of Mexico
as the region is home to the current-induced
phenomenon known as “loop currents.” In
simple terms, these loop currents create
excess force in underwater currents, which
often hit riser pipelines directly. As these
forces exert themselves on the riser, the
pipeline has no choice but to experience
some movement as a result. As stands to
reason, excessive movement of a field’s
riser pipelines poses a serious threat to the
environment and to production.
Fortunately, the industry has – through
exhaustive and ongoing research and
technology development efforts – essentially
solved this problem. Special pieces of
equipment, called “strakes,” are typically
added to a riser to serve as a deflector for
these environmental conditions such as

80
vortex induced vibration (Figure 24). In
effect, these strakes allow the riser to “shed”
the force of the loop currents and maintain a
reliable position in relation to the surface
and subsea equipment being connected.
Figure 22: Riser Pipe with Anti Vortex Induced Vibration Strakes
Source: Quest Offshore Resources, Inc.
Additionally, risers are still evolving as oil
companies and equipment providers strive
to refine and perfect these technologies. A
few added benefits of increasingly new riser
technologies will be the ability to quickly
disconnect a surface facility in the event of a
hurricane, reduce the weight of the riser to
allow for smaller facilities, and many other
technological advances that will increase the
efficiency by which produced liquids flow
through the pipeline system
.Pipelines are used to transport material
both to and from a producing well(s). While it
is generally understood what these lines are
used for the technology being used in many
of the Gulf’s subsea pipelines is leading
edge incorporating space age materials.
As with risers, the primary purpose of an
offshore, subsea flowline is to transport
liquids either from the well back to the host
facility, or from the host facility back to
shore.
In every project development plan, pipeline
routes from the production platform to
onshore must be determined. This is done
with the aid of additional services from
“G&G” or seismic companies. Through the
use of acoustic imaging technology, these
companies can create a detailed map of the
seafloor. This allows companies to visually
map the best route for a subsea pipeline,
ensuring the safe and efficient transportation
of produced materials.

81
While conceptually fairly straightforward, the
risers and flowlines of an oilfield are some of
the most critical components that employ a
high degree of technical complexity and
subsequently high capital cost. To install
offshore risers and flowlines, the offshore oil
and natural gas industry utilizes a of fleet
specialized offshore installation boats. The
fleet is operated by a very capable group of
companies with a very long history of
successfully installing the multitude of
equipment pieces needed to produce the
offshore natural resources of the U.S.
These boats, or “vessels,” are large and
expensive pieces of equipment, ranging
from US$150 million to more than US$1
billion to design and build. For this reason,
installation contractors are very selective
when deciding whether or not to build any
new vessels.
Once the partners for a given field have
determined which solution best suits the
field, and provides the most effective use of
all parties’ capital expenses, a field
development plan is presented to the
relevant decision makers for the companies
involved. When the plan has been
thoroughly reviewed, and the potential
economic value
of the project has been determined, the
company(s) will then proceed to the “project
sanctioning” phase of development wherein
an offshore oilfield receives ultimate
approval to proceed with the final investment
decision.
Figure 23: Marine Construction Vessel
Installing Flowlines
Source: Quest Offshore Resources, Inc.

82
Stage 3: Project Sanctioning
Once the proposed concept for developing a
field has been presented, a decision is made
whether or not to Sanction, or give the go-
ahead to, the field in question. The decision
to sanction a project given a suitable
development plan has been presented – is
largely a consideration of the profitability of
the field.
Moreover, the companies involved in
developing and producing the field must be
assured that each will receive a company-
specific return on the capital investment that
must be made. A field may cost as much as
$10 billion and make take several years to
fully develop. The project sanctioning
decision is crucial decision and must ensure
that the owners in a project remain
financially healthy and are able to maintain a
long-term competitive position.
It is important to understand that oil and
natural gas exploration and production
companies consistently realize rather low
profit margins. A fact that can often be
overshadowed by the focus placed solely on
announced profit numbers. In other words,
the cost of being in this business is very,
very high. In order to maintain domestic
production, these companies face a rather
steep investment – or re-employment of
those profits. This happens at such a rate
that most major oil companies only
experience profit margins of three to ten
percent. Table 18 below shows the 2010
revenues for a select group of major U.S.
companies. Both ExxonMobil and Chevron
rank at the top of the list when ranked by
revenues. However, from a profitability
perspective they are in fact outperformed by
other large American companies.
Table 19: Comparison of 2010 Revenue ($ Billions), Income and Profit Margin for Major Companies – Various Industries
Source: U.S. Securities and Exchange Commission
Industry Company Revenue Income Profit Margin
Technology Microsoft 19.9 6.6 33.3%
Food McDonalds 16.2 4.9 30.5%
Pharmecuticals Eli Lilli 23.0 5.0 22.0%
Technology Google 21.7 4.2 19.4%
Tobacco Lorillard Tobbaco Co. 5.9 1.0 17.4%
Tobacco Reynolds American (Tobbaco) 8.1 1.1 13.6%
Food Pepsico 57.8 6.3 10.9%
Oil & Gas Chevron 198.1 19.0 9.6%
Oil & Gas ExxonMobil 370.1 30.4 8.2%
Pharmecuticals Merck & Co. 45.9 0.8 1.9%

83
Stage 4: FEED (Front-End Engineering & Design) & Detailed Engineering
Once sanctioned, the project moves into the
engineering and design phase. During this
time, the oil companies, their suppliers and
third-party support organizations work
together designing the highly technical
pieces of equipment and installation
methods that will be needed according to
the concept chosen in the “Concept
Selection” phase of development. This
process can vary in duration depending on
the overall size of the project being
considered, but generally takes more than a
year to complete.
This phase of the project development life
cycle is a critical source of creation for jobs,
as much of the engineering work that is to
be done is contracted to third parties –
namely engineering firms. While the vast
majority of oil companies have their own
engineers to carryout design and
development plans, many contract to highly
specialized engineering firms as an added
measure of safety and quality assurance.
Many of these engineering firms have grown
fairly large over the last decade, with many
employing upwards of 200 employees.
Additionally, many of these firms serve as a
great entry point into the industry for young
college graduates.
Specific tasks in this stage are to take the
concept created in stage 2 and sanctioned
in stage 3, and compile the designs that will
guide the companies through the actual
building and acquiring of the materials to
create the equipment that is needed.
Engineers spend many hours pouring over
technical specifications and designs to
ensure that the minute details of each piece
of equipment are built exactly to
specification. As such, this stage of work
employs the use of many highly trained and
highly skilled engineers.
At present, there is a large deficit of
qualified, young engineers to continue this
work when their more experienced
counterparts move towards retirement.
While this poses a large threat to the
industry, it is one that is being addressed
through university partnerships, public
relations campaigns, early career engineer
programs and other mediums. Regardless,
this generational gap presents a great
opportunity for young engineers and other
business students to fill a growing, always
vital role in the energy supply chain.
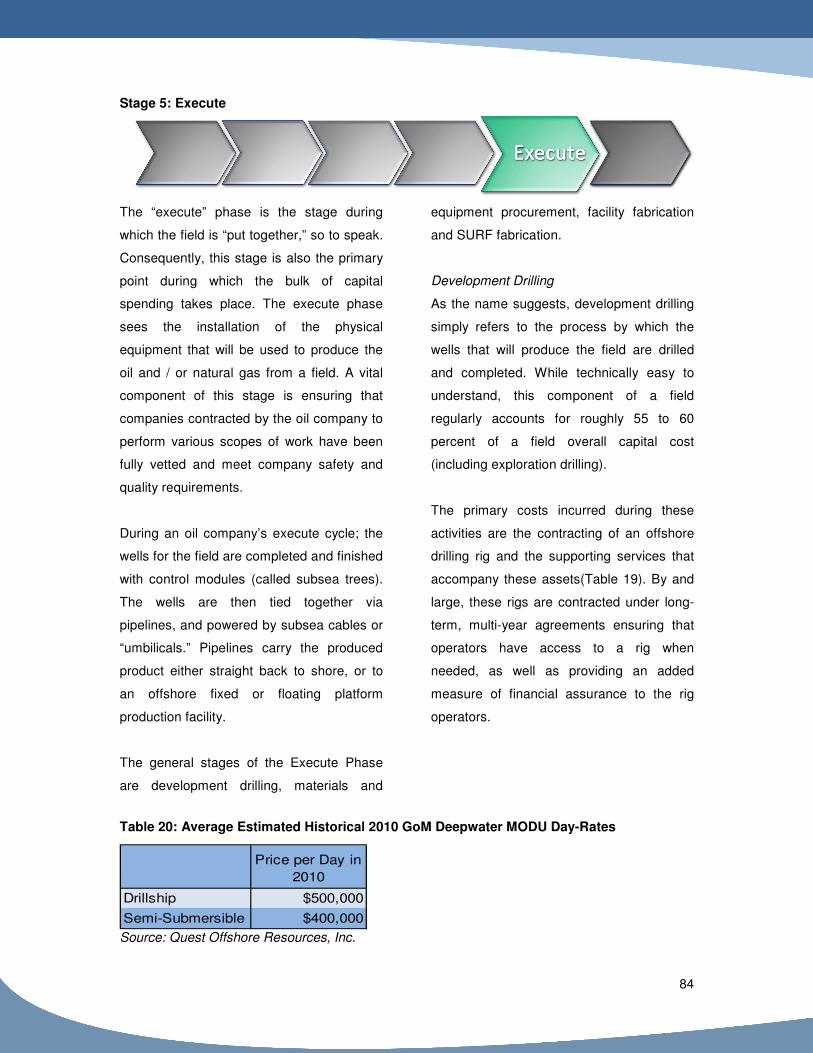
84
Stage 5: Execute
The “execute” phase is the stage during
which the field is “put together,” so to speak.
Consequently, this stage is also the primary
point during which the bulk of capital
spending takes place. The execute phase
sees the installation of the physical
equipment that will be used to produce the
oil and / or natural gas from a field. A vital
component of this stage is ensuring that
companies contracted by the oil company to
perform various scopes of work have been
fully vetted and meet company safety and
quality requirements.
During an oil company’s execute cycle; the
wells for the field are completed and finished
with control modules (called subsea trees).
The wells are then tied together via
pipelines, and powered by subsea cables or
“umbilicals.” Pipelines carry the produced
product either straight back to shore, or to
an offshore fixed or floating platform
production facility.
The general stages of the Execute Phase
are development drilling, materials and
equipment procurement, facility fabrication
and SURF fabrication.
Development Drilling
As the name suggests, development drilling
simply refers to the process by which the
wells that will produce the field are drilled
and completed. While technically easy to
understand, this component of a field
regularly accounts for roughly 55 to 60
percent of a field overall capital cost
(including exploration drilling).
The primary costs incurred during these
activities are the contracting of an offshore
drilling rig and the supporting services that
accompany these assets(Table 19). By and
large, these rigs are contracted under long-
term, multi-year agreements ensuring that
operators have access to a rig when
needed, as well as providing an added
measure of financial assurance to the rig
operators.
Table 20: Average Estimated Historical 2010 GoM Deepwater MODU Day-Rates
Source: Quest Offshore Resources, Inc.
Price per Day in
2010
Drillship $500,000
Semi-Submersible $400,000

85
Aside from the actual cost of the rig and its
crew, the operator must also pay for the
support boats that transport all drilling fluids
and other supplies to the rig, as well as
paying for helicopter transportation for
personnel. Additionally, the operator will
incur costs related to the physical materials
used during drilling operations (pipe, drilling
mud, etc.) which all must be procured and
physically transported to the field.
Materials & Equipment Procurement /
Fabrication
Simultaneous to the beginning of
development drilling (and often even before
development drilling begins), the oil
company will begin the process of sourcing
all of the materials needed for the subsea
and facility equipment. During these
activities, oil companies rely on supply chain
management professionals to negotiate
mutually beneficial terms for all parties
involved, while ensuring that the project
schedule is maintained.
Facility Fabrication
Often, the most critical component to be
fabricated is the host facility for the field.
These units represent a large portion of
capital costs to the oil company, and can
take upwards of three years to complete
depending on the size of the unit.
Figure 24: Gulf of Mexico Topside Fabrication Yards
Source: Quest Offshore Resources, Inc.
When contracting for a facility in the GoM,
operators will often seek to separate the hull
(base of the structure that supports the
weight of the topsides processing
equipment) and topsides (above-water
processing equipment) portion of the facility.
This is due to the region’s fortunate position
of having multiple fabrication yards along the
Gulf Coast that are specially geared to
providing topsides fabrication services

86
(Figure 26). This provides an added value of
allowing the oil company to maintain a
presence at the construction yard – ensuring
that designs and plans are carried out per
specifications.
This separation in the construction of the
hull and topsides of a facility is an important
distinction for the Gulf, as nearly 60 percent
of facilities spending are allocated to the
topsides. The existence of local fabrication
yards for these services provides a large
amount of jobs to the nation, as well as
ensuring that a majority of the facility (often
the most expensive piece of equipment) is
purchased and manufactured domestically.
Once fabrication is completed, the hull and
topsides are “mated” either just offshore
from the fabrication yard, or the topsides are
transported to the field and lifted onto the
hull for final commissioning in preparation
for production.
SURF Fabrication: Subsea Systems
The company must also take the designs
and plans previously developed for the
subsea production systems and contract for
the fabrication and delivery of these
technologically advanced equipment pieces
that will control the production of each well.
The contracts are often quite large
compared to other SURF equipment pieces,
with an average control system (subsea tree
plus control package) costing between $9
million to $15 million. A great advantage the
U.S. has in terms of these systems is that
Gulf of Mexico subsea production systems
are largely built and assembled
domestically.
Once fabricated and delivered, the oil
company will employ the use of the drilling
rig working on the development wells to
install the system on each completed well.
The control systems are connected and
controlled at the surface by the use of
subsea umbilicals.
SURF Fabrication: Subsea Umbilicals
To ensure proper control and powering of
the well, subsea umbilicals are employed.
As mentioned above, these units are
essentially long underwater cables used to
provide power (electric or hydraulic) to
subsea systems, as well as providing
essential fluids and chemicals to maintain
production.
Similar to subsea production systems, a
large majority of these units are
manufactured domestically. Similar to
subsea trees and control systems, the
umbilical is a highly engineered piece of
equipment that requires a fair amount of
engineering work to safely employ on a field.
The costs for this piece of equipment can be
generally categorized as: Engineering /
Design, Raw Materials, Fabrication, and
Delivery & Installation.
Once the umbilical has been delivered, the
oil company will contract for the installation
of this equipment using one of the industries
highly capable installation boats. While costs

87
for these assets can reach rather large
numbers of a “cost-per-day” basis, it is
important to note that the industry’s highly
skilled contractors have created large
efficiencies in the installation of these
cables, reducing the total time required for
installation significantly.
SURF Fabrication: Risers & Flowlines
While subsea umbilicals are highly
specialized units, offshore pipelines (and
pipelines in general) are essentially a global
commodity (Table 20).
Table 21: Estimated Historical and Projected Pipeline Capex Spent Overseas (2008-2013)*
* Projected spending contingent on returning to pre-Macondo permitting rates.
Source: Quest Offshore Resources, Inc.
Even though there are added complexities
with the fabrication of subsea pipelines,
generally speaking, a pipeline is a pipeline.
Moreover, steel is traded globally across a
multitude of industries.
This means that for every pipeline that
needs to be purchased, the oil company is
competing for the raw materials, whose cost
is dependent on global demand for steel, on
a global inter-industry scale. Additionally, the
cost of all pipelines needed for a field can
see volatile shifts across the life of the
project’s development cycle, making costs
harder to control.
Once the amount of material needed has
been determined, and suitable pipeline
manufacturing has been contracted, the
operator begins the process of contracting
for the installation of these pipelines typically
through a competitive tendering process. A
very important distinction to understand
regarding the offshore pipelines of a project
is that between 67 to 85 percent of the
offshore pipelines installed in the Gulf of
Mexico are purchased outside of the U.S.
This can primarily be attributed to the
migration of heavy industrial activities to
developing countries. India, for example, is
home to many of the world’s largest pipeline
fabrication companies.
Like the subsea umbilical, the installation of
pipelines relies on the industry’s fleet of
offshore installation vessels to complete
BillionsTotal Pipeline
Capex Spent
2008 $0.6
2009 $0.3
2010 $0.1
2011 $0.3
2012 $0.4
2013 $0.3

88
these activities. However, a key difference
for these pieces of equipment is seen in the
type of boat needed.
Given that pipelines weigh a significant
amount more than an umbilical, the assets
that install these flowlines and / or risers are
often noticeably more expensive. This
increase in boat cost reflects the larger,
more highly rated equipment needed on the
boat to ensure that these lines can be safely
installed.
Once the flowlines and risers are installed,
the lines are tested to ensure there was no
damage during installation. Provided that
these tests produce positive results, the
transportation system of the oilfield is ready
for use. While conceptually fairly
straightforward, the risers and flowlines of
an oilfield are some of the most critical
components that employ a high degree of
technical complexity and subsequently high
capital cost.
Stage 6: Operate
The “Operate” phase is generally used as a
generic description for the activities that are
undertaken once a field is brought on to
production. The actual tasks required to
maintain safe and efficient production are
extremely vast in quantity. The general
categories include all activities that maintain
a suitable flow of material through the
infrastructure and systems installed during
the “execute” phases. Operations must
ensure that production levels are capable of
continuing at levels that are sufficient to
ensure a financial return to the parties
involved.
Operating activities range from continuously
supplying food and fuel to the platform,
repairing damage caused by the wear and
tear associated with full time exposure to the
elements, performing routine maintenance
to ensure continued safe operations, and
ensuring safe transportation of produced
fluids.
All these activities require continued
employment of not only a large crew on the
production platform itself, but also require
support staff onshore. The operating
company requires onshore administrative,
management, and engineering support.
Onshore suppliers must provide the
necessary equipment and supplies. Boats
and helicopters are needed to transfer crew
and supplies back and forth. Wells must be
monitored and worked over when
necessary.

89
Appendix 3: RIMS II I/O Model Definitions

90
RIMS II I/O Model Definitions *Provided by BEA
Final-demand Multipliers
Final-demand output multipliers show the
total industry output per $1 change in final
demand. An estimate of the change in total
output in a region’s economy is calculated
by multiplying a final-demand change times
a final-demand output multiplier.
Final-demand employment multipliers show
the total number of jobs per $1 million
change in final demand. An estimate of the
change in total number of jobs in a region’s
economy is calculated by multiplying a final-
demand change times a final-demand
employment multiplier.
Final-demand value-added multipliers show
the total value added per $1 change in final
demand. An estimate of the change in total
value added in a region’s economy is
calculated by multiplying a final-demand
change times a final-demand value-added
multiplier.
Type II Multipliers
Type II multipliers not only account for the
direct and indirect impacts based on how
goods and services are supplied within the
region, but they also account for the induced
impacts associated with the purchases
made by employees. Type II multipliers
estimate an impact that is the sum of the
direct impacts, indirect impacts, and induced
impacts. For example, an individual who
works in offshore manufacturing in Ohio
earns a certain amount per year. This
money does not disappear after being paid
to the individual. Rather, this individual will
use some portion of earnings to buy
necessities, luxury items, etc. Furthermore,
a good majority of this spending will occur in
Ohio across multiple industries. The RIMS II
multipliers account for this effect, and as
such, provide for the comprehensive
economic impact of the industry on an
individual state.

91
Appendix 4: Explanation of Terms

92
Table 22: Explanation of Terms
component price inputs
HULL Steel, buoyancy, engineering
TOPSIDES Steel piping, control systems, chemicals, engineering, proccesing equipment
component price inputs
Subsea Tree, Controls, Manifolds, Flying Leads, Jumpers, PLETs, SDUs *PLET = Pipeline End-Termination
Umbilicals Steel piping, composite armoring, electrical wiring, chemicals *SDU = Subsea power Distribution Unit
Risers & Flowlines Steel fabrication, installation
component price inputs
Drilling Rig (SW Jackup / DW MODU) Day-rate cost of rig and supply boats, drill pipe, drilling mud
component price inputs
JACKET Steel, buoyancy, engineering
TOPSIDES Steel piping, control systems, chemicals, engineering, processing systems
Refer to "SURF." Pipeline = Flowline
FPS / Facilities
SURF
Drilling
Fixed Platforms (incl. surface wells)
Pipelines
The processing facility located at the surface. In shallow water, a Fixed Platform. In deepwater, an FPS (TLP, SPAR, SEMI or FPSO). The primary
components of spending are the steel for the hull (bottom structure) and topsides (processing facilities).
Subsea, Ubilicals, Risers & Flowlines. Refers to all equipment needed on the seafloor to bring production from the well to the host facility.
The shallow or deep water vessel used to drill the well. The cost of the drilling rig includes the day-rate for the rig, as well as the support boats and
chemicals needed to operate the rig. *Day-rate includes the labor on the rig.
Refer to "FPS / Facilities." This includes the fixed platforms, as well as the cost to drill and complete the surface (dry-tree) wells located on the
platform.

93
Appendix 5: RIMS Category Summary Tables

94
Table 23: Estimated Historical and Projected Total Contribution to GDP by State Associated with GoM Oil and Natural Gas Operations (2008-2013)
(US$ Thousands)
2008 2009 2010 2011 2012 2013 Total
Texas $3,271,252 $3,009,148 $2,591,354 $3,408,831 $4,081,917 $4,746,262 $21,108,764
Louisiana $10,585,223 $9,814,627 $8,892,025 $11,245,980 $13,057,960 $15,155,600 $68,751,414
Alabama $9,414,273 $8,748,213 $7,401,879 $9,135,162 $10,839,238 $12,977,350 $58,516,115
Mississippi $241,801 $247,060 $231,263 $284,478 $326,595 $363,159 $1,694,356
California $1,764,332 $1,795,231 $1,694,347 $2,081,301 $2,389,138 $2,644,663 $12,369,012
Oklahoma $1,327,004 $1,356,129 $1,283,034 $1,575,819 $1,806,621 $1,996,805 $9,345,412
Colorado $1,164,135 $1,190,423 $1,126,617 $1,382,638 $1,586,308 $1,750,942 $8,201,063
New Mexico $841,650 $861,518 $808,920 $992,353 $1,141,306 $1,262,103 $5,907,849
Ohio $298,295 $270,050 $306,048 $415,788 $410,759 $529,588 $2,230,529
Arkansas $284,888 $291,474 $272,875 $336,011 $385,044 $429,529 $1,999,821
Alaska $269,724 $276,403 $262,249 $320,773 $368,819 $404,398 $1,902,366
Pennsylvania $281,751 $260,325 $201,211 $254,165 $318,342 $403,753 $1,719,547
Kansas $176,767 $180,777 $170,035 $208,846 $239,881 $265,716 $1,242,022
Wyoming $165,449 $169,597 $160,924 $196,854 $226,449 $248,429 $1,167,701
Illinois $113,863 $132,113 $123,956 $179,872 $172,734 $254,215 $976,753
Utah $99,747 $101,888 $96,282 $118,338 $135,615 $150,122 $701,992
West Virginia $99,272 $101,538 $95,310 $117,079 $134,545 $149,174 $696,919
Kentucky $45,308 $41,859 $71,180 $107,052 $83,146 $120,709 $469,254
Virginia $69,549 $71,098 $66,981 $82,275 $94,423 $104,524 $488,850
Missouri $8,973 $3,687 $43,150 $77,281 $39,352 $78,851 $251,294
Florida $76,638 $57,380 $41,694 $50,172 $70,245 $91,183 $387,312
Wisconsin $8,557 $3,527 $41,081 $73,563 $37,474 $87,875 $252,078
Michigan $49,336 $43,139 $37,639 $46,319 $56,674 $66,618 $299,725
Nebraska $11,244 $7,946 $33,188 $56,480 $32,876 $59,225 $200,959
Indiana $49,412 $33,733 $24,184 $32,418 $42,904 $62,882 $245,533
New Jersey $34,720 $19,401 $14,944 $20,301 $27,139 $40,867 $157,373
New York $12,081 $13,168 $11,484 $15,620 $16,641 $20,980 $89,973
Montana $11,411 $11,825 $11,029 $13,336 $15,596 $16,885 $80,083
North Dakota $9,646 $9,879 $9,322 $11,423 $13,138 $14,481 $67,889
Tennessee $8,810 $8,988 $8,513 $10,470 $11,974 $13,253 $62,008
Minnesota $12,898 $7,174 $4,246 $5,209 $8,985 $13,008 $51,521
South Dakota $2,107 $2,185 $2,000 $2,422 $2,844 $3,108 $14,665
Idaho $1,377 $1,410 $1,326 $1,627 $1,870 $2,067 $9,677
Other States $1,069 $1,093 $1,034 $1,267 $1,454 $1,601 $7,517
Total $30,812,562 $29,144,007 $26,141,322 $32,861,521 $38,178,007 $44,529,924 $201,667,343

95
Table 24: Estimated Historical and Projected Total Spending by State Associated with GoM Oil and Natural Gas Operations (2008-2013)
(US$ Thousands)
2008 2009 2010 2011 2012 2013 Total
Texas $8,707,562 $8,045,469 $7,312,190 $9,263,393 $10,744,431 $12,507,826 $56,580,871
Louisiana $9,310,704 $8,573,307 $7,257,483 $9,010,702 $10,661,209 $12,867,085 $57,680,490
Alabama $3,291,903 $3,032,149 $2,654,435 $3,490,340 $4,182,305 $4,843,675 $21,494,808
Mississippi $276,293 $282,107 $266,769 $328,287 $376,067 $417,351 $1,946,873
California $1,518,021 $1,541,986 $1,453,308 $1,789,693 $2,052,603 $2,284,369 $10,639,981
Oklahoma $1,252,685 $1,279,048 $1,209,505 $1,488,424 $1,705,052 $1,892,230 $8,826,944
Colorado $987,561 $1,008,345 $953,520 $1,173,407 $1,344,187 $1,491,750 $6,958,769
New Mexico $976,753 $997,308 $943,083 $1,160,565 $1,329,475 $1,475,423 $6,882,607
Arkansas $311,690 $318,598 $300,445 $370,269 $423,365 $472,141 $2,196,507
Alaska $301,767 $308,118 $291,365 $358,555 $410,740 $455,830 $2,126,375
Ohio $269,941 $246,354 $277,624 $374,713 $373,388 $476,062 $2,018,082
Kansas $193,573 $197,647 $186,901 $230,001 $263,476 $292,400 $1,363,997
Wyoming $192,457 $196,507 $185,823 $228,675 $261,957 $290,714 $1,356,132
Pennsylvania $237,608 $219,669 $169,621 $214,315 $268,636 $341,014 $1,450,863
West Virginia $111,490 $113,837 $107,647 $132,471 $151,752 $168,411 $785,608
Illinois $96,255 $111,646 $104,185 $150,717 $145,652 $213,206 $821,662
Utah $86,247 $88,063 $83,274 $102,478 $117,393 $130,280 $607,735
Kentucky $46,355 $42,750 $73,617 $110,825 $85,806 $124,661 $484,014
Virginia $67,217 $68,632 $64,900 $79,867 $91,491 $101,534 $473,642
Nebraska $14,199 $9,679 $44,062 $75,503 $43,213 $78,915 $265,570
Florida $83,779 $61,486 $43,747 $52,625 $74,897 $98,545 $415,080
Missouri $8,955 $3,671 $43,115 $77,223 $39,315 $78,788 $251,067
Wisconsin $8,538 $3,513 $41,030 $73,478 $37,423 $88,284 $252,265
Michigan $44,805 $39,263 $34,384 $42,295 $51,715 $60,677 $273,139
Indiana $48,276 $33,078 $23,734 $31,792 $42,054 $61,543 $240,478
New Jersey $36,090 $20,105 $15,466 $21,029 $28,137 $42,443 $163,270
Montana $12,726 $12,994 $12,287 $15,121 $17,321 $19,223 $89,672
New York $12,807 $13,984 $12,203 $16,736 $17,683 $22,523 $95,936
North Dakota $11,402 $11,642 $11,009 $13,547 $15,519 $17,223 $80,342
Tennessee $8,045 $8,215 $7,768 $9,559 $10,951 $12,153 $56,690
Minnesota $12,735 $7,077 $4,184 $5,133 $8,863 $12,838 $50,829
South Dakota $3,009 $3,072 $2,905 $3,575 $4,096 $4,545 $21,203
Idaho $1,594 $1,628 $1,539 $1,894 $2,170 $2,408 $11,232
Other States $1,442 $1,170 $1,419 $1,900 $1,935 $2,385 $10,250
Total $28,544,483 $26,902,115 $24,194,547 $30,499,106 $35,384,277 $41,448,454 $186,972,981

96
Table 25: Estimated Historical and Projected Total Employment by State Associated with GoM Oil and Natural Gas Operations (2008-2013)
(In Jobs)
2008 2009 2010 2011 2012 2013
Texas 100,809 90,783 79,274 102,577 117,644 140,213
Louisiana 98,248 89,183 70,473 88,747 104,140 129,108
Alabama 36,126 32,293 25,821 34,566 40,666 48,793
Mississippi 2,277 2,298 2,060 2,573 2,921 3,359
California 14,969 15,081 13,888 17,233 19,642 22,216
Oklahoma 13,468 13,621 12,459 15,499 17,601 20,000
Colorado 9,793 9,919 9,109 11,315 12,871 14,582
New Mexico 8,676 8,770 7,978 9,931 11,277 12,842
Ohio 3,342 2,901 3,415 4,789 4,528 6,150
Arkansas 2,918 2,950 2,688 3,357 3,793 4,355
Alaska 2,102 2,126 1,959 2,432 2,759 3,116
Pennsylvania 2,794 2,482 1,856 2,368 2,998 3,911
Kansas 1,715 1,738 1,588 1,975 2,249 2,559
Illinois 1,201 1,404 1,354 2,010 1,856 2,842
Wyoming 1,356 1,372 1,260 1,565 1,776 2,010
Utah 1,054 1,068 984 1,221 1,389 1,570
West Virginia 1,047 1,063 975 1,208 1,378 1,555
Kentucky 495 436 873 1,370 976 1,522
Wisconsin 129 52 626 1,122 570 1,272
Virginia 656 665 614 761 866 978
Florida 1,133 843 609 732 1,029 1,340
Missouri 112 46 542 970 494 990
Nebraska 162 104 540 934 522 971
Michigan 552 462 386 479 595 721
Indiana 691 462 330 445 590 871
New Jersey 408 227 174 237 317 480
Montana 112 116 103 125 146 161
Tennessee 99 100 95 117 133 148
North Dakota 97 98 91 112 128 143
New York 91 99 86 122 123 165
Minnesota 190 105 62 76 132 191
Idaho 19 20 18 22 26 29
South Dakota 17 18 15 18 22 25
Other States 13 13 12 15 17 19
Total 306,870 282,915 242,317 311,023 356,174 429,208

97
Summary Tables: Support Activities for Oil and Natural Gas
Operations

98
Table 26: Estimated Historical and Projected Support Activities for Oil and Natural Gas Operations Contribution to GDP by State (2008-2013)
(US$ Thousands)
2008 2009 2010 2011 2012 2013 Total
Texas $18,229 $17,683 $6,652 $8,623 $9,658 $12,845 $73,689
Louisiana $15,677 $15,207 $5,720 $7,415 $8,305 $11,046 $63,370
Alabama $6,941 $6,733 $2,533 $3,283 $3,677 $4,891 $28,057
Mississippi $167 $162 $61 $79 $88 $117 $673
California $1,546 $1,499 $564 $731 $819 $1,089 $6,249
Oklahoma $863 $837 $315 $408 $457 $608 $3,489
Colorado $800 $776 $292 $378 $424 $563 $3,233
New Mexico $583 $565 $213 $276 $309 $411 $2,356
Arkansas $318 $308 $116 $150 $168 $224 $1,284
Illinois $292 $283 $107 $138 $155 $206 $1,180
New York $196 $190 $72 $93 $104 $138 $794
Alaska $166 $161 $61 $79 $88 $117 $673
Ohio $161 $157 $59 $76 $85 $114 $652
Kansas $121 $117 $44 $57 $64 $85 $487
Wyoming $99 $96 $36 $47 $52 $70 $400
Pennsylvania $91 $88 $33 $43 $48 $64 $366
Utah $69 $67 $25 $33 $36 $48 $278
West Virginia $67 $65 $25 $32 $36 $47 $272
Virginia $48 $47 $18 $23 $25 $34 $195
Kentucky $27 $26 $10 $13 $14 $19 $109
Michigan $24 $23 $9 $11 $13 $17 $96
Florida $17 $17 $6 $8 $9 $12 $69
Montana $7 $7 $3 $3 $4 $5 $30
Other States $22 $22 $8 $11 $12 $16 $91
Total $46,531 $45,135 $16,979 $22,010 $24,651 $32,785 $188,090

99
Table 27: Estimated Historical and Projected Support Activities for Oil and Natural Gas Operations Spending by State (2008-2013)
(US$ Thousands)
2008 2009 2010 2011 2012 2013 Total
Louisiana $16,024 $15,544 $5,847 $7,580 $8,489 $11,291 $64,775
Texas $14,559 $14,123 $5,312 $6,887 $7,713 $10,258 $58,852
Alabama $6,988 $6,779 $2,550 $3,306 $3,702 $4,924 $28,249
Mississippi $184 $179 $67 $87 $98 $130 $745
California $1,283 $1,244 $468 $607 $680 $904 $5,186
Oklahoma $836 $810 $305 $395 $443 $589 $3,377
Colorado $659 $639 $240 $312 $349 $464 $2,663
New Mexico $651 $632 $238 $308 $345 $459 $2,633
Arkansas $341 $331 $125 $162 $181 $241 $1,380
Illinois $228 $221 $83 $108 $121 $160 $920
Alaska $201 $195 $73 $95 $107 $142 $814
New York $192 $186 $70 $91 $102 $135 $775
Ohio $140 $135 $51 $66 $74 $98 $564
Kansas $129 $125 $47 $61 $68 $91 $522
Wyoming $128 $125 $47 $61 $68 $90 $519
West Virginia $74 $72 $27 $35 $39 $52 $301
Pennsylvania $73 $71 $27 $35 $39 $52 $296
Utah $58 $56 $21 $27 $30 $41 $233
Virginia $45 $43 $16 $21 $24 $32 $181
Kentucky $26 $25 $10 $12 $14 $18 $106
Michigan $21 $20 $8 $10 $11 $15 $84
Florida $16 $16 $6 $8 $9 $11 $66
Montana $8 $8 $3 $4 $4 $6 $34
Other States $25 $24 $9 $12 $13 $18 $101
Total $42,890 $41,604 $15,650 $20,288 $22,722 $30,221 $173,375

100
Table 28: Estimated Historical and Projected Support Activities for Oil and Natural Gas Operations Employment by State (2008-2013)
(In Jobs)
2008 2009 2010 2011 2012 2013
Texas 202 196 74 96 107 142
Louisiana 190 184 69 90 101 134
Alabama 79 77 29 37 42 56
Mississippi 2 2 1 1 1 2
California 17 17 6 8 9 12
Oklahoma 11 11 4 5 6 8
Colorado 9 9 3 4 5 6
New Mexico 8 8 3 4 4 6
Arkansas 4 4 2 2 2 3
Illinois 4 4 1 2 2 3
Ohio 2 2 1 1 1 1
New York 2 2 1 1 1 1
Alaska 2 2 1 1 1 1
Kansas 2 2 1 1 1 1
Wyoming 1 1 0 1 1 1
Pennsylvania 1 1 0 0 1 1
Utah 1 1 0 0 1 1
Other States 3 3 2 2 2 2
Total 540 524 197 255 286 381

101
Summary Tables: Oil and Natural Gas Extraction

102
Table 29: Estimated Historical and Projected Oil and Natural Gas Extraction Contribution to GDP by State (2008-2013)
(US$ Thousands)
2008 2009 2010 2011 2012 2013 Total
Texas $6,240,741 $6,455,402 $6,644,698 $8,083,124 $9,360,127 $9,642,931 $46,427,022
Louisiana $4,760,236 $4,922,845 $5,066,414 $6,115,248 $7,046,837 $7,261,617 $35,173,197
Alabama $1,722,676 $1,785,252 $1,839,919 $2,379,405 $2,857,000 $2,937,816 $13,522,068
Mississippi $183,539 $189,772 $195,281 $234,146 $268,683 $276,934 $1,348,354
California $1,361,720 $1,407,964 $1,448,835 $1,737,189 $1,993,425 $2,054,640 $10,003,774
Oklahoma $1,034,819 $1,069,961 $1,101,021 $1,320,151 $1,514,874 $1,561,393 $7,602,220
Colorado $911,473 $942,426 $969,784 $1,162,795 $1,334,307 $1,375,282 $6,696,067
New Mexico $650,507 $672,598 $692,123 $829,873 $952,279 $981,522 $4,778,903
Alaska $215,369 $222,683 $229,147 $274,753 $315,279 $324,961 $1,582,191
Arkansas $215,137 $222,443 $228,900 $274,457 $314,939 $324,610 $1,580,486
Ohio $171,732 $177,564 $182,718 $219,084 $251,398 $259,118 $1,261,614
Kansas $136,299 $140,928 $145,019 $173,881 $199,528 $205,656 $1,001,310
Wyoming $132,037 $136,521 $140,484 $168,444 $193,289 $199,225 $969,999
Pennsylvania $101,067 $104,499 $107,532 $128,934 $147,952 $152,495 $742,478
Utah $77,365 $79,993 $82,315 $98,698 $113,255 $116,733 $568,360
West Virginia $76,205 $78,793 $81,080 $97,217 $111,557 $114,982 $559,834
Virginia $53,784 $55,610 $57,224 $68,614 $78,734 $81,152 $395,118
Kentucky $29,235 $30,228 $31,105 $37,296 $42,797 $44,111 $214,771
Illinois $28,334 $29,297 $30,147 $36,147 $41,479 $42,752 $208,156
Michigan $26,069 $26,955 $27,737 $33,258 $38,163 $39,335 $191,517
Florida $19,485 $20,147 $20,732 $24,858 $28,524 $29,400 $143,146
Montana $9,275 $9,590 $9,868 $11,832 $13,578 $13,994 $68,137
North Dakota $7,561 $7,818 $8,045 $9,646 $11,068 $11,408 $55,546
Tennessee $6,844 $7,077 $7,282 $8,731 $10,019 $10,327 $50,280
New York $5,646 $5,838 $6,007 $7,203 $8,265 $8,519 $41,477
Nebraska $4,484 $4,637 $4,771 $5,721 $6,564 $6,766 $32,943
Indiana $2,548 $2,634 $2,711 $3,250 $3,730 $3,844 $18,716
South Dakota $1,641 $1,696 $1,746 $2,093 $2,402 $2,476 $12,053
Idaho $1,069 $1,105 $1,137 $1,363 $1,565 $1,613 $7,852
New Jersey $722 $747 $768 $921 $1,057 $1,090 $5,305
Wisconsin $381 $394 $405 $486 $557 $575 $2,798
Missouri $379 $392 $404 $484 $555 $572 $2,787
Nevada $243 $252 $259 $310 $356 $367 $1,788
Other States $739 $764 $787 $943 $1,082 $1,116 $5,432
Total $18,189,360 $18,814,821 $19,366,405 $23,550,554 $27,265,226 $28,089,332 $135,275,697

103
Table 30: Estimated Historical and Projected Oil and Natural Gas Extraction Spending by State (2008-2013)
(US$ Thousands)
2008 2009 2010 2011 2012 2013 Total
Texas $5,098,644 $5,274,021 $5,428,675 $6,603,859 $7,647,162 $7,878,212 $37,930,573
Louisiana $4,545,680 $4,700,959 $4,838,058 $5,839,618 $6,729,218 $6,934,317 $33,587,850
Alabama $1,800,832 $1,866,247 $1,923,394 $2,487,357 $2,986,619 $3,071,102 $14,135,551
Mississippi $213,268 $220,511 $226,912 $272,073 $312,204 $321,791 $1,566,761
California $1,154,098 $1,193,291 $1,227,931 $1,472,319 $1,689,487 $1,741,368 $8,478,493
Oklahoma $966,940 $999,777 $1,028,799 $1,233,556 $1,415,506 $1,458,973 $7,103,551
Colorado $762,292 $788,180 $811,060 $972,480 $1,115,921 $1,150,189 $5,600,123
New Mexico $753,949 $779,553 $802,183 $961,837 $1,103,708 $1,137,601 $5,538,830
Arkansas $237,536 $245,603 $252,733 $303,033 $347,730 $358,408 $1,745,044
Alaska $232,932 $240,842 $247,834 $297,159 $340,990 $351,461 $1,711,217
Ohio $161,463 $166,946 $171,792 $205,983 $236,366 $243,624 $1,186,174
Kansas $149,418 $154,492 $158,977 $190,617 $218,733 $225,450 $1,097,687
Wyoming $148,556 $153,601 $158,060 $189,518 $217,472 $224,150 $1,091,358
West Virginia $86,059 $88,981 $91,564 $109,788 $125,982 $129,850 $632,224
Pennsylvania $84,823 $87,704 $90,250 $108,211 $124,173 $127,986 $623,146
Utah $66,574 $68,835 $70,833 $84,930 $97,458 $100,450 $489,080
Virginia $51,885 $53,647 $55,204 $66,191 $75,954 $78,287 $381,167
Kentucky $30,308 $31,337 $32,247 $38,664 $44,367 $45,730 $222,653
Illinois $24,820 $25,663 $26,408 $31,663 $36,334 $37,450 $182,337
Michigan $23,970 $24,784 $25,503 $30,579 $35,089 $36,167 $176,092
Florida $18,824 $19,464 $20,029 $24,015 $27,557 $28,403 $138,292
Montana $9,823 $10,157 $10,451 $12,532 $14,380 $14,821 $72,164
North Dakota $8,801 $9,100 $9,364 $11,228 $12,884 $13,279 $64,656
Tennessee $6,210 $6,421 $6,607 $7,922 $9,091 $9,370 $45,622
New York $5,699 $5,892 $6,064 $7,270 $8,343 $8,599 $41,867
Nebraska $5,203 $5,379 $5,536 $6,637 $7,616 $7,850 $38,221
Indiana $2,619 $2,708 $2,787 $3,341 $3,834 $3,952 $19,242
South Dakota $2,323 $2,402 $2,471 $2,963 $3,400 $3,505 $17,063
Idaho $1,230 $1,272 $1,309 $1,570 $1,801 $1,857 $9,039
New Jersey $650 $672 $692 $830 $952 $981 $4,778
Missouri $374 $387 $398 $477 $548 $565 $2,749
Wisconsin $372 $384 $395 $474 $544 $561 $2,730
Nevada $259 $268 $276 $330 $379 $391 $1,903
Other States $755 $780 $803 $963 $1,105 $1,139 $5,544
Total $16,657,188 $17,230,260 $17,735,596 $21,579,989 $24,992,906 $25,747,839 $123,938,233

104
Table 31: Estimated Historical and Projected Oil and Natural Gas Extraction Employment by State (2008-2013)
(In Jobs)
2008 2009 2010 2011 2012 2013
Texas 49,897 51,614 53,127 64,628 74,838 77,099
Louisiana 38,332 39,642 40,798 49,244 56,745 58,475
Alabama 14,619 15,150 15,614 20,193 24,246 24,932
Mississippi 1,484 1,534 1,579 1,893 2,172 2,239
California 10,531 10,889 11,205 13,435 15,417 15,890
Oklahoma 9,312 9,629 9,908 11,880 13,632 14,051
Colorado 6,869 7,102 7,308 8,763 10,055 10,364
New Mexico 5,920 6,121 6,298 7,552 8,666 8,932
Arkansas 1,957 2,024 2,082 2,497 2,865 2,953
Ohio 1,592 1,646 1,694 2,031 2,331 2,402
Alaska 1,489 1,539 1,584 1,899 2,179 2,246
Kansas 1,182 1,223 1,258 1,508 1,731 1,784
Wyoming 952 984 1,013 1,214 1,393 1,436
Pennsylvania 793 820 844 1,012 1,161 1,197
Utah 747 772 794 952 1,093 1,127
West Virginia 743 768 790 948 1,087 1,121
Virginia 468 483 497 596 684 705
Florida 279 289 297 356 409 422
Kentucky 265 274 282 338 388 400
Michigan 240 249 256 307 352 363
Illinois 204 211 217 260 298 307
Montana 82 85 87 105 120 124
Tennessee 76 78 80 96 111 114
North Dakota 71 73 75 90 103 107
Nebraska 51 53 54 65 74 77
New York 29 30 30 37 42 43
Indiana 27 28 28 34 39 40
Idaho 14 15 15 18 21 21
South Dakota 11 12 12 14 16 17
New Jersey 6 6 6 7 8 9
Wisconsin 5 5 5 6 7 7
Missouri 4 5 5 6 6 7
Oregon 3 3 3 4 4 4
Other States 9 9 9 11 13 13
Total 148,262 153,361 157,858 191,999 222,309 229,027
105
Summary Tables: Drilling Oil and Natural Gas Wells

106
Table 32: Estimated Historical and Projected Drilling Oil and Natural Gas Wells Contribution to GDP by State (2008-2013)
(US$ Thousands)
2008 2009 2010 2011 2012 2013 Total
Louisiana $2,774,224 $2,334,188 $1,389,899 $1,524,088 $2,373,273 $3,686,598 $14,082,269
Texas $2,357,547 $1,981,486 $1,180,292 $1,293,158 $2,014,764 $3,130,588 $11,957,835
Alabama $669,644 $563,252 $335,424 $367,717 $572,691 $889,682 $3,398,410
Mississippi $35,217 $37,882 $20,959 $27,213 $38,133 $54,988 $214,391
California $232,044 $248,644 $137,711 $178,386 $250,322 $361,376 $1,408,483
Oklahoma $175,702 $189,001 $104,567 $135,768 $190,250 $274,342 $1,069,632
Colorado $152,943 $164,519 $91,022 $118,182 $165,606 $238,805 $931,078
New Mexico $116,598 $125,423 $69,392 $90,097 $126,252 $182,056 $709,817
Pennsylvania $96,883 $106,580 $58,608 $77,116 $107,198 $155,557 $601,941
Illinois $76,632 $95,967 $51,044 $72,116 $96,108 $135,901 $527,767
Arkansas $42,015 $45,583 $25,161 $32,835 $45,870 $66,059 $257,524
Ohio $33,238 $35,754 $19,781 $25,684 $35,990 $51,898 $202,346
Alaska $32,801 $35,283 $19,521 $25,346 $35,517 $51,215 $199,683
Kansas $24,829 $26,709 $14,777 $19,186 $26,885 $38,768 $151,154
Wyoming $20,715 $22,283 $12,328 $16,007 $22,430 $32,345 $126,108
West Virginia $14,217 $15,293 $8,461 $10,986 $15,394 $22,199 $86,550
Utah $13,410 $14,425 $7,981 $10,362 $14,520 $20,938 $81,634
Indiana $9,400 $10,379 $5,702 $7,519 $10,438 $15,162 $58,600
Virginia $9,524 $10,245 $5,668 $7,359 $10,313 $14,871 $57,979
Kentucky $5,599 $6,023 $3,332 $4,326 $6,062 $8,742 $34,084
Michigan $4,793 $5,156 $2,853 $3,704 $5,190 $7,484 $29,181
New York $3,170 $3,937 $2,098 $2,952 $3,944 $5,570 $21,672
Florida $3,297 $3,546 $1,962 $2,547 $3,570 $5,148 $20,070
Montana $1,486 $1,598 $884 $1,148 $1,609 $2,320 $9,045
North Dakota $1,289 $1,386 $767 $996 $1,395 $2,012 $7,844
Tennessee $1,133 $1,218 $674 $875 $1,227 $1,769 $6,896
Nebraska $777 $836 $462 $600 $841 $1,213 $4,729
South Dakota $327 $352 $195 $253 $354 $510 $1,990
Idaho $188 $203 $112 $146 $204 $294 $1,147
New Jersey $129 $138 $77 $99 $139 $201 $783
Missouri $71 $76 $42 $55 $77 $111 $433
Wisconsin $66 $72 $40 $51 $72 $20,462 $20,763
Nevada $43 $46 $25 $33 $46 $67 $260
Other States $114 $123 $68 $88 $123 $178 $694
Total $6,910,063 $6,087,605 $3,571,890 $4,056,999 $6,176,806 $9,479,430 $36,282,793
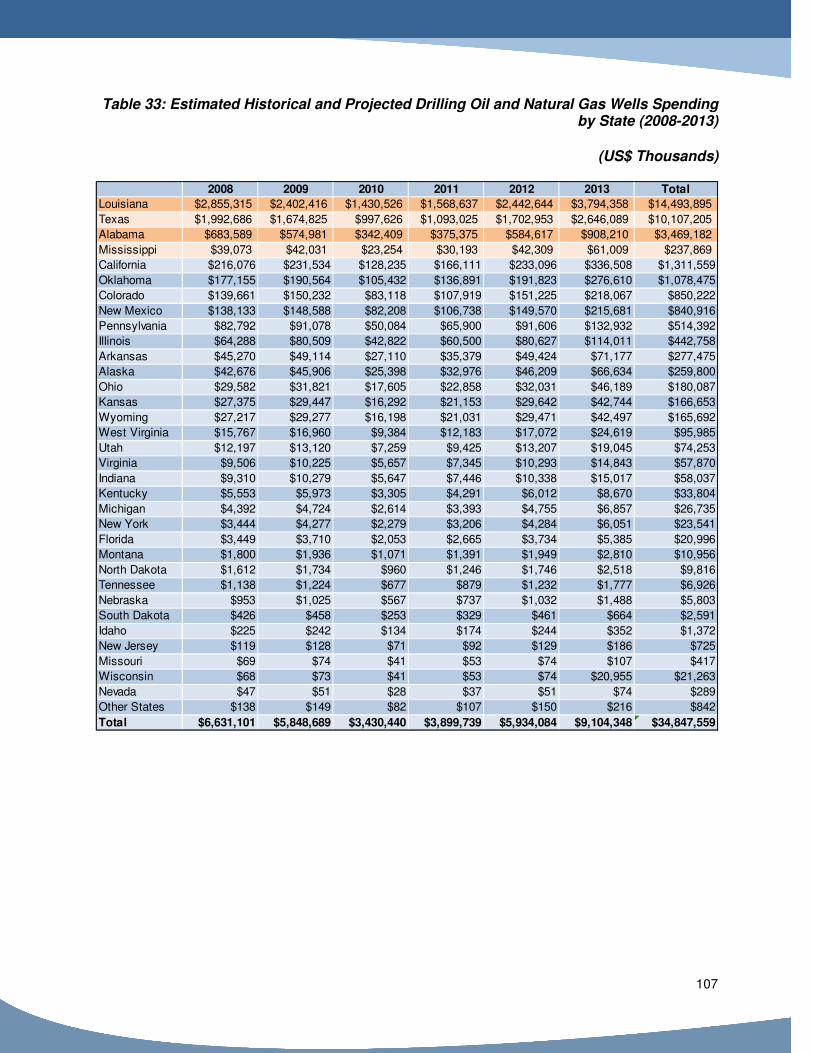
107
Table 33: Estimated Historical and Projected Drilling Oil and Natural Gas Wells Spending by State (2008-2013)
(US$ Thousands)
2008 2009 2010 2011 2012 2013 Total
Louisiana $2,855,315 $2,402,416 $1,430,526 $1,568,637 $2,442,644 $3,794,358 $14,493,895
Texas $1,992,686 $1,674,825 $997,626 $1,093,025 $1,702,953 $2,646,089 $10,107,205
Alabama $683,589 $574,981 $342,409 $375,375 $584,617 $908,210 $3,469,182
Mississippi $39,073 $42,031 $23,254 $30,193 $42,309 $61,009 $237,869
California $216,076 $231,534 $128,235 $166,111 $233,096 $336,508 $1,311,559
Oklahoma $177,155 $190,564 $105,432 $136,891 $191,823 $276,610 $1,078,475
Colorado $139,661 $150,232 $83,118 $107,919 $151,225 $218,067 $850,222
New Mexico $138,133 $148,588 $82,208 $106,738 $149,570 $215,681 $840,916
Pennsylvania $82,792 $91,078 $50,084 $65,900 $91,606 $132,932 $514,392
Illinois $64,288 $80,509 $42,822 $60,500 $80,627 $114,011 $442,758
Arkansas $45,270 $49,114 $27,110 $35,379 $49,424 $71,177 $277,475
Alaska $42,676 $45,906 $25,398 $32,976 $46,209 $66,634 $259,800
Ohio $29,582 $31,821 $17,605 $22,858 $32,031 $46,189 $180,087
Kansas $27,375 $29,447 $16,292 $21,153 $29,642 $42,744 $166,653
Wyoming $27,217 $29,277 $16,198 $21,031 $29,471 $42,497 $165,692
West Virginia $15,767 $16,960 $9,384 $12,183 $17,072 $24,619 $95,985
Utah $12,197 $13,120 $7,259 $9,425 $13,207 $19,045 $74,253
Virginia $9,506 $10,225 $5,657 $7,345 $10,293 $14,843 $57,870
Indiana $9,310 $10,279 $5,647 $7,446 $10,338 $15,017 $58,037
Kentucky $5,553 $5,973 $3,305 $4,291 $6,012 $8,670 $33,804
Michigan $4,392 $4,724 $2,614 $3,393 $4,755 $6,857 $26,735
New York $3,444 $4,277 $2,279 $3,206 $4,284 $6,051 $23,541
Florida $3,449 $3,710 $2,053 $2,665 $3,734 $5,385 $20,996
Montana $1,800 $1,936 $1,071 $1,391 $1,949 $2,810 $10,956
North Dakota $1,612 $1,734 $960 $1,246 $1,746 $2,518 $9,816
Tennessee $1,138 $1,224 $677 $879 $1,232 $1,777 $6,926
Nebraska $953 $1,025 $567 $737 $1,032 $1,488 $5,803
South Dakota $426 $458 $253 $329 $461 $664 $2,591
Idaho $225 $242 $134 $174 $244 $352 $1,372
New Jersey $119 $128 $71 $92 $129 $186 $725
Missouri $69 $74 $41 $53 $74 $107 $417
Wisconsin $68 $73 $41 $53 $74 $20,955 $21,263
Nevada $47 $51 $28 $37 $51 $74 $289
Other States $138 $149 $82 $107 $150 $216 $842
Total $6,631,101 $5,848,689 $3,430,440 $3,899,739 $5,934,084 $9,104,348 $34,847,559

108
Table 34: Estimated Historical and Projected Drilling Oil and Natural Gas Wells Employment by State (2008-2013)
(In Jobs)
2008 2009 2010 2011 2012 2013
Louisiana 28,321 23,829 14,189 15,559 24,228 37,635
Texas 23,084 19,402 11,557 12,662 19,728 30,654
Alabama 6,595 5,547 3,303 3,621 5,640 8,762
Mississippi 371 399 221 287 402 579
California 2,141 2,294 1,271 1,646 2,310 3,334
Oklahoma 1,993 2,144 1,186 1,540 2,158 3,112
Colorado 1,461 1,572 870 1,129 1,582 2,282
New Mexico 1,291 1,389 769 998 1,398 2,016
Illinois 881 1,103 587 829 1,105 1,562
Pennsylvania 937 1,030 567 746 1,036 1,504
Arkansas 449 487 269 351 491 706
Ohio 378 407 225 292 410 591
Alaska 280 301 167 216 303 437
Kansas 278 299 165 215 301 434
Wyoming 187 201 111 145 203 292
West Virginia 154 166 92 119 167 241
Utah 152 164 91 118 165 238
Indiana 121 134 73 97 135 195
Virginia 95 102 57 74 103 149
Kentucky 66 71 39 51 71 102
Michigan 52 56 31 41 57 82
Florida 42 45 25 32 45 65
New York 24 30 16 22 30 42
Montana 16 17 10 12 17 25
North Dakota 13 14 7 10 14 20
Tennessee 10 11 6 8 11 16
Nebraska 8 9 5 6 9 13
South Dakota 3 4 2 3 4 5
Idaho 3 3 2 2 3 4
New Jersey 1 1 1 1 1 2
Other States 3 3 2 2 3 4
Total 69,413 61,236 35,914 40,834 62,129 95,349

109
Summary Tables: Mining and Oil and Natural Gas Field Machinery
Manufacturing

110
Table 35: Estimated Historical and Projected Mining Oil and Natural Gas Field Machinery Manufacturing Contribution to GDP by State (2008-2013)
(US$ Thousands)
2008 2009 2010 2011 2012 2013 Total
Texas $1,107,664 $609,711 $712,508 $1,342,051 $1,104,637 $1,629,406 $6,505,976
Louisiana $745,246 $419,774 $482,904 $908,737 $744,493 $1,098,453 $4,399,607
Alabama $381,751 $204,239 $214,060 $389,142 $344,850 $504,196 $2,038,238
Mississippi $8,294 $4,952 $8,746 $15,050 $10,492 $18,292 $65,825
Ohio $79,986 $43,663 $97,873 $163,725 $114,973 $206,868 $707,088
California $75,230 $45,214 $67,257 $113,608 $85,413 $145,065 $531,788
Oklahoma $44,323 $26,464 $46,740 $80,430 $56,070 $97,755 $351,783
Missouri $8,493 $3,189 $42,692 $76,726 $38,701 $78,142 $247,941
Illinois $6,522 $4,526 $41,770 $70,329 $33,679 $73,524 $230,350
Wisconsin $8,082 $3,035 $40,625 $73,011 $36,827 $66,814 $228,393
Colorado $37,172 $22,194 $39,200 $67,454 $47,024 $81,984 $295,028
Kentucky $8,206 $3,386 $35,778 $64,189 $32,859 $65,866 $210,284
Pennsylvania $76,569 $42,159 $31,993 $44,158 $58,639 $89,355 $342,873
Nebraska $5,670 $2,167 $27,822 $49,987 $25,274 $50,971 $161,891
New Mexico $24,934 $14,887 $26,294 $45,246 $31,543 $54,993 $197,898
Florida $52,411 $32,271 $18,385 $21,977 $37,242 $55,367 $217,654
Indiana $37,263 $20,523 $15,686 $21,539 $28,610 $43,699 $167,320
New Jersey $33,818 $18,466 $14,078 $19,252 $25,910 $39,532 $151,056
Arkansas $11,325 $7,369 $11,839 $19,751 $13,915 $24,481 $88,681
Alaska $7,009 $4,185 $7,391 $12,718 $8,866 $15,458 $55,626
Michigan $16,578 $9,170 $6,242 $8,321 $12,127 $18,135 $70,573
Kansas $5,700 $3,403 $6,011 $10,343 $7,211 $12,571 $45,239
Wyoming $4,306 $2,571 $4,541 $7,814 $5,447 $9,497 $34,175
Minnesota $12,721 $6,991 $4,076 $5,003 $8,744 $12,746 $50,282
Utah $3,448 $2,059 $3,637 $6,258 $4,362 $7,606 $27,370
West Virginia $3,184 $1,901 $3,357 $5,777 $4,028 $7,022 $25,269
New York $2,691 $2,833 $3,146 $5,165 $4,090 $6,420 $24,344
Virginia $2,278 $1,360 $2,403 $4,134 $2,882 $5,025 $18,083
Tennessee $321 $192 $339 $583 $406 $709 $2,550
North Dakota $273 $163 $288 $495 $345 $602 $2,166
Idaho $41 $25 $43 $75 $52 $91 $326
Nevada $10 $6 $10 $18 $12 $21 $77
Oregon $9 $5 $9 $16 $11 $20 $71
Other States $13 $8 $14 $24 $16 $29 $103
Total $2,811,542 $1,563,060 $2,017,754 $3,653,108 $2,929,751 $4,520,715 $17,495,929

111
Table 36: Estimated Historical and Projected Mining Oil and Natural Gas Field Machinery Manufacturing Spending by State (2008-2013)
(US$ Thousands)
2008 2009 2010 2011 2012 2013 Total
Texas $975,915 $537,190 $627,760 $1,182,424 $973,248 $1,435,600 $5,732,137
Louisiana $875,216 $492,982 $567,121 $1,067,219 $874,331 $1,290,021 $5,166,891
Alabama $392,707 $210,101 $220,204 $400,311 $354,747 $518,667 $2,096,737
Mississippi $10,194 $6,086 $10,750 $18,498 $12,896 $22,483 $80,906
Ohio $68,482 $37,382 $83,795 $140,175 $98,436 $177,113 $605,384
California $73,117 $43,944 $65,368 $110,417 $83,014 $140,991 $516,851
Oklahoma $46,218 $27,595 $48,739 $83,868 $58,467 $101,935 $366,822
Missouri $8,488 $3,187 $42,666 $76,680 $38,677 $78,095 $247,793
Wisconsin $8,074 $3,032 $40,584 $72,938 $36,790 $66,748 $228,165
Colorado $36,436 $21,755 $38,423 $66,118 $46,093 $80,361 $289,186
New Mexico $36,038 $21,517 $38,003 $65,394 $45,588 $79,481 $286,021
Nebraska $7,707 $2,945 $37,817 $67,945 $34,353 $69,282 $220,050
Kentucky $8,540 $3,524 $37,234 $66,801 $34,196 $68,546 $218,841
Illinois $5,340 $3,705 $34,198 $57,581 $27,574 $60,197 $188,595
Pennsylvania $64,522 $35,526 $26,960 $37,211 $49,414 $75,297 $288,930
Florida $60,291 $37,123 $21,149 $25,281 $42,841 $63,692 $250,378
Indiana $36,178 $19,925 $15,229 $20,912 $27,776 $42,426 $162,447
New Jersey $35,279 $19,263 $14,686 $20,084 $27,029 $41,239 $157,580
Arkansas $13,424 $8,736 $14,034 $23,413 $16,495 $29,020 $105,122
Alaska $11,134 $6,648 $11,741 $20,204 $14,085 $24,556 $88,366
Kansas $7,142 $4,264 $7,531 $12,960 $9,035 $15,752 $56,684
Wyoming $7,101 $4,240 $7,488 $12,885 $8,983 $15,661 $56,357
Michigan $14,897 $8,241 $5,609 $7,477 $10,897 $16,297 $63,419
West Virginia $4,113 $2,456 $4,338 $7,464 $5,204 $9,072 $32,648
Minnesota $12,573 $6,910 $4,028 $4,944 $8,642 $12,598 $49,695
New York $3,110 $3,273 $3,635 $5,969 $4,726 $7,420 $28,134
Utah $3,182 $1,900 $3,356 $5,774 $4,025 $7,018 $25,256
Virginia $2,480 $1,481 $2,615 $4,500 $3,137 $5,470 $19,683
Montana $470 $280 $495 $852 $594 $1,036 $3,726
North Dakota $421 $251 $444 $763 $532 $928 $3,339
Rhode Island $297 $0 $313 $539 $376 $655 $2,179
Tennessee $297 $177 $313 $539 $376 $655 $2,356
South Dakota $111 $66 $117 $201 $140 $245 $881
Other States $101 $60 $107 $183 $128 $223 $802
Total $2,829,594 $1,575,766 $2,036,850 $3,688,528 $2,952,848 $4,558,775 $17,642,360

112
Table 37: Estimated Historical and Projected Mining Oil and Natural Gas Field Machinery Manufacturing Employment by State (2008-2013)
(In Jobs)
2008 2009 2010 2011 2012 2013
Texas 14,026 7,721 9,023 16,995 13,988 20,633
Louisiana 10,815 6,092 7,008 13,187 10,804 15,940
Alabama 5,460 2,921 3,062 5,566 4,932 7,211
Mississippi 128 77 135 233 162 283
Ohio 1,143 624 1,399 2,340 1,643 2,957
California 930 559 831 1,404 1,055 1,793
Oklahoma 707 422 745 1,282 894 1,559
Wisconsin 123 46 621 1,115 563 1,021
Missouri 107 40 536 964 486 982
Illinois 84 58 536 903 432 944
Kentucky 122 51 534 958 490 983
Colorado 491 293 518 891 621 1,083
New Mexico 458 273 482 830 579 1,009
Nebraska 98 37 479 860 435 877
Pennsylvania 957 527 400 552 733 1,117
Florida 787 485 276 330 559 831
Indiana 539 297 227 312 414 633
Arkansas 192 125 200 334 235 414
New Jersey 401 219 167 228 307 469
Alaska 106 63 111 192 134 233
Kansas 89 53 93 161 112 195
Michigan 227 126 86 114 166 249
Wyoming 69 41 72 125 87 151
Minnesota 188 103 60 74 129 188
Utah 52 31 55 95 66 115
West Virginia 47 28 49 85 59 103
New York 31 33 37 60 48 75
Virginia 32 19 34 58 40 70
Tennessee 5 3 5 8 6 10
North Dakota 4 2 4 7 5 8
Other States 1 1 1 2 1 3
Total 38,417 21,368 27,786 50,264 40,188 62,139

113
Summary Tables: Construction

114
Table 38: Estimated Historical and Projected Construction Contribution to GDP by State (2008-2013)
(US$ Thousands)
2008 2009 2010 2011 2012 2013 Total
Louisiana $1,118,890 $1,056,200 $456,941 $579,675 $666,330 $919,636 $4,797,673
Texas $861,042 $750,346 $347,876 $519,024 $568,776 $739,830 $3,786,893
Alabama $490,241 $449,672 $199,419 $269,283 $303,699 $409,676 $2,121,991
Mississippi $14,585 $14,292 $6,217 $7,991 $9,199 $12,828 $65,112
California $93,793 $91,910 $39,979 $51,386 $59,159 $82,492 $418,718
Oklahoma $71,296 $69,865 $30,390 $39,061 $44,970 $62,706 $318,289
Colorado $61,747 $60,508 $26,320 $33,829 $38,947 $54,308 $275,658
New Mexico $49,028 $48,044 $20,898 $26,861 $30,924 $43,121 $218,875
Arkansas $16,094 $15,771 $6,860 $8,817 $10,151 $14,155 $71,846
Alaska $14,379 $14,091 $6,129 $7,878 $9,070 $12,647 $64,193
Ohio $13,177 $12,913 $5,617 $7,219 $8,312 $11,590 $58,828
Kansas $9,818 $9,621 $4,185 $5,379 $6,193 $8,635 $43,831
Wyoming $8,292 $8,126 $3,535 $4,543 $5,230 $7,293 $37,019
Pennsylvania $7,143 $7,000 $3,045 $3,913 $4,505 $6,282 $31,888
West Virginia $5,598 $5,486 $2,386 $3,067 $3,531 $4,924 $24,993
Utah $5,454 $5,345 $2,325 $2,988 $3,440 $4,797 $24,350
Virginia $3,914 $3,836 $1,669 $2,145 $2,469 $3,443 $17,475
Kentucky $2,241 $2,196 $955 $1,228 $1,414 $1,971 $10,006
Illinois $2,083 $2,041 $888 $1,141 $1,314 $1,832 $9,300
Michigan $1,872 $1,835 $798 $1,026 $1,181 $1,647 $8,358
Florida $1,428 $1,399 $609 $782 $900 $1,256 $6,373
Montana $643 $630 $274 $352 $406 $566 $2,871
North Dakota $517 $507 $220 $283 $326 $455 $2,308
Tennessee $506 $496 $216 $277 $319 $445 $2,259
New York $378 $370 $161 $207 $238 $332 $1,686
Nebraska $309 $303 $132 $169 $195 $272 $1,381
Indiana $199 $195 $85 $109 $125 $175 $887
South Dakota $138 $135 $59 $75 $87 $121 $615
Idaho $78 $77 $33 $43 $49 $69 $349
New Jersey $51 $50 $22 $28 $32 $45 $226
Missouri $29 $29 $13 $16 $19 $26 $131
Wisconsin $27 $27 $12 $15 $17 $24 $123
Nevada $18 $17 $7 $10 $11 $15 $78
Other States $56 $55 $24 $31 $35 $49 $251
Total $2,855,067 $2,633,386 $1,168,295 $1,578,851 $1,781,574 $2,407,662 $12,424,835

115
Table 39: Estimated Historical and Projected Construction Spending by State (2008-2013)
(US$ Thousands)
2008 2009 2010 2011 2012 2013 Total
Louisiana $1,018,469 $961,405 $415,931 $527,649 $606,527 $837,098 $4,367,079
Texas $625,758 $545,309 $252,817 $377,198 $413,354 $537,667 $2,752,103
Alabama $407,786 $374,041 $165,878 $223,992 $252,619 $340,772 $1,765,090
Mississippi $13,573 $13,300 $5,785 $7,436 $8,561 $11,937 $60,592
California $73,448 $71,973 $31,307 $40,239 $46,327 $64,598 $327,892
Oklahoma $61,537 $60,302 $26,230 $33,714 $38,814 $54,123 $274,719
Colorado $48,513 $47,539 $20,678 $26,578 $30,599 $42,668 $216,576
New Mexico $47,982 $47,019 $20,452 $26,288 $30,264 $42,201 $214,205
Arkansas $15,117 $14,814 $6,444 $8,282 $9,535 $13,296 $67,487
Alaska $14,824 $14,526 $6,319 $8,122 $9,350 $13,038 $66,179
Ohio $10,276 $10,069 $4,380 $5,630 $6,481 $9,038 $45,873
Kansas $9,509 $9,318 $4,053 $5,210 $5,998 $8,363 $42,451
Wyoming $9,454 $9,264 $4,030 $5,180 $5,963 $8,315 $42,207
West Virginia $5,477 $5,367 $2,334 $3,001 $3,454 $4,817 $24,450
Pennsylvania $5,398 $5,290 $2,301 $2,957 $3,405 $4,748 $24,099
Utah $4,237 $4,152 $1,806 $2,321 $2,672 $3,726 $18,914
Virginia $3,302 $3,236 $1,407 $1,809 $2,083 $2,904 $14,741
Kentucky $1,929 $1,890 $822 $1,057 $1,217 $1,696 $8,611
Illinois $1,580 $1,548 $673 $865 $996 $1,389 $7,052
Michigan $1,525 $1,495 $650 $836 $962 $1,342 $6,810
Florida $1,198 $1,174 $511 $656 $756 $1,054 $5,348
Montana $625 $613 $266 $342 $394 $550 $2,791
North Dakota $560 $549 $239 $307 $353 $493 $2,500
Tennessee $395 $387 $168 $217 $249 $348 $1,764
New York $363 $355 $155 $199 $229 $319 $1,619
Nebraska $331 $324 $141 $181 $209 $291 $1,478
Indiana $167 $163 $71 $91 $105 $147 $744
South Dakota $148 $145 $63 $81 $93 $130 $660
Idaho $78 $77 $33 $43 $49 $69 $350
New Jersey $41 $41 $18 $23 $26 $36 $185
Missouri $24 $23 $10 $13 $15 $21 $106
Wisconsin $24 $23 $10 $13 $15 $21 $106
Nevada $16 $16 $7 $9 $10 $14 $74
Other States $48 $47 $20 $26 $30 $42 $214
Total $2,383,711 $2,205,796 $976,011 $1,310,563 $1,481,717 $2,007,271 $10,365,068

116
Table 40: Estimated Historical and Projected Construction Employment by State (2008-2013)
(In Jobs)
2008 2009 2010 2011 2012 2013
Louisiana 20,590 19,436 8,409 10,667 12,262 16,923
Texas 13,599 11,850 5,494 8,197 8,983 11,684
Alabama 9,373 8,597 3,813 5,148 5,806 7,833
Mississippi 292 286 124 160 184 257
Oklahoma 1,444 1,415 616 791 911 1,270
California 1,350 1,323 575 739 851 1,187
New Mexico 999 979 426 547 630 879
Colorado 963 943 410 527 607 847
Arkansas 316 310 135 173 199 278
Alaska 226 222 96 124 143 199
Ohio 226 221 96 124 143 199
Kansas 165 162 70 90 104 145
Wyoming 147 144 63 80 93 129
Pennsylvania 106 104 45 58 67 93
West Virginia 102 100 43 56 64 89
Utah 102 99 43 56 64 89
Virginia 60 59 26 33 38 53
Kentucky 41 40 18 23 26 36
Michigan 31 31 13 17 20 27
Illinois 29 28 12 16 18 26
Florida 25 24 11 14 16 22
Montana 14 13 6 8 9 12
North Dakota 9 9 4 5 6 8
Tennessee 9 8 4 5 5 8
Nebraska 6 5 2 3 3 5
New York 5 5 2 3 3 4
Indiana 3 3 1 2 2 3
South Dakota 3 3 1 2 2 2
Idaho 2 2 1 1 1 1
Other States 3 3 1 2 2 3
Total 50,237 46,426 20,561 27,670 31,262 42,312

117
Appendix 6: Employment Summary Table

118
Table 41: Estimated Historical and Projected Employment Associated with GoM Oil and Natural Gas Industry Operations Summary Table (2008-2013)
(In Jobs)
2008 2009 2010 2011 2012 2013
AL Direct 11,851 10,134 7,186 9,959 11,312 14,338
Al Indirect 24,275 22,158 18,635 24,606 29,354 34,456
LA Direct 30,301 26,385 18,110 23,804 27,326 36,469
LA Indirect 67,947 62,798 52,363 64,943 76,814 92,638
MS Direct 648 640 531 685 759 929
MS Indirect 1,629 1,658 1,529 1,889 2,162 2,431
TX Direct 24,619 20,717 16,524 22,760 25,201 32,060
TX Indirect 76,189 70,066 62,751 79,818 92,443 108,152
Total Gulf Direct 67,419 57,876 42,351 57,208 64,598 83,796
Total Gulf Indirect 170,040 156,680 135,278 171,256 200,773 237,677
Total Gulf Jobs 237,459 214,556 177,629 228,464 265,371 321,473
Total Non- Gulf Direct 20,421 19,439 18,048 23,877 25,193 32,008
Total Non- Gulf Indirect 48,990 48,920 46,640 58,682 65,610 75,727
Total Non- Gulf Jobs 69,410 68,359 64,689 82,560 90,803 107,736
Total Direct 87,840 77,315 60,399 81,085 89,791 115,804
Total Indirect 219,030 205,600 181,918 229,938 266,383 313,404
Total Jobs 306,870 282,915 242,317 311,023 356,174 429,208

119
Appendix 7: Selected Gulf of Mexico Oil and Natural Gas Industry Suppliers

120
Index: Number of Companies per State, Not All Inclusive
StateNumber of
CompaniesState
Number of
Companies
Alabama 34 Nebraska 4
Alaska 4 Nevada 5
Arizona 12 New Hampshire 4
Arkansas 7 New Jersey 39
California 120 New Mexico 2
Colorado 12 New York 45
Connecticut 21 North Carolina 22
Delaware 3 North Dakota 1
Florida 38 Ohio 88
Georgia 42 Oklahoma 52
Hawaii 1 Oregon 13
Illinois 77 Pennsylvania 102
Indiana 13 Rhode Island 6
Iowa 3 South Carolina 11
Kansas 4 South Dakota 1
Kentucky 6 Tennessee 7
Louisiana 342 Texas 1,113
Maine 4 Utah 14
Maryland 11 Vermont 1
Massachusetts 34 Virginia 33
Michigan 15 Washington 24
Minnesota 33 Wisconsin 32
Mississippi 19 Wyoming 1
Missouri 21 Total Companies 2,496

121
Table 42: Selected Gulf of Mexico Oil and Natural Gas Industry Suppliers
ALABAMA ARIZONA Cont.
Aaron Oil Company DH Instruments Pressure Products
ABC Applicators, Inc. EMMEGI Heat Exchangers Inc.
ABS Americas HDA/SMC
Advanced Heat Treat Corp. Healthy BACS LLC
Aggreko LLC Ballast Technologies, Inc.
Airgas Tomar Electronics
Alabama Drydock & Shipping Company Valley Forge & Bolt Mfg. Co.
Alabama Laser Westcoast B.O.P. Products US, Inc
Alabama Metal Industries ARKANSAS
Atlantic Marine, Inc. (Mobile) AmerCable Holdings LLC
BAE Systems Applied Technology Group, Inc.
BAE Systems Southeast Shipyards Alabama Baldor Electric Company
Barry Graham Oil Service Llc Bekaert Corporation
Bay Area Screw & Supply Co., Inc Crow-Burlingame Company
Consolidated Pipe & Supply Company Triangle Engineering
Delta Rigging & Tools, Inc United Spectrographics, LLC
DK Tech Corporation CALIFORNIA
Gulf Coast Air & Hydraulics, Inc. 3M
Hill Marine Refrigeration, Inc. Advanced Joining Technologies, Inc.
Ideal Technical Services Aerospace & Marine International
Industrial Training Consultants Inc Ametek HCC
Intergraph Corporation Ametek Programmable Power
Lott Ship Agency, Inc. Amron International Diving Supply Inc.
Martin Energy Services Analysts, Inc.
Master Boat Builders, Inc. Anixter Inc
Metals Usa Plates And Shapes Anritsu Company
Midstream Fuel Service, LLC Applied Physics Systems
Motion Industries Autodesk, Inc.
NOV Baker Tanks Gulf South
Nudraulix, Inc. Bal Seal Engineering Inc.
Offshore Inland Marine & Oilfield Barksdale Control Products
S&K Machineworks and Fabrication, Inc. Behrens and Associates Inc
ShipConstructor Software Inc. BEI Sensors
Technical Specialties, Inc. Berry Plastics
ALASKA BG System Inc
Alaska Instrument Company, Llc Blacoh Fluid Control, Inc.
Alaska Valve And Fitting Company Capstone Turbine Corporation
MRO Sales, Inc. Cavins Oil Well Tools
RJE International Inc Celesco Transducer Products
ARIZONA Ceradyne PetroCeram® Systems
AT&T ChemEOR
Phoenix Digital Corporation Clayton Industries
Certex USA, Inc. Compass Water Solutions
Choice First Aid & Safety Inc. ConGlobal Industries Inc.
Control Panel
Corrpro Companies Inc.

122
CALIFORNIA Oracle America, Inc.
Cryogenic Industries Pacific Crest Corporation
Crystal Engineering Corporation Pacific West Coast Specialties And
Danfoss Sea Recovery PacSeal Hydraulics, Inc.
Deepsea Power & Light Panolin America, Inc.
Digital Age Learning Parco Inc.
Discflo Corporation PNP International Group Inc.
EFA Technologies Inc. Praxair
Environmental Systems Research Inst Primary Steel, Inc.
Epicor Software Corporation Printrex, Inc.
ESL Power Systems, Inc. Proco Products, Inc.
ESP Safety, Inc. Pump
Fabco Automotive R2Sonic LLC
Flir Commercial Systems Inc. Remote Ocean System, Inc.
Fluid Components Intl. (FCI) Reotemp Instruments Corporation
Foster Lubricants (Pro One Lubricants) Resources Global Professionals
Freedom Chemical Corporation Rocket Science Acoustics
Glenair, Inc. Sanmar Supply Company
Grandis Titanium Sanmina - SCI
Hammerhead Industries Inc Schilling Robotics, Inc.
Haskel International, Inc. SeaBotix Inc.
Hawk Industries, Inc. Seacon Advanced Products, LLC
Hewlett Packard Company Seacon Global Production
Hydraulics International, Inc. Separation Specialists, Inc.
Hydro Tek Cleaning Equipment Mfg. Shanghai Nova Group
Hyspan Precision Products, Inc. Sidus Solutions LLC
Insite Pacific, Inc. Solar Turbines
International Rubber Products South Bay Cable Corp.
Interocean Systems, Inc. Spencer Composites Corporation
ITT BIW Connector Systems Statek Corporation
JAE Electronics. Inc. Survival Systems International, Inc.
Kepner Plastics Fabricators, Inc. Swedish Trade Council
Kontron America Tactical Survey Group Inc
Kuster Company Teledyne Impulse
L-3 Communications Tension Member Technology
Linkquest Inc. TMT Laboratories
Lubrication Sciences International Tri Tool Inc.
McCrometer, Inc. Trimble
McMaster-Carr Supply Company Turner Designs Hydrocarbon Instruments
Mechanix Wear United Rentals
Membrane Tech & Research Inc
University of Southern California Viterbi
School
Mil-Ram Technology, Inc. Vacco Industries
National Aeronautics & Space Admin Vigilant Environmental Solutions
NEI Software Weartech International Inc.
Nimsoft Inc Wellbore Navigation, Inc.
Noren Products WETechnologies
NOV

123
COLORADO FLORIDA Cont.
Atlas Copco American Welding Society
BAND-IT IDEX, Inc. Artmark Products Corporation
BVM CorporationBAE Systems Southeast Shipyards
Florida
CoorsTek Technical Ceramics BellowsTech, LLC
Decision Point Associates, Inc Belzona
Freewave Technologies Inc. Citrix Systems, Inc.
Gates Corporation CSX Tranportation
Micro Motion Eastern Shipbuilding Group, Inc.
PTI Group USA LLC Enviro Voraxial Technology
Quadco Inc. Global Satellite USA
Society for Mining, Metallurgy& Exploration Gosan Crane Components
Sundyne Corporation Governor Control Systems, Inc
CONNECTICUT H G Harders & Sons, Inc.
Advanced Testing Systems, Inc. Hercules Sealing Products
APS Technology Hoerbiger Compression Technology
Ashcroft Inc. KE Marine Inc/Worldwide Diesel Power
Baumer Ltd Manown Engineering Co., Inc.
CS Unitec Marine Rescue Technologies
Flygt Maritech Machine Inc.
Global Dynamix Inc Miami Diver, Inc.
Lee Company Neptune Research, Inc.
Oceanweather Inc. Numara Software, Inc.
OFS Fitel LLC Ocean Motions Company
Omega Engineering Inc Oceaneering
Point Lighting Corporation Pensacola Testing Laboratories, Inc.
Process Measurment & Controls Quality Plus Services, Inc.
Pro-Lock USA LLC Southern Spring & Stamping Inc
Remote Automation Solutions Stainless Structurals LLC
RSCC (Rockbestos-Surprenant Cable Corp)Survival Systems International, Inc., SSI
Service Base Florida
Softex Teledyne ODI Inc.
Solidification Products International Inc Tiger Direct, Inc.
TUV Rheinland of North America Virtual Media Integration, Ltd
Walz & Krenzer, Inc. W. W. Grainger, Inc.
Ward Leonard Electric Company, Inc World Fuel Services, Inc.
DELAWARE Worldwide Drilling Resource
C. Foster Usa, Inc. GEORGIA
DuPont Adobe Equipment Houston, LLC
Pole Star Space Applications Llc Amerair Industries, Inc
District of Columbia American Boa, Inc.
Schagrin Associates AT&T
Maritime Administration BASF Corporation
FLORIDA C C Jensen Inc
A&E Systems LLC Crane Control Systems Llc
American Industrial Plastics, Inc. DCL Mooring & Rigging
American Steel Products Dell Marketing L.P.

124
GEORGIA ILLINOIS Cont.
Delta / KLM / Air France / Alitalia Bosch Rexroth Corporation
Det Norske Veritas Burlington Northern And
Deutz Corporation Cat Engine
Donovan Marine, Inc. Caterpillar
Executrain CDW Computer Centers Inc.
Filowire, Inc. CDW Direct
Hope Industrial Systems Inc CEJN Industrial
ICE - Italian Trade Commission Cintas Corporation LOC 543
Imes Inc Clements National
Jas Worldwide Management Clifford-Jacobs Forging
JIT Warehousing & Logistics LLC Clyde Union, Inc.
Kongsberg Coleman Cable Inc
M.C. Electric, LLC Cortland Cable Co.
MacDermid Offshore Solutions LLC Davis Instruments
Metals Usa Dexter Magnetic Technologies, Inc.
MOOG Dynapar
Mustang Computers & Supplies Inc. Eaton Corporation
MyCelx Technologies Corporation Energy Alloys Inc
Nexeo Solutions, LLC Federal Signal Corporation
Nivis Flodraulic Group, Inc.
OBL Groves Industrial Supply
PC Weather Products Honeywell Analytics
Rolls-Royce Commercial Marine Howco Metals Management Llc
Ronson Technical Products Hydratight, Inc
Sigma Thermal Inc. IFS
Sikora International Corp Industrial Air Solutions,
SOTEC, LLC Integrated Project Resou
Specialty Application Services, Inc. ITH Engineering
STW Technic LP Joliet Equipment Corporation
Teledyne D.G. O'Brien, Inc. Joliet Technologies L.L.C.
UPS Capital Legrand
Weg Electric Corp. U.S. Headquarters Lillbacka USA Inc.
WIKA Instrument Corporation Magnetrol International
HAWAII Magnet-Schultz
Structural Solutions Martin Engineering
ILLINOIS Mcmaster-Carr Supply Company
Ace Transportation Inc Metropolitan Life Insurance
AFL Telecommunications, LLC Mijno Precision Gearing
Air Cycle Corporation Mittal Steel
Apex Engineering Products Corporation Morgan Bronze Products, Inc.
Appleton (EGS Electrical Group - Appleton,
Nutsteel, Nelson, SolaHD)MSC Industrial Supply Co.
Applied Industrial Technologies Nitto Kohki USA Inc
AT&T Mobility II, LLC Nord-Lock Inc.
Autodesk Inc. Norman Filter Company, LLC
B & B Electronics Mfg., Co. Partex Marking Systems Inc

125
ILLINOIS KENTUCKY
Pentair Allied Waste Services
Piper Plastics, Inc. General Cable
Poly One Corp. Ideal Solutions
Seabird Electronics Inc. Mubea Inc.
Siemens Water Technologies, Corp. Plymouth Engineered Shapes
Smalley Steel Ring Company TopWorx
SMI Oilfield Services LOUISIANA
SMM North America 2M Oilfield Group, Inc.
SPX Bolting Systems / Power Team A & L Repair Services, Llc
Ssab North American Div. ABL Fabricators, L.L.C.
Staples Advantage ABS Americas
Stucchi, Inc. Acadian Contractors, Inc.
Sumitomo Metal Industries Ltd. Acadiana Cooling & Heating, LLC
SunSource Acadiana Crew Change Service
Tech Cast, LLC Accurate Measurement Controls, Inc.
TMK IPSCO Accurate Weldment Testing, Inc.
UL Ace Transportation Llc
Universal Technical Systems, Inc. Acme Machine & Welding, Llc
UOP LLC, A Honeywell Company Acme Truck Line, Inc.
Webco Industries, Inc. ACP, LLC
Whiting Corporation Action Specialties Llc
Wichita Clutch Advance Products & Systems
Womack Machine Supply Company Advanced Basket Rentals,Inc
INDIANA Advanced Fiberglass
Advanced Designs Corporation Aggreko, Llc
Endress & Hauser AGI Industries
High Performance Alloys, Inc. Agi Industries, Inc.
Kennametal Conforma Clad Air & Process System
Keronite, Inc Air and Process Services, LLC
Nahi, Llc Air Compressor Energy Systems, Inc.
NOV Air Logistics, L.L.C.
NRP-Jones Allis-Chalmers Rental Ser. Inc.
Oerlikon Fairfield American Diesel
Piezo Technologies American Fire & Safety Llc
Sullair Corporation American Polymer Products, Inc
Trellborg AMICO-Seasafe, A Gibralter Company
Zokman Products Inc. Angel Air Repair & Specialty Co Inc
IOWA Api Control System Solutions Inc
Diversified Investment A Auto-Comm Engineering Corp
Fisher Valves & Instruments AWC, Inc.
John Deere Power Systems B.O.P. Controls, Inc.
KANSAS Bayou and Socotherm
Exline Bayou Boeuf Electric
ITW Dymon (DYKEM® and SCRUBS®) Berard Transportation, Inc.
Kmt Aqua-Dyne Bilco Tools, Inc.
Taylor Forge Engineered Systems Billet CNC, Inc.

126
LOUISIANA Dolphin Energy Equipment, Inc
Bis Salamis Inc Don Abney, Inc.
BNA Marine Services, LLC Donnie Williams Tool Co., Inc
Bollinger Shipyards Lockport, LLC Downey Engineering Corp.
Bourque Sales & Service, Inc Dryden Supply, Inc.
Brand Energy Solutions Llc Ductz Of South Louisiana
Bristow U.S. LLC Dynamic Industries Inc.
Broussard Brothers, Inc. E. L. I., Inc.
Burner Fire Control E.P.I. / A.P.P.
C & C Technologies, Inc. Ed Roe's Welding Inc.
Cad Oilfield Specialties Edison Chouest Offshore LLC
Capital Valve & Fitting Co., Inc. Elliott Technical Controls, Inc.
Central Boat Rentals Ene Consultants Llc
Central Dispatch, Inc. Energy Pipe & Supply Inc.
CETCO Oilfield Services Energy Technology/Technical Industries
Charter Supply Company Engineering Dynamics, Inc.
Checkpoint Process Pumps & Systems Envirochem
Chem Spray South Environmental Drilling Solutions
Chet Morrison Contractors Enviro-Tech Systems L.L.C.
C-Innovations LLC Era Helicopters, Llc
Cleanblast, Llc Ess Support Services
Coastal Fire Protection Llc Essi Corporation
Coastal Risk Services, Llc Expeditors & Production
Coastal Safety Management LLC Expert E&P Consultants Llc
Cochrane Technologies, Inc. Expert Riser Solutions, Llc
Commercial Diving Supply, LLC Express Printing & Forms Inc
Connector Specialists, Inc. Falck Alford
CORTEC Fluid Control Federal Flange/A&B
C-Port, LLC Fire & Safety Specialists, Inc.
Creative Manufacturing Services LLC Fire Boss of Louisiana, Inc.
Crosby Tugs, Llc Fitzgerald Inspection Inc
Cross Logistics, Inc. Force Power Systems, LLC
Cross Services, Inc. Fourchon Heavy Lift, LLC
Cutting Underwater Technologies Francis Torque Service
D & D Machine Works, Inc. Frank's Casing Crew & Rental Tools, Inc.
Danos & Curole Marine Fugro
Data Technology Solutions G T Michelli Company Inc
Datacom Gachassin, Inc.
DCL Mooring And Rigging Gaffey, Inc.
Delmar Systems, Inc. Galvotec Corrosion Services
Delta Bolt Llc Gator Tank Rentals, Inc.
Delta's Missy's Supermarket, LLC Gauthiers Oilfield Rental, LLC
Digital And Electronic Resources General Marine Leasing
Diversified Well Logging Inc Global Industries Offshore, L.L.C.
Doerle Food Service Global Manufacturing Inc
Dolphin Global X-Ray

127
LOUISIANA K-Tek
Grand Isle Shipyard L & L Oil And Gas Services
Green Marine & Industrial Equipment Co. Inc. Lafayette Electrical & Marine Supply Inc
Greene's Energy Group Lafayette Power Sports
Gulf Coast International, LLC Lafayette Steel Erector, Inc.
Gulf Coast Marine Associates, Inc. Lapeyre Stair, Inc
Gulf Coast Monitoring LeBlanc & Associates, Inc.
Gulf Coast Training Technologies Lighthouse Lodge, Llc
Gulf Engine & Equipment, Inc. Lirette Ford Lincoln Mercury, Inc.
Gulf Island Fabricators Living Quarter Technology, Inc.
Gulf Offshore Logistics, LLC Loadmaster Derrick & Equipment, Inc
Gulf South Marine Louisiana Crane & Electrical
Gulf States Engr. Co. Louisiana Economic Development
Gulfstream Services Inc Louisiana Environmental Monitoring
H & E Equipment Services, Inc Louisiana International Marine LLC
Hadco Services, Inc Louisiana Machinery Company, L.L.C.
Halo Branded Solutions Inc Louisiana Valve Source Inc
Hanagriff'S Machine Shop, Inc. M & M International, LLC.
Harvey Gulf International Marine M.C. Electric, Inc.
HB Rentals M.C. Forklift & Truck Service, Inc.
Herbert Crappell Construction M.H Reeves Consulting
Hidalgo Ouellet Holdings Llc Magnum Mud Equipment Co Inc
HLR Controls, Inc. Major Equipment & Remediation Services,
Hornbeck Offshore Services, Inc Marine Systems, Inc
Hose Specialty & Supply Co. Marine Technologies, LLC
Houma Armature Works & Supply, Inc. Mark Tool Co.
Huber, Inc. Martin Holdings Llc
Hydradyne Hydraulics, LLC Martin Terminal
Industrial Instrument Works, Inc. Max Welders, Inc.
Industrial Screw & Supply Company Maxim Evaporators Of America Llc
Industrial Solutions Group, Llc MB Industries, LLC
IntegriCert McDaniel Controls, Inc.
J & J Metalworks, Inc. McDermott
J. H. Menge & Company, Inc. Medi-Chest, Inc.
Jack Vilas & Associates, Inc. Metallurgical & Materials Technologies, Inc.
John H. Carter MM Plastics Mfg., Inc.
John W Stone Oil Distributor Llc MMR Group, Inc.
John W. Fisk Company MMR International Ltd
Jotun Paints Inc Modern Engineered Products
K & B Machine Works,Inc. Moody International Inc
Kevin Gros Consulting & Marine Moody Price
Keystone Machine Works, Inc. Morgan City Rentals
Kidder, Inc. NDT Repair Service & Supply, Inc.
Knight New Century Fabricators
Knight Manufacturing New Industries, Inc.
Knight Oil Tools Newpark Environmental

128
LOUISIANA Ray'S Radiator
Norsafe Marine & Offshore Services, Red Fox Environmental Services, Inc
North Pacific Crane Co. L.L.C. Redfish Rental, Inc.
NOV Rel Enterprises
Nrec Power Systems RigPower, LLC
NuTec, Inc. Roclan
Offshore Cleaning Systems Llc RSM - CNC, LLC
Offshore Energy Services, Inc Schat-Harding, Inc.
Offshore Equipment Solutions Scurlock Electric, Inc.
Offshore Service Vessels Llc Seacor Marine LLC
Offshore Towing, Inc. Seal-Tite International
Oil Center Research International, L.L.C. Seatronics Inc.
Oil States Skagit Smatco Secorp Industries
Omega Shannon Hardware Co. Ltd.
Omega Natchiq. Inc. Sherry Laboratories Of Louisiana
Orion Instruments Siemens Water Technologies Corp
OrionCase L.L.C. Solar Turbines
PAC Specialties, Inc. Sonoco
Pacific Gulf Wire Rope, Inc. Sotec
Panalpina, Inc. Southern Crane & Hydraulic, Inc.
Paragon Industries Southern Electronics Supply Inc.
Paragon Metalworks, LLC Southern Pride Fabrication, LLC
Parkway Mechanical Services LLC Southern Technology & Services,Inc
Paul R Daigle Consulting LLC Southport
People Haulers, Inc Specialty Equipment Sales
PermaPipe Specialty Rental Tools & Supply
PESI Spectro-Scan
Petrin Corporation Spirit Marine Service Company, Inc
Petroleum Helicopters Inc SPL INC
Petroleum Helicopters, Inc. Src Materials Testing LLC
Pharma-Safe Industrial Services, Inc. Stabil Drill Specialties LLC
Pneumatics & Hydraulics Co. Stat Waste Stream Services Inc
Point Eight Power Stokes & Spiehler Intl Inc
Power Specialties, Inc. Stratos Offshore Service Co
Precision Tech LLC Sub Surface Tools, L.L.C.
Preheat, Inc. Superior Energy Services
Production Enhancement Systems LLC Superior Supply & Steel
Progress Machine, Inc. Supreme Service & Specialty Co.
Progressive Technical Services Surbo Tubular Services
Pro-Log, Inc Survival Systems International, Inc.
Quail Tools, Lp Swivel Joint Repair
Quality Construction And Synergy Resources, LLC
Quality Oil Tools, Inc. Tanks-A-Lot, Inc
Ralow Services Taylors Industrial Specialties, Inc.
Ralphs Industrial Electronic Supplies Taylors International Services Inc
Ray Oil Tool Co., Inc. Tech Oil Products

129
LOUISIANA MARYLAND Cont.
Techcrane International Llc Safelok - USA, Inc.
Teche Electric Supply, Llc Sauer Compressors
Techniques International T. Rowe Price
Terrebonne Motor Co., Inc. MASSACHUSETTS
The L-H Printing Company, Inc. Aanderaa Data Instruments, Inc
The Nacher Corporation Asahi/America, Inc.
Thomas Energy Services Inc Azonix
Thomas Tools, Inc. Bluefin Robotics Corp.
Tidewater Marine, Inc. Brookfield Engineering Laboratories
Trinity Wire, LLC Brookfield Wire
Triple H Chemicals, Inc. Carousel Industries of N.A., Inc.
Turner Industries Group Cashman Equipment Corporation
ULO Systems, LLC Chase Corporation (Chase & Sons)
UV Logistics LLC Comark Corporation
Vapor Power International Cuming Corporation
Variable Bore Rams Inc Dassault Systèmes
Variable Bore Rams, Inc. Dresser Rand
Vartech Systems, Inc. Engineered Pressure Systems Inc EPSI
Venture Transport Logistics Llc Engineered Syntactic Systems
Versabar Inc. Esco Tool Co. Inc.
Village Marine Tec FIBA Technologies, Inc.
Wadleigh Energy Group Hayden Corporation
Wartsila Automation North America, Inc. Horizon Marine
Wartsila North America, Inc. Hydroid Inc
Water Weights Jeppesen
Webb-RIte Safety, Inc. JinDun Holdings Group
Wechem, Inc. Kronos
Wet Tech Energy, Inc LEWA, Inc
Whitco Supplies Linden Photonics Inc
Worksite Lighting LLC Maxon Precision Motors, Inc.
Workstrings, Llc Miller Lifting Products
MAINE Nanmac Corporation
Diversified Business Communications Noise Control Engineering Inc
Flotation Technologies Inc. Olympus
Kardex Remstar Tekscan Inc
WorkBoat United Electric Controls
MARYLAND Vacuum Barrier Corporation
Aerotek Energy Services Verrillon
Deltek Systems Inc. MICHIGAN
Dixon Valve & Coupling Company Dow Chemical
DRS Defense Solutions, LLC, Advanced
Marine Technology CenterE C Korneffel Co
Fuji Trading America, Inc Emag LLC
Instruments And Controls, Inc ESI Group
Marine Technology Society Focal Technologies Corporation
Rohde & Schwarz Hexarmor

130
MICHIGAN MISSISSIPPI
King Engineering Corporation Bosarge Diving Inc
Martin Fluid Power Colle Towing Co., Inc.
MTU Daily Equipment Company
NLB Corp Dixie Glass & Trim Inc.
Northwest Michigan Tooling Coalition Gibson Electric Motor
QVS Inc. Gulf Sales & Supply, Inc.
RF System Lab Heatcraft/Luvata
Rolled Alloys Industrial Maint & Machine Inc
Spiralock Ingalls Shipbuilding
MINNESOTA Jerry Pittman And Associates, Inc
3M Corporation Millennium Industrial And Marine
Boerger LLC NNW Inc.
Camden Wire Co, Inc Pascagoula Bar Pilots
Capital Safety Signal International Inc
Cat Pumps Southern Inspection Services
Control Panel The Anchor Works
Cortec Corporation Tube-Mac Industries (Services), Inc
Detector Electronics (Det-Tronics) Utility Optimization Group Llc
Drill Pipe International LL Vmi - Vicksburg Marine
Eaton Corporation MISSOURI
Emerson Process Management, Asset
OptimizationContinental Disc Corporation
Gemstar Manufacturing EaglePicher Technologies LLC
General Pump Emerson Electric
Holt Power Systems Fike Corporation
Honeywell (Sensing & Control) Grainger
Infor Global Solutions, Inc. Heat Transfer Systems
Iracore International Inc Holland
Kato Engineering Keegan Adams Executive Search Llc
Kato Generator Killark
L&M Radiator Inc LaBarge, Inc.
Mattracks, Inc. PAS Technologies Inc
Northern Technologies International
CorporationShaughnessy
Precision Powered Products St Louis Metallizing
Red Wing Shoe Company St. Louis Pipe & Supply Inc.
Rosemount Stoody Company
Rotary Systems, Inc. The Bayou Companies, Inc.
Solar Turbines Titanova Inc
Stratasys Tnemec Company, Inc.
Super Radiator Coils Tubular Steel, Inc.
Thern, Incorporated Wal-Mart Stores, Inc
TURCK Inc. Wireco WorldGroup
Wanner Engineering Hydra-Cell Pumps NEBRASKA
Xiotech Corporation Heritage Manufacturing Co Inc
Lincoln Composites
PayFlex Systems USA, Inc.
Pieter Kiewit and Sons

131
NEVADA NEW JERSEY Cont.
American Grating Llc Titanium Industries
Click Bond, Inc. United Arab Emirates Meeting Point
GE Energy Vass Pipe
Microsoft Licensing, Gp Versa Products Company, Inc.
RICE Hydro, Inc. Vita Motivator Company Inc.
NEW HAMPSHIRE Westfalia Separator Inc
Bortech Corp NEW MEXICO
Citadel Computer Corporation Flow Science Inc
Skeie Industrial Equipment & services, LLC Murchison Drilling Schools
Sponge-Jet, Inc. NEW YORK
NEW JERSEY AIChE S
Custom Alloys Amphenol Industrial
Dialight Corporation Asiamet Inc 6
EMD Chemicals, Inc. ATA New York Inc.
Evonik Degussa Corporation Automated Dynamics
Felman Trading Bamberger Polymers, Inc.
Gaffney-Kroese Supply Corporation BFG Marine Inc
General Magnaplate Corporation Blume Worldwide Services
GGB Bearing Technology Busby Metals, Inc.
Godwin Pumps Canty Inc.
Grignard Company, LLC CD-adapco
Helidex Offshore LLC China Huayu Pipe Fitting Co
Hilman Inc Columbus McKinnon Corporation
Hilman Rollers Incorporated CWorks Systems Inc
Honeywell Daikin America Inc
Hytorc, A Division of Unex DSR Corp / DSR Wire Corp
Identropy, Inc. East Hills Instruments, Inc.
IEEE/Oceanic Engineering Society Elsevier-Gulf Professional Publishing
ISP Enecon Corp
ISS Machinery Services Esm Group Inc
John Wiley & Sons Fiber Instrument Sales, Inc.
Kallman Worldwide, Inc. Flexim Americas Corp
Kiswire Trading Inc. G Bopp USA
Kulite Semiconductor Products, Inc. G.W. Lisk Company
Leistritz Corporation USA Global Strategic Communications,
Mimeo.Com, Inc. GP:50
Mistras Group Inc Knovel
Panasonic Solutions Company KRACHT CORP.
RathGibson LLC LIGHTNIN, An SPX Brand
RIA Connect Linuo Valve
Ringfeder Corporation Medima
Seals Eastern Inc. Metro Marine Design Associates Inc.
Society of Naval Architects and Marine Engrs. National Response Corp
T & T Marketing, Inc. Plenty Mixers, An SPX Brand
TDK-Lambda Americas Rotork Controls, Inc.

132
NEW YORK OHIO Cont.
SPX Process Equipment - Lightnin Avtron Industrial Automation
Stellar Technology Inc. Battelle
Stemcor Usa Inc. Bearing Distributors
Sumitomo Bearing Engineered Solut
Tech Products Bronx International Inc.
Tel-Tru Manufacturing Co. Brush Wellman Inc.
Temper Companies C & K Industrial Svcs Inc
Timco, Inc. Carboline Company
Viatran Corporation CAS Dataloggers
VJ Technologies, Inc. Cincinnati Gearing Systems Inc.
NORTH CAROLINA Clark-Reliance
Best Pump Works Cognis Corporation
Bucci Industries USA, Inc. Compass Systems & Sales,
Cavotec USA Inc. Connell Inc.
Dimension Data North America, Inc. Control Transformer, Inc.
Doosan Infracore Portable Power CSA International
Electroswitch Cubbison Company
Global Knowledge IntermediateCurtiss-Wright Flow Control, Sprague
Division
HAWE Hydraulics De Mitta Iron & Metal
Hoffer Flow Controls Inc. Dilworth Machine
ITT Corporation Expo Technologies, Inc.
James Tool, Machine & Engineering, Inc.Farris Engineering, a business unit of
Curtiss-Wright Flow Control
KRAL-USA, Inc. Ferrotrade Corporation
Leser GmbH & Co KG Ferry Cap & Set Screw
Lord Corp. Giant Industries Inc.
Mackay Marine, Division of Mackay
Communications Glunt Industries Inc
MTS Sensors H&S Tool, Inc.
Saft America Inc. Hammelmann Corp.
Scott Safety Honeywell Sensotec
SOS Global Express HydraTech Engineered Products
Tandemloc, Inc. Industrial Mill Maintena
The International Society of Automation Interstate Shredding, Llc
Toromont Energy Ken Greco, Inc
NORTH DAKOTA Kenexis Consulting
Revel Digital Konecranes, Inc.
OHIO Lincoln Electric Company
Adalet Lyden Oil Co.
Advantech MAR-TEST/Frishmuth Consulting
Akron Electric, Inc. Metalico Youngstown Inc.
American Augers, Inc. Middough Consulting Inc
American Waste Mgt Svcs Middough Inc
Ametek Solid State Controls Midwest Industrial Contr
Amg Resources Corportion Milliron Iron & Metal In
Ashtabula Iron & Metal Nelson Fastener Systems
Aubert & Duval Nelson Stud Welding, Inc.

133
OHIO OKLAHOMA Cont.
Network Technologies Inc. Conley Corporation
Niles Iron & Metal Compa Continental Wire Cloth
Norbar Torque Tools, Inc. Den-Con Companies
Noshok, Inc. Double Life Corporation
Ohio Edison Engatech Inc
P M C Industries Corp GEFCO
Parker Hannifin Corporation Geophysical Research Co., LLC
Pepperl+Fuchs Gunnebo Johnson Corp
Pipe Line Development Company - PLIDCO Hetronic USA
Presrite Corporation Hilti, Inc.
Protrade Steel Co Ltd John M. Campbell & Co./PetroSkills
PSC Metals Inc. Kimray, Inc.
Puffer Sweiven King Oil Tools
Republic Engineered Products Lee C. Moore, A Woolslayer Company
RFD Beaufort Inc. Mad, Ltd.
Richards Industries Mathey Dearman, Inc.
Rittal Corporation Oilfield Improvements, Inc.
Rockwell Automation Oiltizer Inc.
Safeguard Technology Inc. Oklahoma Forge, Inc.
Scrap Dynamics Corporati Petroleum Abstracts/The University of Tulsa
Sherwin-Williams Piper Valve Systems
Snap-tite Inc. Primenergy Production Equipment, LLC
Solon Manufacturing Co Reel-O-Matic
Sprague Products Roxtec Inc.
SSP Service Pump & Compressor
Swagelok Shumate Energy Technologies, Inc.
Technical Translation Services Society of Exploration Geophysicists
The David J Joseph Co Specific Systems, Inc.
Timcal America Spentex® FR
TPC Wire & Cable Corp Technical Control System
Tylok International, Inc. Teledrift, Inc.
Vogelsang USA The Crosby Group
Wooster Products Inc Thompson Pump Company
Youngstown Water Dept Toromont Energy
OKLAHOMA Tulsa heaters
AAPG Tulsa Power, Inc.
Aceco Valve Inc. TWG
American Foundry Group U S Safety Sign & Decal
Bertrem Products, Inc Webco Industries, Inc.
Best Pump Works Whitco Supply
Bronco Manufacturing Llc Woolslayer Companies, Inc
BS&B Safety Systems, L.L.C. ZEECO
C&C Equipment Specialists Inc. OREGON
Callidus Technologies by Honeywell Allied Systems Company
CESI Chemical - Flotek Company Columbia Industrial Products

134
OREGON PENNSYLVANIA Cont.
Columbia Industries LLC Ellwood Group, Inc.
Equipmentland Ensinger Inc
FLIR SystemsEST Group, Curtiss-Wright Flow Control
Company
GasGun, Inc. Femco Machine Company
Greenberry Industrial Fiber-Line, Inc
Skookum FORTA Corporation - Drilling Prod. Div.
Sulzer Pumps GAI-Tronics
Technical Marine Service, Inc. Gamajet Cleaning Systems Inc
The Ulven Companies GDF Suez Energy Resources NA
Tinitron, Inc. GE Energy Inspection Technologies
Ulven Forging, Inc. GEA PHE Systems North America
Wolf Steel Foundry General Dynamics
PENNSYLVANIA Gottlieb Inc
Affival Inc Haskel International, Inc.
AGC Chemicals Americas, Inc. High Pressure Equipment Company
Aker Construction, Inc. HYDAC Technology Corporation
Alfa Laval Ice Qube Inc.
AMETEK Ims Systems Inc
Ametek Drexelbrook Innovative Pressure Technologies
Amg Resources Corp. International Sos Assistance, Inc
Anker Industries IPT
ANSYS, Inc. ITT Neodyne/Conoflow/Enedine
Arkema, Inc. Key Bellevilles, Inc.
ASTM International Kroff Chemical Company,
Autoclave Engineers Fluid Components Div of
Snap-titeLatrobe Specialty Steel - SPD Products
Azcon Corporation Liberty Iron & Metal
Bedford Reinforced Plastics Linc Milton Roy
Billet Industries, Inc. Linde, Inc.
Bodine Business Products LMI / Milton Roy
Bolttech Mannings LTC, Inc.
Bridon American Corporation Maxpro Technologies, Inc.
C/G Electrodes, Llc Mecco Marking & Traceability
Carpenter Technology Corporation Mercer Company
Chromalox Mercer Lime & Stone Co
Converteam, Inc. Metalico Assad Iron & Me
Copes-Vulcan, An SPX Brand Metalico Neville Recycli
Core Furnace Systems Corp Milton Roy Company
CP Industries Oceaneering International Inc
Daisy Data Displays Inc. Oil & Gas Online
Dell Marketing L.P. PBM Inc Valve Solutions
Dominion PEI-Genesis
Durameter Milton Roy Penn United Technologies, Inc.
EBC Industries Phoenix Contact
Elizabeth Carbide Components PNC Bank, National Association
Elliott Group Pressure Products Industries, Milton Roy

135
PENNSYLVANIA TENNESSEE
Rajant Corporation Acme Truck Line Inc
Sap America, Inc. Bailey Parks Urethane, Inc.
Schramm, Inc. Control Panel
Schroeder Industries, LLC Heatec, Inc.
Science Application Int'l Corp Thomas & Betts Corporation
Silcotek Corporation Tradequip International
SKF USA, Inc. TS3 Technology, Inc.
Snap-tite Inc. TEXAS
Snap-tite Quick Disconnect & Valve Div. 2H Offshore, Inc.
Software House International 3M Oil and Gas Business
Specialty Bar Products 3Ps, Inc.
Strongarm Designs A&B Valve
Superbolt, Inc. A.Hak
TE Connectivity A/M Air Starters
TMS (The Minerals, Metals & Materials
Society)AADE
Torcup Inc AAR Incorporated
Tube City, Llc ABB
Universal Refractories ABCO Products, Inc.
Usx Corportation Able Infosat Communications, Inc
Van Gas Technologies ABS Consulting
Victrex USA ABS Nautical Systems
VideoRay LLC ABSG Consulting Inc.
Voith Turbo, Inc. Accudata Systems, Inc
Whitehill Manufacturing Accuturn Manufacturing, Inc.
Williams Milton Roy Acme Cleaning Equipment Inc
RHODE ISLAND Acumen International, Inc
Alloy Wire International Acute Technological Services, Inc.
Bad Dog Tools Admiralty Marine And Structural
Dellner Brakes AB Adobe Equipment
igus, Inc. Advanced Welding Services, Inc.
igus, Inc. AER Supply Ltd.
KVH Industries, Inc. Agar Corporation
SOUTH CAROLINA Aggreko, Llc.
AFL AgilityDocs
Chicago Pneumatic Tool Co Agr Subsea Inc
CIRCOR Instrumentation Technologies, Inc. AIMS International
Grace Distributing Air Comfort Incorporated
InsulFab Air Starter Components, Inc.
Life Cycle Engineering Airdyne Inc
Staubli Corporation Airgas Southwest
Tobul Accumulator, Inc. Aker Kvaerner Subsea Inc
WEC Equipment & Machining Solutions Aker Solutions
Zapp Precision Wire, Inc. Alamo Iron Works
Zeus Inc. Alamo Transformer Supply Company
SOUTH DAKOTA Alan C. McClure Associates, Inc.
Sioux Corporation Alatas Americas Inc.

136
TEXAS APS Hydraulic Services
Alco Valves (US), Inc. Aqua-Chem, Inc.
Alexander/Ryan Marine & Safety Co. Arc Specialties, Inc.
Alimak Hek Inc Arefco Seals, Inc.
All Points Equipment Co., Llc Argo International Corporation
Allamon Tool Argus Subsea
Allendorph Specialties IncASME International Petroleum Technology
Institute
Allesco AssetNation Inc
Allied Alloys Astro Controls, Inc
Allied Electronics, Inc ATCOM
Alloy Machine Works Athens Group Austin Lp
Alloy Metals & Tubes International, Inc. Athens Group Holdings Llc
Alloy Products Corp. Atlas Incinerator A/S
All-Pro Fasteners Atsco
Alltrans Port Trucking Audubon
Alpha Slip Rings, Inc. Automatic Power, Inc.
Altex Electronics, Ltd. Autronica
Ambox Limited Aveva, Inc
AMEC Paragon Axiom Process Llc
AmerCable Incorporated Axon Energy Products
American Alloy Steel Aztec Manufacturing/Houst
American Block B & W Pipe Inc.
American Clutch & Equipment Co Baker Hughes
American Completion Tools Inc. Baker Oil Tools
American Connectors Ball & Seat Specialties Co.
American Red Cross Balmoral Offshore Engineering
American Shipping & Chartering Bardex Corporation
American Solutions For Business Bardot Group Sa
AmeriMex Motor & Controls, Inc. Bastion Technologies, Inc
Amerjin Co., LLC. Bates Reliable Solutions Llc
Ameron International Bauer-Pileco Inc
AmerRig Services Beacon Maritime Inc
Amosco Bechtel Oil Gas Chemicals
Amtex Machine Products Beeco Motors & Controls, Inc
Analytical Systems Intl./Keco R&D Bel Valves
AnchorPipe International, Inc.Belgian Pavilion - Belgian Trade
Commission
Andon Specialties Bell Engineering, Inc.
Ani Direct Lp Belven, Inc.
Anixter, Inc. Bemex International
Anson Flowline Equipment Inc Bench Tree
Antares Datensysteme GmbH Bennex Subsea Houston, Inc.
Anthelion Systems, Inc. Bernard Controls Inc
Anti-Stall Technology (A Tomax Company) Best Pump Works
Applied Energy Company, Inc. Bestolife Corporation
Applied Industrial Technologies Inc Beta International
Applus RTD Billy Pugh Co., Inc.

137
TEXAS Centerpoint Energy Gas R
Bishop Lifting Products, Inc. Cen-Tex Marine Fabricators, Inc.
Black Angus Steel & Suppl Central Bolt & Industrial Supplies,
Blackwell Plastics Certex Usa, Inc
Blohm + Voss Oiltools LLC Ceva
Bluewater Solutions, Inc. CGG Veritas Services (Us) Inc
BMT Reliability Consultants Ltd Champion Technologies Inc
BMT Scientific Marine Services Inc. Champions Pipe & Supply, Inc
Bob Herbert Drilling Equipment Chapel Steel Company
Bodycote Chase Controls, Inc.
Bolton Alloys LC Check 6 Training Systems
Bop Controls Chem Oil Products UVI
BOXX Modular/Nortex Modular Space Chickasaw Distributors, Inc.
BrandtChina Petroleum Technology &
Development Corp.
Brasilamarras Citic Group - Xin Yegang Steel
Bredero Shaw ClampOn
Bring Cargo, Offshore and Energy Logistics Clearstream Wastewater Systems Inc.
Brown Book Shop Clover Tool Co.
Brown Corrosion Services, Inc. Clutchco International Inc
BTI Services Clydeunion
Burintekh USA LLC C-Mar America, Inc.
Burrow Global LLC CMP Products
Bush Hydraulics Coade, Inc
Business Security Solutions Llc Coastal Power Systems
Butcher Fabricators Coastal Switchgear & Controls, Inc
Butler Business Products, Llc Cobore
Buxton Interests, Inc Cobra Rig Products
C.A. Richards & Associates, Inc. Coflexip Drilling & Refining Div
C.C. Gasket & Fastener,Lt Commvault Systems, Inc
C.W. Rod Tool Co., Inc. Comptroller Of Public Ac
Cameron Constellation Newenergy
Cameron Measurement Construction Technical Svc Inc
Cam-Tech Products, Inc. Containerhouse International
Canrig Drilling Technology Ltd. Continental Airlines, Inc.
Canyon Manufacturing Services Inc Continental ContiTech
Capital Process Management, Inc. Continental Valve & Fittings, Llc
CapRock Communications Contitech Beattie Corporation
Castrol Offshore Control Automation Services, Llc
Catapult Systems Inc Control Flow, Inc.
Cavo Drilling Motors Control Panel
C-B Gear & Machine Inc. Controlled Fluids
CCC Group, Inc. Cool-A-Zone
CDL Cooper Industries
CDQ International, Llc. Copper State Rubber
CDR Strainers & Filters, Inc. Core Labs
Cenergy International Services Llc Cornerstone and WOM
Centerline Manufacturing Cornerstone Valve

138
TEXAS DiaPac LLC
Cor-Pro Systems Operating, LTD Distribution Internatl
Corrosion Resistant Alloys Dixie Pipe Sales L.P.
Cortland Companies DNP-Americas
Corvalent Dockwise
COSCO Shipping Company Ltd. Donovan Law Office
Cotech Irm Services Inc Dooley Tackaberry, Inc.
CPSI Production Co., Lp Doris Inc.
Crane Pro Parts Dox Steel
Crawford Electric Supply Doyles
Craymond Nigeria Limited DPS Offshore, Inc.
Crispin Energy Inc Draco Spring Mfg. Co.
CS&P Technologies Draeger Safety, Inc.
CT Gasket & Polymer Dragados Offshore, S.A.
C'Treat Offshore Inc. Drago Supply Co.
Cubility Dragon Products/Tiger Offshore
Cudd Energy Services Draka Offshore
Custom Power DrawWorks L.P.
Custom Safety Products, Inc. Dreco (National Oilwell)
Cutting Tools, Inc. Drew Marine Usa, Inc
Cyclone Steel Services, Inc. Drilling & Production Resources
D Reynolds Company Llc Drilling Controls, Inc.
D&S Machine Works, Inc. Drillmec Inc.
Da Mid South Drilltec Technologies Corporation
Daniel Measurement and Control, Inc. Dril-Quip, Inc.
Dan-Loc Bolt & Gasket DTC International
Danmar Industries, Inc DTI
Daryl Flood Warehouse & Movers Duramast Industries, Inc.
Daytech Instruments Durmat Inc.
Deansteel Manufacturing Co. Dutton'S Navigation Inc
Deco Plastics, Inc. DWD International, LTD
Deep Sea Development Services Inc DXP Enterprises, Inc.
Deep Sea Quality Consulting, Inc DXP Sepco
Deep Trend Inc Dyna Torque Technologies, Inc.
Deepwater Corrosion Services Inc. Dynacon
Dell Marketing L.P. E. J. Reynolds Company
Delta Centrifugal Corporation Eagle Electronics Resources Inc
Delta Steel, L.P. Eastham Forge, Inc.
Denso Ecad, Inc.
Derrick Equipment Company Ecaregroup, Pllc
Design Staff, Inc. Echometer Company
Det Norske Veritas (DNV) Eckel International Inc
Devon Industries, Inc Ecodyne MRM, Inc.
DHL Global Forwarding Ecom Instruments Inc.
DIAB Sales, Inc. Edgen Murray Corp.
Diamond Offshore Company Eew Steel Trading Llc
Diamond Wire Spring Company Efird Corrosion International

139
TEXAS Fire Protection Service, Inc
EGS Systems Inc. Fishbone Safety Solutions Ltd
Electro Mechanical Industries, Inc. Fisher Controls c/o Puffer Sweiven
Electronic Power Design, Inc. Five Star Metals, Inc.
Electronic Technical Services Corporation Flare Industries, Inc.
Eletec Global Offshore Ltd. Flexible Lifeline Systems, Inc
Elite Precision Fabricators, Inc. Flo Trend Systems
Ellington & Associates FloaTEC, LLC
Emd Services International (Emdsi) Flodraulic Group Inc
Emerson Process Management Co. Fluid Systems, Inc.
Enduro Fluor Offshore Solutions
Enerflex Energy Systems, Inc FMC Technologies
Energy Aviation LLC Forge USA
Energy Valve And Supply Company Llc Forged Components, Inc.
Enertech Services International Inc Forged Vessel Connections, Inc.
Engineered Packaged Systems Inc Forrester Research, Inc
Engineered Spring Products Fort Bend County/Chamber Of Commerc
Enventure Global Technology Forum Energy Technologies
Ep-Hvac Us Inc. Forum Oilfield Technologies
EPI Materials Testing Group Forum Services
Epilogue Systems, Llc Foster Wheeler
Equipment Management Services LLC Franklin Offshore Americas, Inc.
Equipment Resources Freeman & Curiel Engineers, LLP
Equipment Valve & Supply Friede & Goldman, Ltd.
ES&H Consulting Services, Inc. Frisa Forjadss S.A. De C.V.
Esco Products, Inc Fugro Chance Inc
Eutex International, Inc Fugro Global Environ.& Ocean Sciences
Ex One / ProMetal RCT Fugro Global Environmental & Ocean
Excel Engineering, Inc. Furmanite America, Inc.
Excell Battery Corporation Fusion Inc
Exmar Marine NV G A S Unlimited Inc
Exmar Offshore Company G.A.M. RecuHeat, Inc.
Expedited Logistics and Freight Services GAC Group
Expeditors International Gagemaker LP
Expro Americas, Llc Gai-Tronics
Exterran Galvotec Alloys, Inc.
E-Z Line, Inc. Galvotec Companies
F.W. Gartner Gardner Denver Inc.
Fann Instrument Company Gartner Coatings, Inc.
Farmers Copper Ltd. Gateway International Transport, Inc
Fastenal Gaus Anodes International
Fastorq GB TUBULARS
FBV Inc GBA-Corona
FCI GD Engineering, An SPX Brand
Federal Flange/A&B GE Oil & Gas
Fibergrate Composite Structures Gearench
Fielder Electric Supply Co, Inc General Monitors Systems

140
TEXAS Harris CapRock Communications
General Plastics Mfg., Co. Hart Energy
Generon IGS Hart Heat Transfer Products
Geoforce, Inc. Hastik-Baymont, Inc.
Geophysical Pursuit Inc Hatfield and Company, Inc.
Geoscience Earth & Marine Hawke International
GE-Sensing Hayata
GHX, Ind. Hayes Industries
Gill Services, Inc. Haynes Wire Rope
Gilmore Valve Company HCL Clamping Solutions
GL Noble Denton, Inc. HDI Instruments, Inc.
Global Fabrication Services, Inc. Hempel (USA) Inc.
Global Industries, Ltd. Hi-Cad America
Global Maritime Inc. High Performance Cables, Inc.
Global Oil Corporation Hiller Offshore Services, Inc
Global Shop Solutions Hilti, Inc.
Global Thermoelectric Corp. Holloway-Houston, Inc.
Globaltech Motor & Controls, Inc Holt Power Systems
Goodwin International Honeywell Process Solutions
Gotco International Honghua America
GPS Integrated Systems, Inc. HongHua Group Ltd
Grant Prideco, Lp Hoover Materials Handling Group
Graybar Electric Co., Inc Hose & Fittings, Inc
Grayloc Products Llc Hot-Hed Inc.
Griffin Americas Houghton Offshore
GS-Hydro US, Inc. Houston Blow Pipe a Division of AGI
GSM, Inc. Houston Center Valve & Fitting, Lp
Gulf Coast Downhole Technologies Houston Motor & Control, Inc
Gulf Coast Engineered Solutions Houston Offshore Engineering
Gulf Copper & Manufacturing Houston Pipe Benders
Gulf Electroquip Houston Steel Equipment Co.
Gulf Marine Fabricators HS Energy LLC
Gulf Publishing Company Hufco
Gulfex Huisman-Intrepid Services, Llc.
Gulfmark Americas Inc Hunt Engine, Inc
GX Technology Corp Hydradyne Hydraulics
Hacker International Hydraquip Distribution, Inc.
Hagemeyer North America, Inc Hydratight-Cortland
Hahn Equipment Co. Inc. Hydraulic Equipment Service, Inc.
Halliburton Energy Services Hydril Company
Hallmark Office Products, Inc. Hydril Pressure Control
Hamanaka Chain USA, Inc. Hydrological Solutions, Inc.
Hamilton Metals Hy-Lok USA
Ham-Let Advanced Control Technology Hytorc Of Texas
Hampco I.T.S.
Hamworthy Inc. Iadc Publications
Hannon Hydraulics ICS Triplex, Inc

141
TEXAS K & K Insulation, Inc
IEC Systems, Llc Kalsi Bearings
IHS Energy Group Log Services Kalsi Engineering, Inc.
Impac Systems Engineering Kalsi Seals
Impact Fluid Solutions, LLC Kana Energy Services Inc
Impact Selector, Inc. KBR
ImpactWeather, Inc. Kefco Offshore, Inc
Independent Propane Company Kemlon Products & Development
InduMar Products, Inc. KEM-TRON Technologies, Inc.
Industrial Air Tool, Lp, Llp Kennametal
Industrial Piping Special Kennedy Wire Rope & Sling
Industrial Scale Co. Inc. Kentec Composites
Industrial Solutions & Innovations LLC Keppel Offshore & Marine Usa, Inc
Infinity Marine Offshore, Inc Kerger Marine Electric, Inc.
Inman Texas Company KIDD PipeLine & Specialties
Innovative Electronics Kinder Morgan Bulk Termi
Insite Objects, Inc KLT Carbide Co., Ltd.
Institute of Marine Engineering, Science and
Technology (IMarEST)KnightHawk Engineering Incorporated
INTECSEA/WorleyParsons Kobelco EDTI Compressors, Inc.
Integrated Applications Engineering Inc Koch Heat Transfer Company LPFM
Integrated Drive Systems LLC Kodiak-Terra USA Inc
InterLink Controls Kongsberg Oil & Gas Technologies
InterMoor L & L oil and Gas Services, LLC
International Clamps, Inc L & S Cryogenics, Inc.
International Paint LLC L D Systems, Lp
Intertek Group plc L.C. Eldridge Sales Company,Inc.
Intervale Capital L/K Oil Field Products, Inc.
Intsel Steel Distributors LA Recruitment Ltd.
Intsel Steel/Triple-S Steel Lamons Gasket Company
IWS Gas & Supply of Texas Lancaster Flow Automation
J & J Technical Services, LLC Landscape Images Of Texas
J D Marine Llc Landy Energy Services, Inc.
J P Kenny, Inc. Laser Welding Solutions
J. D. Fields & Co., Inc. Laversab, Inc.
J.Ray McDermott Lawson Products Inc
Jackup Structures Alliance, Inc LBO Inc
JAS Distributing LLC Lebus International Inc
JDR Cable Systems Inc. Leecyn
Jelec Usa, Inc. LeTourneau Technologies, Inc
Jet Machine Works, Inc. Lewis-Goetz And Company, Inc.
Jet-Lube, Inc. LHR Services and Equipment, Inc.
Jhump & Associates, Llc Linco-Electromatic
Jireh Consulting Llc Lincoln Manufacturing,Inc.
Joda Transportation Lloyd's Register Americas
Johnny'S Gauge & Meter Repairs Loadcraft Industries, Ltd.
Journal of Petroleum Technology (JPT) Loadmaster Universal Rigs, Inc.
JT Oilfield Mfg. Co., Inc. Logan Industries International, Inc.
142
TEXAS MCM Oiltools
Logan International Inc. McNichols Company
Logik Precision, Inc. MCS Kenny
Lone Star Companies MCT Brattberg
Lone Star Diving, Inc. Mechtec Corporation
Lone Star Fasteners, LP. Meridian Equipment, Inc.
Lone Star Heat Treating Corp. Merpro Americas, Inc.
Lonestar Deepwater Llc Merrick Systems, Inc.
LoneStar Forklift, Inc. Merrimac Manufacturing, Inc.
Longwood Elastomers Metal Coatings Corp.
Loran International Sales, Inc. Metco-Materials Evaluations
Louisiana Electric Rig Service, Inc M-I SWACO
LSI Interest, Ltd Micron Eagle Hydraulics Inc
LSPHE(US), Inc. Micro-Smart Systems, Inc.
LTS, Inc. MicroTesla Magnetic Field Effects
Lufthansa German Airlines Mid-West Electric Co., Inc.
M & F Gauge Midwest Hose & Specialty Inc.
M & H Engineering Mitsubishi Forklift Trucks of Houston
M D Cowan Inc MLC Cad Systems
M G Maher & Co Inc MODEC-SOFEC
M&I Electric Industries Inc, an AETI Company Moduspec Usa Inc.
M&J Valve, An SPX Brand Mohr Engineering Division
MacArtney Offshore, Inc Monarch Stainless, Ltd.
Macdermid Offshore SolutionsMontgomery Westland Bunker - Data
Center
Mackay Communications, Inc. Moody International, Inc
Magtech Morris Metals Service, Inc.
Malin International Ship Repair & Drydock, Moss Seal Company
Mammoet Motion Industries, Inc
MAN Diesel & Turbo North America Inc. Moulding Specialists,Inc.
Manifold Valve Service MSI Kenny
Marine Aluminium MSO Seals & Gaskets
Marine Chemists, Inc. Of Texas MTS Threaded Products Co
Marine Computation Services Kenny ltd Mud Technology International, Inc.
Marine Equipment, Inc. Mustang Engineering
Marine Medical, Inc. Mustang Power Systems
Marine Salvage & Services, Inc Myrex Industries
Marshall Machine, LLC Nalco
Marubeni-Itochu Tubulars American, Inc. Namasco
Martin Midstream Partners , Lp Nance International
Master Flo Valve (USA), Inc. NASA Johnson Space Center
MasterWord Services, Inc. NATCO
Matthews-Daniel Company National Bronze & Metals, Inc.
Maxim Silencers Inc National Coupling Co., Inc.
McDermott International National Instruments
Mcdonough Marine Service National K Works
McElroy Translation Company National Oilwell Varco
Mcjunkin Red Man Corporation National Service Alliance
Mckenzie Equipment Company, Inc. National Specialty Alloys, LLC

143
TEXASOnsite Treatment Technologies Inc. AKA
OTT A/S
Nedschroef Corporation Open & Close Equipment
Neptune OTC Brasil
Net Safety Monitoring Inc. Outernet Management, Lp
New Century Fabricators Oxifree Metal Protection
New Millennium Group Ltd PAC Stainless, Ltd.
New Orleans to Houston Oil Directory Packard International Inc.
New Tech Systems Panolin
Neway Valve Inc. Parker Cabbet Subsea
Newpark Drilling Fluids Parker Seal
Nick'Sfastener & Industrial Supply Partin Ltd. Partnership
Nigerian Pavilion Pason Offshore Corp.
NMA Maritime & Offshore Contractors Path Consulting, Ltd.
Noble Denton Marine, Inc. PDS Bartech
Noble Drilling (U S) Inc Pegasus International, Inc.
Norriseal Pem-Tech, Inc.
Norson Services Llc PennWell
North Shore Supply Co., Inc. Pentagon Freight Services
Nova Forge Corp. Perkins Drilling Tools, Inc.
Oceaneering International, Inc. Permenter Controls Service, Inc
OceanWorks International Inc. Petreco
OCS Group Petro Amigos
O-D Rentals, Inc. PetroMaterials USA Inc.
Odessa Pumps & Equipment Company Petron Industries, Inc
O'DRILL/MCM, Inc. Phase Dynamics, Inc.
Ods International Inc. Pileco, Inc
ODS-Petrodata Pipe Distributors Inc
OEM Components, Inc. Pipeco Service Lp
OEMic Inc. Pipeline Pigging Products, Inc.
OES Oilfield Services (USA), Inc. Pivot City Corporation
OET Global, Inc. Plusco, Inc.
Office Depot Inc Port-A-Cool, L.L.C.
Offshore Commissioning Solutions Powell Electronics Inc.
Offshore Marine Cable Specialists Powell Industries
Offshore Oil Services, Inc Precise Steel, Inc.
Offshore Rig Movers International Precision Flamecutting and Steel, L.P.
Oglaend System Precision Powered Products
Oil Guide Online Inc. Premium Welding, Inc.
Oil States Industries, Inc. Premsol Specialized Services
OilCareers.com PressureLinks LP
Oildata Logging Services Limited Prime Electrical Services, Llc
Oilfield Equipment Marketing, Inc. Pro Box, Inc.
Oilfield Motor And Control, Inc Probe
Oilstates Process Level Technology Ltd
Oilwell Tubular Consultants, Inc Process Solutions
Okonite Company Production Management
Oliver Valves Ltd. Proserv Offshore, Inc
Omron Oilfield & Marine Pro-Tech Welding

144
TEXAS Rongsheng Machinery Manufacture Ltd.
PSI Automation Rosemount Analytical
Process Safety & Reliability Group Rotech Subsea
Puffer Sweiven Rowan Companies
Pulsar Process Measurement Ltd. RPS Solutions
QA Bearing Technologies Ltd. RR Valve Inc.
QCI Marine Offshore, Llc RTI Energy Systems
Quality Bit & Supply RYCO Hydraulics, Inc.
Quality Connector Systems,LLC S & N Pump Company Inc
Quest Integrity Group, LLC Sabine Pilots
Quest Offshore Resources Inc. Sabine Universal Products, Inc
Quietaire Safety Engineering Services PLLC
R R Williams & Associates Safety Rx
R&M Energy Systems Safety Savings & Environmental LLC
Racor Division/Parker Filtration Samson
Radio Holland Usa, Inc Santini Export Packing Corp.
Radoil, Inc. SAS USA
Ram Winch & Hoist, Ltd Saudi Aramco
Ramtech Building Systems, Inc. SBM Atlantia
Ranger Steel Supply Corp. SC Pipe Services Inc
RAPID-TORC Inc. Scana Offshore Services
Rawson Scan-Pac Mfg., Inc.
RBG Usa, Inc Schlumberger
Recruitment Partners Lp Scorpion Oil Tools, Inc.
Redding Communications SEA CON
Redman Pipe & Supply Sea Technology Ltd
Reed-Hycalog Lp Seacoast Electric
Reliable Pumps Consultants Seals & Packings, Inc.
Remora ASA Seamar Divers, Inc.
Research Partnership to Secure Energy
for AmericaSeaquest Diving Llc
Retsco Seatrax Marine Cranes
Rexel Seatrax, Inc.
RG Petro-Machinery Group Seaward Safety, Inc
Rice Electronics LpSellers Sales Company, Inc. Pumps &
Equipment
Rickmers-Linie Semco Maritime US
Rig-A-Lite AZZ/RAL SENSEAR Texas
Right Angle Gear Sepam Group
Rignet, Inc Sercel
RigStat, L.P. Severn Trent DeNora
Rigzone.com Shanco Equipment Specialists
Ringers Gloves Shaw Pipeline Services
Riversand Technologies, Inc. Shea Writing and Training Solutions
Roberts Production Tools Shell Offshore Inc
Robsco, Inc. Shermco Industries, Inc.
Rock-Oilfield Group Lp Sigma Solutions, Inc.
Rolls-Royce Commercial Marine, Inc Simmons & Company International

145
TEXAS Stratos
SINOPEC Petroleum & Chemical
CorporationStress Engineering Services, Inc.
SIPCO Mechanical Linkage Solutions Stress Subsea, Inc.
Smith & Associates STS Products, Inc.
Smith International Inc STVA Scaffolding & Shoring
SMU Cox School of Business Executive
EducationSTX US Marine
Society for Underwater Technology Sub-Atlantic
Society of Petroleum Engineers Subsea Solutions Llc
Sodexo Remote Sites Partnership Subsea Systems, Inc.
SOFEC Subsea Technologies, Inc.
Solar Turbines SunSource
Sonardyne Inc Superior Drillpipe Mfg, Inc.
Sonica Supply Co Superior Threaded Products, Lp
Sooner Pipe, LP SURF Subsea, Inc.
Source IEC Surface Techniques, Inc.
South Coast Technology, Inc. Suzhou Viza Valve Co. Ltd.
Southern California Valve Swds Slc, Llc
Southwest Electric Supply Inc Swift Technical Services, Llc
Southwest Electronic Energy Group Systel Inc
Southwest Materials Handling Co T H Hill Associates Inc
Southwest Ocean Services, Inc. T Rex Engineering & Construction Lc
Southwest Oilfield Products, Inc T.S. Moly-Lubricants, Inc
Southwest Research InstituteT3 Energy Services, A Unit of Robbins &
Myers Inc.
Southwest Stainless, L.P. Tailwind Air Charters
Southwest Wire Rope Lp TALON Technical Sales, Inc.
Sparrows Offshore Llc TAM International, Inc.
Spartek Systems TCR Inc.
Spears Mfg Co Technical & Scientific Application
Specialties Co/Copper State Rubber Technip
Specialties Company Technogenia, Inc
Specialty Rental Tools and Supply (STS) Technology And Calibration, Inc.
Specialty Steel Supply, Inc. TechTrans International, Inc.
Specific Equipment Company TEEX
Spectra Sensors Tejas Completion Solutions
Spectrex, Inc. Tejas Tubular Products, Inc.
Spectrum Batteries Inc. Teledyne TSS Limited
SPET, Inc. Tenaris
SPIR STAR Tesco Corporation
Spir Star, Ltd. Tetra Technologies, Inc.
Spitzer Texas A&M at Galveston
Spring Bolt & Nut MFGTexas A&M University Energy Engineering
Institute
SPT Group, Inc. Texas Bolt & Nut Company Ltd
STAHL Texas Engineering Experiment
Stainless Steel Custom Texas First Industrial Corp., Inc.
Stallion Offshore Quarters Inc Texas Institute Of Science, Inc
Stallion Oilfield Services Ltd Texas Nameplate Company, Inc.
Stewart & Stevenson Texas Pipe &Supply Co Inc
StormGeo, Inc. Texas Pipe Works, Inc.

146
TEXAS Tubular Perforating Manufacturing, Ltd.
Texas Steel Turbofab
Texma Petroleum Machinery Turner Oilfield Services
TFE Company Inc. TXY-Tech Inc.
TFT-Pneumatic/Safety Tools Allmet Tyco Valves & Controls LP
TGS Type B Solutions, Llc
The Artex Group, LLC U.S. Bolt Manufacturing & TSP Inc
The Eads Company U-Bolt-It, Inc.
The Harding Group, Inc. Ultra Deep, LLC
The Nut Place, Inc. Unitech International
The Rochester Corporation United Laboratories
The Subsea Company LLC Univar Usa, Inc
The University Of Texas At Austin Universal Bacteria Specialist, Inc.
The Watermaker Co., Inc Universal Steel America, Inc.
Thrustmaster of Texas, Inc. Universe Technical Translation, Inc.
Tideland Signal Limited HoustonUniversity of Houston - College of
Technology
Tiger TanksUniversity of Houston Energy Research
Park and College of Engineering
Titan Specialties, Ltd. University of Phoenix
Titanium Engineers, Inc.Upstream, The International Oil & Gas
Newspaper
Tiw Corporation Usx Corporation
Toolmen Corporation UTC Overseas
Toro Downhole Tools Utex Industries, Inc.
Toromont Energy V & M Tube-Alloy Lp
Torq/Lite - Div. Francis Services, Inc. ValTek Industries
Torque Tools Inc Valwu International Inc
Total Instrumentation & Controls Inc. Vam Drilling Usa, Inc
Total Safety Van Beest
Trademarks Promotional Products, Lp Vanco Ring Gasket Specialty, Inc
Translation Source Ltd. Vantran / Bolin Industrial
TransPerfect Translations Varel International Energy Services
Tranter Velosi
Tranter, Inc. Versabar, Inc.
Trelleborg Offshore US, Inc. Vetco Gray Inc.
Trendsetter Electronics Vicinay Cadenas, S.A.
Trendsetter Engineering, Inc VIKING Life-Saving Equipment
Tri Wave, LLC. Vimarc Inc.
Tri-Elements Petroleum Products, Inc. VME Process Inc.
Trionics, Inc VN & Unique Solutions, Inc
Tristar Electronics Corporation Voith Turbo
TSC Offshore Group, Ltd. Volga Dnepr - Unique Air Cargo,
TTGM Vortex Ventures Inc.
Tube Supply Inc. VRcontext
Tuboscope Vetco International W & O Supply Inc
Tuboscope/Vetco Wach Subsea
Tubular Instrumentation And Wagner Plate Works

147
TEXAS TEXAS Cont.
Warner & Hughes Corp. WPT Power Corporation
Warrior Rig USA WT Well Testing
Washing Equipment of Texas Xodus Group Inc
Waters International, Inc. Yellow Freight System, Inc.
Watkins & Associates Executive Search ConsultantsYida Special Steel Ltd Corp
Weatherford YZ Systems / Milton Roy
Weiler Pipe, Llc Zaetric Business Solutions, LLC
Weir SPM Zentech, Inc
Welbor Technology, Inc. Zep Incorporated
Weldinghouse, Inc. Zerl's Welding and Fabrication Inc.
Welldynamics Inc UTAH
Wellhead Distributors International Automation Products Group, Inc.
Welltec A/S Beijer Electronics, Inc.
West Engineering Services Ceramatec, Inc.
West Houston Valve & Fitting Chromalox
Western Data Systems ITT Acoustic Systems
Western Rubber & Mfg. Pepcon Systems
Westerngeco Llc Power Innovations International Inc.
Westney Consulting Group, Inc. Quartzdyne
WGIM Quartzdyne Electronics
Whitco Supply Rhotheta USA Inc
Whitefield Plastics Tanklogix
Wholesale Electric Supply Co. Trans-System Logistics LLC
Wild Well Control, Inc. US Synthetic Bearings
Wilkens Weather Technologies Weather Hawk
Wilson Industries Inc VERMONT
Wilson Supply Superior Technical Ceramics Corp.
Windlass Engineers VIRGINIA
W-Industries Aerial Machine and Tool Corp.
Winston / Royal Guard Alfa Laval Inc
Winters Instruments American Heavy Industries
Wireline Technologies Inc. American Society of Civil Engineer
WM Healthcare Solutions, Inc Anton Paar USA
WMCO Brandt Instruments, Inc. Approva Corporation
WMG Enterprises Ii, Inc Bauer Compressors, Inc.
WOMBlue Ridge Partners Management
Consulting
Womack Machine Supply Co. Coastal Training Technologies Corp
Wood Group Kenny DSM Dyneema
Woodco Usa Dba Focal
World Supply IncIndependent Project Analysis, Inc. / IPA
Institute
Worldwide Oilfield Machine, Inc Inst. Air Receiver
WorleyParsons Katec Inc.
Wozair (USA) Limited Liberian Int'L Ship & Corp Registry
WPI Wellkin Inc. Liebherr Nenzing Crane Co.

148
VIRGINIA WISCONSIN
Marine Spill Response Corp. A&A Manufacturing Co
Mobil Industrial Lubricants Appleton Marine, Inc.
MOOG APV, An SPX Brand
NBB Controls, Inc. Bran+Luebbe, An SPX Brand
Optical Cable Corporation Cordstrap USA
Par Marine Services Diesel & Gas Turbine Worldwide
Rosetta Stone Ltd. Durst Power Transmission Products
SAIC Dynex/Rivett Inc.
SF Marina Systems USA Ellsworth Corporation
Software Ag Usa, Inc Enerpac
Strongwell Fairbanks Morse Engine
Syntech Technology, Inc. Frentzel Products, Inc.
The Rochester Corporation Gleason Reel Corp
Triple Canopy, Inc. Hy-Safe Technology
U.S. - Saudi Arabian Business Council Inductotherm Group
W R Systems Johnson Pump, An SPX Brand
Weidmuller Kabelschlepp America Inc.
WASHINGTON Marathon Electric Generators
Columbia Analytical Services Inc. Marking Services, Inc.
Custom Sensor Design, Inc. Mastergear USA
Elliott Bay Design Group Meltric Corporation
Fluke Corporation NOV
Guido Perla & Associates, Inc. Petersen Products
Markey Machinery Company, Inc. Plenty Mirrless Pumps, An SPX Brand
Measurement Technology NW Safway Services
Mustang Survival SPX Flow Technology
PACCAR International Team Industries, Inc.
Paine Electronics, LLC Thermal Transfer Products
Paroscientific Inc. Twin Disc Incorporated
Rapp Hydema AS Veolia VES Special Servies
Rasmussen Equipment Company WAGO Corporation
Safeworks, Llc Waukesha Cherry
Samson WYOMING
Schweitzer Engineering Laboratories Grainger
SkoFlo Industries, Inc.
Smith Berger Marine, Inc.
Winshuttle, Inc
WEST VIRGINIA
Laser Processing
Marsh Bellofram Group of Companies
Mustang Sampling
PCC Energy Group

149
Top Related