


Languages
Pages
Legal


United Spirits Ltd
1
Lorem ipsum dolor sit amet, consectetuer adipiscing elit, sed diam nonummy nibh euismod tincidunt ut laoreet dolore magna aliquam erat volutpat. Ut wisi enim ad minim veniam, quis nostrud exerci tation ullamcorper suscipit lobortis nisl ut aliquip ex ea commodo consequat. Duis autem vel eum iriure dolor in hendrerit in vulputate velit esse molestie consequat, vel illum dolore eu feugiat nulla
Lorem ipsum dolor sit amet, consectetuer adipiscing elit, sed diam nonummy nibh
euismod tincidunt ut laoreet dolore magna aliquam erat volutpat. Ut wisi enim ad minim veniam,
quis nostrud exerci tation ullamcorper suscipit lobortis nisl ut aliquip ex ea commodo consequat. Duis autem vel eum iriure dolor in hendrerit in vulputate velit esse molestie consequat,
vel illum dolore eu feugiat nulla facilisis at vero eros et accumsan et iusto odio dignissim qui blandit praesent luptatum zzril delenit augue duis dolore te feugait nulla facilisi. et iusto odio dignissim qui blandit praesent luptatum zzril delenit augue duis dolore te feugait nulla facilisLorem ipsum dolor sit amet,
Initiating Coverage
United Spirits Ltd 30-March-2021

United Spirits Ltd
2
Industry LTP Base Case Fair Value Bull Case Fair Value Recommendation Time Horizon
Alcobev 554 603 647 Buy at CMP and add on the dips to 499-505 band 2 quarters
Our Take: United Spirits (UNSP) is the leader in the Indian spirits market, with ~33% volume share. It has an established portfolio of ~120 brands across the price spectrum, with 13 millionaire (million cases sold per annum) brands including 4 brands with over 10mn cases per annum in sales. McDowell’s No.1, Royal Challenge, Signature, Antiquity, Black Dog, Director’s Special Black, McDowell’s Rum, McDowell’s Brandy, Bagpiper, Old Tavern, Haywards are some of the marquee brands owned by the company. In addition, UNSP also imports, manufactures, distributes and sells various iconic Diageo brands such as Haig Gold Label, Captain Morgan, Johnnie Walker, J&B, Baileys, Lagavulin, Talisker, VAT 69, Black & White, Smirnoff and Ciroc in India under different licensing agreements. With over 50 manufacturing facilities spread across approximately 23 states and over 3 union territories in India, it has a pan-India manufacturing and distribution footprint, and a sticky franchise. This category is both stringently regulated and ‘media dark’ and that offers strong competitive advantage to the existing players. UNSP is majority owned by Diageo, the largest spirits player globally. After a bumpy post-takeover phase, Diageo over the last decade has improved UNSP’s governance, strategy and business model – that led to boost in margins in tandem with market share. With UNSP dominating volume market share of the whisky segment in India, we believe they are well placed to ride on the rise in consumption of alcoholic beverages in India, driven by the underlying demographic advantage and the change in perception towards alcohol.
Valuations & Recommendation: Diageo is a global leader with 17% share in spirits and 40% in scotch globally. India being the largest whiskey market, is very important for Diageo. Over the past few years, UNSP management has tightened their seat belts and made a number of positive changes in the company. Their focus on premiumisation, de-focussing of popular category brands, debt reduction, digital push, cost optimization, better product mix and supply chain management are well reflected in the higher margins and superior growth rate of the company. The alcohol beverage industry which was already facing the heat due to strict regulatory measures and weak consumer sentiment was further beaten down by Covid-19 and resulting lockdown, however with economy opening up, the overall consumption is improving sequentially. The long-term growth drivers (low per capita consumption, favourable demographics, changing perception towards alcohol and up-trading from country liquor) still remain intact which would lead to steep volume recovery and thereby better operating efficiencies over next few quarters. Benign raw material prices, increased premiumisation and strict cost control, coupled with deleveraging will lead to higher profitability. While challenges still persist, the worst seems to be behind the company and so we recommend a buy on the stock at CMP with add on dips to Rs.499-505 band for a base case target of Rs. 603 (41XFY23E EPS) and a bull case target of Rs.647 (44XFY23E EPS).
HDFC Scrip Code MCDLTDEQNR
BSE Code 532432
NSE Code MCDOWELL-N
Bloomberg UNSP:IN
CMP Mar 30, 2021 554
Equity Capital (cr) 145
Face Value (Rs) 2
Eq- Share O/S(cr) 72.7
Market Cap (Rscr) 40,256
Book Value (Rs) 52.4
Avg.52 Wk Volume (in ‘000s)
3176
52 Week High 661
52 Week Low 458
Share holding Pattern % (Dec 31, 2020)
Promoters 56.76
Institutions 28.77
Non Institutions 14.47
Total 100.0
Fundamental Research Analyst Harsh Sheth [email protected]

United Spirits Ltd
3
Financial Summary (Rs Cr) Particulars (Rs cr) Q3FY21 Q3FY21 YoY-% Q2FY21 QoQ-% FY20 FY21E FY22E FY23E
Net Revenues 2146 2296 (6.55) 1030 108.30 9091 8016 9918 10657
EBITDA 270 416 (35.11) -78 (447.55) 1508 908 1514 1694
APAT 128 225 (42.83) -140 (191.52) 790 430 909 1069
Diluted EPS (Rs) 1.80 3.10 (41.94) -1.90 (194.74) 10.88 5.92 12.52 14.71
P/E (x) 50.92 93.59 44.26 37.65
EV/EBITDA 28.04 45.66 27.10 23.68
RoE-% 22.77 10.79 19.69 19.06
Long Term Triggers:
Demographics to ensure strong growth:
Despite being a country with a population of ~1.3 bn, of which ~60% lies within the age group of 15-55 years, India’s per-capita consumption of alcoholic beverages stands abysmally low at ~2.6 litres per annum. On the other hand, for most countries, the per capita consumption of alcohol exceeds 10 litres per annum. Going forward, we believe that the Indian alcohol (including IMFL) industry provides a lucrative opportunity for players, in the light of; (1) Rising income levels, fuelling discretionary spends - As per industry sources, the pace of growth of consumption in Tier-2/3/4 cities as well as rural areas could outpace that of urban cities. This would be beneficial for UNSP, considering its well-entrenched manufacturing and distribution footprint across India.
(2) Changing consumption patterns, led by aspirational consumption - Changing social norms, acceptability of social drinking and increasing consumption by women are all drivers that could catapult demand growth over the long run. Moreover, with the rise in discretionary income, consumers would tend to upgrade their preferences, resulting in higher demand for prestige and above segments. By virtue of its expansive portfolio across all price points, UNSP would stand to benefit from these. (3) An increasing portion of the population entering the legal drinking bracket each year - An estimated ~25mn of the populace is touted to enter the legal drinking bracket (which varies from 18 to 25 years across states) each year. Such a favourable demographic index augurs well for the industry. Dominant player with strong portfolio: In the IMFL industry, Brown spirits (whiskey, brandy and rum) dominate the consumption pattern in India, as compared to the white spirits (gin and vodka). Brown spirits account for more than 90% of the consumption, in both volume and value terms. UNSP is the largest spirits
United Spirits Ltd
4
player in India, garnering ~33% volume share of the market. UNSP has a strong product portfolio with 120 of its own brands, of which 13 are millionaire brands. UNSP’s product portfolio encompasses all categories of IMFL, namely whiskey, brandy, rum, gin and vodka. A distinguishing characteristic of UNSP is its established product portfolio - across segments and price points. Over the years, UNSP’s brands have developed a strong brand recall among consumers, which is evident from its notable market share.
Segment-wise Key Brands: Category Whiskey Brandy Rum Gin Vodka
Luxury
Johnnie Walker Tanqueray Ketel One
Gold Label Reserve Ciroc
Glenfiddich
Singleton
Talisker
Premium
VAT 69 Captain Morgan Smirnoff
Black & White
Black Dog
Prestige
McDowell's No.1 Original McDowell's VSOP
McDowell's No.1 Cariba Romanov Red
McDowell's No.1 Platinum Honey Bee
McDowell's No.1 Luxury
Royal Challenge
Signature
Antiquity
Popular
Director's Special McDowell's McDowell’s No.1 Celebration Blue Riband Romanov
Old Tavern Bagpiper Rum White Mischief
Bagpiper
Haywards
Mrs. Hina Nagrajan to be the new MD and CEO: Effective from April, 2021 Ms. Hina Nagarajan has been appointed as Chief Executive Officer, who will closely work with Mr. Anand Kripalu up to June 30, 2021. Thereafter, Mr. Anand Kripalu will step down as the Managing Director & Chief Executive Officer. Mrs. Nagarajan is

United Spirits Ltd
5
currently managing director, Africa Regional Markets (ARM) at Diageo, UNSP’s parent company. Prior to joining Diageo, she has spent more than three decades in consumer-packaged goods businesses, holding senior marketing and general management positions at Reckitt Benckiser, Nestle India, and Mary Kay India. Entrenched footprint - A key distinguisher: The Indian alcohol industry is highly regulated on a state level. Every state has its own set of regulations governing alcohol manufacture and distribution, retailing, pricing, levies and duties etc. Also, to a large extent, inter-state transportation attracts levies. Moreover, the Indian alcohol market is a media-dark industry, where advertising is restricted. Stringent state-wise regulations and restrictions on advertising could create challenges for new players to enter this market, and create a loyal customer base for their products. These aspects act as a strong advantage for UNSP’s business, given its pan-India manufacturing and distribution footprint, as well as established product portfolio with notable brand recall. UNSP’s strong distribution network and point of sale coverage spans across more than 65,000 outlets across India. Company's products are manufactured across more than 50 locations in India of which 15 manufacturing facilities across 10 states and 1 union territory are owned by the company Maharashtra and Karnataka are key markets for UNSP, both contributing approximately ~40% to overall volumes. States such as Telangana, Rajasthan, Uttar Pradesh, Andhra Pradesh and Haryana, each contribute 4-7% to UNSP’s volumes. Thus, 75-80% of the volumes can be attributed to these states. Also, over the years, UNSP has gradually exited or reduced volumes in regions with low profitability.
North, 22%
West, 26%South, 42%
East, 10%
Region-wise Split - Indian Alcohol Beverage Industry (in Volumes) North, 11%
West, 20%
South, 53%
East, 16%
Region-wise Sales Split - UNSP (in Volumes)

United Spirits Ltd
6
Transit to Premiumisation: Predominantly the whiskies in India are positioned in value segment. However, UNSP has focused on premiumisation. This strategy has progressed well, considering that the prestige and above segment currently contributes ~68% to UNSP’s revenue and ~51% to its volumes, from ~55% to revenues and 36% to volumes in FY16. We believe that the Indian alcohol market is in a favourable phase of transition, led by (1) Presence of global players as market leaders to upgrade industry standards, aligning them to best global practices, (Diageo is the promoter of UNSP, Heineken that of United Breweries) and (2) Focus on premiumisation and improving the product mix (shifting focus from volume to value) could result in improved profitability and consequently better return ratios. This premiumisation journey has facilitated UNSP to enhance its margins in spite of rising input costs and multiple disruptions over the past few years. Pernod Ricard enjoys the higher gross margins, of ~50% ( vs UNSP’s ~44.8%), as it operates only in the Prestige & Above segment. UNSP leads the market in the lower-prestige sub-segment, while in the mid- and upper-prestige sub-segments Pernod Ricard is the market leader. In order to gain traction in these sub-segments, UNSP recently renovated/relaunched its core whiskey brands, McDowell’s No1 and Royal Challenge. Pernod Ricard’s high gross margin and operational efficiencies imply the underlying potential that exists in the IMFL category. Though, the difference exists in the way companies operate their businesses, UNSP can get close to PRI’s operating margins via premiumization drive and operational cost efficiencies.
19.7% 23.7% 28.7% 33.0% 31.0% 34.2% 36.8% 37.2% 41.6% 40.9%
80.3% 76.3% 71.3% 67.0% 69.0% 65.8% 63.2% 62.8% 58.4% 59.1%
FY11 FY12 FY13 FY14 FY15 FY16 FY17 FY18 FY19 FY20
Contribution from 'Prestige & Above' segment has seen a steady rise
Prestige & Above Popular

United Spirits Ltd
7
Strategic Review of Selected Popular Brands –UNSP is initiating a strategic review of selected Popular brands, continuing the strategy towards long-term profitable growth through premiumising the company’s portfolio. UNSP’s Popular portfolio comprises around 30 brands and the strategic review will focus on approximately half of this portfolio by volume. This review will not include the McDowell’s or Director’s Special trademarks. The strategic review is expected to be completed by the end of the 2021 calendar year. This review reinforces UNSP’s commitment to deliver sustainable long-term growth and improved profitability, through a sharpened focus on core Popular and Prestige & Above brands, including international brands. Franchising: A win-win strategy: With a view to focus on its prestige and above brands and downsize its non-profitable regular portfolio, UNSP has started franchising select regular brands in certain states, starting January 2017. At present, UNSP has brand franchise agreements (typically for 3-5 years) across 13 states. UNSP has entered into a fixed-fee-based franchise model, wherein the company would franchise its select regular brands in that particular state, and in turn, receive a fixed annual fee from the franchisee partner. As per this arrangement, manufacturing, distribution, other variable costs, as well as working capital would be borne by the franchisee partner. Thereby, UNSP’s manufacturing and sales bandwidth would be focussed on their high-margin prestige and above portfolio. On the other hand, the franchisee would also be incentivised to produce and sell higher volumes, as they have to pay a fixed fee to UNSP. Any benefits incurred owing to operating leverage would benefit the franchisees. We believe this franchising strategy would continue to benefit UNSP in the form of improved profitability (non-profitable regular brands being franchised and UNSP receiving a fixed fee in return) and reduction in working capital. The company could also rationalise its manufacturing footprint like it has been doing since past few years, going ahead.
28 27
19 1915
FY16 FY17 FY18 FY19 FY20
No. of owned manufacturing units
6953
149185 167
FY16 FY17 FY18 FY19 FY20
(in
Rs.
Cr.
)
Income from Franchising

United Spirits Ltd
8
Short Term Triggers Relief on Raw Material Costs: ENA and Glass are key raw materials for UNSP. The prices of the same were fairly stable in FY17-FY19 period which is reflected in better gross margins. However, the prices of ENA which makes roughly 40% of the RM costs prices had shot up in H1FY20, leading to margin pressures on the industry. Part of the reason was, the increased blending by the OMC companies, leading to additional requirement of ENA in the country, due to which there was a short fall for the Alcohol and Chemical industries. However, at historically low levels of Crude in H1FY21, the OMC’s ENA requirement had decreased for the short term (because of reduction in demand due to the virus, as well as cheaper rates of crude). This gave some relief to UNSP and the industry. Going ahead ENA inflation is expected to be mild due to the recent Ethanol Blending Policy introduced by the government and glass prices might see only a mild inflationary pressure. Thus, we believe rising raw material costs to be thing of past. Improving Margin Profile: As mentioned above, UNSP has over the years optimized its portfolio and state mix to garner better profitability. After Diageo took control of UNSP in 2014, the company has focused on premiumisation. Increasing contribution from Prestige & Above segment has helped the company to enhance its gross margins (Prestige & Above segment’s gross margins are ~3.5X of popular segment) with an exception in FY20 where industry witnessed steep inflation in raw material prices. Further UNSP curtailed production of some low-margin products in select markets and also started franchising popular brands in some markets by way of fixed fee and reduction in working capital requirements. The management has been proactive and has undertaken numerous rationalisation and restructuring initiatives for better productivity. It further upped its game with cost cutting and other operational measures along with supply chain efficiency which has generated cost savings to the tune of Rs. 780 Cr over FY16-FY19. Recently, the company has undertaken strategic review which will to deliver sustainable long-term growth and improved profitability, through a sharpened focus on core Popular and Prestige & Above brands, the outcome of which is expected to be shared by end of calendar year. EBITDA margins have significantly improved from 10.7% in FY16 to 16.6% in FY20. PAT margins have steadily improved as UNSP has over the years de-leveraged its balance sheet. We expect debt levels to come down further which would aid profitability.

United Spirits Ltd
9
Strengthening Balance Sheet: The company’s debt metrics improved to Net Debt/EBITDA of 1.4x as on FY20 and interest coverage of 6.7x in FY20 from Net Debt/EBITDA of 4.7x as on FY16 and interest coverage of 1.8x in FY19 on the back of healthy operating accruals. UNSP also repaid ~Rs. 2,127 Cr debt from FY16, the current net debt stands at ~Rs. 2,039 Cr. While the debt reduction measures are continuing, we expect further deleveraging at UNSP over the next 1-2 years supported by robust cash flows. This can further lead to re-rating of company. Franchising along with supply chain efficiency has nearly halved the working capital cycled leading to improved return ratios. Regulatory Hurdles: The Indian alcohol industry is highly regulated on a state level. Alcohol tax revenue goes directly to the state government unlike other goods which are under the purview of the Goods and Services Tax (GST). The GST goes to the central government and not directly to the state government. Every state has its set of regulations which govern the value chain of industry players. These typically govern alcohol manufacturing, retailing, pricing, levies and duties (eg: excise duty) etc. Liquor industry contributes 10-30% to revenues of states by the way of taxation. There has been a sharp increase in duties over the years. Hence, the excise per case for alcoholic beverage players has gone up significantly. Accordingly, even a small change in the duty pushes the prices of alcohol beverages at retail level thereby affecting the volumes in the near term after which the market stabilizes and absorbs the rise in selling price. Also, if we consider the ratio of excise duty adjusted to alcoholic content, IMFL appears to be more affordable than beer, as it exhibits a higher ‘alcohol/price’ ratio. Over time, this could act as a trigger for consumers switching to IMFL from beer as IMFL provides higher value for money.
41.2% 43.2%48.6% 49.4% 44.8%
10.7% 11.8% 11.9% 14.7% 16.2%
3.0% 5.2% 6.2% 7.7% 8.7%
FY16 FY17 FY18 FY19 FY20
Steady improvement in profitablity over the years
Gross Margin EBITDA Margin APAT Margin

United Spirits Ltd
10
Covid-19 impact and subsequent recovery: In the beginning of the COVID-19 lockdown in India, the country implemented an alcohol sales ban. When the lockdown measures were relaxed on May 4, 2020, India decided to lift the sales ban on alcohol. Accordingly, from May 4, 2020 onwards L6 and L8 type liquor stores were allowed to open. This is about 50% of ~75,000 liquor stores in the country. Several Indian states increased alcohol taxes soon after the decision to re-open liquor stores in the country. Many state governments cited revenue from alcohol sales as the reason for increasing alcohol taxation during COVID-19, and surprisingly not as a public health policy solution – but as pure revenue generation measure. States which imposed Corona cess on liquor in May to compensate for the revenue deficit during Covid-19 lockdown saw sale of alcohol plummeting by more than half during the relaxation phase. Based on the data, CIABC (apex body of the Indian Alcoholic Beverage Industry) has urged state governments to reduce the Corona cess to a sustainable level stating that heavy taxation has proved counterproductive resulting in sales decline and downtrading. With the economy returning to normal, state revenues have improved in the last two quarters. Hence, we believe states are likely to refrain from irrational excise hikes on alcohol beverages. Increase in alcohol tax during Covid-19:
State Rate hike during Covid-19 Recent Development
Rajasthan 10% increase in excise duty on IMFL Withdrew the hike but only for beer
Delhi 70% Covid Cess on MRP Rolled back 70% covid cess & increased VAT by 5%
Karnataka 11% increase in excise duty
Andhra Pradesh 75% increase in excise duty Reduced by 2-30%
427579 706 848
10201391
16321870
2280 2394 2446
FY10 FY11 FY12 FY13 FY14 FY15 FY16 FY17 FY18 FY19 FY20
Exci
se/C
ase
(in
Rs.
)
Excise/Case has increased by 19.07% CAGR since FY10

United Spirits Ltd
11
Telangana 15% Covid Cess on MRP
West Bengal 30% additional sales tax Withdrew the hike but only for beer
Odhisa 30% Covid Cess on MRP Reduced to 15%
Punjab Additional excise of Rs. 10 per bottle
Tamil Nadu 15% increase in excise duty
Kerala 35% Covid Cess on IMFL
Assam & Meghalaya 25% increase in excise duty Withdrew the hike
Uttar Pradesh Hike of Rs. 5 to Rs 400 depending upon type and size
Jammu & Kashmir 50% increase in excise duty Withdrew the hike
Goa 20% increase in excise duty
Key Risks: Constantly changing regulatory environment: The industry is exposed to multiple regulatory risks emanating from state taxes, adverse ruling from courts and changes in regulations with respect to pricing, licensing, working of operating facilities, manufacturing processes, marketing, advertising and distribution.
Pricing challenges: Pricing continues to remain a challenge for the category since with continuous increase in excise duties, end consumer prices continue to experience upsurge with no benefit to the company.
Political Risk: Increased tendency towards prohibition in an election year. Another concern emerges from the dependence on state governments to get price increases. Margins may get severely impacted in case of inflation in raw material costs or any increase in cost due to change in regulations.
Distribution Concerns: Significant changes in route to market strategies by various state governments pose a concern on establishing distribution network with new intermediaries. This also poses credit risk in case the existing distributors default due to the closure of their respective businesses.
Illegal Liquor: Prohibition in certain states poses a threat to legitimate sales and gives rise to inter-state smuggling impacting industry growth. This may also lead to a proliferation of country liquor sales in absence of / curtailed availability of branded products.
United Spirits Ltd
12
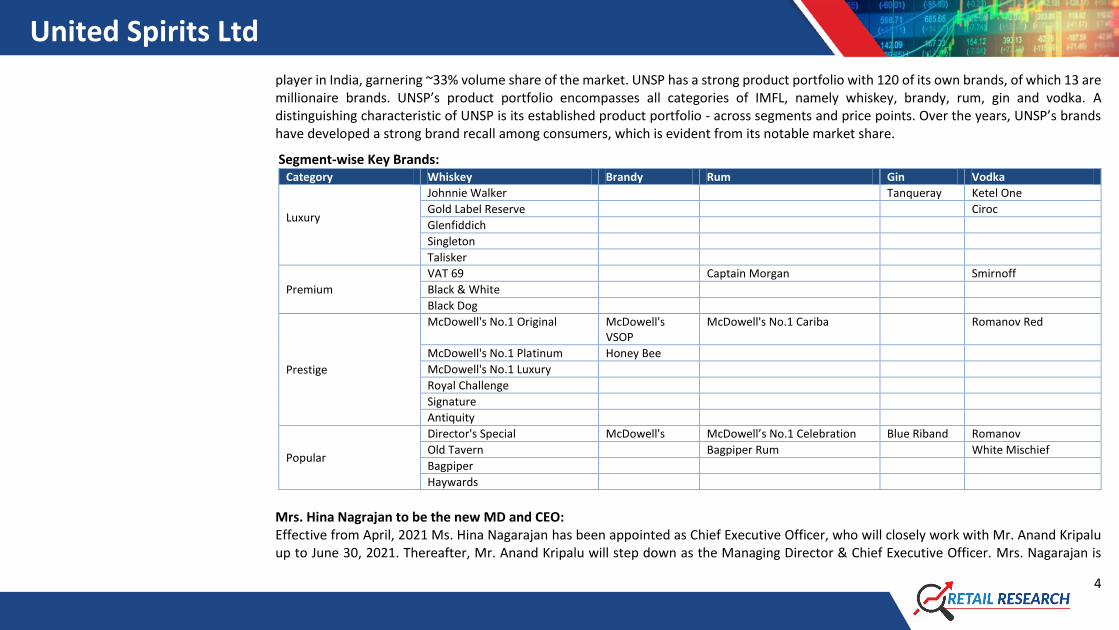
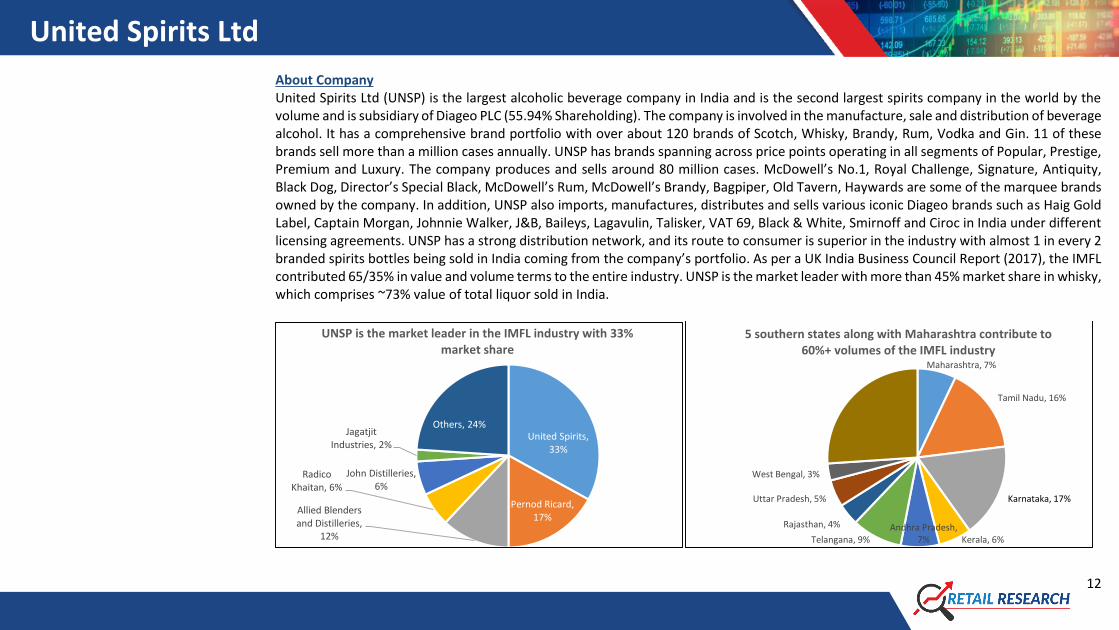
About Company United Spirits Ltd (UNSP) is the largest alcoholic beverage company in India and is the second largest spirits company in the world by the volume and is subsidiary of Diageo PLC (55.94% Shareholding). The company is involved in the manufacture, sale and distribution of beverage alcohol. It has a comprehensive brand portfolio with over about 120 brands of Scotch, Whisky, Brandy, Rum, Vodka and Gin. 11 of these brands sell more than a million cases annually. UNSP has brands spanning across price points operating in all segments of Popular, Prestige, Premium and Luxury. The company produces and sells around 80 million cases. McDowell’s No.1, Royal Challenge, Signature, Antiquity, Black Dog, Director’s Special Black, McDowell’s Rum, McDowell’s Brandy, Bagpiper, Old Tavern, Haywards are some of the marquee brands owned by the company. In addition, UNSP also imports, manufactures, distributes and sells various iconic Diageo brands such as Haig Gold Label, Captain Morgan, Johnnie Walker, J&B, Baileys, Lagavulin, Talisker, VAT 69, Black & White, Smirnoff and Ciroc in India under different licensing agreements. UNSP has a strong distribution network, and its route to consumer is superior in the industry with almost 1 in every 2 branded spirits bottles being sold in India coming from the company’s portfolio. As per a UK India Business Council Report (2017), the IMFL contributed 65/35% in value and volume terms to the entire industry. UNSP is the market leader with more than 45% market share in whisky, which comprises ~73% value of total liquor sold in India.
United Spirits, 33%
Pernod Ricard, 17%
Allied Blenders and Distilleries,
12%
Radico Khaitan, 6%
John Distilleries, 6%
Jagatjit Industries, 2%
Others, 24%
UNSP is the market leader in the IMFL industry with 33% market share
Maharashtra, 7%
Tamil Nadu, 16%
Karnataka, 17%
Kerala, 6%Andhra Pradesh,
7%Telangana, 9%
Rajasthan, 4%
Uttar Pradesh, 5%
West Bengal, 3%
Others, 26%
5 southern states along with Maharashtra contribute to 60%+ volumes of the IMFL industry

United Spirits Ltd
13
Financials (Standalone) Income Statement Balance Sheet
(Rs Cr) FY19 FY20 FY21E FY22E FY23E As at March (in Rs. Cr.) FY19 FY20 FY21E FY22E FY23E
Net Revenues 8981 9091 8016 9918 10657 SOURCE OF FUNDS
Growth (%) 9.92 1.23 -11.83 23.73 7.45 Share Capital 145 145 145 145 145
Operating Expenses 7657 7583 7107 8404 8963 Reserves 2986 3664 4019 4929 5998
EBITDA 1323 1508 908 1514 1694 Shareholders' Funds 3132 3810 4165 5074 6143
Growth (%) 35.58 13.96 -39.76 66.66 11.89 Long Term Debt 764 0 0 0 0
EBITDA Margin (%) 14.74 16.59 11.33 15.26 15.90 Short Term Debt 1825 2073 1469 1084 833
Depreciation 145 228 274 320 342 Total Source of Funds 5772 5813 5641 6166 6985
EBIT 1179 1281 634 1194 1352 APPLICATION OF FUNDS
Other Income 62 46 46 48 56 Net Block 1245 1256 1152 1009 850
Interest expenses 220 191 174 125 92 Investment in Subsidiaries 298 253 240 228 217
PBT 1021 1135 506 1117 1316 Other Non-Current Assets 2211 2067 2202 2354 2525
Tax 333 430 251 335 341 Total Non Current Assets 3755 3575 3594 3591 3592
APAT 688 790 430 909 1069 Inventories 1877 1836 1669 2038 2190
Growth (%) 35.68 14.83 -45.59 111.46 17.55 Trade Receivables 2518 2284 2013 2491 2677
EPS 9.47 10.88 5.92 12.52 14.71 Other Current Assets 454 628 554 685 736
Total Current Assets 4848 4747 4236 5214 5602
Trade Payables 1336 1171 1164 1413 1518
Other Current Liab & Provisions 1554 1373 1266 1528 1650
Total Current Liabilities 2890 2545 2430 2941 3168
Net Current Assets 1958 2203 1806 2273 2435
Cash & Equivalents 59 35 241 302 959
Total Application of Funds 5772 5813 5641 6166 6985 (Source: Company, HDFC sec)

United Spirits Ltd
14
Cash Flow Statement Key Ratios (Rs Cr) FY19 FY20 FY21E FY22E FY23E Particualrs FY19 FY20 FY21E FY22E FY23E
Reported PBT 1021.1 1135.4 506.3 1117.0 1316.0 EBITDA Margin (%) 14.7 16.6 11.3 15.3 15.9
Non-operating & EO items -62.2 -45.5 -46.1 -48.0 -55.7 EBIT Margin (%) 13.1 14.1 7.9 12.0 12.7
Interest Expenses 220.0 190.7 173.8 124.6 91.5 APAT Margin (%) 7.7 8.7 5.4 9.2 10.0
Depreciation 144.5 227.5 274.3 320.4 342.3 RoE (%) 24.4 22.8 10.8 19.7 19.1
Working Capital Change 364.1 -244.6 396.4 -466.5 -161.6 RoCE (%) 14.1 14.5 5.6 14.2 16.8
Tax Paid -332.8 -430.0 -251.0 -335.0 -341.2 Solvency Ratio
OPERATING CASH FLOW ( a ) 1354.7 833.5 1053.8 712.4 1191.3 Net Debt/EBITDA (x) 1.9 1.4 1.4 0.5 (0.1)
Capex -289.7 -238.1 -170.3 -177.7 -183.3 Net D/E (x) 0.8 0.5 0.3 0.2 (0.0)
Free Cash Flow 1065.0 595.4 883.5 534.7 1008.0 PER SHARE DATA
Investments -231.1 68.6 -44.6 -139.4 -158.6 EPS (in Rs.) 9.5 10.9 5.9 12.5 14.7
Non-operating income 32.5 131.2 121.1 48.0 55.7 CEPS (in Rs.) 11.5 14.0 9.7 16.9 19.4
INVESTING CASH FLOW ( b ) -488.3 -38.3 -93.8 -269.2 -286.1 BV (in Rs.) 43.1 52.4 57.3 69.8 84.6
Debt Issuance / (Repaid) -676.5 -515.9 -604.2 -385.0 -251.3 Dividend - - - - -
Interest Expenses -220.0 -190.7 -173.8 -124.6 -91.5 Cash Conversion Cycle (days) 79.6 88.4 82.3 83.7 83.4
FCFE -1384.8 -744.9 -871.9 -778.8 -628.9 Debtor days 102.3 91.7 91.7 91.7 91.7
Share Capital Issuance 0.0 0.0 0.0 0.0 0.0 Inventory days 76.3 73.7 76.0 75.0 75.0
Dividend 0.0 0.0 0.0 0.0 0.0 Creditors days 54.3 47.0 53.0 52.0 52.0
Others -30.9 -26.5 0.0 0.0 0.0 VALUATION
FINANCING CASH FLOW ( c ) -927.4 -733.1 -778.0 -509.6 -342.8 P/E (x) 58.5 50.9 93.6 44.3 37.7
NET CASH FLOW (a+b+c) -61.0 62.1 182.0 -66.4 562.4 P/BV (x) 12.9 10.6 9.7 7.9 6.6
EV/EBITDA (x) 32.3 28.0 45.7 27.1 23.7
EV / Revenues (x) 4.8 4.7 5.2 4.1 3.8
Dividend Yield (%) - - - - - (Source: Company, HDFC sec)

United Spirits Ltd
15
One Year Price Chart
(Source: Company, HDFC sec)
0
100
200
300
400
500
600
700
Mar
-20
Ap
r-2
0
May
-20
Jun
-20
Jul-
20
Au
g-2
0
Sep
-20
Oct
-20
No
v-2
0
De
c-2
0
Jan
-21
Feb
-21
Mar
-21

United Spirits Ltd
16
Disclosure:
I, Harsh Sheth, MCom, author and the names subscribed to this report, hereby certify that all of the views expressed in this research report accurately reflect our views about the subject issuer(s) or securities. HSL has no material adverse disciplinary history as on the date of publication of this report. We also
certify that no part of our compensation was, is, or will be directly or indirectly related to the specific recommendation(s) or view(s) in this report.
Research Analyst or his relative or HDFC Securities Ltd. does not have any financial interest in the subject company. Also Research Analyst or his relative or HDFC Securities Ltd. or its Associate may have beneficial ownership of 1% or more in the subject company at the end of the month immediately preceding
the date of publication of the Research Report. Further Research Analyst or his relative or HDFC Securities Ltd. or its associate does not have any material conflict of interest.
Any holding in stock –No
HDFC Securities Limited (HSL) is a SEBI Registered Research Analyst having registration no. INH000002475.
Disclaimer: This report has been prepared by HDFC Securities Ltd and is meant for sole use by the recipient and not for circulation. The information and opinions contained herein have been compiled or arrived at, based upon information obtained in good faith from sources believed to be reliable. Such information has not been independently verified and no guaranty, representation of warranty, express or implied, is made as to its accuracy, completeness or correctness. All such information and opinions are subject to change without notice. This document is for information purposes only. Descriptions of any company or companies or their securities mentioned herein are not intended to be complete and this document is not, and should not be construed as an offer or solicitation of an offer, to buy or sell any securities or other financial instruments. This report is not directed to, or intended for display, downloading, printing, reproducing or for distribution to or use by, any person or entity who is a citizen or resident or located in any locality, state, country or other jurisdiction where such distribution, publication, reproduction, availability or use would be contrary to law or regulation or what would subject HSL or its affiliates to any registration or licensing requirement within such jurisdiction. If this report is inadvertently sent or has reached any person in such country, especially, United States of America, the same should be ignored and brought to the attention of the sender. This document may not be reproduced, distributed or published in whole or in part, directly or indirectly, for any purposes or in any manner. Foreign currencies denominated securities, wherever mentioned, are subject to exchange rate fluctuations, which could have an adverse effect on their value or price, or the income derived from them. In addition, investors in securities such as ADRs, the values of which are influenced by foreign currencies effectively assume currency risk. It should not be considered to be taken as an offer to sell or a solicitation to buy any security. HSL may from time to time solicit from, or perform broking, or other services for, any company mentioned in this mail and/or its attachments. HSL and its affiliated company(ies), their directors and employees may; (a) from time to time, have a long or short position in, and buy or sell the securities of the company(ies) mentioned herein or (b) be engaged in any other transaction involving such securities and earn brokerage or other compensation or act as a market maker in the financial instruments of the company(ies) discussed herein or act as an advisor or lender/borrower to such company(ies) or may have any other potential conflict of interests with respect to any recommendation and other related information and opinions. HSL, its directors, analysts or employees do not take any responsibility, financial or otherwise, of the losses or the damages sustained due to the investments made or any action taken on basis of this report, including but not restricted to, fluctuation in the prices of shares and bonds, changes in the currency rates, diminution in the NAVs, reduction in the dividend or income, etc. HSL and other group companies, its directors, associates, employees may have various positions in any of the stocks, securities and financial instruments dealt in the report, or may make sell or purchase or other deals in these securities from time to time or may deal in other securities of the companies / organizations described in this report. HSL or its associates might have managed or co-managed public offering of securities for the subject company or might have been mandated by the subject company for any other assignment in the past twelve months. HSL or its associates might have received any compensation from the companies mentioned in the report during the period preceding twelve months from t date of this report for services in respect of managing or co-managing public offerings, corporate finance, investment banking or merchant banking, brokerage services or other advisory service in a merger or specific transaction in the normal course of business. HSL or its analysts did not receive any compensation or other benefits from the companies mentioned in the report or third party in connection with preparation of the research report. Accordingly, neither HSL nor Research Analysts have any material conflict of interest at the time of publication of this report. Compensation of our Research Analysts is not based on any specific merchant banking, investment banking or brokerage service transactions. HSL may have issued other reports that are inconsistent with and reach different conclusion from the information presented in this report. Research entity has not been engaged in market making activity for the subject company. Research analyst has not served as an officer, director or employee of the subject company. We have not received any compensation/benefits from the subject company or third party in connection with the Research Report. HDFC securities Limited, I Think Techno Campus, Building - B, "Alpha", Office Floor 8, Near Kanjurmarg Station, Opp. Crompton Greaves, Kanjurmarg (East), Mumbai 400 042 Phone: (022) 3075 3400 Fax: (022) 2496 5066 Compliance Officer: Binkle R. Oza Email: [email protected] Phone: (022) 3045 3600 HDFC Securities Limited, SEBI Reg. No.: NSE, BSE, MSEI, MCX: INZ000186937; AMFI Reg. No. ARN: 13549; PFRDA Reg. No. POP: 11092018; IRDA Corporate Agent License No.: CA0062; SEBI Research Analyst Reg. No.: INH000002475; SEBI Investment Adviser Reg. No.: INA000011538; CIN - U67120MH2000PLC152193 Mutual Funds Investments are subject to market risk. Please read the offer and scheme related documents carefully before investing.
Top Related