


Languages
Pages
Legal


Union Square Farmers Market
•Managed by Union Square Main Streets with City of Somerville.•Started 2005. •Launched in partnership with Federation of Mass Farmers Markets.•Held Saturdays 9 am to 1 pm, June through October

Kimball Fruit Farm (Pepperell, MA) – Full range of tree fruit, berries and vegetables
Parker Farm (Lunenberg, MA) – Full range of vegetables and greens
Nicewicz Family Farm (Bolton, MA) – IPM orchard with full range of tree fruit, berries and corn
Drumlin Farm (Lincoln, MA) – Full range of vegetables, drop cherries, cut flowers and pesto
Cook’s Orchard (Brimfield, MA) – IPM orchard and berries, baked goods and jams
Stillman's Farm (Lunenburg, MA) – Fresh cut flowers
Siraco Sharpening Service (Somerville, MA)- Sharpening services of kitchen knives, garden tools.
Vendors with our market since 2005

New Vendors
Iggy’s Bread (Cambridge, MA) –range of breads and rolls
Hutchins Farm (Concord, MA) – vegetables and greens
Taza Chocolate (Somerville, MA) – chocolate
Fiore di Nonno (Somerville, MA) – mozzarella
Groundwork Somerville (Somerville, MA) – plants, herbs
Urban Homesteaders League (Somerville, MA) – skillshare workshops, swap table
Herb Lyceum (Groton, MA) – potted flowers and herbs, honey, herb blends, soap

Data Collection at Market:
• Customer intercept survey (435 surveys in total collected) • Weekly attendance records
• Transaction records from wireless terminal
• Informal interviews with vendors

We accept Food Stamps Aceitamos “Food Stamps” (vales para comida) Se aceptan Cupones de Comida Nou aksepte “Food Stamps”

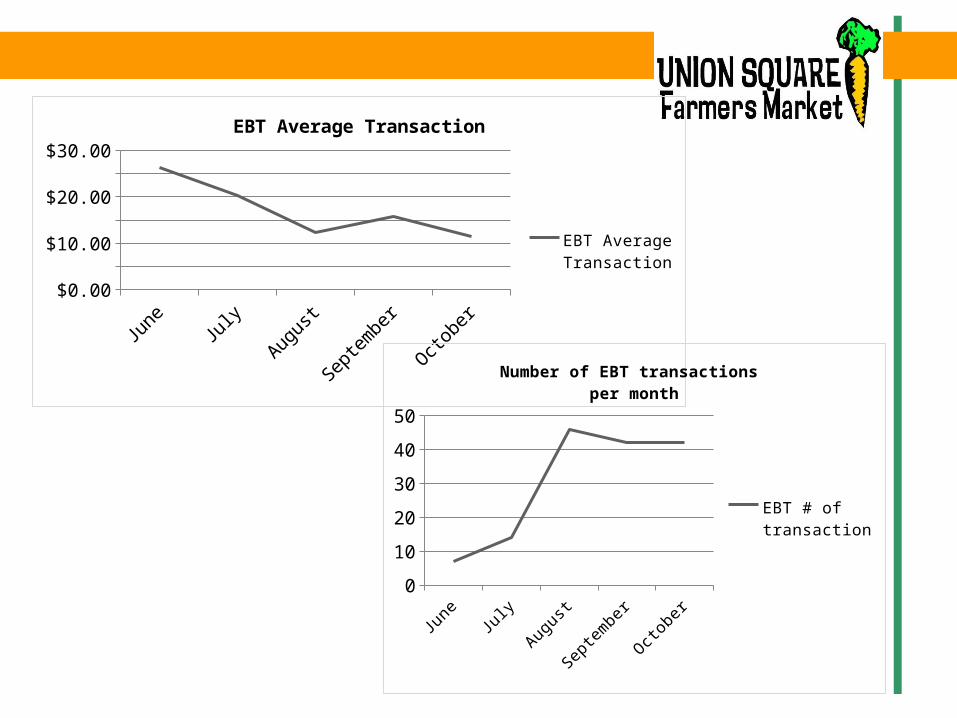
Wireless Terminal Transaction 2010 Market Season
Total Dollars spent by SNAP customers = $2,190
Total Dollars distributed in SNAP incentives = $1,237
Total Dollars spent by credit/debit customers = $8,354
Total amount all terminal market transactions = $10,544

Key Findings:
Six fold increase in EBT redemptions in 2010 compared to previous years when SNAP benefits were accepted at market.
June Ju
ly
Augus
t
Sept
embe
r
Octob
er$0.00$5.00
$10.00$15.00$20.00$25.00$30.00
EBT Average Transaction
EBT Average Transac-tion
June Ju
ly
Augus
t
Sept
embe
r
Octob
er0
10
20
30
40
50
Number of EBT transactions per month
EBT # of transac-tion
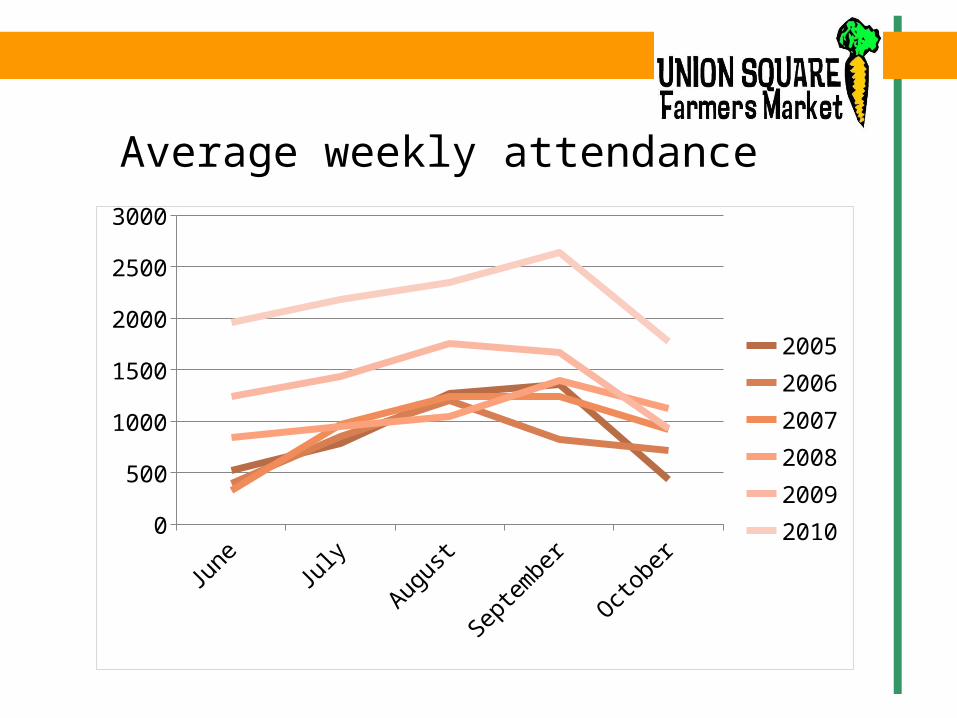
Average weekly attendance
June Ju
ly
Augu
st
Sept
embe
r
Octob
er0
500
1000
1500
2000
2500
3000
200520062007200820092010

Key Findings:
Weekly Market attendance has roughly doubled .

Residence Zip Code of Market Customers - 2010
02138021390214002141021430214402145Other
The geographic distribution of market customers has remained constant between 2005, 2006 and 2010 with just over half of customers from the immediate area of 02143. During this period, however, according to our survey the percentage of foreign born customers has decreased. In 2005 and 2006, USA was the country of origin for 79.8% of respondents. In 2010 that percentage increased to 90.6%.

Age of Market Customers (percentage of total)
15 to 19
20 to 24
25 to 34
35 to 44
45 to 54
55 to 59
60 to 64
65 to 74
75 to 84
85 +
0
5
10
15
20
25
30
35
40
2005 & 062010

Key Findings:
Four fold increase in market attendance among seniors.
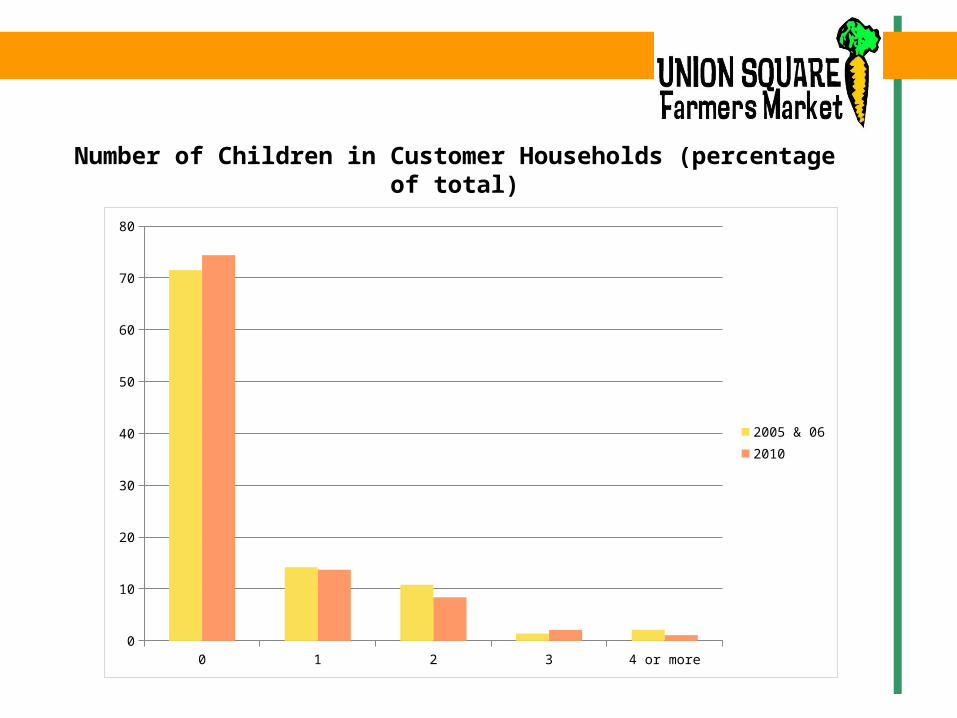
Number of Children in Customer Households (percentage of total)
0 1 2 3 4 or more0
10
20
30
40
50
60
70
80
2005 & 062010

Income Level of Market Customers
< $10k
$10k-
$19k
$20k-29k
$30k-
$39k
$40k-
$49k
$50k-
$59k
$60k-
$74k
$75k-
$99k
$100+
0
5
10
15
20
25
30
35
2005 & 062010

Frequency of Market Attendance (percentage of total)
First Time
Less than 1 x
month
Once a month
2 x month
3 x month
Every Week
0
5
10
15
20
25
30
35
40
45
50
2005&062010

Key Findings:
43% of customers report visiting the market every week.

Customer Reported Total Average Weekly Purchase
Noth-ing
$1-4 $5-9 $10-19
$20-29
$30-39
$40-49
$50-74
$75-99
$100+
0
5
10
15
20
25
30
35
40
45
2005 & 062010
Average weekly sales 2010 for all customers = $31.27 Self Reported data from survey Average weekly sales 2010 for card customers = $27.18 Obtained from terminal data

Key Findings:
Double the percentage of customers to 13% who spend more than $50 at the market each week.

Key Findings:
Vendors report that Union Square Farmers Market provides their highest gross sales and highest profit over any other farmers market.
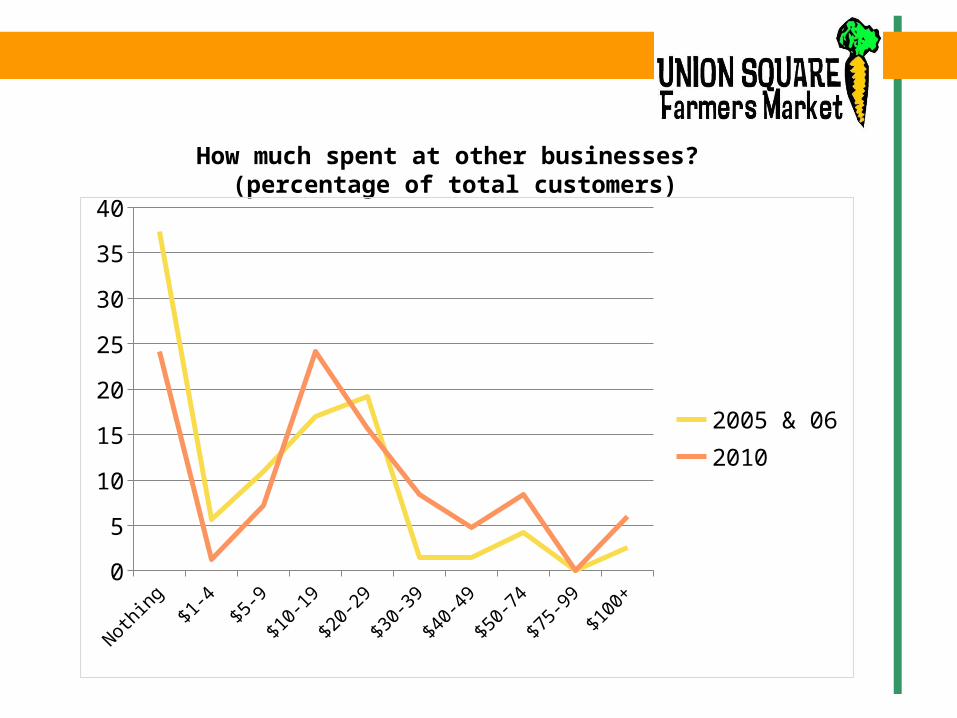
How much spent at other businesses? (percentage of total customers)
Nothing
$1-4 $5-9 $10-19
$20-29
$30-39
$40-49
$50-74
$75-99
$100+
0
5
10
15
20
25
30
35
40
2005 & 062010

In 2010 the direct economic impact of the Union Square Farmers Market for the season reached over $1.5M.

What makes the Union Square Farmers Market special?

Market is held on a pedestrian plaza with trees and seating
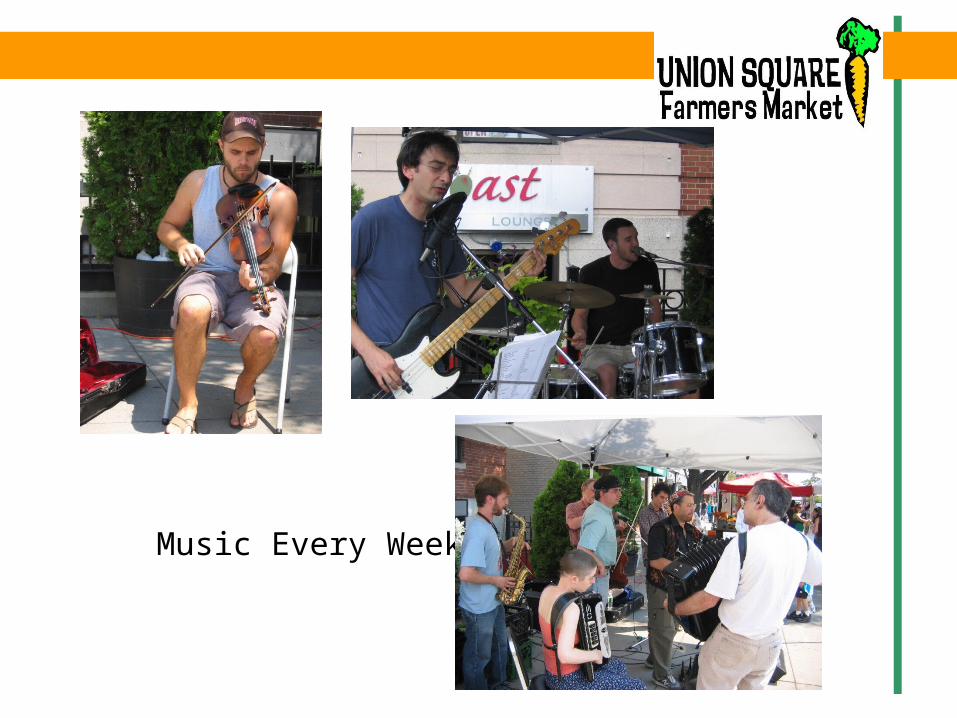
Music Every Week
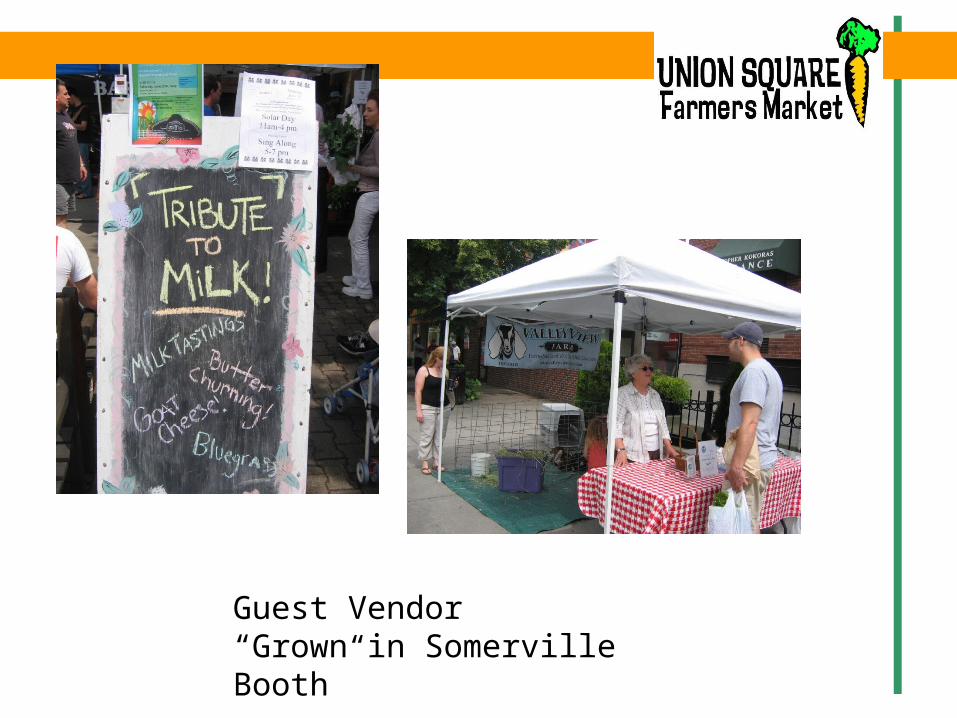
Guest Vendor “Grown in Somerville Booth”

Recipes and free samples

Educational programs

Promotion

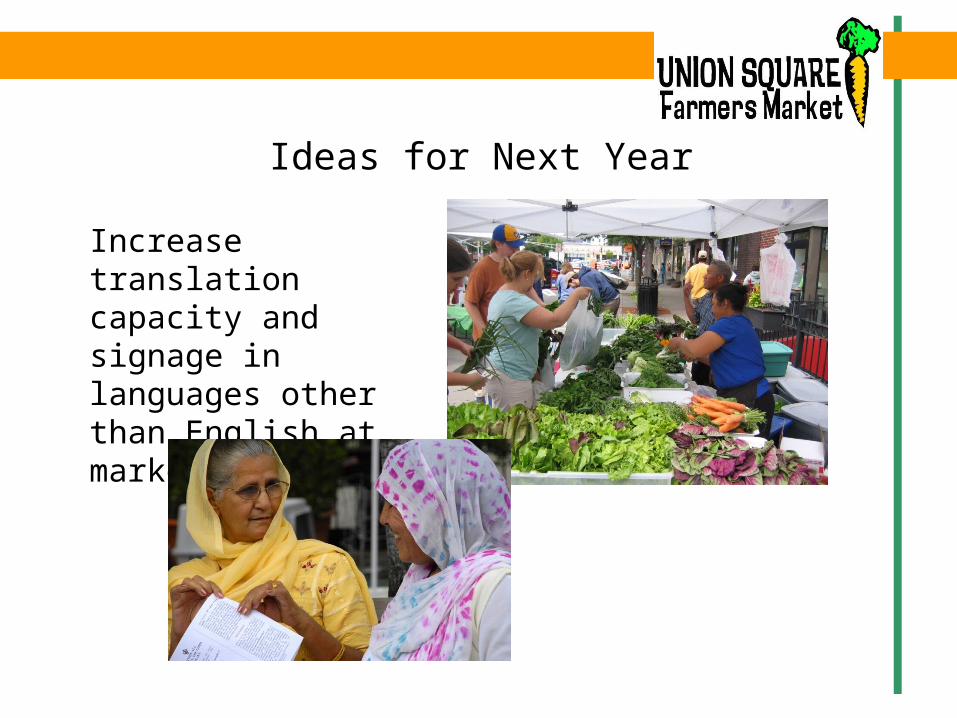
Ideas for Next Year
Create higher denomination coins ($5, $10)
Investigate partnership to share token system with other Somerville farmers markets
Ideas for Next Year
Increase translation capacity and signage in languages other than English at market

Ideas for Next Year
Increase use social media and internet promotion of the market
Perhaps a blog?

Top Related