


Languages
Pages
Legal


1
Understanding Urban Inequalities in Bangladesh:A prerequisite for achieving Vision 2021

2
3
Understanding Urban Inequalities in Bangladesh:A prerequisite for achieving Vision 2021
A study based on the results of the 2009 Multiple Indicator Cluster Survey
UNICEF Bangladesh
November 2010

4
AcknowledgementsThis paper was prepared by Dirk Westhof, demographer, with contributions from Carel de Rooy,
Siping Wang and Deqa Ibrahim Musa of UNICEF Bangladesh.
© United Nations Children’s Fund
(UNICEF), Bangladesh
All UNICEF materials are protected by
copyright, including text, photographs,
images and videotapes. Permission to
reproduce any part of this publication
must be requested from:
Planning, Monitoring and Evaluation Section
United Nations Children’s Fund
���������� ���
1, Minto Road, Dhaka-1000
Bangladesh
Telephone: 88 02 8852266
Email: [email protected]
Website: www.unicef.org.bd
The views expressed in this report are those
of the consultant and do not necessarily
represent those of UNICEF.
ISBN: 984-70292-0022-3
Cover Photo:UNICEF/2010/Ahsan Khan
Design & layout:Syed Makhlesur Rahman/UNICEF
Printing:Evergreen Printing & Packaging

5
Executive Summary Conventional wisdom in Bangladesh says that investing in urban
slums will attract more rural migrants. Bangladesh is not alone.
Brazil in the past adopted policies that discriminated against urban
settlements by the poor, but eventually changed course.
Ample evidence shows that people in Bangladesh migrate from
rural to urban areas in search of economic opportunities, not in
search of basic social services. Indeed, such services are mostly
nonexistent in slums, and when they are, they are provided mostly
through unscrupulous middlemen using exploitative means – at an
extremely high cost to slum dwellers. Data from the 2009 Multiple
Indicator Cluster Survey (MICS) in Bangladesh make it clear that
conditions in slum areas are much worse than those in most rural
areas, even in regard to service delivery-type indicators such as
secondary education attendance rates and skilled attendance at
birth.
The natural trend towards urbanization cannot simply be halted or reversed. In fact, it is
an important aspect of the country’s development process and inherent to its evolution
from a low income country to a middle-income country. It is also fundamental to the
realization of “Vision 2021”, which foresees economic growth that provides an average
per capita income of USD2,000 a year.
Taking its cue from other countries, Bangladesh should consider this as a positive trend
and act proactively by developing a socially inclusive urban development strategy in its
sixth Five-Year National Development Plan. This would enable a rapidly growing slum
population to more effectively contribute to the acceleration of economic growth and
poverty reduction, instead of becoming an ever-increasing burden and obstacle to the
development.
Evidence from India, China and Brazil indicates very clearly that efforts to ease
inequalities generate larger dividends for poverty reduction than a more conventional
focus on economic growth. It is time to accept this new paradigm and start to invest in
human capital development in the slums of Bangladesh.
© U
NIC
EF
/2010/A
hsa
n K
han

6
Introduction This report challenges the widely held belief that the situation of
urban dwellers in Bangladesh is generally better than those living
in rural areas. In fact, data drawn from a 2009 Multiple Indicator
Cluster Study (MICS) clearly show that living conditions in urban
slums are often appalling and, in fact, much worse than those in
most rural areas.
�������������������������� ��������������������������
development strategy, since, historically, most development
programmes in Bangladesh have focused on rural areas. Evidence
from countries including Brazil, China and India show that
reducing inequalities yields larger dividends for poverty reduction
than a more conventional focus on economic growth, and is a
��������� ���������������������!���"�
���������������������������������������������������!���
development. Dhaka is one of the fastest growing mega-cities in the world, with slum
populations seemingly outpacing the growth of other urban areas. Still, the country has no
comprehensive policy on urbanization or urban poverty reduction.
In the past it was widely believed that people migrated to the cities in search of better
services. In fact, when asked about their reasons for migrating, most Bangladeshis cite
economic factors.1 And the areas in which migrants initially choose to settle – slums –
are those with the lowest levels of services. Denying basic services to slum dwellers,
������#�������!�$������������ ������������������������%��!��� ��������"2
1 World Bank, ‘Improving Living Conditions for the Urban Poor’, Dhaka, June 2007.2 See: Martine, George and Gordon McGranahan, ‘Brazil’s Early Urban Transition: What can it teach other urbanizing
countries?’, International Institute for Environment and Development and United Nations Population Fund, August 2010.
© U
NIC
EF
/2009/S
heh
zad N
oora
ni

7
The Current Study Several studies have been undertaken on the situation of the urban
poor in Bangladesh. These studies generally focused on the poorest
20 per cent of the urban population, rather than the situation of
��� ����������������"���������������#�!�������'*�������#�
reveals large inequalities between slum and other populations –
both urban and rural. The picture that results is sobering.
The data in this report are drawn from slums areas in four large
cities (Dhaka, Chittagong, Khulna and Rajshahi), involving 134
clusters of 20 households each. The report looks at several social
indicators and compares them with those of people living in non-
slum urban and rural areas.
Background
Bangladesh is the most densely populated country in the world
(excluding some city-states), with an average of 1,050 people per square kilometre in
2005 (in contrast, the Netherlands has almost 400 people per square kilometre, and
Brazil, 20). The 2009 MICS data showed that, in contrast to most countries, differences
in coverage in social services are unusually small between urban and rural areas in
Bangladesh, and for many indicators they are non-existent. However, when statistics
for slum dwellers and other populations are disaggregated out, the situation changes
dramatically.
For example, while the national average for net attendance in secondary education is 49
per cent (48 per cent in rural areas and 53 per cent in urban areas), it is only 18 per cent
in urban slums. The situation is similar for most other social indicators, including skilled
�����������!����#��������� ���������+����������������!������������������#������
better-off urban areas outperforming them both. Net attendance in secondary education
is 64 per cent in Khulna City Corporation, for example, and just 14 per cent in Dhaka’s
slums. Despite their proximity to metropolitan areas where such services are available,
access for slum dwellers is denied.
Some improvements in the social sector have been made since the 2006 MICS. However,
when it comes to meeting the Millennium Development Goal targets, slums are
����� �������������������������� ���������������;���!���������������������!%�������#�
or upazila, levels).
The fact that parts of cities (in this case, city corporations) are in a privileged position is
���!�����"�<����#������������������� ������ ������������������ ������������
a new one for Bangladesh. Normally, based on physical proximity alone, slum dwellers
should have greater access to basic social services than isolated rural areas. But this is not
the case in Bangladesh.
© U
NIC
EF
/2009/K
iron

8
Key concepts
Rapid urbanization
=���������!���������������������������������������>��!����������������#����
is readily apparent that the country is experiencing one of the most rapid urbanization
����������O���#���� ������� ����������� ������������Q�+����������"�'�����������
agree that urban populations in Bangladesh have grown from 5 per cent in 1971 to a 27
per cent in 2008,3 suggesting that approximately 41 million people are currently living in
urban areas. Nevertheless, Bangladesh remains a mostly agrarian country. The consensus
estimate is that the urban population will reach 50 million in 2015, representing just less
than a third (30 per cent) of the total population.
The contribution of the urban sector to the national gross domestic product (GDP) has
also increased rapidly, from 26 per cent of GDP in 1972 to more than 50 per cent by
2005.4 In 2000, industry represented 20 per cent of all employment in Dhaka; half of
that was in the garment industry. Twenty eight per cent of female employment is in the
garment industry;5 this in itself is an important factor in female empowerment.
Urban populations
�������������������� �>��!�������������������������+�����������"����Z��������
Participation Research Centre (PPRC)6#�����$�����������������������������������
involves a particular population density per square kilometre, a set minimum population
size, and over 50 per cent of the labour force in non-agricultural occupations.
��������������������>��!������������������������������������!�������������������
size:
�� Mega-city (Dhaka): A statistical metropolitan area (SMA) with more than 5 million
inhabitants. The population of Dhaka was estimated at 10.7 million in 2001
�� A statistical metropolitan area: A city corporation and adjacent areas having urban
characteristics (Chittagong, Khulna and Rajshahi)
�� Municipality (pourashava): Area declared by the Local Government Division of
Ministry of Local Government, Rural Development and Co-operatives.
�� Other urban areas: Subdistrict (upazila) headquarters with urban characteristics.
An increase in the number of urban centres has occurred mainly as a result of the
��������������������"
During the current decade, the number of pourashavas jumped from 213 in 2001 to 309
���\]]^"������������������!������������������������pourashava; this is up to local
governments that might seek (or not seek) an enhanced status.
���\]]^�'*�����������������������!������������������������_�`{� �����������#�
2) city corporations (non-slum areas) and 3) slums. The non-city corporation areas were
excluded from the urban category and, for this reason, the proportion of the ‘urban’
3 Tavares-Goodman, Nadia, ‘Review of UNICEF Interventions in the Urban Sector and Potential Future Interventions’, UNICEF Bangladesh, February 2010.4 Ibid. 5 Islam and Mustafa, ‘Poverty Impact Assessment’, January 2006, UNDP.6 Power and Participation Research Centre, June 2010.

9
population as a share of the total population in the sampling framework is 20 per cent and
not 27 per cent.
The ‘slums’ sample frame was the same as for the 2006 MICS and was based on the 2006
World Food Programme report, ‘Study of Household Food Security in Urban Slum Areas
of Bangladesh’. For the 2009 MICS, 134 clusters (probability proportional to size) in the
slums were visited. In each cluster, at least 20 households were interviewed.
Slums7
According to the 2005 Census of Urban Slums, the total slum population in the six largest
cities of Bangladesh was 5.4 million compared to a total urban population of roughly
15.6 million. However, there is no typical slum; the differences among such settlements
���!����������������������� ��������"�*��������������������������������������
are poor live in slums.8 Some estimates of the total slum population in 2010 are as high
as 10 million. On the other hand, a World Bank study counted 1,925 slums in Dhaka
comprising 275,000 households (1.5 million people). Because of several uncertainties, it
is preferable to deal in ranges. The population of slums in 2008 was estimated at between
six and seven million people, 30 per cent of the metropolitan population and about 15 per
cent of the overall urban population. In other words, the population of slums is about 5
per cent of the total population or about 7 million people in 2010.
Characteristics of slums (from the 2005 Census of Urban Slums):
�� Predominantly poor housing
�� Very high population density and room crowding (more than 1,000 persons per acre)
�� Very poor environmental services
�� Very low socio-economic status for the majority of residents
�� Lack of security of tenure (permanent threat of eviction)
�� Poor governance.9
7 This report uses the term ‘slum’ for what can also be termed as ‘informal settlement’, ‘squatter settlement’, ‘pavement dwellings’ and ‘shanties’.8 Power and Participation Research Centre, June 2010.9 Tavares-Goodman, February 2010.
Urban slums in Bangladesh grew much faster than the overall rate of urbanization. In most cases, slums lack even the most basic amenities associated with urban life, such as running water, sewage systems, latrines, waste disposal services and electricity. Slum dwellers also have restricted access to basic social services, such as health clinics and schools.9 ©
UN
ICE
F/2
010/A
hsa
n K
han

10
Migration
Migration is the main driver of urban growth. The main reasons for migration are:
�� Economic; ‘push and pull factors’ (55 per cent)
�� Environmental; mostly river erosion (27 per cent)
�� |� ����;���{�����������"10 (10 per cent)
Migration is fuelled by extreme rural poverty, landlessness and large urban-rural wage
�����������"�'��������Q�+���������������������������������� ����������������_����
search of jobs (employment in services and industry) and better lives.11
Migrants normally end up in illegal settlements on precarious land with major
environmental problems. These areas have few – usually low-quality – services, and rents
offered are at high prices through middlemen (mastaans) effectively and conveniently
positioned between huge demand for and limited offer of basic services. Slum evictions
are a constant threat and occur without a clear resettlement plan.
A vicious circle
Lack of tenure security is a key characteristic of informal urban settlements. Informal
settlements are thus deprived of support and services from the formal public and non-
public sectors. Some support comes from non-governmental organizations (NGOs)
and the United Nations, but these agencies allocate the majority of funding for poverty
alleviation to rural areas.
The insecurity of tenure and its implicit potential for politicization serve as deterrents
when it comes to allocating funds for the urban poor (even for the Grameen Bank).
The government perceives that granting tenure security would encourage more settlers
and induce migration from rural areas. Thus, the lack of secure tenure perpetuates the
downward spiral of poverty in slum areas.12
10 Power and Participation Research Centre, June 2010.11 World Bank, June 2007. 12 Ahmed, K. Iftekhar: ‘Urban Poor Housing in Bangladesh and Potential Role of Asian Coalition for Housing Rights’
(ACHR), May 2007, ACHR.
The level of services provided in slums is much lower than in most rural areas. Access to better services is almost never given as a reason for migration.
© U
NIC
EF
/2009/S
heh
zad N
oora
ni

11
Analysis of Data Urban-rural differentials
����������������� ��������������������������������countries
������������������ ������������������!�����������������%��� ��������������
(U5MR) among selected Asian countries, as shown in Table 1.
Table 1:
}�!��%�����������������������������%��� ���������
in selected Asian countries
Per 1,000 live births Ranked by differences
Total
U5MR
Urban
U5MR
Rural
U5MR
Rural % higher
Bangladesh (2007) 74 63 77 22%
Bangladesh (2009) 64 53 66 25%
Pakistan (2007 93 78 100 28%
Cambodia (2005) 106 76 111 46%
India (2007) 74 52 82 58%
Indonesia (2007) 51 38 60 58%
Philippines (2008) 37 28 46 64%
Nepal (2006) 79 47 84 79%
Based upon DHS Stat-compiler and Bangladesh MICS 2009
According to a recent publication “Achieving the MDG’s with Equity” the ratio of the
����%��� ������������#�����������������!�����������`"��������������������������
countries and also in South Asia.
������������������ �������������!������!�����������������%��� ���������
rates (U5MR) among selected Asian countries, as shown in Table 1. Rural U5MR is 25%
higher, a ratio of U5MR , rural areas to urban areas, is therefore of 1.25.
������������������������������������������������� rural areas
The same relationship between urban and rural area is found for Bangladesh when a
composite deprivation index (CDI)13 is used (Table 2).
13 Composite deprivation index, based upon four indicators: net attendance ratio in secondary school, sanitation coverage,
adult literacy and skilled attendance at birth.

12
Table 2:
Comparisons of urban and rural areas by ranking in the composite deprivation index
Total CDI Urban CDI Rural CDI Rural % higher:
Bangladesh 55 45 58 29%
Urban-rural differences for MICS 2009 indicators
When analysing the components of the CDI, the most obvious observation is the
absence of any difference between urban and rural areas in access to improved sanitation
;���������������������������!������<��}�*��|�������'����������Z����� ����
Water Supply and Sanitation). This is due to the widespread use of shared facilities in
urban areas, which is considered ‘unimproved’ sanitation according to the JMP . Other
components of the CDI show substantial differences in relation to indicators such as
�+����������������!���������������"�<����#����������������������������������
differences for many indicators between urban and rural areas
Table 3:
Urban-rural differences using MICS 2009 indicators for Bangladesh
Indicator Urban Rural
Skilled attendant at birth 45% 19%
Adult literacy (Women aged 15-49 years) 66% 48%
Net attendance ratio in secondary education 53% 48%
Gender parity index in secondary education 1.08 1.18
Comprehensive correct knowledge on HIV and AIDS 18% 13%
Youth literacy (Women aged 15-24 years) 77% 70%
Table 4:
Urban-rural similarities using MICS 2009 indicators for Bangladesh
Indicator Urban Rural
Population using an improved sanitation facility 54% 54%
Breastfeeding within one hour of birth 50% 50%
Net attendence ratio in primary education 84% 81%
Gender parity in primary education 1.01 1.03
Net attendence ratio in secondary education - women 55% 52%
Drop out in primary education 1.2% 1.2%
Drop out in secondary education 3.5% 3.4%
Repetition rate in primary education 5% 5%
Access to improved drinking water 99% 97%
Birth registration 53% 54%
Child labor 3% 2%

13
This study suggests that urban-rural comparisons obscure the severe deprivation in
urban slum areas and that the extent of deprivation in the latter partly explains why only
minimal statistical differences exist between urban and rural areas.
Social indicators performance in slums
Social indicators from MICS 2009
Slums have the worst indicator values of all surveyed areas, sometimes dramatically so.
Table 5 presents an overview.
Table 5:
Urban, rural and slum values for 12 indicators of the 2009 MICS in Bangladesh
Indicator Urban Rural Slum Slum worse
than rural %
U5MR (per 1,000 live births) 53 66 95 44%
Skilled attendent at birth 45% 19% 15% -21%
Population using an improved sanitation
facility
54% 54% 9% -83%
Net attendence ratio in pre-school
education
26% 22% 13% -41%
Net attendence ratio in primary education 84% 81% 65% -20%
Pupils starting Grade 1 who reach Grade 5 80% 80% 48% -40%
Drop out in primary education 1% 1% 8% 700%
Net attendence ratio in secondary
education
53% 48% 18% -63%
Youth literacy (women aged 15-24 years) 77% 70% 51% -27%
Adult literacy (women aged 15-49 years) 66% 48% 35% -27%
Gender parity index in secondary
education
1.08 1.18 1.26 7%
Birth registration 53% 54% 28% -48%
While the national average for net attendance in secondary education is 49 per cent (48
per cent in rural areas and 53 per cent in urban areas), it is only 18 per cent in slums.
Even an indicator such as initial breastfeeding (which shows no difference by geographic
area or the education level of the mother, and is 50 per cent in both urban and rural areas),
is lowest in slums (35 per cent). In addition:
�� Slums have very high rates of school dropout and repetition, and an extremely poor
ratio for gender parity in secondary school.
�� Slums have three times more child labour (13 per cent, according to MICS 2006),
than the national average.
�� Slums have half the rate of birth registrations and half the rate of knowledge of HIV
as compared to the national average.
14
*����� �#��� ��������������������������������������������;���{�� !������
produce an environment of extreme deprivation and violation of basic rights.14
The MICS data correspond to those of the World Bank report:15 Access to schools and
health clinics is limited for the poor. Only 7.3 per cent of slums have a public health clinic
and only 26 per cent have a government school. In the absence of public providers, some
NGOs operate clinics and/or primary schools.
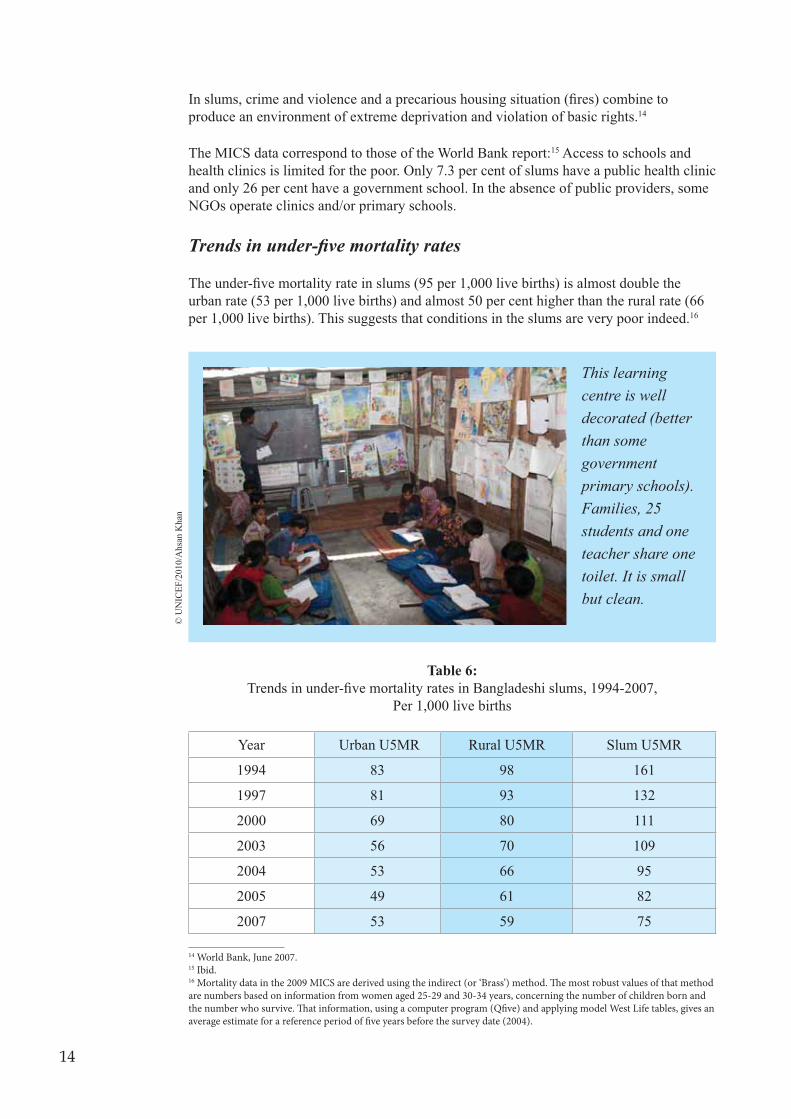
������������ ����������������
�������%��� ������������������� ��;^�����`#]]]�����!�����{������ �������!�����
urban rate (53 per 1,000 live births) and almost 50 per cent higher than the rural rate (66
per 1,000 live births). This suggests that conditions in the slums are very poor indeed.16
Table 6:
�������������%��� ������������������������������� �#�`^^�%\]]�#�
Per 1,000 live births
Year Urban U5MR Rural U5MR Slum U5MR
1994 83 98 161
1997 81 93 132
2000 69 80 111
2003 56 70 109
2004 53 66 95
2005 49 61 82
2007 53 59 75
14 World Bank, June 2007.15 Ibid.16 Mortality data in the 2009 MICS are derived using the indirect (or ‘Brass’) method. The most robust values of that method are numbers based on information from women aged 25-29 and 30-34 years, concerning the number of children born and the number who survive. That information, using a computer program (Qfive) and applying model West Life tables, gives an average estimate for a reference period of five years before the survey date (2004).
This learning centre is well decorated (better than some government primary schools).Families, 25 students and one teacher share one toilet. It is small but clean.
© U
NIC
EF
/2010/A
hsa
n K
han

15
Figure 1:
}���%��� �������������������!��#�������������� ������������������#�
1994-2005
Several observations can be made from the data in Figure 1. First, it is apparent that urban
��������������%��� �������������� ��������������"�����#����}�'�������� ������
stagnant at the beginning of the millennium, but has recently improved. Third, U5MR in
slums has declined considerably over time, from 161 per 1,000 live births in 1994 to 82
per 1,000 live births in 2005. This implies that U5MR in slums was halved in 11 years.
This trend, however, must be treated with caution, keeping in mind the scale of rural to
urban migration over this period.
Trends in selected social indicators, 2006 and 2009
The 2006 and 2009 MICS allowed for an analysis of development over time for some
indicators:
Table 7:
Trend in net attendance ratio in primary school, 2006 and 2009
2006 2009
Urban 80.9% 83.9%
Rural 81.5% 80.8%
Slums 52.3% 65.1%
The data show that progress has been achieved in urban areas in terms of net attendance
in primary school and that slums are catching up. For the poor, education costs can
be prohibitive and there is little evidence that the state/government is investing in
human capital (the development of slum dwellers) to boost overall social and economic
development. The credit for this goes mainly to Bangladeshi NGOs who have stepped in
and done a remarkable job.

16
���������������������Q�����������������������#���������������!���"
Table 8:
Trend in female youth literacy, 2006 and 2009
2006 2009
Total 70.0% 72.0%
Urban 75.0% 77.0%
Rural 68.0% 70.0%
Slums 38.0% 52.0%
O���������������������� ����� ������Q������!�+���������� �������� �����������
situation in slums, but in Bangladesh it can be a combination of both factors. The poorest
of the poor usually end up in slums, but the slums also offer few opportunities to address
basic social-service deprivation.
Progress in health is lagging in slum areas.
Table 9:
Trend in skilled birth attendance, 2006 and 2009
2006 2009
Total 20.1% 24.4%
Urban 38.0% 45.0%
Rural 14.0% 19.0%
Slums 11.5% 15.0%
In many cases, economic growth has been accompanied by increased inequality, complicating the challenge of poverty reduction. High levels of inequality could undermine growth.
Policy makers should pay particular attention to income inequality, both for its own sake �������������� ��������������the “poverty reduction dividend” of growth. Social policy can be a powerful means by which to limit inequality in outcomes. (OECD 2010)©
UN
ICE
F/2
009/H
abib
ul
Haq
ue

17
The proportion of births attended by a skilled health worker is low, although this result
��� ��+��!�������������������������������������������"������� �����������������
the slums (no doctors and nurses), but several health posts run by the Bangladesh Rural
Advancement Committee (BRAC) are presently staffed with trained community health
workers.
Table 10:
Trends in birth registration, 2006 and 2009
2006 2009
Total 10% 54%
Slums 5% 28%
�����!����������������������������� ������������������!����\]]������\]]^�
(thanks in part to a nationwide campaign), coverage in the slums remains half the national
����"�
However, for several important indicators (except skilled attendance at birth), we see that,
even in the slums, some improvements are under way.
There are three maternal health-care centres supervised by BRAC in the Korail slum in Dhaka. The traditional birth attendant there reported about 20 births per month. She attended a 15-day initial training two years ago and attends a three-day refresher course every three months. She regularly receives delivery kits from BRAC. For pregnancies with potential risk, she refers the mother to the BRAC hospital. In the above photo, she demonstrates how she assists in a delivery. After a normal delivery, the mother and baby will stay in the centre for about six hours before returning home.
© U
NIC
EF
/2010/A
hsa
n K
han

18
The statistics in Bangladesh suggest that urban slums are extremely marginalized, much
more so than in other countries where slums still outperform rural areas in service
delivery.
Why coverage of basic social services in slums is low
The provision of social services in burgeoning urban areas is an enormous challenge in
light of rapid population growth and limited physical space.
The absence of legal rights to land and threats of eviction also account for the absence
of formal service provision. As a result, a parallel structure has emerged where free
education and health is delivered through NGOs and where mastaans (middlemen) are
providing other services (albeit illegally and for a high fee).
Thus, there are three major constraints when it comes to providing services in slums:
�� The absence of an inclusive governmental urban development policy giving slum
dwellers basic rights and access to social services
�� The repeated eviction – or permanent threat of eviction – of slum residents
�� The role of mastaans in the absence of formal government structures.
Access to health, education, power, water supply, sanitation and waste management is
very limited for the urban poor. Where those services do exist, quality is low and the cost
���!������!����"�����������������������������������!�������������!���������������
meet the basic needs of this vulnerable portion of the population17. An inclusive policy
framework for urbanization would be most helpful18.
According to the World Bank, two common perspectives among policy makers affect
decision-making with regard to the urban poor:
�� First, it is assumed that providing access to basic services will result in increased
rural-urban migration.
�� Second, it is generally thought that the urban population is better off than the rural
population. Consequently, until recently, slums have received little attention from
donors, NGOs and government agencies.
The World Bank offers a number of reasons why slum populations have less access to
education:
�� Inadequate or absent school facilities
�� Distance to school
�� High costs
�� Problems getting children admitted
�� Duties in caring for younger siblings
�� Slum evictions
�� High opportunity cost of education.
17 Ahmed, K. Iftekhar, May 2007.18 Islam and Mustafa, January 2006.

19
The discrepancy between attendance in primary and secondary schools is extremely large in slums. There are no informal schools at the secondary level, and in a slum such as Korail, only 7 out of 50 children can continue on to secondary school. The story of Manzil, who graduated from a learning centre but had to assist her father in managing his small shop in Korail, is typical of the plight of many slum children. Moreover, informal learning centres apply tough rules for continued access. Buni, a young girl living in Korail, was expelled from the centre since she could not regularly attend class. The reason for the low use of health services is that hospitals and clinics are typically not located close to slum areas and the waiting line is extremely long. Slum dwellers feel deprived and ‘free’ services often carry hidden costs.
The pervasive role of mastaans is related to party politics as they are the ones that
‘deliver the voters’. Thus, in Bangladesh, the lack of a government policy does not
necessarily harm politics but can, as in other countries, support political parties. With the
threat of eviction ever present, people are effectively held hostage by the mastaans and
broader interests.
Two urban realities
The data show that when four individual city slum populations and six city corporation
populations are included in the analysis and ranked by means of the composite
deprivation index, all the slums fall into the ‘most deprived’ category, with Dhaka slums
being one of the ten worst-performing geographic areas. All city corporations were in the
top 35 best-performing areas, a graphic illustration of the fact that urban areas include
two completely separate realities. Slums are generally performing worse than rural areas,
but a few upazilas have even lower social indicators than the slums.

20
Equitable UrbanizationThere is no doubt that economic growth is necessary for improving human development
in terms of reducing poverty and increasing the availability of resources for investment
(Anand and Ravallion. 1993). Bangladesh’s performance in this respect has been
� ������������������#�!����������� ��� ����������������;������ ��
inequality) has been rising as shown in Figure 2.
Figure 2:
Gini index trend in Bangladesh, 1990-2005
Source: Household Income and Expenditure Survey 2000 and 2005
The experience from Brazil, China and India has shown that poverty reduction is more
dependent on inequality reduction than economic growth (Ravallion. 2010) and thus,
perhaps Bangladesh can afford to grow at a slower economic pace while effectively
�������������������"�=������������������������=Z��������������������!����������
����*����#����������������������������������������=Z���������������������!�����
times higher than that of China and 11 times higher than that of India as shown in Tables
11 and 12 (Ibid).
Table 11:
Growth rates in Brazil, China and India: 1981 - 2005
Brazil China India
GDP per capita (%) 0.8 8.8 3.9
Table 12:
Poverty reduction rates in Brazil, China and India: 1981 - 2005
Brazil China India
Poverty reduction (%) 3.2 6.6 1.5

21
According to Ravallion (2010), the reason for Brazil’s better performance is to do with a
��������������������������������������������� ������������������*�����;��!��
13) during their respective reform periods (1993-2005 for Brazil and India; and 1981-
2005 for China).
Table 13:
Gini index trends in Brazil, China and India: 1993 and 2005
Brazil China India
1993 2005 1993 2005 1993 2005
Gini index (%) 59.7 57.6 35.5 41.5 30.8 33.4
In 2010, the estimated per capita income in Bangladesh was USD750 per year.19 Given
that the estimated population of Bangladesh is approximately 150 million, GDP amounts
to some USD112.5 billion.
The current estimated urban population as a share of the total population is 27 per cent
(2008), or 41 million people. It is estimated that 50 per cent of GDP is contributed by
those who live in urban areas.20 This amounts to USD56.3 billion or USD1,370 per capita/
year.
Assuming a current average annual income of USD750 per capita for slum dwellers and
given that the latter comprise approximately 18 per cent of the urban population, this
implies some 7.3 million people contributing in the order of USD 5.5 billion annually to
the GDP.
The non-slum urban population comprise approximately 33.2 million and contribute some
USD 46.1 billion annually to the GDP (USD1,390 per capita/year).
The rural population is currently earning about USD515 per capita annually (USD56.3
billion/109.5 million people), and will have to quadruple its income during the next
decade to achieve the “Vision 2021”21 average annual income of USD2000 per capita.
It will not be easy to materialize this objective. Nor will it be easy for the urban slum
dwellers to almost triple their income over the same period.
19 Bangladesh Economic Review, 2010, available online at <www.mof.gov.bd/en/>, accessed 23 November 2010.20 Ahmed, K. Iftekhar, May 2007.21 The Awami League political platform and also the basis for the “Perspective Plan 2021” as well as the sixth Five-Year National Development Plan currently being developed by the Government of Bangladesh.

22
Conclusion and Policy Implications This challenge calls for serious urban development, not just in the
six city corporations but also in at least some selected
municipalities. Much greater decentralization of urban growth,
����������������������������������������������������
selected municipalities may have to be considered to move
industries (and jobs) to rural areas. Adequate infrastructure
investments and development, particularly outside the major cities,
as well as an inclusive strategy for urban slum dwellers is needed.
“Vision 2021” targets may not be met if the disparities between
slum dwellers and the non-slum dwellers living in cities are
allowed to follow the current trend and continue to increase.
Such a development is undesirable, not only from a human rights
perspective, but also because it could lead to social unrest. It is,
therefore, critically necessary to incorporate slum-dwellers into
urban development strategies.
Slum dwellers are hardworking people that moved to the cities in search of a better life. They did not move to cities because of better services. Their children – as all children in Bangladesh – have the right to be treated as ������������������������� ������ ���������� ��� ������������������� �education, water, sanitation and health services to all urban slum dwellers.
There is simply no way to halt or reverse the natural trend towards urbanization. This
���������+���������������� ������������������ �+�����������������������"�
Urbanization will continue to occur as more people reach middle-income status.
Furthermore, urbanization is necessary to the realization of “Vision 2021”. Taking lessons
from other countries, such as Brazil,22 Bangladesh should consider this trend as positive
and act proactively so that the large productive population living in slums can better
contribute towards the acceleration of economic growth – instead of becoming a social
and economic burden.
*����������������� ������������������������������� ������������������ ���
development investments in slums will act as a pull factor for urbanization, the sixth
Five-Year National Development Plan could simultaneously incorporate a socio-
economically inclusive urban development strategy along with substantially improved
targeting of human development and economic opportunities towards the most deprived
rural districts and upazilas. Such a holistic approach would assist Bangladesh in
achieving the Millennium Development Goals with equity as well as the realization of
“Vision 2021”.
22 See: Martine and McGranahan, August 2010.
©U
NIC
EF
/2009/S
heh
zad N
oora
ni

23

24
United Nations Children’s Fund
���������� ���
1, Minto Road, Dhaka-1000
Bangladesh
Telephone: 88 02 8852266
Email: [email protected]
Website: www.unicef.org.bd
ISBN: 984-70292-0022-3
Top Related