


Languages
Pages
Legal


© 2013 NewsCred NewsCred.com l (212) 989-4100 l [email protected]
The
Ultimate Guide
to Content
Marketing ROI

Filling the Funnel:
Aligning with the Sales
Conversion Funnel
Working Backwards:
Forecasting ROI to
Plan Your Budget
Choosing the Right Tools
Begin with the End In Mind:
A Deep Dive Into KPIs
Content Marketing: Uniting
a Brand’s Left & Right Brain
Table of Contents
01
02
03
04
05
Why Read This Guide?
You need a process and analytical framework to support your
content strategy and tie it to your company’s bottom line. Building
your content strategy around your key performance indicators (KPIs)
before you dive into content production, will build greater credibility
and focus amongst all team members.
This guide will teach you how to measure your content program’s
full return on investment. You’ll be able to:
» Determine which KPIs will indicate growth for your business
» Forecast how much budget is needed to meet your marketing goals
» Align brand and lead generating activities to your business goals
» Report the progress (and success!) of your marketing programs
Reporting is a lot like telling a story. You need to illustrate trends,
explain methodologies, and present information in a logical way.
In addition, your story (results) should inspire your audiences to take
action on your findings – increase budget for email marketing, zero
in on advertising to your Facebook audience, or create additional
customer service channels.

© 2013 NewsCred 3
Content Marketing: Uniting a Brand’s Left & Right Brain
Content marketing is a discipline where art meets science.
In response to strong consumer demand for informative,
high-utility content, brands are launching newsrooms to
produce original content and license timely relevant stories
from top publishers. Why? Content marketing has the potential
to generate significant ROI for your business – through new
leads with intent to purchase and upsell opportunities.
Engaging videos, blog posts, infographics, and multimedia
comprise the creative, artistic side of content marketing.
But what about the science?
The process of quantifying your content marketing e!orts can
seem daunting to a creative types, especially if you’re not regularly
using spreadsheets and forecasting tools. Even if your content
goes viral, your CMO, CEO, and CFO will want to see results in
terms of cost, revenue, and margins.

© 2013 NewsCred 4
01 Begin with the End in Mind: A Deep Dive into KPIs
Success in content marketing doesn’t happen
overnight. If you want to delight, engage, and
connect with your audiences, you need to
produce high-value material.
Be careful with the KPIs that you choose to
highlight. Particularly with content marketing,
you have seemingly infinite metrics to choose
from – some of which are better indicators
of business growth than others. If you’re not
selective, your organization will find itself buried
in an unmanageable data dump, or celebrating
the success of content that didn’t return
monetary value to your company.
Begin with the End in Mind:
A Deep Dive Into KPIs.
Content marketing KPIs are a direct reflection
of your company’s conversion funnel. Metrics
should track a lead’s movement through the
funnel by answering the following questions:
» How e!ective is your content in
exposing new prospects to your brand?
» How e!ective is your content in building
interest and engagement with your brand?
» To what extent does your content inspire
customers to do business with you?
» Overall, how e!ective is your content
strategy in driving revenue?
Metrics like brand awareness, page impressions,
and search ranks need to sync up with
bottom-line concepts like costs, revenue,
profits, and pipeline. The following framework
will help you connect the dots.
© 2013 NewsCred 5
01 Begin with the End in Mind: A Deep Dive into KPIs
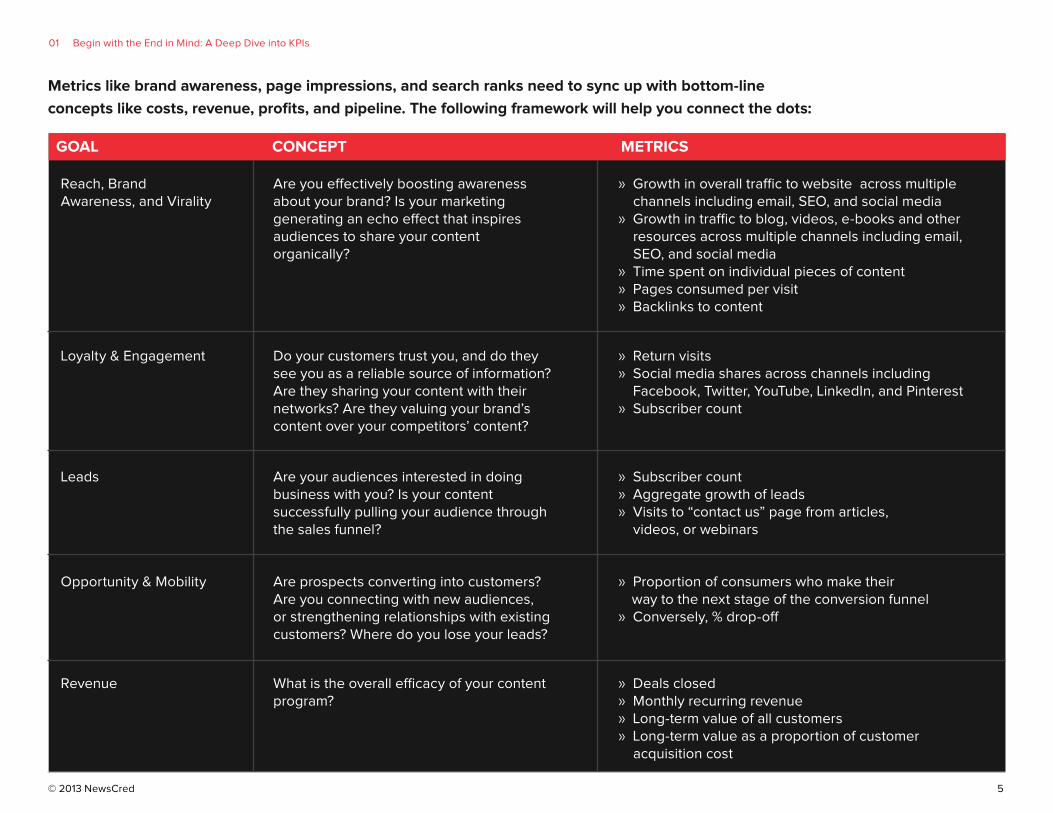
Metrics like brand awareness, page impressions, and search ranks need to sync up with bottom-line
concepts like costs, revenue, profits, and pipeline. The following framework will help you connect the dots:
GOAL CONCEPT METRICS
Reach, Brand Awareness, and Virality
Loyalty & Engagement
Leads
Opportunity & Mobility
Revenue
Are you e!ectively boosting awareness about your brand? Is your marketing generating an echo e!ect that inspires audiences to share your content organically?
» Growth in overall tra"c to website across multiple channels including email, SEO, and social media
» Growth in tra"c to blog, videos, e-books and other resources across multiple channels including email, SEO, and social media
» Time spent on individual pieces of content» Pages consumed per visit» Backlinks to content
» Return visits» Social media shares across channels including
Facebook, Twitter, YouTube, LinkedIn, and Pinterest» Subscriber count
» Subscriber count» Aggregate growth of leads» Visits to “contact us” page from articles,
videos, or webinars
» Proportion of consumers who make their way to the next stage of the conversion funnel
» Conversely, % drop-o!
» Deals closed» Monthly recurring revenue» Long-term value of all customers» Long-term value as a proportion of customer
acquisition cost
Do your customers trust you, and do they see you as a reliable source of information? Are they sharing your content with their networks? Are they valuing your brand’s content over your competitors’ content?
Are your audiences interested in doing business with you? Is your content successfully pulling your audience through the sales funnel?
Are prospects converting into customers? Are you connecting with new audiences, or strengthening relationships with existing customers? Where do you lose your leads?
What is the overall e"cacy of your content program?
© 2013 NewsCred 6
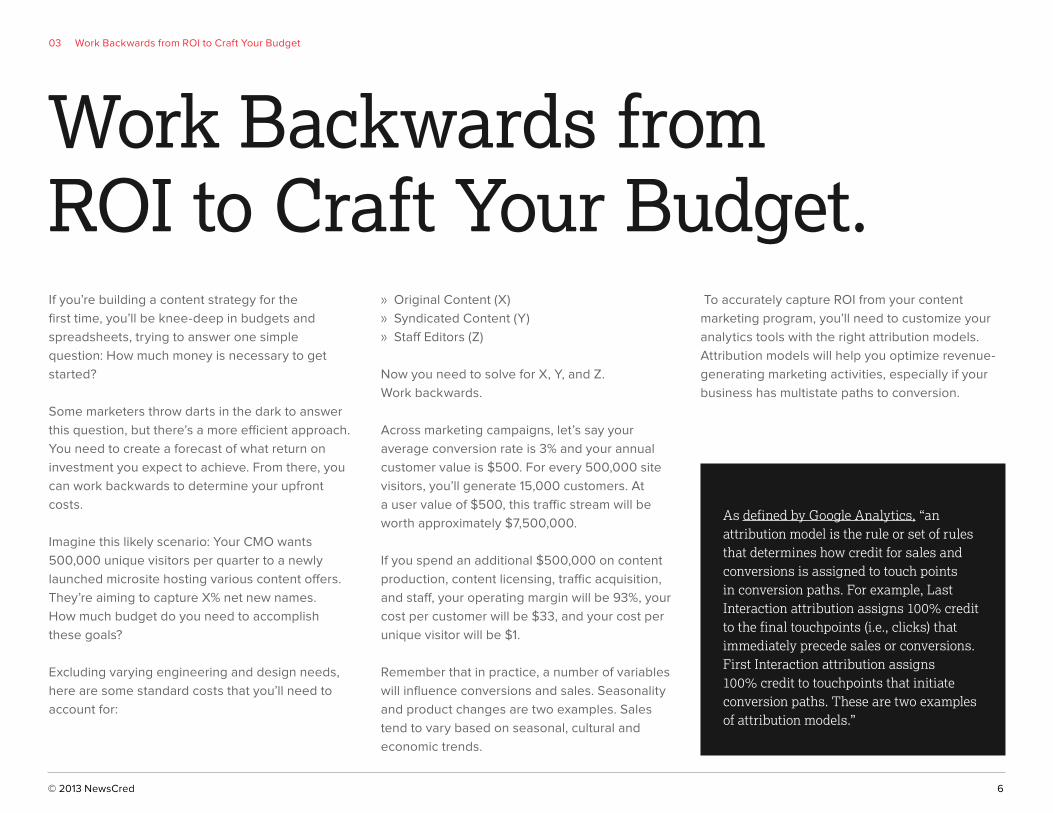
Work Backwards from
ROI to Craft Your Budget.
If you’re building a content strategy for the
first time, you’ll be knee-deep in budgets and
spreadsheets, trying to answer one simple
question: How much money is necessary to get
started?
Some marketers throw darts in the dark to answer
this question, but there’s a more e"cient approach.
You need to create a forecast of what return on
investment you expect to achieve. From there, you
can work backwards to determine your upfront
costs.
Imagine this likely scenario: Your CMO wants
500,000 unique visitors per quarter to a newly
launched microsite hosting various content o!ers.
They’re aiming to capture X% net new names.
How much budget do you need to accomplish
these goals?
Excluding varying engineering and design needs,
here are some standard costs that you’ll need to
account for:
» Original Content (X)
» Syndicated Content (Y)
» Sta! Editors (Z)
Now you need to solve for X, Y, and Z.
Work backwards.
Across marketing campaigns, let’s say your
average conversion rate is 3% and your annual
customer value is $500. For every 500,000 site
visitors, you’ll generate 15,000 customers. At
a user value of $500, this tra"c stream will be
worth approximately $7,500,000.
If you spend an additional $500,000 on content
production, content licensing, tra"c acquisition,
and sta!, your operating margin will be 93%, your
cost per customer will be $33, and your cost per
unique visitor will be $1.
Remember that in practice, a number of variables
will influence conversions and sales. Seasonality
and product changes are two examples. Sales
tend to vary based on seasonal, cultural and
economic trends.
To accurately capture ROI from your content
marketing program, you’ll need to customize your
analytics tools with the right attribution models.
Attribution models will help you optimize revenue-
generating marketing activities, especially if your
business has multistate paths to conversion.
As defined by Google Analytics, “an attribution model is the rule or set of rules that determines how credit for sales and conversions is assigned to touch points in conversion paths. For example, Last Interaction attribution assigns 100% credit to the final touchpoints (i.e., clicks) that immediately precede sales or conversions. First Interaction attribution assigns 100% credit to touchpoints that initiate conversion paths. These are two examples of attribution models.”
03 Work Backwards from ROI to Craft Your Budget

© 2013 NewsCred 7
Align with the Sales
Conversion Funnel.
Customer acquisition is a marathon, not a sprint.
The length of your conversion cycle depends on
whether you’re a B2B or B2C organization, and
conversions can span a period of hours, days,
week, or months. A website visitor may discover
your company through content, return to your site
a week later via an advertisement, sign up for your
email list, and then sign a contract six months later.
Deterioration and drop o! exists at every stage of
the funnel. Only a small proportion of your site’s
visitors will become paying customers.
By aligning your content marketing activities to
your buyer personas and stages of the conversion
funnel, you’ll increase your opportunity to acquire
leads and close deals. Conversion funnels map
the steps that prospects take as they become
paying customers, as well as the steps that first-
time customers take when they become returning
buyers.
04 Align with the Sales Conversion Funnel
Stages of a Conversion Funnel
Early StageGoal: Generate tra"c, awarenessTactics: Blog posts, curated lists, email marketing, thought leadership, social media, events
Middle StageGoal: Generate leadsTactics: Case studies, analyst report, webinars, best practice guides, newsletters, events
Late StageGoal: Convert leads to customersTactics: Newsletters, demos, trials, comparison guides, price sheets, analyst reports, events
Customer StageGoal: Retain customers, upsell, advocacyTactics: Case studies, consulting services, events, product updates, tutortials/training, advocacy program
Awareness
Evaluation
Purchase
Retain

© 2013 NewsCred 8
The Content Performance Report
To identify your top performing content, you need
to measure the cost per lead acquired from your
content through a web form (“gated content”).
Content Type
Channel
# ofCampaigns
Net New Names per Month
$ Spent
New New NamesChange
Leads to Date
MQLThis Month
CPL
MQLChange %
Whitepaper
Webinar
Tutorial
TOTAL
Sponsored Webinar
Sponsored Email
Online Advertising
4
3
3
10
398
337
2015
10
$3,011.59
$4,509.56
$4,738.18
$12,259.33
30%
28%
50%
129
316
344
789
123
202
1,219
$23.35
$14.27
$13.77
$15.54
20%
23%
30%
Channel Level Reporting
This report will give you an aggregate view of
the business impact of your marketing activities
by channel. Every company has a sweet spot in
terms of your marketing channel mix. Channel
level reporting will help you determine the success
of each of your channels, ultimately providing
direction as to where you should allocate budget
for the next quarter.
04 Align with the Sales Conversion Funnel
Your framework for measuring ROI, user behavior, and sales should capture transitions between
each of these conversion steps, not just the final jump from email subscriber to customer.
A “report card” can provide your organization with transparency to the ROI of your content marketing.
At NewsCred, we update our demand generation report card daily; however, you could share your
progress periodically, weekly, monthly or even quarterly. *These numbers have been modified.

© 2013 NewsCred 9
Marketing Metrics Guide
It’s important to look at all touch points in your
company’s conversion funnels to see where
content marketing fits in. This Marketing Metrics
template was developed for SaaS companies,
but can be customized to fit your needs.
*The numbers in this report have been modified.
Program Specific Report
Each company defines marketing programs di!erently.
At NewsCred, programs are individual marketing activities.
For example, each sponsored email or sponsored
webinar is considered a single program.If you track each
program separately, then you’ll have more flexibility when
segmenting or aggregating your data.
Program Channel TotalMembers
Net NewNames
Costper Member
Cost perNew Name
Cost per MQLMQL(defined by channel)
Webinar with Buzzfeed
eMarketer Email
LinkedIn Sponsored Posts
Native Ad
Sponsored Webinar
Sponsored Email
Online Advertising
Online Advertising
398
337
1696
319
425
339
1714
319
$23.53
$18.73
$15.06
$31.34
$37.68
$18.84
$15.21
$31.34
$121.95
$31.43
$25.11
$52.35
123
202
1028
191
04 Align with the Sales Conversion Funnel

© 2013 NewsCred 10
MARKETING SUMMARY
These will vary by company:
AdwordsDirect emails, PR, content marketing SEP
Conference, events, workshops, sponsorships
Cold emails & calls, LinkedIn, Twitter
Intros, relationships, referrals
BOOKINGS
COST
VALUE
Leads 2000 5000 3000 1000 1000 1 2,000
60 100 90 60 30 340
3% 2% 3% 6% 3% 2.8%
$80,000 $150,000 $110,000 $80,000 $10,000 $430,000
$1,333 $1,500 $1,222 $1,333 $333 $1,265
19% 35% 26% 19% 2% 100%
$70,000 $100,000 $80,000 $60,000 $9,000 $319,000
$35 $20 $27 $60 $9 $27
$1,167 $1,000 $889 $1,000 $300 $938
22% 31% 25% 19% 3% 1 100%
13% 33% 27% 25% 10% 26%
$167 $500 $333 $333 $33 $326
7.0 2.0 2.7 3.0 9.0 2.9
8.0 7.0 10.0 9.0 11.0 8.7
$640,000 $1,050,000 $1,100,000 $720,000 $110,000 $ 3,620,000
$1,333 $3,500 $3,333 $3,000 $367 $2,833
1.1 3.5 3.8 3.0 1.2 3.0
Deals Closed
Conversion Rate
MRR (Monthly Recurring Revenue)
MRR / Customer
% of Total Revenue
Cost
CPL (Costs Per Lead)
CAC (Customer Acquisition Cost)
% of Total Costs
Gross Margin
Monthly Profit / Customer
Months to Break-even
Average Lifetime (Months)
Gross LTV (Lifetime Value)
Net LTV / Customer
Net LTV / CAC
TOTALJuly ‘13
Inbound/Adwords
Inbound/Other
Conference/Events
OutboundCold
OutboundReferrals

© 2013 NewsCred 11
Data is both a power tool and a nightmare. The
right framework will tell an amazing ROI story.
Follow these best practices to avoid finding
yourself buried in a meaningless data dump.
Report Standardization
All content marketing reports should follow the
same template.
Data Automation
Work with developer and analytics teams to
automate your reports. This will help minimize
human error.
Streamlined Presentation
If you’re still pulling data into Excel, create a few
templates in PowerPoint or another presentation
tool to make the information more digestible. Avoid
excessive commas and decimal places.
Outlined Methodology
Ensure that your entire methodology is
documented and that your audience has access to
it. Be transparent about the black box.
Definition of Terms
In online marketing, phrases and marketing terms
can have di!erent meanings between business
units. Make sure that your definitions are outlined
for your team and stakeholders to understand.
Streamline Sampling Processes
Your sampling methodology can skew the numbers
that you report. To minimize the potential for
error, make sure that the data sampling steps are
consistent across your team.
Consistency
Establish how frequently you need to create
reports. At the very least, you should be tracking
progress quarterly, but some reports will be
necessary on a weekly or monthly basis.
Sta! Appropriately
Decide which team members should manage
reporting for content marketing. Have this team
generate reports and make sure that systems are
fully integrated and consistently online.
Data Consolidation
Identify which data sources you want to work with
and how to best synthesize relevant information.
Growth
All reporting should be actionable and positioned
towards growth. Don’t track something just
because it’s interesting. At the end of the day,
marketers are growth engines, not historians.
Tips for Reporting Data
04 Align with the Sales Conversion Funnel

© 2013 NewsCred 12
Choosing the Right Tools.
With so many metrics to track, which tools can help
you streamline processes, report consistently, and
sift through massive volumes of data to uncover
meaningful results and trends.
You should pick an analytics solution that provides
as much insight as possible into your business
goals. At a minimum, you’ll need platforms that
support the following:
Content Drilldowns
This makes it easy for you to see which pieces of
content are generating the most interest and sales
opportunities.
Tra"c Source Analysis
This type of tool makes it easy to identify referral
tra"c sources – other sites that are sending tra"c
your way.
Conversion Funnel Analysis
Analytics software can help you visualize the
di!erent paths to conversion that visitors are taking
on your website.
Conversion Reports
This functionality will help you track revenue-
generating actions from your website.
Social Sharing & Engagement
Monitoring and measuring the activity around your
brand and content across social channels can help
you optimize your content strategy and advertising
budgets. Clicks, mentions, sharing actions, and
audience growth are several figures that indicate
successful marketing.
It’s also important to choose tools that complement
your existing marketing systems, like Marketo
and Eloqua. For example, if you’re running email
automation campaigns, you’ll want to make sure
that your tools are in sync to measure the same
data points.
05 Choosing the Right Tools

© 2013 NewsCred 13
Focus on E"cacy
This process requires relentless self-discipline.
You might love your content, but does your
audience love it too? Be critical about your
content program’s performance. Give yourself
a reality check by asking the following question:
Did you underachieve, achieve or overachieve
your marketing goal?
The answer to this should be highly data-driven,
with major and vanity KPIs accounted for.
Marketing leader and author, Andreas Ramos,
outlined the steps your team needs to take:
1. State the campaign costs.
2. State the revenue produced directly
from the campaign.
3. Describe the tracking process.
4. State the number of leads and sales
with a conversion rate.
5. State the maximum profitable cost per
lead (maxCPL) or cost per action (maxCPA).
6. Use statistically meaningful numbers – if data
samples are too low, the results aren’t valuable.
7. Describe the control group so that you can
draw conclusions about your campaigns.
“If you set up a content marketing
process that works, you become a
money machine. Your CFO will give
you an unlimited budget. Your CEO
will shower you with a big bonus.
VCs fund your project. Your cat will
come when you call.” — Andreas Ramos
04 Align with the Sales Conversion Funnel

14

© 2013 NewsCred NewsCred.com l (212) 989-4100 l [email protected]
Top Related