


Languages
Pages
Legal

UK Residents’ Views Of
Local Councils
By DJS Research Ltd July 2014
Your contacts Alasdair Gleed, Research Director & Localise Lead;
Elliot Simmonds, Senior Marketing Executive
Phone: 01663 767857
Web: www.djsresearch.co.uk; http://localiseprofiling.com
E-mail: [email protected]; [email protected]
Follow us: @DJS_Localise; @DJSResearch

1 1 The headlines

The headlines
Eight key insights emerge from the research:
1. There is a positive attitude from residents towards local councils moving their communications to a more online approach in order to realise savings which could be applied in other areas: 52% of respondents agree, while only 12% disagree.
2. Despite there being some variation by age and region in support of a more online approach, about half of respondents aged 55-64 and 65+, and two fifths of respondents from Yorkshire and Humber, still actively support the idea. In these groups of lowest support, disagreement is not much different to the overall average proportions.
3. Over two fifths of respondents do not believe that their local council targets services to them in the way that best suits them. Age is a major factor behind the dissatisfaction in this aspect. Localise could aid local councils to target their services more effectively.
4. Two fifths of respondents feel that their local council does not focus its budget on things that matter to local people. Fewer than one quarter agree. Localise could aid local councils in their budget focussing, by determining what matters most to people in particular areas.
5. There is a significant proportion of people who feel that their local council does not understand its residents very well (37%). Localise would be able to provide local councils with detailed information and therefore a greater understanding of their residents.
The headlines
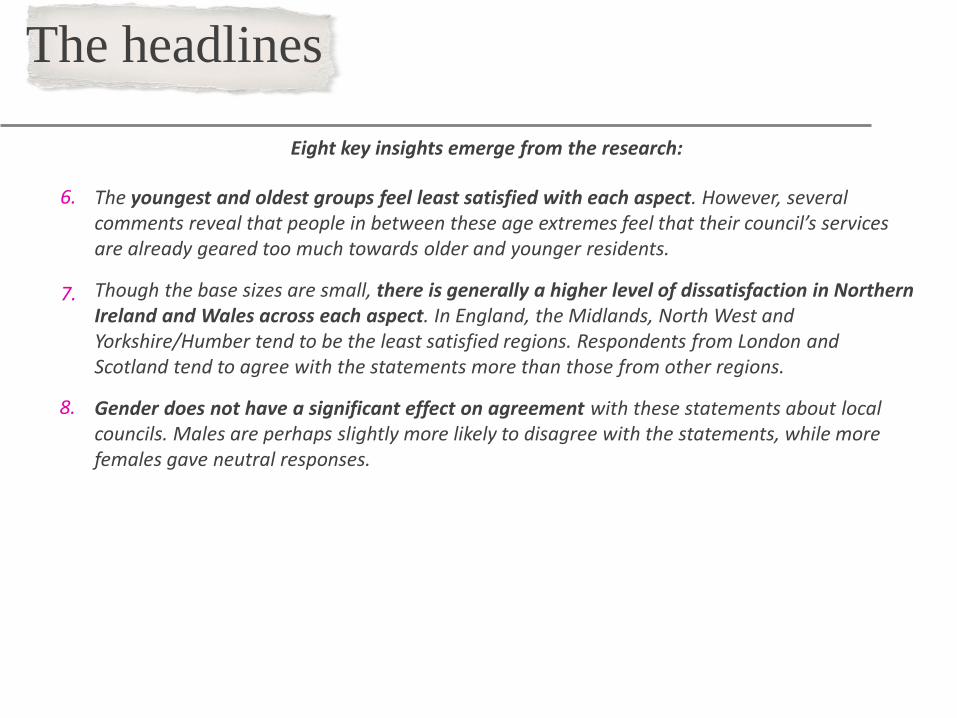
Eight key insights emerge from the research:
1. The youngest and oldest groups feel least satisfied with each aspect. However, several comments reveal that people in between these age extremes feel that their council’s services are already geared too much towards older and younger residents.
2. Though the base sizes are small, there is generally a higher level of dissatisfaction in Northern Ireland and Wales across each aspect. In England, the Midlands, North West and Yorkshire/Humber tend to be the least satisfied regions. Respondents from London and Scotland tend to agree with the statements more than those from other regions.
3. Gender does not have a significant effect on agreement with these statements about local councils. Males are perhaps slightly more likely to disagree with the statements, while more females gave neutral responses.
6.
7.
8.

2 2 Methodology

Research Methodology Representative survey of UK residents carried out online
• Online panel survey carried out in May 2014, returning 1,034 responses.
• Respondents representative at country level (England 84%, Scotland 8%, Wales 5% and Northern Ireland 3%). Respondents in England representative at regional level.
• Respondents broadly representative in terms of age at overall level.
• Respondents were representative in terms of gender at an overall level.
• Panel survey carried out by Respondi AG.
• Analysis and reporting carried out by the Localise team at DJS Research Ltd.
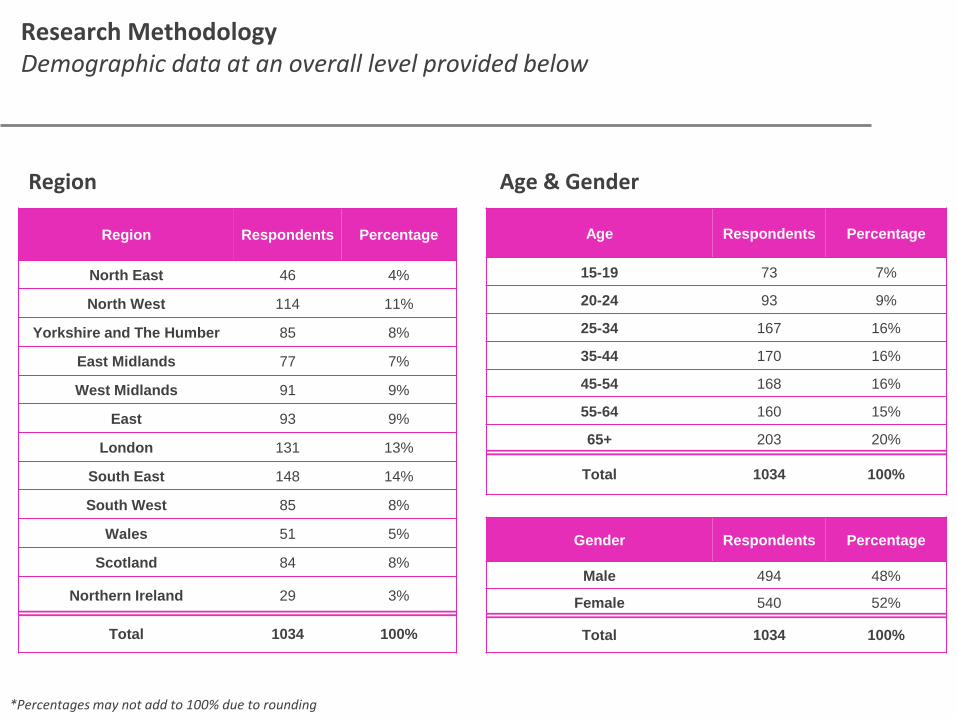
Research Methodology Demographic data at an overall level provided below
Region Respondents Percentage
North East 46 4%
North West 114 11%
Yorkshire and The Humber 85 8%
East Midlands 77 7%
West Midlands 91 9%
East 93 9%
London 131 13%
South East 148 14%
South West 85 8%
Wales 51 5%
Scotland 84 8%
Northern Ireland 29 3%
Total 1034 100%
Age Respondents Percentage
15-19 73 7%
20-24 93 9%
25-34 167 16%
35-44 170 16%
45-54 168 16%
55-64 160 15%
65+ 203 20%
Total 1034 100%
*Percentages may not add to 100% due to rounding
Gender Respondents Percentage
Male 494 48%
Female 540 52%
Total 1034 100%
Region Age & Gender

3 3 Local Councils’ understanding of
residents

My local council has a good understanding of its residents Almost two fifths of respondents disagree that their local council has a good understanding of its residents.
Base: All respondents (1034)
26%
37%
32%
5%
Council understands residents
Net agree
Net disagree
Neither agree nor disagree
Don't Know
“Most members of my local council are people who have moved here later in life and do not understand the problems and difficulties which face ordinary working people in this area of very low wages and very high house prices.”
“The council understands enough to cherry pick where it puts its efforts - to where the leader thinks votes will be garnered rather than where real need exists.”
• This is the statement with most agreement and least disagreement.
• Only one quarter agree that their local council has a good understanding of its residents.
“They are detached and have no understanding of local needs.”
*Percentages may not add to 100% due to rounding
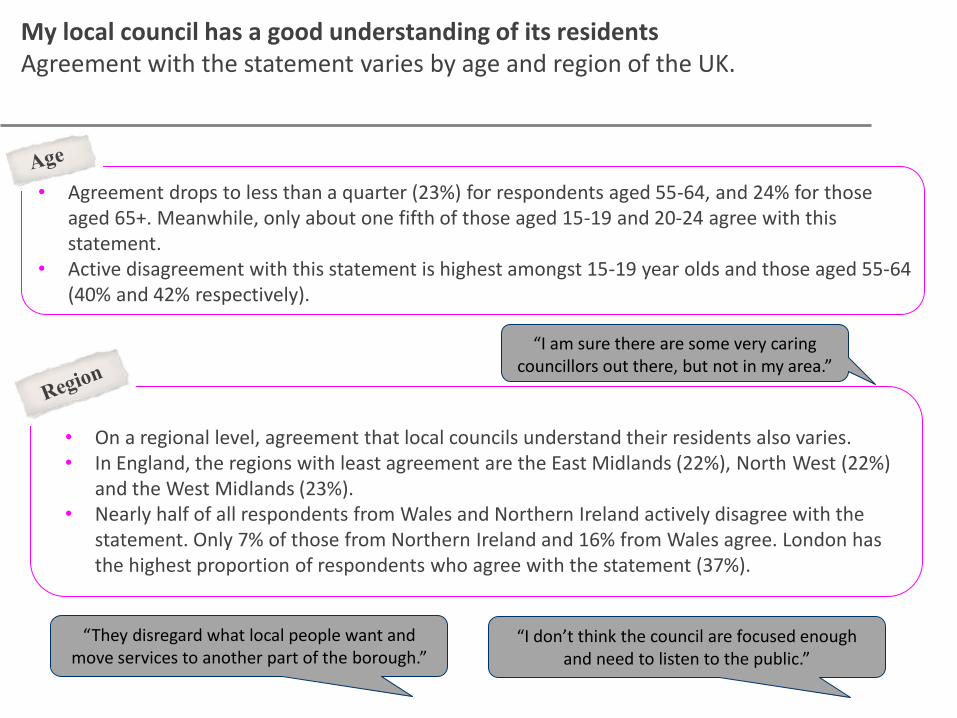
My local council has a good understanding of its residents Agreement with the statement varies by age and region of the UK.
• On a regional level, agreement that local councils understand their residents also varies. • In England, the regions with least agreement are the East Midlands (22%), North West (22%)
and the West Midlands (23%). • Nearly half of all respondents from Wales and Northern Ireland actively disagree with the
statement. Only 7% of those from Northern Ireland and 16% from Wales agree. London has the highest proportion of respondents who agree with the statement (37%).
• Agreement drops to less than a quarter (23%) for respondents aged 55-64, and 24% for those aged 65+. Meanwhile, only about one fifth of those aged 15-19 and 20-24 agree with this statement.
• Active disagreement with this statement is highest amongst 15-19 year olds and those aged 55-64 (40% and 42% respectively).
“They disregard what local people want and move services to another part of the borough.”
“I don’t think the council are focused enough and need to listen to the public.”
“I am sure there are some very caring councillors out there, but not in my area.”

4 4 Local Councils’ targeting of
services

My local council targets services to me in the way that best suits me Just one fifth of respondents agree that their local council targets services to them in the way that best suits them. This question prompted the most overall disagreement out of the three (43%).
Base: All respondents (1034)
• Regional variation is quite pronounced for this
statement. • About three fifths of respondents from Wales
(63%) and Northern Ireland (59%) disagree with the statement.
• The North West is the most dissatisfied region in England, as over half the respondents disagree with the statement.
• Scotland has the greatest proportion of respondents who agree that councils target their services in the best suited way (30%).
“I have a daughter that uses health and social care services. She is not a round peg that fits into a square
hole... I appreciate they have a limited budget, it could still be tailored more efficiently to suit.”
20%
43%
33%
4%
Council targets services in the way that best suits me
Net agree
Net disagree
Neither agree nor disagree
Don't Know
*Percentages may not add to 100% due to rounding
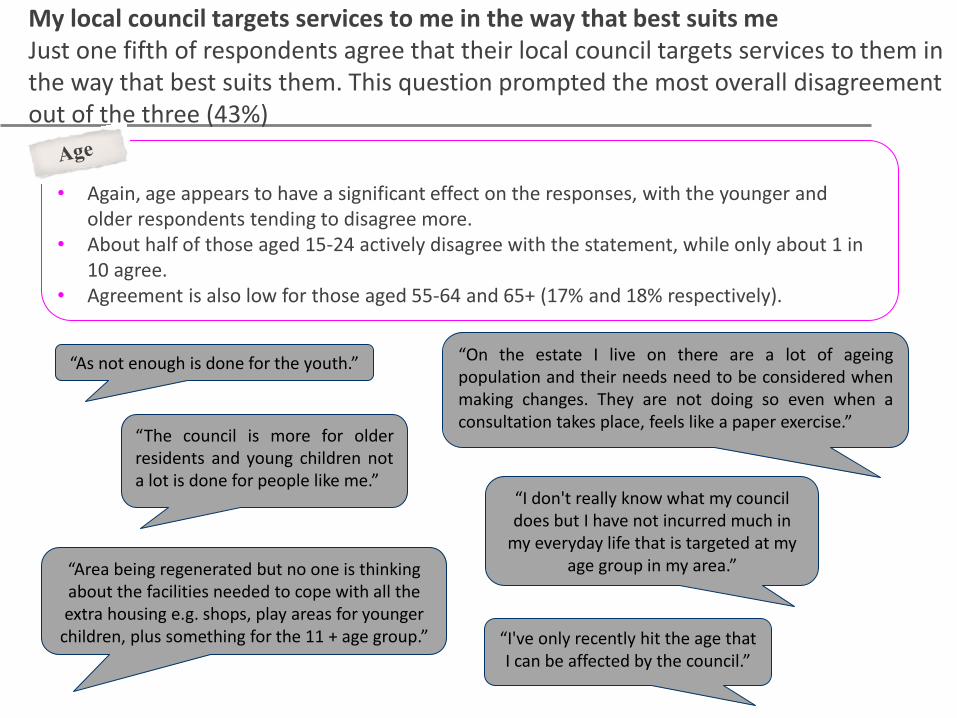
• Again, age appears to have a significant effect on the responses, with the younger and
older respondents tending to disagree more. • About half of those aged 15-24 actively disagree with the statement, while only about 1 in
10 agree. • Agreement is also low for those aged 55-64 and 65+ (17% and 18% respectively).
My local council targets services to me in the way that best suits me Just one fifth of respondents agree that their local council targets services to them in the way that best suits them. This question prompted the most overall disagreement out of the three (43%)
“I don't really know what my council does but I have not incurred much in
my everyday life that is targeted at my age group in my area.”
“The council is more for older residents and young children not a lot is done for people like me.”
“On the estate I live on there are a lot of ageing population and their needs need to be considered when making changes. They are not doing so even when a consultation takes place, feels like a paper exercise.”
“As not enough is done for the youth.”
“Area being regenerated but no one is thinking about the facilities needed to cope with all the extra housing e.g. shops, play areas for younger
children, plus something for the 11 + age group.” “I've only recently hit the age that I can be affected by the council.”

5 5 Local Councils’ budget focus

My local council focuses its budget on the services that matter most to local people Just 23% of respondents agree that their council focuses the budget on the most important services.
Base: All respondents (1034)
• The focus of local councils’ budgets is also an area of high dissatisfaction, with many complaining that services they need or previously used frequently have been cut, while other services are not needed, or only benefit a small number of people.
.
23%
39%
32%
6%
Council focuses budget on services that matter
Net agree
Net disagree
Neither agree nor disagree
Don't Know
“Imprecise focus on the things that matter to the local population.”
“I have noticed in the last year services that people use are getting taken away. Budget cuts everywhere.”
“Budget cuts have impacted to such a degree that they are unable to focus resources where I would like them (e.g. bus subsidy).”
“The finances are a mess and the councillors do not know how much money is being spent. They are spending money on things that do not matter, like giving councillors iPads.”
“They often waste money on projects that reward only a few people, or overspend on projects not needed.”
*Percentages may not add to 100% due to rounding

• Yet again, Wales and Northern Ireland are the regions with least agreement (just 12% and
10%). • Yorkshire and Humber, East Midlands and West Midlands are the regions of England with
lowest agreement about focus of council budgets (18%, 19% and 17% respectively).
My local council focuses its budget on the services that matter most to local people Just 23% of respondents agree that their council focuses the budget on the most important services.
Base: All respondents (1034)
• The lowest agreement is by those aged 20-24 (14%). • Highest disagreement is by those aged 55-64 (44%).
“Very little spent on services for our age
group.”
“Have not seen much evidence of the council spending funds on things that would actually be useful for people in
my age group.”
“Main focus is on services for the young with detrimental effects on services and benefits for the elderly, accepting very limited finances.”
“Money spent in my local council area could be better
spent in other areas.”
“They make cuts in areas where they should actually be spending more money.”
“Funding based in town areas countryside
forgotten.”
6 6 Desire for communications
channel shifting

I would support my local council if it chose to move its communications channels to a more online approach in order to realise savings which could be applied in other areas
• Over half of respondents would support their local council if it moved its communications channels to a more online approach.
• Only 12% would not support this change. • A similar proportion (32%) to the other
statements are neutral to the idea.
Base: All respondents (1034)
52%
12%
32%
4%
I would support my local council if it chose to move its communications to a more
online approach
Net agree
Net disagree
Neither agree nor disagree
Don't Know
• There is some variation by age; generally the younger respondents are more likely to support this statement than the older respondents.
• However, around half of people aged 55-64 (52%) and 65+ (48%) would still support a change to a more online approach.
• Respondents aged 20-24 were mostly likely to agree with the statement (61%).
*Percentages may not add to 100% due to rounding

I would support my local council if it chose to move its communications channels to a more online approach in order to realise savings which could be applied in other areas
Base: All respondents (1034)
• Yorkshire and Humber is least likely to desire a more online approach (40% agree). • The South West and Scotland were most likely to agree (63% and 62% agree), while the North
East was least likely to disagree (4%).
• Some residents complain that there is a lack of information provided by the council about its plans, decisions and other factors that will effect its residents.
• It is also questioned whether the local councils have adequate information about its residents. • These are areas in which moving local council communications channels to an online approach
could help with, while Localise would be able to provide the councils with the required information.
“Because they don't follow their policies of what they want to do/have planned to do
according to their research of what needs to be done, there is never a full survey from everyone
in the area so how can they be even close to covering all the needs of local people?.”
“I don't receive an awful lot of information on things the council are doing.”
“There is not much information that comes out from the council.”
“Lack of information from council.” “No information about what
the council decides.”

7 7 About Localise

Localise is a regional and sub-
regional consumer profiling
and mapping tool designed by
DJS Research which applies
local census data (and other
data in the public domain) at a
local level. Localise’s unique
local level analysis provides
robust data on the population
as it actually exists, rather
than an approximation using
national data (as is the case
with other consumer
classification products).
Localise enables clients to truly understand a target audience in a
local or regional area, identifying who they are and where they
live, to levels of detail as precise as a single street.
• Age
• Gender
• Marital and family status
• Employment status
• Income
How can Localise be applied to your research?
• Qualifications/education
• Ethnicity
• Health information
• Housing tenure
• Car ownership
In addition, we can also use transactional or survey data to include
service use or attitudinal data which can be mapped alongside
other datasets, as long as it is linked to a postcode.

The analysis process
Gather the relevant census data for the locations of interest.
DJS developed the Localise
proposition to conduct the
statistical analysis required to
create meaningful segments
for further analysis.
Standardise the variables.
CTT (Classic Test Theory) applied to eliminate the variables
which are not useful and identify those which have the largest
variation/greatest differentiation within areas.
Carry out cluster analysis in order to segment the areas into
‘super group’ areas e.g. Rural, Urban Wealthy, Urban Poor.
Super groups are then broken down further within the groups.
Each segment is a group of relatively homogenous respondents
that share common characteristics. They are also dissimilar to
those outside the segment, particularly those in other segments.

Illustrative output from Localise – segment A3:
For each segment we provide
a detailed summary of the
profiles of those consumers –
the output varies by project
but for councils might include:
income levels, family status,
housing type etc. We share
the segments emerging from
the analysis with clients to
discuss, before finalising the
segment reports.

Illustrative output from Localise – 10 segments
mapped onto the city of Hull:
As our profiling data includes
postcodes we can produce a
map showing where the
different segments live to a
highly granular level – literally
on a street-by-street basis.
This can be invaluable for
understanding where certain
types of consumers live. We
can add locations of client
sites (such as libraries, leisure
centres, job centres etc.) on to
the maps.

Data integration (additional bolt on option):
If the client is able to provide
transactional data (e.g. from a
CRM, library records etc.), this
data can be integrated into
Localise so profiles could
include information on what
services or products each
segment uses or requests
information on most often.
We can also utilise attitudinal
or lifestyle data collected from
surveys – in short, any data
with a post code.

Get in touch +44 (0) 1663 767 857
or email: [email protected]
For more information, visit our UK corporate or Localise websites:
www.djsresearch.co.uk
http://localiseprofiling.com
Top Related