


Languages
Pages
Legal


Centre for Business Research
UK Economy Forecast Report
Winter 2015
Dr. Graham Gudgin, and Ken Coutts Centre for Business Research, Judge Business School, University of Cambridge
Professor Neil Gibson, and Jordan Buchanan, Economic Policy Centre, Ulster Business School, Ulster University

Forecasts derived from CBR macro-economic forecast model (UKMOD) www.cbr.cam.ac.uk/publications/
1
Contents
Contents............................................................................................................................................ 1
Charts and Tables .......................................................................................................................... 3
Acknowledgements ....................................................................................................................... 6
About the Authors ......................................................................................................................... 6
About the CBR ............................................................................................................................... 6
Executive Summary ........................................................................................................................... 7
Summary ....................................................................................................................................... 7
Conclusion ................................................................................................................................... 12
Part A: Economic Outlook ................................................................................................................ 14
Chapter 1: Economic Overview .................................................................................................... 14
1.1: Labour Market Overview................................................................................................... 16
1.2: Inflation Overview............................................................................................................. 19
1.3: Conclusion ........................................................................................................................ 20
Chapter 2: Forecast in Detail ........................................................................................................ 22
2.1: Macroeconomic Forecasts ................................................................................................ 22
2.1: Fiscal Forecasts ................................................................................................................. 25
Chapter 3: Consumption .............................................................................................................. 28
Chapter 4: Investment ................................................................................................................. 33
Chapter 5: Government ............................................................................................................... 36
Chapter 6: Trade and the Balance of Payments ............................................................................ 42
Chapter 7: Labour Market and Demography ................................................................................ 48
7.1: Employment and Unemployment...................................................................................... 48
7.2: Earnings ............................................................................................................................ 52
7.3: Demography ..................................................................................................................... 54
Chapter 8: Housing and Household Debt ..................................................................................... 55
Part B: Scenarios - Reflation............................................................................................................. 60
Scenario Overview ....................................................................................................................... 60
Real GDP ..................................................................................................................................... 61

Forecasts derived from CBR macro-economic forecast model (UKMOD) www.cbr.cam.ac.uk/publications/
2
Inflation ....................................................................................................................................... 63
Government Deficit ..................................................................................................................... 64
Government Debt ........................................................................................................................ 65
House Prices and Household Debt ............................................................................................... 66
Conclusion ................................................................................................................................... 68

Forecasts derived from CBR macro-economic forecast model (UKMOD) www.cbr.cam.ac.uk/publications/
3
Charts and Tables
Table ES1: Key Exogenous Drivers of Economic Growth and Inflation ................................................ 7
Chart ES1: Number of New Housing Loans Each Year ......................................................................... 8
Table ES2: Overview of the Economy Forecast ................................................................................... 9
Chart ES2: The Great Dislocation in Economic Growth ..................................................................... 10
Chart 1.1: GDP per Annum............................................................................................................... 15
Chart 1.2: GDP per Head .................................................................................................................. 16
Chart 1.3: Employment .................................................................................................................... 17
Chart 1.4: Unemployment Rate ....................................................................................................... 18
Chart 1.5: Productivity ..................................................................................................................... 18
Chart 1.6: Consumer Price Index ...................................................................................................... 19
Table 2.1: Macroeconomic Conditions ............................................................................................. 22
Chart 2.1: Bank of England Interest Base Rates ................................................................................ 23
Table 2.2: Overview of the Economy Forecast ................................................................................. 24
Chart 2.2: Components of GDP ........................................................................................................ 24
Table 2.3: Fiscal Overview ............................................................................................................... 26
Chart 2.3: Government Debt and Deficit .......................................................................................... 26
Table 2.4: GDP Deflators Annual Growth ......................................................................................... 27
Table 3.1: Consumption ................................................................................................................... 28
Table 3.2: Components of Real Household Income Growth.............................................................. 29
Chart 3.1: Change in Household Debt .............................................................................................. 30
Chart 3.2: Debt / Income Ratio ........................................................................................................ 31
Chart 3.3: Savings Ratio ................................................................................................................... 32
Table 4.1: Components of Investment ............................................................................................. 33
Chart 4.1: Components of Investment ............................................................................................. 34
Chart 4.2: Housing Completions ...................................................................................................... 35
Table 5.1: Government Expenditure ................................................................................................ 36
Table 5.2: Government Current Expenditure Deflators ................................................................... 36
Table 5.3: Government Expenditure ................................................................................................ 37
Table 5.4: Government Expenditure ................................................................................................ 37
Chart 5.1: Total Public Sector Spending and Receipts ....................................................................... 38
Chart 5.2: Consumption and Welfare Spending................................................................................ 38
Chart 5.3: Government Consumption per Head ............................................................................... 39
Table 5.5: Government Income ....................................................................................................... 40
Forecasts derived from CBR macro-economic forecast model (UKMOD) www.cbr.cam.ac.uk/publications/
4
Chart 5.4: Government Fiscal Deficit ................................................................................................ 40
Chart 5.5: Public Sector Net Debt .................................................................................................... 41
Chart 6.1: World Trade .................................................................................................................... 42
Chart 6.2: Cost Competitiveness ...................................................................................................... 43
Table 6.1: Trade Components .......................................................................................................... 43
Chart 6.3: Openness of the UK Economy .......................................................................................... 44
Chart 6.4: Net Property Income ....................................................................................................... 45
Chart 6.5: Balance of Payments and Net Trade ................................................................................ 46
Table 6.2: Balance of Payments (Current Account Components) ...................................................... 46
Chart 6.6: Oil Prices (Brent Crude) ................................................................................................... 47
Chart 7.1: Private Sector Employment ............................................................................................. 48
Table 7.1: Key Labour Market Indicators .......................................................................................... 49
Chart 7.2: Public Sector Employment ............................................................................................... 49
Chart 7.3: Total Employment ........................................................................................................... 50
Chart 7.4: Employment Rate ............................................................................................................ 51
Chart 7.5: Unemployment Rate ....................................................................................................... 51
Chart 7.6: Real Earnings ................................................................................................................... 52
Chart 7.7: Compensation of Employees ........................................................................................... 53
Chart 7.8: Labour Productivity (whole economy) ............................................................................. 53
Table 7.2: Demography ................................................................................................................... 54
Chart 8.1: New Dwellings ................................................................................................................. 55
Table 8.1: Housing Indicators ........................................................................................................... 56
Chart 8.2: Housing Stock .................................................................................................................. 56
Chart 8.3: House Price Annual Growth ............................................................................................. 57
Chart 8.4: House Prices / Disposable Income Ratio .......................................................................... 57
Chart 8.5: Number of Housing Loans ............................................................................................... 58
Chart 8.6: Household Debt / Disposable Income Ratio ..................................................................... 59
Table B1: General Government Consumption .................................................................................. 60
Table B2: General Government Fixed investment ............................................................................ 61
Chart B1: Real GDP .......................................................................................................................... 61
Chart B2: Components of GDP ......................................................................................................... 62
Chart B3: Number of People Employed (All Sectors) ........................................................................ 62
Chart B4: Number of People Unemployed ....................................................................................... 63
Chart B5: Consumer Price Inflation .................................................................................................. 64
Chart B6: Government Deficit .......................................................................................................... 65

Forecasts derived from CBR macro-economic forecast model (UKMOD) www.cbr.cam.ac.uk/publications/
5
Chart B7: Government Debt / GDP Ratio ......................................................................................... 65
Chart B8: House Price / Income Ratio .............................................................................................. 67
Chart B9: Household Liabilities ........................................................................................................ 68

Forecasts derived from CBR macro-economic forecast model (UKMOD) www.cbr.cam.ac.uk/publications/
6
JEL codes: E12; E17; E27; E44; E47
Acknowledgements We are grateful for Bill Martin’s kind permission to access his revised Blue Book Historical Macro-Economic database of UK national accounts data backdated on a consistent basis to 1948. We have subsequently updated the series used in this paper from ONS sources, but the work would not have been started without access to Bill Martin’s data. We are also grateful to Oxford Economics Ltd for their kind permission to use their UK weighted UK world trade forecasts. The views in this report are of course our own and no responsibility of Oxford Economics or any others.
About the Authors Graham Gudgin is currently Honorary Research Associate at the Centre For Business Research (CBR) in the Judge Business School at the University of Cambridge. He is also visiting Professor at the University of Ulster and Chairman of the Advisory Board of the Ulster University Economic Policy Centre. He was director of the Northern Ireland Economic Research Centre from 1985 to 1998 when he became Special Adviser to the First Minister in the NI Assembly until 2002. Prior to this he was economics fellow at Selwyn College, Cambridge and a member of the Cambridge Economic Policy Group.
Ken Coutts is Honorary Research Associate at the Centre For Business Research (CBR) in the Judge Business School, Emeritus Assistant Director of Studies in the Faculty of Economics, and Life Fellow in Economics, Selwyn College, at the University of Cambridge. A member of the Cambridge Economic Policy Group in his younger career, led by the late Wynne Godley, his main interests are in macroeconomics, monetary and fiscal policy, trade, capital flows and balance of payments. He has also written extensively on the pricing behaviour of manufacturing industries in the UK and Australia.
Neil Gibson is Professor of Economic Policy and Director of the Economic Policy Centre at the Ulster Business School at the Ulster University. He was formerly a Director of Oxford Economics Ltd and previously economic consultant at PriceWaterhouseCoopers. His research interests are in regional economic forecasting economic development, and regional policy. Jordan Buchanan is an Economist at the Economic Policy Centre at the Ulster Business School at the Ulster University.
About the CBR The Centre for Business Research (CBR) is an independent research institution within the University of Cambridge. The CBR conducts interdisciplinary research on enterprise, innovation and governance in contemporary market economies. Established in 1994, it is now one of the leading centres for social science research on economics, law and business in the UK, and has a growing European and global reputation. The Centre’s current areas of specialisation include the construction and analysis of large and complex datasets on small and medium-sized enterprises (SMEs) and innovation, longitudinal analysis of regulatory change affecting business firms, and fieldwork-based studies of corporate governance and organisational practice.

Forecasts derived from CBR macro-economic forecast model (UKMOD) www.cbr.cam.ac.uk/publications/
7
Executive Summary
Summary
The forecasts presented in this report are for the period from 2015 to 2025. Although covering this
year and the next, their main purpose is not short-term forecasting but instead to examine how
medium-term economic trends might evolve over a period of one to two parliaments. In particular
we wish to comment on the influence of UK fiscal and monetary policy on these trends. This has
required constructing a new model of the UK economy based on a Keynesian framework, since most
existing models, including that of the Office for Budget Responsibility (OBR) rely on assumptions
about productive capacity and economic growth in the medium-term. The OBR approach includes an
assumption that cuts in government spending will be offset by private sector expansion to achieve
the assumed growth rate in GDP. We regard this supply-side optimism as unrealistic and unhelpful
as a guide to the impact of government policy in anything except the very long run.
The forecasts in this report make no assumption about the medium or long-run growth of
productive capacity. Instead productive capacity depends on investment which itself reflects the
outlook for effective demand. Our forecasts are however conditional on several independent, i.e.
exogenous, trends. The financial deficits of the private, government and foreign sectors are inter-
dependent and must sum to zero, and each of these sectors has one exogenous driver. These drivers
are world trade and real government current and capital spending on goods and services. The third,
private-sector, driver of growth is the expansion of lending to UK households which itself depends on
credit conditions in UK banks. We use the number of new loans for housing as our main indicator of
credit conditions. These assumptions allow us to generate conditional forecasts out to 2025, but we
focus mainly on the current parliament, up to 2020, based on the Government’s stated spending
plans for this period. The tables in this report thus extend to 2020 but the longer and less certain
period, to 2025 is shown in the charts.
Table ES1: Key Exogenous Drivers of Economic Growth and Inflation
Our view is that the outlook for world trade will be more favourable in future than over the period
since 2010 (table ES1). In itself this should generate faster growth in GDP, although uncertainties in
China and elsewhere cloud the outlook. In this sense these forecasts are based on a relatively
optimistic assumption. It is real government spending on goods and services which is the weakest
link in the conditions for growth in the medium term. Although government consumption expanded
slowly over the 2010-14 period, the degree of austerity was less than often perceived and was
relaxed in the run up to the last general election. The Government’s current, Autumn Statement,
plans are for slightly greater austerity in nominal, and hence also real, spending. We have used the
Key drivers: 2010-14 2015 2016 2017 2018 2019 2020
World trade (% p.a.) 3.6 3.5 4.1 5.2 4.9 4.7 4.5
Government consumption (%p.a.) 1.1 0.1 1.0 1.8 -0.3 -0.3 1.5
Number of housing loans (change 000s) 39 104 120 112 87 61 36
Interest rate (bank rate) 0.5 0.5 0.8 2.5 3.5 4.0 3.5

Forecasts derived from CBR macro-economic forecast model (UKMOD) www.cbr.cam.ac.uk/publications/
8
OBR’s estimates for government spending plans in nominal terms but believe that real spending may
be more restrained than the more optimistic projections of the OBR.
The conversion of government spending in nominal terms into real spending, i.e. into the delivery of
physical public services, is influenced by wages and productivity in the public sector and by other
costs. We are less optimistic than the OBR who are assuming that costs of government consumption
can be held down. The OBR’s assumption of a 3.8% rise in costs to 2019 is below our 5.3%. In the
past the difference has been due to OBR assumptions that cuts in nominal spending will bring forth
growth rates of government-sector productivity higher than at any time in the past. However, their
productivity forecasts have recently been sharply reduced and the difference in the forecasts for
costs now seems to lie in assumptions about non-wage cost inflation. Our projections (table ES1)
suggest that the volume of government consumption will decline in 2018 and 2019 and will rise by
only 0.5% per annum over the whole parliament. A related assumption underlying our forecasts is
that monetary policy will loosely target a 2% per annum rate of consumer price inflation. The bank
rates which we believe will be necessary to keep inflation close to this target are shown in table ES.1.
Chart ES1: Number of New Housing Loans Each Year
In the UK private sector, the number of housing loans halved in 2008 and remained at a low level of
around 500,000 loans per year until 2013 when it began rising rapidly (chart ES1). The increase in the
number of new loans for housing was high in 2015, stimulated by government subsidies for first time
buyers. This underpinned the mini-economic boom of 2015 which we expect will continue into 2016.
Our projections for housing loans combine forecasts for a growing potential demand for loans with a
slow relaxation of the constraints on the supply of loans due to banks’ need to repair their balance
sheets. The number of additional housing loans is projected to expand throughout this parliament,
stimulated by an extended period of subsidies for first-time buyers, but with growth slowing from
400500600700800900
1,0001,1001,2001,3001,400
Number of loans (000's), UK, 1950-2025
Forecast

Forecasts derived from CBR macro-economic forecast model (UKMOD) www.cbr.cam.ac.uk/publications/
9
2018 followed by a decline as interest rates rise and both household debt and house prices become
extremely high. The pattern shown in chart ES1 is for a major credit cycle peaking in 2020-21. This
forms what Claudio Borio of the Bank of International Settlements calls a financial super-cycle, and
would constitute the 4th such cycle since WW2, each cycle lasting around 20years1.
The consequence of these assumptions is a forecast for GDP growth close to 2.2% in 2016 but falling
away after that as the Government’s expenditure cuts reduce employment and incomes as well as
the volume of public services (table ES2). The negative impact of Government spending cuts will, in
our view, be exacerbated by interest rates which rise to forestall the higher inflation generated by
the mini-boom of 2015-16. Higher interest rates are projected to have a negative impact on growth
in investment both for businesses and households. Household consumption, comprising two-thirds
of aggregate demand, is forecast to hold up well, largely due to rising household debt. The broad
picture is of a contractionary impact of government austerity offset by an expansionary stimulus
from growing household borrowing until the final years of this parliament. Beyond 2020, falling
household borrowing would depress growth further, especially if government austerity continues in
a forlorn attempt to achieve a balanced budget.
Table ES2: Overview of the Economy Forecast
This forecast for GDP is less optimistic than that of the OBR which projects GDP growing at close to
2.4% per annum in every future year. The OBR would accept that this smooth growth path might be
interrupted by what they would term ‘shocks’ (for example unanticipated recessions in world trade,
terrorist attacks etc.) but not by government fiscal or monetary policy as currently planned. Since
our forecast for GDP expects slower growth than in the OBR projections, our forecasts for
government revenue are also slower. Together with our higher projections for unemployment, this
implies a slower reduction in the Government deficit. Our expectation is that the target of a zero
deficit will not be reached within the next decade. Like the OBR we expect the public debt to peak
this year or next at 81% of GDP, but by contrast we do not anticipate much subsequent decline in
the debt to GDP ratio. By 2020 our forecast is that this debt will still be close to 77% of GDP, a level
1 Borio C(2012) The Financial Cycle and Macroeconomics. What have we learnt? Bank of International
Settlements. Working Paper WP395.
% per annum (unless otherwise stated) 2015 2016 2017 2018 2019 2020
GDP 2.7 2.2 2.0 1.7 1.1 1.3
Household consumption 4.4 4.3 3.3 3.0 2.3 1.7
General government consumption 0.1 1.0 1.8 -0.3 -0.3 1.5
Business investment 5.8 5.2 1.0 -0.2 0.1 1.4
General government investment 3.1 0.6 0.6 -1.6 1.9 2.0
Household investment 11.2 10.6 4.9 -0.2 -2.6 -3.3
Exports 2.7 0.8 1.9 3.9 3.4 3.7
Imports 5.4 5.7 4.1 3.2 3.2 3.6
CPI 0.0 1.2 1.5 2.3 2.8 2.7
Employment 2.1 1.5 0.7 -0.4 -0.7 -0.6
Average earnings 3.6 4.6 3.5 3.6 2.3 1.2
LFS unemployment (% of labour force) 4.9 4.0 4.1 5.0 5.9 6.8
Forecasts derived from CBR macro-economic forecast model (UKMOD) www.cbr.cam.ac.uk/publications/
10
considerably above the OBR’s projection of 71%., although this takes no account of government
sales of real assets and excludes the recent transfer of housing association assets and liabilities.
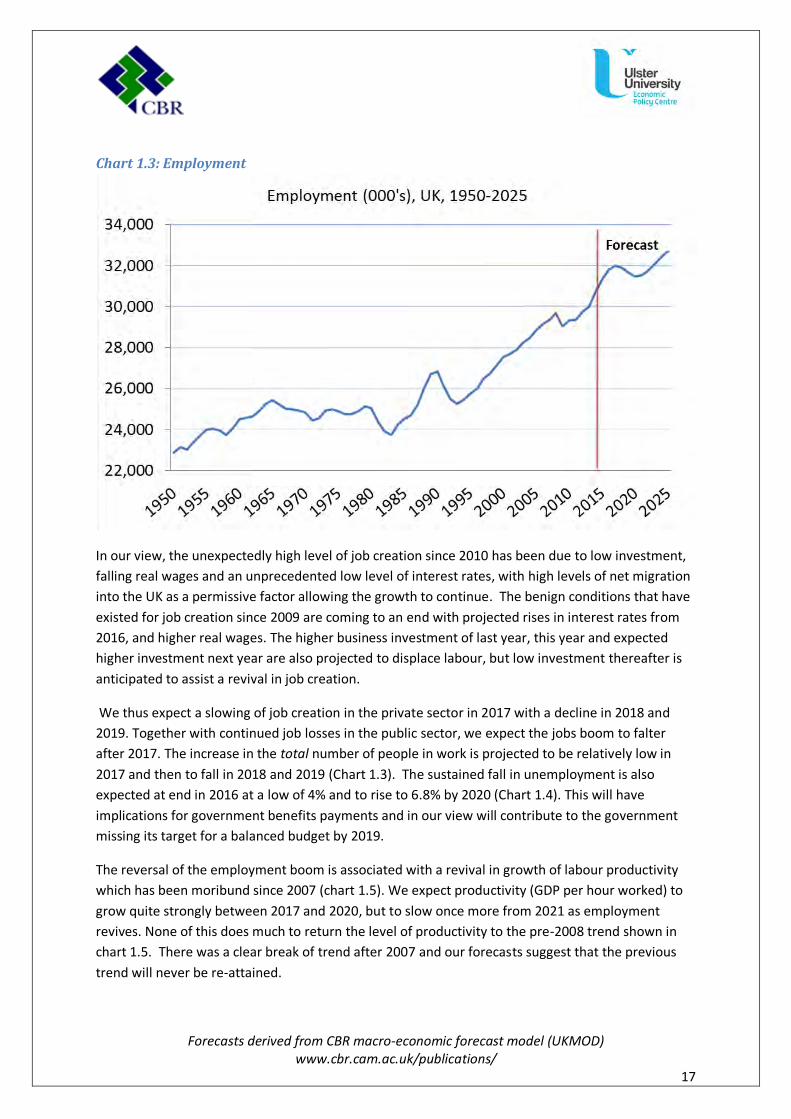
Perhaps the most dramatic aspect of this forecast is an end to the job creation boom of 2010-16. We
expect 2.5 million additional jobs will have been created in this boom by 2016, but we forecast
employment growth to slow in 2017 and to fall in 2018 and 2019. Slowing growth in GDP is one
cause. Others are increasing costs of labour and interest payments, and also the higher investment
of the boom years (which means less labour is required for any given level of output). The long fall in
the unemployment rate from its 2011 peak is also projected to end in 2016 at a low of 4%, and to
begin rising in 2017 to new peak of close to 7% by 2020. Again these forecasts are very different
from those published by the OBR which projects 600,000 more jobs by 2020 than in our baseline
projection, and an unemployment rate settling at a little over 5% in all future years. The difference
between our unemployment forecasts and those of the OBR is only partly a reflection of contrasting
views about the future of jobs. Around half of the unemployment gap is due to different views about
future levels of net working-age migration. Our forecast for net migration is at over 300,000 in every
year up to 2020, compared with a past average of 215,000 between 2010 and 2014. The OBR’s
unemployment forecast is consistent with a net migration rate of around half of ours, at 160,000 a
year. With pressures on immigration into the UK remaining strong, our view is that the OBR are
unrealistic in assuming that net migration will fall to little over half of the 2014 level.
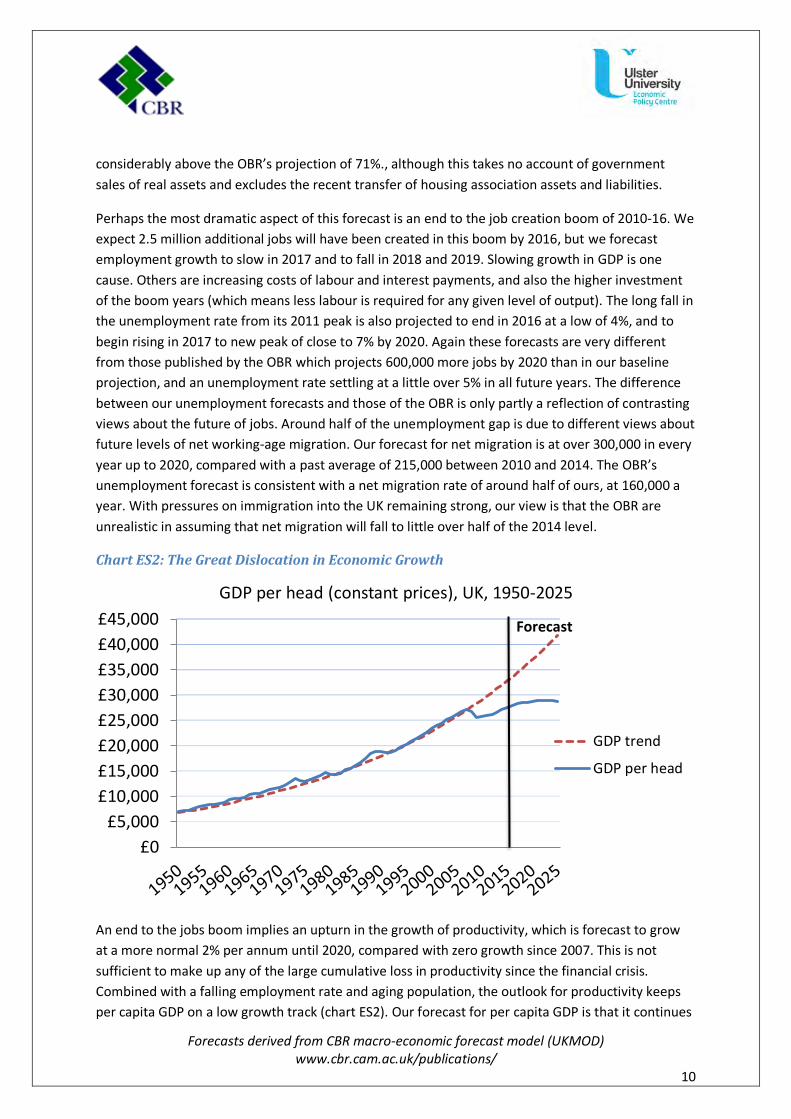
Chart ES2: The Great Dislocation in Economic Growth
An end to the jobs boom implies an upturn in the growth of productivity, which is forecast to grow
at a more normal 2% per annum until 2020, compared with zero growth since 2007. This is not
sufficient to make up any of the large cumulative loss in productivity since the financial crisis.
Combined with a falling employment rate and aging population, the outlook for productivity keeps
per capita GDP on a low growth track (chart ES2). Our forecast for per capita GDP is that it continues
£0
£5,000
£10,000
£15,000
£20,000
£25,000
£30,000
£35,000
£40,000
£45,000
GDP per head (constant prices), UK, 1950-2025
GDP trend
GDP per head
Forecast

Forecasts derived from CBR macro-economic forecast model (UKMOD) www.cbr.cam.ac.uk/publications/
11
to diverge from the pre-crisis trend which had been followed for at least 60 years. The dislocation in
this trend is the most important macroeconomic phenomenon of our times. For reasons not fully
clear, the UK economy is now on a much lower growth trajectory than for the whole of the previous
period since WW2. One important consequence is the ‘need for austerity’. GDP in 2015 is 16% below
the pre-2008 trend, and hence government tax revenues are reduced by a similar amount or around
£125 billion per annum. The need for large cuts in public spending, in an attempt to return to the
relatively small deficits of the pre-crisis years, stems from a failure of the economy to return to the
long-term trend as happened in all previous recessions. The Chancellor wishes to reduce the deficit
further, to zero by 2019/20, but in our view will not achieve this aim.
Even though our forecast is less favourable than that of the OBR, with lower GDP and higher
unemployment, we regard it as only marginally sustainable. The problems lie with excessive levels of
household borrowing and inflated house prices. With falling government spending, the only thing
preventing near recession in 2018 and 2019 is the high level of household borrowing. We expect the
number of housing loans to peak at over 1.2 million by 2018, and to drive house prices higher,
reaching an expected peak ratio of mean house prices to post-tax household income of a wholly
unprecedented 17 times incomes by 2020. This compares to a ratio of 12 in 2010 and a low of 8 in
1996. Loosening credit conditions are projected to result not only in high levels of mortgage debt but
also similarly high levels of short-term unsecured debt. Aggregate household debt would, under
these conditions, reach a level of close to two times post-tax income in 2020, a third above today’s
level and double the level of 1996. This high ratio is not solely due to a high level of borrowing, but
also to a low projected growth of household incomes.
The economics of austerity in government spending means that growth in incomes is repressed by
the multiplier effect of cuts in public spending. Growth in GDP can be maintained if expansion in
consumption and investment by households is maintained by borrowing. Eventually, levels of
household debt and house prices become unsustainable. This is not because debt repayments
become particularly high by historical standards. At a projected level of just over 5% of disposable
income by 2020, the debt interest payment rate, although double the level in recent years, would be
close to the average for the 1990s. The problem arises rather in the housing market where it
becomes difficult to sustain extraordinarily high house prices, out of line with all historic experience.
The housing market has been partly sustained by buy-to-let purchasers, partly with migrant tenants
in prospect, but rents cannot continually rise relative to incomes. At some point prices will cease to
rise, and expectations of future price increases will fade. In these circumstances a sudden collapse in
house prices can easily occur as it did in 2008-9. The possibility of defaulting loans then puts banks
under pressure. Something similar happened in 2008-9 at much lower levels of both household debt
and house prices than we expect by 2020. Bank collapses occurred in 2007-8 before UK loan default
rates became high, mainly due to housing finance problems in the USA. These led to a freezing of the
markets for inter-bank loans, and to the bankruptcy of adventurous banks like Northern Rock which
had come to depend on short-term debt rather than deposits. UK bank balance sheets are now
stronger than they were in 2008, and may be strong enough to withstand a house price collapse. If

Forecasts derived from CBR macro-economic forecast model (UKMOD) www.cbr.cam.ac.uk/publications/
12
no financial crisis occurs, we still believe that demand for loans would retreat, leading to slower
economic growth after 2020 unless offset by a rapid expansion of government spending.
The unsustainability of growth underpinned by expanding household borrowing has led us to
generate an alternative ‘reflation’ scenario in which government current and capital spending on
goods and services grows much more rapidly than in existing government plans. We have selected
the largest increases in spending compatible with inflation at under 4% per annum and a ratio of
public sector debt to GDP not exceeding its 2016 peak at 81%2. This generates a cumulative £160
billion of additional real government spending on goods and services by 2020 and over £400 billion
by 2025. In this scenario real GDP grows 0.5% per annum faster on average up to 2020, and
unemployment remains close to 4.5%, and 700,000 lower than in the baseline projection by 2020.
The result leaves government debt higher than in the baseline forecast, but gives a more balanced
outcome for the household sector. The ratio of house prices to incomes is much lower by 2020 than
in the baseline projection. Household debt is also somewhat less extreme than in the baseline,
although it is forecast to be above the previous peak level of 170% of average disposable income.
One aspect of the economy which is forecast to remain unbalanced irrespective of baseline or
reflation policies is the current account of the balance of payments. Our forecast is that the current
account deficit will remain large in both cases. We expect the deficit to remain close to a range of 4-
5% of GDP until 2020. After that our expectation is that slowing GDP growth in the UK, and
depreciating exchange rates, will lead the deficit to shrink. Even so, the forecasts are expected to
continue the experience of a balance of payments in consistent deficit, as has been the case since
the early 1980s.
Conclusion
We conclude that neither the baseline forecasts nor the reflation scenario do much to regain lost
output since 2008. In both cases GDP per head in 2020 is close to 20% below the pre-2008 trend,
with the gap continuing to rise thereafter. This demonstrates the limits of action in a single country
within a globalised economy with a substantial international deficiency of demand. Reflation in the
UK alone would leave price inflation at just under 4% per annum and public sector debt at close to
80% of GDP. Unemployment would be projected to be much lower, for at least a decade, but per
capita incomes would be only a little higher.
Whether the outcomes under the reflation scenario with faster growth and lower unemployment
are preferred to an austerity approach, which results in lower inflation and lower public sector debt,
will be a matter of political preference. Both approaches carry dangers, but they are of different
types. While public sector austerity runs a real risk of another private sector financial collapse and
2 This omits the addition to government debt from the reclassification of Housing Associations to the
government sector.

Forecasts derived from CBR macro-economic forecast model (UKMOD) www.cbr.cam.ac.uk/publications/
13
recession, a reflationary approach carries the difficulties of managing a high public sector debt if a
major economic shock were to spread to the UK from abroad. We emphasise that the reflationary
strategy produces neither a continually rising public debt ratio nor increasing inflation, which
economists assessing fiscal reflation have often most concern. The present Government and its
supporters emphasise the dangers from high government debt but largely ignore the dangers from
high household debt. A much superior approach for satisfactory economic growth in a balanced
manner would involve co-ordinated demand expansion across all of the major economies. During
the recent financial crisis China supported global demand, but even as large an economy as this
cannot go it alone indefinitely. The policy choice of governments in the USA, UK, and especially the
Eurozone, to opt for austerity makes it difficult for any single economy to reflate alone.
Forecasts derived from CBR macro-economic forecast model (UKMOD) www.cbr.cam.ac.uk/publications/
14
Part A: Economic Outlook
Chapter 1: Economic Overview
This forecast has been generated after the Government’s Autumn Statement and Spending Review
in November 2015 and is conditional on the government expenditure and tax rates projected in that
Statement, as well as on assumptions about the growth of world trade. The new Government’s first
Budget in July 2015 substantially toned down the degree of austerity that had been outlined in the
last Budget of the Coalition only four month’s previously. In the March 2015 Budget government
spending on goods and services had been planned to be cut in nominal terms by 10% in 2016 and
2017, but these cuts were eliminated in the July Budget in which nominal spending was then
projected to rise by a cumulative 1% over the three calendar years 2016-18 with no cuts in any
individual calendar year. The Autumn Statement further reduced the degree of austerity, increasing
projected government consumption by 2-3% per annum more in 2017-19 and government
investment by 5% per annum more in 2016-17.
Although no cuts are now projected, the slow rise in nominal government spending implies a
minimal rise in real government current spending with, in our view, small reductions in real
government consumption in 2018 and 2019. Together with an expected rise in world trade which is
slow by historic standards, our forecast for GDP is one with slowing growth for the whole of the
period to 20203. Unlike the OBR, our forecast does not depend on the assumption that GDP will
converge on full capacity operation of the economy, or on the OBR’s assumption that this capacity
will itself expand by a steady 2.4% per annum. Instead our forecast is generated by econometric
equations without assumptions about the growth of productive capacity4. As a result our forecasts
are driven primarily by projections of demand. This includes investment, with the result that growth
in capacity is endogenous to the model and not influenced by exogenous assumptions.
The relaxation of austerity in 2014 in the run-up to the last general election, together with boosts to
the housing market, generated relatively rapid growth in 2014 with knock-on effects into 2015 and
2016. As a result there has been reasonable growth of GDP in 2015 at 2.6% per annum and we
expect growth in 2016 at 2.2% per annum. However, the slow growth of government demand from
2016, together with expected restrained expansion in UK export markets, means that growth in
aggregate GDP is projected to slow from 2017 onwards, giving an average growth rate much slower
than the 2.4% per annum forecast by the OBR. This slow rate would not be fast enough to prevent a
reversal of recent falls in unemployment. Although growth in consumer spending is forecast to
3 We have ignored the implausible OBR forecast of 3.5% growth in government real consumption in 2020-21.
Since we forecast that the planned zero deficit for 2019 will not be achieved there seems little sense in assuming a surge in government consumption even in what is likely to be an election year. 4 Our UKMOD macroeconomic model is described in the manual located on the website of the Centre for
Business Research, Judge Business School, University of Cambridge, www.cbr.cam.ac.uk/publications

Forecasts derived from CBR macro-economic forecast model (UKMOD) www.cbr.cam.ac.uk/publications/
15
remain robust, investment spending by both companies and households is expected to slow down
and then fall in the middle of this Parliament.
Chart 1.1: GDP per Annum
The failure of the economy to maintain growth at around 2.5% per annum for an extended period
means that per capita GDP will diverge ever further from the pre-2008 trend that had been
maintained since the modern National Accounts records began in 1948. This divergence now looks
permanent. Per capita GDP is already 16% below the pre-2007 trend and by 2020 is expected to be
23% below that trend. The cumulative loss of GDP relative to the pre-2007 trend is already over
100% of annual GDP and by 2020 is projected to be over 200%.

Forecasts derived from CBR macro-economic forecast model (UKMOD) www.cbr.cam.ac.uk/publications/
16
Chart 1.2: GDP per Head
This huge loss of income necessarily entails a large reduction in government tax revenues. It is this
loss which has driven public debt up to 80% of GDP and which has led both the Coalition and the
present Government to restrain public spending in order to eventually reduce the debt. Because we
are less optimistic than the OBR about future growth in GDP, and hence about the expansion of tax
revenues, we expect that the government deficit will not be eliminated within the next decade, and
that the Government’s own target date of 2019 will be missed by 2% of GDP. Public Sector Net Debt
is projected to fall from a 2015 peak of just over 80% to reach 77% by 2020. The more optimistic
OBR projection is for net debt to fall to 68% by 2020.
1.1: Labour Market Overview
The main reason that there has not been greater public concern about the loss of GDP has been, in
our view, that the pain has been relatively widely shared and not concentrated upon the
unemployed as in previous recessions and as famously occurred in the 1930s. Employment has risen
much faster than the OBR envisaged in its first, 2010, forecast to the extent that productivity
remains close to its 2007 level. The OBR was not alone in failing to foresee the end of the previously
well-established relationship between GDP and employment, and it is still not well understood.
£0
£5,000
£10,000
£15,000
£20,000
£25,000
£30,000
£35,000
£40,000
£45,000
GDP per head (constant prices), UK, 1950-2025
GDP trend
GDP per head
Forecast
Forecasts derived from CBR macro-economic forecast model (UKMOD) www.cbr.cam.ac.uk/publications/
17
Chart 1.3: Employment
In our view, the unexpectedly high level of job creation since 2010 has been due to low investment,
falling real wages and an unprecedented low level of interest rates, with high levels of net migration
into the UK as a permissive factor allowing the growth to continue. The benign conditions that have
existed for job creation since 2009 are coming to an end with projected rises in interest rates from
2016, and higher real wages. The higher business investment of last year, this year and expected
higher investment next year are also projected to displace labour, but low investment thereafter is
anticipated to assist a revival in job creation.
We thus expect a slowing of job creation in the private sector in 2017 with a decline in 2018 and
2019. Together with continued job losses in the public sector, we expect the jobs boom to falter
after 2017. The increase in the total number of people in work is projected to be relatively low in
2017 and then to fall in 2018 and 2019 (Chart 1.3). The sustained fall in unemployment is also
expected at end in 2016 at a low of 4% and to rise to 6.8% by 2020 (Chart 1.4). This will have
implications for government benefits payments and in our view will contribute to the government
missing its target for a balanced budget by 2019.
The reversal of the employment boom is associated with a revival in growth of labour productivity
which has been moribund since 2007 (chart 1.5). We expect productivity (GDP per hour worked) to
grow quite strongly between 2017 and 2020, but to slow once more from 2021 as employment
revives. None of this does much to return the level of productivity to the pre-2008 trend shown in
chart 1.5. There was a clear break of trend after 2007 and our forecasts suggest that the previous
trend will never be re-attained.

Forecasts derived from CBR macro-economic forecast model (UKMOD) www.cbr.cam.ac.uk/publications/
18
Chart 1.4: Unemployment Rate
Chart 1.5: Productivity
Forecasts derived from CBR macro-economic forecast model (UKMOD) www.cbr.cam.ac.uk/publications/
19
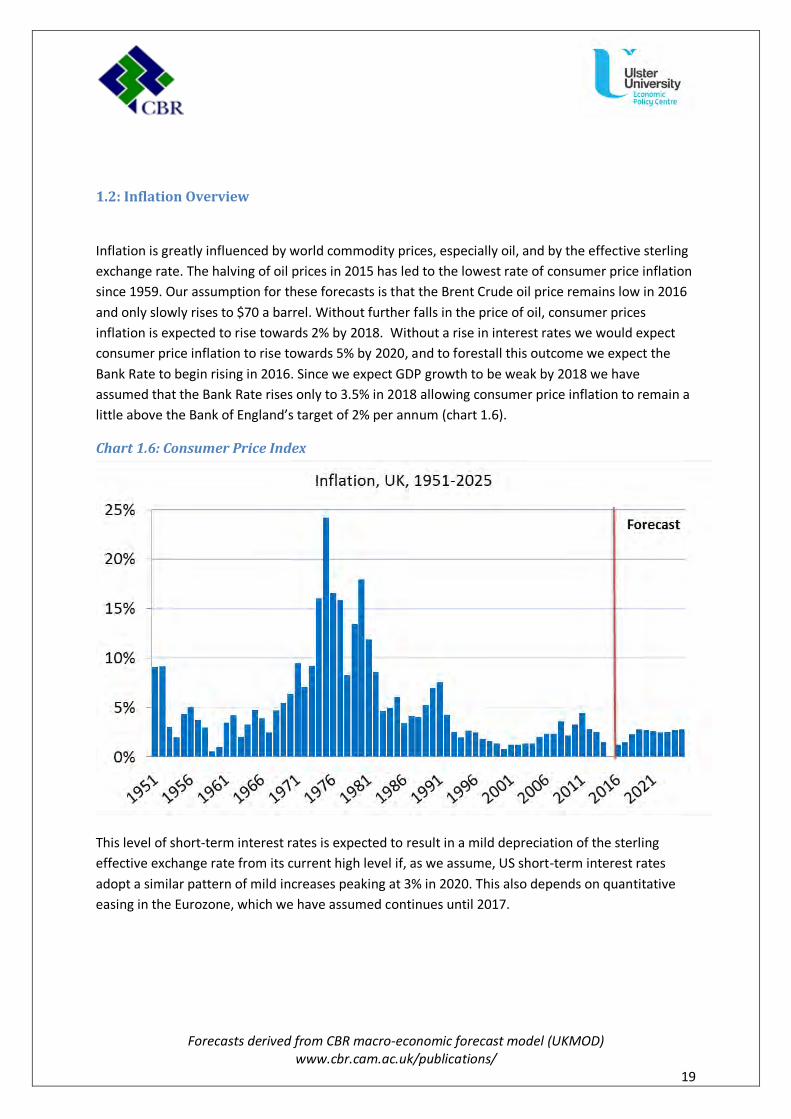
1.2: Inflation Overview
Inflation is greatly influenced by world commodity prices, especially oil, and by the effective sterling
exchange rate. The halving of oil prices in 2015 has led to the lowest rate of consumer price inflation
since 1959. Our assumption for these forecasts is that the Brent Crude oil price remains low in 2016
and only slowly rises to $70 a barrel. Without further falls in the price of oil, consumer prices
inflation is expected to rise towards 2% by 2018. Without a rise in interest rates we would expect
consumer price inflation to rise towards 5% by 2020, and to forestall this outcome we expect the
Bank Rate to begin rising in 2016. Since we expect GDP growth to be weak by 2018 we have
assumed that the Bank Rate rises only to 3.5% in 2018 allowing consumer price inflation to remain a
little above the Bank of England’s target of 2% per annum (chart 1.6).
Chart 1.6: Consumer Price Index
This level of short-term interest rates is expected to result in a mild depreciation of the sterling
effective exchange rate from its current high level if, as we assume, US short-term interest rates
adopt a similar pattern of mild increases peaking at 3% in 2020. This also depends on quantitative
easing in the Eurozone, which we have assumed continues until 2017.

Forecasts derived from CBR macro-economic forecast model (UKMOD) www.cbr.cam.ac.uk/publications/
20
1.3: Conclusion
In conclusion, our medium-term outlook is less rosy than the OBR forecasts. This is partly because
cuts in public spending are larger in real terms, and have a larger economic impact in our more
Keynesian model than under the OBR system which ensures convergence of GDP to an assumed
steady growth path for productive capacity. Our forecast for GDP has similar growth to the OBR in
2016 but substantially slower growth thereafter. The net result is that real GDP would be 3.2% lower
in 2020 under our forecasts than in the OBR forecast. If the OBR were to persist beyond 2020 in
assuming a 2.4% per annum annual growth rate for GDP, the result in 2025 would be a level of GDP
10% above our projection.
Most forecasters, including the OBR have had difficulty forecasting the path of employment (and
hence also productivity). Our forecasts for employment diverge substantially from those of the OBR.
The OBR projects continued growth in the number of people employed although at a slower pace
than the impressive rate of job creation since 2009. In contrast, our forecast for employment is that
rapid growth will continue to 2017 but be reversed in 2018 and 2019, and that the number of people
employed in 2020 will be similar to that in 2015. This leads to a large difference in the employment
projections, with the OBR forecasting over 500,000 more people in work by 2020 than in our
baseline forecast.
In other respects the forecasts are similar including consumer price inflation, since both models
assume that monetary policy will pursue a 2% per annum target for price inflation. In our forecasts
the Bank Rate has to rise to 3.5% to maintain consumer price inflation at close to 2%. The OBR’s rise
is less with the Bank Rate reaching 2% only by 2020. Since we forecast slow growth in GDP and rising
unemployment we would expect the Bank of England to keep interest rates somewhat lower than
needed to strictly maintain the 2% inflation target, just as it did in 2010/11.
The huge gap between forecast GDP and the pre-2007 trend for GDP is projected to continue
widening to reach 23% of the trend by 2020 and 33% by 2025. The faster growth projected by the
OBR would do relatively little to narrow this gap. Nor as we suggest in Part B below could a UK fiscal
and monetary reflation achieve much on its own. What is needed is a large scale co-ordinated
international reflation with world trade growing at around 10% instead of the 4-5% range assumed
in the baseline forecast.
Even the slow economic growth projected in our baseline forecasts is dependent on households
continuing to expand their mortgage debt. The ratio of total debt to disposable income for the
household sector has fallen back from its 2007 peak at 1.68 to reach 1.47 in 2014 but is forecast to
rise steeply once again reaching close to 2.0 in 2020. Such a high ratio is unprecedented for the UK.
Although several Scandinavian economies currently have higher ratios, these countries still retain tax
relief on mortgage interest payments. If the Scandinavian levels are adjusted for tax relief their
comparable ratio might be around 1.8. Hence, by 2020 household debt levels in the UK might be in

Forecasts derived from CBR macro-economic forecast model (UKMOD) www.cbr.cam.ac.uk/publications/
21
uncharted territory. High levels of new mortgage debt are also projected to result in
unprecedentedly high ratios of house prices to household income. The house price ratio reached a
historically high level of 14 in 2007. Although it fell back a little in 2009, the fall was much less than
in the USA and was soon reversed to reach another record of 15 in 2015. On current government
policies for housing our forecasts suggest a ratio of 17 by 2020 making homes increasingly
unaffordable for young and other first-time buyers. Such high levels of house prices will exert a
strain on the financial system. This is not directly modelled here but suggests that the danger of
another banking crisis will steadily increase. There are signs that the Bank of England is aware of the
dangers of a renewed boom in household borrowing. The Chancellor also plans to address the
housing shortage, although measures to assist first-time buyers are offset by increased costs for buy-
to-ley investors. It is not obvious however that the Chancellor’s measures will moderate the rise in
house prices.
Forecasts derived from CBR macro-economic forecast model (UKMOD) www.cbr.cam.ac.uk/publications/
22
Chapter 2: Forecast in Detail
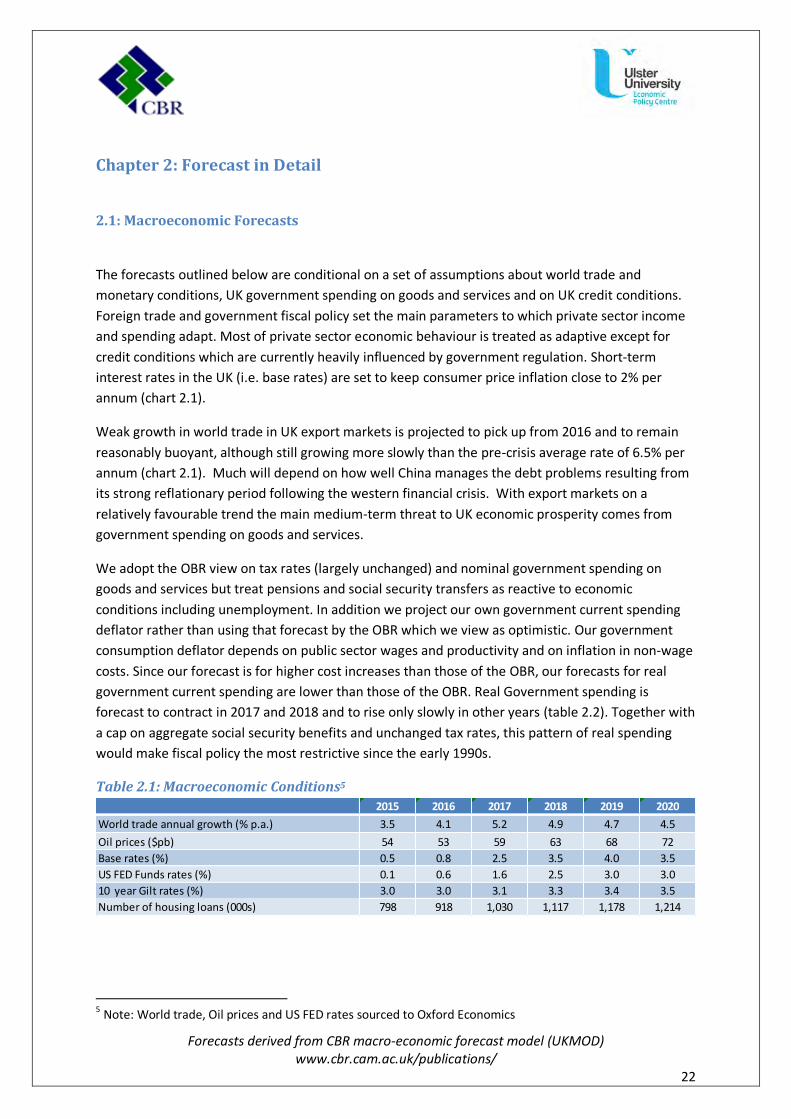
2.1: Macroeconomic Forecasts
The forecasts outlined below are conditional on a set of assumptions about world trade and
monetary conditions, UK government spending on goods and services and on UK credit conditions.
Foreign trade and government fiscal policy set the main parameters to which private sector income
and spending adapt. Most of private sector economic behaviour is treated as adaptive except for
credit conditions which are currently heavily influenced by government regulation. Short-term
interest rates in the UK (i.e. base rates) are set to keep consumer price inflation close to 2% per
annum (chart 2.1).
Weak growth in world trade in UK export markets is projected to pick up from 2016 and to remain
reasonably buoyant, although still growing more slowly than the pre-crisis average rate of 6.5% per
annum (chart 2.1). Much will depend on how well China manages the debt problems resulting from
its strong reflationary period following the western financial crisis. With export markets on a
relatively favourable trend the main medium-term threat to UK economic prosperity comes from
government spending on goods and services.
We adopt the OBR view on tax rates (largely unchanged) and nominal government spending on
goods and services but treat pensions and social security transfers as reactive to economic
conditions including unemployment. In addition we project our own government current spending
deflator rather than using that forecast by the OBR which we view as optimistic. Our government
consumption deflator depends on public sector wages and productivity and on inflation in non-wage
costs. Since our forecast is for higher cost increases than those of the OBR, our forecasts for real
government current spending are lower than those of the OBR. Real Government spending is
forecast to contract in 2017 and 2018 and to rise only slowly in other years (table 2.2). Together with
a cap on aggregate social security benefits and unchanged tax rates, this pattern of real spending
would make fiscal policy the most restrictive since the early 1990s.
Table 2.1: Macroeconomic Conditions5
5 Note: World trade, Oil prices and US FED rates sourced to Oxford Economics
2015 2016 2017 2018 2019 2020
World trade annual growth (% p.a.) 3.5 4.1 5.2 4.9 4.7 4.5
Oil prices ($pb) 54 53 59 63 68 72
Base rates (%) 0.5 0.8 2.5 3.5 4.0 3.5
US FED Funds rates (%) 0.1 0.6 1.6 2.5 3.0 3.0
10 year Gilt rates (%) 3.0 3.0 3.1 3.3 3.4 3.5
Number of housing loans (000s) 798 918 1,030 1,117 1,178 1,214

Forecasts derived from CBR macro-economic forecast model (UKMOD) www.cbr.cam.ac.uk/publications/
23
Chart 2.1: Bank of England Interest Base Rates
A combination of an improved outlook for UK world trade markets and continuing expansion in
household borrowing, with growing austerity in public spending, underlies the forecasts shown in
Table 2.2. GDP growth is forecast to remain close to 2.3% in 2016 but slows after that as austerity
begins to bite and interest rates rise. Household consumption is forecast to grow relatively rapidly
throughout the period and to increasingly account for most of the growth in demand (chart 2.2).
Large slowdowns are projected in both business and household investment if, as we expect, the
interest rate rise in 2017 is quite sharp.
Net trade is forecast to make a negative impact on GDP in 2016 and even more so in 2017 (chart
2.2). Relatively fast growth in domestic demand leads to fast growth in import volumes. This slows
somewhat in 2017 as domestic demand slows. Export volume growth is projected to be quite strong
up to 2020. Initially world trade is expected to support export volumes growth at close to or above
3% per annum. Later in the period as overseas markets are projected to grow a little less rapidly, we
expect the sterling effective exchange rate to begin weakening. This will support growth in the
export volumes but not immediately choke off growth in imports (which are influenced inter alia by
the volume of exports), and net trade is projected to continue to have a small but slightly negative
impact on GDP growth.
Consumer price inflation has remained at an unusually low level though 2015 due to the impact of
falling world oil and other commodity prices. As these price reductions leave the index, inflation will
rise, but we assume that Bank of England base rates will begin their first rise since 2007 in
anticipation of higher future inflation. We have assumed a steady set of interest rate rises through
2016 to leave the annual average at 0.75%. However the almost daily media pre-occupation with the

Forecasts derived from CBR macro-economic forecast model (UKMOD) www.cbr.cam.ac.uk/publications/
24
timing of rate rises is, in our view, misplaced. A lower set of interest rate rises during 2016, or indeed
no rise at all in 2016, would be projected to have only a minor impact on future inflation and GDP,
although it would allow greater job creation (and hence lower productivity growth).
Table 2.2: Overview of the Economy Forecast
With the path of interest rates used in our baseline forecasts, and described in Table 2.1,
employment growth is forecast to cease after 2017. Rising costs of labour and debt servicing are the
main causes, although faltering company investment will help to boost jobs in later years by keeping
productivity low.
Chart 2.2: Components of GDP
Over 400,000 new jobs have been created each year on average since 2012, but we expect 2016 to
experience the last expansion on this scale. In the public sector, job reductions are projected in
% per annum (unless otherwise stated) 2015 2016 2017 2018 2019 2020
GDP 2.7 2.2 2.0 1.7 1.1 1.3
Household consumption 4.4 4.3 3.3 3.0 2.3 1.7
General government consumption 0.1 1.0 1.8 -0.3 -0.3 1.5
Business investment 5.8 5.2 1.0 -0.2 0.1 1.4
General government investment 3.1 0.6 0.6 -1.6 1.9 2.0
Household investment 11.2 10.6 4.9 -0.2 -2.6 -3.3
Exports 2.7 0.8 1.9 3.9 3.4 3.7
Imports 5.4 5.7 4.1 3.2 3.2 3.6
CPI 0.0 1.2 1.5 2.3 2.8 2.7
Employment 2.1 1.5 0.7 -0.4 -0.7 -0.6
Average earnings 3.6 4.6 3.5 3.6 2.3 1.2
LFS unemployment (% of labour force) 4.9 4.0 4.1 5.0 5.9 6.8

Forecasts derived from CBR macro-economic forecast model (UKMOD) www.cbr.cam.ac.uk/publications/
25
every year, and with the end of offsetting job creation in the private sector, total employment will
decline.
As a consequence of the end of employment expansion, unemployment rates are projected to reach
their lowest point at 3.9% in 2016 and to then rise steadily to over 6.8% by 2020. Unemployment
will be pushed up by a projected continuous rise in potential labour supply. The indigenous
population of working age will decline throughout the period, although we expect the number of
people aged over 64 who are in work to continue rising at its recent rate of over 80,000 per year.
The largest boost to labour supply is however predicted to come from continuing high levels of
working-age migration which we expect to run at over 300,000 even with some diminution due to
rising unemployment. Cumulative net migration has been broadly equal to the additional number of
people in work since the Millennium and this trend is forecast to continue until 2017. After 2017 the
forecast scale of net migration is above the projected level of job creation, which implies a greater
level of displacement of indigenous workers than in the past. Migration did continue at a high rate in
2009 even as large numbers of jobs were lost, and so this phenomenon would not be
unprecedented, but obviously the relationship between jobs and migration will be sensitive to policy
changes and to the outcome of the EU referendum due before the end of 2017.
After seven lean years of falling or stationary real wages, real wages have risen rapidly in 2015 with
relatively large wage rises in the private sector, and helped in both public and private sectors by the
virtual disappearance of consumer price inflation in 2015. For the future, the Government plans to
hold down public sector wages are assumed to weaken, with increases of 2% per annum until 2019,
allowing rising real wages in the government sector through much of this parliament. The long
squeeze on public sector pay since 2008 is bringing wages more into line with private sector wages
after the period during the last Labour government when public sector pay pulled ahead. By 2018
average public wages will be 5% above those in the private sector reflecting the higher skills profile
in the public sector with its large component of professional occupations including teachers, doctors
and nurses. Even if the public sector wage squeeze were to be attempted to be maintained beyond
2018 we would expect rising industrial unrest in the still quite strongly unionised public sector, and
hence we expect that public sector wages will move in line with those in the private sector.
2.1: Fiscal Forecasts
The Government remains committed to a policy of reducing the large financial deficit that emerged
during the financial crisis of 2008. The Coalition Government had intended to eliminate its deficit by
2015 but failed to do so, and the current Government has a target of 2019. Cuts to its current
spending, known as Resource Departmental Expenditure Limits (RDEL) including public sector pay
restrictions, plus limits on social security benefits and lower debt interest payments are all intended
to reduce government sector net debt to 71.5% by 2019-2020. This target rests on the OBR’s
assumption of 2.4% per annum growth rates for GDP every year from 2016. As outlined above, our
lower forecast of GDP implies smaller increases in tax revenues and a slower reduction in the

Forecasts derived from CBR macro-economic forecast model (UKMOD) www.cbr.cam.ac.uk/publications/
26
Government’s annual net deficit. Our forecast for the fiscal deficit is 2% of GDP in 2020 (table 2.3)
and 1.1% in 2025. The deficit will thus not be eliminated in our projections over the next decade.
This is turn means a slower reduction in the Government’s Net Debt which we expect to be 77% in
2020 (Chart 2.2), and well above the OBR’s forecast of 70% in 2020. This in turn means that
Government debt interest payments will be higher than the OBR expect and will contribute to a
higher deficit.
Although we use the OBR’s calculations about the Government’s expenditure plans in nominal
terms, our estimates of government plans for public sector wages and productivity, and general
inflation leads to rather different estimates of current spending in real terms. In addition our higher
unemployment forecasts imply higher spending on social security benefits6.
Table 2.3: Fiscal Overview
Chart 2.3: Government Debt and Deficit
The Government’s plans for spending on goods and services, plus our projections for social security
spending and debt interest payments, imply that the Government’s Total Managed Expenditure
(TME) will fall to 39% of GDP by 2020. This will be the lowest since the mid-1950s, except for the
6 Care is needed in interpreting figures for government consumption in real terms in the OBR’s Economic and
Fiscal Outlook reports (EFOS). The OBR’s figures for financial cuts in real terms use a GDP deflator, in contrast to the government current spending deflator used to estimate real current spending.
% of GDP: current prices 2015 2016 2017 2018 2019 2020
Total managed expenditure 40.6 40.5 40.6 40.4 40.2 40.0
General government receipts 36.9 37.9 38.2 38.0 37.7 37.3
General government deficit -3.1 -2.1 -1.9 -1.9 -2.0 -2.1
Public sector net debt 80.1 80.0 79.2 78.0 77.1 76.7

Forecasts derived from CBR macro-economic forecast model (UKMOD) www.cbr.cam.ac.uk/publications/
27
early years of the first Blair Government in 1997-99. In the 1950s defence spending and debt interest
amounted to 14% of GDP compared to under 5% today, but social security was much lower. These
three items together accounted for about the same proportion of GDP as they do today.
Current and capital spending on goods and services (e.g. education, health, defence etc.) is forecast
to be 19% of GDP by 2020. Although this is lower than most post-WW2 years, it is higher as a
proportion of nominal GDP than in 1997-9 following four successive terms of Thatcherite policies.
The government sector (excluding public corporations) provided 35% of real spending in the 1950s
and 1960s when public services were cheaper relative to goods and services supplied by the private
sector. Today the equivalent figure would be 22%, a figure expected not to fall below 21% in the
forecasts. The economy has not yet approached uncharted waters for the size of the public sector.
Nominal spending on goods and services excluding defence has been lower than the projected 2020
level as a proportion of GDP several times since WW2. However ring fencing for health and foreign
aid spending means that other departments will have lower spending relative to GDP than at any
time since WW2.
Table 2.4: GDP Deflators Annual Growth
% per annum (unless otherwise stated) 2015 2016 2017 2018 2019 2020
GDP deflator 2.1 0.6 1.5 2.2 2.7 2.1
Consumer price deflator 0.0 1.2 1.5 2.3 2.8 2.7
Government consumption deflator 0.3 0.2 0.2 1.7 1.8 0.4
Import deflator -6.9 -3.0 0.2 3.3 3.9 4.4
Export deflator -4.6 -2.6 0.1 2.9 3.7 3.8

Forecasts derived from CBR macro-economic forecast model (UKMOD) www.cbr.cam.ac.uk/publications/
28
Chapter 3: Consumption
As already noted, consumers’ expenditure is projected to grow at a consistently favourable rate
throughout the forecast period. Since consumer spending accounts for two-thirds of GDP, this trend
dominates the overall forecast. One result is that household consumption is forecast to rise from
64% of GDP in 2015 to 69% by 2020. At 68%, consumption would comprise a higher proportion of
GDP than at any time since the early 1950s. In one sense this might be welcomed, at least by those
who regard a small state as beneficial. The declining level of public spending and hence taxation
leaves more of GDP for household consumption. Of course this view would depend on the quality of
public services including national security and aspects such as education and research which feed
into future economic growth.
Table 3.1: Consumption
Of greater concern is the reliance of economic growth on consumption in a context of relatively slow
growth in other drivers of economic growth including world trade and UK government spending. Any
slowdown in consumer spending would have serious consequences for overall economic growth. In
this situation it is important to take a view on the realism and sustainability of the factors underlying
the growth in consumption. The consumption function which generates these forecasts for
consumer spending is relatively conventional in that long-term spending depends on:
Household income
Net Financial Assets
New borrowing both long-term (mortgages) and short-term
Repayments of mortgages
Short-term influences are changes in the value of equities and houses, and changes in household
incomes.
One factor maintaining relatively rapid growth in consumption is the growth in real wages and wider
household income (table 3.2). Real wages in the private sector, as already noted are boosted in the
short-run by a tight labour market with labour shortages in some occupations and areas, leading to
better nominal wage settlements than in recent years. Low consumer price inflation also boosts the
real value of these nominal settlements. Public sector wages are still being held down in what
amounts to a government wages policy, and will continue to be constrained under current
government plans for much of this parliament, even though the overshoot in public sector pay
% per annum (unless otherwise stated) 2015 2016 2017 2018 2019 2020
Households final consumption 4.4 4.3 3.3 3.0 2.3 1.7
Household income 6.8 4.1 3.3 3.2 2.6 2.5
Savings ratio (%) 7.6 5.5 3.8 2.2 0.5 -0.4
Household debt: income ratio 1.4 1.5 1.6 1.7 1.8 1.9
Number of new loans for housing (000s) 798 918 1,030 1,117 1,178 1,214

Forecasts derived from CBR macro-economic forecast model (UKMOD) www.cbr.cam.ac.uk/publications/
29
during the Labour years will have been largely corrected by 2018. We have doubts that any attempt
to extend this pay policy will be any more successful than the pay policies of the 1960s and 1970s.
Table 3.2: Components of Real Household Income Growth
Beyond 2016 the weakening labour market is predicted to lead to slower growth in real wages in the
private sector while the real value of public sector wages are eroded by rising price inflation. Growth
in household incomes will also be dampened by slow growth in social security receipts. The
Government’s cap on aggregate social security benefits will hold down benefits in real terms despite
the projected context of rising unemployment. Rising interest rates in 2016 and 2017 are also
projected to reduce the real value of net property income, profits of unincorporated businesses and
self-employed income. Finally, rising taxes and social security contributions reduce the growth of
post-tax household incomes over the first years, but beyond 2017 are expected to have little impact
when wages are growing slowly.
While household disposable income is strongly supporting consumption in 2015, its relatively slow
growth through the rest of the forecast period means that it is not the main factor supporting
consistently rapid expansion of consumption. Nor does any increase in net financial wealth buoy up
consumption. On the contrary, the rapid expansion of household debt through the period means
that net wealth declines steadily. Instead, it is the flow of new borrowing that is most important. Our
(relatively cautious) assumptions about the number of new housing loans (table 3.1), implies fast
growth until 2018. This easing in credit conditions supports continuing rises in house prices and is
also reflected in short-term lending.
Once the annual number of housing loans approaches the high pre-crisis levels even smallish
percentage increases lead to a large change in the value of household debt relative to incomes. This
is shown in Chart 3.1. Although most of the new debt is taken out to finance house purchases we
estimate that around one sixth of this amount leaks into consumption. This is because most loans
are for the purchase of existing houses and in these cases the money flows immediately into the
bank accounts of those sellers at the end of housing chains.
% per annum: constant prices 2015 2016 2017 2018 2019 2020
Households disposable income 6.8 4.1 3.3 3.2 2.6 2.5
Private sector earnings per employee 4.2 4.0 2.3 1.6 -0.4 -1.5
Public sector earnings per employee 0.6 0.2 -1.4 -2.3 -1.3 0.6
Pensions & social benefits per head 1.0 -0.8 -2.6 -0.3 0.5 1.9
Net property income & profits per head 2.8 -9.8 -5.7 0.6 5.4 8.8
Direct taxes & NI contributions 7.7 5.3 3.2 1.6 0.2 -0.7
Forecasts derived from CBR macro-economic forecast model (UKMOD) www.cbr.cam.ac.uk/publications/
30
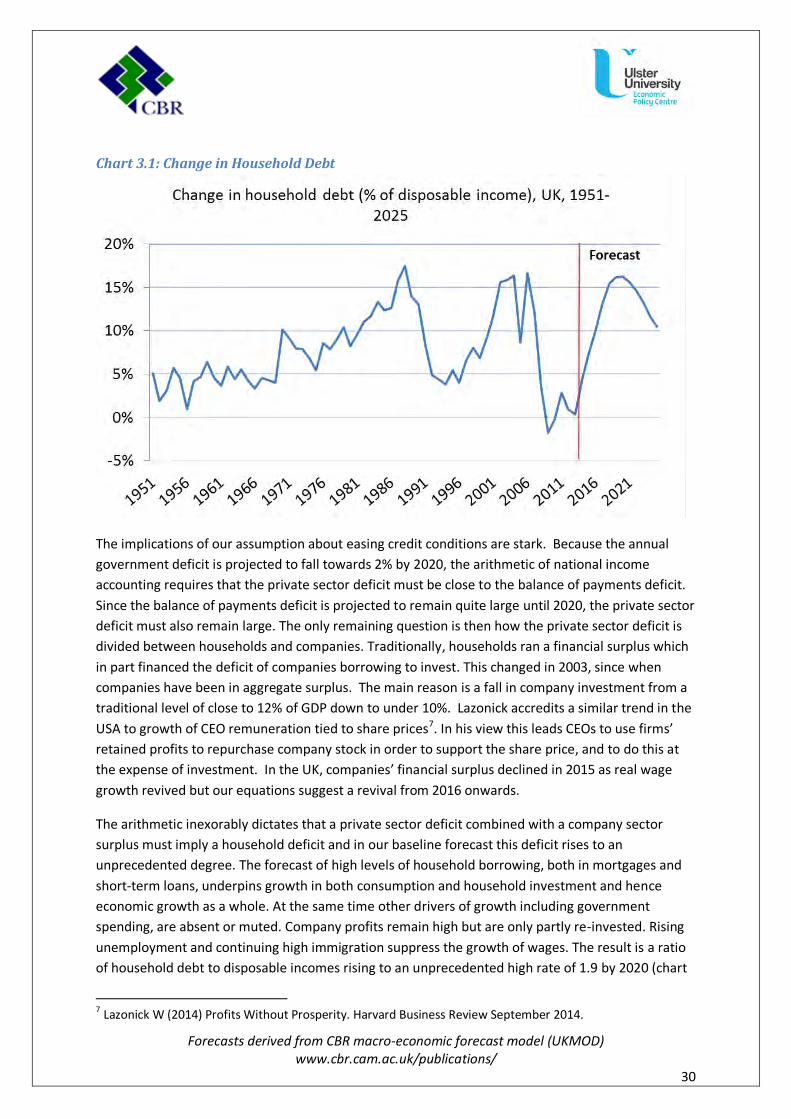
Chart 3.1: Change in Household Debt
The implications of our assumption about easing credit conditions are stark. Because the annual
government deficit is projected to fall towards 2% by 2020, the arithmetic of national income
accounting requires that the private sector deficit must be close to the balance of payments deficit.
Since the balance of payments deficit is projected to remain quite large until 2020, the private sector
deficit must also remain large. The only remaining question is then how the private sector deficit is
divided between households and companies. Traditionally, households ran a financial surplus which
in part financed the deficit of companies borrowing to invest. This changed in 2003, since when
companies have been in aggregate surplus. The main reason is a fall in company investment from a
traditional level of close to 12% of GDP down to under 10%. Lazonick accredits a similar trend in the
USA to growth of CEO remuneration tied to share prices7. In his view this leads CEOs to use firms’
retained profits to repurchase company stock in order to support the share price, and to do this at
the expense of investment. In the UK, companies’ financial surplus declined in 2015 as real wage
growth revived but our equations suggest a revival from 2016 onwards.
The arithmetic inexorably dictates that a private sector deficit combined with a company sector
surplus must imply a household deficit and in our baseline forecast this deficit rises to an
unprecedented degree. The forecast of high levels of household borrowing, both in mortgages and
short-term loans, underpins growth in both consumption and household investment and hence
economic growth as a whole. At the same time other drivers of growth including government
spending, are absent or muted. Company profits remain high but are only partly re-invested. Rising
unemployment and continuing high immigration suppress the growth of wages. The result is a ratio
of household debt to disposable incomes rising to an unprecedented high rate of 1.9 by 2020 (chart
7 Lazonick W (2014) Profits Without Prosperity. Harvard Business Review September 2014.

Forecasts derived from CBR macro-economic forecast model (UKMOD) www.cbr.cam.ac.uk/publications/
31
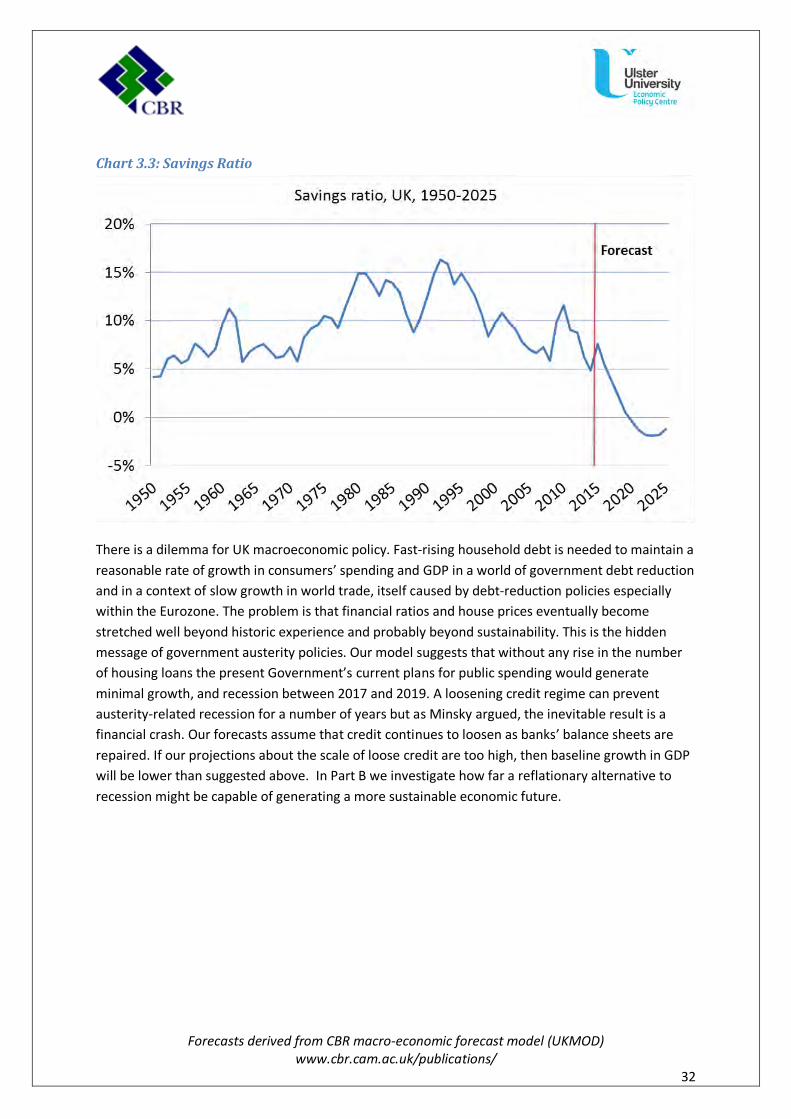
3.2). At the same time the household savings ratio is projected to fall to zero by 2020 (chart 3.3).
The trend of a rising private deficit is much the same in the OBR forecast. However the split between
households and companies is very different in the OBR forecast where it is companies rather than
households which run unprecedented large deficits. This difference stems from the OBR assumption
that credit conditions will remain tighter than in our forecast. This is a change in the OBR view since
as late as December 2014 the OBR assumed that household debt would rise almost as much as we
now assume.
Chart 3.2: Debt / Income Ratio
We might ask whether such unprecedented outcomes by 2020 are sustainable. If the Government
persists in running a financial surplus beyond 2020 while credit conditions continue to permit a high
level of household borrowing, then the economy would move into ever more uncharted territory.
The household debt ratio would, in our view, rise to around 2.3 and the savings ratio would become
negative for the first time since modern records began in 1948. The ratio of mean house prices to
disposable income is already above its previous 2007 peak level of 14 and could reach 17 by 2020
(see chapter 8). It seems unlikely that these extreme ratios could be sustained. The factors most
likely to prevent the extremes would be a crash in house prices and an associated banking crisis. A
substantial programme of social sector house building or other measures to promote supply or
constrain demand, could mitigate the most extreme rises in these ratios but none of these is
included within the plans of the present government.
Forecasts derived from CBR macro-economic forecast model (UKMOD) www.cbr.cam.ac.uk/publications/
32
Chart 3.3: Savings Ratio
There is a dilemma for UK macroeconomic policy. Fast-rising household debt is needed to maintain a
reasonable rate of growth in consumers’ spending and GDP in a world of government debt reduction
and in a context of slow growth in world trade, itself caused by debt-reduction policies especially
within the Eurozone. The problem is that financial ratios and house prices eventually become
stretched well beyond historic experience and probably beyond sustainability. This is the hidden
message of government austerity policies. Our model suggests that without any rise in the number
of housing loans the present Government’s current plans for public spending would generate
minimal growth, and recession between 2017 and 2019. A loosening credit regime can prevent
austerity-related recession for a number of years but as Minsky argued, the inevitable result is a
financial crash. Our forecasts assume that credit continues to loosen as banks’ balance sheets are
repaired. If our projections about the scale of loose credit are too high, then baseline growth in GDP
will be lower than suggested above. In Part B we investigate how far a reflationary alternative to
recession might be capable of generating a more sustainable economic future.

Forecasts derived from CBR macro-economic forecast model (UKMOD) www.cbr.cam.ac.uk/publications/
33
Chapter 4: Investment
Investment is one of the most difficult aspects of macroeconomic behaviour to predict, hence
Keynes’ term ‘animal spirits’ for the causes of fluctuations in investment. In the CBR model we
separately forecast three types of investment. Government investment is taken directly from
government plans as interpreted by the OBR in both nominal and real terms. Investment by
companies and by households is forecast using a separate equation in each case.
Company investment is related in the long term to company profits and tax rates and to the cost of investment as indicated by real interest rates, capital tax allowances and the relative price of investment goods. Also important is the size of the existing capital stock since this this indicates the need for replacement investment. We have no indicators for firms’ expectations of future demand for goods and services except for planned government investment since contracts for this work are usually awarded well in advance.
Table 4.1: Components of Investment
As outlined in the previous chapter, company investment has been low in relation to real GDP over
the last decade and a half. Real depreciation of the capital stock averages close to 8% and in several
years company investment has been only slightly above 8%. Our forecast for future business
investment is low especially after 2017, until a low capital output ratio leads to a pick-up in growth
at the end of the decade (table 4.1). Short-term company profits are squeezed by rising inflation,
wage costs and interest rates, and this limits the level of investment in 2017 and 2018. The ratio of
business investment to real GDP never rises above 10%. The ratio of our estimate of the real capital
stock to real GDP has been on a falling trend since the early 1990s perhaps reflecting the declining
importance of manufacturing and low investment in important capital infrastructure in energy. This
falling trend is projected to continue until the end of this decade. If Lazonick is correct in attributing
low investment to perverse incentives in CEO remuneration, there will be no major acceleration in
investment until these incentives are reformed, and CEOs focus more heavily on long-term growth
rather than short-term stock prices.
Our forecasts for business investment are much lower than those of the OBR published in July 2015.
In the OBR forecasts, investment has to be consistent with the expansion of the capital stock which
itself must grow in line with productive capacity. Business investment grows at between 6 and 7%
per annum until 2018 and a little slower in 2019. Because GDP grows at close to 2.4% per annum
each year in the OBR forecast, company investment must grow fast enough to make this possible,
with no possibility of the slump in investment seen in table 4.1. There is also an additional boost of
around 0.2% per annum from lower corporation tax and higher investment allowances. The much
% per annum (unless otherwise stated) 2015 2016 2017 2018 2019 2020
Household investment 11.2 10.6 4.9 -0.2 -2.6 -3.3
Government investment 3.1 0.6 0.6 -1.6 1.9 2.0
Business investment 5.8 5.2 1.0 -0.2 0.1 1.4
Business capital stock 1.4 1.7 1.7 1.5 1.4 1.4

Forecasts derived from CBR macro-economic forecast model (UKMOD) www.cbr.cam.ac.uk/publications/
34
faster growth of business investment assumed by the OBR, if applied to the CBR forecasts, would
add around one third of one percent to the growth of GDP for three years.
Chart 4.1: Components of Investment
Investment in the household sector consists of new dwellings and housing improvements but also
investment by unincorporated businesses and by non-profit institutions including universities. The
purchase of existing houses is not included but the national accounts data does include the
transaction costs involved in the purchase of existing homes. Household investment rises in line with
real household disposable income, and also inversely with the size of the existing housing stock
relative to population. Construction of social housing is also important, but this has been at a low
level for several decades.
Household investment has been rising rapidly in 2014 and 2015 helped by the expansion of
mortgage credit, itself stimulated by several government schemes to assist first-time buyers.
Whether fortuitously, or not, this mini-boom in house-building and improvements boosted
economic growth in the run-up to the last election. The boom is expected to last into 2016 but then
die away quickly as interest rates rise. The number of new dwellings completed is forecast to rise in
the private sector, many of them buy-to-let properties (chart 4.2). In the social (mainly housing
association) sector we have predicted a decline in completions mainly due to the decline in the real
value of government investment. Plans to force Housing Associations to sell their existing stock of
dwellings to tenants are also predicted to diminish Housing Associations’ appetite for new building.
Forecasts derived from CBR macro-economic forecast model (UKMOD) www.cbr.cam.ac.uk/publications/
35
Chart 4.2: Housing Completions
It is commonly argued that the level of house building is much too low for a growing population. The
number of dwellings per hundred people traditionally rose year upon year but peaked at 44
dwellings per hundred people soon after immigration from the new eastern European member
states began in 2004 (see chapter 8). The ratio has subsequently fallen. The three million rise in
population due directly to net immigration since 2001 has not led to a commensurate response in
house-building. Most immigrants are unlikely to qualify for mortgages at least in their early years.
Instead buy-to-let landlords have bought up both existing and new property to let to immigrants
often at high densities. One result has been to drive up house prices, and driving indigenous first-
time buyers out of the market for owner-occupation. As can be seen in chart 4.2 there has been
little response from the social housing sector and on current fiscal plans any future response also
looks unlikely.

Forecasts derived from CBR macro-economic forecast model (UKMOD) www.cbr.cam.ac.uk/publications/
36
Chapter 5: Government
The forecasts for government current spending on goods and services in nominal terms up to 2019
are taken from the OBR estimates of November 2015. Beyond 2019 we have assumed that current
spending on goods and services grows at 2% per annum allowing real government consumption per
head of population to remain approximately constant. We have not used the OBR figure for 2019-
2020 which has a growth in nominal current spending of 4%. This figure may be credible as a
planned pre-election boost but the OBR tend to change the value for the final year in a forecast
period and we have assumied instead that nominal current spending will rise by 2% in 2020 much
the same as the planned growth in the previous year. Government fixed investment is taken directly
from the OBR in both nominal and real terms, and beyond 2020 is assumed to grow at 2.5 per
annum in nominal terms and 2% per annum in real terms. The other components of government
spending are forecast using econometric equations.
Table 5.1: Government Expenditure
The conversion of nominal current spending to real spending requires forecasts for a current
expenditure deflator. Projections for this deflator depend on government sector wage increases and
productivity, and on inflation in government procurement costs. Our government-sector wage
assumptions are guided by relativities with the private sector but up to 2018 are close to those of
the OBR. We also assume that procurement costs rise in line with consumer prices. Our projections
for productivity in the government sector are above those of the OBR now that the OBR have
substantially reduced their productivity growth assumptions. Our view is that the OBR’s forecast
deflator remains is optimistic even with a lower assumption on public sector productivity. Our
government expenditure deflators are shown in table 5.2.
Table 5.2: Government Current Expenditure Deflators
While the OBR assume an increase in the government current expenditure deflator between 2015
and 2019 of only 2.9%, we have 4.2%. Since we use the OBR’s calculations for the Government’s
spending intentions in nominal prices, our faster rising deflator results in larger cuts in real
government current spending. In other words the result is greater austerity. The consequential
increases in our projected real current spending are given in Table 5.3. Real government current
spending is forecast to decline in both 2017 and 2018. In the OBR’s view real spending will rise in
these years, albeit by very small amounts. Reflecting the difference in productivity assumptions
% per annum (unless otherwise stated): current prices 2015 2016 2017 2018 2019 2020
Government current spending 0.3 1.3 2.0 1.5 1.5 2.0
Government fixed investment 0.1 1.6 1.6 -3.3 3.2 2.5
Social benefits -0.5 1.7 2.1 2.6 2.7 3.0
Other spending 15.3 0.5 4.7 4.3 4.9 4.1
Debt interest -39.1 33.2 31.9 24.1 13.9 4.1
Government managed expenditure -1.3 2.7 3.9 3.3 3.3 2.8
% per annum 2015 2016 2017 2018 2019 2020
OBR -1.4 0.8 1.4 1.0 1.0 0.8
CBR Model 0.3 0.2 0.2 1.7 1.8 0.4

Forecasts derived from CBR macro-economic forecast model (UKMOD) www.cbr.cam.ac.uk/publications/
37
government sector employment falls more in our forecast up to 2020, i.e. by 430,000 compared with
the OBR’s 120,000.
Table 5.3: Government Expenditure
Note: The GDP deflator is used for social spending, other spending, and debt interest.
Government fixed investment, following the OBR, is projected to expand in most years in real terms.
Spending on social benefits in constant prices is projected to be broadly flat as benefits caps push it
down while rising unemployment acts in the opposite direction. Other spending, including EU and
overseas aid net payments, and also company and housing grants plus student grants, are forecast
to continue rising faster than GDP. Finally, debt interest payments are projected to stop falling once
interest rates begin to rise. The slower decline in public debt in our forecast also means that debt
interest payments are higher than projected by the OBR.
The forecast for total government spending (total managed expenditure or TME) is for a slow
increase in real terms from 2016 (Table 5.3). TME has been falling from its 2010 peak of 47% of GDP,
and is forecast to reach 40% by 2020 (table 5.4). On our assumptions it would then continue to fall
to 37.5% by 2025, the lowest level since the 1950s, but only a little below the levels of 1993 or 1997
(chart 5.1). Current spending on goods and services would fall to 16.8% of GDP by 2020, roughly the
level of the 1960s (chart 5.2). Welfare spending on pensions and benefits would also fall but only to
the average percentage of GDP for the whole period since 1980. In this case a rapid decline in the
benefits bill would be offset by a small rise in pension’s payments of 0.3% of GDP by 2020.
Table 5.4: Government Expenditure
% per annum (unless otherwise stated): constant prices 2015 2016 2017 2018 2019 2020
Government current spending 0.1 1.0 1.8 -0.3 -0.3 1.5
Government fixed investment 3.1 0.6 0.6 -1.6 1.9 2.0
Social benefits -2.6 1.1 0.6 0.4 0.0 0.9
Other spending 12.9 -0.1 3.1 2.1 2.1 2.0
Debt interest -40.4 32.4 30.0 21.4 10.9 2.0
Government managed expenditure -3.4 2.1 2.3 1.1 0.6 0.6
% of GDP: current prices 2015 2016 2017 2018 2019 2020
Government current spending 18.8 18.5 18.3 17.8 17.4 17.2
Government fixed investment 2.6 2.6 2.5 2.3 2.3 2.3
Social benefits 13.4 13.3 13.1 12.9 12.8 12.7
Other spending 4.1 4.0 4.0 4.0 4.1 4.1
Debt interest -1.7 -2.2 -2.7 -3.3 -3.6 -3.6
Government managed expenditure 40.6 40.5 40.6 40.4 40.2 40.0

Forecasts derived from CBR macro-economic forecast model (UKMOD) www.cbr.cam.ac.uk/publications/
38
Chart 5.1: Total Public Sector Spending and Receipts
Chart 5.2: Consumption and Welfare Spending
Consumption of government-provided goods and services is projected to be broadly staple relative
to population up to 2025 (chart 5.3). This would represent the largest sustained fall in real
consumption of public services since the 1950s when defence spending fell rapidly after the Korean

Forecasts derived from CBR macro-economic forecast model (UKMOD) www.cbr.cam.ac.uk/publications/
39
War. The ring- fencing of health spending and foreign aid means that the volume of most other
services will fall, by substantial amounts. A commitment to maintain defence spending at 2% of
GDP, albeit with some re-definition, will further tighten the squeeze on other services. In part this
unprecedented lack of growth in the volumes of public services per head represents a return to a
longer and slower growth trend in public services, following the equally unprecedented surge in the
volume of services during the Labour years from 1997-2010.
Chart 5.3: Government Consumption per Head
The projected path of government revenue is much less dramatic (Chart 5.1). Following current
Government plans we assume that most tax and social contribution rates remain unchanged and
thresholds mostly rise with inflation. The main exception is the corporation tax rate which has been
radically reduced from 30% in 2007 to a planned 18% in 2018. This is the lowest rate of profits tax
for any large economy. The research evidence is that low corporation tax will give the UK a
substantial advantage in attracting foreign direct investment. The result of these tax assumptions is
that aggregate revenues, and most individual components of revenue, are forecast to rise roughly in
line with GDP (table 5.5).
A combination of steadily falling government spending relative to GDP with a relatively constant
stream of revenue will reduce the fiscal deficit, but will not move it into surplus by 2019-20 as the
Chancellor intends (chart 5.4). Growth of revenues is forecast to be slower than in the OBR
projections. Our model suggests that the rapid reduction in government spending, both absolute
and relative to GDP, is itself a cause of slower economic growth than the OBR forecast, and hence
slower growth of revenues.

Forecasts derived from CBR macro-economic forecast model (UKMOD) www.cbr.cam.ac.uk/publications/
40
Table 5.5: Government Income
Chart 5.4: Government Fiscal Deficit
The fiscal deficit did not rise during the Labour years until 2007, because rapid, but eventually
unsustainable economic growth generated rapid growth in revenues. The financial crisis of 2008-9
then led to the UK’s largest fiscal deficit in modern times (chart 5.4), followed by an equally dramatic
period of rapid deficit reduction. As the economy slows after 2016 we expect deficit reduction to
stall (chart 5.4). The whole period from peak deficit in 2009 to a 2% of GDP deficit in 2020 is thus
forecast to experience one of the largest and most sustained deficit reductions since before WW2,
similar in magnitude to the Howe/Lawson reduction of 1980-88. The social cost will certainly involve
a smaller state than before the financial crisis, but as we have seen in chart 5.3 no significant decline
in the volume of public services per person. The pressures of containing and reducing government
spending will be felt by the public, chiefly because an aging population requires more health and
care services, and a fraught if not outright dangerous world does not make it easy or riskless to
reduce defence spending. As over the last five years, the axe will need to fall on a narrow band of
spending programmes, including those that that have already been heavily cut.
Very large ratios of Government debt to GDP are not new, nor are they evidently inimical to
economic growth. The huge deficit following the Napoleonic war did not stifle the industrial
revolution nor prevent the railway age, although it did arguably underlie a dangerous and proto-
% of GDP: current prices 2015 2016 2017 2018 2019 2020
Direct current tax revenues 13.9 14.5 14.5 14.3 14.1 13.8
Indirect taxes 12.6 12.8 12.8 12.8 12.8 12.9
Capital taxes 0.2 0.3 0.3 0.3 0.3 0.3
Social contributions 7.5 7.6 7.7 7.7 7.6 7.5
Property income 0.7 0.8 1.0 1.1 1.2 1.1
Other income 0.3 0.3 0.3 0.3 0.3 0.3
Total receipts 36.9 37.9 38.2 38.0 37.7 37.3

Forecasts derived from CBR macro-economic forecast model (UKMOD) www.cbr.cam.ac.uk/publications/
41
revolutionary era in both Britain and Ireland. The very large deficits following WW2 also did not
prevent 60 years of economic growth and prosperity. In both examples the debt was slowly reduced
to a relatively low level. Modern Japan provides another example of extremely high debt without
obviously damaging social consequences. These and other similar examples suggest that the speed
of deficit reduction since 2010 was a matter of political choice rather than of strict economic
necessity.
Our forecasts agree with those of the OBR that the public debt has now peaked at close to 81% of
GDP, and will now fall relative to GDP. Our forecast for the debt by 2020 is 77% of GDP which is well
above the OBR forecast of 70%. Our forecasts of slower growth in GDP and hence also for
government revenues, plus our forecast for higher unemployment, all lead to a slower rate of debt
reduction than in the OBR forecasts. Since we do not regard a debt of around 80% of GDP as a
danger to future prosperity we have generated a ‘reflation’ scenario with much higher levels of
government spending. The details of this scenario are reported in Section B of this report.
Chart 5.5: Public Sector Net Debt

Forecasts derived from CBR macro-economic forecast model (UKMOD) www.cbr.cam.ac.uk/publications/
42
Chapter 6: Trade and the Balance of Payments
Export volumes, to a first approximation, are most influenced by the state of world trade, while
import volumes are most influenced by the growth of domestic demand. Both are also influenced by
the trade-weighted effective exchange rate. Our forecasts for world trade come from the Oxford
Economics Global Forecasts in which the index is weighted by the size the UK’s main markets. World
trade is projected to grow at close to 5% per annum from 2016 (Chart 6.1). This is a relatively slow
rate compared with the past, but assumes steady growth without the trade recessions that tend to
occur at a rate of around one per decade.
Chart 6.1: World Trade
UK cost competitiveness improved following the large depreciation of sterling in 2008, but then
deteriorated again as sterling appreciated in 2014 and has remained high in 2015. Our expectation is
that the effective exchange rate will remain high until 2018 but will decline after that, with a
commensurate improvement in relative unit labour costs (Chart 6.2). Exchange rates are of course
very difficult to predict and our forecast depends on assumptions about US interest rates, since the
gap between UK and US interest rates is an important influence. We assume that US 10 year bond
rates will rise to 3% and remain at this level. Another assumption is about quantitative easing in the
Eurozone since some of the additional money created leaks into sterling. We have assumed that
Eurozone QE remains in place until mid-2017.

Forecasts derived from CBR macro-economic forecast model (UKMOD) www.cbr.cam.ac.uk/publications/
43
Chart 6.2: Cost Competitiveness
Table 6.1: Trade Components
The forecast is for exports growth to pick up from the relatively slow rate of 2016, with exports
expanding at over 3% per annum after 2017 (table 6.1). Import growth is forecast to be strong
through to 2020 mainly because of the expected consistently strong growth in consumer demand,
but after 2018 also due to the growth of exports which have a relatively high import content.
A high exchange rate in the early years of the forecast should put some downward pressure on
export prices, although exporters can decide whether to reduce prices or alternatively forgo some
market share in foreign markets. If sterling slips towards 2020, as we expect, export prices are
projected to rise once more. Import prices should have the opposite pattern, but our assumption of
a steady recovery in the world price of oil and other raw materials leads to strengthening import
prices towards 2020.
The expected tendency for export and import prices to fall in the short-term leads to a projection for
the value of both to decline as a proportion of GDP and to remain comparatively low until 2020 with
renewed growth after that (chart 6.3). There has been a general trend since around 1990 for both
exports and imports to increase as a proportion of GDP, in other words for the UK economy to
% per annum (unless otherwise stated) 2015 2016 2017 2018 2019 2020
Exports 2.7 0.8 1.9 3.9 3.4 3.7
Imports 5.4 5.7 4.1 3.2 3.2 3.6
World trade 3.5 4.1 5.2 4.9 4.7 4.5
Effective exchange rate (total) 91.4 92.2 91.3 87.1 83.3 79.6
Export prices -4.6 -2.6 0.1 2.9 3.7 3.8
Import prices -6.9 -3.0 0.2 3.3 3.9 4.4
Oil prices ($pb) 54 53 59 63 68 72

Forecasts derived from CBR macro-economic forecast model (UKMOD) www.cbr.cam.ac.uk/publications/
44
become more open. In the case of imports this may be associated with the tendency for companies
in both manufacturing and services to outsource production to lower cost countries. There is some
evidence that outsourcing may be slowing and some cases being reversed as wages increase in
emerging economies, but also reflecting the improved trade competitiveness of the UK since 2008.
Our forecast is that export intensity (i.e. exports as a proportion of GDP) will remain at pre-crisis
levels and indeed not exceed the levels of the late 1970s or early 1980s until after 2020. Import
intensity is projected to remain at somewhat higher levels, and hence the net trade balance will
deteriorate further (chart 6.5).
Chart 6.3: Openness of the UK Economy
The UK’s current account balance of payments has been in deficit every year since 1982. A new
record has been surpassed in 2015 with the largest current account balance, relative to GDP, since
the early 19th century. It is not obvious how this sustained deficit has been financed, but a slow and
irregular deterioration in the UK’s net financial asset position denominated in sterling of around 20%
has occurred since 1987, (0.8% per annum). The immediate source of the recent worsening in the
current account deficit is not trade, but instead net property income in the form of profits, dividends
and interest payments. The UK earned a higher return on assets abroad than foreigners earned on
assets within the UK until 2010, but this position reversed sharply in 2011 and has deteriorated
further since then (chart 6.4).

Forecasts derived from CBR macro-economic forecast model (UKMOD) www.cbr.cam.ac.uk/publications/
45
Chart 6.4: Net Property Income
As a balance between two very large flows, which may not be well measured, the annual
fluctuations in the balance can be large, and several falls of larger than £10 billion have been
recorded over the last 15 years. The estimated decline was however over £20 billion in both 2011
and 2013. Since mid-2011 the balance has deteriorated from a surplus of 2.2% of GDP to a deficit of
2.7% of GDP by the third quarter of 2013. The OBR view this as a temporary reverse which may in
part be due to a deteriorating balance in the stock of financial assets over the recession, weakness in
the Eurozone economies with consequent poor profitability, and finally large US fines on BP and on
UK banks. The OBR envisage a large and rapid return to UK surplus by 2017. Our own forecasts of the
flows of property income into and out of the UK, which depend on econometric equations, suggest a
similar return to surplus by 2017.
The current property income deficit amounts to an estimated 1.8% of GDP compared with an
average surplus of 1.2% of GDP prior to 2011. Most of this turn-around 3% of GDP in income was
absorbed by the UK company sector. The household sector experienced a smaller decline in property
income equivalent to 1% of GDP. More obvious is a secular decline since 1997 in household property
income as a proportion of GDP.

Forecasts derived from CBR macro-economic forecast model (UKMOD) www.cbr.cam.ac.uk/publications/
46
Chart 6.5: Balance of Payments and Net Trade
Our forecast for the current account balance is that it will remain in deficit by between 4% and 5% of
GDP (table 6.2). While UK net property income is projected to return to surplus, a deterioration in
net trade is forecast to keep the current account in substantial deficit. As the UK’s North Sea Oil
production continues to decline and oil imports increase, the world oil price could play a larger role
in the UK’s current account deficit.
Table 6.2: Balance of Payments (Current Account Components)
Our assumption of a steadily recovering oil price (chart 6.6) is based upon delays and cancellations in
opening up new fields at today’s low oil price although a recovery in Iranian oil exports will offset
other falls or delays in production. Many of the world’s largest producing countries have large fiscal
deficits at current oil prices and at some point OPEC will wish to raise the price. Our assumptions are
however cautious and up until 2020 would not make much difference to the deficit compared, for
instance with an oil price that stays close to today’s low level.
% of GDP: current prices 2015 2016 2017 2018 2019 2020
Current A/C balance -4.0 -4.7 -5.0 -4.7 -4.7 -4.8
Net trade -1.8 -2.9 -3.5 -3.5 -3.7 -3.9
Net property income -1.0 -0.5 -0.2 0.0 0.2 0.4

Forecasts derived from CBR macro-economic forecast model (UKMOD) www.cbr.cam.ac.uk/publications/
47
Chart 6.6: Oil Prices (Brent Crude)

Forecasts derived from CBR macro-economic forecast model (UKMOD) www.cbr.cam.ac.uk/publications/
48
Chapter 7: Labour Market and Demography
7.1: Employment and Unemployment
The rapid recovery of jobs since the financial crisis of 2008-9 was unexpected and remains largely
unexplained. The OBR and other UK forecasters failed to forecast the strength of the recovery and
the associated stalling of labour productivity growth, known as the ‘productivity puzzle’. Our
equation for private sector employment suggests that three factors account for the strong growth in
jobs since 2009. These are low real wages, low interest rates and low business investment. Low real
wages and interest rates reduce the cost base of companies and increase company profits, reducing
the financial pressure on firms to raise productivity. Low investment reduces the capital-output
ratio, and in as far as technical progress is embodied in new plant and equipment, this means that
firms are operating with lower-efficiency plant and equipment than would otherwise be the case. A
further factor is the stock market index. Again, when stock prices are high, there is less pressure on
firms to reduce costs by employing fewer people at any given level of output. Company CEOs often
target share-holder value and are under greater pressure to cut costs and raise profits when the
share price is low.
The trends in three of these factors are already being reversed. Real wages have risen in 2015 and
company investment has recovered from the low levels of 2009 and 2010. If interest rates rise in
2016 and especially 2017, as we anticipate, then our forecast is that private sector employment will
stop rising and may temporarily decline (chart 7.1).
Chart 7.1: Private Sector Employment

Forecasts derived from CBR macro-economic forecast model (UKMOD) www.cbr.cam.ac.uk/publications/
49
Table 7.1: Key Labour Market Indicators
Public sector employment is forecast to decline in every year up to 2020 and beyond (table 7.1, chart
7.2). Our baseline forecast is that 430,000 jobs will be lost from the government sector between
2014 and 2020. The OBR projects a lower figure of 120,000 lost jobs (including public corporations).
The two forecasts differ mainly because of differences in assumptions about government sector
productivity. Although faster productivity growth could be expected to result in larger job losses, this
is not the case here because productivity assumptions also affect the growth of real government
consumption (for a given rate of nominal growth in government spending, since we adopt the OBR
estimates of future nominal spending by government).
Chart 7.2: Public Sector Employment
Slowing growth in private sector jobs, combined with steady loss of jobs in the government sector,
imply a downturn in total employment in 2018 and 2019, before a return to growth in 2020 as real
wages and interest rates fall (table 7.1, chart 7.3). This path contrasts with the OBR’s expectation
that employment will continue rising rapidly up to 2020. As a result the OBR forecasts 600,000 more
jobs in 2020 than is the case in our baseline forecast.
% per annum (unless otherwise stated) 2015 2016 2017 2018 2019 2020
Employment 2.1 1.5 0.7 -0.4 -0.7 -0.6
Private sector jobs 2.7 2.2 1.1 -0.3 -0.5 -0.4
Public sector jobs -0.9 -1.8 -1.4 -1.1 -1.6 -1.7
Private earnings 4.2 5.2 3.9 4.0 2.3 1.2
Public earnings 1.5 2.0 2.0 2.0 2.0 1.0
Employment rate (% wkg age popn) 73.2 73.7 73.5 72.6 71.4 70.3
Unemployment rate (% of labour force) 4.9 4.0 4.1 5.0 5.9 6.8

Forecasts derived from CBR macro-economic forecast model (UKMOD) www.cbr.cam.ac.uk/publications/
50
Chart 7.3: Total Employment
The end of the jobs boom in 2017 would leave the projected employment rate at 73.5% of the
working-age population (chart 7.4), the highest level since the 1950s when the female participation
rate was much lower. The employment rate for working-age people shown in chart 7.4 is kept down
by the relatively large number of new jobs taken by people aged over 64 who remain in the labour
force. Along with high levels of immigration, the phenomenon of more elderly people in work
should restrain wage inflation pressures. However, the impact appears to be small, and we expect
the high employment rate to put upward pressure on wage inflation in 2016, although this should be
quickly reversed as the employment rate falls rapidly after 2016.
Forecasts derived from CBR macro-economic forecast model (UKMOD) www.cbr.cam.ac.uk/publications/
51
Chart 7.4: Employment Rate
Chart 7.5: Unemployment Rate
The end of the jobs boom also means that we expect unemployment to cease falling in 2016 and to
rise once more from 2017 reaching a rate of close to 7% by 2020. The level of unemployment will
however depend on the supply of labour as well as on demand. The supply is in turn now heavily
influenced by working-age migration. Although migration responds (negatively) to unemployment in

Forecasts derived from CBR macro-economic forecast model (UKMOD) www.cbr.cam.ac.uk/publications/
52
our migration equation, the projected rise in unemployment is not sufficient to reduce forecast
migration below the high level of 300,000 per annum. Our equations suggest that working-migrants
into the UK mainly add to total employment but displace around a third of their total into
unemployment. As a result, our projection of a reduction in employment of 300,000 between 2016
and 2020 is associated with a rise in unemployment of over 990,000.
7.2: Earnings
The UK seems to have moved into an American pattern in which real earnings stagnate over long
periods. Earnings rose virtually every year, in real terms, until the financial crisis but have fallen since
then. Private sector earnings have risen sharply in 2015, as the employment rate reached its historic
peak and consumer price inflation has been close to zero, but is not expected to rise much further
(chart 7.6). Although private sector earnings are expected to rise in current prices over the forecast
period (table 7.1), the return of consumer price inflation at rates close to 2% mean that little real
increase is expected by 2020.
Chart 7.6: Real Earnings
The pattern in the government sector has been similar although without any recovery in 2015. We
have doubts that the government pay limits of 1% per annum can be continued much longer. As
chart 7.7 shows, government sector wages were allowed to drift above those in the private sector
during the labour years from 2007, but by 2016 are expected to be back in line taking into account

Forecasts derived from CBR macro-economic forecast model (UKMOD) www.cbr.cam.ac.uk/publications/
53
the higher skills profile of public sector employees. There is likely to be strong trade union resistance
to government sector wages falling behind those in the private sector.
Chart 7.7: Compensation of Employees
Chart 7.8: Labour Productivity (whole economy)

Forecasts derived from CBR macro-economic forecast model (UKMOD) www.cbr.cam.ac.uk/publications/
54
We expect real wages in the whole economy to be no higher than the 2007 level in 2020, or indeed
in 2025. The main negative influence on real wages over recent years has been the lack of any
increase in productivity in the private sector. In future we expect productivity to recover quite
strongly until 2020 (chart 7.8), but for this influence to be offset by a weaker labour market (falling
employment rate) and rising net immigration into the UK.
7.3: Demography
An aging population in the UK reached the point in 2011 when the number of working-age people
began to decline. This decline will continue in the foreseeable future. Expansion of the population of
working-age now depends wholly on net migration. There is nothing in economic theory to suggest
that a growing population is a prerequisite of continuing prosperity and our equations suggest that
net migration into the UK has little impact on per capita GDP. However the under-training of health
professions in the UK and low wages in the care home sector mean that the NHS and social care
providers have come to depend on migrant labour. Other low paid sectors including agriculture and
food processing are in a similar position but for different reasons. These and other low-pay sectors
would need to operate at a smaller scale without migrant labour. For these reasons we expect levels
of net migration to remain above 300,000 per annum until 2020 (table 7.2) and to approach 400,000
by 2025. The forecasts in chart 7.8 are thus conditional on the continuation of current government
migration policy. Since immigration is a politically charged topic, policy changes may intervene to
alter these forecasts, not least the possibility of the UK leaving the EU and ceasing to permit free
entry for EU citizens.
Table 7.2: Demography
These projections for net migration imply an increase in the working-age population as rapid as at
any time since WW2 except for the years immediately after the accession of the new Eastern
European member states to the EU in 2004. With the addition of an expanding population of elderly
people, the expansion of the total population is projected to be greater than any post-war year at
around 650,000 per annum8. At this rate of increase the population would rise to over 71 million by
2025, a rise of over 20 million since the end of WW2.
8 The ONS has the population of over 16 growing at 0.6% per annum, a similar rate to that for working-age
population in our forecasts.
% per annum (unless otherwise stated) 2015 2016 2017 2018 2019 2020
Population 0.7 0.8 0.9 0.9 0.9 0.9
Working-age population 0.4 0.6 0.7 0.6 0.6 0.6
65+ population 1.8 1.9 1.7 1.8 1.8 1.7
Migration (000's) 265 266 333 371 373 366
Natural increase (000's) 226 171 219 226 231 234

Forecasts derived from CBR macro-economic forecast model (UKMOD) www.cbr.cam.ac.uk/publications/
55
Chapter 8: Housing and Household Debt
Housing plays an important role in macroeconomic growth in the UK. Household investment, which
is mainly new houses and improvements to dwellings, is large and is more volatile than company
investment. Household investment was only a quarter as large as company investment in the 1950s
and 1960s, but by 2007 had risen to almost two-thirds as large. Lending for house purchase is also
now the major activity of UK banks, excluding transactions within the financial sector itself. In both
of the last two major UK recessions the proximate cause of economic decline was a fall in household
investment. The decline in 2008 was almost four times larger in absolute terms than the fall in
company investment. Only in 2009 did company investment become a major cause of recession and
even then the fall in household investment was as large.
Chart 8.1: New Dwellings
Private sector house-building has historically been in the range of 150,000 to 200,000 dwellings a
year, but fell to a historic low of 100,000 in 2010 and has been slow to recover (chart 8.1). Our
forecast suggests a continuation of the recovery that is already underway rising to 163,000 new
dwellings in 2020 (chart 8.1). This is well within historic experience but is insufficient for a fast-rising
population. As is well known, the social housing programme was largely discontinued in the early
1980s and has never recovered even though most social housing is now constructed by housing
associations rather than local authorities.
The number of dwellings per thousand people rose historically at 1% per annum, but this rate
slowed markedly from 1990 and ceased growing around 2004 at the beginning of large scale East
European migration into the UK (chart 8.2). Since then the number of dwellings per thousand people

Forecasts derived from CBR macro-economic forecast model (UKMOD) www.cbr.cam.ac.uk/publications/
56
has fallen and is forecast to continue to fall. In other words the occupancy density has been rising
with more people per dwelling on average. Much of this is likely to reflect high densities in rented
properties bought under buy-to-let mortgages.
Table 8.1: Housing Indicators
Chart 8.2: Housing Stock
The buy-to-let market has raised average house prices through purchasing existing properties. Not
enough new dwellings have been built to house the rising population and we forecast that this will
continue, with the result that house prices keep rising throughout the forecast period (table 8.1,
chart 8.3). Our equations suggest that the lack of new social housing is an important influence on
rising prices and that a major increase in building would considerably reduce the rate of house price
inflation.
% per annum (unless otherwise stated) 2015 2016 2017 2018 2019 2020
House building 2.4 5.6 6.0 3.5 2.0 1.2
House price index 9.9 11.2 7.0 3.5 2.0 0.4
Number of housing loans (000's) 800 920 1,030 1,120 1,170 1,210

Forecasts derived from CBR macro-economic forecast model (UKMOD) www.cbr.cam.ac.uk/publications/
57
Chart 8.3: House Price Annual Growth
Chart 8.4: House Prices / Disposable Income Ratio
The result is a large rise in the ratio of average house prices to disposable income (chart 8.4). Already
in 2015 this ratio is above the pre-financial crisis level, and higher than in any previous year. By 2020
we forecast that the ratio will have risen to 17, a third above the pre-crisis level, and will remain at
that high level after 2020. Such an unprecedented level looks unsupportable, but not because

Forecasts derived from CBR macro-economic forecast model (UKMOD) www.cbr.cam.ac.uk/publications/
58
mortgage interest payments would reach unsustainable levels. While rising interest rates in 2016
and 2017 are likely to double mortgage interest payments as a share of household disposable
income, the level reached would only equal the average level over the 1990s. Very high house prices
will require a combination of high rents and large mortgages for first-time buyers to support them.
At some point these supports will fail to raise prices further. Once expectations of further rises are
removed the likelihood is that demand will collapse, leading to a sharp fall in house prices. House
prices are projected to increase throughout our forecast period to 2025 but price rises approach
zero as the period advances. This suggests that a financial crash becomes more likely towards the
middle of the next decade.
Chart 8.5: Number of Housing Loans
The main factor underlying the large increase in house prices is the rise in the number of loans for
house purchase (mortgages) (chart 8.5). Our equations predict that the demand for new mortgages
has been well above the actual number in each year since 2008. This suggests that the supply of
housing loans has been greatly constrained by the need for the lending banks to repair their balance
sheets after the financial crisis. At the very low interest rates since 2008 the demand for mortgages
could have been close to 2 million, but of course interest rates would not have been so low had
there not been the banking crisis resulting in a mortgage famine. Our approach to forecasting future
numbers of housing loans has been to observe the degree to which the supply of mortgages
converged on the high demand over the last two years. The convergence rate has been low starting
at only 10% per annum but accelerating. An accelerating convergence towards the estimate of
(unconstrained) demand is used to forecast the number of loans. The forecast for unconstrained
demand for mortgages is that it will fall sharply after 2017 in the face of higher interest rates, high
levels of indebtedness and high real house prices. Falling demand for mortgages and rising supply
are expected to come into balance in 2020-21 at a level of 1.2 million new mortgages a year. This

Forecasts derived from CBR macro-economic forecast model (UKMOD) www.cbr.cam.ac.uk/publications/
59
level is close to the peak in the three previous post-war cycles. After 2020 we expect falling demand
for mortgages to dominate changes in the number of loans.
Chart 8.6: Household Debt / Disposable Income Ratio
A rising number of mortgages combined with high and rising house prices leads to unprecedented
levels of household debt relative to disposable incomes (chart 8.6, repeated from 3.2) This ratio is
currently below its pre-crisis peak, but is forecast to rise quickly to reach a value of 2.0 by 2020, well
above the previous peak of 1.7 in 2007. The ratio is then projected to continue rising to a level of
2.25 by 2020. A similar cycle is also forecast for short-term unsecured debt relative to post-tax
income, although this takes longer to reach its 2007 peak once more. While interest payments on
this large debt should be manageable, the amount of debt will become a burden both to lenders and
borrowers when house prices once again begin to fall.

Forecasts derived from CBR macro-economic forecast model (UKMOD) www.cbr.cam.ac.uk/publications/
60
Part B: Scenarios - Reflation
Scenario Overview
The unsustainability of growth underpinned mainly by expanding household borrowing has led us to
generate an alternative ‘reflation’ scenario in which government current and capital spending on
goods and services grows much more rapidly than under existing government plans. We have
selected the largest increases in spending compatible with inflation at under 4% per annum and no
rise in the ratio of public sector debt to GDP above its 2015 peak.
To achieve this aim we have set government consumption in nominal terms to increase at 4% per
annum from 2016 in place of the much slower growth in the Government’s current plans (table B1).
Beyond 2020 we assume growth of 4% per annum in the reflation scenario compared with the 2.5%
per annum in the baseline. Because we do not accept the OBR’s forecasts for the government
consumption deflator as plausible and estimate our own, the projections for real government
consumption do not differ as much between scenario and baseline as is the case for nominal
spending (table B1). On average real government spending grows 2.5% per annum faster in the
scenario.
Table B1: General Government Consumption
The scenario assumptions for government fixed investment are shown in table B2. Here we have
assumed that real fixed investment grows at around 7% per annum faster than in the baseline. As
part of this we have assumed that most of the additional investment up to 2020 consists of extra
dwellings constructed by housing associations at a rate expanding to 40,000 dwellings a year.
Two other assumptions are made to aid financial stability in this scenario. One is that monetary
policy is more permissive, with short-term interest rates around one percentage point lower than in
the baseline. This allows government debt to be lower than it would otherwise be at the cost of
higher inflation. The other is to assume some mild restriction of mortgage credit once the number of
housing loans exceeds 1.2 million per annum. Low interest rates boost the demand for loans to the
extent that household debt rises too far.
The net result of these assumptions is that reflation generates a cumulative £190 billion of additional
real spending by 2020 and £500 billion by 2025. This includes 190,000 additional housing association
dwellings by 2020 and 400,000 by 2025. However, since the model predicts some decline in private
% per annum (unless otherwise stated) 1997-2010 2015 2016 2017 2018 2019 2020
Baseline Nominal 6.4 0.3 1.3 2.0 1.5 1.5 2.0
Reflation Nominal n.a. 0.3 3.0 3.0 3.0 3.0 3.0
Baseline Real 2.6 0.1 1.0 1.8 -0.3 -0.3 1.5
Reflation Real n.a. 0.0 3.9 2.8 1.5 1.0 1.6
Difference, Relation-Baseline, Real n.a. -0.1 2.8 1.0 1.8 1.3 0.0

Forecasts derived from CBR macro-economic forecast model (UKMOD) www.cbr.cam.ac.uk/publications/
61
house-building as a result of the extra housing association building, the total number of additional
dwellings is 170,000 by 2020 and 365,000 by 2025.
Table B2: General Government Fixed investment
Real GDP
In this scenario real GDP grows 0.5% per annum faster on average up to 2020 and unemployment
remains between 4% and 5%, and 700, 000 lower than in the baseline projection by 2020. The
growth advantage in GDP under the reflation scenario then falls away as higher interest rates are
needed to contain the higher inflation generated by close to full employment (chart B1). Further
ahead the advantage of the reflation is small as household borrowing is restrained by macro-
prudential policy. The forecasts are dominated by consumers’ spending, as was the case in the
baseline forecasts. The difference here is that government consumption and investment play rather
larger roles (chart B2).
Chart B1: Real GDP
% per annum (unless otherwise stated) 1997-2010 2015 2016 2017 2018 2019 2020
Baseline Nominal 9.5 0.1 1.6 1.6 -3.3 3.2 2.5
Reflation Nominal n.a. 2.4 5.0 10.0 10.0 10.0 10.0
Baseline Real 6.6 3.1 0.6 0.6 -1.6 1.9 2.0
Reflation Real n.a. -13.6 7.8 8.5 7.2 6.9 6.4
Difference, Relation-Baseline, Real n.a. -16.6 7.2 7.9 8.8 5.1 4.4

Forecasts derived from CBR macro-economic forecast model (UKMOD) www.cbr.cam.ac.uk/publications/
62
Chart B2: Components of GDP
Chart B3: Number of People Employed (All Sectors)
A clear prediction from the scenario forecasts is that employment would be higher throughout the
decade of the forecast (chart B3). The additional government spending in this scenario is not large

Forecasts derived from CBR macro-economic forecast model (UKMOD) www.cbr.cam.ac.uk/publications/
63
enough to maintain government employment at its current level but the decline is slower than in the
baseline. By 2020 this means a quarter of a million more government sector jobs than in the baseline
forecasts. Private sector employment is also higher under the reflation scenario throughout the
forecast period.
Chart B4: Number of People Unemployed
More jobs not surprisingly lead to lower projected unemployment under the reflation scenario. By
2020 the gap between the scenario and the baseline is close to 700,000 fewer people unemployed.
The gap is expected to widen further after 2020 but at a slowing rate.
Inflation
The higher level of activity under the reflation scenario generates higher wage and price inflation.
We have deliberately adopted a target for government spending on goods and services that is the
largest compatible with keeping consumer price inflation at below 4% per annum and without
raising the level of government deficit above its current level. Short-term interest rates are set
around one percent above the baseline level over the period to 20209. The resulting inflation rates
are shown in chart B5. Lower unemployment in this scenario leads to higher inflation than in the
baseline, but it does not lead to permanently accelerating, and hence unmanageable inflation, as
some types of economic theory would suggest.
9 Interest rates are initially set a little higher than this after 2020.

Forecasts derived from CBR macro-economic forecast model (UKMOD) www.cbr.cam.ac.uk/publications/
64
Chart B5: Consumer Price Inflation
The main influence on inflation is the effective sterling exchange rate. This in turn depends chiefly on
interest rate differences between sterling and the dollar. We have assumed that short-term dollar
interest rates rise to an average of 0.75% in 2015, 1.6% in 2016 rising to 3.5% by 2019. Any other
assumption would change the sterling effective exchange rate and hence UK price inflation
Government Deficit
Higher inflation in the scenario could, of course, be contained with higher interest rates than those
assumed here (and shown in table 2.1 above). Higher interest rates would minimise the fall in the
sterling exchange rate that occurs with higher government spending, and which is the main cause of
higher inflation. Higher interest rates however lead to a larger government deficit and higher debt
levels. Since our criteria for the size of the reflation package include no significant rise in the ratio of
government debt to GDP, our choice of interest rate is a balance between inflation and government
debt.

Forecasts derived from CBR macro-economic forecast model (UKMOD) www.cbr.cam.ac.uk/publications/
65
Chart B6: Government Deficit
Government Debt
Chart B7: Government Debt / GDP Ratio
Forecasts derived from CBR macro-economic forecast model (UKMOD) www.cbr.cam.ac.uk/publications/
66
Slow growth in GDP in the Baseline forecast translates, as already noted, into a slow increase in tax
revenues and a failure to realise the Government’s target of a zero deficit. A major reflation in this
scenario increases government expenditure more than revenues, even with faster growth in GDP,
and the fiscal deficit becomes higher than in the baseline. From its 2015 level, at just above 3% of
GDP, the deficit is expected to fall a little at first and then to rise to a peak of just under 4% by 2020
(chart B6). A reflation strategy thus involves the abandonment of any intention to balance the
government’s budget. It does not though also mean that government debt continues to rise as a
proportion of GDP. It is a common error to assume that a higher deficit means a higher debt ratio. A
deficit can be consistent with falling debt as long as the percentage rise in debt is less than the
percentage increase in GDP.
In this scenario the ratio of government debt to GDP remains close to its 2015 peak at 81% (chart
B8). This would leave the UK in danger of even higher debt in the case of a major economic shock
either abroad, affecting UK exports and foreign income returns, or at home in the form of a financial
collapse. One of the main aims of proponents of austerity is to avoid the debt consequences of
unforeseen shocks.
What such proponents may overlook is the probability that a balanced fiscal budget may make a
domestic financial collapse more likely. This is because GDP depends largely on private sector
growth and in particular on household consumption and investment. Our model suggests that both
household consumption and household investment depend heavily on borrowing and hence on
credit conditions. (The same is not true of company investment where fixed investment is funded
largely by retained profits and corporate bonds. Some bank loans finance fixed investment but most
loans finance inventories and in some cases share buybacks).
House Prices and Household Debt
In this scenario the assumption that higher levels of government spending are used inter alia to
finance the construction of an extra 40,000 houses each year has a significant impact in reducing
house prices. House price inflation is projected to decelerate up to 2020, reaching zero in 2019 and
declining slightly thereafter. The ratio of house prices to average disposable incomes is forecast to
fall from 2017 and to return to its 2015 level by 2020 (chart B8). In the baseline forecast the average
house price remains at the much higher level of 17 times disposable income per capita. The much
less extreme ratio in this scenario makes the financial system less exposed to problems of non-
performing mortgage loans, even with some small falls in average house prices

Forecasts derived from CBR macro-economic forecast model (UKMOD) www.cbr.cam.ac.uk/publications/
67
Chart B8: House Price / Income Ratio
The financial system would also be less exposed with a lower level of household debt in the scenario.
Lower interest rates and lower house prices increase the demand for mortgages in the scenario but
we have assumed that macro-prudential policies are used to restrain the growth of mortgage credit
once the number of loans reaches a level of 1.2 million loans per annum in order to keep the total
from exceeding its previous peak level of 1.4 million loans per year. The result shown in chart B9 is a
somewhat lower ratio of household debt to disposable income. This is still higher than the current
ratio of household debt to income but is less extreme than in the baseline

Forecasts derived from CBR macro-economic forecast model (UKMOD) www.cbr.cam.ac.uk/publications/
68
Chart B9: Household Liabilities
The result is more balanced in that the rise in household debt is less excessive and the ratio of house
prices to incomes is no higher by 2020 than today.
Conclusion
We conclude that an alternative is feasible. The question really revolves around a balance of risk. In
the baseline forecast the extreme levels of household debt and house prices pose a threat to
financial stability. In the reflation scenario this threat is less but government debt remains high at
close to the peak of 81% of GDP. The Government’s wish to reduce its debt is based on two ideas.
One is to avoid the high interest payments which accompany higher debt. The other is to avoid the
possibility of debt reaching much higher levels in the event of a future shock to economic growth.
The idea that reduced government spending will allow lower tax rates is less often cited but is
presumably also a powerful motive underpinning austerity policies.
The ideal would involve a co-ordinated international reflation among the world’s richer nations. This
would allow balanced growth in which higher exports would lead to higher GDP and hence higher
tax revenues. With higher tax revenues the higher levels of government spending in this scenario
would be compatible with a lower government deficit and hence lower debt. In the absence of
international action, the UK could reflate in isolation as this scenario demonstrates. Substantially
higher levels of public expenditure would be available, including for house building. The costs would
include consumer price inflation at between 3% and 4% and a level of government debt remaining at

Forecasts derived from CBR macro-economic forecast model (UKMOD) www.cbr.cam.ac.uk/publications/
69
the high level of close to 80% of GDP. This account however omits the question of financial
confidence. There is no question of a country with its own currency defaulting on its debt but bond
markets can attempt to force yields higher if, as in this scenario, anticipated future inflation is higher
and exchange rate depreciation is likely. This is not though a simple matter of supply and demand.
Wynne Godley always pointed out that the private sector has a lending requirement just as much as
the public sector has a borrowing requirement. In other words insurance and pension funds need to
buy bonds and have to manage exchange risks. Even if real bond yields are low, a higher level of
economic activity generated via reflation increases the level of saving and hence the demand for
bonds at the same time as the supply is increasing. Confidence remains an issue however and would
need to be carefully managed in the context of higher government spending.
The development of an econometric macroeconomic model, as used in this report, generates quite
different forecasts from a modelling approach that assumes a steady rate of productivity growth.
Time will tell which approach proves more accurate, but we feel that the less constrained
econometric approach used in the CBR model reveals much about the UK economy and its future
prospects. The research will continue to focus on better understanding the drivers of growth.

Forecasts derived from CBR macro-economic forecast model (UKMOD) www.cbr.cam.ac.uk/publications/
70
Top Related