


Languages
Pages
Legal

TYNDP 2022
October 2021
Scenario Building Guidelines


ENTSO-E // ENTSOG TYNDP 2022 Scenario Building Guidelines // 3
Contents
1 Introduction 4
1.1 How to read this document 4
1.2 Decisional process for designing the methodology 5
1.3 Summarising the improvements 5
2 Overall Process 7
2.1 NationalTrends(bottom-up)ScenarioModellingPrinciples 7
2.2 COP21ScenarioModellingPrinciples 12
3 Dispatch and expansion modelling 17
3.1 BasicprinciplesofDispatchModel 17
3.2 BasicPrinciplesofExpansionModel 18
4 Overview of modelling parameters of TYNDP scenarios 19
4.1 ClimaticYears 20
4.2 VOLL and spillage costs 21
4.3 Commodity prices and emission factors 21
4.4 Sector coupling modelling 23
4.5 Startinggrid 23
4.6 Predefinedcapacitylevel 23
4.7 InvestmentCandidates 24
4.8 Disinvestmentoptions 25
4.9 Must-runofthermalunits 25
Appendix 26
AppendixI: Districtheatingsupply 26
AppendixII: ProsumerandEVModelling 27
AppendixIII: P2Gmodellingmethodology 29
AppendixIV: InvestmentCostassumptions 36
AppendixV: DunkelFlaute 39
AppendixVI: Demand 40
AppendixVII: Climaticdatabase 48
AppendixVIII:FuelCommoditiesandCarbonPrices 48
AppendixIX: MethaneandHydrogenSupply 51
ENTSO-E // ENTSOG TYNDP 2022 Scenario Building Guidelines // 3

4 // ENTSO-E // ENTSOG TYNDP 2022 Scenario Building Guidelines
Introduction1The purpose of the Scenario Building guideline is to give insight in the methodologies used for developing the scenario and thereby both helping the reader to better comprehendfigures,chartsandresultsoftheScenarios
MainReportbyprovidingadditionalinformationaswellas give an understanding of the scenario development process itself.
1.1 How to read this document
Themainbodyofthedocument(sections1,2,3and4)is designed to provide a comprehensive overview of the scenariosbuildingprocess(forNationalTrendsandCOP21 scenarios being Distributed Energy and Global Ambi-tion).Thesesectionsdescribestepbystepthemodellingapproaches,theprocessandsequencesfollowedfromthedatacollectionuntilthepost-processingoftheresultsandprovidetheessentialinformationofthemodellingbuildingblocksandrelatedparameters.
The appendixes aim to provide further details about the toolsused,themodellinginnovationsembeddedinthisedition(districtheatingsupply,P2Gmethodologyanditspossibleconfigurations,EVandprosumernodesanddiffer-entiatedPECD)aswellasdetaileddescriptionandinsightsbehindthedifferentchoicesformodellingthedemand,thesupplyandotherparameterslikefuelandCO₂prices.
Thisdivisionallowsthereadertohaveafirst,completeunderstandingoftheoverallScenariosmodellingprocess,butatthesametimethefreedomtofurtherexploredetailsaboutcertainbuildingblocksofthismethodologywithoutaffectingthereadabilityofthefulldocument.
Beforeexploringeachsection,thetwofollowingpara-graphsdescribethemajorimprovementsforthiseditionand what has been the general decisional process that lead to the modelling features implemented for this 2022 edition.
While the expansion model for National Trends for the 2040timehorizonisnotrunatDraftScenarioreportstage,the present document already describes the main lines of the approach to be used.

ENTSO-E // ENTSOG TYNDP 2022 Scenario Building Guidelines // 5
1.2 Decisional process for designing the methodology
The methodology guideline presented in this document canbeconsideredastheoutcomeofacollectivedecisionalprocessfromdifferentexpertsfrombothgasandelectric-ityTSOsintheWorkingGroupScenarioBuilding(WGSB).Stakeholderfeedbackderivingfrompublicconsultationand bilateral engagement constitutes a major input for theworkoftheWGSB.TheWGSBisorganizedinsub-teams,eachsub-teamhasworkedonspecificthemesandmodellingaspectsbasedontheexpertiseofitsmembers.Hence,thechoicesdefiningthemethodologyappliedfor
the TYNDP 2022 Scenarios have been processed and de-batedwithineachsub-groupdependingontheirfieldofexpertisebeforediscussionatWGScenarioBuildinglevel.Choices have been made giving priority to the accuracy of the model but considering also constraints such as the timeline,dataavailabilityandcomputationtime.
Theoverallstructurefortheorganisationoftasksanddecisions related to the scenario building is pictured in Figure1.
Figure 1: Decision making groups for the Scenario building methodology definition
1.3 Summarising the improvements
TheevolutionofTYNDPScenariosproducedbyENTSOGandENTSO-Eistwo-fold.Onthefirsthandthestorylinesareadaptedtocaptureevolvingstakeholders’expectationsandtheEuropeanpolicyandclimaticambition.Therebytheimprovements of the TYNDP 2022 scenarios are to a large extend based upon the evaluation of the TYNDP 2020 scenariosandthefeedbackgivenbystakeholders.Ontheotherhand,somemodellinginnovationsaredevelopedandimplementedinordertobettercapturethedynamicsofafast-changingenergysystem.
The present document describes the methodology used to convertstorylinesintofully-fledgedscenarios.Comparedtopreviousedition,improvementscovermanyaspectsofscenariodevelopmentandofferedtheopportunityofcloserinteractionwiththerespectivesectors.Inparticu-lartheimprovementsachievedtomodeldifferentsectors(amongwhichelectrolysis,prosumerandEVnode,districtheating)havebenefitedfromboththeexpertiseofthosestakeholdersthat,beingclosertocertainsectors,havemanifested their availability for bilateral exchanges and feedbacksreceivedduringthepublicconsultations.Moredetailsonstakeholders’interactionsandexchangesareprovidedinadedicatedsectionoftheDraftTYNDP2022ScenarioReport.
AsWGSBresponsiblefortheTYNDP2022scenarios,weareproudofthedevelopmentthatwehavebeenthrough,butweacknowledgethatwemighthavesomeblindspots
onourmethodology.Ifyou,thereader,haveanyinputorexpertiseinthisarea,wewillbehappytointeractwithyouandlearnfromyourexpertisesothatwecanimproveitfurther – do not hesitate to reach out to us!
Someinput(likeparametersusedforthesimulations)canbetakenintoaccountbeforethefinalizationoftheTYNDP2022scenarios,andothers(morerelatedtothemethodologymechanisms)canserveasthefoundationforthe TYNDP 2024.
Electrolysis modelling
Inthepreviousedition,electrolysiswasmodelledwithdedicatedRenewableEnergySources(RES)(notconnectedtotheelectricitywholesalemarket)and“spilled”energyfromthemarket.Theintentionwastoprovidesomefirstinsights on the amount of wind and solar necessary to produce renewable hydrogen in Europe.
Takingintoaccountthedevelopmentofhydrogenstrate-giesatnational,Europeanandgloballevelaswellastheincreasingnumberofprojects(e.g.,electrolysis,mobility,industrialapplications),ithasbeendecidedtofocusonthecoupling of hydrogen with the rest of the energy system. The coupling of hydrogen with the rest of the energy sys-temcanhappenviadifferentpathways.Thisisdependingontheavailability/developmentofalternativehydrogensources(SMR),storagesoranintegratedhydrogensystem.
WG Scenario Building
Energy System Model (Ambition Tool) Team
Demand Team Supply Team Innovation Team Stakeholder Engagement Team
6 // ENTSO-E // ENTSOG TYNDP 2022 Scenario Building Guidelines
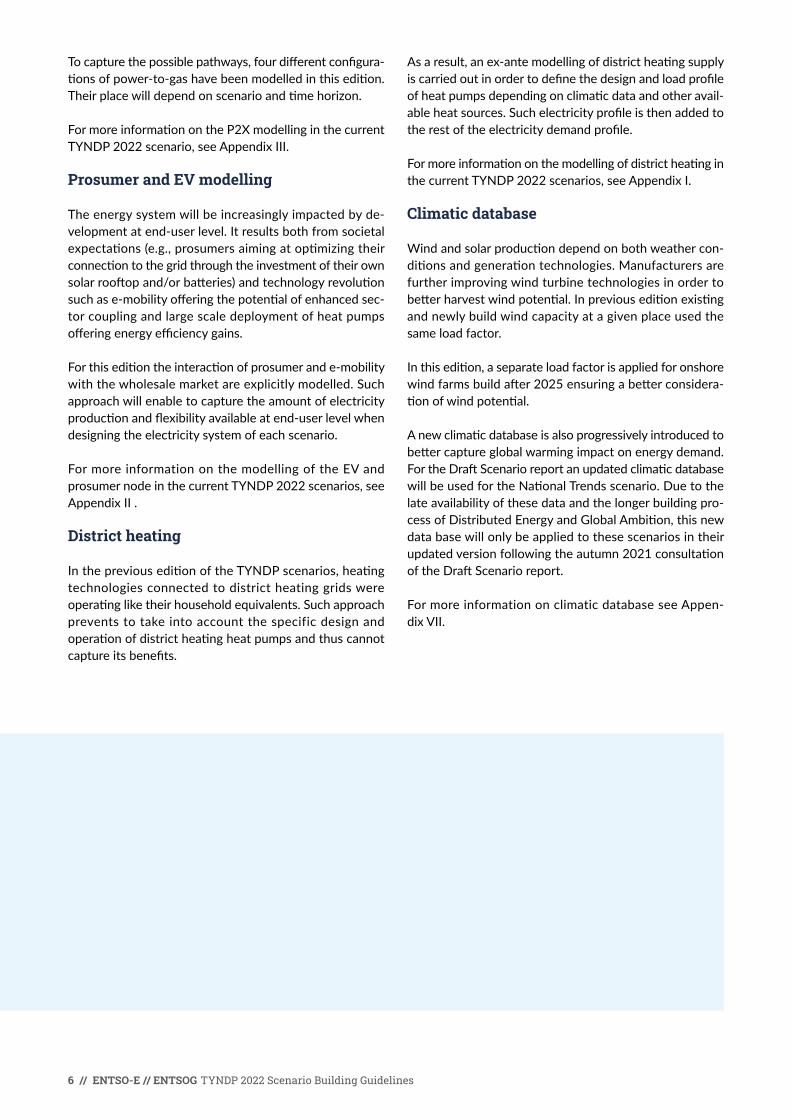
Tocapturethepossiblepathways,fourdifferentconfigura-tionsofpower-to-gashavebeenmodelledinthisedition.Theirplacewilldependonscenarioandtimehorizon.
FormoreinformationontheP2XmodellinginthecurrentTYNDP2022scenario,seeAppendixIII.
Prosumer and EV modelling
The energy system will be increasingly impacted by de-velopmentatend-userlevel.Itresultsbothfromsocietalexpectations(e.g.,prosumersaimingatoptimizingtheirconnectiontothegridthroughtheinvestmentoftheirownsolarrooftopand/orbatteries)andtechnologyrevolutionsuchase-mobilityofferingthepotentialofenhancedsec-tor coupling and large scale deployment of heat pumps offeringenergyefficiencygains.
Forthiseditiontheinteractionofprosumerande-mobilitywiththewholesalemarketareexplicitlymodelled.Suchapproach will enable to capture the amount of electricity productionandflexibilityavailableatend-userlevelwhendesigning the electricity system of each scenario.
FormoreinformationonthemodellingoftheEVandprosumernodeinthecurrentTYNDP2022scenarios,seeAppendixII.
District heating
InthepreviouseditionoftheTYNDPscenarios,heatingtechnologies connected to district heating grids were operatingliketheirhouseholdequivalents.Suchapproachpreventstotakeintoaccountthespecificdesignandoperationofdistrictheatingheatpumpsandthuscannotcaptureitsbenefits.
Asaresult,anex-antemodellingofdistrictheatingsupplyiscarriedoutinordertodefinethedesignandloadprofileofheatpumpsdependingonclimaticdataandotheravail-ableheatsources.Suchelectricityprofileisthenaddedtotherestoftheelectricitydemandprofile.
FormoreinformationonthemodellingofdistrictheatinginthecurrentTYNDP2022scenarios,seeAppendixI.
Climatic database
Windandsolarproductiondependonbothweathercon-ditionsandgenerationtechnologies.Manufacturersarefurther improving wind turbine technologies in order to betterharvestwindpotential.Inpreviouseditionexistingand newly build wind capacity at a given place used the same load factor.
Inthisedition,aseparateloadfactorisappliedforonshorewindfarmsbuildafter2025ensuringabetterconsidera-tionofwindpotential.
Anewclimaticdatabaseisalsoprogressivelyintroducedtobettercaptureglobalwarmingimpactonenergydemand.FortheDraftScenarioreportanupdatedclimaticdatabasewillbeusedfortheNationalTrendsscenario.Duetothelate availability of these data and the longer building pro-cessofDistributedEnergyandGlobalAmbition,thisnewdata base will only be applied to these scenarios in their updatedversionfollowingtheautumn2021consultationoftheDraftScenarioreport.
FormoreinformationonclimaticdatabaseseeAppen-dixVII.

ENTSO-E // ENTSOG TYNDP 2022 Scenario Building Guidelines // 7
TheaimoftheScenarioBuildingMethodologyistoenablethe delivery of a set of scenarios in a sufficient level of detail to support infrastructure assessment at ENTSOG andENTSO-ETYNDPlevel.
Such methodology should capture the evolving dynamics oftheenergysystem(e.g.,sectorcoupling)andbetrans-parenttoensurestakeholders’understandingandsupport.
Thenatureofthemethodologydiffersbetween:
- National TrendsbasedonTSOs(bottom-up)dataupto2040translatingnationalpoliciesandstrategiesasstatedendof2020andfocusingonthesoleelectricity,methane and hydrogen energy carriers.
- Distributed Energy and Global Ambition based on aholisticviewoftheEuropeanenergysystemupto2050factoringstakeholders’feedbackcollectedduringtheDraftStorylineReportconsultationprocessandbi-lateral engagement with a wide range of sectors. These scenariosareoftenreferredtoasCOP21scenarios,given their compliance with the 2015 Paris Agreement.
2.1 NationalTrends(bottom-up)ScenarioModellingPrinciples
AcoreelementoftheENTSOs’scenariobuildingprocessis the use of supply and demand data collected from both gasandelectricityTSOstobuildbottom-upscenarios.Thebottom-updatacollectionremainsakeycomponentofthescenario building exercise and provides useful insights and trendsthatexistatanationallevel.Bottom-upscenari-os are an important feature of TYNDP scenarios as they showhowNationalPlanscometogetherfromaEuropeanperspective.
For TYNDP 2022, National Trends is the bottom-up scenario. This scenario uses a simplified methodology compared to Distributed Energy and Global Ambition scenariosbecauseitcoversafocusedscope(electricity,methaneandhydrogen),aspredefineddemandandca-pacityfiguresresultingfromTSOdatacollectionareused.
OverallProcess2

8 // ENTSO-E // ENTSOG TYNDP 2022 Scenario Building Guidelines
Figure 2: building blocks for national trends scenario
2.1.1 Data Collection Process
Aswrittenabove,theNationalTrendsscenarioisbasedondatacollectedfromgasandelectricityTSOs,reflectingthelatestpolicy-andmarket-drivendevelopmentsdiscussedatnationallevelasstatedendof2020.Thismayinclude,butisnotlimitedto,theNationalEnergyandClimatePlans,astheremaybeadditionaldevelopments/ambi-tions(inparticularbutnotlimitedtoNationalHydrogenStrategies).Thescenariocoverselectricity,methane,andhydrogen energy carriers. The aim is to ensure that gas and electricity TYNDPs provide a consistent and aggregated viewofthenationalscenariosandinformstakeholdersabout European energy dispatch.
Electricity and gas data were collected from TSOs respec-tivelyinJanuary2021andApril2021forthetimehorizons2025,2030and2040.
Toensuretheconsistencyofthedataset,asynchroni-sationofkeydatawascarriedoutbetweenthegasandelectricityTSOs,asshowninTable1.CollectedenergyspecificdataaredefinedinTable2.
Synchronised data
Gas-fired power generation capacity
Electrolyser capacity
Number of electric vehicles for passenger transport
Number of all-electric and hybrid heat pumps
Table 1: Synchronised data collection among ENTSO-E and ENTSOG
TSO
dat
a co
llect
ion
Star
ting
gri
d 20
30
Electricity data predefined along the time horizon
Final e-demand
Generationcapacity
Storagecapacity
Commidityprices
Electricity flows
P2G capacityCapacity
PV & WindThermal units
BatteriesP2GNTC
Methane and Hydrogen data
predefined along the time horizon
Methanenetwork
MethaneFinal demand
HydrogenFinal demand
Methane demand (Final and power generation) and production
Hydrogen production (SMR) and imports Hydrogen historic production
Natural gas/bio-methane potential
NTC Storage unit Peak unit
Investment candidates Decommissioning
Expansion Model 2040
Dispatch model
Outputs
2025 2030
CO2 e
mis
sion
from
ele
ctri
city
, met
hane
and
hyd
roge
n
H2 p
rodu
ctio
n fr
om P
2G
Fuel
con
sum
ptio
n (i
ncl.
Met
hane
)

ENTSO-E // ENTSOG TYNDP 2022 Scenario Building Guidelines // 9
Electricity Gas
Number of Electric Vehicles for non-passenger transport Number of Fuel Cell Electric Vehicles for passenger transport
Photovoltaic capacity for electrolysis Conventional natural gas production
Offshore wind capacity for electrolysisNatural gas production via unconventional technology, e. g., fracking etc.
Onshore wind capacity for electrolysis Gas demand in all power plants (incl. CHP)
Hydro (reservoir, run-of-river and pump storage) capacity Electrolyser (only connected to gas grid)
Thermal unit capacity and must-runs
Nuclear unit capacity and must-runs
Electrolyser (only connected to electricity grid)
Electrolyser (connected to both the electricity and gas grid)
Battery capacity
Demand-side response capacity and price band
Net Transfer Capacity (NTC) for 2025 and 2030
Table 2: Energy specific data collection per sector for building the bottom-up scenario (National trend)
2.1.2 Electricity Demand and Renewable Profiling
CollectedTSOs’demandandRenewableEnergySources(RES)dataareprovidedonannualbasis.This,inturn,hastobetranslatedintoanhourlyprofiletoenablethemodellingof the power system.
- Demand profiling: for most of the countries the Tra-puntaTool(Seesection2.2.3andAppendixVI,sectionA(ii))isusedtoproducehourlydemandprofileforarange of climatic years based on a climatic database (AppendixVII);
- Wind and solar profiling: hourly load factors are derivedfromaclimaticdatabase(AppendixVII)differ-entiatingexistingandnewtechnologiesforwind.
2.1.3 Electricity Interconnection Capacity
Nationalpoliciesandstrategiesdonotprovideastraightviewofcross-borderelectricityinterconnectiondevelop-ment.Asaresult,TSOshavetobuildreasonableassump-tionsregardingfuturecapacitydevelopments:
- Timehorizon2025and2030:levelconsistentwithEu-ropeanResourceAdequacyAssessment(ERAA)2021processinanodaltopologybasedonbiddingzones
- Timehorizon2040:ajointIdentificationofSystemNeeds(IoSN)togetherwiththeENTSO-ETYNDPteam.Such joint approach is an improvement compared to previouseditionandhelpstoensureenhancedconsist-ency between Scenario Building and TYNDP processes.
2.1.4 Electricity and Hydrogen System Modelling
ThebiddingzonesconsideredforeachcountrymodelledcanbeseeninFigure3.

10 // ENTSO-E // ENTSOG TYNDP 2022 Scenario Building Guidelines
1 Electricity modelling for National Trends 2040 will be included in the final scenario report, in line with the described methodology.
Figure 3: The bidding zones considered for each country modelled
For20401,anexpansionmodel isruntoensuretheadequacyoftheelectricitysystem.Asadifferencewithpreviousedition,thisinvestmentloopiscarriedoutjointlywiththeelectricityTYNDPprocess(JointIdentificationofSystemNeeds)andresultsintheselectionofthemostviableinvestmentcandidatesamonginterconnections,storageandpeakgeneration.
Asanadditionalinnovationcomparedtopreviousedition,Power-to-Gas(P2G)isnowmodelledaspartoftheelec-tricitysystemusingConfiguration3(seeAppendixIII).
Itenablestocapturetheimpactofhydrogenproductionthrough electrolysis on the electricity system. Electrol-ysis occurs when the electricity marginal price is below a threshold corresponding to the cost of decarbonised hydrogenproduction(steammethanereformingofnatu-ralgasplusCCSandCO₂costtakingintoaccounta90 %capturerate).
Inaddition,someTSOshavedeclaredsomeP2GcapacityoperatingoutofthemarketbasedondedicatedRES.
ITn
SE01
SE02
SE03
UK
UKNI DKW DKE
UA01
NOS
NOM
NON
SE04
ITcs
ITs
ITsic
ITsar
ITcn
UA
TR
SI
SE
RS
RO
PT
PLNL
MKME
LV
LU
LT
IT
HR
GR
GB
FR
FI
ES
EE
DK
DE
CZ
CH
BG
BE
BA
AT
CY
MT
AL
XK
IE
SK
HU
NO

ENTSO-E // ENTSOG TYNDP 2022 Scenario Building Guidelines // 11
2.1.5 Output of the National Trends Scenario Building Process
Table3providesanoverviewofthedataflowaccordingtotheNationalTrendsmodellingprocess
Input data Processing Output data
Final electricity demand No change: the output equals the input Hourly demand profile based on PECD
P2G capacityNo change: the output equals the input P2G capacity
Dispatch modelling results Electrolyser hourly load
RES capacityNo change: the output equals the input Hourly generation profile based on PECD
Dispatch modelling results Spilled energy
Thermal (incl. nuclear) capacity and must-runs
No change for 2025 and 2050Additional peak capacity for 2040 resulting from IoSN*
Thermal capacity
Dispatch modelling results Aggregated unit commitment
Flexibility (Pump hydro, battery and DSR) capacity
No change for 2025 and 2030Additional capacity for 2040 resulting from IoSN
Flexibility capacity
Dispatch modelling resultsStorage in and out flowsDSR activation
Interconnection capacity
No change for 2025 and 2030Additional capacity for 2040 resulting from IoSN
Interconnection capacity
Dispatch modelling results Flows
Final gas demand No change: the output equals the inputDaily final gas demand per sector for yearly average, peak day, 2 week cold spell and dunkelflaute cases.
* IoSN: Identification of System Need as the first step of the TYNDP process aiming at identifying necessary infrastructures
Table 3: data flows in national trendS modelling process
12 // ENTSO-E // ENTSOG TYNDP 2022 Scenario Building Guidelines
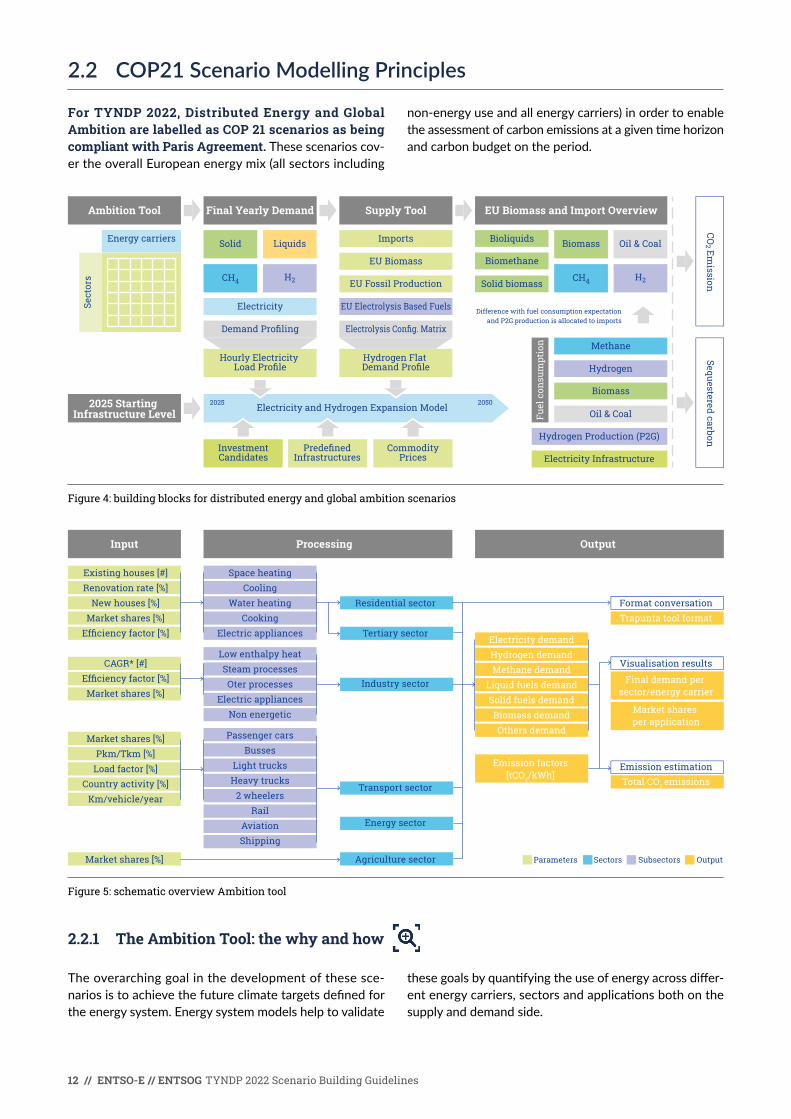
2.2 COP21ScenarioModellingPrinciples
For TYNDP 2022, Distributed Energy and Global Ambition are labelled as COP 21 scenarios as being compliant with Paris Agreement. These scenarios cov-ertheoverallEuropeanenergymix(allsectorsincluding
non-energyuseandallenergycarriers)inordertoenabletheassessmentofcarbonemissionsatagiventimehorizonand carbon budget on the period.
Figure 4: building blocks for distributed energy and global ambition scenarios
Figure 5: schematic overview Ambition tool
2.2.1 The Ambition Tool: the why and how
The overarching goal in the development of these sce-nariosistoachievethefutureclimatetargetsdefinedforthe energy system. Energy system models help to validate
thesegoalsbyquantifyingtheuseofenergyacrossdiffer-entenergycarriers,sectorsandapplicationsbothonthesupply and demand side.
Ambition Tool
2025 Starting Infrastructure Level
Final Yearly Demand Supply Tool
ImportsSolid Liquids
CH4 H2
CO2 Em
issionSequestered carbon
EU Biomass and Import Overview
Biomass Oil & CoalBioliquids
Biomethane
Solid biomass
Hydrogen
Methane
Difference with fuel consumption expectationand P2G production is allocated to imports
Fuel
con
sum
ptio
n
Biomass
Oil & Coal
CH4 H2
EU Biomass
EU Fossil Production
Electricity Infrastructure
Hydrogen Production (P2G)
Hydrogen Flat Demand Profile
Hourly Electricity Load Profile
InvestmentCandidates
PredefinedInfrastructures
CommodityPrices
EU Electrolysis Based FuelsElectricity
Energy carriers
Sect
ors
Electricity and Hydrogen Expansion Model2025 2050
Demand Profiling Electrolysis Config. Matrix
Input Processing Output
Existing houses [#]Renovation rate [%]
New houses [%]Market shares [%]
Efficiency factor [%]
CAGR* [#]Efficiency factor [%]Market shares [%]
Market shares [%]Pkm/Tkm [%]
Load factor [%]Country activity [%]
Km/vehicle/year
Market shares [%]
Residential sector
Tertiary sector
Industry sector
Transport sector
Energy sector
Agriculture sector
Format conversationTrapunta tool format
Visualisation results
Final demand per sector/energy carrier
Market shares per application
lication
Emission estimationTotal CO2 emissions
Space heatingCooling
Water heatingCooking
Electric appliances
Low enthalpy heatSteam processesOter processes
Electric appliancesNon energetic
Passenger carsBusses
Light trucksHeavy trucks
2 wheelersRail
AviationShipping
Electricity demandHydrogen demandMethane demand
Liquid fuels demandSolid fuels demandBiomass demandOthers demand
Emission factors [tCO2/kWh]
Parameters Sectors Subsectors Output

ENTSO-E // ENTSOG TYNDP 2022 Scenario Building Guidelines // 13
InthecourseoftheTYNDP2022,theelectricityandgasTSOsfurtherdevelopedtheAmbitionToolthathasalreadybeenusedintheTYNDP2020cycle.TheAmbitionToolinitscurrentversionisstructuredintoaninputdata,adataprocessingandanoutputdatapartlikeshowninFigure5.
The input data consists of reference data on the energy usepersectorandapplication,fixedparametersdefiningtechnicalproperties(e.g.,efficiencies)pertechnologyandscenario parameters which can be adjusted by the user. These scenario parameters for example describe how
2 The POTEnCIA Central scenario: an EU energy outlook to 2050: https://publications.jrc.ec.europa.eu/repository/handle/JRC123198. An exception was made for the EV efficiencies, which are based on “EU road vehicle energy consumption and CO2 emissions by 2050 – Expert-based scenarios, Energy Policy, volume 138, 2020” : https://doi.org/10.1016/j.enpol.2019.111224.
certainmarketsharespertechnologywilldevelopinthefuture. Whereas per default the parameter values were takenoverfromtheJRCPOTENCIAcentralscenariostudyaswellasthe“EUroadvehicleenergyconsumptionandCO₂emissionsby2050–Expert-basedscenarios(EnergyPolicy,March2020)forEVsefficiencyvalues2,theparam-etersforboththeDistributedEnergy(DE)andtheGlobalAmbition(GA)scenariohavebeencalibratedbythere-spectiveelectricityandgasTSOsduringthedatacollectionprocess,toaccountforcountryspecificsandconsiderthenationalexpertise.
Figure 6: Exemplary results from the ambition tool: total sectorial energy demand
Figure 7: Exemplary results from the ambition tool: total demand per energy
TWh
Reference
Global AmbitionDistributed Energy
2030 2040 2050 Reference 2030 2040 2050
Residential
0
4,000
2,000
6,000
8,000
10,000
12,000
14,000
Tertiary Transport Industry Agriculture Energy branch Others
TWh
Reference
Global AmbitionDistributed Energy
2030 2040 2050 Reference 2030 2040 20500
4,000
2,000
6,000
8,000
10,000
12,000
14,000
OthersSolidsLiquidsMethaneElectricity BiomassHydrogen

14 // ENTSO-E // ENTSOG TYNDP 2022 Scenario Building Guidelines
Inthedataprocessingpart,theinputassumptionsareperend-usersectorandinseveralcalculationstepstranslatedtoenergyconsumptionvolumes.Commonstartingpointforeachcountryisadescriptionofhistoric3 use of energy ("energyflows")whichisinthefollowingstepsadjustedaccordingtotheuserselectedparameters.Asanexample,theassumptionofhighermarketsharesofelectricvehicleswill result in an increasing electrical and decreasing oil demand in the transport sector4,takingintoaccountthehigherefficiencyofelectricmotorscomparedtotraditionalcombustionengines.
3 For residential and tertiary sectors the historic values are based on 2018. For the other sectors (industry, agriculture, energy branch, mobility) 2015 values are the most recent with sufficient level of detail.
4 Assuming that the kilometres driven remain comparable to today's level
Intheoutputpartofthetoolthecalculationresultsareper(sub)sectorandenergycarriergatheredinauniformstructureandvisualizedintheformofdifferentinfograph-icstosupportvalidationandbenchmarkingagainstotherEuropeanscenarios.Figure5andFigure6showinanex-emplary way the development of the total sectoral energy demandandthedemandperenergycarrierrespectively.Inaddition,datafromtheprocessingandoutputpartoftheAmbitiontoolisconvertedtospecificformatswhichareneededtofeedthesubsequentmethodologicalsteps(e.g.,TRAPUNTAtooltogenerateloadtimeseries,seeAppendixVI,sectionA(ii).
2.2.2 Electricity profile building process: Trapunta tool
InthisparagraphthestepsarepresentedtouseTRAPUN-TAandtodefinethehourlyelectricitydemandprofilesforeachmarketarea,eachscenarioandeachtargetyear.The
useofTRAPUNTAinvolvesthreemainphasesthatareaccomplishedbythethreemainfunctionsofthetool,asillustratedinFigure8.
Figure 8: electricity demand file building steps
Phase 1: The creation of the forecast model
Thisisthefirststepofthemethodologyfortheelectricloadprediction.ItconsistsofcreatingaregressionmodelabletoexplainthecorrelationsbetweentheelectricalloadandtheclimaticvariablespresentinthePanEuropeanClimateDatabase(PECD,seeAppendixVIIformoreinformation)Forexamplepopulationweightedtemperature,citytem-perature,irradiance,windspeed,humidity,etc.Themodelisbasedonatrainingsetofinformation,i.e.,theelectricalloadandclimaticvariablestimeseries.Sincetheregressioniscreatedbasedonthisdata,itshouldberepresentativeofthemarketsituationtheuserwantstosimulate.
Phase 2: The creation of a normalised year
Thisfunctionallowstheusertocreateanormalisedyearforthedifferentclimaticvariables.Itcouldbeusedasinputduringthepredictionoftheelectricalload.Thenormal-isedyearisthemeanvalueofthetimeseriesforagivenclimaticvariable.
Phase 3: The computation of the scenario year (Process step for WGSB Demand Team)
Thecomputationoftheelectricalloadwiththeapplicationoftheforecastmodeltoafuture(orthenormalised)yearandtheloadadjustmentformarketevolution.
ThisfunctionisthefinalaimofTRAPUNTA,andthestepusedbyWGSBtobuildthedemandprojectionsforeachscenarioandclimateyear.Startingfromtheinformationontheclimaticvariables(asnormalisedyearorgenericdata)andtheforecastmodeldevelopedatthefirststep,thetoolwillprovidetheuserwithapredictionoftheelectricalloadforfutureyearscharacterisedbytheclimaticvariablesgiven as input.
Figure 9: three process phases in trapunta
Step 1
Install TRAPUNTA Run TRAPUNTAto create the output:
Hourly demand profiles
Download countryfolder structure
&
country trainedTRAPUNTA models
from WG D&M
Download and install:
PECD data
EV profils
Holiday file
Use the latesambition tool files
Rrname into convention
PEMMDB-[xx]_{storylinename}
Step 2 Step 3 Step 4 Step 5
1. Creation of the forecast model
2. Creation of a normalised year
3. Prediction of the electric load

ENTSO-E // ENTSOG TYNDP 2022 Scenario Building Guidelines // 15
The latest version of the software (TRAPUNTA XL) is able to run a single simulation (with detailed information useful to investigate the effectiveness of the created model) or a ”loop” of simulations simultaneously including all the climate years for all of the market zones, all scenarios and all target years.
2.2.3 Building of the energy demand overview
The first step of the process is the definition of the yearly final demand for each energy carrier based on a sectorial analysis carried out for each Member State. The Ambition Tool is at the core of this quantification ensuring the trans-lation of storylines into quantified demand scenarios taking into account country specifics jointly by electricity and gas TSOs (See chapter 2.2.1 for more information).
Hourly profiling of electricity load
Annual electricity final demand in each sector needs to be translated into hourly profiles for modelling purpose.
For this purpose, profiling tools are used for all sectors except district heating for space and water heating in the residential and tertiary sectors (see Appendix I for more detailed information). Trapunta is the tool used for all countries with the exception of Poland and France where TSOs use their own tool to create the hourly profiles, in consistency with national developments.
Standard profiles for light electric vehicles and residential and tertiary are subtracted to be used in the specific EV and Prosumer nodes. The rest of the profile is used in the wholesale market node.
Figure 10: from the ambition tool to the hourly electricity load in every node of the electricity system model
The profile of electric heat-pumps on district heating net-work are defined separately (Appendix I for more details) before being added to the electricity wholesale market node of the electricity and hydrogen model.
2.2.4 Building of the supply overview
From the aforementioned energy demand overview, the annual volume of each energy carrier (except electricity as power generation result from expansion modelling) is split between its different sources of supply and imports.
As methane demand and hydrogen production are de-pendent from the electricity and hydrogen modelling, it is necessary to make some preliminary assumptions on:
the amount of gas to be consumed for power generation on the basis of TYND 2020 scenarios;
- the share of hydrogen to be supplied by European electrolysis.
- These two parameters will be adjusted on the basis of the electricity and hydrogen modelling results.
The hydrogen to be supplied by electrolysis is split into the different Power-to-gas configurations using a matrix which parameters are scenario and time horizon dependent. As hydrogen is mostly used in the industrial and heavy mo-bility sectors, a flat hourly profile is assumed for modelling purpose.
2.2.5 Electricity and hydrogen expansion model
Using the electricity and hydrogen demand profiles defined in the previous step, an electricity and hydrogen expansion model is run. It aims to define the level and location of ca-pacity (generation, flexibility, P2G) consistent with scenario storyline and associated cost assumptions.
In order to place the different investment options (RES, P2G, etc.) in accordance with the Scenario Storylines and to ensure the meaningfulness of the results, the invest-ment model is also given the degree of freedom to expand electricity and hydrogen interconnectors. Therefore, the tool develops the infrastructure it deems economically viable to develop coherent scenarios in which energy is produced and transported throughout Europe. Such grid developments do not signify a particular transmission need or the identification of a project for a future time horizon but gives an indication of how grid capacities in certain borders could develop in the scenarios under a European optimisation of the energy system based upon the assump-tions used.
Electricity demand from the Ambition Tool
Nodes usedin electricity system model
EV & Prosumer profiles
EV node Prosumer node
Trapunta profiling District heating
Wholesale market node

16 // ENTSO-E // ENTSOG TYNDP 2022 Scenario Building Guidelines
ItshouldbenotedthattheTYNDPprocessblock"Iden-tification of System Needs5"isnotpartofthescenariobuildingexercisebutispartoftheENTSO-ETYNDPwheretheEuropeaninfrastructureneedsareinvestigatedandpresented.
Aftertheexpansionmodelhasrun,thescenarioisgoingthroughqualitycontroliterations,toidentifyandcorrectany errors in the modelling. These iterations were first doneonatechnicallevelwithintheinnovationteam,andthenlaterexpandedtotheentireworkinggrouptoensurequalitycontrol.
2.2.6 Adaptation of the gas supply overview
Based on the expansion model and associated dispatch results,itisneededtoadjustthepreliminaryassumptionsrelatedtogasdemandforpowergenerationandvolumeofhydrogen to be produced by electrolysis. Several modelling iterationswereruntoarriveatthefinalscenarioresults.
5 For more information about the Identification of System Needs study please see: https://tyndp.entsoe.eu/system-needs/
2.2.7 GHG emission accounting
CO₂emissionsarecalculatedbasedontheannualcon-sumptionofeachprimaryfuel(beingproducedinEuropeorimported)takingintoaccounttheirspecificemissionfactor.Non-CO₂emissionsarederivedfromECImpactAssessment scenarios.
Aseachscenarioisdefinedalongapathwayfrom2022to2050,itispossibletocalculatetheGHGemissionforeveryyear and thus evaluate their carbon budget.
2.2.8 Approval of Scenarios
Whenthescenariosaredrafted,theyarecheckedforpossibletechnicalerrors,andtoensurethatthescenarioslive up to their purpose from the scenario storyline report. Thescenariosarethenapproved,firstbytheWGSB,thenbytheScenarioSteeringGroupandfinallybyENTSOGandENTSO-Erespectively.Thepurposeoftheapprovalprocessistoalignandcorrectbothtechnicalerrors,andtomakesurethatthescenariosareconsistentwithotherworkdoneintheENTSOsbeforepublicationforconsul-tation.
ENTSO-E // ENTSOG TYNDP 2022 Scenario Building Guidelines // 17
WhenbuildingEuropeanenergyscenarios,itisnecessaryto model the electricity system at European scale at an hourlygranularityinordertocaptureitsdynamics.Itisparticularlyimportantwhentheenergytransitionresultsinto a stronger influence of climatic parameters on the operationoftheelectricitysystemduetothedevelop-mentofelectricityheatingandRES.Astheemergenceofahydrogeneconomyislargelylinkedtothedevelopmentofelectrolysis,itisincreasinglynecessarytouseajointmodelling approach between the two energy carriers.
AspartoftheTYNDPscenariobuildingprocess,themodelling of the electricity system has two functional requirements:
- Definingthedispatchofelectricitybasedonapre-de-finedlevelofinfrastructure(generation,flexibilityandgrid)andtakingintoaccountcommodityprices->Dispatchmodel;
- Identifyingtheinfrastructurestobebuiltontopofpre-definedinfrastructuretakingintoaccounttheevo-lutionofelectricitydemandandcommodityprices->Expansion model.
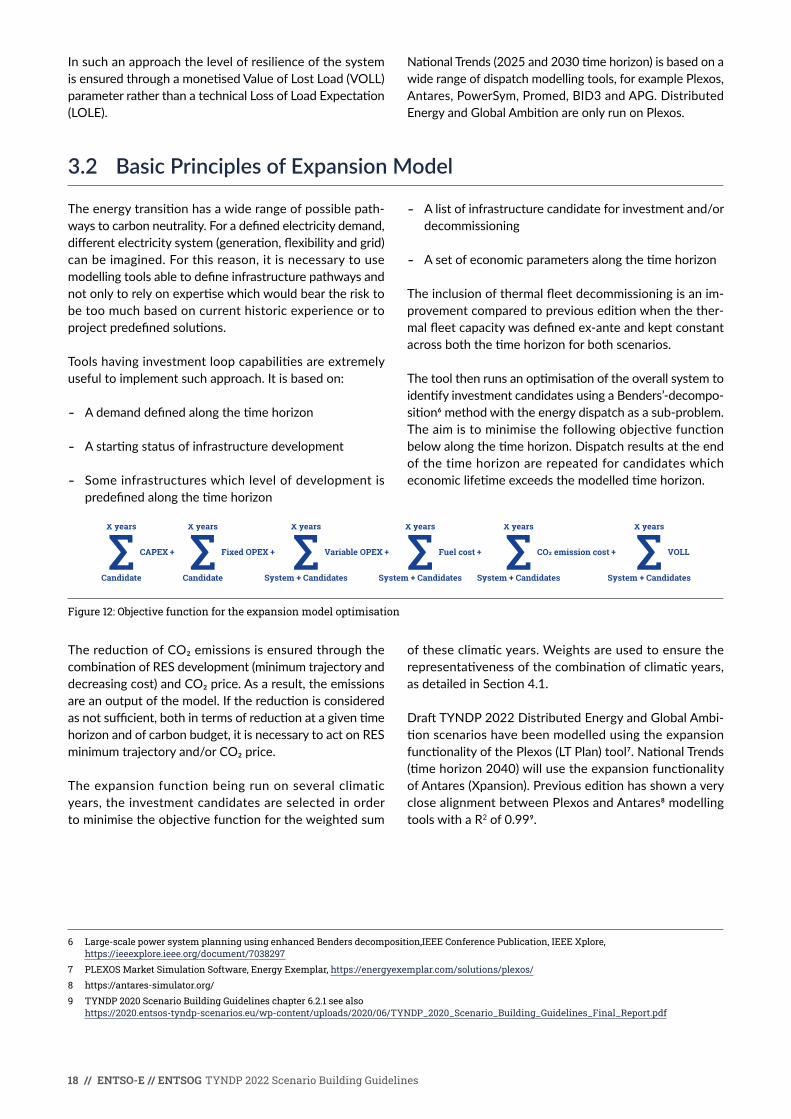
3.1 BasicprinciplesofDispatchModel
Thepurposeistoidentifythegenerationunitcommitmentminimising the variable costs of the electricity system. This optimisationtakesintoaccounttheavailableinfrastructure
andcommodityprices.Theaimistominimisetheobjectivefunction.
Figure 11: Objective function for the dispatch model optimisation (variable costs of the electricity system)
Dispatch and expansion modelling3
X years
System
Variable OPEX +∑X years
System
Fuel cost +∑X years
System
CO� emissions cost +∑X years
System
VOLL∑
18 // ENTSO-E // ENTSOG TYNDP 2022 Scenario Building Guidelines
InsuchanapproachthelevelofresilienceofthesystemisensuredthroughamonetisedValueofLostLoad(VOLL)parameterratherthanatechnicalLossofLoadExpectation(LOLE).
6 Large-scale power system planning using enhanced Benders decomposition,IEEE Conference Publication, IEEE Xplore, https://ieeexplore.ieee.org/document/7038297
7 PLEXOS Market Simulation Software, Energy Exemplar, https://energyexemplar.com/solutions/plexos/
8 https://antares-simulator.org/
9 TYNDP 2020 Scenario Building Guidelines chapter 6.2.1 see also https://2020.entsos-tyndp-scenarios.eu/wp-content/uploads/2020/06/TYNDP_2020_Scenario_Building_Guidelines_Final_Report.pdf
NationalTrends(2025and2030timehorizon)isbasedonawiderangeofdispatchmodellingtools,forexamplePlexos,Antares,PowerSym,Promed,BID3andAPG.DistributedEnergyandGlobalAmbitionareonlyrunonPlexos.
3.2 BasicPrinciplesofExpansionModel
Theenergytransitionhasawiderangeofpossiblepath-waystocarbonneutrality.Foradefinedelectricitydemand,differentelectricitysystem(generation,flexibilityandgrid)canbeimagined.Forthisreason,itisnecessarytousemodellingtoolsabletodefineinfrastructurepathwaysandnotonlytorelyonexpertisewhichwouldbeartherisktobe too much based on current historic experience or to projectpredefinedsolutions.
Toolshavinginvestmentloopcapabilitiesareextremelyusefultoimplementsuchapproach.Itisbasedon:
- Ademanddefinedalongthetimehorizon
- Astartingstatusofinfrastructuredevelopment
- Some infrastructures which level of development is predefinedalongthetimehorizon
- A list of infrastructure candidate for investment and/or decommissioning
- Asetofeconomicparametersalongthetimehorizon
Theinclusionofthermalfleetdecommissioningisanim-provementcomparedtopreviouseditionwhenthether-malfleetcapacitywasdefinedex-anteandkeptconstantacrossboththetimehorizonforbothscenarios.
ThetoolthenrunsanoptimisationoftheoverallsystemtoidentifyinvestmentcandidatesusingaBenders’-decompo-sition6methodwiththeenergydispatchasasub-problem.Theaimistominimisethefollowingobjectivefunctionbelowalongthetimehorizon.Dispatchresultsattheendofthetimehorizonarerepeatedforcandidateswhicheconomiclifetimeexceedsthemodelledtimehorizon.
Figure 12: Objective function for the expansion model optimisation
ThereductionofCO₂emissionsisensuredthroughthecombinationofRESdevelopment(minimumtrajectoryanddecreasingcost)andCO₂price.Asaresult,theemissionsareanoutputofthemodel.Ifthereductionisconsideredasnotsufficient,bothintermsofreductionatagiventimehorizonandofcarbonbudget,itisnecessarytoactonRESminimumtrajectoryand/orCO₂price.
The expansion function being run on several climatic years,theinvestmentcandidatesareselectedinordertominimisetheobjectivefunctionfortheweightedsum
oftheseclimaticyears.Weightsareusedtoensuretherepresentativenessofthecombinationofclimaticyears,asdetailedinSection4.1.
DraftTYNDP2022DistributedEnergyandGlobalAmbi-tionscenarioshavebeenmodelledusingtheexpansionfunctionalityofthePlexos(LTPlan)tool7.NationalTrends(timehorizon2040)willusetheexpansionfunctionalityofAntares(Xpansion).Previouseditionhasshownaveryclose alignment between Plexos and Antares8 modelling toolswithaR2 of 0.999.
X years
Candidate
CAPEX +∑X years
Candidate
Fixed OPEX +∑X years
System + Candidates
Variable OPEX +∑X years
System + Candidates
Fuel cost +∑X years
System + Candidates
CO� emission cost +∑X years
System + Candidates
VOLL∑
ENTSO-E // ENTSOG TYNDP 2022 Scenario Building Guidelines // 19
While the basics of expansion modelling are the same forallscenarios,itsrolediffers.ForNationalTrends,theaimoftheexpansionmodelistoensuretheadequacyoftheelectricitysystemresultingfromTSOdatacollection.ForDistributedEnergyandGlobalAmbition,theaimistoactuallybuildthepowergenerationandP2Gcapacitymix
intermsoflevelandlocation.Theseobjectivestranslateintoascenariospecificdefinitionofthebuildingblocksofthe expansion model. Table 4 provides an overview of the differencesbetweentheexpansionmodelofthedifferentscenarios.
Overview of modelling parametersofTYNDP scenarios4

20 // ENTSO-E // ENTSOG TYNDP 2022 Scenario Building Guidelines
Building block National Trends Distributed Energy & Global Ambition
Time horizon 2040 2030, 2040 and 2050
Climatic years 1995, 2008 and 2009Expansion Model – 2009 Dispatch – 1995, 2008, 2009 Dunkelflaute – 2012
Adequacy 10 k €/MWh for the electricity and hydrogen 10 k €/MWh for the electricity and hydrogen
Commodity prices Scenario specific Scenario specific
Sector coupling modelling• Power-to-gas• EV/Prosumer• District heating
• Two P2G configurations • No• No
• Four P2G configurations• Yes• Embedded in electricity load profile
Starting grid
TYNDP 2020 Reference Grid for 2025 Time Horizon has been updated by the TSOs to reach the best estimates in terms of infrastructure development for the given time horizon
TYNDP 2020 Reference Grid for 2025 Time Horizon has been updated by the TSOs to reach the best estimates in terms of infrastructure development for the given time horizon
Predefined capacity at time horizon
• All renewables• Hydro• Nuclear• Thermal (as in 2030)• NTC
• Hydro• Nuclear• Solar thermal• Marine• H2 storages• Electrolyser Capacity (config 1 & 2)
Investment candidates: NTCSpecific candidates to be collected in summer 2021
Predefined candidates based on IoSN 2020
GenerationAdditional generic thermal peak unit to ensure adequacy
Onshore wind (wholesale market and dedicated for P2G)Offshore wind (wholesale market and dedicated for P2G)PV (wholesale market, prosumer and dedicated for P2G)CCGT (methane, hydrogen)Hydrogen salt cavern storage (hydrogen config 4)
FlexibilityAdditional generic short term storage to ensure adequacy
Additional generic short term storage to ensure adequacy
P2G No Yes, separately for each P2G configuration
H2 grid NoRetrofit methane pipelineNewly built pipeline
Decommissioning candidate:Generation
No Thermal units
Must-runs Yes Removed after 2030
Table 4: Modelling parameters
Thissectionprovidesadetaileddescriptionofthesettingofeachparameteroftheexpansionanddispatchmodelsusedto build scenarios.
4.1 ClimaticYears
Thenumberofclimaticyearstakenintoaccountbytheexpansionmodelstronglyinfluencethecomputationtime.Itisthereforenecessarytoselectalimitedcombinationofyearswhileensuringtherepresentativenessofthecli-maticvariabilityofthelast30years.Astatisticalanalysisperformedonthelast35yearshavehelpedtoidentifythemostrepresentativecombinationsofyears.
Inthecaseofdefinitionofrepresentativeclimateyears,theapproachisasfollows:
- Definitionofhourlytimeseriesofresidualload(finaldemandminuswindandsolarpowergeneration)onaregionallevel,tocapturethetemporalandspatialvar-iabilityofthesystemstateduetoclimaticconditions;

ENTSO-E // ENTSOG TYNDP 2022 Scenario Building Guidelines // 21
- Compute delta indicators to assess how years compare tothe30-yearaverageonaregionallevel;
- Selectionofmostrepresentativecombinationofthreeyears for the study
The weights are calculated based on the Pan European ClimateDatabase(PECD,seeAppendixVIIformoreinfor-mation)accordingtotheirrepresentativenessintermsofthesolarinfeed,windinfeed,hydroinflowsandloadparameters.
ForDistributedEnergyandGlobalAmbition,thecompu-tationtimeisveryhighduetothetimehorizon(25years),sectorcoupling(combinedH₂andelectricitymodelling)and number of investment candidates. As priority has been
10 Koffi, B., Cerutti, A., Duerr, M., Iancu, A., Kona, A. and Janssens-Maenhout, G., Covenant of Mayors for Climate and Energy: Default emission factors for local emission inventories – Version 2017, EUR 28718 EN, Publications Office of the European Union, Luxembourg, 2017, http://publications.jrc.ec.europa.eu/repository/bitstream/JRC107518/jrc_technical_reports_-_com_default_emission_factors-2017.pdf
giventoanearlyreleaseoftheDraftScenarioReport,ex-pansionmodellingisrunonlyonthemostrepresentativeyear(2009).
ForNationalTrends,thereducedcomputationloadenablestheuseofawiderclimaticyearpanel.Theselectedyearsandassociatedweights(betweenbrackets)areasfollow:1995(23 %),2008(37 %)and2009(40 %).
Ithastobenotedthat2009ranksatthesecondmoststressfulclimaticyearintermsof2-weekDunkelflautesit-uation(seealsoAppendixV)atEuropeanaggregatedlevelafter2012.Aseparatedispatchsimulationwascarriedoutforthe2012Dunkelflautesituationasanillustrationofthebehaviour of the electricity system.
4.2 VOLL and spillage costs
Astheobjectivefunctionofdispatchandexpansionmodelisinmonetaryterms,itisnecessarytotranslatesecurityofsupplyandenergyefficiencyinsimilarterms.Suchcon-version enables the comparison with investment candidate CAPEXandsystemOPEX(includingcommodityprices).
Whenjointlymodellingelectricityandhydrogen,itisnec-essarytoconsistentlydefinethevalueoflostload(VOLL)ofeachenergycarrierinordertoavoidundue“non-servedenergy”ofagivencarrier.Forthisreason,theVOLLofhydrogen has been established at a parity level with elec-tricitytakingintoaccounttheefficiencyofelectrolysers.
4.3 Commodity prices and emission factors
CommoditypricesincludebothfuelandCO₂prices.Theyinterveneinthedispatchoptimisationandthereforeintheexpansionmodel.TheemissionfactorsquantifyhowmuchCO₂isemittedduringfuelcombustionthereforetheyare
usedtomeasureinwhichextentCO₂priceimpactsfuelprices.TheemissionfactorsarederivedfromJRC10 and summarised below.
Fuel Emission
Oil 0.267
Solids 0.354
Primary 0
Biogasoline 0
Other 0
Biomethane 0
Natural gas 0.202
Biomethane 0
Decarbonised hydrogen imports and European SMR with CCS* 0.0262
Hydrogen from electrolysis
Renewable hydrogen imports 0
* For steam methane reforming an efficiency factor of 77 % is used. For CCS processes a capture rate of 90 % is considered, to account for the part of the CO₂ that cannot be captured in the process and that is therefore released in the atmosphere.
Table 5: Emission factor of fuels

22 // ENTSO-E // ENTSOG TYNDP 2022 Scenario Building Guidelines
Methaneandhydrogenemissionfactorsdependonthecompositionofdifferentsources:
- Methane:naturalgas,biomethaneandsyntheticmeth-ane
- Hydrogen:electrolysis,hydrogenimportsandSMRproduction
Thecompositionofthemethaneisdependentonscenar-iosandtimehorizon.Theemissionfactorsofelectroly-sis-basedproducts(hydrogen,syntheticmethaneandliquids)areanoutputoftheelectricitymodelling.
Some commodity prices are common to all scenarios and dependenteitherfromlocaldrivers(shaleoilandlignite)orfromaveryspecificandslowevolvingvaluechain(nuclear).Table6andTable7provideanoverviewofsuchprices.
€/GJ 2025 2030 2040 2050
Nuclear 0.47
Biomethane 23.89 20.74 16.94 13.97
Shale oil 1.56 1.86 2.71 3.93
Lignite:
- Group 1 (BG, MK and CZ) 1.40
- Group 2 (SK, DE, RS, PL, ME, UK, IE and BA) 1.80
- Group 3 (SI, RO and HU) 2.37
- Group 4 (GR and TR) 3.10
Table 6: fuel prices common to all scenarios
Othercommoditieshaveapricedependingeitherontheglobalenergycontext(naturalgas,oil,coal)orEuropeanregulation(CO₂).AsscenariosreflectdifferentEurope-anandglobalstorylines,itisnecessarytodefineprices
reflectingtheirrespectivestoryline.Moredetailsonthemethodology used to define commodity prices can be foundunderAppendixVIII.
Unit Scenarios 2025 2030 2040 2050
CO₂ €/tonneNT 40 70 90 N.a.
DE & GA 40 78 123 168
Hard coal
€/GJ
NT 2.30 2.48 2.41 N.a.
DE & GA 2.30 1.97 1.92 1.87
Light oilNT 12.87 13.78 15.41 N.a.
DE & GA 12.87 10.09 9.61 9.12
Natural gasNT 5.57 6.23 6.90 N.a.
DE & GA 5.57 4.02 4.07 4.07
Synthetic methaneNT 26.97 28.09 23.35 N.a.
DE & GA 26.97 28.96 23.35 18.09
Renewable H2 importsNT Na 20.25 16.08 N.a.
DE & GA Na 20.63 16.08 12.52
Decarbonised H2 importsNT 19.05 20.25 16.08 N.a.
DE & GA 19.05 17.11 17.55 17.91
Table 7: Fuel and CO₂ prices per scenario and horizon

ENTSO-E // ENTSOG TYNDP 2022 Scenario Building Guidelines // 23
4.4 Sector coupling modelling
11 https://2022.entsos-tyndp-scenarios.eu/quantification-of-key-parameter-ranges/
Theoperationandtheevolutionoftheelectricitysystemwillincreasinglydependonothersectors.Asaresult,itisnecessarytomodelitsinteractionwithothersectorsaspart of the dispatch and expansion model. The modelling of sector coupling is the priority enhancement of the 2022 editionandinnovativemodellingapproacheshavebeendefinedtocapturethedynamicsof:
- Electrolysers:upto4electrolyserconfigurationsaremodelledbasedontheuseofhydrogen(finaldemandorsyntheticfuelproduction)andtheevolutionofthehy-drogenmarket.Itcapturesawiderangeofinteractionsbetween electricity and hydrogen systems. A detailed descriptionofelectrolysermodellingcanbefoundinAppendixIII.
- Prosumer and Electric Vehicle (EV): development on theend-usersidewillimpactthedesignandtheopera-tionoftheelectricitysystem.Forthispurpose,specificnodes have been introduced as part of the electricity marketmodellingofDistributedEnergyandGlobalAmbition.AdetaileddescriptionofProsumerandEVmodellingcanbefoundinAppendixII.
- District heating: the combination of different heat supplyandflexibilitysourcesonanetworkenablesanoptimizeddesignandoperationofconnectedheatpumps.Suchspecificbehaviouriscapturedintheelec-tricitydemandprofileusedasaninputtotheelectricitysystem modelling. A detailed description of district heatingmodellingcanbefoundinAppendixI.
Explicit sector coupling modelling in National Trends is lessambitiouscomparedtoDistributedEnergyandGlobalAmbition.Itisduetoitsshortertimehorizon(2040)mak-inglesscriticalandtothefactthatsomesectorcouplingcomponentsarealreadycapturedincollecteddata.ForthisscenarioPower-to-gasismodelledalongtwoconfigura-tions which capacity is defined as part of the TSO data collection:
- UsingConfiguration3wheretheSMRisusedasagenericbackupatapriceequivalenttodecarbonisedhydrogen.SeeAppendixIII,sectionD(iii)formorein-formation.
- UsingdedicatedRESandmodelledoutoftheelectricitymarket.
4.5 Startinggrid
Forallscenariosandtimehorizon,themodelbasesitsex-pansiononabestestimateofthegridlevelofdevelopmentfortheyear2025.Itusesthe2025timehorizonofthe
TYNDP2020asareferencewithsomeNTCupdatedtak-ingintoaccountthelatestdevelopmentininterconnectionprojects as seen early spring 2021.
4.6 Predefinedcapacitylevel
DistributedEnergyandGlobalAmbitiongenerationfleetswillmostlydifferintermsofwind,solarandnuclearcapaci-ty.ThefirsttwoRESsourceswillresultfromtheexpansionmodelwhilenuclearisdefinedex-antebasedonrangeintheFinalStorylineReport11 of each scenario in order to ensuresufficientdifference.
Theothergenerationtechnologieswillseethesamelevelof development in the two scenarios. Such development isbasedonNationalTrendsdatacollectionasstatedinTable8.

24 // ENTSO-E // ENTSOG TYNDP 2022 Scenario Building Guidelines
Technology 2030 2040 2050
Wind and Solar Defined by the expansion model based on 2025 level and trajectories
Nuclear Distributed Energy: 45-year lifetime for existing and under construction units
(unless anticipated phase-out policy)Global Ambition: 55-year lifetime for existing, under construction and planned units
Hydro, Solar thermal and Marine National Trends 2030 National Trends 2040
Thermal National Trends 2030 National Trends 2040Nation Trends 2040, while
considering expected decommissions after 2040
Table 8: Starting generation capacity for Distributed Energy and Global Ambition scenarios
NationalTrendsgenerationfleetisdefinedaccordingtotheTSOdatacollectionfor2040inordertopicturenationalstrategies and policies. As the expansion model is only run toensurethescenarioadequacyandinordernottoover-estimateflexiblegeneration,CCGTandOCGTpredefinedcapacity for 2040 is set at National Trends 2030 level.
Capacity development of such technologies beyond 2030 are then subject to the expansion model.
Thecapacityofhydrogenstorages(steeltanksandsaltcaverns)hasbeendefinedex-ante.
4.7 Investment Candidates
InthecaseofDistributedEnergyandGlobalAmbitionscenarios,theexpansionmodelisusedtodefinethelevelofdevelopmentofstoryline-dependenttechnologies.Suchtechnologiescoverrenewablesources(windandsolar),flexibilitysources(gas-firedthermalunitsandbatteries),conversionfacilities(electrolysers),powerandhydrogeninterconnections.Interconnectioncandidatesenableameaningfullocationofothercandidatesanddonotintendtoidentifyanyinvestmentgap.
RESandbatterycandidatescanbeinstalledatdifferentnodesofthesystemdependingonneeds(electricitymixdecarbonation,minimisationoftheprosumerconnectiontothegrid,hydrogenproduction…).Theexpansionmodelwill then select the best technology based on their cost andthespecificneedofeachconfiguration.Table9de-scribesthepossiblelocationsforwind,solarandbatteries.
Technology Transmission Prosumer EV node P2G config. 1 & 4
Wind (onshore & offshore) X X
Solar X (PV farm) X (Rooftop PV)
Batteries X (utility-scale) X X
Table 9: Location of RES and batterie investment candidates for distributed energy and global ambition
InthecaseofNationalTrendsscenario,theexpansionmodelisonlyusedtoensurethesystemadequacyin2040.Asaresult,therangeofinvestmentcandidatesislimitedtoflexibilitysourcesbeingthermalpeakgenerationunits,shorttermelectricitystorageandinterconnections.
Each investment candidate is defined by a set of pa-rameterstakenintoaccountbytheexpansionmodeltoselectthem.Candidatesaredefinedforeachzone(andinterconnection for electricity and hydrogen transport infrastructures):
- Maximumdevelopmentlevelforeachtimehorizon,basedoncountryspecificpotentials
- Minimumexpecteddevelopmentlevelforeachtimehorizononacountrylevel
- Maximumbuildingratebyyear
- CAPEX
- FixedOPEX
- VariableOPEX
- Economiclifetime
- Weightedaveragecostofcapital(WACC)
- Build-outrateasthemaximumcapacitythatcanbebuilt in one year

ENTSO-E // ENTSOG TYNDP 2022 Scenario Building Guidelines // 25
InordertocaptureuncertaintyonRESdevelopmentandthechallengetomaximisetheirdevelopment,themax-imumtrajectoryhasbeenbrokendowninto3stepsofincreasingCAPEX.InordertobothreflectcountryspecificsandsomebasichomogeneityintermsofRESambitionbe-tweencountries,thecapacitylevelofeachstepscombineTSOsdata(MaxandPushlevels)andthirdpartystudies(3°Study12).
- Level 1 =Minimum (Max;Level 2)
- Level 2=Average (Max;3° Study)
- Level 3=Maximum [Minimum (Push;Max×AF);Level 2]
12 For Offshore wind, Wind Europe – Our Energy, our future completed with Mediterranean offshore strategy from Guidehouse for EC and World bank. For Onshore wind and Solar PV, LIMES-EU, P. Nahmmacher (p 21) together with Mediterranean offshore strategy from Guidehouse for EC
AFisanAmbitionFactorusedtomatchFinalStorylinereport upper ranges and capturing the potential easier expansion of Solar PV compared to wind and especially RooftopPVwhichcouldbeembeddedinnewbuildings.Asaresult,AFequals1.33foronshoreandoffshorewind,2forPVFarmand3forRooftopPV.Fortechnologiesstronglydependentonscenariostorylines,CAPEXandOPEXaredifferentiatedbetweenscenariosinordertoreflectthehigherinnovationandcostreductionassociatedwithtech-nology predominance.
The parameters of the investment candidates can be found under Appendix .
4.8 Disinvestmentoptions
ForDistributedEnergyandGlobalAmbitionscenarios,thestrongdevelopmentofREStechnologiesandthesharpincreaseinCO₂costwillstronglyimpacttheeconomicvia-bilityofthermalunits.Suchsituationisanticipatedthrough
thepredefineddecreasedofthermalgenerationcapacity.Inaddition,theexpansionmodelhastheabilitytodecideto decommission other thermal units when the electricity priceisnotsufficienttobalancefixedcosts.
4.9 Must-runofthermalunits
Withthedevelopmentofwindandsolar,itwillbeneces-saryfortheelectricitysystemtobecomemoreflexible.Mustrunsofthermalunitsareusedgenerallytopicturesystemstabilityconstraints(eithervoltageorfrequency)orconstraints beyond the European electricity system.
Inscenariosaimingatcarbonneutrality,theGHGemis-sionsinducedbythesemust-runswillbecomeobstaclestothedecarbonizationonthemediumterm.Asaresult,itisassumedthatmust-runwillberemovedafter2030forDistributedEnergyandGlobalAmbition,replacedbyothertechnologiesbeyondthedefinitionofthescenarios.

26 // ENTSO-E // ENTSOG TYNDP 2022 Scenario Building Guidelines
Appendix
AppendixI:Districtheatingsupply
Districtheatingcombinesonasinglenetworkseveralheatsources.Theyareusuallyutility-scaleequivalentsoftechnologiesthatcanbeinstalledathouseholdlevel(e.g.,gas/biomassboilers,heatpumps,etc.).Theircombinationwithsomeformofthermalstorage,beingtheinertiaofthenetworkordedicatedassets,providesbothflexibilityinthedesignandoperationofheatsources.Inaddition,suchnet-workcanuseresidualheatfromsomeindustrialprocessesparticipatingtotheenergyefficiencyandcircularitydriverofthescenarios,especiallyforDistributedEnergy.
Inordertocapturesuchdistrictheatingspecifics,ENT-SO-EandENTSOGhaveinitiatedacooperationwithsomedistrictheatingstakeholdersinordertoprovidesomefirstinsightsonhowelectricity,gasandheatnetworkscanbesmartlycombined.Forthisedition,theaimistodefinetheelectricityloadofdistrictheatingheatpumpsasaninput to electricity modelling. An algorithm has been de-finedtodefinetheircapacityandelectricityprofiletakingintoaccountotherheatsourcesandclimaticimpactonspace-heatingdemandandtheCoefficientofPerformance(COP)ofheatpumps.Definingheattobesupplied
Districtheatingmarketshareinspaceandwater-heatingisderivedfromtheAmbitionTool(seeSection2.2.1)foreachscenario,country,andtimehorizon.TheTRAPUNTAprofile for temperature dependent demand is used for space-heatingwhileaflatprofileisusedforwater-heating.SeealsoAppendixVI,sectionA(ii)formoreinformation
Heatlossesatnetworklevelareassumedtoaccountfor5 %oftheheatdemand.
TYNDPScenarioshaveacountry/bidding-zonegranular-ityrequiringanaggregatedapproachofdistrictheating.Thermalstorageiscapturedthrougha12-hourmovingav-eragingofheatdemand.Itmaybeoptimisticforverylargecitieshavingreducedstorageabilitybutconservativeforsmallernetworksequippedwithseasonalthermalstorage.
ENTSO-E // ENTSOG TYNDP 2022 Scenario Building Guidelines // 27
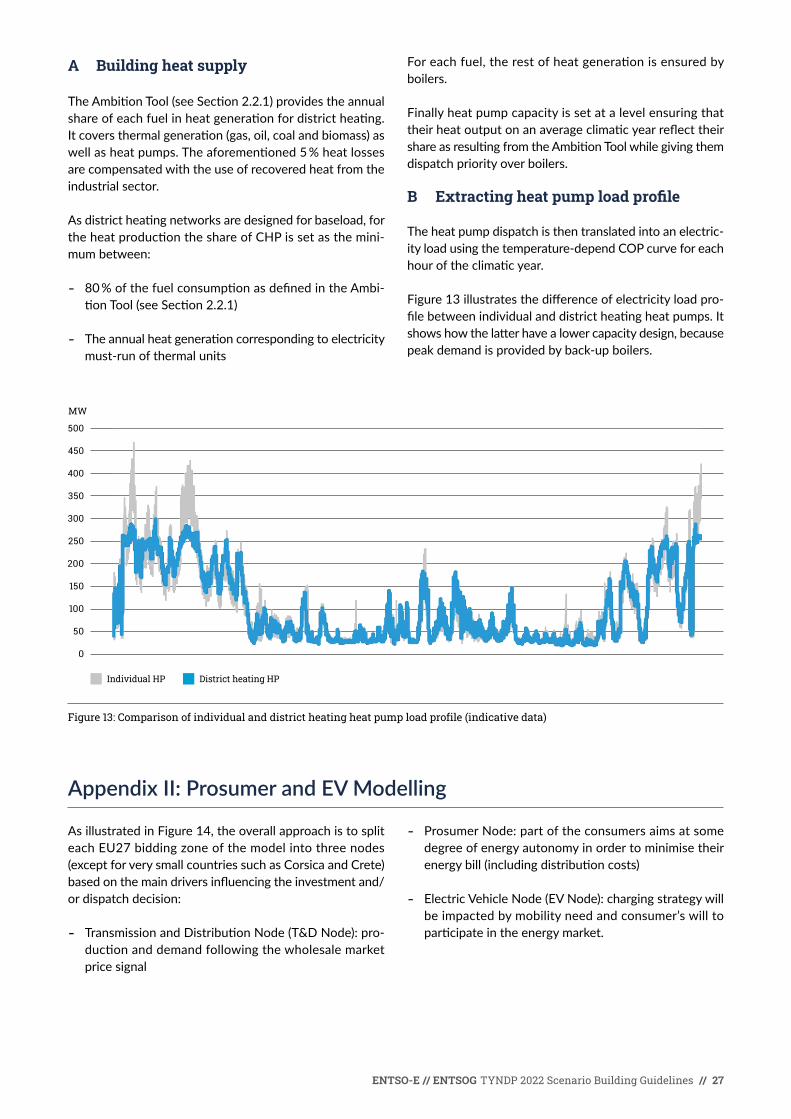
A Building heat supply
TheAmbitionTool(seeSection2.2.1)providestheannualshareofeachfuelinheatgenerationfordistrictheating.Itcoversthermalgeneration(gas,oil,coalandbiomass)aswellasheatpumps.Theaforementioned5 %heatlossesare compensated with the use of recovered heat from the industrial sector.
Asdistrictheatingnetworksaredesignedforbaseload,fortheheatproductiontheshareofCHPissetasthemini-mumbetween:
- 80 %ofthefuelconsumptionasdefinedintheAmbi-tionTool(seeSection2.2.1)
- Theannualheatgenerationcorrespondingtoelectricitymust-runofthermalunits
Foreachfuel,therestofheatgenerationisensuredbyboilers.
FinallyheatpumpcapacityissetatalevelensuringthattheirheatoutputonanaverageclimaticyearreflecttheirshareasresultingfromtheAmbitionToolwhilegivingthemdispatch priority over boilers.
B Extracting heat pump load profile
The heat pump dispatch is then translated into an electric-ityloadusingthetemperature-dependCOPcurveforeachhouroftheclimaticyear.
Figure13illustratesthedifferenceofelectricityloadpro-filebetweenindividualanddistrictheatingheatpumps.Itshowshowthelatterhavealowercapacitydesign,becausepeakdemandisprovidedbyback-upboilers.
Figure 13: Comparison of individual and district heating heat pump load profile (indicative data)
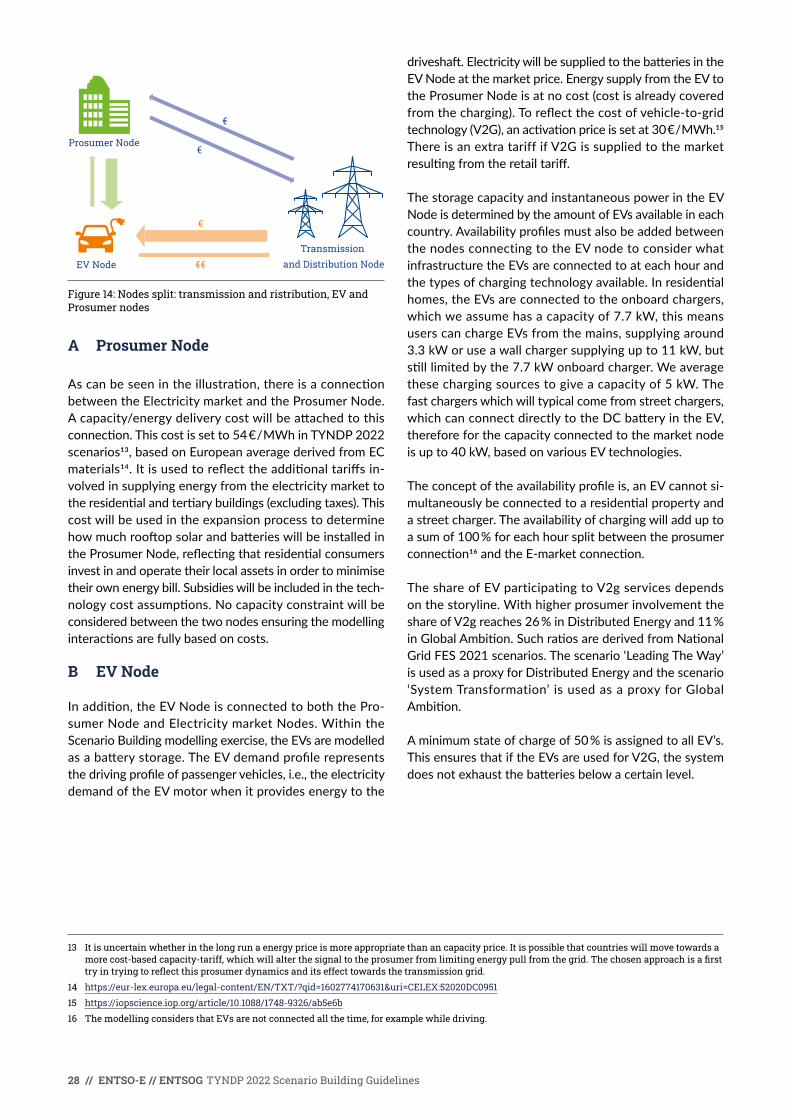
AppendixII:ProsumerandEVModelling
AsillustratedinFigure14,theoverallapproachistospliteachEU27biddingzoneofthemodelintothreenodes(exceptforverysmallcountriessuchasCorsicaandCrete)basedonthemaindriversinfluencingtheinvestmentand/ordispatchdecision:
- TransmissionandDistributionNode(T&DNode):pro-ductionanddemandfollowingthewholesalemarketprice signal
- ProsumerNode:partoftheconsumersaimsatsomedegree of energy autonomy in order to minimise their energybill(includingdistributioncosts)
- ElectricVehicleNode(EVNode):chargingstrategywillbeimpactedbymobilityneedandconsumer’swilltoparticipateintheenergymarket.
MW
Individual HP
0
100
50
150
200
250
300
350
400
450
500
District heating HP
28 // ENTSO-E // ENTSOG TYNDP 2022 Scenario Building Guidelines
Figure 14: Nodes split: transmission and ristribution, EV and Prosumer nodes
A Prosumer Node
Ascanbeseenintheillustration,thereisaconnectionbetweentheElectricitymarketandtheProsumerNode.Acapacity/energydeliverycostwillbeattachedtothisconnection.Thiscostissetto54 € / MWhinTYNDP2022scenarios13,basedonEuropeanaveragederivedfromECmaterials14.Itisusedtoreflecttheadditionaltariffsin-volvedinsupplyingenergyfromtheelectricitymarkettotheresidentialandtertiarybuildings(excludingtaxes).Thiscost will be used in the expansion process to determine howmuchrooftopsolarandbatterieswillbeinstalledintheProsumerNode,reflectingthatresidentialconsumersinvest in and operate their local assets in order to minimise their own energy bill. Subsidies will be included in the tech-nologycostassumptions.Nocapacityconstraintwillbeconsidered between the two nodes ensuring the modelling interactionsarefullybasedoncosts.
B EV Node
Inaddition,theEVNodeisconnectedtoboththePro-sumerNodeandElectricitymarketNodes.WithintheScenarioBuildingmodellingexercise,theEVsaremodelledasabatterystorage.TheEVdemandprofilerepresentsthedrivingprofileofpassengervehicles,i.e.,theelectricitydemand of the EV motor when it provides energy to the
13 It is uncertain whether in the long run a energy price is more appropriate than an capacity price. It is possible that countries will move towards a more cost-based capacity-tariff, which will alter the signal to the prosumer from limiting energy pull from the grid. The chosen approach is a first try in trying to reflect this prosumer dynamics and its effect towards the transmission grid.
14 https://eur-lex.europa.eu/legal-content/EN/TXT/?qid=1602774170631&uri=CELEX:52020DC0951
15 https://iopscience.iop.org/article/10.1088/1748-9326/ab5e6b
16 The modelling considers that EVs are not connected all the time, for example while driving.
driveshaft.ElectricitywillbesuppliedtothebatteriesintheEVNodeatthemarketprice.EnergysupplyfromtheEVtotheProsumerNodeisatnocost(costisalreadycoveredfromthecharging).Toreflectthecostofvehicle-to-gridtechnology(V2G),anactivationpriceissetat30 € / MWh.15 ThereisanextratariffifV2Gissuppliedtothemarketresultingfromtheretailtariff.
The storage capacity and instantaneous power in the EV Node is determined by the amount of EVs available in each country.Availabilityprofilesmustalsobeaddedbetweenthe nodes connecting to the EV node to consider what infrastructure the EVs are connected to at each hour and thetypesofchargingtechnologyavailable.Inresidentialhomes,theEVsareconnectedtotheonboardchargers,whichweassumehasacapacityof7.7kW,thismeansuserscanchargeEVsfromthemains,supplyingaround3.3kWoruseawallchargersupplyingupto11kW,butstilllimitedbythe7.7kWonboardcharger.Weaveragethesechargingsourcestogiveacapacityof5kW.Thefastchargerswhichwilltypicalcomefromstreetchargers,whichcanconnectdirectlytotheDCbatteryintheEV,thereforeforthecapacityconnectedtothemarketnodeisupto40kW,basedonvariousEVtechnologies.
Theconceptoftheavailabilityprofileis,anEVcannotsi-multaneouslybeconnectedtoaresidentialpropertyanda street charger. The availability of charging will add up to asumof100 %foreachhoursplitbetweentheprosumerconnection16andtheE-marketconnection.
The share of EV participating to V2g services depends on the storyline. With higher prosumer involvement the shareofV2greaches26 %inDistributedEnergyand11 %inGlobalAmbition.SuchratiosarederivedfromNationalGridFES2021scenarios.Thescenario‘LeadingTheWay’is used as a proxy for Distributed Energy and the scenario ‘SystemTransformation’isusedasaproxyforGlobalAmbition.
Aminimumstateofchargeof50 %isassignedtoallEV’s.ThisensuresthatiftheEVsareusedforV2G,thesystemdoesnotexhaustthebatteriesbelowacertainlevel.
Transmission and Distribution NodeEV Node €€
Prosumer Node
€
€
€

ENTSO-E // ENTSOG TYNDP 2022 Scenario Building Guidelines // 29
AppendixIII:P2Gmodellingmethodology
A Introduction
The purpose of this chapter is to introduce the modelling methodology of P2G used in the TYNDP 2022 scenarios. Firstly,theconceptofP2Gwillbedefinedandthebasicmodelling methodologies specified. Then the hydrogen demand and the core P2G technologies will be presented. LastlythisisbroughttogetherintheindividualP2Gconfig-urationsusedintheTYNDP2022scenarios.ThischapterexplainstheoperationoftheP2Gplantsandthemodellingmethodologies.Forinformationonhowthesystemisbuild,seesection3.2onBasicPrinciplesofExpansionModel.Forcostassumptions,seeAppendixIV.Thefinalcapacitiesineach of the scenarios van be found on the visualisationplatform.
P2X,Power-to-Xisarelativelyloosetermthatspansalotofdifferenttechnologiesconvertingpowerintosomething/X.The process starts with power used in an electrolyser to splitwaterintoHydrogenandOxygen,andthenafterwardsthehydrogencanbeusedeitherdirectly,orasaninputintheproductionprocessofothergassesofliquidfuels.Thefirststepoftheprocess,wherehydrogenisproducedistyp-icallythemostenergyintensive,andheretheoperationonthe electrolysers has a large impact in the energy system. Thisimpactisseenbothintheelectricitysystem,whereflexibleoperationwillbedefinedby,andimpactthepriceformationintheelectricitymarket,aswellasinthegassystem,whereregionaldifferencesinhydrogensupplyanddemand,leadtofutureenergy-transmissionneeds.
IntheTYNDP2022scenarios,thetermP2Gischosentodescribethefirststepoftheprocess,wherehydrogenisproducedthroughelectrolysis,regardlessofiftheenduseoftheenergyisintheformofhydrogen,syntheticmethane,orsyntheticfuels.
OneofthekeybenefitsofP2Gisthepossibilitytostorerenewableenergy,totransportitoverlongdistancesbyusingthegasinfrastructureordirectlyuseitasafeedstockinindustry.Atthismomentintime,hydrogeninjectioninthegasgridisinapilotstagewhereassyntheticmethanecan be fully injected. The permissible levels of hydrogen [injectionintothegasgrid]aretypicallysetbynationalleg-islationandarecurrentlyupto10 %(Germany).Thissourceofrenewablegascanbeusedtodecarbonisesectors.Italsohasthepotentialtoprovideademandsidebalancingmechanismtothepowersystem.Inaddition,itcouldena-bletheinstalledcapacityofrenewablepowergenerationto
increase,alongwiththeoverallusageofrenewablesourcesin the energy mix. P2G is a technology that enables the convergenceoftheelectricityandgassystems,utilisingtherespectivestrengthsofeach.
The P2G methodology in the TYNDP 2022 scenarios has evolveddramaticallycomparedtoTYNDP2020ScenarioReportwhereP2GwasbasedonlyoncurtailedelectricityandthequantificationofdedicatedREScapacitytosupplyelectrolysis-basedhydrogenwasconsideredoutsidetheelectricitymarket.Therehasbeenalargepush,frombothinternalandexternalactors,tofurtherdevelopthemeth-odologywiththepurposeoftakingtheoperationofP2Gplantsintoaccountintheelectricitymarket,andtherebyexplicitlymodellingthedifferentoperationaldynamicsthatare expected and the impact that they will have on the electricitymarket.
Itshouldbenoted,thattherearelargeuncertaintiesinhowfutureP2Gplantswilloperate,andthereforehowtheyshouldbemodelled,asnomajorplantsareinoperationtoday.Thisuncertaintyisreflectedinthemodel,whereawiderrangeofelectrolyserconfigurationsismodelled.Theyrepresentdifferentlevelsofintegrationintheelec-tricityandgasmarkets.Inordertoensuremeaningfulinteractionsbetweenelectricity,hydrogenandmethanesystems,partofhydrogeninfrastructureismodelledaswellassomestand-aloneP2Gplantswhichdonotinter-act with the hydrogen grid. The purpose of this approach istoreflectthecorrectdynamicstowardstheelectricitymarketaswellasinvestigatingthebenefitsofaEuropeanhydrogeninfrastructurefromthestandpointofoptimizingtheEuropeanenergysystemwithaholisticapproach.
P2Gmodellingisatajuvenilestageonaninternationallevel,andveryfewEuropeanstudieshavedivedintodifferentmodellingmethodologiesofP2G.ThemodellingmethodologyusedintheTYNDP2022isoneofthefirstattemptstotacklethischallengeonaEuropeanlevelandhasbeenbasedoninteractionswithEuropeanactorsonhydrogen,aswellasexpertsfromvariousmemberstates.
B Hydrogen Demand
The hydrogen demand that needs to be fulfilled in the modelling,consistsbothofdirectandindirecthydrogendemand. The direct hydrogen demand accounts for the vast majority of the whole hydrogen demand.

30 // ENTSO-E // ENTSOG TYNDP 2022 Scenario Building Guidelines
The direct hydrogen demand is the demand for hydrogen astheenergycarrier.Thisismostoftenusedinindustry,suchassteelproduction,wherecurrentfuelslikecoalormethane are replaced by hydrogen. Other applications couldbeinthetransportationsector,e.g.,inheavytrans-portationbytrucks,or,toalesserextent,intheresidentialandtertiarysectorusinghydrogenindistrictheatingorhybrid heat pumps.
The indirect hydrogen demand is the demand for other energyvectors,suchassyntheticmethaneorsyntheticliquidthathashydrogenasoneofthemainenergyin-puts–itisthisinputhydrogen,thatisheredefinedastheindirecthydrogendemand.Therefinementofhydrogenintosyntheticmethaneorsyntheticliquids,suchasam-moniaorcarbon-basedfuelslikesyntheticdieselforroadtransportorjet-fuelcanbelocatedbothcentrallyinlargescalefacilitiesordecentral,ifthereisanexistingmethaneinfrastructurelikeinbiogas-upgradingfacilities.
The total hydrogen demand modelled in the TYNDP 2022 scenarios is the sum of the direct and the indirect hydrogen demandandhydrogendemandforpowergeneration.Formoreinformationondemandquantifications,seeSection2.2.1.Itisassumedthatthedemandprofileforhydrogenisaflatdemand,asitismostlyusedinlargeindustries,bothdirectly and indirectly.
C Introduction to technologies
ThepurposeofthissectionistointroducethedifferenttechnologiesthatconstitutetheP2Gconfigurationsbuild-ingblocksinthefinalenergysystemthatismodelled.Theone-byoneintroductionservestoprovidebothatechnicalfoundationaswellasanunderstandingoftheoperationaldynamics of the technology.
i Electrolysers
Electrolysis is one of the most important technologies forprovidingdecarbonisedhydrogen,andthehydrogenproducedbyelectrolysersusingRES,isoftenreferredtoasrenewablehydrogen.Inelectrolyserstheproductionof hydrogen is done via electrolysis of water using elec-tricity.Today,thereareseveraltechnologicaloptionstoproducehydrogenviaelectrolysis,forexamplealkalinewater electrolysis and polymer electrolyte membrane electrolysis.Eachtechnologyhasitsowncharacteristicsanddifferentiatingfactorsandareatdifferenttechnologyreadiness levels.
IntheTYNDP2022processitisexpectedthatallthetechnologies above will develop and that the European fleetofelectrolyserswillbeatechnologicalmixwithalka-lineelectrolysersbeingdominantinthestart,andintimePEMwillseeanincreasingmarketshare.Assumptionsareshown in Table 10.
Technology 2020 2025 2030 2040 2050
Market share alkaline 90 % 90 % 77 % 51 % 25 %
Market share PEM 10 % 10 % 23 % 49 % 75 %
Table 10: Market share of european flee of electrolysers
Inordertousecrediblevaluesforcostsandefficiencies,itischosentotakeanaverageofvaluesfromHydrogenEurope,IRENAandE3M.Withthemarketsharesabove,
thisleadstothefleetefficienciesandcostsforprovidinganadditionalaveragekWofelectrolysis,asshowninTable11.
2020 2025 2030 2040 2050
DE & GA
Efficiency (%NCV) 66 % 68 % 69 % 71 % 74 %
CAPEX (€/kW) 565 366 290 198
OPEX (€/kW/yr) 12 11 11 10
Table 11: European electrolyser fleet efficiency and investment costs
Theelectrolysersareinthemarketmodelassumedtobefullyflexible.Thisseemstobeafairassumption,asthemarketmodelusesanhourlyresolution,andmostelectro-lysers will be able to perform a warm start within minutes. Acoldstarttakeslongerandcanbedoneinafewhoursdependingontechnology,butsinceweatherforecasts,and
therebyRESproductionisrelativelyreliableforpredictingdaysforward,itisassumedthatoperatorswillbeabletoplanforwhenelectrolysersshouldbewarmforstand-by.
Thecostsfortheelectrolysers,usedintheinvestmentloop,canbefoundinAppendixIV.
ENTSO-E // ENTSOG TYNDP 2022 Scenario Building Guidelines // 31
ii Steam Methane Reforming
SteamMethaneReforming(SMR)isatechnologyusedforsplittingmethaneintohydrogenandcarbondioxide,andiscurrently the most used technology for providing hydrogen today.IfequippedwithCCStocapturetheCO₂,thehy-drogenproducedbySMRsisreferredtoasdecarbonisedhydrogen.
TheSMRcapacitycurrentlyinstalledinEuropehasthecapacity of producing in the range of 265 TWh/y17. Cur-rentSMRisanoptiontoprovidelowcarbonhydrogenandcanbeneficiallycontributetotheuptakeofahydrogeneconomyinEurope.SMRplantsaretodaytypicallylocat-edinproximitytotheconsumerandisoftenlocatedinindustrial clusters with access to methane infrastructure. Thisopensupforthelong-termperspectiveforconnectingtheselocationstohydrogeninfrastructure,whichmakesit
17 The 265 TWh are result of the assumption of 7600 running hours for the SMR facilities multiplied with the capacity derived from of the estimated H2 production provided by the Fuel Cells and Hydrogen Observatory, March 2020. The FCHO data is publicly available: https://www.fchobservatory.eu/observatory/technology-and-market/hydrogen-supply-capacity.
possibletoimportrenewablehydrogenasareplacement,orexportdecarbonisedhydrogen.AsSMRplantsarelargescalefacilitiesandacentralpoint-sourceforCO₂emis-sions,itisintheTYNDP2022assumed,inlinewiththeEuropeanHydrogenStrategy,thatallEuropeanSMRplantswillberetrofittedwithCCSby2030.ItisassumedthatnonewSMRplantswillbebuilt,henceitisnotaninvestmentcandidate in the investment loop. Depending on the sce-nario,thecurrentSMRfleetwillslowlybedecommissioned(DistributedEnergyscenario)orkeptatcurrentcapacitylevel(GlobalAmbition).
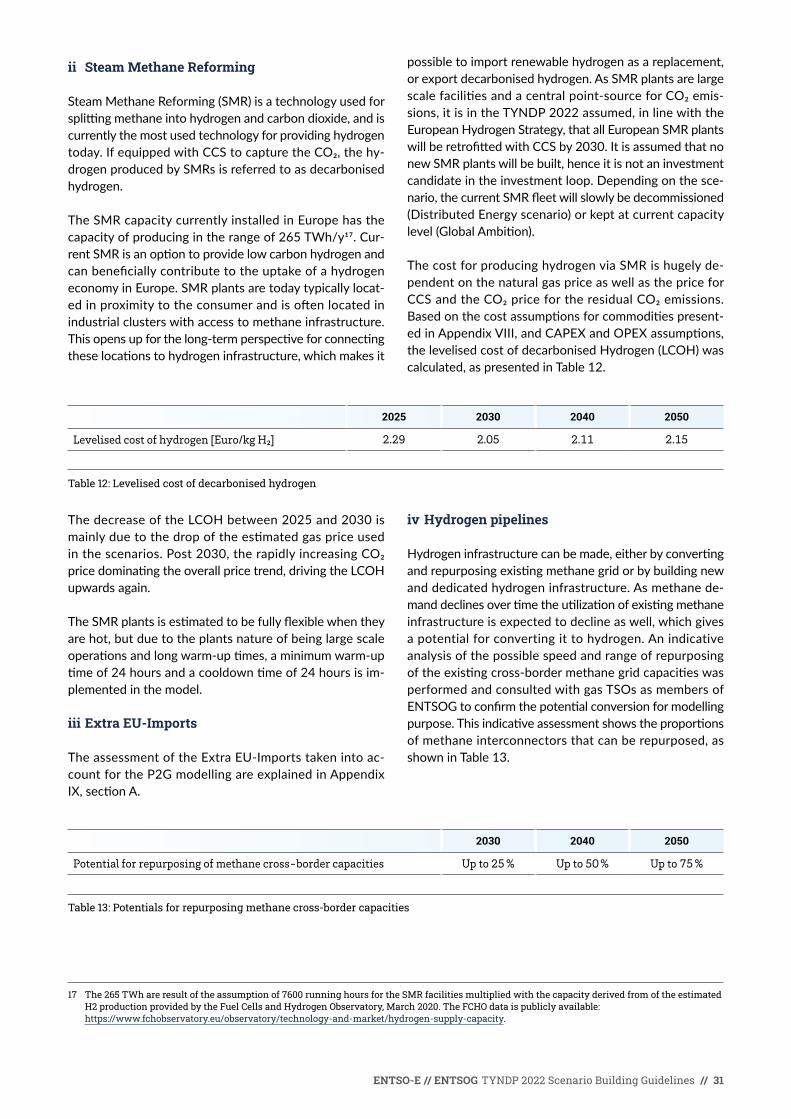
ThecostforproducinghydrogenviaSMRishugelyde-pendent on the natural gas price as well as the price for CCSandtheCO₂pricefortheresidualCO₂emissions.Basedonthecostassumptionsforcommoditiespresent-edinAppendixVIII,andCAPEXandOPEXassumptions,thelevelisedcostofdecarbonisedHydrogen(LCOH)wascalculated,aspresentedinTable12.
2025 2030 2040 2050
Levelised cost of hydrogen [Euro/kg H₂] 2.29 2.05 2.11 2.15
Table 12: Levelised cost of decarbonised hydrogen
The decrease of the LCOH between 2025 and 2030 is mainlyduetothedropoftheestimatedgaspriceusedinthescenarios.Post2030,therapidlyincreasingCO₂pricedominatingtheoverallpricetrend,drivingtheLCOHupwards again.
TheSMRplantsisestimatedtobefullyflexiblewhentheyarehot,butduetotheplantsnatureofbeinglargescaleoperationsandlongwarm-uptimes,aminimumwarm-uptimeof24hoursandacooldowntimeof24hoursisim-plemented in the model.
iii Extra EU-Imports
TheassessmentoftheExtraEU-Importstakenintoac-count for the P2G modelling are explained in Appendix IX,sectionA.
iv Hydrogen pipelines
Hydrogeninfrastructurecanbemade,eitherbyconvertingandrepurposingexistingmethanegridorbybuildingnewand dedicated hydrogen infrastructure. As methane de-manddeclinesovertimetheutilizationofexistingmethaneinfrastructureisexpectedtodeclineaswell,whichgivesa potential for converting it to hydrogen. An indicative analysis of the possible speed and range of repurposing oftheexistingcross-bordermethanegridcapacitieswasperformed and consulted with gas TSOs as members of ENTSOGtoconfirmthepotentialconversionformodellingpurpose.Thisindicativeassessmentshowstheproportionsofmethaneinterconnectorsthatcanberepurposed,asshown in Table 13.
2030 2040 2050
Potential for repurposing of methane cross-border capacities Up to 25 % Up to 50 % Up to 75 %
Table 13: Potentials for repurposing methane cross-border capacities

32 // ENTSO-E // ENTSOG TYNDP 2022 Scenario Building Guidelines
Inparallel,thepotentialforbuildingnewhydrogeninfra-structure has been assessed in cases where repurposing does not deliver the needed capacity. The boundary con-ditionsandthepotentialsarebasedonexperiencefromthemethanegrid,anditisdeterminedtogivethemodeltheoptiontoinvestinupto7,5GWH2 per year per border.
18 https://gasforclimate2050.eu/sdm_downloads/extending-the-european-hydrogen-backbone/
Bothrepurposedgrid,andnewbuildgrid,areinvestmentcandidates to the investment model. The associated costs arebasedonthestudyEuropeanHydrogenBackbone,whichisconductedbyGasForClimate18. The costs used intheinvestmentmodellingare:
Type Band Capacity Cost €/MW/km (until 2040) Cost €/MW/km (from 2040)
Repurpose 1Depending on the existing
methane capacity92 54
New Pipeline 2 Up to 13 GW 265 227
Table 14: Investment candidates for hydrogen infrastructure
Whentheinvestmentmodelisrun,andtheoptimalhydro-geninfrastructureisdetermined,thehydrogensystem,willbe modelled under the same constraints as the electricity system.Inotherwords,themodelwillclearthemarketforanoptimalsystempriceinboththeelectricityandthehydrogenmarket,andtherewillbeapriceforhydrogenineveryhouroftheyear.Thisisaneededassumption,asrequiredperthemethodologyofthetoolsavailabletotheWGSB.Eventhoughitdoesnotreflectthegasmarket,itisestimated,thatthismodellingmethodologyshowssufficientoperationaldynamicstoboththeelectricityandgasmarket.
Asforelectricity,hydrogeninterconnectionsarealsopo-tentialinvestmentcandidatesfortheexpansionmodelinordertooptimizethelocationofelectricityproductionandelectrolysers. Such grid developments result from a Euro-peanoptimisationoftheenergyinfrastructureanddonotsignifyaparticulartransmissionneedortheidentificationofaprojectforafuturetimehorizon.
v Hydrogen Storages
One of the main sources of flexibility in the hydrogen system,arethehydrogenstorages.IntheTYNDP2022scenarios,twodifferentstoragetechnologiesaredefinedwithdifferenttasksassigned:
- Saltcavernstorage:largescalestorageoptionthatisconnectedtothehydrogengridinordertooffersecu-
rityofsupplyandflexibilitytothesystemfordifferenttimeperiods(dailytoseasonal).
- DecentralPressurisedhydrogentanks:Smallscalestor-ageoptionthatisnotconnectedtothehydrogengrid.Itisusedtoachieveadecouplingfromtheelectricitymarketforalimitedperiodoftime(upto48 h),e. g.,toavoid producing hydrogen during some hours with high electricityprices.Noofferofsecurityofsupply.
vi Salt cavern
Saltcavernsseemslikeoneofthemostpromisingstoragetechnologies for large scale hydrogen storage and is one of thefewtestedtechnologiesforlargescaleoperation.Duetothesheersizeofpotentialsaltcavernstorages,theyareexpectedtoplayakeyroleinbalancingthehydrogengrid.
ThepotentialforEuropeansaltcavernstorageshavebeenidentifiedthroughascreeningofexistingsaltcavernstor-ages used for methane today. Due to the expected decline inmethanedemanduntil2050,anincreasingproportionofthesaltcavernstorages,canovertimebeconvertedtohydrogen.Itisassumedthatallsaltcavernstoragecapac-itiescanintimebeconverted,sincethereisstillplentyaquiferstoragecapacityavailableformethanestoragein the long term. Table 15 shows the salt cavern storage that can be converted to hydrogen storage as well as the resultingstoragecapacitiesthatisavailableformodelling(sameforDEandGA).
2030 2040 2050
Conversion of current salt cavern storages (in %) 33 67 100
Hydrogen storage working gas volume (TWhNCV) 33.75 68.53 102.29
Table 15: Salt cavern storage conversion potentials for hydrogen in the investment loop

ENTSO-E // ENTSOG TYNDP 2022 Scenario Building Guidelines // 33
Thecostsforconvertingexistingsaltcavernsfrommeth-anetohydrogenisexpectedtobeintherangeof50 %ofinvestmentcostsofanewbuiltstorage,asitismostlytheabove-groundequipmentthatneedstobereplacedorrepurposed,resultinginapriceof167 € / MWhH₂stored19.
Inthelongterm,otherstoragetechnologies,likeaquiferstorages,mightprovefeasible.Astechnologiesdevelopandisproven,theTYNDPscenarioswillinthefuturebeupdated to include these.
Fromamodellingstandpoint,theflexibilityfromhydrogenstorageistobemodelledasmedium-long(days-months)termstorageunitforthegassystem,similartothewaythatpumpedhydroplantsprovidemedium-longtermflexibilityfor the electricity system.
vii Decentralised Pressurised Hydrogen Tanks
DecentralisedhydrogenstoragetanksforPressurisedhydrogenserveacriticalpurposeforprovidingflexibilityfor Decentralised hydrogen demand that is not located so that it can be connected to the hydrogen grid. The Pres-surisedstoragetankscanbesteeltanks,aluminumtanksorcompositetanks.
Due to difficulties in having the investment loop in the scenariodevelopmentdeterminethesizeoftheDecen-
19 “Hydrogen generation in Europe: Overview of costs and key benefits (2020)” This study undertaken by Guidehouse and Tractebel estimates the investment cost for new salt cavern storages of 334 EUR / MWh H2 stored. This value was then divided by two.
tralisedtanks,theirsizewaschosenexanteanddefinedtobeenoughforserving48hoursofhydrogendemandandbefilledin8hours.Thisnumberwaschosenbasedonexperiencefrommodellingandoptimizingsimilarstand-alonesystemsfromvariousTSOs,andisnotanoptimizedvalue,butaqualifiedestimateofwheretheextrasizeofDecentralised storage begins to see diminishing returns. The exact value can be discussed and might be developed in future TYNDP scenarios.
Fromamodellingstandpoint,theflexibilityfromDecentral-isedhydrogenstorageistobemodelledasshort-medium(hours-days)termstorageunitsforthegassystem,similartothewaythatgridscalebatteriesshort-mediumtermflexibilityfortheelectricitysystem.
D The P2G configurations modelled in TYNDP 2022 scenarios
ThefutureoperationandconfigurationofP2Gunits,arestilluncertain,whicharethemaindriversfordevelopingandmodellingP2Gusingapluralityofconfigurationsinthe TYNDP2022 scenarios. The main purpose of using dif-ferentconfigurationsistoreflecttheirdistinctoperationaldynamicstowardstheelectricitymarket.P2Gisenvisionedtobeoneofthemainsourcesofdemandsideflexibility,andhowthatflexibilityisactivateddependsonhowtheP2Gisconfigured.
Figure 15: Modelling configurations for P2G and H₂-Grid in the TYNDP2022 scenarios
Figure15showsanoverviewofallthedifferentmodellingconfigurationsforP2GandH₂grid,whichisusedintheTYNDP2022scenarios.Ingeneral,itisseenthattheH₂
demandissplitintofourdifferentconfigurations,whicheachcanbeservedwithhydrogen,intheirindividualwaydependingonwhatplanttypetheconfigurationisreflect-
Electricity Market
Generation CapacityInfrastructure(TSO-)Demand
1. Indirect H2 demand/decentral upgrading
Electricity connection
Hydrogen connection
2. Decentral direct demand with storage
3. Replacing Blue H2 with Green H2 (SMR)
P2G
P2G
P2G
DRES
DRES
P2G
4. Hydrogen MarketXX00 national
H2-gridStorage (cavern)
4. Hydrogen MarketYY00 national
H2-gridStorage (cavern)
Extra-EUH2-imports
4. Hydrogen MarketZZ00 national
H2-gridStorage (cavern)
TSO node H2 demand nodesHydrogen pipeline
Hydrogen pipeline (planned)
DRES P2G
P2G

34 // ENTSO-E // ENTSOG TYNDP 2022 Scenario Building Guidelines
ing.Thegreenboxtotheleftisthe“normal”electricitymarketnodewhereamarketclearingofelectricityisdoneasusual.Thefourdifferentconfigurationsareinthemodelset up in each of their individual nodes and are assigned aspecifichydrogendemand.Thishydrogencanthenbeprovidedbydifferentmeans,dependingonthenode,andflexibilitycanbeprovidedindifferentwaystothedifferenthydrogennodes.Inthefollowing,eachindividualnodewillbe elaborated.
i Configuration 1: Indirect H2 demand for Decen-tralised upgrading facilities
Thepurposeofthisconfigurationistoreflectplantsthatare Decentralised throughout Europe and that have a hydrogen demand that can be characterised as indirect hydrogen demand. This could typically be biogas plants producingamixofmethaneandCO₂throughanaerobicdigestionofbiomassand/orfarmwaste.Theseplantswillbeinrelativeproximitytothelocationswherethebiomassisavailable,asitcanrequirealotofresourcestotransportbiomassforverylongdistances.Tomaximizevalue,theplantsupgradetherawbiogas,whichistypicallycontainingintherangeof60 % volmethaneand40 % volCO₂insteadofjustflaringtheCO₂totheatmosphere.
ThroughsynthesisoftheCO₂fromthebiogasandre-newableH₂,theupgradingfacilitycaneitherproducesyntheticmethaneorsyntheticfuelsinprocessesliketheFisher-Tropsch.
The hydrogen can be produced with electricity from two differentsources,eitherfromelectricityfromdedicatedrenewablesources,notedDRESinthefigure,orfromelectricityfromtheelectricitymarket.Therefore,fromanelectricitymarketperspectivetherewillbeapullforelectricitythatisinversetotherenewableproductionasthehydrogendemandmustbemetwitheitherDRESorfromtheelectricitymarket
Inthisconfiguration,theexpansionmodelhastheabilitytoinvestindedicatedRES.
ii Configuration 2: Decentralised direct demand with storage
ThepurposeofthisconfigurationistoreflectplantswithadirecthydrogenconsumptionthathasinstalledasystemofDecentralisedPressurisedhydrogentanksinordertodeliver flexibility for the demand. This configuration is meant to represent e.g. hydrogen refueling stations for transport,ortocoverconsumers,thatduetotimeorgeographicalconstraints,cannotbecoveredbyanationalhydrogeninfrastructure.Forexample,consumersmightliketophaseouttheircurrentlyusedfossilfuelbycompletingitwithhydrogenproducedbyanon-siteelectrolyserbefore
a hydrogen transmission pipeline can be build to decrease theircarbonemission.Therefore,theyinstallPressurisedhydrogentankstoactasabuffer,sothattheyhaveroomforoptimizingtheoperationoftheelectrolysertothehours where electricity is cheaper and more renewable.
Thedynamicsofthisconfiguration,asseenfromtheelectricitymarketissothattheelectrolyserwilloptimizeoperationdependingonboththeelectricityprice,theex-pected electricity price and the current storage level. This meansthatlowpricehourswithalargepenetrationofRESwillbepreferred.InlongperiodswithlowRESpenetrationandhighelectricityprices,theplantmightbeforcedtorun the electrolyser in order to ensure that the demand ismet,whichentailsacarbon-emissionforthesehours.Ingeneral,thedynamicofthisconfigurationislikewhatwouldbeexpectedfromafleetofEVswithsmartcharging,butwithoutV2Gcapabilities.
Thecapacityofthedecentralizedpressurizedhydrogenstorageisdefinedexantetocover48hoursofhydrogendemand.
iii Configuration 3: Complementing electrolysis with SMR production
The purpose of this configuration is to reflect plants thatcurrentlyhaveahydrogendemand,whichisservedfromsourceslikeSteamMethaneReforming(SMR).ItisassumedthattheseplantsovertimewouldliketoreplacetheirhydrogenfromSMRwithrenewablehydrogen,whichis why they install an electrolyser to produce renewable hydrogeninthehourswhereelectricityfromthemarkethaslowcosts,andlowcarbonemissions.Toensuresecurityofsupply,theplant,willkeeptheirSMRplantinoperation,and when electricity prices are too high to economically justifyoperation,theSMRwillbeusedinstead.Duetothe fact that the hydrogen consumers in this category are alreadyconnectedtothemethanegrid,andthatpartsofthemethanegridovertimecanbeconvertedtohydrogen.Thisconfigurationwill,overtime,beconnectedtothehy-drogenmarketwhichisdescribedinthenextparagraph.
Thedynamicsofthisconfigurationareasimplecut-in/cut-outdynamicsbasedonthepriceofhydrogenfromtheSMRplant.Whenrenewablehydrogenisthecheapestalternative,itisprioritized,andwhenelectricitypricesrise,decarbonisedhydrogenfromtheSMRispreferred.Overtime,asthehydrogengriddevelops,thisdynamicwillhavetoconsiderthepriceformationonthehydrogenmarket,whereboththeelectrolyserandtheSMRwillbeabletodeliver hydrogen.

ENTSO-E // ENTSOG TYNDP 2022 Scenario Building Guidelines // 35
Inthisconfiguration,theexpansionmodelhastheabilitytoinvestinelectrolysercapacity.TheSMRcapacityiskeptatthecurrentlevelinGlobalAmbition,andisdecommis-sionedovertimeinDistributedEnergy.
iv Configuration 4: National and European hydrogen Markets
ThepurposeofthisconfigurationistoreflecttherolloutofanationalandEuropeanhydrogenmarketwithvarioussourcesandinterconnectedbetweencountries,withahydrogentransmissiongrid.AsresourcesforRESvaryindifferentlocations,andbecausehydrogeninfrastructureiscostcompetitivetoelectricityinfrastructure,itiscon-cludedthatmuchofEurope’shydrogendemandwillbeconnectedtothegrid.ThisisinlinewiththeperspectivesseenintheEuropeanHydrogenBackbone20study,andbuilds on the same principles.
Inthisconfigurationhydrogencanbeproducedfrommul-tiplesources.First,itcancomefromtheinterlinkagetoconfiguration3.SeconditcancomefromextraEUimportsviapipeline,seealsoAppendixIX,sectionA.Lastly,itcancome from renewable hydrogen from various sources. The firstsource,4.a,isanelectrolyserthatisgridconnected.Thesecondsource,4.b,areadedicatedfeed-in-zone,wherenewbuildDRESisco-locatedwithanelectrolyserand partly connected to both the electricity and the hy-drogengrid.Thisfeed-in-zoneapproachisakeydriverforco-locationofRESandelectrolyserasithasthepotentialto save costs on electricity infrastructure. The possibility tobepartlyconnectedtotheelectricitymarket,makesitpossible for the plant to export valuable electricity to the marketinlowREShours,andinhighREShourswhereelectricityisplentiful,itcanbeconverteddirectlytohydro-gen.Thelastoptionforprovidingrenewablehydrogen,4.c,isbydedicatedRESthatisnotconnectedtotheelectricitymarket,andcouldbeintheformofnewtechnologieslikeH₂-PVpanelsorH₂-windturbines.
20 https://gasforclimate2050.eu/wp-content/uploads/2021/06/European-Hydrogen-Backbone_April-2021_V3.pdf
Theflexibilityinthehydrogenmarketcomesfromvarioussourcesaswell.Oneofthelargestsourcesforflexibilityarethe central salt cavern storages which are available for the hydrogenmarket,seesectiononsaltcavernstorage.Thesaltcavernstoragesactlikeabuffertotherenewablehy-drogen,andarbitragesfromcharginginhourswhereplentyhydrogenisavailableandpricesarelow,todischarginginhigherpricehours.Themaindriverforprovidingflexibilityisthepriceofhydrogeninthismarketnode,similartowhatitisintheelectricitymarket.Thiswilldriveproductionfromthevarioussourcesanddrivetheflowsinthehy-drogen grid between countries that has an excess or need for hydrogen.
Inthisconfiguration,theexpansionmodelhastheabilitytoinvestelectrolysercapacityconnectedtothemarket,REScapacitiesinthefeed-in-zone,electrolysercapacityinthefeed-in-zone,electricitygridconnectionto/fromthefeed-inzone,DRESandthecorrespondingelectrolysers,newhydrogenstoragefacilitiesaswellashydrogengridbetween countries.
E Distribution of hydrogen demand in configurations
Asmanyoftheproductionfacilitiesinthedifferentconfig-urationareoptionsfortheexpansionmodel,thedemandineachnodehastobedeterminedexante.Thisdistributionof demand has been done by WGSB and is based on each ofthescenariostorylinesmatchedwiththeconfigurations.Ingeneral,itisassumedthatthemajorityofdemandovertimewillbemovedtoconfiguration4whereitcanbeservedfromamarketinordertoexploitthebenefitsofanintegratedandflexiblehydrogenmarket.Thetotalhydrogen demand is distributed in form of both direct and indirect hydrogen demand for the Distributed Energy andGlobalAmbitionscenarios,asshowninTable16andTable17.
Distributed Energy 2025 2030 2040 2050
Configuration 1: 50 % of indirect 50 % of indirect 50 % of indirect 50 % of indirect
Configuration 2: 25 % of direct 25 % of direct 20 % of direct 20 % of direct
Configuration 3: 50 % of direct 40 % of direct 10 % of direct 2 % of direct
Configuration 4: 25 % of direct 35 % of direct 70 % of direct 78 % of direct
50 % of direct 50 % of direct 50 % of direct 50 % of direct
Table 16: Distribution of hydrogen demand across electrolysis configuration for Distributed Energy

36 // ENTSO-E // ENTSOG TYNDP 2022 Scenario Building Guidelines
Global Ambition 2025 2030 2040 2050
Configuration 1: 33 % of indirect 33 % of indirect 33 % of indirect 33 % of indirect
Configuration 2: 25 % of direct 20 % of direct 15 % of direct 5 % of direct
Configuration 3: 50 % of direct 40 % of direct 10 % of direct 5 % of direct
Configuration 4: 25 % of direct 40 % of direct 75 % of direct 90 % of direct
67 % of direct 67 % of direct 67 % of direct 67 % of direct
Table 17: Distribution of Hydrogen demand across electrolysis configurations for Global Ambition
21 European Hydrogen Backbone, Analysing future demand, supply, and transport of hydrogen (June 2021) §4.4.2
F First steps in the direction of interlinked modelling
ContrarytotheTYNDP2020,wherepotentialsforP2Gwereinvestigatedoutsidetheelectricitymarket,theTYNDP2022seekstoincludetheP2Gintheelectricitymarketmodels.DuetothenatureofthemarketmodelsoftwareusedbyENTSO-Eanditsmembers,theoperationofthehydrogennetworkismodelledandoperatedunderthesameassumptionsandmarketclearingrulesastheelectricitymarket.Thismeansthatthehydrogenmarketisclearedonanhourlybasis,andthatthemodelseekstooptimizesocietalwelfarebyproducing,distributing,
storing,andconsuminghydrogeninconjunctionwiththeelectricitysystem.ThedrasticdevelopmentoftheP2Gmethodology in the TYNDP 2022 scenario is a step in thedirectionofinterlinkedmodelling,wheretheenergysystemcanbeoptimizedacrossenergyvectors,andwhereaholisticapproachistakentotransmissionplanning.
Themethodologywillneedfutureimprovement,tun-ing and development to more carriers in future TYNDP scenario processes. The WGSB is open for input on this regardasitisacknowledgedtobenefitfromthespecializedknowledgeofstakeholders.
AppendixIV:InvestmentCostassumptions
This appendix provides further details on the different investment candidates available to the expansion model.
A Hydrogen interconnection and salt cavern
TheconversionrateforretrofittedpipelinesisexplainedintheAppendixIII,sectionC(iv).Duetothelimitedexpe-riencewithhydrogengriddevelopment,themethanegriddevelopmentisusedasaproxy.Thebuild-outrateissetat7,5GW/yearperborder.
Alevelisedcostofstorageof9 € / MWh21 is used to capture the impact of salt cavern on hydrogen on the energy sys-tem and especially the level of electrolysis capacity.
B Electricity interconnection
Theupperexpansionlimitofferedoneachinterconnectiontotheexpansionmodelintendstoreflecttheexistenceofactualprojectsontheconsideredhorizon,basedonthelisttakenfromTYNDP2020,and/or,wherenoprojectswereproposed,genericinterconnectionincrements(100MW,500MWor2000MW)adaptedtothesizeofthecountryandthepre-existingnetwork.
FortheCOP21scenarios,thechallengeistomanagethelevel of increase at a reasonable value avoiding too large increasesintooshorttimeforsuchinfrastructures.
TYNDPinvestmentoptionsarelimitedtotheperiodbe-tween2025and2040.Afterthisperiod,andupto2050,anestimateisusedforyearlyexpansionratebasedontheexpansionoptionsbetween2025and2040.Ascapacityisincreasedacrossborders,thecostofadditionalintercon-nectioncapacitytypicallyincreases.Alinearprojectionistherefore used to establish the cost of new grid between 2040 and 2050.
Themodelisthencapableofchallengingvariousoptions,investinRESinanareawithhighpricesevenwitharatherlowloadfactor,orco-investinRESandgrid,byselectingforexampleahighloadfactorareatodevelopREStogeth-erwithaninterconnectortoexportitintothehigh-pricedarea,ifthisisprofitable.
C Power generation, batteries and electrolysers
TheassumptionsonpowergenerationCAPEXandOPEXareprimarilybasedonDanishEnergyAgency’sTechnol-

ENTSO-E // ENTSOG TYNDP 2022 Scenario Building Guidelines // 37
ogyCatalogueforGenerationofElectricityandDistrictHeating22,withASSETreport“Technologypathwaysinde-carbonisationscenarios”23usedasasupportingreference.AnnexIIofthisdocumentpresentstheCAPEXandOPEXassumptions.Allcostsareinrealterms.
GlobalAmbitionandDistributedEnergyscenariosdifferregardingREScostsinordertoreflecttheirdifferenttech-
22 https://ens.dk/en/our-services/projections-and-models/technology-data
23 https://ec.europa.eu/energy/sites/ener/files/documents/2018_06_27_technology_pathways_-_finalreportmain2.pdf
nologyfocus.GlobalAmbitionconsidersthelowerboundofcostsforoffshorewindincoherencewiththefocusonlargegenerationunits.DistributedEnergyconsidersthelower bound for onshore wind and solar PV in coherence withDecentralisedtechnologies.Batteries,CCGT,OCGT,electrolysers,coalandlignitehavethesameCAPEXandOPEXforbothscenarios.
National Trends 2025 2030 2035 2040 2045 2050 Lifetime (years)
Wind onshore* CAPEX €/kW 1,111 1,040 997 954 932 909
30OPEX €/kW/a 13.7 12.6 11.9 11.3 11.0 10.7
Wind offshoreCAPEX €/kW 2,063 1,930 1,860 1,791 1,739 1,689
30OPEX €/kW/a 38.7 36.1 34.5 32.8 31.8 30.7
Solar PV (utility-scale)
CAPEX €/kW 455 380 355 330 315 30040
OPEX €/kW/a 8.1 7.3 7.0 6.6 6.5 6.3
Solar PV (rooftop)
CAPEX €/kW 1,000 870 800 730 660 59040
OPEX €/kW/a 12.1 10.8 10.4 10.0 9.5 9.1
BatteryCAPEX €/kW 607 456 443 430 417 404
25OPEX €/kW/a 23.5 15.0 14.5 14.1 13.6 13.1
CCGTCAPEX €/kW 855 830 815 800 800 800
25OPEX €/kW/a 28.6 27.8 27.4 26.9 26.4 26.0
OCGTCAPEX €/kW 445 435 430 424 418 412
25OPEX €/kW/a 7.9 7.7 7.7 7.6 7.5 7.4
ElectrolyzerCAPEX €/kW 693 340 305 270 235 200
25€/kW/a 26.3 15.0 13.8 12.5 11.3 10.0
Distributed Energy 2025 2030 2035 2040 2045 2050 Lifetime (years)
Wind onshore CAPEX €/kW 1,000 915 866 817 788 758
30OPEX €/kW/a 11.2 10.5 9.8 9.1 8.9 8.6
Wind offshoreCAPEX €/kW 1,799 1,620 1,532 1,444 1,395 1,348
30OPEX €/kW/a 41.1 38.8 37.3 35.9 34.9 33.9
Solar PV (utility-scale)
CAPEX €/kW 412 333 307 281 266 25040
OPEX €/kW/a 6.8 6.0 5.7 5.4 5.2 5.0
Solar PV (rooftop)
CAPEX €/kW 904 762 692 622 556 49240
OPEX €/kW/a 10.2 8.9 8.5 8.1 7.7 7.2
* For wind onshore technologies, CAPEX and OPEX are adjusted to reflect expected load factor evolution in 2025-2050, given that utilized PECD time series are constant for the entire time horizon, but some incremental improvement in terms of load factors are expected. The costs presented reflect a standard techno-logy in terms of hub height and specific power. As described in the section on PECD, the modelled onshore wind technology mix varies country-by-country, and CAPEX figures are variated depending on the technology mix.
Table 18a: OPEX and CAPEX costs for market capacties
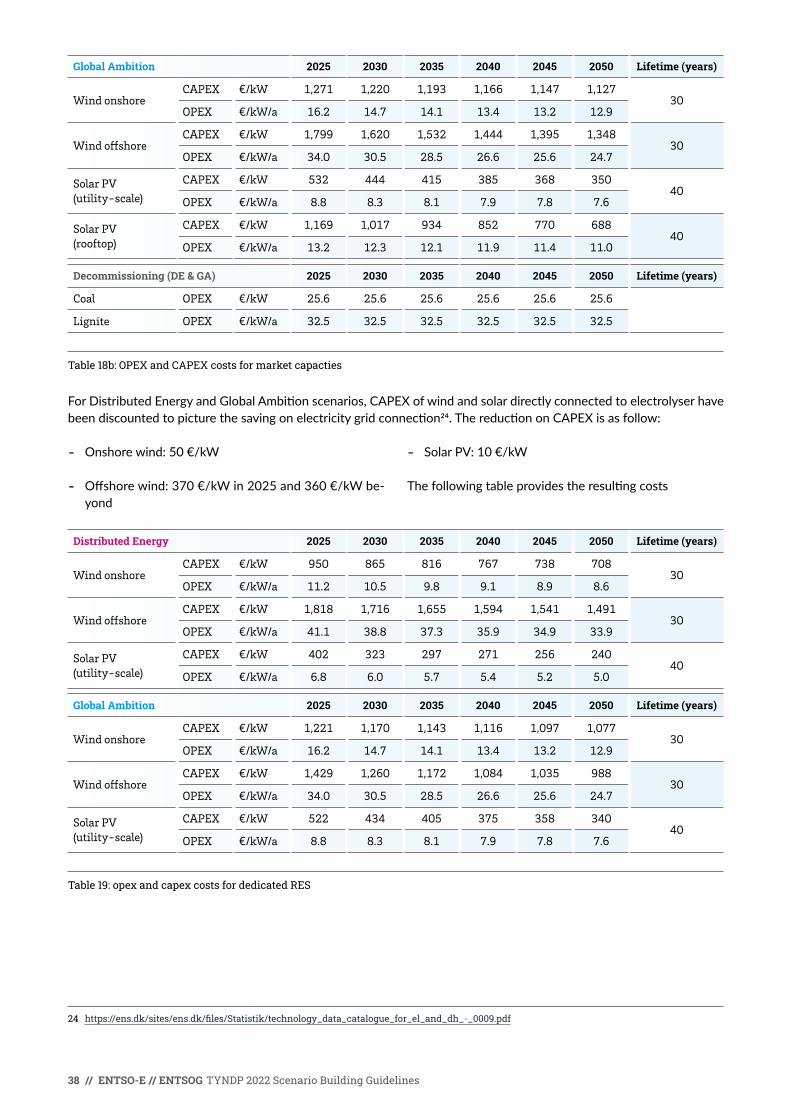
38 // ENTSO-E // ENTSOG TYNDP 2022 Scenario Building Guidelines
Global Ambition 2025 2030 2035 2040 2045 2050 Lifetime (years)
Wind onshore CAPEX €/kW 1,271 1,220 1,193 1,166 1,147 1,127
30OPEX €/kW/a 16.2 14.7 14.1 13.4 13.2 12.9
Wind offshoreCAPEX €/kW 1,799 1,620 1,532 1,444 1,395 1,348
30OPEX €/kW/a 34.0 30.5 28.5 26.6 25.6 24.7
Solar PV (utility-scale)
CAPEX €/kW 532 444 415 385 368 35040
OPEX €/kW/a 8.8 8.3 8.1 7.9 7.8 7.6
Solar PV (rooftop)
CAPEX €/kW 1,169 1,017 934 852 770 68840
OPEX €/kW/a 13.2 12.3 12.1 11.9 11.4 11.0
Decommissioning (DE & GA) 2025 2030 2035 2040 2045 2050 Lifetime (years)
Coal OPEX €/kW 25.6 25.6 25.6 25.6 25.6 25.6
Lignite OPEX €/kW/a 32.5 32.5 32.5 32.5 32.5 32.5
Table 18b: OPEX and CAPEX costs for market capacties
ForDistributedEnergyandGlobalAmbitionscenarios,CAPEXofwindandsolardirectlyconnectedtoelectrolyserhavebeendiscountedtopicturethesavingonelectricitygridconnection24.ThereductiononCAPEXisasfollow:
24 https://ens.dk/sites/ens.dk/files/Statistik/technology_data_catalogue_for_el_and_dh_-_0009.pdf
- Onshorewind:50€/kW
- Offshorewind:370€/kWin2025and360€/kWbe-yond
- SolarPV:10€/kW
Thefollowingtableprovidestheresultingcosts
Distributed Energy 2025 2030 2035 2040 2045 2050 Lifetime (years)
Wind onshore CAPEX €/kW 950 865 816 767 738 708
30OPEX €/kW/a 11.2 10.5 9.8 9.1 8.9 8.6
Wind offshoreCAPEX €/kW 1,818 1,716 1,655 1,594 1,541 1,491
30OPEX €/kW/a 41.1 38.8 37.3 35.9 34.9 33.9
Solar PV (utility-scale)
CAPEX €/kW 402 323 297 271 256 24040
OPEX €/kW/a 6.8 6.0 5.7 5.4 5.2 5.0
Global Ambition 2025 2030 2035 2040 2045 2050 Lifetime (years)
Wind onshore CAPEX €/kW 1,221 1,170 1,143 1,116 1,097 1,077
30OPEX €/kW/a 16.2 14.7 14.1 13.4 13.2 12.9
Wind offshoreCAPEX €/kW 1,429 1,260 1,172 1,084 1,035 988
30OPEX €/kW/a 34.0 30.5 28.5 26.6 25.6 24.7
Solar PV (utility-scale)
CAPEX €/kW 522 434 405 375 358 34040
OPEX €/kW/a 8.8 8.3 8.1 7.9 7.8 7.6
Table 19: opex and capex costs for dedicated RES
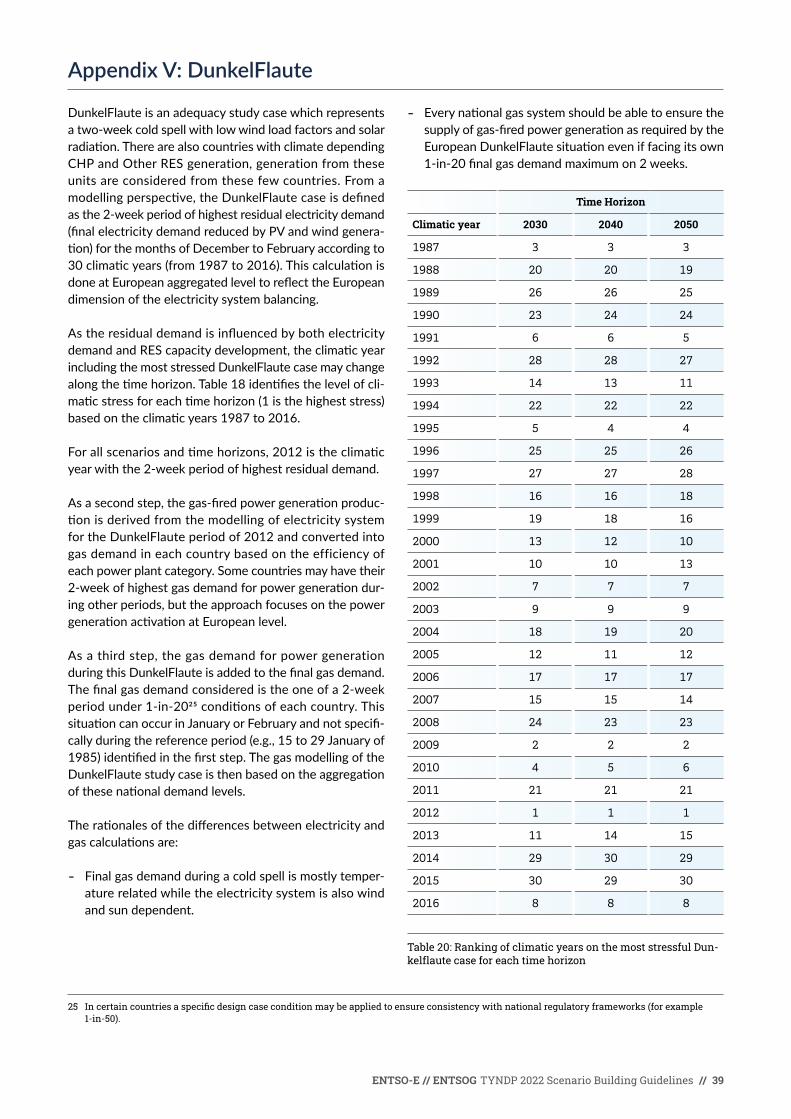
ENTSO-E // ENTSOG TYNDP 2022 Scenario Building Guidelines // 39
Appendix V: DunkelFlaute
25 In certain countries a specific design case condition may be applied to ensure consistency with national regulatory frameworks (for example 1-in-50).
DunkelFlauteisanadequacystudycasewhichrepresentsatwo-weekcoldspellwithlowwindloadfactorsandsolarradiation.TherearealsocountrieswithclimatedependingCHPandOtherRESgeneration,generationfromtheseunitsareconsideredfromthesefewcountries.Fromamodellingperspective,theDunkelFlautecaseisdefinedasthe2-weekperiodofhighestresidualelectricitydemand(finalelectricitydemandreducedbyPVandwindgenera-tion)forthemonthsofDecembertoFebruaryaccordingto30climaticyears(from1987to2016).ThiscalculationisdoneatEuropeanaggregatedleveltoreflecttheEuropeandimension of the electricity system balancing.
AstheresidualdemandisinfluencedbybothelectricitydemandandREScapacitydevelopment,theclimaticyearincludingthemoststressedDunkelFlautecasemaychangealongthetimehorizon.Table18identifiesthelevelofcli-maticstressforeachtimehorizon(1isthehigheststress)basedontheclimaticyears1987to2016.
Forallscenariosandtimehorizons,2012istheclimaticyearwiththe2-weekperiodofhighestresidualdemand.
Asasecondstep,thegas-firedpowergenerationproduc-tionisderivedfromthemodellingofelectricitysystemfortheDunkelFlauteperiodof2012andconvertedintogas demand in each country based on the efficiency of each power plant category. Some countries may have their 2-weekofhighestgasdemandforpowergenerationdur-ingotherperiods,buttheapproachfocusesonthepowergenerationactivationatEuropeanlevel.
Asathirdstep,thegasdemandforpowergenerationduringthisDunkelFlauteisaddedtothefinalgasdemand.Thefinalgasdemandconsideredistheoneofa2-weekperiodunder1-in-2025conditionsofeachcountry.ThissituationcanoccurinJanuaryorFebruaryandnotspecifi-callyduringthereferenceperiod(e.g.,15to29Januaryof1985)identifiedinthefirststep.ThegasmodellingoftheDunkelFlautestudycaseisthenbasedontheaggregationofthesenationaldemandlevels.
Therationalesofthedifferencesbetweenelectricityandgascalculationsare:
- Finalgasdemandduringacoldspellismostlytemper-ature related while the electricity system is also wind and sun dependent.
- Everynationalgassystemshouldbeabletoensurethesupplyofgas-firedpowergenerationasrequiredbytheEuropeanDunkelFlautesituationeveniffacingitsown1-in-20finalgasdemandmaximumon2weeks.
Time Horizon
Climatic year 2030 2040 2050
1987 3 3 3
1988 20 20 19
1989 26 26 25
1990 23 24 24
1991 6 6 5
1992 28 28 27
1993 14 13 11
1994 22 22 22
1995 5 4 4
1996 25 25 26
1997 27 27 28
1998 16 16 18
1999 19 18 16
2000 13 12 10
2001 10 10 13
2002 7 7 7
2003 9 9 9
2004 18 19 20
2005 12 11 12
2006 17 17 17
2007 15 15 14
2008 24 23 23
2009 2 2 2
2010 4 5 6
2011 21 21 21
2012 1 1 1
2013 11 14 15
2014 29 30 29
2015 30 29 30
2016 8 8 8
Table 20: Ranking of climatic years on the most stressful Dun-kelflaute case for each time horizon

40 // ENTSO-E // ENTSOG TYNDP 2022 Scenario Building Guidelines
Appendix VI: Demand
Thedemandprofilebuildingprocessisnecessarytoallowannualfinaluseenergyvolumestobeconvertedtohourlyanddailyvolumesrequiredforthepowerandgassectormodellingtools.Thehigh-levelprocessstepsareshowninFigure16.
Figure 16: Demand profile building process
A Electricity Demand
Electricity demand is a fundamental input to the power sector investment modelling step in the scenario building process. Electricity demand is projected in two ways de-pendingonwhetherascenarioisbuildusinga"bottom-up"or"top-down"methodology;
- Bottom-upmodelsusehourlyprofilesthatarebuiltbytheENTSO-EWorkingGroupData&ModelsbasedonTSOvalidation,ordirectlysubmittedbytheTSO.Thedatafilesarebasedonnormalisedprofilesspanning30climatesyears,1987-2016
- Top-downmodelsrequireaprocesstoconverttheannualelectricitydemandfiguresintohourlyprofilesasexplainedinthefollowingsections.
i Top-down electricity demand construction
The following section describes the steps necessary to converttheoutputsfromtheAmbitionToolintoadataformat that can be used as input for the investment tool used by the scenario building models.
Intheelectricitydemandfilebuildingprocess,interactionsbetweenvariousteamsarerequiredinordertoenableanefficientdeliveryofthefinalhourlydemandprofiles.Fig-ure17providesacomprehensivedescriptionofrolesandresponsibilitiestoenablethedemandfilebuildingprocess:
- TheWorkingGroupData&Modelsprovideskeyinputdata to the process in the form of trained normalised demand models along with the necessary PECD.
- TheAmbitionToolteamprovidesExcel-basedindividualmarketzoneAmbitionToolfilesrequiredtoconstructthe demand input sheet. This is then to be read by the TRAPUNTAtool.
- The Demand Team is in charge to develop the simula-tionswithTRAPUNTAinordertocreatetheprofilesforeachmarketnodes,eachtimehorizonsandeachscenario.
- TheInnovationTeamisthefinaluserofthedemandprofilesandisresponsiblefordemandprofileadjust-mentandsplittingthisprofilebetweenwholesalemar-ket,prosumerandEVnodes.
Ambition Tool: Market areaAnnual Energy Volumes
PEMMDB demand sheet formatIntegration Interface and
Storyline Consistency CheckDefining sectoral Full Load Hours
and Case Temperatures
TRAPUNTA
Final demand case figures (Average Summer, Average Winter
Design Case, 2Week)
Hourly demand profiles Electricity Market Simulation:
Gas demand for power ENTSOG DEMAND Daily Value

ENTSO-E // ENTSOG TYNDP 2022 Scenario Building Guidelines // 41
Figure 17: Electricty demand profile building process and team interactions
ii Ambition Tool to TRAPUNTA Conversion tool
Inordertotransformannuallevelelectricitydemandpro-jectedwiththeAmbitionToolintoTRAPUNTAsoftwareusedtocreatehourly-levelelectricitydemandprofiles,aspecificconversionprocesswasapplied.Spaceheatingandcooling-relateddemandwastransferredpertechnology,i.e.splittingair-sourceheatpumps,ground-sourceheatpumps,directelectricheatingandelectrifieddistrictheating.
GenericassumptionsweretakenforcategoriesthatwererequiredbyTRAPUNTAbutnotconsideredbytheAmbitionTool(namelyheatpumpsplitbetweensanitarywaterandotherheatsources).Thisenabledthehourlyloadprofilesofthesetechnologiestobeinfluencedbytheambienttem-peratureassumptionfortheclimateyearsusedintheTRA-PUNTAtool.Non-heatingrelateddemandwasquantifiedasasumofindustrialdemandevolution(includingelectrifiedheatingforindustrialprocesses)aswellaslighting,power,cookingandcateringdemandfromresidentialandtertiarysectors.Thisdemandwasassumedbythenon-temperaturedependentdemandprofilesinTRAPUNTA.
Transportdemandwasbrokendowntoseveraltransportsegments,namelyprivatevehicles,passengerrail,bustrans-port,railfreighttransportandotherfreighttransport,whichwereassignedtype-specifictransportdemandprofiles.
IncasegenericassumptionsmadeinAmbitionTool,Con-versionTooland/orTRAPUNTAresultedinTRAPUNTAprojectiondifferinginannuallevelfromtheoriginalAm-bitionToolprojection,thehourlyprofileswereafterwardsadjusted evenly to match the annual values from the AmbitionTool.
iii Different EV patterns
InTRAPUNTAtheadditionalloadforelectricvehiclesisconsideredbasedonthefollowinginputs:
- AdditionalEVs:thenumberofadditionalelectricvehi-cles with respect to the training period
- Consumption:theaverageconsumptionofaspecifiedelectricvehicle,expressedinkWh/100km
- Effectiveusage:theaverageuseofaspecifiedvehicletype,dividedintoweekdaysandweekends(eachonewithachosenchargeprofile),expressedinkmperday
- Dailydistributionoftheaforementionedeffectiveusagedividedintoweekdaysandweekends.
TRAPUNTAallowscreationofadditionalload,whichincludesfourtypesofelectricvehicles.Duringanalyticalwork,thefollowingtypeshavebeendeveloped:
- TypeA:Electricprivatecars
- TypeB:Buses
- TypeC:Passengertrains
- TypeD:Heavygoodsvehicles
Additionally,railheavygoodsandaviationhavebeencal-culatedandaddedtotherestoftheloadprofilewithanevenrepartitionofdailyvaluewithintheday.
ThenumberofEVsisoneoftheAmbitionToolresultsforeverymarketnode.
WG D&M TRAPUNTA Base files WG SB Ambition Tool Team WGSB Demand Team WGSB Demand Team
• Providers of trained TRAPUNTA Model
• Providers of PECD files
• Providers of National Trends Demand files
• Support for Error correction
• User of Demand profile output
• Responsible for Demand profile adjustment and splitting
• Issues should be reported to Demand Team if required
• Providers of Storyline compliant Ambition Tool files
• Support to Conversion of AT to TRAPUNTA
• Support to demand team for quality assurance process
• Owner of AT to Demand conversion Tool
• Owner of User definable profiles for EV profiles
• Responsible for Quality Assurance Checks
• Responsible for documentation and supporting analysis

42 // ENTSO-E // ENTSOG TYNDP 2022 Scenario Building Guidelines
Electric private carsSinceTRAPUNTAdifferentiatesloadprofileswithworkingdaysandweekendsorseasonalchangesusingelectricityconsumptionandeffectiveusagevaluesasinputdata,thedailyloadpatternshouldbeasuniversalaspossible.Thecurrentloadpatternwascreatedtakingdailyactivityofpotentialusersintoaccount.
Figure 18: Electric private cars load pattern
BussesThedailyloadprofilewascreatedbasedontheassumptionthatmostofbusesusesslownightcharging.Fastchargersatbusdepotsarealsoavailableforaround30-35 %ofthefleet.Thisprofilereflectsmainlypublictransportincities.
Figure 19: Electric busses load pattern
% of daily demand
1 2 3 4 5 6 7 8 9 10 11 12 13 14 15 16 17 18 19 20 21 22 24230
4
2
6
8
10
12
% of daily demand
1 2 3 4 5 6 7 8 9 10 11 12 13 14 15 16 17 18 19 20 21 22 24230
4
5
6
2
3
1
7
8
9
10

ENTSO-E // ENTSOG TYNDP 2022 Scenario Building Guidelines // 43
Electric passenger trainsThedailyloadprofileisbasedonlivedataaboutthenumberofpassengertrainsoperating24hoursaday.Accordingtolivedata,insimplifiedform,therailwaylineloadinglooksasfollows.
Figure 20: Electric passenger trains load pattern
Electric heavy goods vehiclesThedailyloadprofileisfocusedonthefleetofasmalltrucksandwasbasedontheassumptionthattruckswillbechargedmostlyatnight.Nevertheless,thesameassumptionforTransportInternationalRoutevehiclescanbeapplied.
Figure 21: Electric heavy goods vehicles load pattern
% of daily demand
1 2 3 4 5 6 7 8 9 10 11 12 13 14 15 16 17 18 19 20 21 22 24230
4
5
6
2
3
1
7
8
% of daily demand
1 2 3 4 5 6 7 8 9 10 11 12 13 14 15 16 17 18 19 20 21 22 24230
4
2
6
8
10
12

44 // ENTSO-E // ENTSOG TYNDP 2022 Scenario Building Guidelines
iv Assumptions for Heat Pumps (HPs) modelling
The consumptions associated to HPs are constructed starting from the definition of a comfort temperature above(conditioning)orbelow(heating)ofwhichelectricityconsumptionsareexpectedfromconsumers.Thesecom-fort temperatures could be computed by the model itself startingfromhistoricaldataordirectlyinputted.
ForeachtypeofHPs(air/air,air/waterandgeothermal)aCoefficientofPerformance(COP)isconsidered.Forair/airandair/waterHPsaCOPcurveisdefinedaccordingtotemperatureandhumidity(defaultvalue75 %).ForgeothermalHPsasinglevalueisused(defaultvalue3.2).ItispossibletousecustomvaluesfortheCOP.Noassump-tiononelectricityback-upresistanceforheatingserviceisconsidered.
Figure 22: Example of COP curve for air/air and air/water heat pumps
B Gas Demand
Thissectionprovidesthemethodologyandprocessesusedtocollectandcalculatethetotalgasdemand(methaneandhydrogen)forthescenariostobeusedforTYNDP2022.Totalgasdemandismadeupoffinalgasdemand(definedasresidential,tertiary,industrial(includingnon-energyuse)andtransportsectors)andgasdemandforpowergeneration.
Gas demand for power generation is the result of the ENTSO-Emodellingprocess,withaconversionfromtheelectricitygenerationintogasdemand.
ForthisTYNDPprocessthereisadifferentapproachforshort-termdemand(2022,2025)andlong-termdemand(2030,2040)thatwillbeexplainedinthefollowingsection.
TheinnovationofthisTYNDPistheseparationofmethaneand hydrogen demand in all scenarios.
i Seasonal and high case demand situations
GasdemandinEuropeshowsastrongseasonalpattern,with higher demand in winter than in summer. These variationsarelargelydrivenbytemperature-relatedheatdemandintheresidentialandtertiarysectors.Inthelong-term,consideringsomelevelofelectrificationintheheatingsector,alsoanincreasingseasonalityinthegasdemandforpowergenerationisassumable.Thisisduetheroleofgas-firedpowerplantsbeingtheback-upforvariablerenewablesina“kalteDunkelflaute”(Germanfor“colddarkdoldrums”describinga2-weekcoldspellwithverylowvariablerenewableelectricitygeneration).
Inaddition,thedayofhighestconsumptionintheyearisakeyinputthatrepresentsoneofthemoststressfulsituationstobecoveredbythegasinfrastructure(includingtransmission,distributionandstorage).
Asaresultofthesesituations,seasonalvariationandhighcase demand data is contemplated. Table 21 presents an overviewthedifferentcases.
Situation Demand
Average Summer (AS)Final Injection Period Demand
Power Injection Period Demand
Average Winter (AW)Final Withdrawal Period Demand
Power Withdrawal Period Demand
–10 10 301.5
3.0
2.5
2.0
3.5
4.0
0
50
25
75
100
Air-to-air
Temperature (°C)
Rel
. hum
idit
y (%
)
0
50
25
75
100
Rel
. hum
idit
y (%
)
–10 10 302.0
3.0
4.0
5.0
Air-to-water
Temperature (°C)

ENTSO-E // ENTSOG TYNDP 2022 Scenario Building Guidelines // 45
Situation Demand
Design Case (DC)Final Peak Demand
Power Peak Demand
2 Week Cold Spell (2W)Final 2W Demand
Power 2W Demand
Dunkelflaute (DF)Final 2W Demand
Power Demand Dunkelflaute
Table 21: Seasonal and high case variations
ii Seasonal variation
Average demand and the Seasonal Demand Factor (SDF)Seasonalvariationisdividedintotwoperiods:storageinjection period and withdrawal period. These periods correspond to the average summer and average winter demandrespectively.
The storage injection period covers seven months (April-October),whilethestoragewithdrawalperiodcoversfivemonths(January,February,March,November,December).
TheSeasonalDemandFactor(SDF)isaparametertocal-culate average winter and average summer demand as part ofthetotalannualdemandfortheTYNDPSimulations.
Storage injection period average demand = “SDF” * Yearly average demand
SDFrepresentsayearlyfactortoderivethefinaldemandforthe7-monthstorageinjectionperiodfromtheyearlydemand. These values were given by TSOs in the data collectionquestionnaireandusedbothforallscenarios.
High case demand: Design case (DC)TheDesignCase(DC)isthemaximumlevelofgasdemandusedforthedesignofthenetworktocapturemaximumtransportedenergyandensureconsistencywithnationalregulatoryframeworks.Thepeakdaytakesplacebasedonthemodelledsituationfromtheover-the-whole-yearsimulationandismodelledon31January(afterday91ofstoragewithdrawalperiod).
Dependingonthetypeofscenariothemethodologyvaries:
- NationalTrends:FinaldemandvaluesarecollectedfromTSOsintheDataCollectionQuestionnaire.GasdemandforpowergenerationiscalculatedfromtheresultsofENTSO-Emodellingprocess,asitisexplainedin chapter 3.
- COP21scenarios:FinaldemandvaluesarecalculatedfollowingtheGasPeakDemandMethodology,ex-plainedinAppendixVI,sectionB(iv).GasdemandforpowergenerationiscalculatedfromtheresultsofENT-SO-Emodellingprocess,asitisexplainedinchapter3.
High case demand: Two week cold spell (2W)Maximumaggregationofgasdemandreachedover 14consecutivedaysonceevery20yearsineachcoun-trytocapturetheinfluenceofacoldspellonsupplyandespecially on storage. The 14 days high demand period takesplacebasedonthemodelledsituationfromtheover-the-whole-yearsimulationandismodelledstartingon 15February(afterday106ofstoragewithdrawalperiod).
Dependingonthetypeofscenario,themethodologyvaries:
- NationalTrends:FinaldemandvaluesarecollectedfromTSOsintheDataCollectionQuestionnaire.GasdemandforpowergenerationiscalculatedfromtheresultsofENTSO-Emodellingprocess,asitisexplainedin chapter 3.
- COP21scenarios:FinaldemandvaluesarecalculatedbasedontheGasPeakDemandMethodology,ex-plainedinAppendixVI,sectionB(iv).GasdemandforpowergenerationiscalculatedfromtheresultsofENT-SO-Emodellingprocess,asitisexplainedinchapter3.
High case demand: Kalte Dunkeflaute (DF)Theso-called“KalteDunkelflaute”(Germanfor“colddarkdoldrum”)describesanextendedperiodoftimewithverylowoutsidetemperatureaswellaslowproductionofwindandsolarenergy.Thisweatherphenomenonisfrequentlyseen,e.g.inGermanyfrom16to26January2017,withupto90 %ofthegenerationcomingfromconventionalpowerplantsatpeakdemand.
Withhigherelectrificationoffinaldemandsectors,espe-ciallytheresidentialandtertiarysector,andhighpene-trationofrenewablesinthepowermarket,the“KalteDunkelflaute”becomesanewsecurityofsupplycaseforahybrid energy system.

46 // ENTSO-E // ENTSOG TYNDP 2022 Scenario Building Guidelines
Finaldemandvaluesarethesameasforthe2Weekde-mandasexplainedinabovesection,andfurtherexplainedinfollowingsections.GasdemandforpowergenerationiscalculatedfromtheresultsofENTSO-Emodellingprocess,as it is explained in chapter 3.
iii Data estimation methods for final gas demand
Short term demandShort-termdemandisthedatafortheyears2022and2025.Fortheseyearsonlyonescenarioisconsidered,BestEstimate,basedonthebest-knowledgeofENTSOG’smembers.
TheBestEstimatescenarioisabottom-upscenario.De-manddataissubmittedfromTSOsinaccordancewiththeNationalTrendsstoryline,parametersandprices,usingnationalexpertisetoprovidecountry-levelspecifics.Adatacollectionquestionnaireisprovided,whichcoversallbottom-upscenariosaswellasanygasdemandasaresultofnewlygasifiedareasenabledbyfutureprojectswhereapplicable,whichisclassifiedasgasificationdemand.
Wherenodatawasprovidedbyacountry,datafromBestEstimatefromTYNDP2020wasusedforTYNDP2022(RomaniaandSerbia),withthesamesharetosplitthehydrogen/methanedemandasEUaverage.
Year Scenario name Type Demand derived from
2022 Best Estimate (BE) Bottom-up TSO Data Collection
2025 Best Estimate (BE) Bottom-up TSO Data Collection
Table 22: ENTSOG short-term Scenario Types
Long term demandLong-termdemandisthedatafortheyearsbeyond2030.Fortheseyearsthreescenariosareconsidered:NationalTrends,GlobalAmbitionandDistributedEnergy.Whereas
NationalTrendsreliesonbottom-upcollecteddata,forDistributedEnergyandGlobalAmbition,ENTSOEandENTSOGcomputedthefinaldemandfigureswithtop-down methodologies.
Year Scenario name Type Demand derived from
2030–2040 National Trends (NT) Bottom-up TSO Data Collection
2030–2050 Global Ambition (GA) Top-down Ambition Tool
2030–2050 Distributed Energy (DE) Top-down Ambition Tool
Table 23: ENTSOG long-term scenario Types
Bottom-up dataDemanddataissubmittedfromTSOsinaccordancewiththeNationalTrendsstoryline,parametersandprices,usingnationalexpertisetoprovidecountry-levelspecifics.Adatacollectionquestionnaireisprovided,whichcoversallbottom-upscenariosaswellasanygasdemandasaresultofnewlygasifiedareasenabledbyfutureprojectswhereapplicable,whichisclassifiedasgasificationdemand.
Values are provided for all years up to 2040 for the yearly andaveragevolume,seasonalvariation,aswellashighdemandcasesforthepeakday(DesignCase),the2-weekhighdemandcaseandthe“Dunkelflaute”case.
Top-down dataAnnual demand data is calculated using the Ambition Tool.TheAmbitionToolcalculatescountry-leveldemand(methane,hydrogenandelectricity)basedonhistoricaldataandusingdifferentend-usertechnologysharesforeachcountry.EachcountryspecificinputwasobtainedusinganEU-27defaultapproachandthenreviewedbyTSOs,bothelectricandgas.
TheEU-27defaultapproachisasectorialapproachbasedon the storylines for Global Ambition and Distributed Energy,consideringfuelandtechnologyswitch,energyefficienciesanddecarbonization.
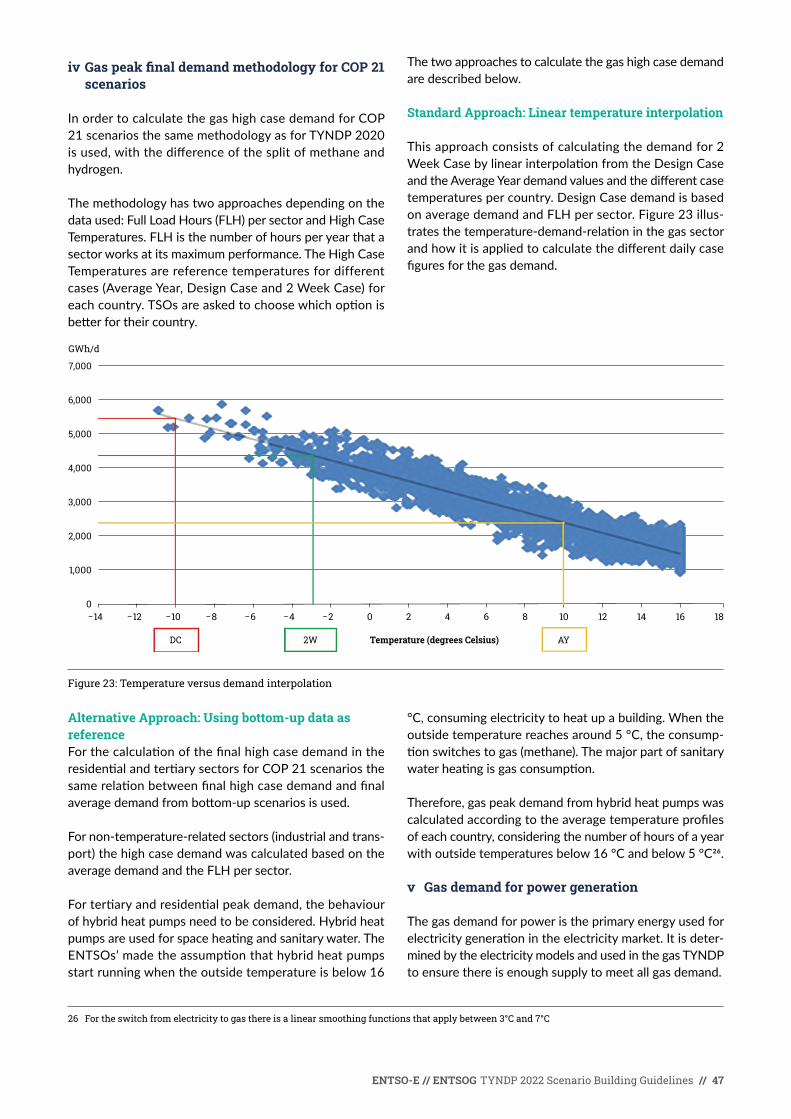
ENTSO-E // ENTSOG TYNDP 2022 Scenario Building Guidelines // 47
iv Gas peak final demand methodology for COP 21 scenarios
InordertocalculatethegashighcasedemandforCOP21 scenarios the same methodology as for TYNDP 2020 isused,withthedifferenceofthesplitofmethaneandhydrogen.
The methodology has two approaches depending on the dataused:FullLoadHours(FLH)persectorandHighCaseTemperatures.FLHisthenumberofhoursperyearthatasectorworksatitsmaximumperformance.TheHighCaseTemperatures are reference temperatures for different cases(AverageYear,DesignCaseand2WeekCase)foreachcountry.TSOsareaskedtochoosewhichoptionisbetterfortheircountry.
26 For the switch from electricity to gas there is a linear smoothing functions that apply between 3°C and 7°C
The two approaches to calculate the gas high case demand are described below.
Standard Approach: Linear temperature interpolation
This approach consists of calculating the demand for 2 WeekCasebylinearinterpolationfromtheDesignCaseandtheAverageYeardemandvaluesandthedifferentcasetemperatures per country. Design Case demand is based onaveragedemandandFLHpersector.Figure23illus-tratesthetemperature-demand-relationinthegassectorandhowitisappliedtocalculatethedifferentdailycasefiguresforthegasdemand.
Figure 23: Temperature versus demand interpolation
Alternative Approach: Using bottom-up data as referenceForthecalculationofthefinalhighcasedemandintheresidentialandtertiarysectorsforCOP21scenariosthesamerelationbetweenfinalhighcasedemandandfinalaveragedemandfrombottom-upscenariosisused.
Fornon-temperature-relatedsectors(industrialandtrans-port)thehighcasedemandwascalculatedbasedontheaveragedemandandtheFLHpersector.
Fortertiaryandresidentialpeakdemand,thebehaviourof hybrid heat pumps need to be considered. Hybrid heat pumpsareusedforspaceheatingandsanitarywater.TheENTSOs’madetheassumptionthathybridheatpumpsstart running when the outside temperature is below 16
°C,consumingelectricitytoheatupabuilding.Whentheoutsidetemperaturereachesaround5°C,theconsump-tionswitchestogas(methane).Themajorpartofsanitarywaterheatingisgasconsumption.
Therefore,gaspeakdemandfromhybridheatpumpswascalculatedaccordingtotheaveragetemperatureprofilesofeachcountry,consideringthenumberofhoursofayearwithoutsidetemperaturesbelow16°Candbelow5°C26.
v Gas demand for power generation
The gas demand for power is the primary energy used for electricitygenerationintheelectricitymarket.Itisdeter-mined by the electricity models and used in the gas TYNDP to ensure there is enough supply to meet all gas demand.
GWh/d
0
1,000
−14 −12 −10 −8 −6 −4 −2 0 2 4 6 8 10 12 14 16 18
2,000
3,000
4,000
5,000
6,000
7,000
Temperature (degrees Celsius)DC 2W AY
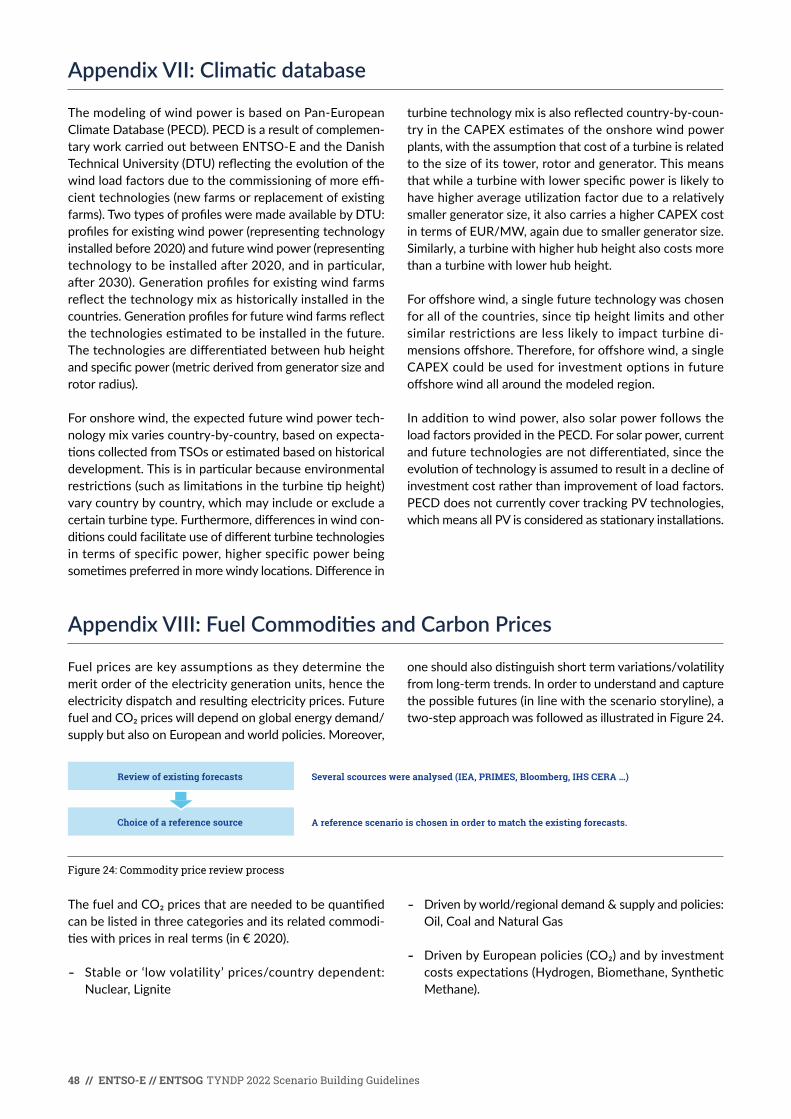
48 // ENTSO-E // ENTSOG TYNDP 2022 Scenario Building Guidelines
AppendixVII:Climaticdatabase
ThemodelingofwindpowerisbasedonPan-EuropeanClimateDatabase(PECD).PECDisaresultofcomplemen-taryworkcarriedoutbetweenENTSO-EandtheDanishTechnicalUniversity(DTU)reflectingtheevolutionofthewindloadfactorsduetothecommissioningofmoreeffi-cienttechnologies(newfarmsorreplacementofexistingfarms).TwotypesofprofilesweremadeavailablebyDTU:profilesforexistingwindpower(representingtechnologyinstalledbefore2020)andfuturewindpower(representingtechnologytobeinstalledafter2020,andinparticular,after2030).Generationprofilesforexistingwindfarmsreflectthetechnologymixashistoricallyinstalledinthecountries.Generationprofilesforfuturewindfarmsreflectthetechnologiesestimatedtobeinstalledinthefuture.Thetechnologiesaredifferentiatedbetweenhubheightandspecificpower(metricderivedfromgeneratorsizeandrotorradius).
Foronshorewind,theexpectedfuturewindpowertech-nologymixvariescountry-by-country,basedonexpecta-tionscollectedfromTSOsorestimatedbasedonhistoricaldevelopment.Thisisinparticularbecauseenvironmentalrestrictions(suchaslimitationsintheturbinetipheight)varycountrybycountry,whichmayincludeorexcludeacertainturbinetype.Furthermore,differencesinwindcon-ditionscouldfacilitateuseofdifferentturbinetechnologiesintermsofspecificpower,higherspecificpowerbeingsometimespreferredinmorewindylocations.Differencein
turbinetechnologymixisalsoreflectedcountry-by-coun-tryintheCAPEXestimatesoftheonshorewindpowerplants,withtheassumptionthatcostofaturbineisrelatedtothesizeofitstower,rotorandgenerator.Thismeansthatwhileaturbinewithlowerspecificpowerislikelytohavehigheraverageutilizationfactorduetoarelativelysmallergeneratorsize,italsocarriesahigherCAPEXcostintermsofEUR/MW,againduetosmallergeneratorsize.Similarly,aturbinewithhigherhubheightalsocostsmorethan a turbine with lower hub height.
Foroffshorewind,asinglefuturetechnologywaschosenforallofthecountries,sincetipheightlimitsandothersimilarrestrictionsarelesslikelytoimpactturbinedi-mensionsoffshore.Therefore,foroffshorewind,asingleCAPEXcouldbeusedforinvestmentoptionsinfutureoffshorewindallaroundthemodeledregion.
Inadditiontowindpower,alsosolarpowerfollowstheloadfactorsprovidedinthePECD.Forsolarpower,currentandfuturetechnologiesarenotdifferentiated,sincetheevolutionoftechnologyisassumedtoresultinadeclineofinvestment cost rather than improvement of load factors. PECDdoesnotcurrentlycovertrackingPVtechnologies,whichmeansallPVisconsideredasstationaryinstallations.
AppendixVIII:FuelCommoditiesandCarbonPrices
Fuelpricesarekeyassumptionsastheydeterminethemeritorderoftheelectricitygenerationunits,hencetheelectricitydispatchandresultingelectricityprices.FuturefuelandCO₂priceswilldependonglobalenergydemand/supplybutalsoonEuropeanandworldpolicies.Moreover,
oneshouldalsodistinguishshorttermvariations/volatilityfromlong-termtrends.Inordertounderstandandcapturethepossiblefutures(inlinewiththescenariostoryline),atwo-stepapproachwasfollowedasillustratedinFigure24.
Figure 24: Commodity price review process
ThefuelandCO₂pricesthatareneededtobequantifiedcan be listed in three categories and its related commodi-tieswithpricesinrealterms(in€2020).
- Stableor‘lowvolatility’prices/countrydependent:Nuclear,Lignite
- Drivenbyworld/regionaldemand&supplyandpolicies:Oil,CoalandNaturalGas
- DrivenbyEuropeanpolicies(CO₂)andbyinvestmentcostsexpectations(Hydrogen,Biomethane,SyntheticMethane).
Review of existing forecasts Several scources were analysed (IEA, PRIMES, Bloomberg, IHS CERA …)
A reference scenario is chosen in order to match the existing forecasts. Choice of a reference source

ENTSO-E // ENTSOG TYNDP 2022 Scenario Building Guidelines // 49
A Stable or ‘low volatility’ prices/country dependent: Nuclear and Lignite
Nuclear,givenitsmarketspecifics,andligniteprices,givenitslocalaspects,haveverylittlevariationsovertime.Giv-enthoseparticularities,thenuclearandlignitepricesareassumedtostaystableoverthetimehorizonsandacrossthescenarios.ThosewillbebasedontheTYNDP2018and2020pricesfornuclearandonanexternal,dedicatedstudy for Lignite costs and prices27. Lignite prices are also country dependent although it has been decided to pro-vide average prices per group of countries within the same range.Thesepricesareequalto:
- Nuclear:0.47€/GJ
- LigniteGroup1(Bulgaria,RepublicofNorthMacedoniaandCzechRepublic)::1.40€/GJ
- LigniteGroup2(SlovakRepublic,Germany,RepublicofSerbia,Poland,Montenegro,UnitedKingdom-NorthernIrelandmarketnode,IrelandandBosniaandHerzego-vina):1.80€/GJ
- LigniteGroup3(Slovenia,RomaniaandHungary): 2.37€/GJ
- LigniteGroup4(GreeceandTurkey):3.10€/GJ
B Prices driven by policies and world/ regional markets
Coal,oilandnaturalgasaremainlydrivenbyworld/re-gionalandfuturesupply/demanddynamics,hencetheirevolutionwilldependonmanyvariables.Theevolutionovertimewillalsobedifferent.Itisassumedthatthepriceofcoal,oilandnaturalgasarethesameacrossEurope.
Themarketforecastsconsideredandcomparedforcoal,oilandnaturalgasare:
- IEAWorldEnergyOutlookforcoal,crudeoilandnaturalgas,
- Forhardcoalonly:Coal(API2)CIFARA(ARGUS-McClo-skey)futureprices2022 – 2025,Newcastlebenchmarkthermalcoalpriceforecasts2021 – 2025
- Fornaturalgasonly:RystadEnergyResearchandAnal-ysis(reportingonrealpricesforecastforHenryHubprices,TitleTransferFacility-TTF-prices,NEAsiaSpotLNGprices)
27 Booz & Co, “Understanding Lignite Generation Costs in Europe, https://www.dei.gr/documents2/investors/meleth%20booz/understanding%20lignite%20generation%20costs%20in%20europe.pdf
28 Based on gross calorific value
Afterreviewofthesestudies,IEAWorldEnergyOutlook2020hasbeenchosenasthereferencesourceforthegas,coal and oil prices.
SincesignificantdifferencesbetweenmarketforecastandWEOSTEPSpricesfor2025arenotobserved,WEOSTEPS(StatedPoliciesScenario)pricesforhardcoal,nat-uralgasandcrudeoilpriceshavebeenconsideredfitfor2025BestEstimateandforNTScenariowhileWEOSD(SustainableDevelopmentScenario)forDEandGAScenar-ios. The choice of the reference scenarios from the WEO hasbeendrivenbythefollowingconsiderations:
- StatedPolicyScenarioisdesignedtogivefeedbacktodecisionmakersaboutthecoursethattheyareonto-day,basedonstatedpolicyambitions.Thisscenarioas-sumes that the pandemic is brought under control over thecourseof2021.Itincorporatesstatedpolicyambi-tions,includingtheenergycomponentsofannouncedstimulusorrecoverypackages(asofmid-2020)andtheNationallyDeterminedContributionsundertheParisAgreement. This scenario can be considered in line with NationalTrendscenario.
- IntheSustainableDevelopmentScenario,asurgeinclean energy policies and investment puts the energy systemontracktoachievesustainableenergyobjec-tivesinfull,includingtheParisAgreement,energyaccessandairqualitygoals.Theassumptionsonpublichealth and the economy are the same as in the STEPS. This scenario has been considered a good match with DistributedEnergyandGlobalAmbitionScenarios.
- Forthoseyearsandhorizonwhenanexplicitforecastisnot available the prices have been linearly interpolated assuming the same growth/decreasing trend observed in the previous decade.
Originally,WEOpriceswerepublishedinUSD2019/tonneforhardcoalandUSD2019/Mbtufornaturalgas28. AsTYNDPpricesshouldbeconvertedtoEUR/GJforhardcoalandnaturalgas,theparametersbelowwereused:
- USD/EURaverageratio2020–0.877
- 1 t–25.12GJ(ARA6,000kcal)
- 1 GJ–0.947817Mbtu
Light and heavy oil prices have been derived by applying respectivelya28 %and8 %priceincreasetothecrudeoilpricesusingthehistoricaverageratioundertheassump-tionthatevenifvalueschange,theratioremainsthesameasthereisnosignificantchangeintheconversionprocess.
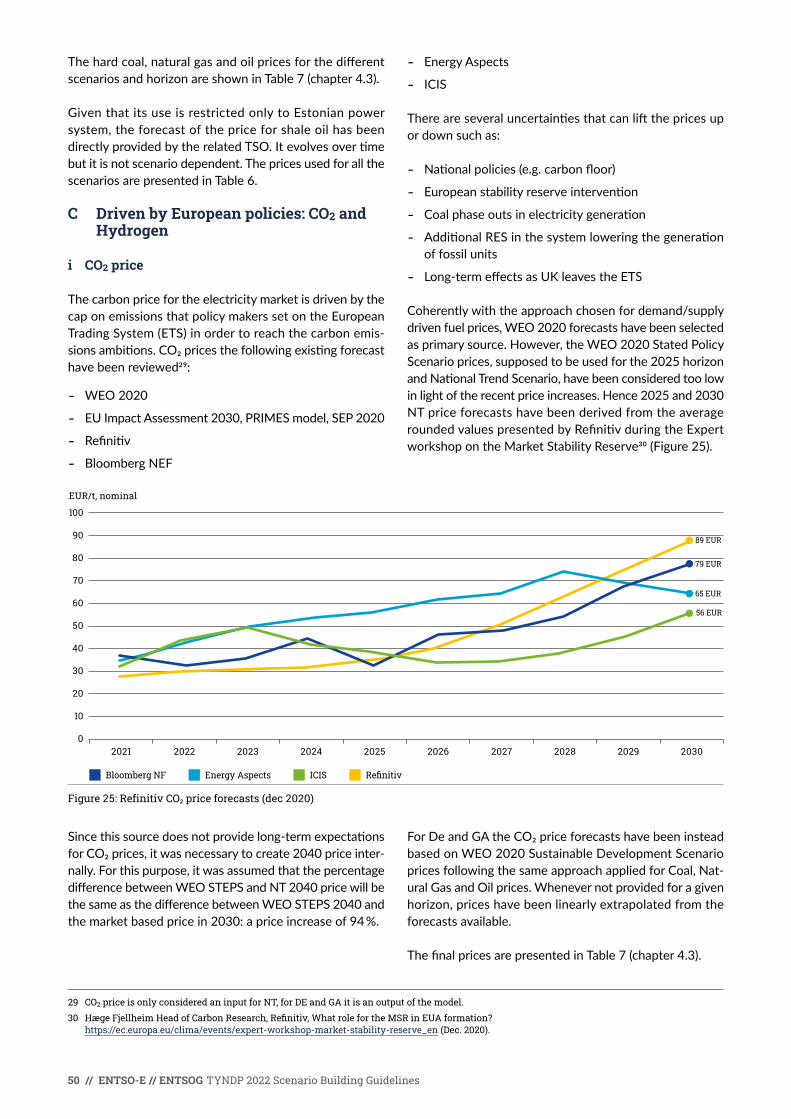
50 // ENTSO-E // ENTSOG TYNDP 2022 Scenario Building Guidelines
Thehardcoal,naturalgasandoilpricesforthedifferentscenariosandhorizonareshowninTable7(chapter4.3).
Given that its use is restricted only to Estonian power system,theforecastofthepriceforshaleoilhasbeendirectlyprovidedbytherelatedTSO.Itevolvesovertimebut it is not scenario dependent. The prices used for all the scenarios are presented in Table 6.
C Driven by European policies: CO2 and Hydrogen
i CO2 price
ThecarbonpricefortheelectricitymarketisdrivenbythecaponemissionsthatpolicymakerssetontheEuropeanTradingSystem(ETS)inordertoreachthecarbonemis-sionsambitions.CO₂pricesthefollowingexistingforecasthave been reviewed29:
- WEO 2020
- EUImpactAssessment2030,PRIMESmodel,SEP2020
- Refinitiv
- BloombergNEF
29 CO2 price is only considered an input for NT, for DE and GA it is an output of the model.
30 Hæge Fjellheim Head of Carbon Research, Refinitiv, What role for the MSR in EUA formation? https://ec.europa.eu/clima/events/expert-workshop-market-stability-reserve_en (Dec. 2020).
- Energy Aspects
- ICIS
Thereareseveraluncertaintiesthatcanliftthepricesupordownsuchas:
- Nationalpolicies(e.g.carbonfloor)
- Europeanstabilityreserveintervention
- Coalphaseoutsinelectricitygeneration
- AdditionalRESinthesystemloweringthegenerationof fossil units
- Long-termeffectsasUKleavestheETS
Coherently with the approach chosen for demand/supply drivenfuelprices,WEO2020forecastshavebeenselectedasprimarysource.However,theWEO2020StatedPolicyScenarioprices,supposedtobeusedforthe2025horizonandNationalTrendScenario,havebeenconsideredtoolowin light of the recent price increases. Hence 2025 and 2030 NT price forecasts have been derived from the average roundedvaluespresentedbyRefinitivduringtheExpertworkshopontheMarketStabilityReserve30(Figure25).
Figure 25: Refinitiv CO₂ price forecasts (dec 2020)
Sincethissourcedoesnotprovidelong-termexpectationsforCO₂prices,itwasnecessarytocreate2040priceinter-nally.Forthispurpose,itwasassumedthatthepercentagedifferencebetweenWEOSTEPSandNT2040pricewillbethesameasthedifferencebetweenWEOSTEPS2040andthemarketbasedpricein2030:apriceincreaseof94 %.
ForDeandGAtheCO₂priceforecastshavebeeninsteadbased on WEO 2020 Sustainable Development Scenario pricesfollowingthesameapproachappliedforCoal,Nat-ural Gas and Oil prices. Whenever not provided for a given horizon,priceshavebeenlinearlyextrapolatedfromtheforecasts available.
ThefinalpricesarepresentedinTable7(chapter4.3).
EUR/t, nominal
89 EUR
79 EUR
65 EUR
56 EUR
Bloomberg NF Energy Aspects ICIS Refinitiv
2021 2022 2023 2024 2025 2026 2027 2028 2029 20300
60
50
40
30
20
10
70
80
90
100

ENTSO-E // ENTSOG TYNDP 2022 Scenario Building Guidelines // 51
ii Hydrogen price
Hydrogenpricesareexpectedtoreflectboththerequiredcapital invested to produce hydrogen and the European policies toward a climate neutrality. TYNDP 2022 Scenar-ios consider only decarbonised and renewable hydrogen. ForNationalTrendsjustonepriceforhydrogenisusedforagivenyearDistributionEnergyandGlobalAmbitionScenariosconsiderdistinctpricesfordecarbonisedandimported renewable hydrogen.
Thosepricesarederivedbyusingthetechno-economicassumptions(e.g.,Interestrate,EfficiencyortheCAPEX($/kWH₂)fromEWI31,complementedbyapplyingtheCO₂price forecast expected to be used for TYNDP 2022 Sce-narios.Regardingtherenewablehydrogen,amark-upwasaddedtoreflectthenecessityto“structure”thefluctuatinghydrogenproductiontothebaselinedemand.ItisassumedthatH₂storageswillbeusedforthattask.ThesepricesareshowninTable7(chapter4.3).
It’simportanttohighlightthattherenewablehydrogenprices presented in this paragraph are valid only for hy-drogen imports. of the price of hydrogen from European electrolysis production are an output of the electricity modelling.
31 Estimating Long-Term Global Supply Costs for Low-Carbon Hydrogen, Institute of Energy Economics at the University of Cologne (EWI), Novem-ber 2020, https://www.ewi.uni-koeln.de/de/publikationen/estimating-long-term-global-supply-costs-for-low-carbon-hydrogen/
32 https://2020.entsos-tyndp-scenarios.eu/wp-content/uploads/2020/07/TYNDP_2020_Scenario_Building-Guidelines_05_Annex_4_Biomethane_Assumptions_final_report.xlsx.zip
33 https://gasforclimate2050.eu/?smd_process_download=1&download_id=282
34 https://gasforclimate2050.eu/?smd_process_download=1&download_id=339
iii Synthetic methane and Biomethane
Thebiomethanepricesarederivedfromthe“NavigantBiomethaneTool”thatisusedtocalculatethedomesticbiomethaneproductionpercounty.Thistoolisafurtherdevelopment of the methodology used by Navigant in the study by Gas for Climate and was already was used for TYNDP 202032. Compared the methodology used in TYNDP2020,theuseofsequentialcroppingwasreduces,basedonstakeholderfeedback.Furthermore,theshareofinjectioninthegridwasslightlyincreased.Moreinfor-mationonthebiomethaneassumptionscanbefoundinAppendixIX,sectionC.
Thestudyestimatespricesfor2025and2050.Fortheyears2030and2040,alinearinterpolationwasapplied.
Syntheticmethanepriceshavebeenassessedbyapplyingamark-upof€12/MWhofinvestmentcostsand€8/MWhofO&Mtotheestimatedhydrogenpricestoconsidertheadditionalcostsfortheprocess.(basedonGasforClimateStudy from 201933 and 202034).
AppendixIX:MethaneandHydrogenSupply
Thischapterdescribesthemainstorylinesassumptionsandmethodologiesregardingthegassupplymix,gassourcecompositionandgassupplypotentials.
ENTSOsscenariosdifferentiatebetweengastype,gassourceandimportsorindigenousproduction.
Gas types:Therearetwodifferentgastypes,whicharemethaneandhydrogen.Forallscenarios,NationalTrends,DistributedEnergyandGlobalAmbition,thequantificationofthetype-specificdemandisdescribedinappendixVI.B
Gas sources:Thedemandforthetwodifferentgastypescanbesuppliedbymultiplegassources,whichcanbenon-decarbonised,decarbonisedandrenewable.
Formethane,potentialsourcesare:
- Natural gas
- Naturalgaswithpost-combustiveCCS
- Biomethane produced from organic material
- Syntheticmethaneproducedviaelectrolysis.
Forhydrogen,potentialsourcesare:
- NaturalgaswithSMR(steammethanereforming)
- NaturalgaswithSMR+CCS
- Electrolysis
- By-productsfromindustrialprocesses
Importsandindigenous/nationalproduction:bothgastypes from each source can be either produced indige-nously or imported from outside Europe.

52 // ENTSO-E // ENTSOG TYNDP 2022 Scenario Building Guidelines
2030 DISTRIBUTED ENERGY 2030 GLOBAL AMBITION
2040 DISTRIBUTED ENERGY 2040 GLOBAL AMBITION
2050 DISTRIBUTED ENERGY 2050 GLOBAL AMBITION
217 217
86
North Africa
259
North Africa
217 217
189
259
North Africa
259
North Africa
217 312
317
403
79North Africa
Figure 26: Extra-EU supply potential for Hydrogen in Distributed Energy in 2030 [TWh]
Figure 28: Extra-EU supply potential for Hydrogen in Distributed Energy in 2040 [TWh]
Figure 30: Extra-EU supply potential for Hydrogen in Distributed Energy in 2050 [TWh]
Figure 27: Extra-EU supply potential for Hydrogen in global ambition in 2030 [TWh]
Figure 29: Extra-EU supply potential for Hydrogen in global ambition in 2040 [TWh]
Figure 31: Extra-EU supply potential for Hydrogen in global ambition in 2050 [TWh]

ENTSO-E // ENTSOG TYNDP 2022 Scenario Building Guidelines // 53
A Hydrogen Import Potentials
Itisassumedthattheimportedhydrogenisonlyusedfordirect hydrogen demand and not used to provide for the indirecthydrogendemand.Thisassumptionisbasedonthefactthatitiscost-efficienttousetheexistingimportinfrastructure for oil and methane to directly import hy-drogen-basedenergycarriersuchassyntheticfuelsandsynthetic methane instead of importing hydrogen first andconvertingitinasecondstepwithintheEUtooneoftheabove-mentionedsyntheticenergycarriers.TheExtraEUsupplypotentialforTYNDP22havebeenconsultedwithstakeholderson27May202135,wherefeedbackwasgenerallypositive.
Theimportpotentialsofhydrogenareassessedinadif-ferent way compared to the assessment of the import po-tentialofmethaneinordertoreflectthemaindifference:thematurityoftheimportinfrastructure.Methaneimportscanrelyonanexistingimportinfrastructure,allowingthemethanetoreachtheEUviadifferentimportrouteswithsufficientcapacity.Theinfrastructureforhydrogenimportsstillneedstobedeveloped.Weassumethatsuppliers,TSOsandthebuyer/marketforhydrogenareworkingtogether to establish hydrogen imports on a project basis. Theprojectsareassumedtouseretrofittedmethanepipe-linestoimporthydrogen,thusofferlessimportofenergyduetothedifferentenergycontentofmethaneandhydro-gen.Therefore,retrofittedhydrogenpipelines“limit”theimportpotentialsofhydrogenandsettheboundariesfortheimportpotentialsofhydrogeninashort-tomidtermtimehorizon.ThetotalimportpotentialforhydrogenislowerinDistributedEnergycomparedtoGlobalAmbition.
35 https://www.entsog.eu/entsog-and-entso-es-workshop-extra-eu-supply-potentials-tyndp-2022
Ingeneral,hydrogencanbeimportedtotheEUviaimportpipelinesormaritimeshipping.Fromacostperspective,hydrogen imports via ships are not expected to be com-petitiveintheshorttermduetothehighpricesforlique-faction,regasification,cooling,etc.,comparedtopipelineimports.Inthelongrun,hydrogenimportviashippingmight be based on other reasoning then pure cost perspec-tive,likediversifyingimportsources,butintheshort-tomedium term it is assumed that shipping will not develop. Thismightchangepost2040.Therefore,alltheimportofhydrogen in the TYNDP22 scenarios is assumed to be via pipeline from adjacent regions.
TheimportpipelinesentercertainEuropeancountries,and the imported hydrogen is then distributed throughout Europeviathehydrogeninfrastructure.Thefiguresbelow,showthehydrogenimportpotentialsusedintheTYNDP22scenariosinTWhperyear(basedonnetcalorificvalue).
ItisassumedthatforEuropeanactorstoimporthydrogen,thehydrogenmustbecostcompetitivetodomesticallyproducedhydrogen.Thiswouldalsomakesensefromtheexportingregions,thattheyseeknewmarkets,astheex-portofmethanedeclinesovertime.Therefore,thecostofimported hydrogen is set marginally lower than European produceddecarbonisedhydrogen.Thishastheeffectthatimportofhydrogen,willactasabaseloadimportatalmostfullcapacitywithfewhoursofbelow-capacityoperation.Thecostofimportedhydrogen,includingtransmissioncosts are provided in Table 24.
Global Ambition 2025 2030 2040 2050
Levelised cost of hydrogen (€/kg H₂) 2.25 2.05 1.93 1.50
Table 24: Prices for hydogen imports
The import demand in terms of energy volumes is then thedifferenceofthetotalgasdemandandallindigenouslyproduced gases.
B Methane Import Supply Potentials
Theextra-EUsupplysources-thatissourcesofEUener-gyimports-todayincludeRussia,Norway,Algeria,Libya,AzerbaijanandtheLNGmarket.AzerbaijanhasstartedsupplyingtheEUbypipelineattheendof2020.TheLNGmarketissplitintobasinstoreflectdifferenceinsupplypotentials:MiddleEast,NorthAfrica,Russia,NorthAmer-ica and Others.
i Methodology
Theextra-EUsupplypotentialsareassessedasarangebetween the minimum and the maximum potential for eachsource.Thesesupplyspecificrangesareboundaryconditionsinthegasbalancesimulations,therebyalwaysrespectedintheresultingsupplymix.Theyareintroducedtoavoidunrealisticsupplymixsituations.Thesimulationwillfindtheoptimalsupplymixwithinthegivensupplyrangeforthegivenmarketassumptions.Supplymixresultsaretherebydeterminedbyacombinationofthesupplypotentials,networkconstraintsandmarketassumptions.Thisassessmentisnotpartofthejointscenariosscope,but will be made in the ENTSOG TYNDP.
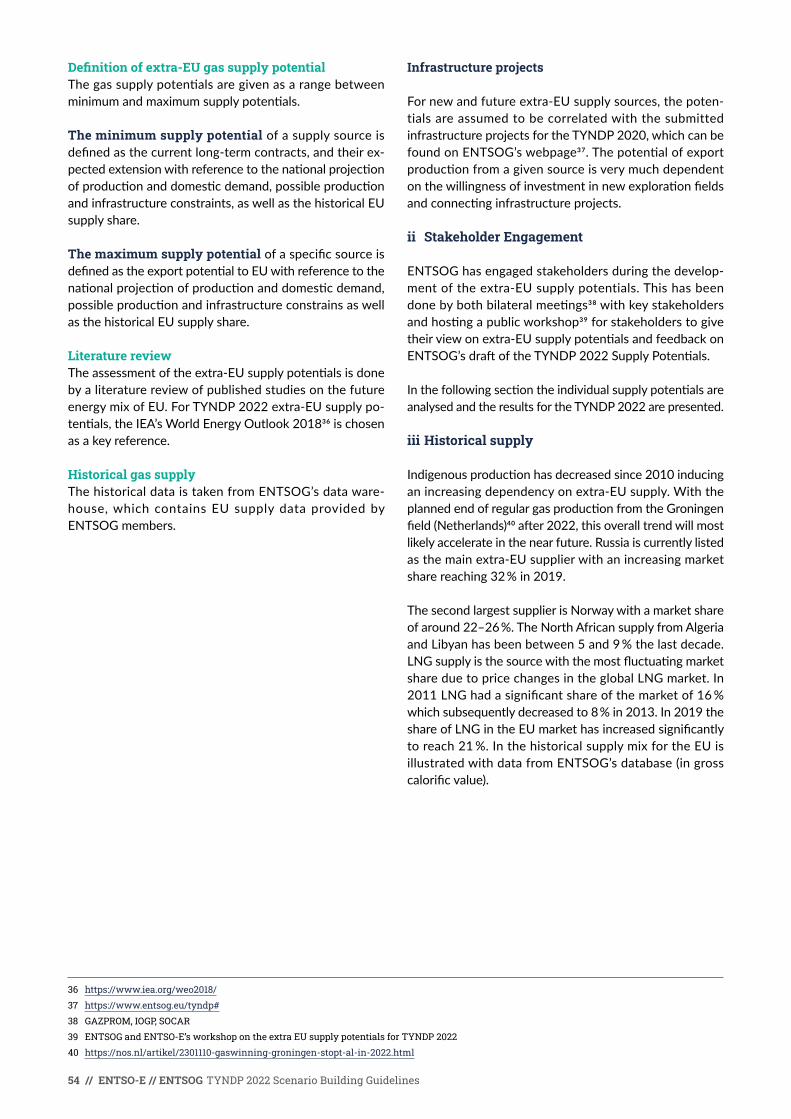
54 // ENTSO-E // ENTSOG TYNDP 2022 Scenario Building Guidelines
Definition of extra-EU gas supply potentialThegassupplypotentialsaregivenasarangebetweenminimumandmaximumsupplypotentials.
The minimum supply potential of a supply source is definedasthecurrentlong-termcontracts,andtheirex-pectedextensionwithreferencetothenationalprojectionofproductionanddomesticdemand,possibleproductionandinfrastructureconstraints,aswellasthehistoricalEUsupply share.
The maximum supply potentialofaspecificsourceisdefinedastheexportpotentialtoEUwithreferencetothenationalprojectionofproductionanddomesticdemand,possibleproductionandinfrastructureconstrainsaswellasthehistoricalEUsupplyshare.
Literature reviewTheassessmentoftheextra-EUsupplypotentialsisdoneby a literature review of published studies on the future energymixofEU.ForTYNDP2022extra-EUsupplypo-tentials,theIEA’sWorldEnergyOutlook201836 is chosen asakeyreference.
Historical gas supplyThehistoricaldataistakenfromENTSOG’sdataware-house,whichcontainsEUsupplydataprovidedby ENTSOG members.
36 https://www.iea.org/weo2018/
37 https://www.entsog.eu/tyndp#
38 GAZPROM, IOGP, SOCAR
39 ENTSOG and ENTSO-E’s workshop on the extra EU supply potentials for TYNDP 2022
40 https://nos.nl/artikel/2301110-gaswinning-groningen-stopt-al-in-2022.html
Infrastructure projects
Fornewandfutureextra-EUsupplysources,thepoten-tials are assumed to be correlated with the submitted infrastructureprojectsfortheTYNDP2020,whichcanbefoundonENTSOG’swebpage37.Thepotentialofexportproductionfromagivensourceisverymuchdependentonthewillingnessofinvestmentinnewexplorationfieldsandconnectinginfrastructureprojects.
ii Stakeholder Engagement
ENTSOGhasengagedstakeholdersduringthedevelop-mentoftheextra-EUsupplypotentials.Thishasbeendonebybothbilateralmeetings38withkeystakeholdersandhostingapublicworkshop39forstakeholderstogivetheirviewonextra-EUsupplypotentialsandfeedbackonENTSOG’sdraftoftheTYNDP2022SupplyPotentials.
Inthefollowingsectiontheindividualsupplypotentialsareanalysed and the results for the TYNDP 2022 are presented.
iii Historical supply
Indigenousproductionhasdecreasedsince2010inducinganincreasingdependencyonextra-EUsupply.WiththeplannedendofregulargasproductionfromtheGroningenfield(Netherlands)40after2022,thisoveralltrendwillmostlikelyaccelerateinthenearfuture.Russiaiscurrentlylistedasthemainextra-EUsupplierwithanincreasingmarketsharereaching32 %in2019.
ThesecondlargestsupplierisNorwaywithamarketshareofaround22–26 %.TheNorthAfricansupplyfromAlgeriaandLibyanhasbeenbetween5and9 %thelastdecade.LNGsupplyisthesourcewiththemostfluctuatingmarketshareduetopricechangesintheglobalLNGmarket.In2011LNGhadasignificantshareofthemarketof16 %whichsubsequentlydecreasedto8 %in2013.In2019theshareofLNGintheEUmarkethasincreasedsignificantlytoreach21 %.InthehistoricalsupplymixfortheEUisillustratedwithdatafromENTSOG’sdatabase(ingrosscalorificvalue).
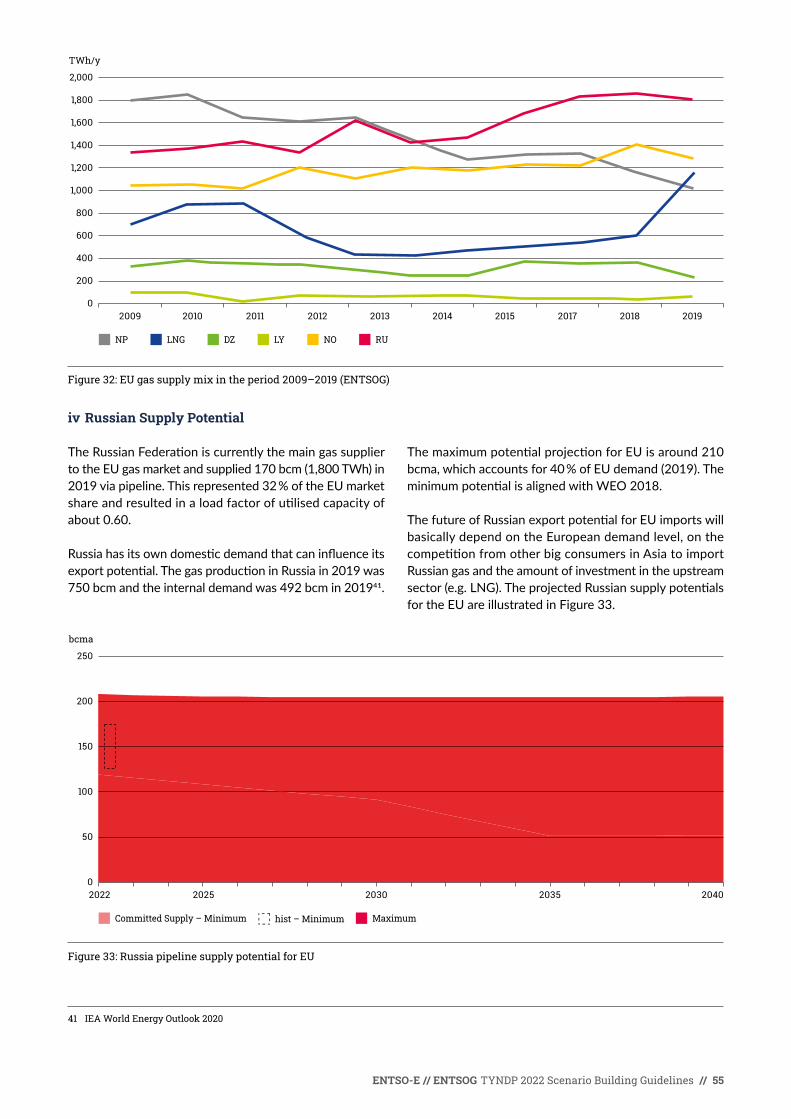
ENTSO-E // ENTSOG TYNDP 2022 Scenario Building Guidelines // 55
41 IEA World Energy Outlook 2020
Figure 32: EU gas supply mix in the period 2009–2019 (ENTSOG)
iv Russian Supply Potential
TheRussianFederationiscurrentlythemaingassuppliertotheEUgasmarketandsupplied170bcm(1,800TWh)in2019viapipeline.Thisrepresented32 %oftheEUmarketshareandresultedinaloadfactorofutilisedcapacityofabout 0.60.
Russiahasitsowndomesticdemandthatcaninfluenceitsexportpotential.ThegasproductioninRussiain2019was750bcmandtheinternaldemandwas492bcmin201941.
ThemaximumpotentialprojectionforEUisaround210bcma,whichaccountsfor40 %ofEUdemand(2019).TheminimumpotentialisalignedwithWEO2018.
ThefutureofRussianexportpotentialforEUimportswillbasicallydependontheEuropeandemandlevel,onthecompetitionfromotherbigconsumersinAsiatoimportRussiangasandtheamountofinvestmentintheupstreamsector(e.g.LNG).TheprojectedRussiansupplypotentialsfortheEUareillustratedinFigure33.
Figure 33: Russia pipeline supply potential for EU
TWh/y
NP LNG DZ LY NO RU
2009 2010 2011 2012 2013 2014 2015 2017 2018 20190
1,200
1,000
800
600
400
200
1,400
1,600
1,800
2,000
bcma
Committed Supply – Minimum Maximumhist – Minimum
2022 2025 2030 2035 20400
100
50
150
200
250
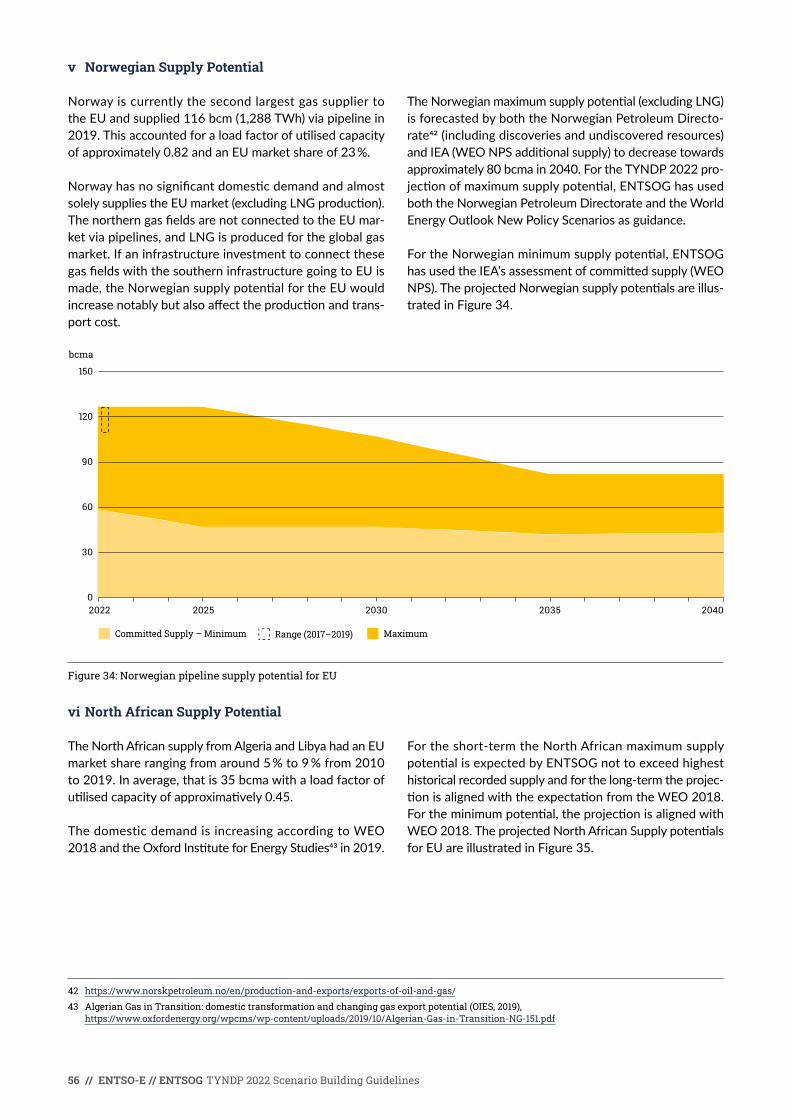
56 // ENTSO-E // ENTSOG TYNDP 2022 Scenario Building Guidelines
v Norwegian Supply Potential
42 https://www.norskpetroleum.no/en/production-and-exports/exports-of-oil-and-gas/
43 Algerian Gas in Transition: domestic transformation and changing gas export potential (OIES, 2019), https://www.oxfordenergy.org/wpcms/wp-content/uploads/2019/10/Algerian-Gas-in-Transition-NG-151.pdf
Norway is currently the second largest gas supplier to theEUandsupplied116bcm(1,288TWh)viapipelinein2019.Thisaccountedforaloadfactorofutilisedcapacityofapproximately0.82andanEUmarketshareof23 %.
NorwayhasnosignificantdomesticdemandandalmostsolelysuppliestheEUmarket(excludingLNGproduction).ThenortherngasfieldsarenotconnectedtotheEUmar-ketviapipelines,andLNGisproducedfortheglobalgasmarket.IfaninfrastructureinvestmenttoconnectthesegasfieldswiththesoutherninfrastructuregoingtoEUismade,theNorwegiansupplypotentialfortheEUwouldincreasenotablybutalsoaffecttheproductionandtrans-port cost.
TheNorwegianmaximumsupplypotential(excludingLNG)is forecasted by both the Norwegian Petroleum Directo-rate42(includingdiscoveriesandundiscoveredresources)andIEA(WEONPSadditionalsupply)todecreasetowardsapproximately80bcmain2040.FortheTYNDP2022pro-jectionofmaximumsupplypotential,ENTSOGhasusedboth the Norwegian Petroleum Directorate and the World EnergyOutlookNewPolicyScenariosasguidance.
FortheNorwegianminimumsupplypotential,ENTSOGhasusedtheIEA’sassessmentofcommittedsupply(WEONPS).TheprojectedNorwegiansupplypotentialsareillus-tratedinFigure34.
Figure 34: Norwegian pipeline supply potential for EU
vi North African Supply Potential
TheNorthAfricansupplyfromAlgeriaandLibyahadanEUmarketsharerangingfromaround5 %to9 %from2010to2019.Inaverage,thatis35bcmawithaloadfactorofutilisedcapacityofapproximatively0.45.
The domestic demand is increasing according to WEO 2018andtheOxfordInstituteforEnergyStudies43 in 2019.
Fortheshort-termtheNorthAfricanmaximumsupplypotentialisexpectedbyENTSOGnottoexceedhighesthistoricalrecordedsupplyandforthelong-termtheprojec-tionisalignedwiththeexpectationfromtheWEO2018.Fortheminimumpotential,theprojectionisalignedwithWEO2018.TheprojectedNorthAfricanSupplypotentialsforEUareillustratedinFigure35.
bcma
Committed Supply – Minimum MaximumRange (2017–2019)
0
60
30
90
120
150
2022 2025 2030 2035 2040

ENTSO-E // ENTSOG TYNDP 2022 Scenario Building Guidelines // 57
Figure 35: North Africa pipeline supply potential for EU
vii Caspian and Turkish Supply Potential
44 Gas Supply Changes in Turkey (OIES, 2018), https://www.oxfordenergy.org/wpcms/wp-content/uploads/2018/01/Gas-Supply-Changes-in-Turkey-Insight-24.pdf. Turkeys gas demand decline reasons and consequences (OIES, 2017), https://www.oxfordenergy.org/wpcms/wp-content/uploads/2017/04/Turkeys-gas-demand-decline-reasons-and-consequences-OIES-Energy-Insight.pdf
The Caspian supply potential consist of gas production fromAzerbaijanandTurkmenistan,wheretheTurkishsupplypotentialisgasredirectedtoEUfromadiversityofsupply sources. This can in principle be all the gas sources supplyingtheTurkishgasmarket(includedLNG).TheCas-pianregionisanewsupplysourcetoEUandisverymuchdependent on the current infrastructure projects.
ThepotentialexportsofgasfromAzerbaijantoEUarecloselylinkedtothedevelopmentoftheShahDenizfieldbutotherfieldscanpotentiallyberelevantforexportinthefuture.TheShahDenizfieldhasproduced17bcmin2019and18bcmin2020.OftheShahDenizproduction,6bcmaarecontractedtoTurkeyand10bcmatotheEUmarketviatherouteknownastheSouthernGasCorridor.
The Southern Gas Corridor consist of the Trans Anatolian Pipeline(TANAP)andTransAdriaticPipeline(TAP)projects,incombinationwiththeextensionoftheSouthCaucasusPipeline(SCPX).TheTransAdriaticPipeline(TAP)starteddeliveringAzerbaijanigastoItalyonDecember30th2020.
ThepotentialforAzerbaijanexportgasiscorrelatedwithinfrastructure projects and with the possible expansion of theSouthernGasCorridor(e.g.SCPFX,2025),theexportpotentialfromAzerbaijanareprojectedtoincludeaddi-tional5bcmafromeitherthecurrentexportingfieldsortheremainingAzerbaijanifields.
ThepotentialexportsofgasfromTurkmenistantoEUintheTYNDP2022arelinkedtotheTrans-Caspianpipeline(TCP)projectwithacapacityof30bcmacrossingtheCaspianSeatoAzerbaijanwithobjectivetotransportTurk-menistangastotheEU.Thisprojectwillfurtherneedanexpansion of the Southern Gas Corridor to reach Europe.
Turkeyimportsgasfromavarietyofsupplysourcesi.e.Russia,Iran,AzerbaijanandtheglobalLNGmarket(withgasfromRussiaasthemainsupplier).AsEU,Turkeyislookingtodiversifyitssupplyportfolio,andwiththatob-jective,BOTASarelookingtoexpanditsinfrastructure44. Furthermore,BOTAShasavisionofcreatingaSouthernGasHubfortheSouthEastEuropeangasmarket,whichpotentiallythencansupplyEUwithgasinthefuture.
TheTurkishmaximumsupplypotentialisassumedtobearound7bcmain2030,whichcanberedirectedgasfromAzerbaijan,RussiaorLNG.TheprojectionoftheCaspianandTurkishsupplypotentialsfortheEUareillustratedinfigures36and37onthefollowingpage.
bcma
Algeria – Minimum Libya – Minimum Algeria – Maximum Libya – MaximumRange (2017–2019)
0
30
20
10
40
50
60
2022 2025 2030 2035 2040

58 // ENTSO-E // ENTSOG TYNDP 2022 Scenario Building Guidelines
Figure 36: Caspian supply potential for EU
Figure 37: Turkish supply potential for EU
viii LNG Supply Potential
ThemarketshareofLNGsupplyhasincreasedsignificantlyfromaround10 %from2015to2018toaround21 %in2019.In2019thecorrespondingloadfactorofutilisedcapacityis0,74.
LNG is expected to play an increasingly important role in Europe. This is partly expected because of the decreasing indigenousEUproductionandtheincreaseinliqueficationcapacity in the world.
FortheTYNDP2022,theprojectionofthesupplytoEUisbasedonIEA’sWEO.ThisisaspecificprojectionofthesupplypotentialforEU(WEO2018).
Theprojectionofthemaximumpotentialisapproximatelyconstantafter2025andaccountsfor32 %ofEUdemand(2019).TheprojectionfortheLNGsupplypotentialforEUisillustratedinFigure38.Thelong-termLNGcontractsrelatedtotheminimumpotentialsareprojectedtoslowlystart expiring from 2030 onwards to 2040.
bcma
Azerbeijan – Minimum Azerbeijan – Maximum Turkmenistan – Maximum
0
30
20
10
40
50
60
2022 2025 2030 2035 2040
bcma
Turkish Hub – Minimum Turkish Hub – Maximum
0
3
2
1
4
5
10
9
8
7
6
2022 2025 2030 2035 2040

ENTSO-E // ENTSOG TYNDP 2022 Scenario Building Guidelines // 59
Figure 38: LNG supply potential for EU
45 For France the values for Distributed Energy and Global Ambition are identical.
C Biomethane – Input assumptions and methodology
Thissectiondescribestheinputassumptionsandmeth-odologyusedtodeveloptheestimationsforbiomethanepotentials in2050inENTSOG’sbiomethanetool.AS-curveapproachhasbeenappliedtocomputevaluesfor2030and2040.For2030,itisassumedthat40 %ofthe2050potentialswillbeproduced.For2045itisassumedthat90 %ofthepotentialsfor2050willbeproduced.Thevalues for Distributed Energy are calculated based on the assumptionsexplainedbelow.Accordingtothestorylines,GlobalAmbitionwillrelylessondomesticproduction,thereforeweassumethatthebiomethaneproductioninGlobalAmbitioniswithinarangeof75 %45 compared to Distributed Energy.
i Global Inputs and Scenario Inputs
GlobalInputscontainsallgeneralinputsusedthroughoutthetoolimpactingthecalculationsofallfeedstocktypes.Differentinputsarespecified:
- the country list
- thefeedstockcategoriesandfeedstocktypes
- naturalgaslowheatingvalue
- biomethanelowcalorificvalue
- biogasandbiomethaneyieldsperfeedstocktype
- average shares of biomethane and carbon dioxide in biogasfromanaerobicdigestion
- average share of carbon dioxide in biomethane from thermalgasification
ScenarioInputsgathersallinputsspecifictoeachfeed-stocktypeincludedinthetool.InScenarioInputs,anoverviewoftheinputassumptionsspecifictoeachfeed-stocktypeisgiven.Thecommonparametersforalmostallfeedstocktypesare:
- moisturecontent(%)
- allocationshareof[feedstocktype]tobiomethaneuse(%)
- yieldincreaseto2050(%)
ii Original Feedstock Raw Data
OriginalFeedstockRawDatacontainstherawdataperfeedstocktypethatareusedasabasistocalculatethefeedstockpotentialsin2050.FeedstockpotentialsarecalculatedinktonnesofDryMaterial(DM)and1000hec-tares,perfeedstocktypeintherespectivedatayear.Datayearsvaryperfeedstocktypeasfollows:
- 2010–Manure
- 2015–Branches&tops
- 2016–Wastewood,Thinnings
- 2017–Sequentialcropping,MSW
- 2030–Agriculturalresidues,Foodwaste,Sewagesludge,Landscapecarewoodandroadsidevergegrass
bcma
Middle East – Minimum North Africa – Minimum Russia – Minimum North America – Minimum Other – Minimum
Middle East – Maximum North Africa – Maximum Russia – Maximum North America – Maximum Other – Maximum
Range (2017–2019) Minimum – committed Maximum – committed
0
90
60
30
120
150
180
2022 2025 2030 2035 2040

60 // ENTSO-E // ENTSOG TYNDP 2022 Scenario Building Guidelines
Inthefollowingsubsections,amoredetailedstepbystepexplanationisgivenonthemethodologyusedperfeed-stocktypetocalculatethefeedstockpotentialsthatwillleadtotheestimatedbiomethanepotentialsperMemberState by 2050.
iii Sequential cropping
Thesequentialcroppingconceptisbasedoncultivatingasecondcrop(orwintercrop)toproducebiomethaneinadditiontotheproductionofthemaincrop.Noagricul-tural crops that are produced as the main crop would be
usedforbiomethaneproduction.SequentialcroppingisestimatedtorepresentasignificantshareofthefeedstockpotentialintheEUby2050.ToestimatethispotentialrawdatafromEurostathasbeenusedtoextracttheUtilisedAgriculturalArea(UAA)perMemberStatein2017.
Ashareofthisutilisedagriculturallandisassumedtohavethepotentialtobeusedforsequentialcropping.Byde-fault,thesamesharehasbeenassumedforeachMemberState.However,thiscanvarysignificantlypercountryanditisattheuser’sdiscretiontodefinethemostappropriateshare for a given country.
Land for sequential cropping in 2017 (1000 ha) = UAA per MS (1000 ha) × Share of UAA for sequential cropping (%)
Cropyieldestimationsforsequentialcrops(wintercrops)are calculated as a share of the average summer silage crop yields. The share of summer silage crop yield that would reflecttheaveragesequentialcropyielddiffersperregioninEurope.ClimatologicalconditionsinsouthernEurope-an countries are more favourable compared to Northern
countrieswheretheaverageyieldforsequentialcropsisassumedtobezero.Table25showsthethreeregionsdefined,i.e.North,CentreandSouth,thatcapturethedif-ferentclimatologicalconditionsinEuropeimpactingtheintroductionofsequentialcropping.
Sequential crop yield in 2050 ((tonne DM)/ha) = Average summer silage crop yield in 2050 ((tonne DM)/ha) × Sequential crop yield (% of average summer silage crop yield) Member State region
Member State region Member States
North Denmark, Estonia, Finland, Latvia, Lithuania, Sweden
CentreAustria, Belgium, Bulgaria, Croatia, Czech Republic, Germany, Hungary, Ireland, Luxembourg, Malta, Netherlands, Poland, Portugal, Romania, Slovakia, Slovenia, UK
South Cyprus, France, Greece, Italy, Spain
Table 25: Regions in Europe with varying climatological conditions impacting the introduction of sequential cropping
Nexttothat,theaveragesummersilagecropyieldin2050is calculated by applying a yield increase to the average summersilagecropyieldassumedin2017.SubjecttotheMemberStateinquestionandtheregionitfallsunder,
differentaveragesummersilagecropyieldshavebeenesti-mated,beinghigherinSoutherncountriesthaninNorthernonesduetomorefavourableclimatologicalconditions.
Average summer silage crop yield in 2050 ((tonne DM)/ha) = Average summer silage crop yield in 2017 ((tonne DM)/ha) × (1 + Yield increase to 2050 (%))
Finally,theactualsequentialcropharvestedin2050iscalculatedtakingintoaccountthesequentialcropyieldcalculatedfor2050andtheavailablelandforsequential
croppingin2017,whichisassumedtoremainapproxi-mately the same in 2050.
Harvested sequential crop in 2050 (ktonnes DM) = Land for sequential cropping in 2017 (1000 ha) × Sequential crop yield in 2050 ((tonne DM)/ha)
Table27givesanoverviewoftheinputassumptionsconsideredforallintermediatecalculationstepstoderivethefeedstockpotentialfromsequentialcropsin2050.
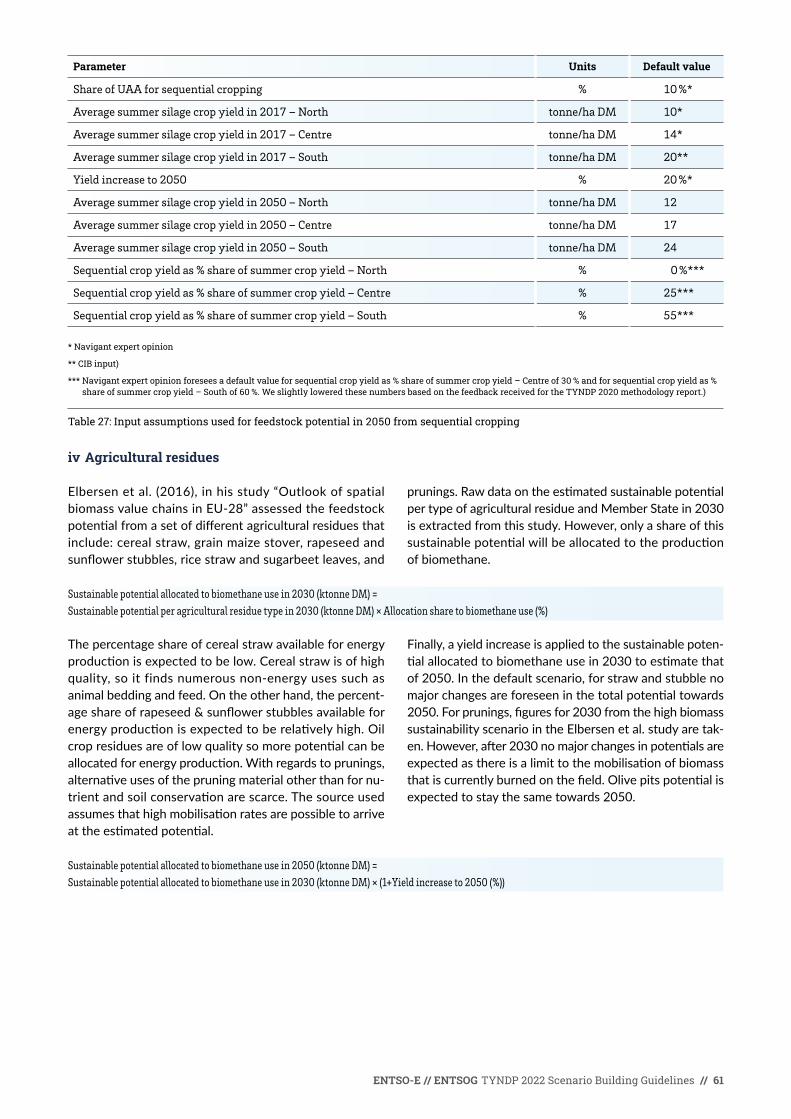
ENTSO-E // ENTSOG TYNDP 2022 Scenario Building Guidelines // 61
Parameter Units Default value
Share of UAA for sequential cropping % 10 %*
Average summer silage crop yield in 2017 – North tonne/ha DM 10*
Average summer silage crop yield in 2017 – Centre tonne/ha DM 14*
Average summer silage crop yield in 2017 – South tonne/ha DM 20**
Yield increase to 2050 % 20 %*
Average summer silage crop yield in 2050 – North tonne/ha DM 12
Average summer silage crop yield in 2050 – Centre tonne/ha DM 17
Average summer silage crop yield in 2050 – South tonne/ha DM 24
Sequential crop yield as % share of summer crop yield – North % 0 %***
Sequential crop yield as % share of summer crop yield – Centre % 25***
Sequential crop yield as % share of summer crop yield – South % 55***
* Navigant expert opinion
** CIB input)
*** Navigant expert opinion foresees a default value for sequential crop yield as % share of summer crop yield – Centre of 30 % and for sequential crop yield as % share of summer crop yield – South of 60 %. We slightly lowered these numbers based on the feedback received for the TYNDP 2020 methodology report.)
Table 27: Input assumptions used for feedstock potential in 2050 from sequential cropping
iv Agricultural residues
Elbersenetal.(2016),inhisstudy“OutlookofspatialbiomassvaluechainsinEU-28”assessedthefeedstockpotentialfromasetofdifferentagriculturalresiduesthatinclude:cerealstraw,grainmaizestover,rapeseedandsunflowerstubbles,ricestrawandsugarbeetleaves,and
prunings.RawdataontheestimatedsustainablepotentialpertypeofagriculturalresidueandMemberStatein2030isextractedfromthisstudy.However,onlyashareofthissustainablepotentialwillbeallocatedtotheproductionof biomethane.
Sustainable potential allocated to biomethane use in 2030 (ktonne DM) = Sustainable potential per agricultural residue type in 2030 (ktonne DM) × Allocation share to biomethane use (%)
The percentage share of cereal straw available for energy productionisexpectedtobelow.Cerealstrawisofhighquality,soitfindsnumerousnon-energyusessuchasanimalbeddingandfeed.Ontheotherhand,thepercent-ageshareofrapeseed&sunflowerstubblesavailableforenergyproductionisexpectedtoberelativelyhigh.Oilcropresiduesareoflowqualitysomorepotentialcanbeallocatedforenergyproduction.Withregardstoprunings,alternativeusesofthepruningmaterialotherthanfornu-trientandsoilconservationarescarce.Thesourceusedassumesthathighmobilisationratesarepossibletoarriveattheestimatedpotential.
Finally,ayieldincreaseisappliedtothesustainablepoten-tialallocatedtobiomethaneusein2030toestimatethatof2050.Inthedefaultscenario,forstrawandstubblenomajorchangesareforeseeninthetotalpotentialtowards2050.Forprunings,figuresfor2030fromthehighbiomasssustainabilityscenariointheElbersenetal.studyaretak-en.However,after2030nomajorchangesinpotentialsareexpectedasthereisalimittothemobilisationofbiomassthatiscurrentlyburnedonthefield.Olivepitspotentialisexpected to stay the same towards 2050.
Sustainable potential allocated to biomethane use in 2050 (ktonne DM) = Sustainable potential allocated to biomethane use in 2030 (ktonne DM) × (1+Yield increase to 2050 (%))
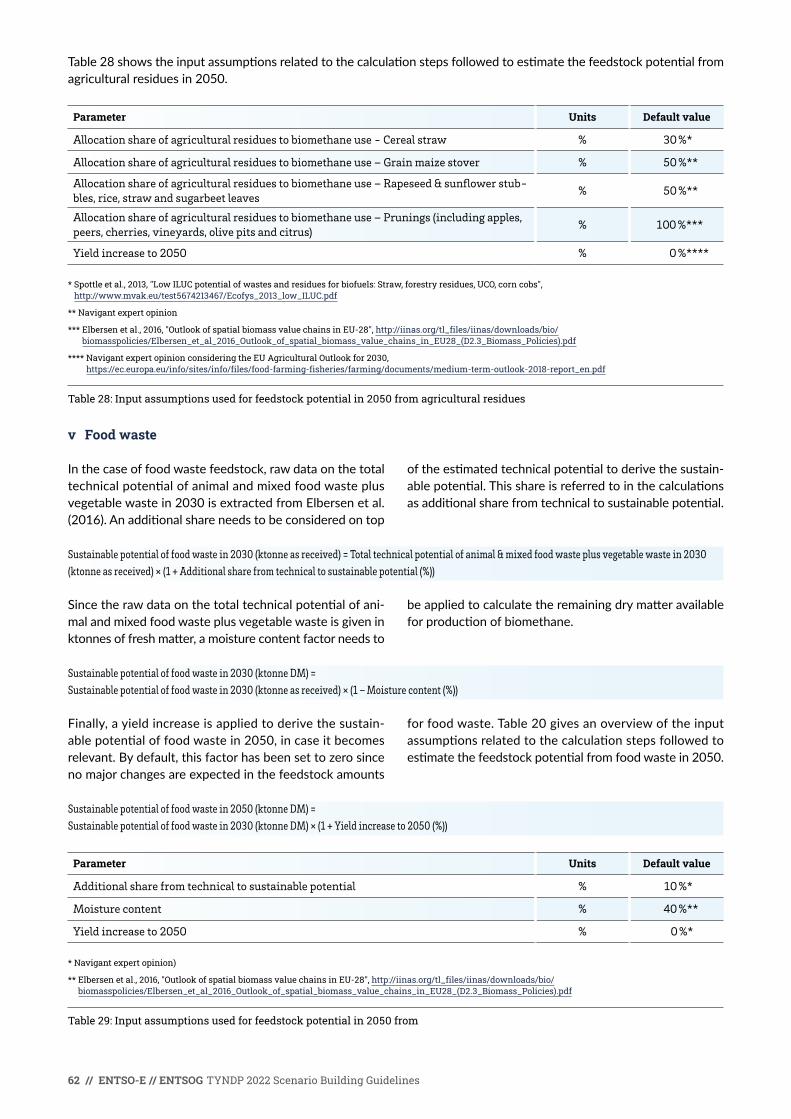
62 // ENTSO-E // ENTSOG TYNDP 2022 Scenario Building Guidelines
Table28showstheinputassumptionsrelatedtothecalculationstepsfollowedtoestimatethefeedstockpotentialfromagricultural residues in 2050.
Parameter Units Default value
Allocation share of agricultural residues to biomethane use - Cereal straw % 30 %*
Allocation share of agricultural residues to biomethane use – Grain maize stover % 50 %**
Allocation share of agricultural residues to biomethane use – Rapeseed & sunflower stub-bles, rice, straw and sugarbeet leaves
% 50 %**
Allocation share of agricultural residues to biomethane use – Prunings (including apples, peers, cherries, vineyards, olive pits and citrus)
% 100 %***
Yield increase to 2050 % 0 %****
* Spottle et al., 2013, "Low ILUC potential of wastes and residues for biofuels: Straw, forestry residues, UCO, corn cobs", http://www.mvak.eu/test5674213467/Ecofys_2013_low_ILUC.pdf
** Navigant expert opinion
*** Elbersen et al., 2016, "Outlook of spatial biomass value chains in EU-28", http://iinas.org/tl_files/iinas/downloads/bio/ biomasspolicies/Elbersen_et_al_2016_Outlook_of_spatial_biomass_value_chains_in_EU28_(D2.3_Biomass_Policies).pdf
**** Navigant expert opinion considering the EU Agricultural Outlook for 2030, https://ec.europa.eu/info/sites/info/files/food-farming-fisheries/farming/documents/medium-term-outlook-2018-report_en.pdf
Table 28: Input assumptions used for feedstock potential in 2050 from agricultural residues
v Food waste
Inthecaseoffoodwastefeedstock,rawdataonthetotaltechnicalpotentialofanimalandmixedfoodwasteplusvegetable waste in 2030 is extracted from Elbersen et al. (2016).Anadditionalshareneedstobeconsideredontop
oftheestimatedtechnicalpotentialtoderivethesustain-ablepotential.Thisshareisreferredtointhecalculationsasadditionalsharefromtechnicaltosustainablepotential.
Sustainable potential of food waste in 2030 (ktonne as received) = Total technical potential of animal & mixed food waste plus vegetable waste in 2030 (ktonne as received) × (1 + Additional share from technical to sustainable potential (%))
Sincetherawdataonthetotaltechnicalpotentialofani-mal and mixed food waste plus vegetable waste is given in ktonnesoffreshmatter,amoisturecontentfactorneedsto
beappliedtocalculatetheremainingdrymatteravailableforproductionofbiomethane.
Sustainable potential of food waste in 2030 (ktonne DM) = Sustainable potential of food waste in 2030 (ktonne as received) × (1 – Moisture content (%))
Finally,ayieldincreaseisappliedtoderivethesustain-ablepotentialoffoodwastein2050,incaseitbecomesrelevant.Bydefault,thisfactorhasbeensettozerosincenomajorchangesareexpectedinthefeedstockamounts
for food waste. Table 20 gives an overview of the input assumptionsrelatedtothecalculationstepsfollowedtoestimatethefeedstockpotentialfromfoodwastein2050.
Sustainable potential of food waste in 2050 (ktonne DM) = Sustainable potential of food waste in 2030 (ktonne DM) × (1 + Yield increase to 2050 (%))
Parameter Units Default value
Additional share from technical to sustainable potential % 10 %*
Moisture content % 40 %**
Yield increase to 2050 % 0 %*
* Navigant expert opinion)
** Elbersen et al., 2016, "Outlook of spatial biomass value chains in EU-28", http://iinas.org/tl_files/iinas/downloads/bio/ biomasspolicies/Elbersen_et_al_2016_Outlook_of_spatial_biomass_value_chains_in_EU28_(D2.3_Biomass_Policies).pdf
Table 29: Input assumptions used for feedstock potential in 2050 from

ENTSO-E // ENTSOG TYNDP 2022 Scenario Building Guidelines // 63
vi Manure
The Elbersen et al. study was also used to extract the raw data on the technical potential of manure produced in stablesindrymatterbasisfortheyear2010throughoutEurope.Differentsolid(cattle,pig,poultry,sheep/goat)and
liquid(cattle,pig)manuretypesareconsideredanddiffer-entsustainablesharespermanuretypeandperMemberStateareappliedtoestimatethesustainablepotentialofthisfeedstock.
Sustainable potential of manure produced in stables in 2010 (ktonne DM) = Technical potential of manure produced in stables in 2010 (ktonne DM) × Sustainable potential share per manure type in 2010 (%)
Aswithotherfeedstocktypes,ayieldincreasefactorisapplied to estimate the potential in 2050 compared to 2010.However,nomajorchangesareexpectedintheto-
talmanurepotentialtowards2050asEUlivestockheadswould remain approximately the same as suggested by the EUAgriculturalOutlookfor2030.
Sustainable potential of manure produced in stables in 2050 (ktonne DM) = Sustainable potential of manure produced in stables in sustainable scenario in 2010 (ktonne DM) × (1 + Yield increase to 2050 (%))
Member State Solid Liquid
Cattle Pig Poultry Sheep/Goat Cattle Pig
Austria 3 % 30 % 30 % 1 % 5 % 61 %
Belgium 9 % 33 % 26 % 2 % 18 % 66 %
Bulgaria 34 % 49 % 46 % 13 % 67 % 98 %
Croatia 0 % 0 % 0 % 0 % 0 % 0 %
Cyprus 47 % 49 % 44 % 12 % 93 % 99 %
Czech Republic 44 % 0 % 42 % 9 % 85 % 96 %
Denmark 39 % 50 % 49 % 18 % 91 % 99 %
Estonia 38 % 48 % 1 % 7 % 73 % 97 %
Finland 13 % 41 % 42 % 2 % 22 % 82 %
France 30 % 49 % 45 % 13 % 61 % 97 %
Germany 30 % 44 % 45 % 18 % 60 % 88 %
Greece 16 % 33 % 28 % 2 % 33 % 67 %
Hungary 37 % 36 % 34 % 11 % 70 % 72 %
Ireland 19 % 0 % 47 % 11 % 45 % 99 %
Italy 29 % 0 % 47 % 6 % 57 % 94 %
Latvia 38 % 47 % 33 % 17 % 75 % 95 %
Lithuania 13 % 38 % 41 % 7 % 26 % 75 %
Luxembourg 0 % 0 % 0 % 0 % 0 % 0 %
Malta 16 % 38 % 29 % 1 % 32 % 76 %
Netherlands 28 % 0 % 33 % 1 % 0 % 53 %
Poland 37 % 0 % 49 % 19 % 73 % 98 %
Portugal 5 % 18 % 40 % 2 % 11 % 36 %
Romania 27 % 44 % 39 % 9 % 44 % 88 %
Slovakia 45 % 44 % 40 % 30 % 90 % 88 %
Slovenia 28 % 46 % 46 % 7 % 65 % 92 %
Spain 21 % 46 % 47 % 19 % 40 % 93 %
Sweden 4 % 0 % 17 % 6 % 9 % 32 %
Table 31: Sustainable potential shares to calculate the sustainable potential for different manure types and per member state

64 // ENTSO-E // ENTSOG TYNDP 2022 Scenario Building Guidelines
vii Sewage sludge
RawdatawasextractedfromtheElbersenetal.study,where they assessed the potential of common sludges produced in households and in other sectors in 2030 in
drymatterbasis.Inaddition,ayieldincreasewasappliedtoestimatethe2050potential.However,asTable32shows,thepotentialisestimatedtoremainthesameasin2030.
Total potential of common sludges produced in households and in other sectors in 2050 (ktonne DM) = Total potential of common sludges produced in households and in other sectors in 2030 (ktonne DM) × (1 + Yield increase to 2050 (%))
Parameter Units Default value
Yield increase to 2050 % 0 %*
* Elbersen et al., 2016, "Outlook of spatial biomass value chains in EU-28", http://iinas.org/tl_files/iinas/downloads/bio/ biomasspolicies/Elbersen_et_al_2016_Outlook_of_spatial_biomass_value_chains_in_EU28_(D2.3_Biomass_Policies).pdf (53)
Table 32: Input assumptions used for feedstock potential in 2050 from sewage sludge
viii Municipal Solid Waste (MSW)
Eurostat provided raw data on the municipal waste gener-atedin2017infreshmatterbasis.However,onlythedryorganicfractionofitissuitableforbiomethaneproduction.
Therefore,asharerepresentingtheorganicfractionandashare for the moisture content are applied.
Organic municipal waste generated in 2017 (ktonne as received) = Municipal waste generated in 2017 (ktonne as received) × Share of organic fraction in MSW (%)
Organic municipal waste generated in 2017 (ktonne DM) = Organic municipal waste generated in 2017 (ktonne as received) × (1 – Moisture content (%))
Additionally,itisassumedthatonlyashareofthedryorganicmunicipalwastegeneratedwillbeallocatedtobiomethaneuse.
Organic municipal waste generated allocated to biomethane use in 2017 (ktonne DM) = Organic municipal waste generated in 2017 (ktonne DM) × Allocation share of organic volume to biomethane use (%)
Finally,ayieldincreaseof-30 %isassumedinthiscasetoestimatethepotentialin2050.Areductioninmunicipalwasteisexpectedtowards2050duetoincreasedseparationandrecycling.
Organic municipal waste generated allocated to biomethane use in 2050 (ktonne DM) = Organic municipal waste generated allocated to biomethane use in 2017 (ktonne DM) × (1 + Yield increase to 2050 (%))

ENTSO-E // ENTSOG TYNDP 2022 Scenario Building Guidelines // 65
Table33showstheinputassumptionsrelatedtothecalculationstepsfollowedtoestimatethefeedstockpotentialfrommunicipal solid waste in 2050.
Parameter Units Default value
Share of organic fraction in MSW % 60 %*
Moisture content % 40 %*
Allocation share of organic volume to biomethane use % 30 %*
Yield increase to 2050 % -30 %*
* Navigant expert opinion
Table 33: Input assumptions used for feedstock potential in 2050 from Municipal Solid Waste (MSW)
ix Waste wood
RawdatafromEurostatwascollectedonwoodwastegen-eratedinfreshmatterbasisfor2016.Amoisturecontentfactor was applied as well as a share to account for the part thatwillbeallocatedtobiomethaneuse.Finally,ayield
increasewasappliedtoderivethe2050potentialofwastewood.Overall,wastewoodwillstabilize,sosamefiguresas in 2016 apply for 2050.
Wood waste generated in 2016 (ktonne DM) = Wood waste generated in 2016 (ktonne as received) × (1 – Moisture content (%))
Wood waste generated allocated to biomethane use in 2016 (ktonne DM) = Wood waste generated in 2016 (ktonne DM) × Allocation share of waste wood to biomethane use (%)
Wood waste generated allocated to biomethane use in 2050 (ktonne DM) = Wood waste generated allocated to biomethane use in 2016 (ktonne DM) × (1 + Yield increase to 2050 (%))
Table34showstheinputassumptionsrelatedtothecalculationstepsfollowedtoestimatethefeedstockpotentialfromwaste wood in 2050.
Parameter Units Default value
Moisture content % 20 %*
Allocation share of waste wood to biomethane use % 50 %*
Yield increase to 2050 % 0 %*
* Ecofys, 2018, "Mobilising woody residues to produce biomethane", https://gasforclimate2050.eu/wp-content/uploads/2020/03/GfC-Memo-Rethinking-the-EU-biomethane-potential-from-woody-biomass-residues.pdf
Table 34: Input assumptions used for feedstock potential in 2050 from waste wood
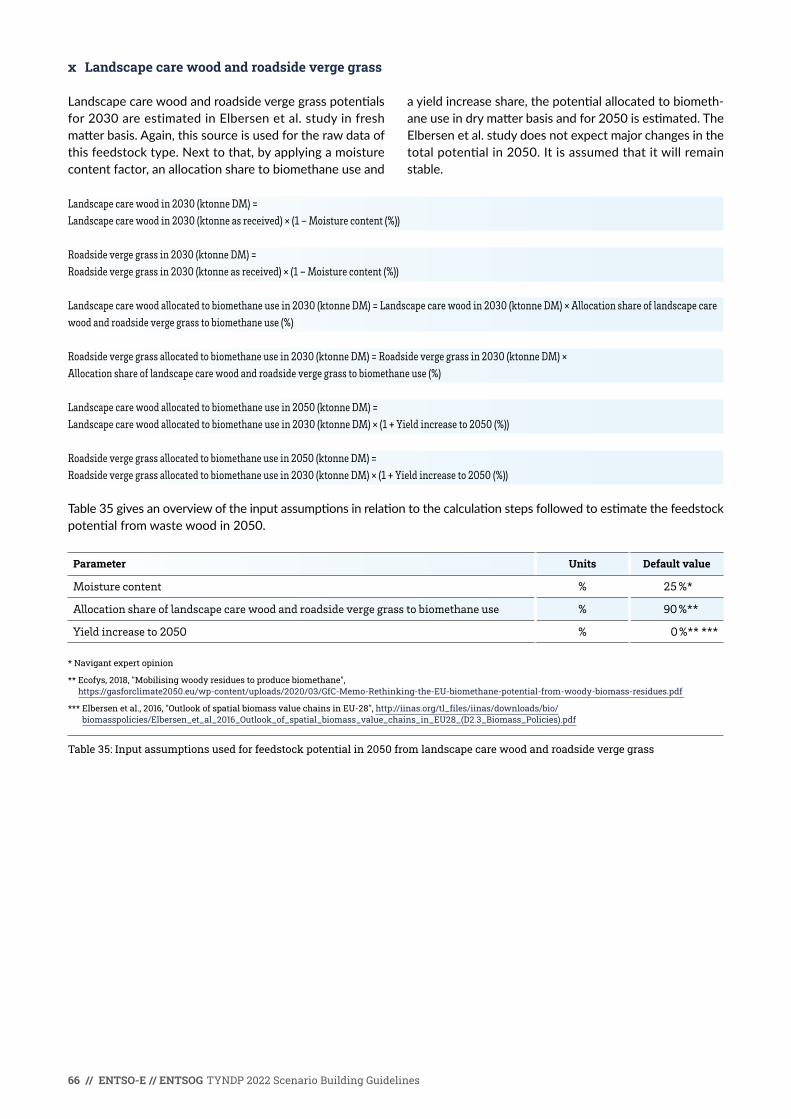
66 // ENTSO-E // ENTSOG TYNDP 2022 Scenario Building Guidelines
x Landscape care wood and roadside verge grass
Landscapecarewoodandroadsidevergegrasspotentialsfor 2030 are estimated in Elbersen et al. study in fresh matterbasis.Again,thissourceisusedfortherawdataofthisfeedstocktype.Nexttothat,byapplyingamoisturecontentfactor,anallocationsharetobiomethaneuseand
ayieldincreaseshare,thepotentialallocatedtobiometh-aneuseindrymatterbasisandfor2050isestimated.TheElbersen et al. study does not expect major changes in the totalpotentialin2050.Itisassumedthatitwillremainstable.
Landscape care wood in 2030 (ktonne DM) = Landscape care wood in 2030 (ktonne as received) × (1 – Moisture content (%))
Roadside verge grass in 2030 (ktonne DM) = Roadside verge grass in 2030 (ktonne as received) × (1 – Moisture content (%))
Landscape care wood allocated to biomethane use in 2030 (ktonne DM) = Landscape care wood in 2030 (ktonne DM) × Allocation share of landscape care wood and roadside verge grass to biomethane use (%)
Roadside verge grass allocated to biomethane use in 2030 (ktonne DM) = Roadside verge grass in 2030 (ktonne DM) × Allocation share of landscape care wood and roadside verge grass to biomethane use (%)
Landscape care wood allocated to biomethane use in 2050 (ktonne DM) = Landscape care wood allocated to biomethane use in 2030 (ktonne DM) × (1 + Yield increase to 2050 (%))
Roadside verge grass allocated to biomethane use in 2050 (ktonne DM) = Roadside verge grass allocated to biomethane use in 2030 (ktonne DM) × (1 + Yield increase to 2050 (%))
Table35givesanoverviewoftheinputassumptionsinrelationtothecalculationstepsfollowedtoestimatethefeedstockpotentialfromwastewoodin2050.
Parameter Units Default value
Moisture content % 25 %*
Allocation share of landscape care wood and roadside verge grass to biomethane use % 90 %**
Yield increase to 2050 % 0 %** ***
* Navigant expert opinion
** Ecofys, 2018, "Mobilising woody residues to produce biomethane", https://gasforclimate2050.eu/wp-content/uploads/2020/03/GfC-Memo-Rethinking-the-EU-biomethane-potential-from-woody-biomass-residues.pdf
*** Elbersen et al., 2016, "Outlook of spatial biomass value chains in EU-28", http://iinas.org/tl_files/iinas/downloads/bio/ biomasspolicies/Elbersen_et_al_2016_Outlook_of_spatial_biomass_value_chains_in_EU28_(D2.3_Biomass_Policies).pdf
Table 35: Input assumptions used for feedstock potential in 2050 from landscape care wood and roadside verge grass
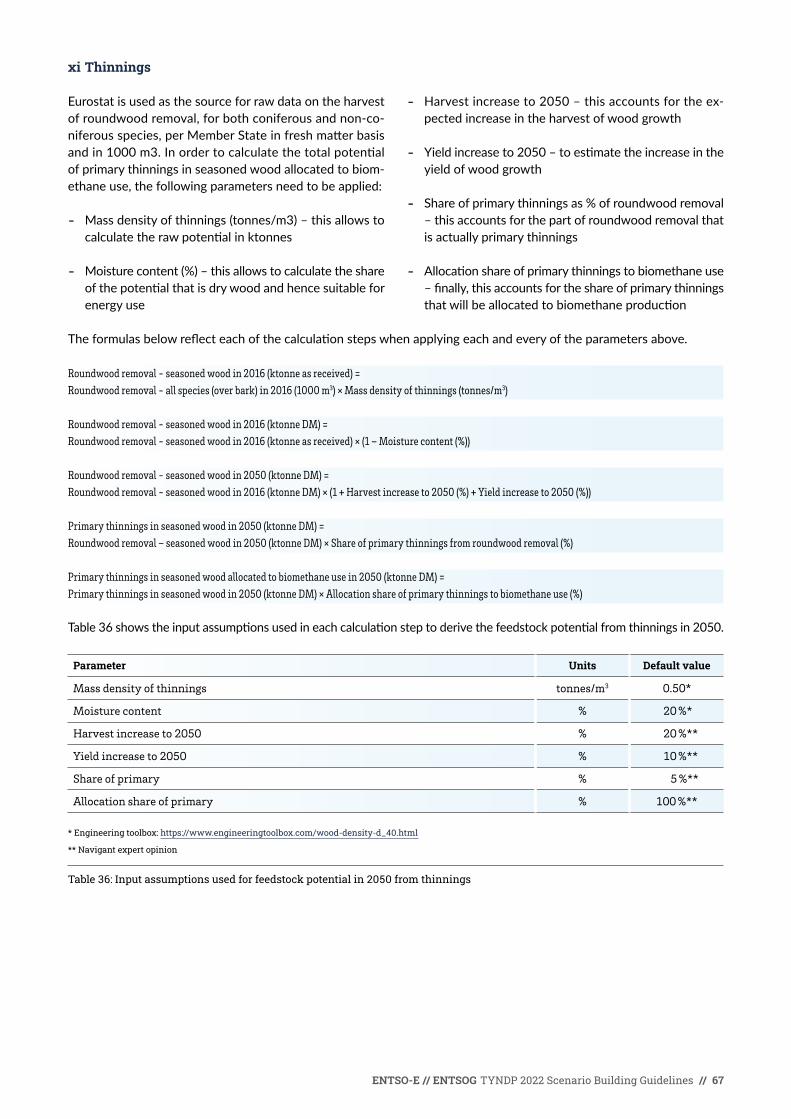
ENTSO-E // ENTSOG TYNDP 2022 Scenario Building Guidelines // 67
xi Thinnings
Eurostat is used as the source for raw data on the harvest ofroundwoodremoval,forbothconiferousandnon-co-niferousspecies,perMemberStateinfreshmatterbasisandin1000m3.Inordertocalculatethetotalpotentialof primary thinnings in seasoned wood allocated to biom-ethaneuse,thefollowingparametersneedtobeapplied:
- Massdensityofthinnings(tonnes/m3)–thisallowstocalculatetherawpotentialinktonnes
- Moisturecontent(%)–thisallowstocalculatetheshareofthepotentialthatisdrywoodandhencesuitableforenergy use
- Harvest increase to 2050 – this accounts for the ex-pected increase in the harvest of wood growth
- Yieldincreaseto2050–toestimatetheincreaseintheyield of wood growth
- Shareofprimarythinningsas%ofroundwoodremoval– this accounts for the part of roundwood removal that is actually primary thinnings
- Allocationshareofprimarythinningstobiomethaneuse–finally,thisaccountsfortheshareofprimarythinningsthatwillbeallocatedtobiomethaneproduction
Theformulasbelowreflecteachofthecalculationstepswhenapplyingeachandeveryoftheparametersabove.
Roundwood removal - seasoned wood in 2016 (ktonne as received) = Roundwood removal - all species (over bark) in 2016 (1000 m3) × Mass density of thinnings (tonnes/m3)
Roundwood removal - seasoned wood in 2016 (ktonne DM) = Roundwood removal - seasoned wood in 2016 (ktonne as received) × (1 – Moisture content (%))
Roundwood removal - seasoned wood in 2050 (ktonne DM) = Roundwood removal - seasoned wood in 2016 (ktonne DM) × (1 + Harvest increase to 2050 (%) + Yield increase to 2050 (%))
Primary thinnings in seasoned wood in 2050 (ktonne DM) = Roundwood removal – seasoned wood in 2050 (ktonne DM) × Share of primary thinnings from roundwood removal (%)
Primary thinnings in seasoned wood allocated to biomethane use in 2050 (ktonne DM) = Primary thinnings in seasoned wood in 2050 (ktonne DM) × Allocation share of primary thinnings to biomethane use (%)
Table36showstheinputassumptionsusedineachcalculationsteptoderivethefeedstockpotentialfromthinningsin2050.
Parameter Units Default value
Mass density of thinnings tonnes/m3 0.50*
Moisture content % 20 %*
Harvest increase to 2050 % 20 %**
Yield increase to 2050 % 10 %**
Share of primary % 5 %**
Allocation share of primary % 100 %**
* Engineering toolbox: https://www.engineeringtoolbox.com/wood-density-d_40.html
** Navigant expert opinion
Table 36: Input assumptions used for feedstock potential in 2050 from thinnings

68 // ENTSO-E // ENTSOG TYNDP 2022 Scenario Building Guidelines
xii Branches and tops
Similarly,aswiththinning,rawdatafromEurostatwascollectedontheroundwood(woodintherough)foroverbarkforconiferousandnon-coniferousspecies(1000m3)fortheyear2015perMemberState.
Inordertocalculatethetotalpotentialofbranchesandtopsfromroundwood,thefollowingparametersareap-plied:
- AverageBiomassExpansionFactors(BEFs)forconifer-ousandnon-coniferousspeciesinEU–thesefactorsallowtoestimatetheamountofcrownmassfordif-ferentspeciesgroupsaccordingtotheclimaticzone.MemberStatesarecategorisedbyclimaticzone.WithintheEU-27,MemberStatesarepredominantlylocatedinthetemperateclimaticzone.
- Sustainableremovalrateofbranches&tops(%)–thisaccountsfortherateatwhichbranches&topsaresustainablyremovedfromtrees.Thisestimatealreadyincludessustainablepotential.
- Massdensityofbranches&tops(tonnes/m3)-thisallowstocalculatethepotentialinktonnes.
- Moisturecontent(%)–thisallowstocalculatetheshareofthepotentialthatisdrywoodandhencesuitableforenergy use.
- Yield increase to 2050 – to account for the increase in the yield of forestry residues assumed towards 2050.
Theformulasbelowguidethecalculationstepsappliedwith each parameter above.
Sustainably removed roundwood in 2015 – coniferous species (1000 m3) = Roundwood for over bark for coniferous species in 2015 (1000 m3) Average BEFs – Coniferous species in EU × Sustainable removal rate of branches & tops (%)
Sustainably removed roundwood in 2015 – non-coniferous species (1000 m3) = Roundwood for over bark for non-coniferous species in 2015 (1000 m3) × Average BEFs – Non-coniferous species in EU × Sustainable removal rate of branches & tops (%)
Sustainably removed roundwood in 2015 – coniferous & non-coniferous species (ktonne DM) = Sustainably removed roundwood in 2015 – coniferous & non-coniferous species (1000 m3) × Mass density of branches & tops (tonnes/m3) × (1 – Moisture content (%))
Sustainably removed roundwood in 2050 – coniferous & non-coniferous species (ktonne DM) = Sustainably removed roundwood in 2015 – coniferous & non-coniferous species (ktonne DM) × (1 + Yield increase to 2050 (%))
Table37showstheinputassumptionsusedineachcalculationsteptoderivethefeedstockpotentialfrombranchesandtops in 2050.
Parameter Units Default value
Average Biomass Expansion Factors (BEFs) - Coniferous species in EU temperate climate zone
- 0.30*
Average Biomass Expansion Factors (BEFs) - Non-coniferous species in EU temperate climate zone
- 0.40*
Sustainable removal rate of branches & tops % 20 %*
Moisture content % 20 %**
Mass density of branches & tops tonnes/m3 0.50**
Yield increase to 2050 % 10 %***
* Spottle et al., 2013, "Low ILUC potential of wastes and residues for biofuels: Straw, forestry residues, UCO, corn cobs", https://zoek.officielebekendmakingen.nl/blg-248798.pdf
** Engineering toolbox: https://www.engineeringtoolbox.com/wood-density-d_40.html
*** Navigant expert opinion
Table 37: Input assumptions used for feedstock potential in 2050 from branches and tops
ENTSO-E // ENTSOG TYNDP 2022 Scenario Building Guidelines // 69
ImprintiJoint-Publishers
ENTSOG
EuropeanNetworkof Transmission System Operators for Gas
Avenue de Cortenbergh 100 1000Brussels,Belgium
www.entsog.eu
ENTSO-E
EuropeanNetworkof Transmission System Operators for Electricity
RuedeSpa,8 1000Brussels,Belgium
www.entsoe.eu
Co-authors
AlexanderKättlitz MariaChiaraCavarretta NalanBuyuk Olivier Lebois Pieter Boersma
Sub-TeamleadsoftheJointWGScenarioBuilding
JointWGScenarioBuilding
ENTSOG WG Scenarios
ENTSO-ERegionalGroups
Design
DreiDreizehnGmbH,Berlin|www.313.de Coverartwork:ZNConsulting,Brussels|www.znconsulting.com
Pictures
p.4: ©iStockphoto.com/petmal p.7: ©iStockphoto.com/JefHu p.11: courtesyofGAZ-SYSTEM p.17: courtesyofREN p.19: courtesyofThyssengas p.26: courtesyofSNAM
Publishingdate
October 2021

Top Related