


Languages
Pages
Legal

Two Examples of Probabilis2c Transmission Planning
At BPA
Bill Mi&elstadt, Chuck Ma&hews and Paul Ferron
Grid Transforma<on March 20, 2013
1

Topics
• BPA Transmission Outage Data using the Transmission Outage Manager Program
• Benefits Analysis Program (1996)
• Kangley – Echo Lake 500 kV reclassifica<on example
2
Transmission Outage Management Program (TOM)
• Maintains an outage data base for BPA system transmission lines
• Allows sta<s<cs to be grouped in many different ways to es<mate the effect of a change in design or expected outage rate of a future transmission facility.
_______________________________ Program wri&en by Sudhir Agrawal (General Reliability)
3

Ways To Sort Data • Voltage Class (500 kV, 345 kV, 230 kV,…) • Region of system • With or without OHGW • Outage <me (temporary or sustained) • Fault cause (line or terminal) • Common or separate tower
For example: What is expected outage rate for a 10-‐mile 500 kV double-‐circuit line located east of the Cascades on common tower with OHGW and high-‐speed reclosing?
4
Benefits Analysis Program
• Planning effort applied to 14 area service transmission projects (1996).
• Cost/Benefit Analysis: project, societal, BPA • Outage sta<s<cs: frequency and dura<on • Load dura<on curve of area or region used, incremented by <me (next slide)
5

0!
1000!
2000!
3000!
4000!
5000!
6000!
0! 500! 1000! 1500! 2000! 2500! 3000!
Loa
d L
evel
(MW
)
Hours of Year
Yearly Incremented Load Duration Curve
With Project
Without Project
6
Kangley – Echo Lake 500 kV Case
• 9.5 mile common ROW of two lines with one common breaker and half terminal
• 2715 mile-‐years of historical data spanning a period of 17 years for es<ma<ng MTBF
• Adjusted historical data for load dura<on analysis
• Robust Line mi<ga<on factors
• Adjusted from Category C to D by WECC
7

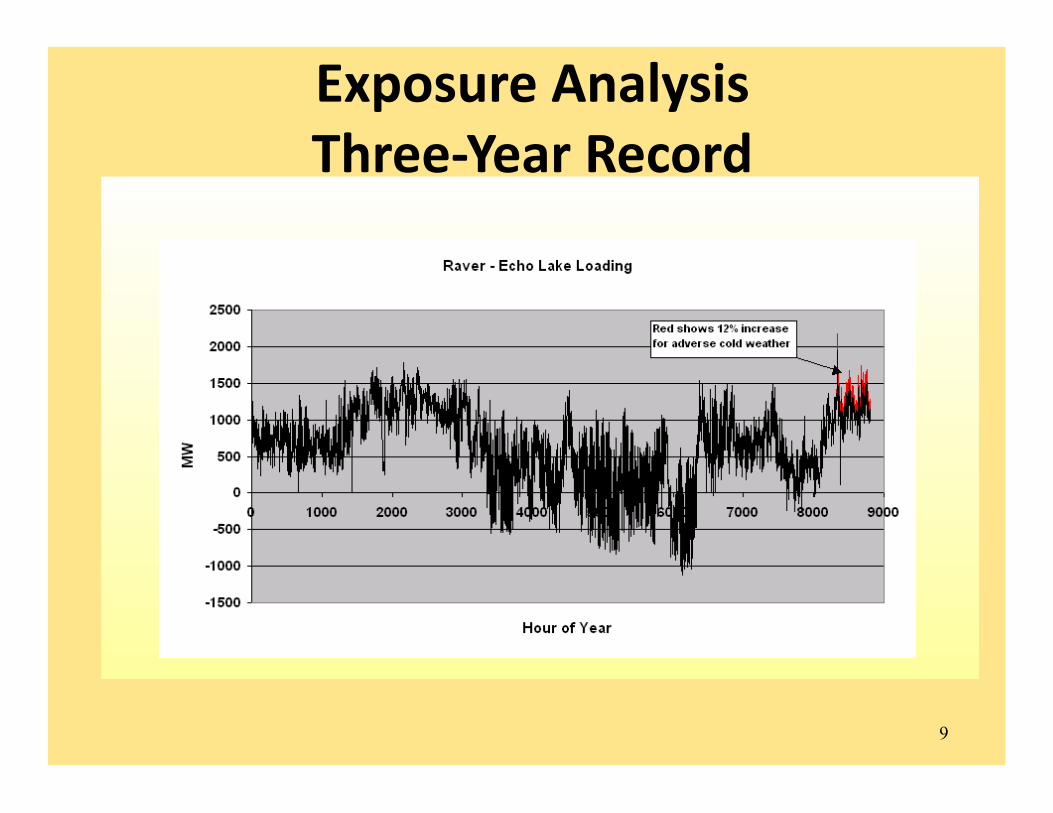
9
Exposure Analysis Three-‐Year Record
10
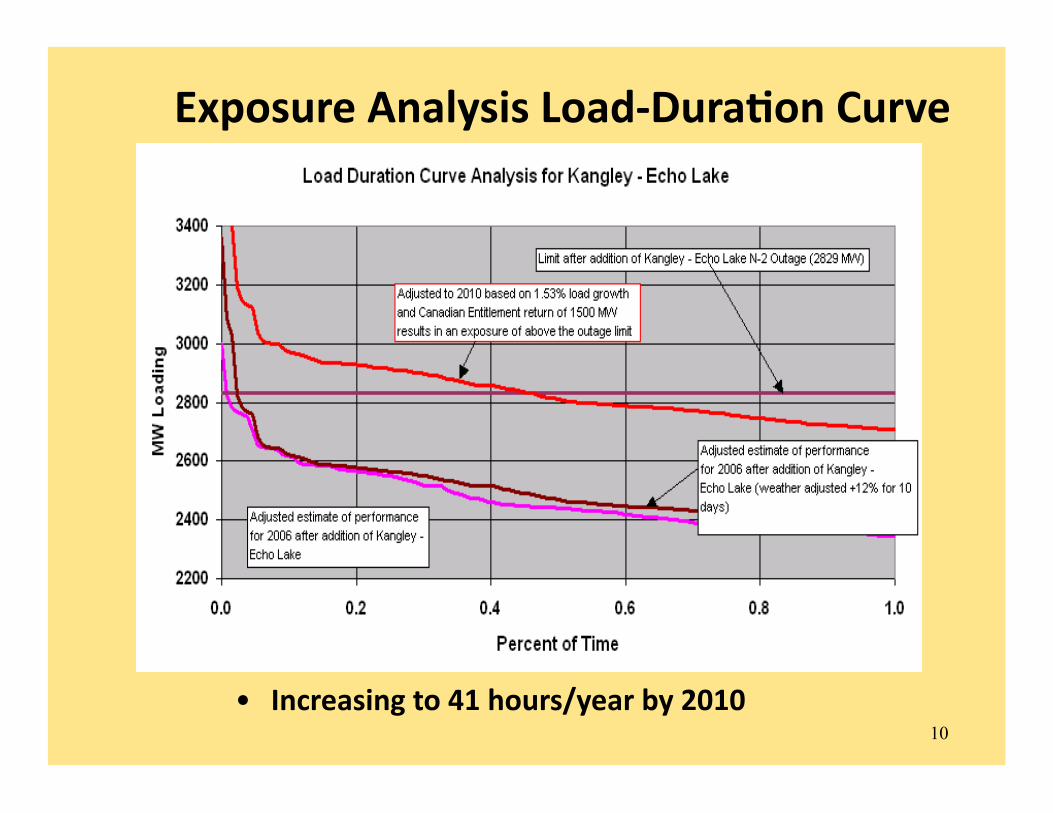
Exposure Analysis Load-‐Dura2on Curve
• Increasing to 41 hours/year by 2010

? Concluding Ques<ons ?
• How can we be&er use line and sta<on historical outage informa<on in making decisions on future projects?
• How can we be be&er use historical and projected flow pa&erns in making decisions on future projects?
• What tools are available?
11

Concluding Sugges2ons… • Increase use of sta<s<cal outage informa<on and forecasted projec<ons on path use in comparing alterna<ves and selec<ng network robustness features.
• Examine prac<cal ways to minimize the impact of extreme events.
• Con<nue to improve situa<onal awareness. • Minimize system readjustment <me to reduce risk posed by a next con<ngency.
12
Ques2ons?

14
Reducing Risks

References
1. Outage Probability of Lines Sharing a Common Corridor, W.A. Mi&elstadt, D. Paul Ferron, S. K. Agarwal, Ron E. Baugh 8th Interna<onal Conference Probabilis<c Methods Applied to Power Systems, September 12-‐16, 2004.
2. Robust Line Design Features, WECC Reliability Probability Evalua<on Work Group approved, December 2003.
15

16
A. Monroe – Custer 500, 1&2 89 miles
B. Paul – Allston 500, 1&2 48 miles C. Custer – Ingledow 500, 1&2 23 miles
D. 2700 Mile-‐years of historical data E. West of Cascades sample F. None shield wire equipped
G. Paul-‐Allston SPR Equipped
Sta2s2cal Base Used
Top Related