


Languages
Pages
Legal

Two impact studies of airborne DWL data on tropical cyclone track and intensity forecasts
G. D. Emmitt, K. Godwin and S. GrecoSimpson Weather Associates
Z. PuUniversity of Utah
WGSBLW, Miami,2011
Acknowledgements• Funding
– Ron Ferek(ONR)• Operators
– CDR Dan Eleuterio (NAVY)– Dan Carre’ (Simpson Weather Associates)– Michael Riemer (NPS)– Brian Tang (MIT)
• Key support (software and hardware)– Chris O’Handley (SWA)– Kevin Godwin (SWA/UVA)– LMCT

Outline
• P3DWL tropical cyclone observations (general)• Nuri case study• Hagupit case study• Plans for next impact studies

Mission Plan• Study of tropical cyclogenesis, intensification, transition and
weakening• Based out of Guam (P3)• Other aircraft include USAF C130 and DLR Falcon
– P3: dropsondes, ELDORA and P3DWL– C130: dropsondes– Falcon: dropsondes, DWL, DIAL
• Use ferry flights to collect long curtains of wind soundings to test data impact on NWP.– Pax River to West Coast– West Coast to Hawaii– Hawaii to Guam

P3DWL for TPARC/TCS-081.6 um coherent WTX (ARL/LMCT)10 cm bi-axis scanner (NASA)P3 and other parts (NRL)Analyses software (SWA/CIRPAS)

Basic LOS Signal• 50 meter range resolution (Gaussian pulse ~ 70
meters FWHM)• 10 cm beam diameter• Spectral domain (Heterodyne detection)– Frequency (LOS speed)– Spectral feature width (turbulence within the
illuminated volume)– Frequency discrimination of multiple LOS motions
(ground, air, precipitation signals all in same spectrum)

The Data• Profiles of u,v, and w above and below flight level following ~
3km of scanning.• Information on aerosol structures, precipitation, and sea state• Challenges to signal processing and interpretation
– Aircraft extreme motions (mainly rolling)– Chaotic marine boundary layer
• Sprays, waves and foam
– Clouds (partial obscuration)– Precipitation
• Comparisons with dropsondes provides basis for developing “smarter” algorithms

Dropsonde Comparisons• The following series of comparisons are
selected from a much larger set of DWL profiles obtained near Typhoon Hugapit.
• It is expected that the curtain of DWL profiles will be used for independent diagnostics on typhoon dynamics and to assign situational observation errors to the dropsondes (mass field information) for assimilation into forecasting models.

Comparisons with dropsondes
• While compulsory, comparisons between dropsondes and airborne DWL profiles must be done considering:– The dropsonde takes ~ 3 minutes from flight level (3km) to
the surface; a DWL profile takes ~ 20 -30 seconds to construct.
– With a 10 m/s wind, the dropsonde would drift 1.8 km; at 120 m/s ground speed, the P3DWL data for a single profile would cover 2.4 – 3.6 km. Separation of the near surface returns from the nearest dropsonde measurement could be ~ 5 -6 km
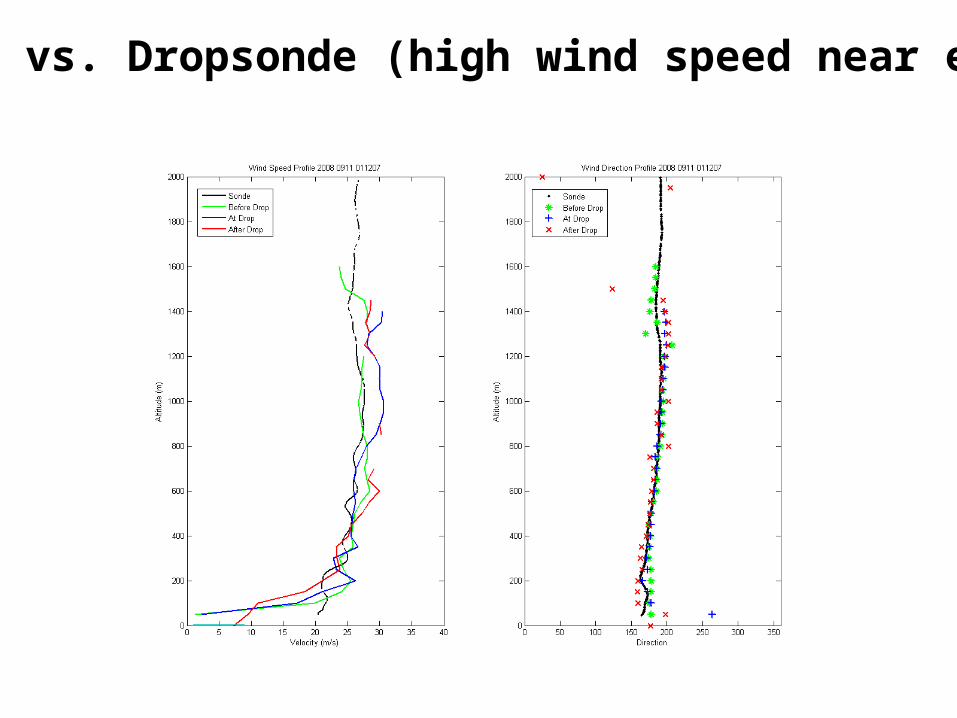
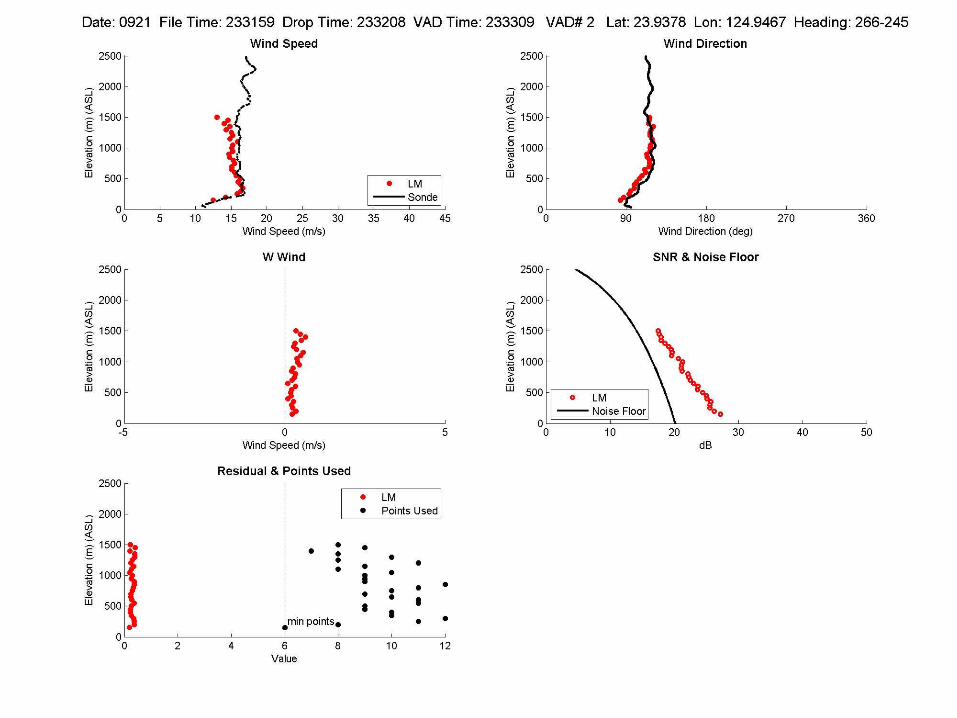
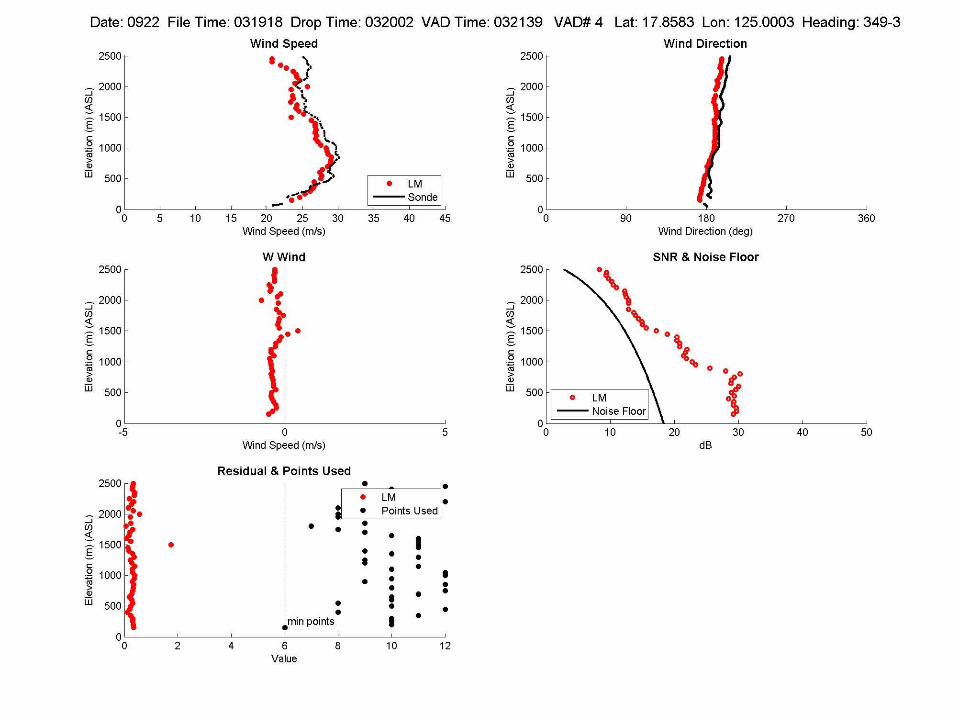
DWL vs. Dropsonde (high wind speed near eye)

Profiling in a turn267 CW 205 (62 degrees)


Profiling in a turn327 CW 25 (57 degrees)

Profiling in rain and through cloudswhile turning
114 CW 75 (39 degrees)


Data Impact Studies• Initial impact study on typhoon Nuri
conducted at University of Utah and published Zhaoxia Pu, Lei Zhang, and G. David Emmitt
“Impact of airborne Doppler wind lidar profiles on numerical simulations of a tropical cyclone”, GRL, VOL. 37, 2010
• Working on additional impact evaluation for other typhoons in various segments of their life cycles.

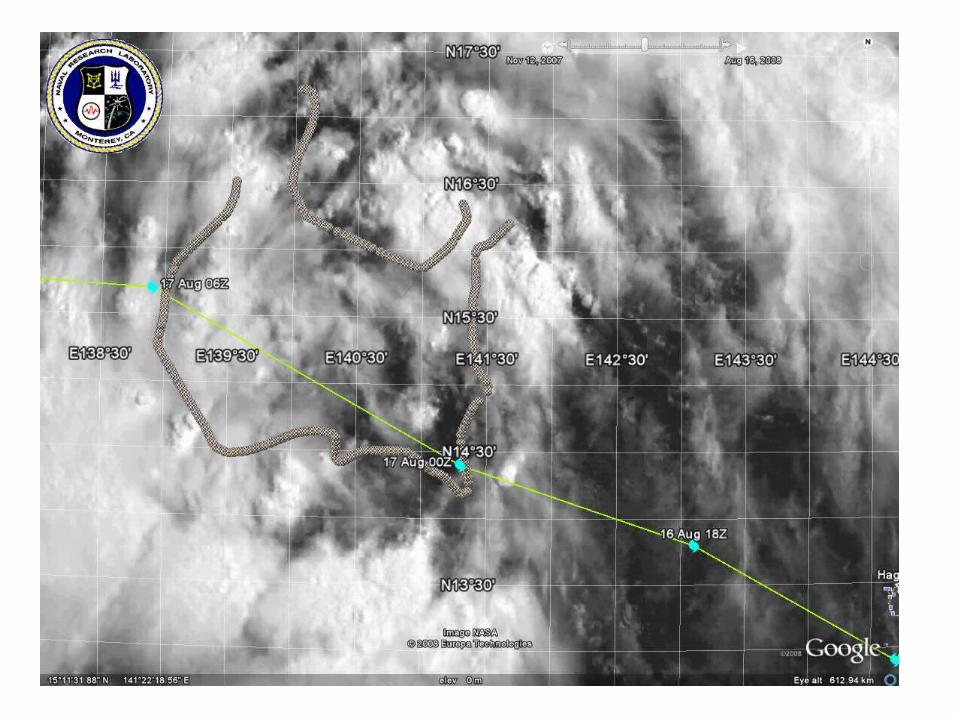
Typhoon Nuri
Courtesy G. D. Emmitt
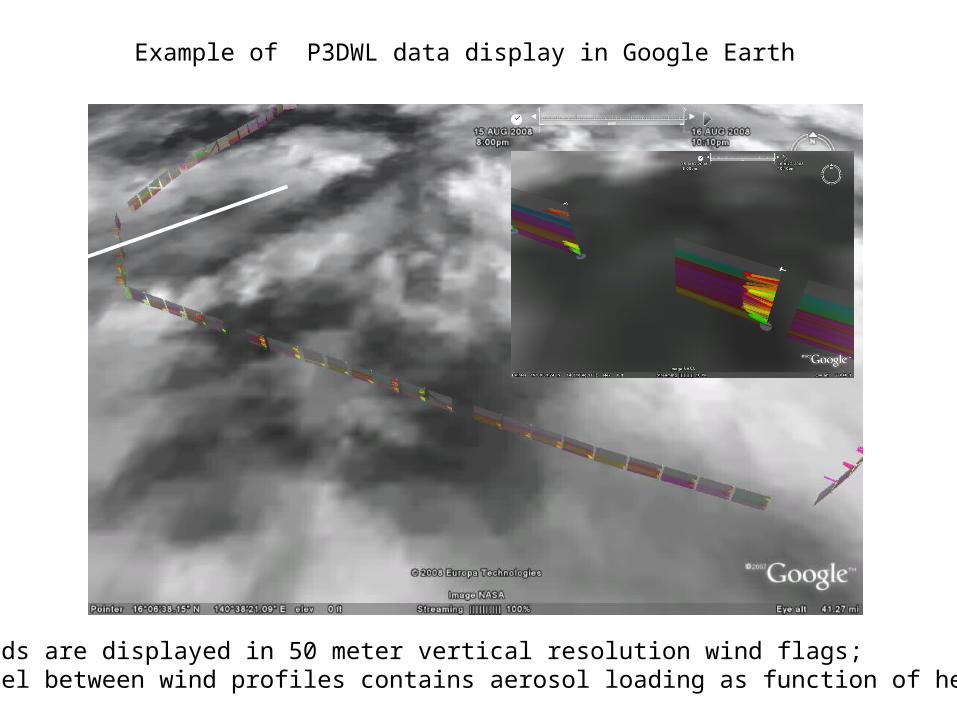
Example of P3DWL data display in Google Earth
Winds are displayed in 50 meter vertical resolution wind flags;Panel between wind profiles contains aerosol loading as function of height
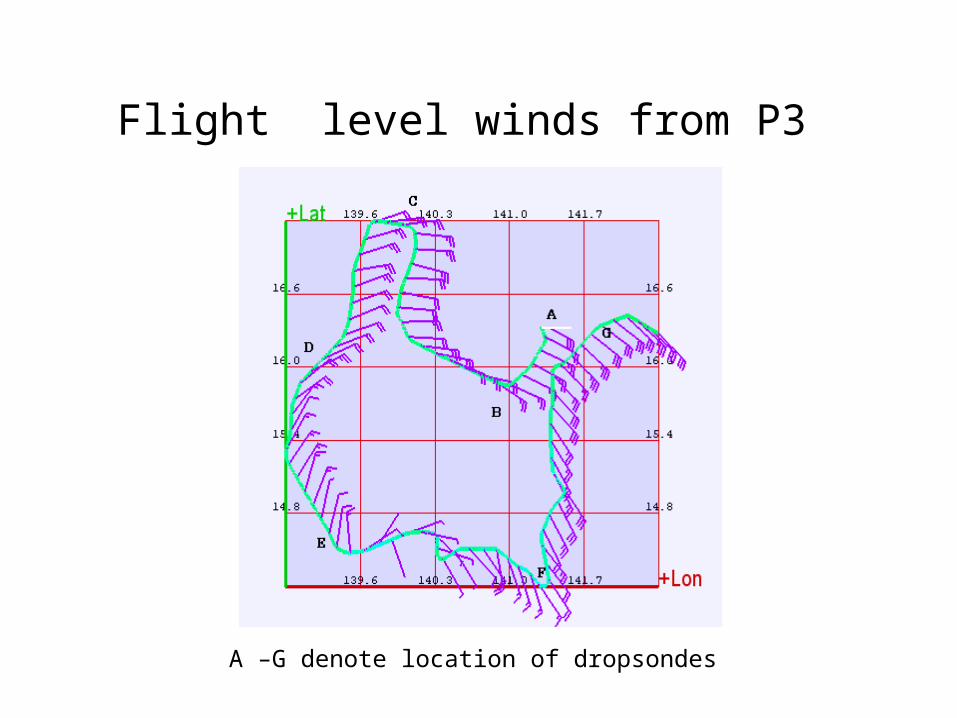
Flight level winds from P3
A –G denote location of dropsondes
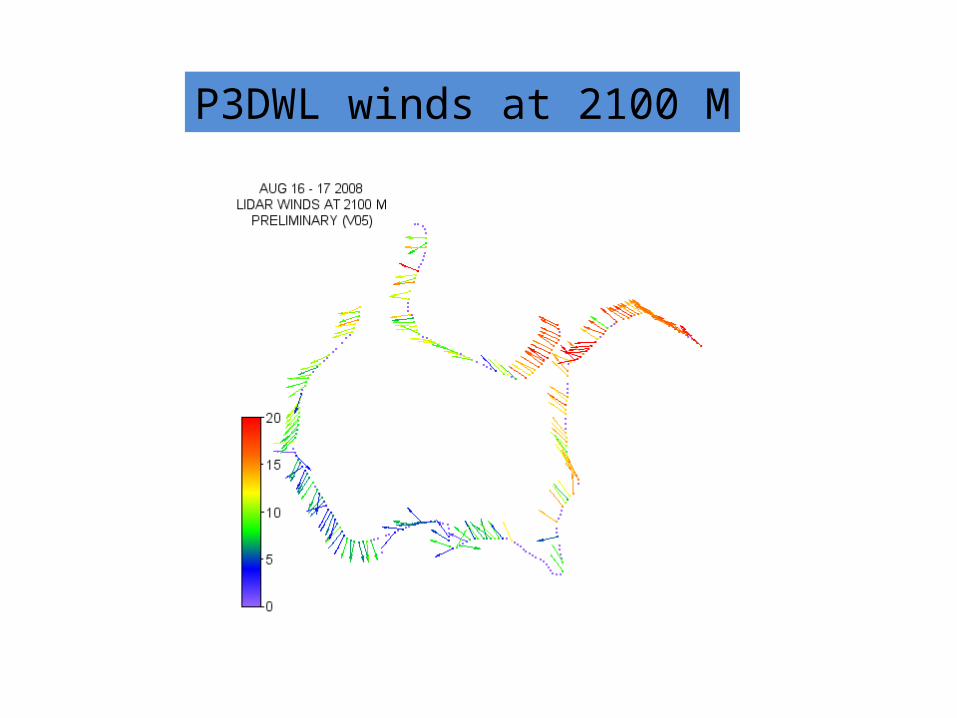
P3DWL winds at 2100 M
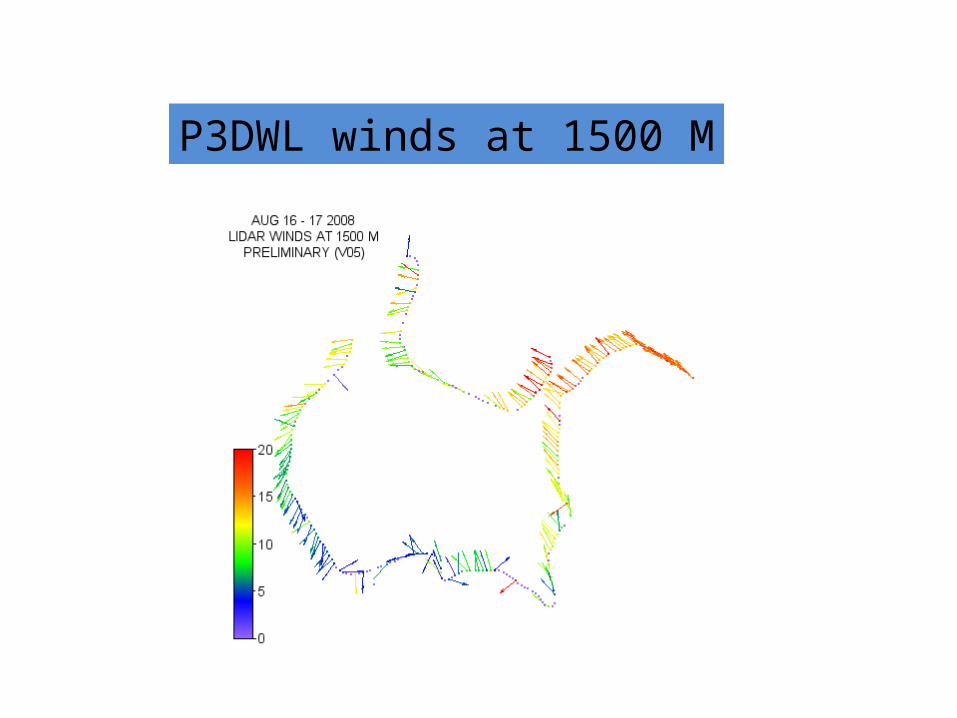
P3DWL winds at 1500 M
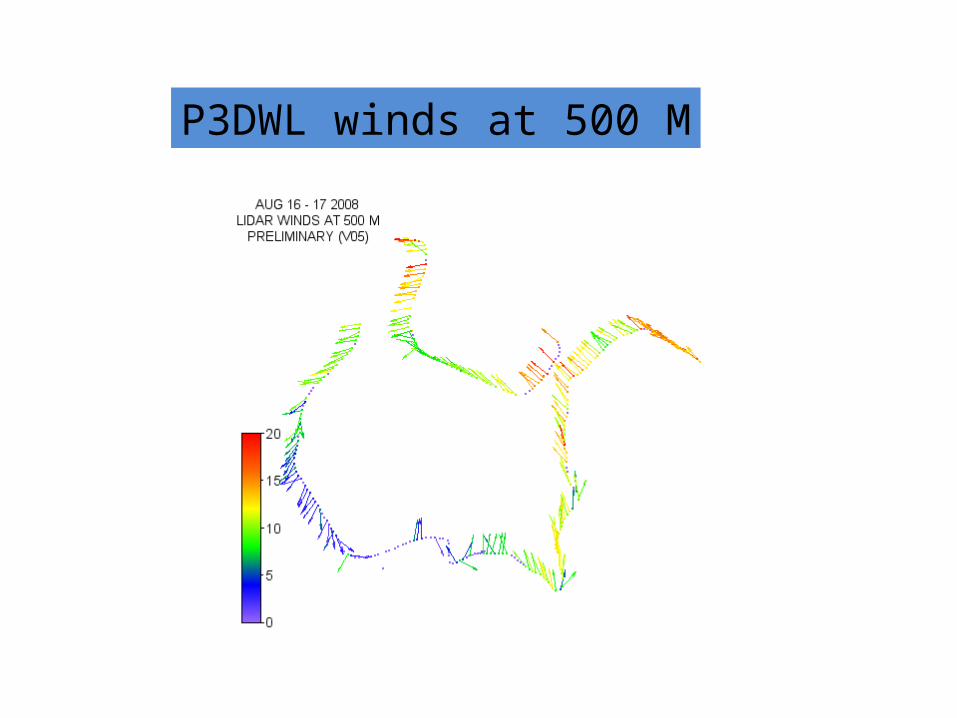
P3DWL winds at 500 M
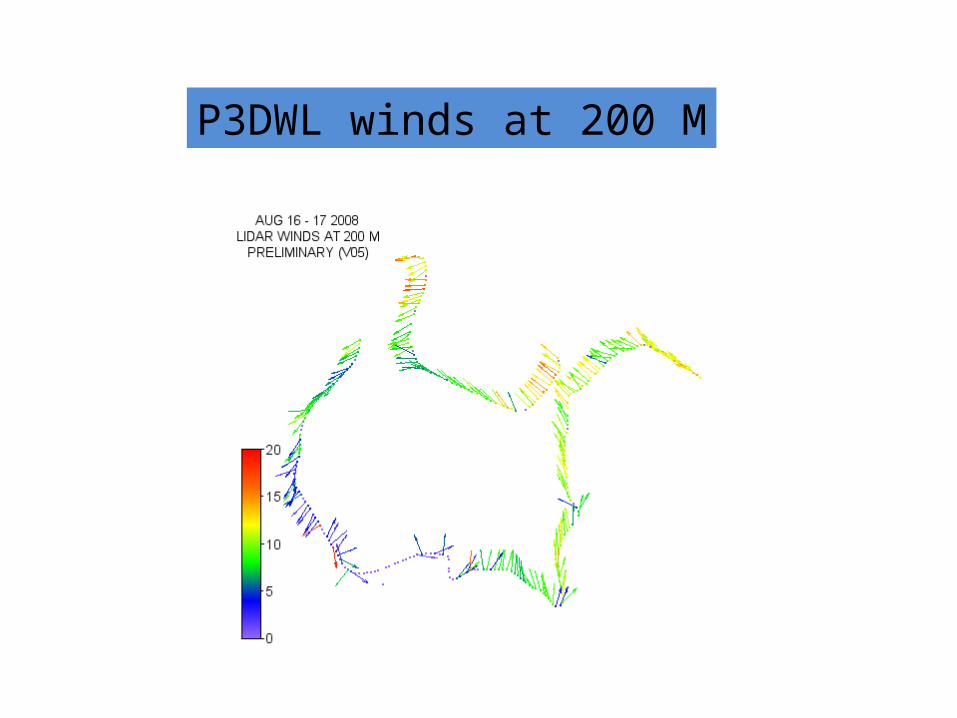
P3DWL winds at 200 M
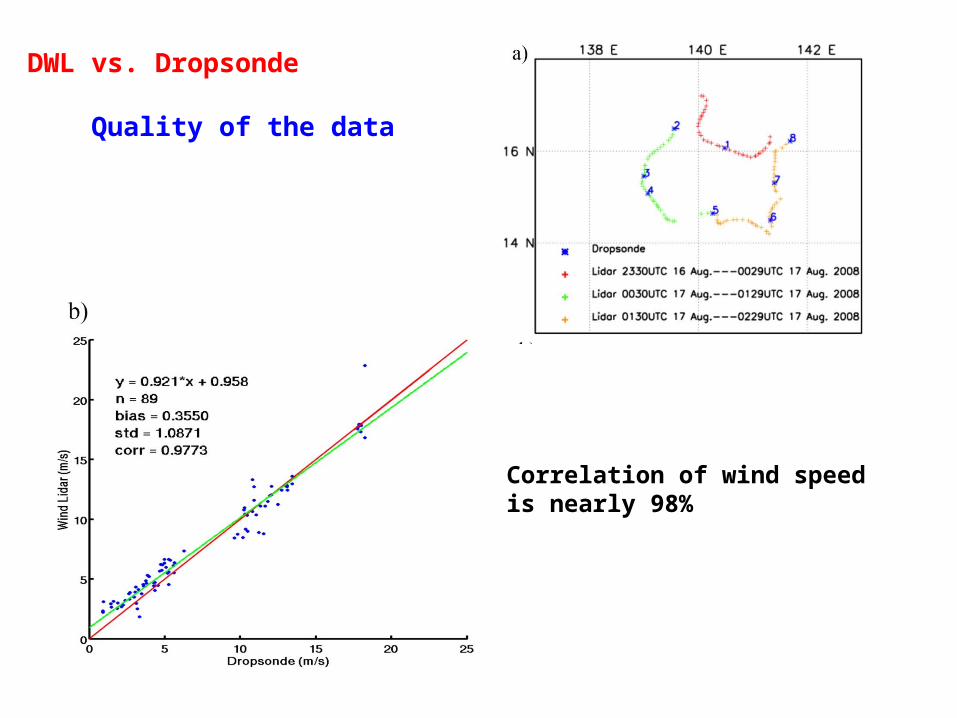
DWL vs. Dropsonde
Quality of the data
Correlation of wind speedis nearly 98%
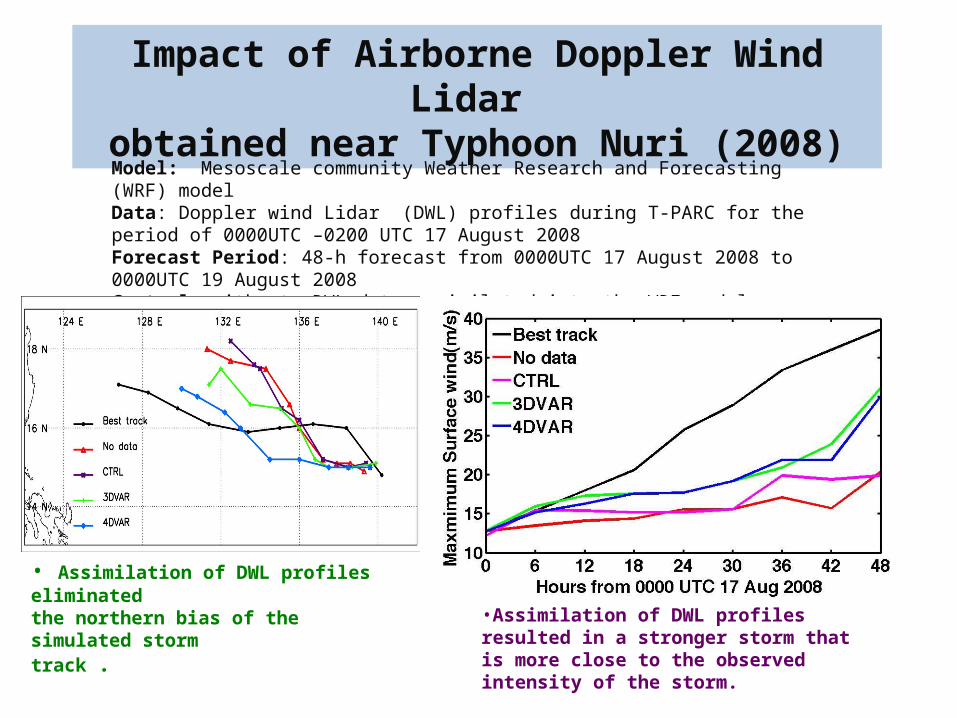
Impact of Airborne Doppler Wind Lidar obtained near Typhoon Nuri (2008)
Model: Mesoscale community Weather Research and Forecasting (WRF) modelData: Doppler wind Lidar (DWL) profiles during T-PARC for the period of 0000UTC –0200 UTC 17 August 2008Forecast Period: 48-h forecast from 0000UTC 17 August 2008 to 0000UTC 19 August 2008Control: without DWL data assimilated into the WRF model.Data Assimilation: With DWL data assimilated into the WRF model
• Assimilation of DWL profiles eliminated the northern bias of the simulated storm track . •Assimilation of DWL profiles resulted in a
stronger storm that is more close to the observed intensity of the storm.

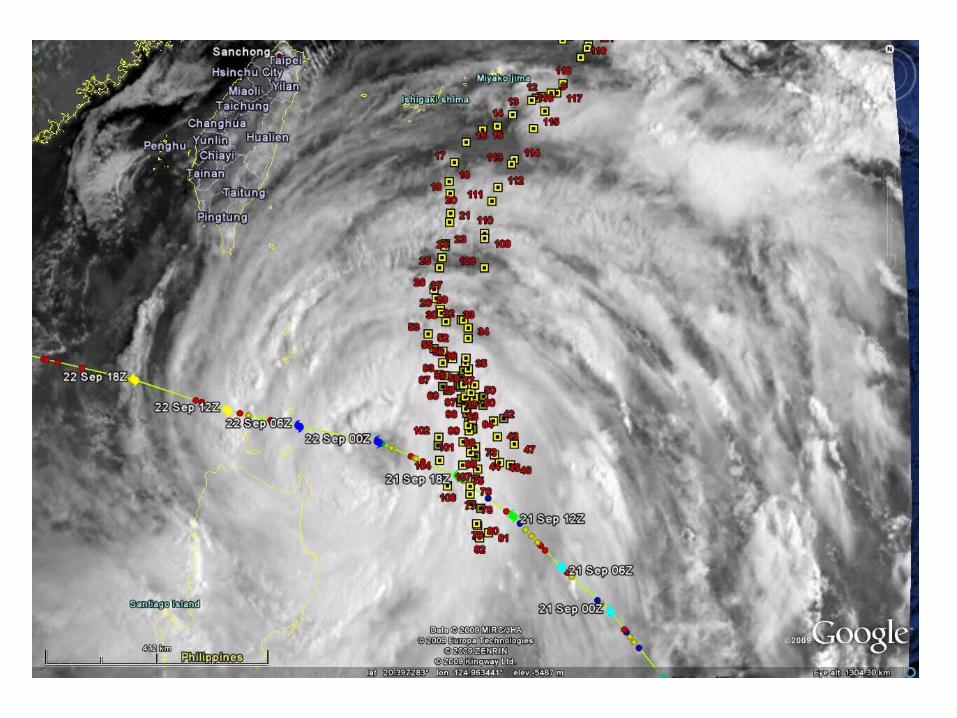
P3DWL flight near Typhoon Hagupit (September 21, 2008)

Impact of DWL wind profiles on numerical simulations of Typhoon Hagupit’s rapid intensification
Data: Doppler wind Lidar (DWL) profiles during 0000UTC –0430 UTC 22 September 2008
Forecast Period: 48-h forecast; 0000UTC 22 September 2008 --- 0000UTC 24 September 2008
•Assimilation of conventional and dropwindsonde data (CTRL) shows a positive impact on Hagupit’s track and intensity forecasts.• Including the DWL wind observations in the model initialization (3DVAR) resulted in significant improvements for both the track and intensity forecasts
Zhaoxia Pu and Lei Zhang, Department of Atmospheric Sciences, University of Utah G. David Emmitt, Simpson Weather Associates, Charlottesville, VA
Observations
SLPminError
Vmax Error
Track Error
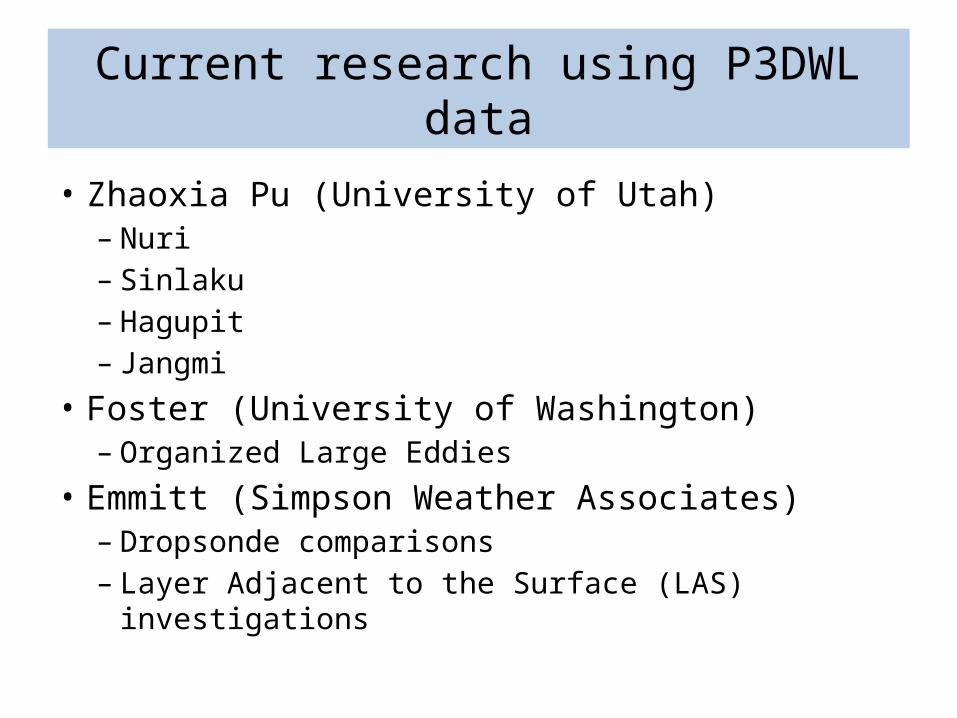
Current research using P3DWL data
• Zhaoxia Pu (University of Utah)– Nuri– Sinlaku– Hagupit– Jangmi
• Foster (University of Washington)– Organized Large Eddies
• Emmitt (Simpson Weather Associates)– Dropsonde comparisons– Layer Adjacent to the Surface (LAS) investigations

Summary• More than 10,000 profiles of the three
dimensional Doppler lidar winds in the vicinity of tropical cyclones have been processed and are now available for use.
• FTP site set up for P3 processed data• Questions regarding data access and utility:
Top Related